Temporal and Spatial Variations of the Biochemical Composition of Phytoplankton and Potential Food Material (FM) in Jaran Bay, South Korea
Abstract
1. Introduction
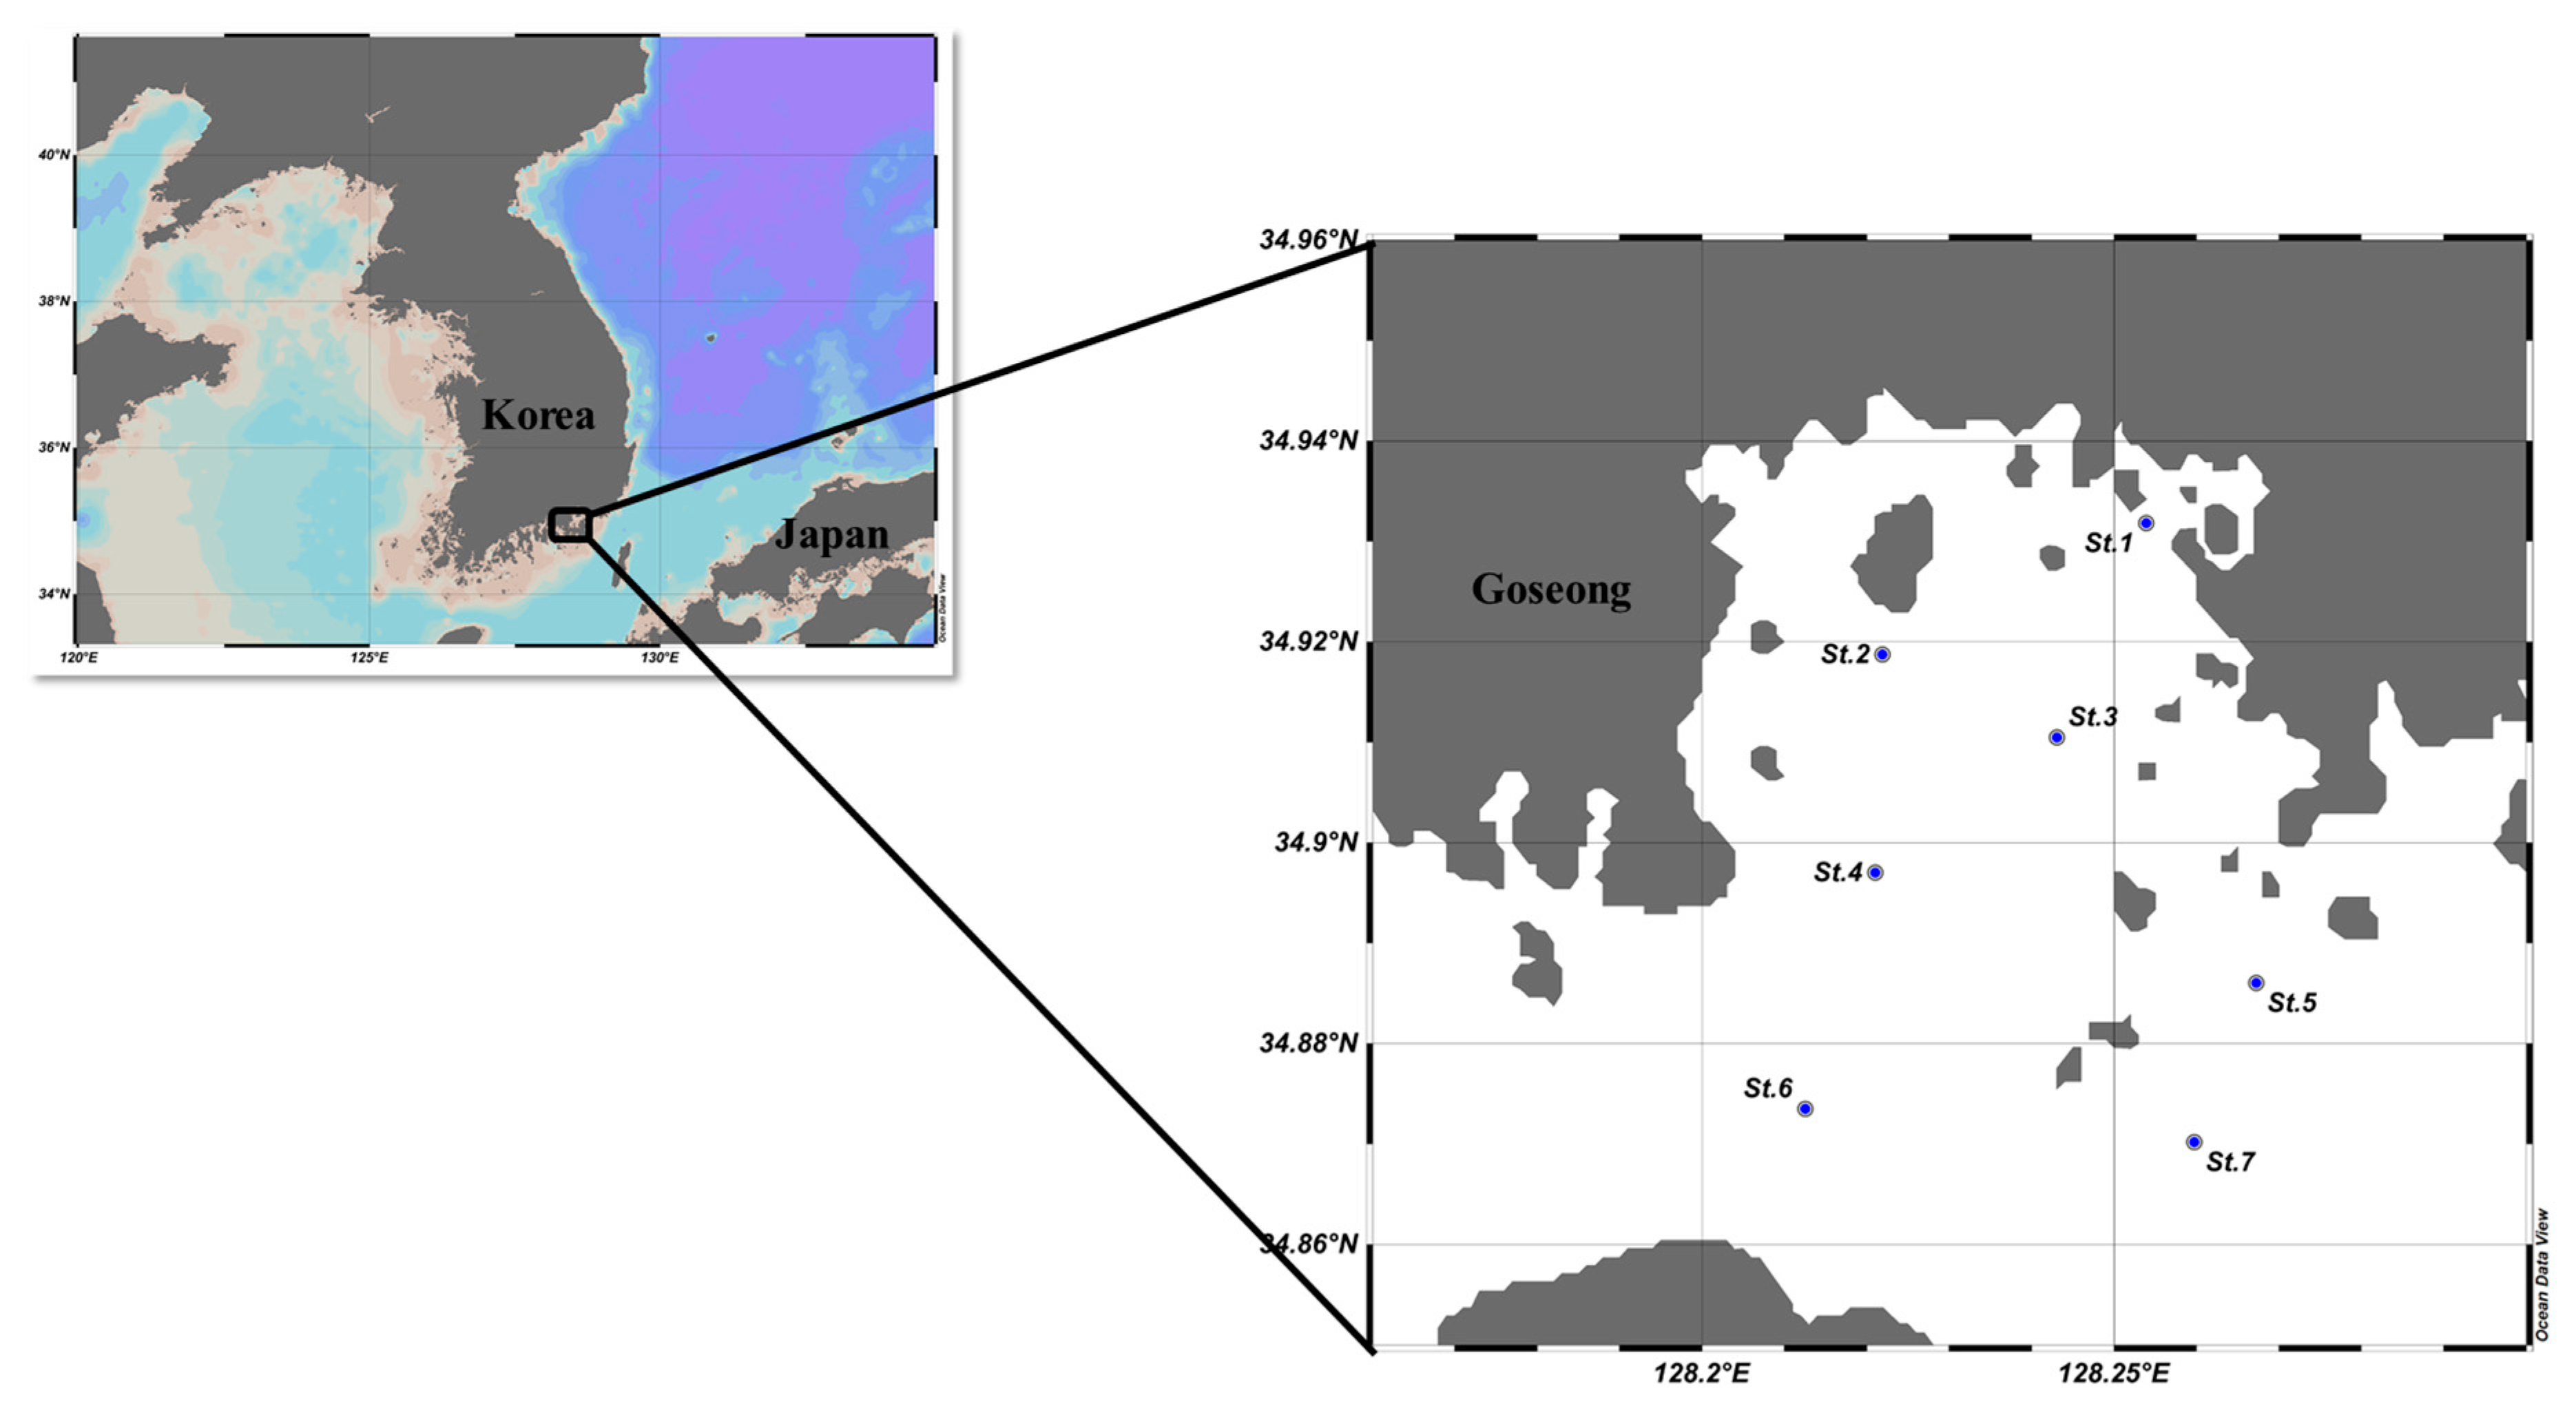
2. Materials and Methods
2.1. Water Sampling and Analysis
2.2. Statistical Analysis
3. Results
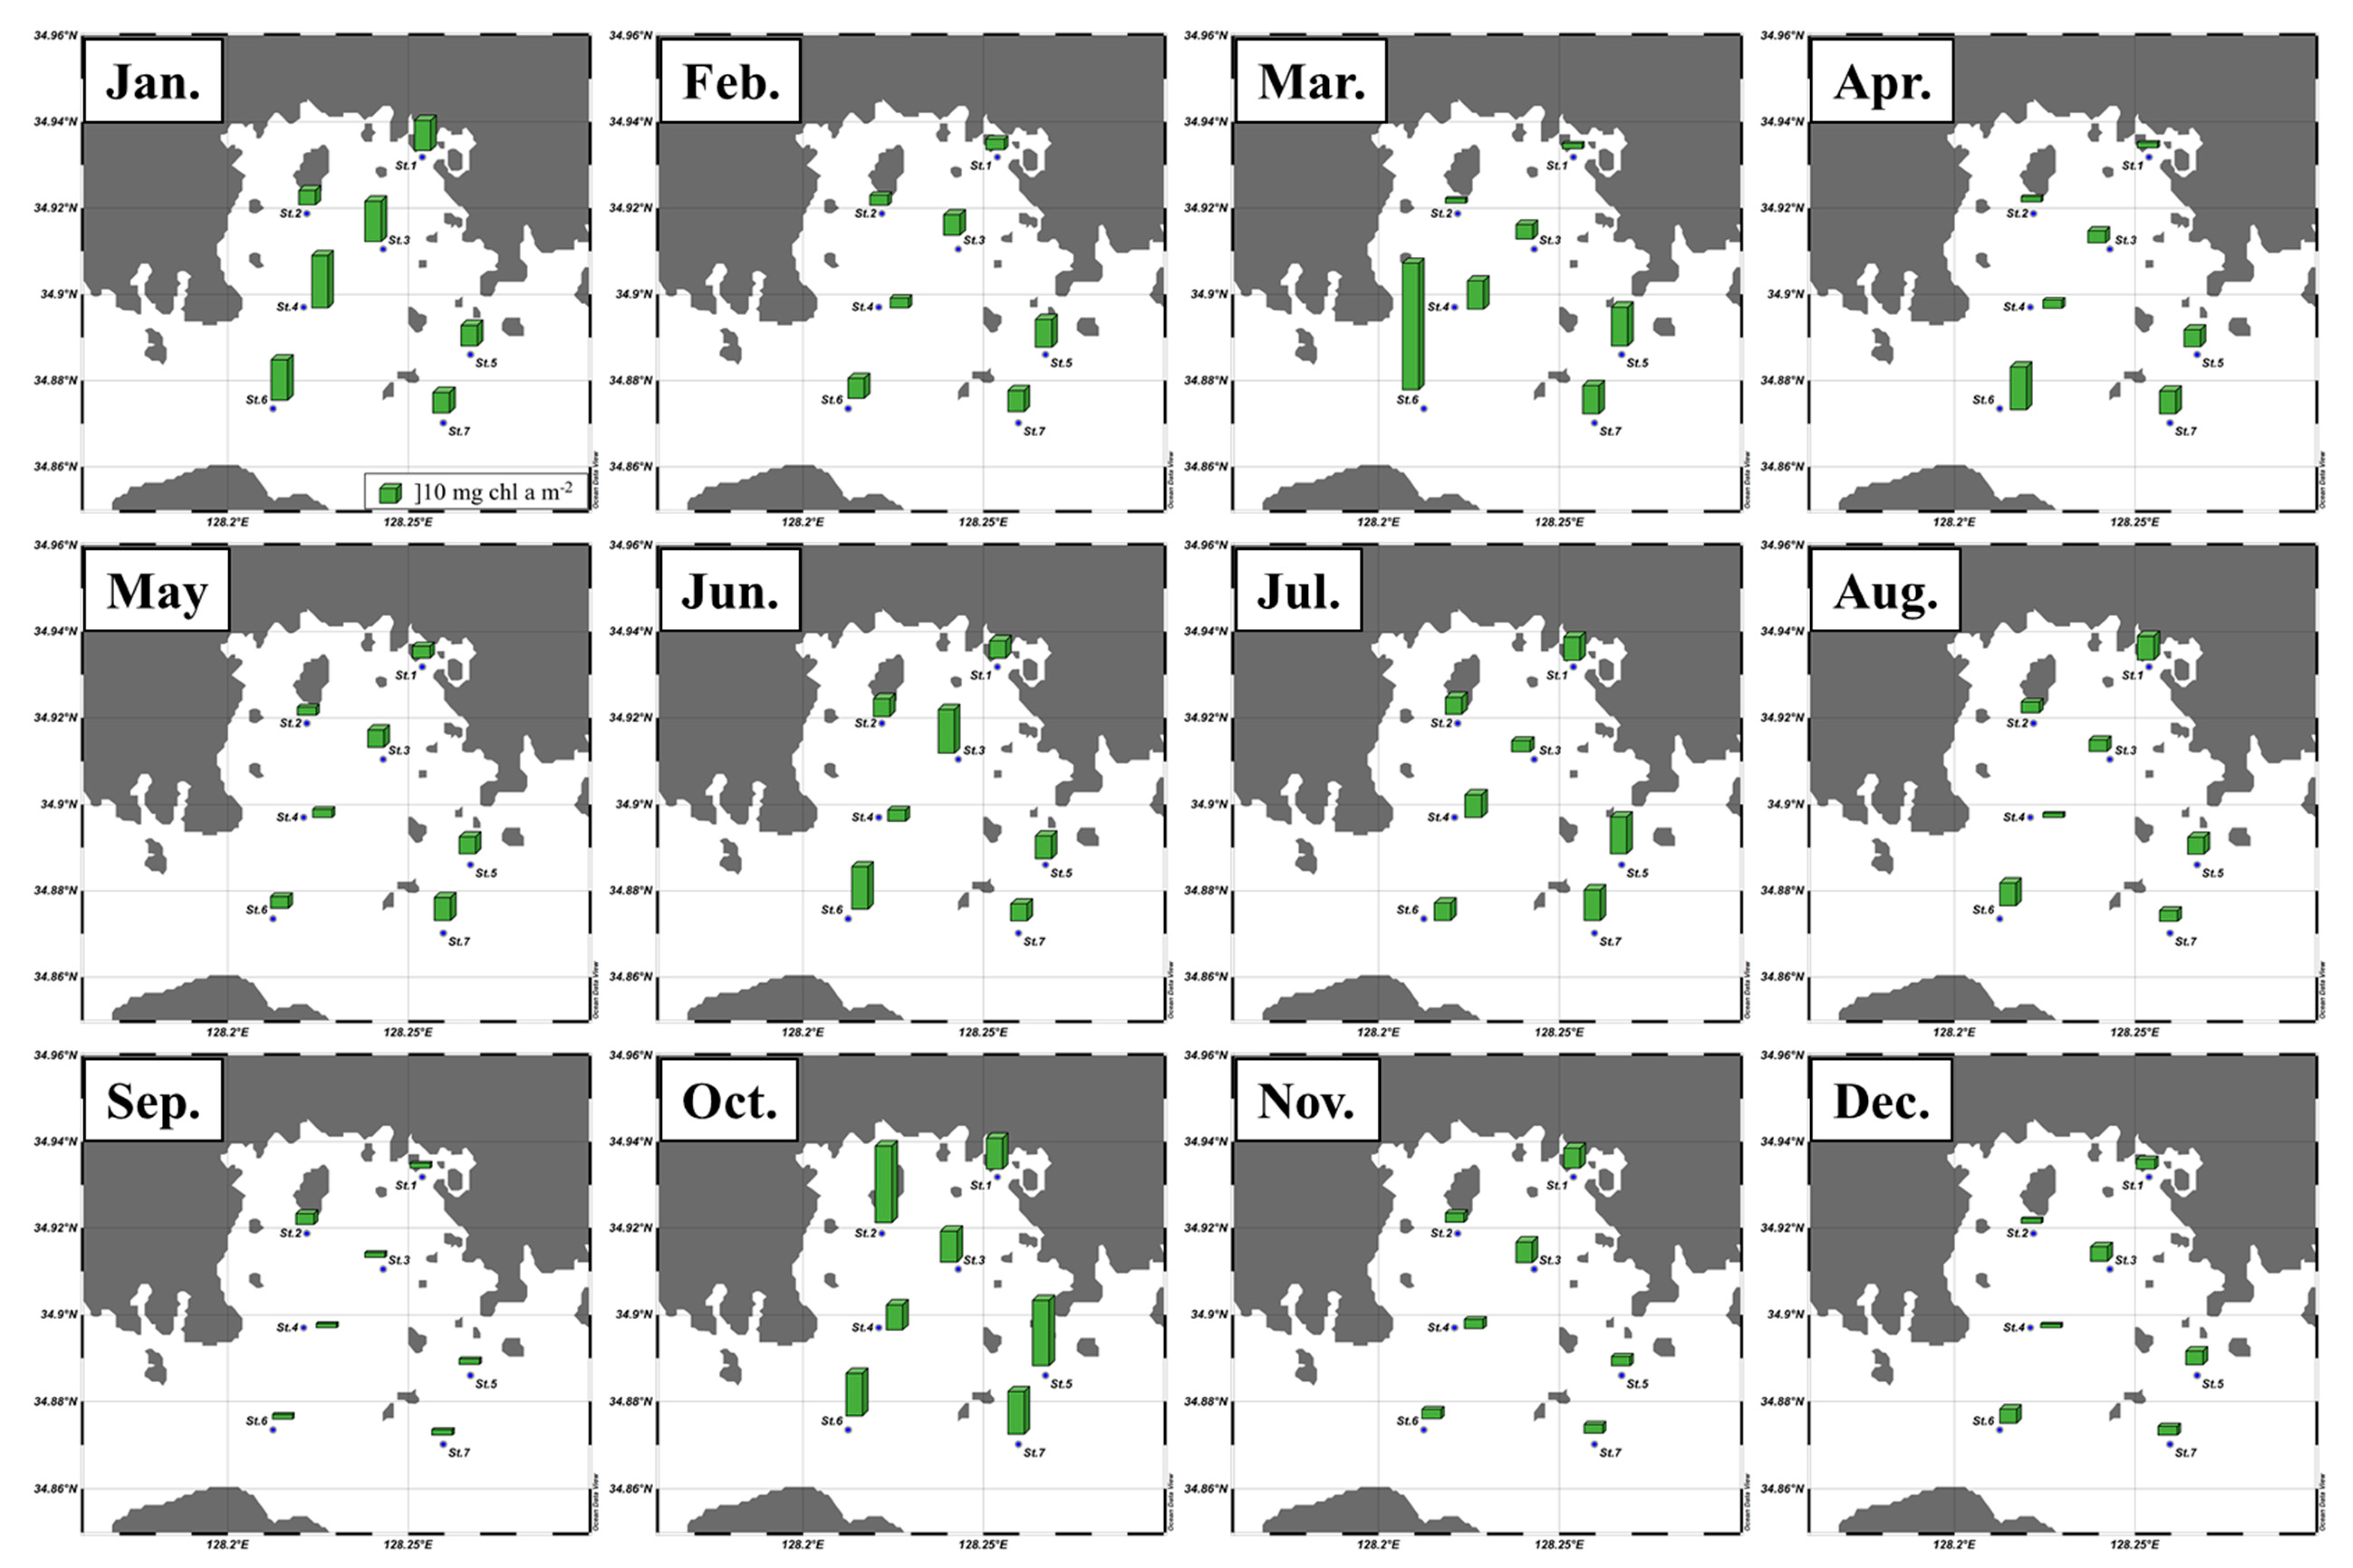
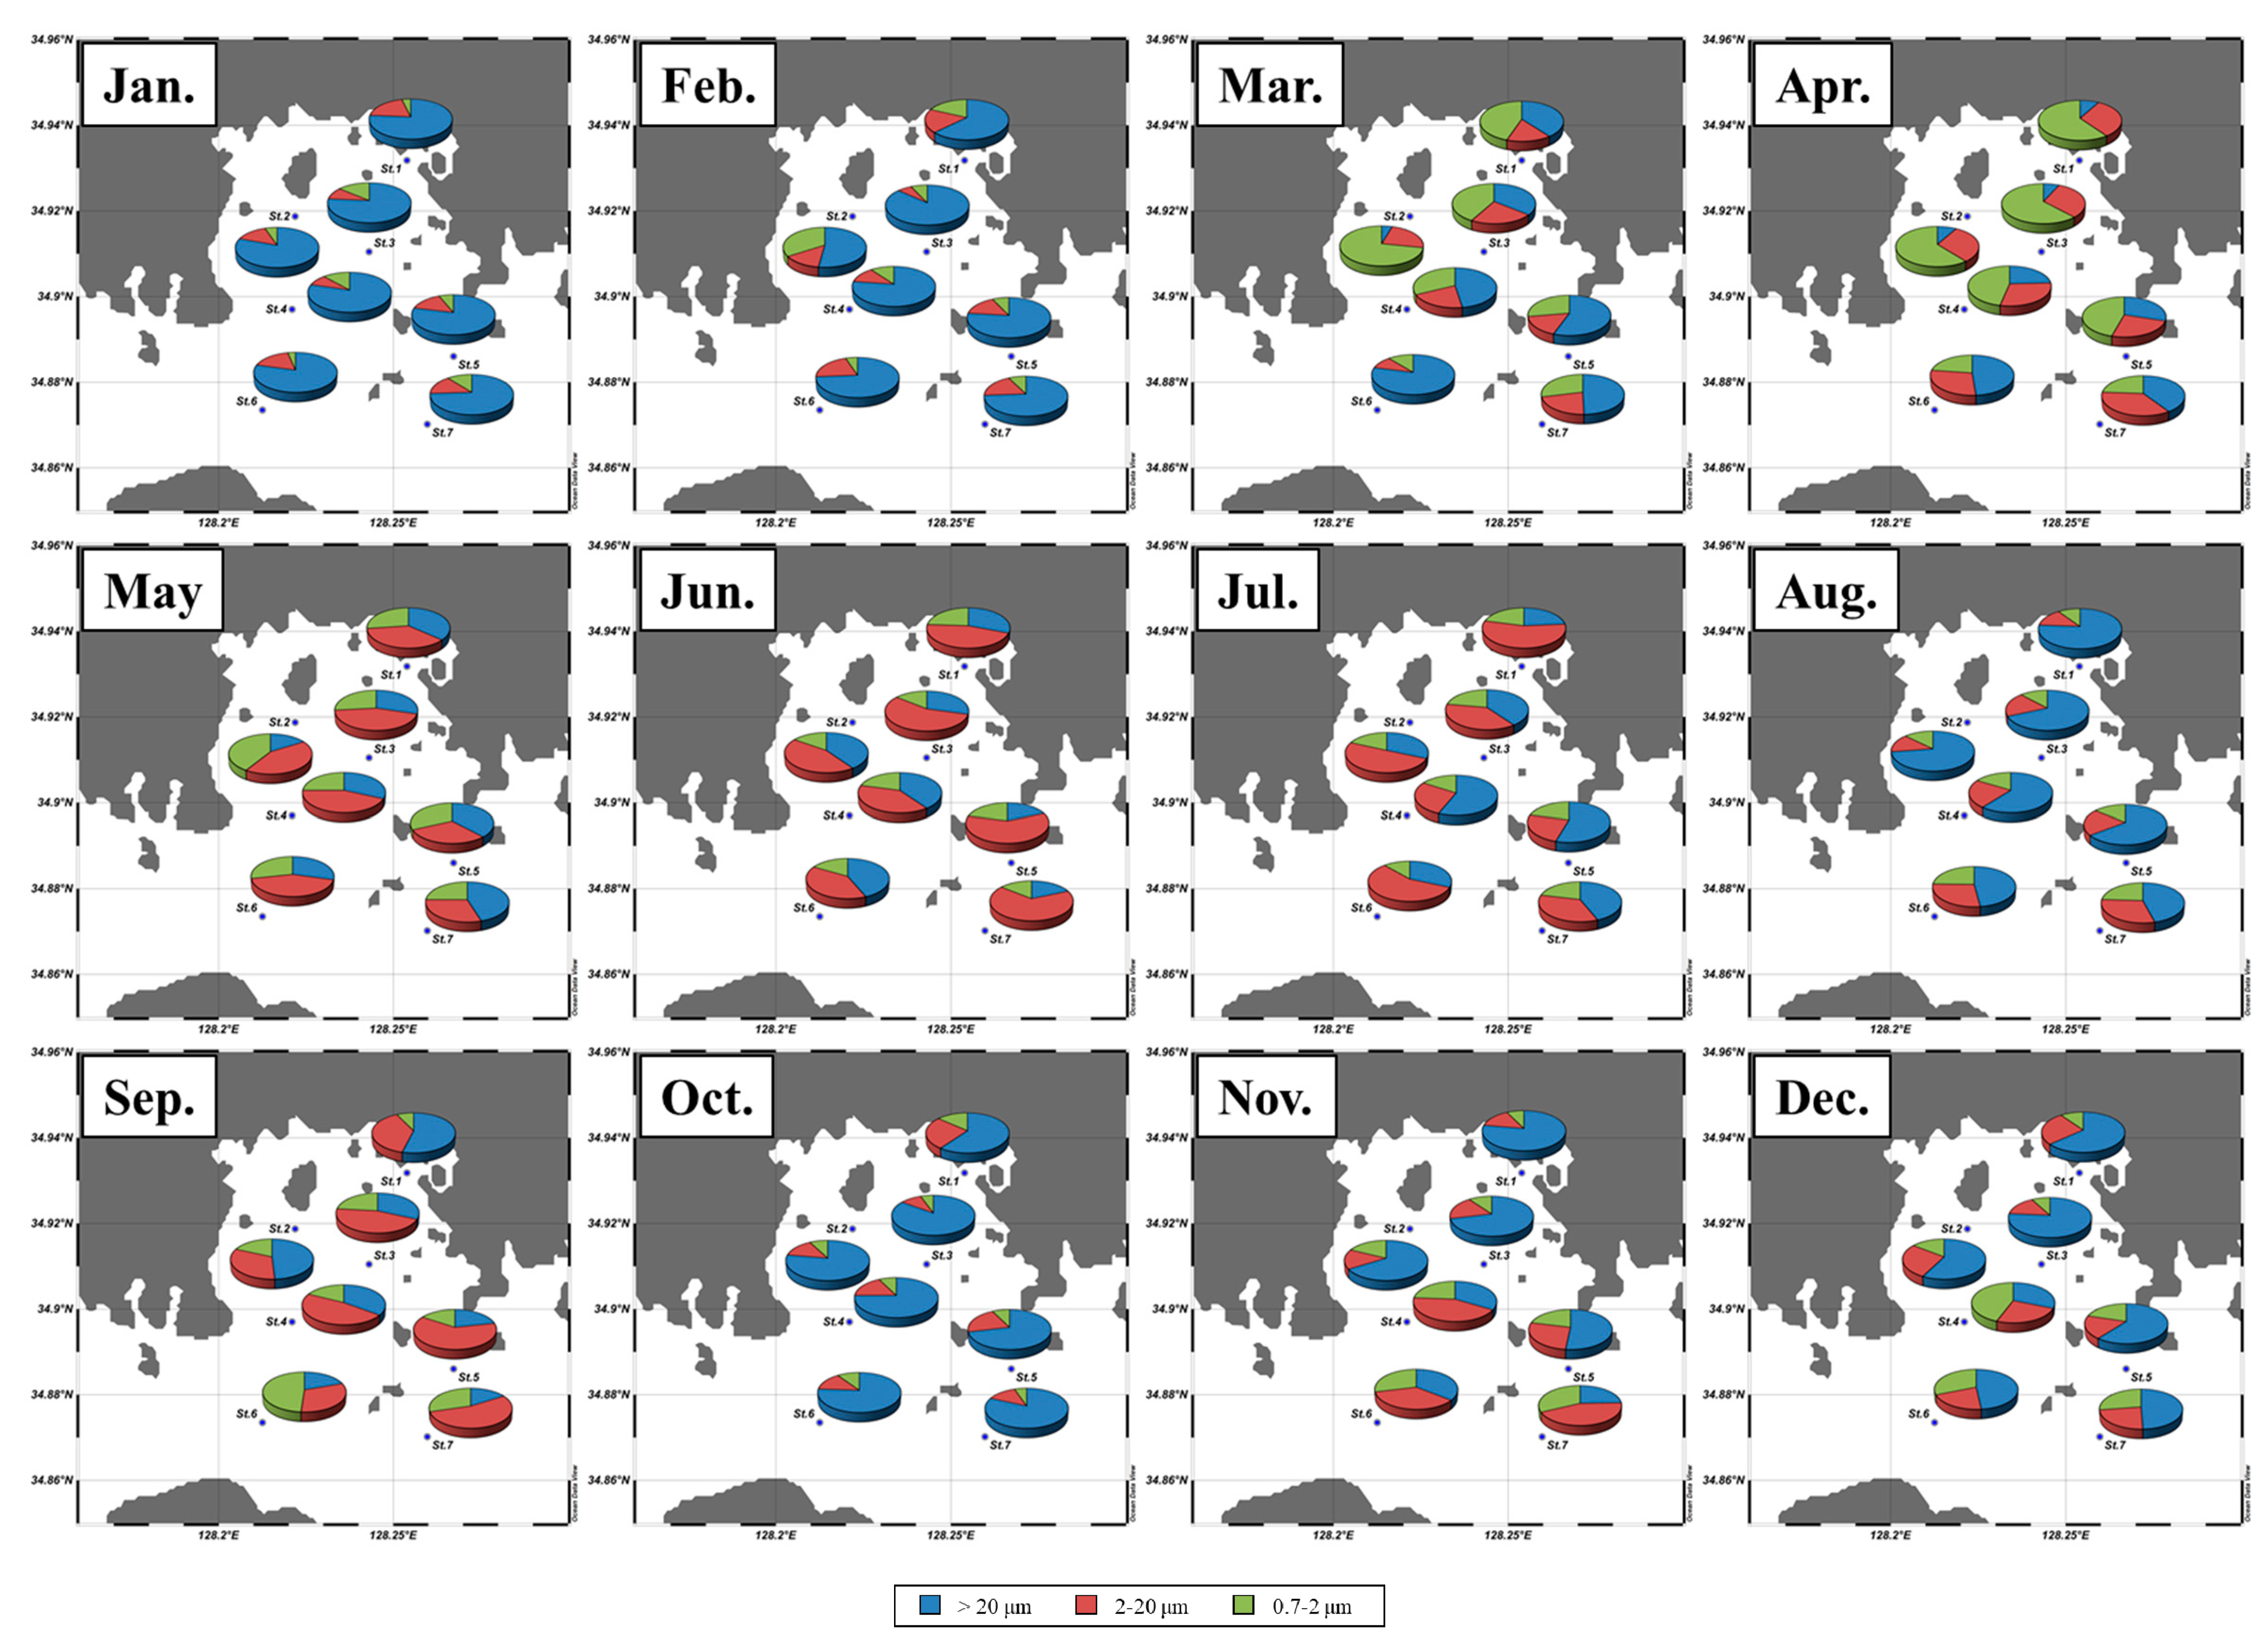
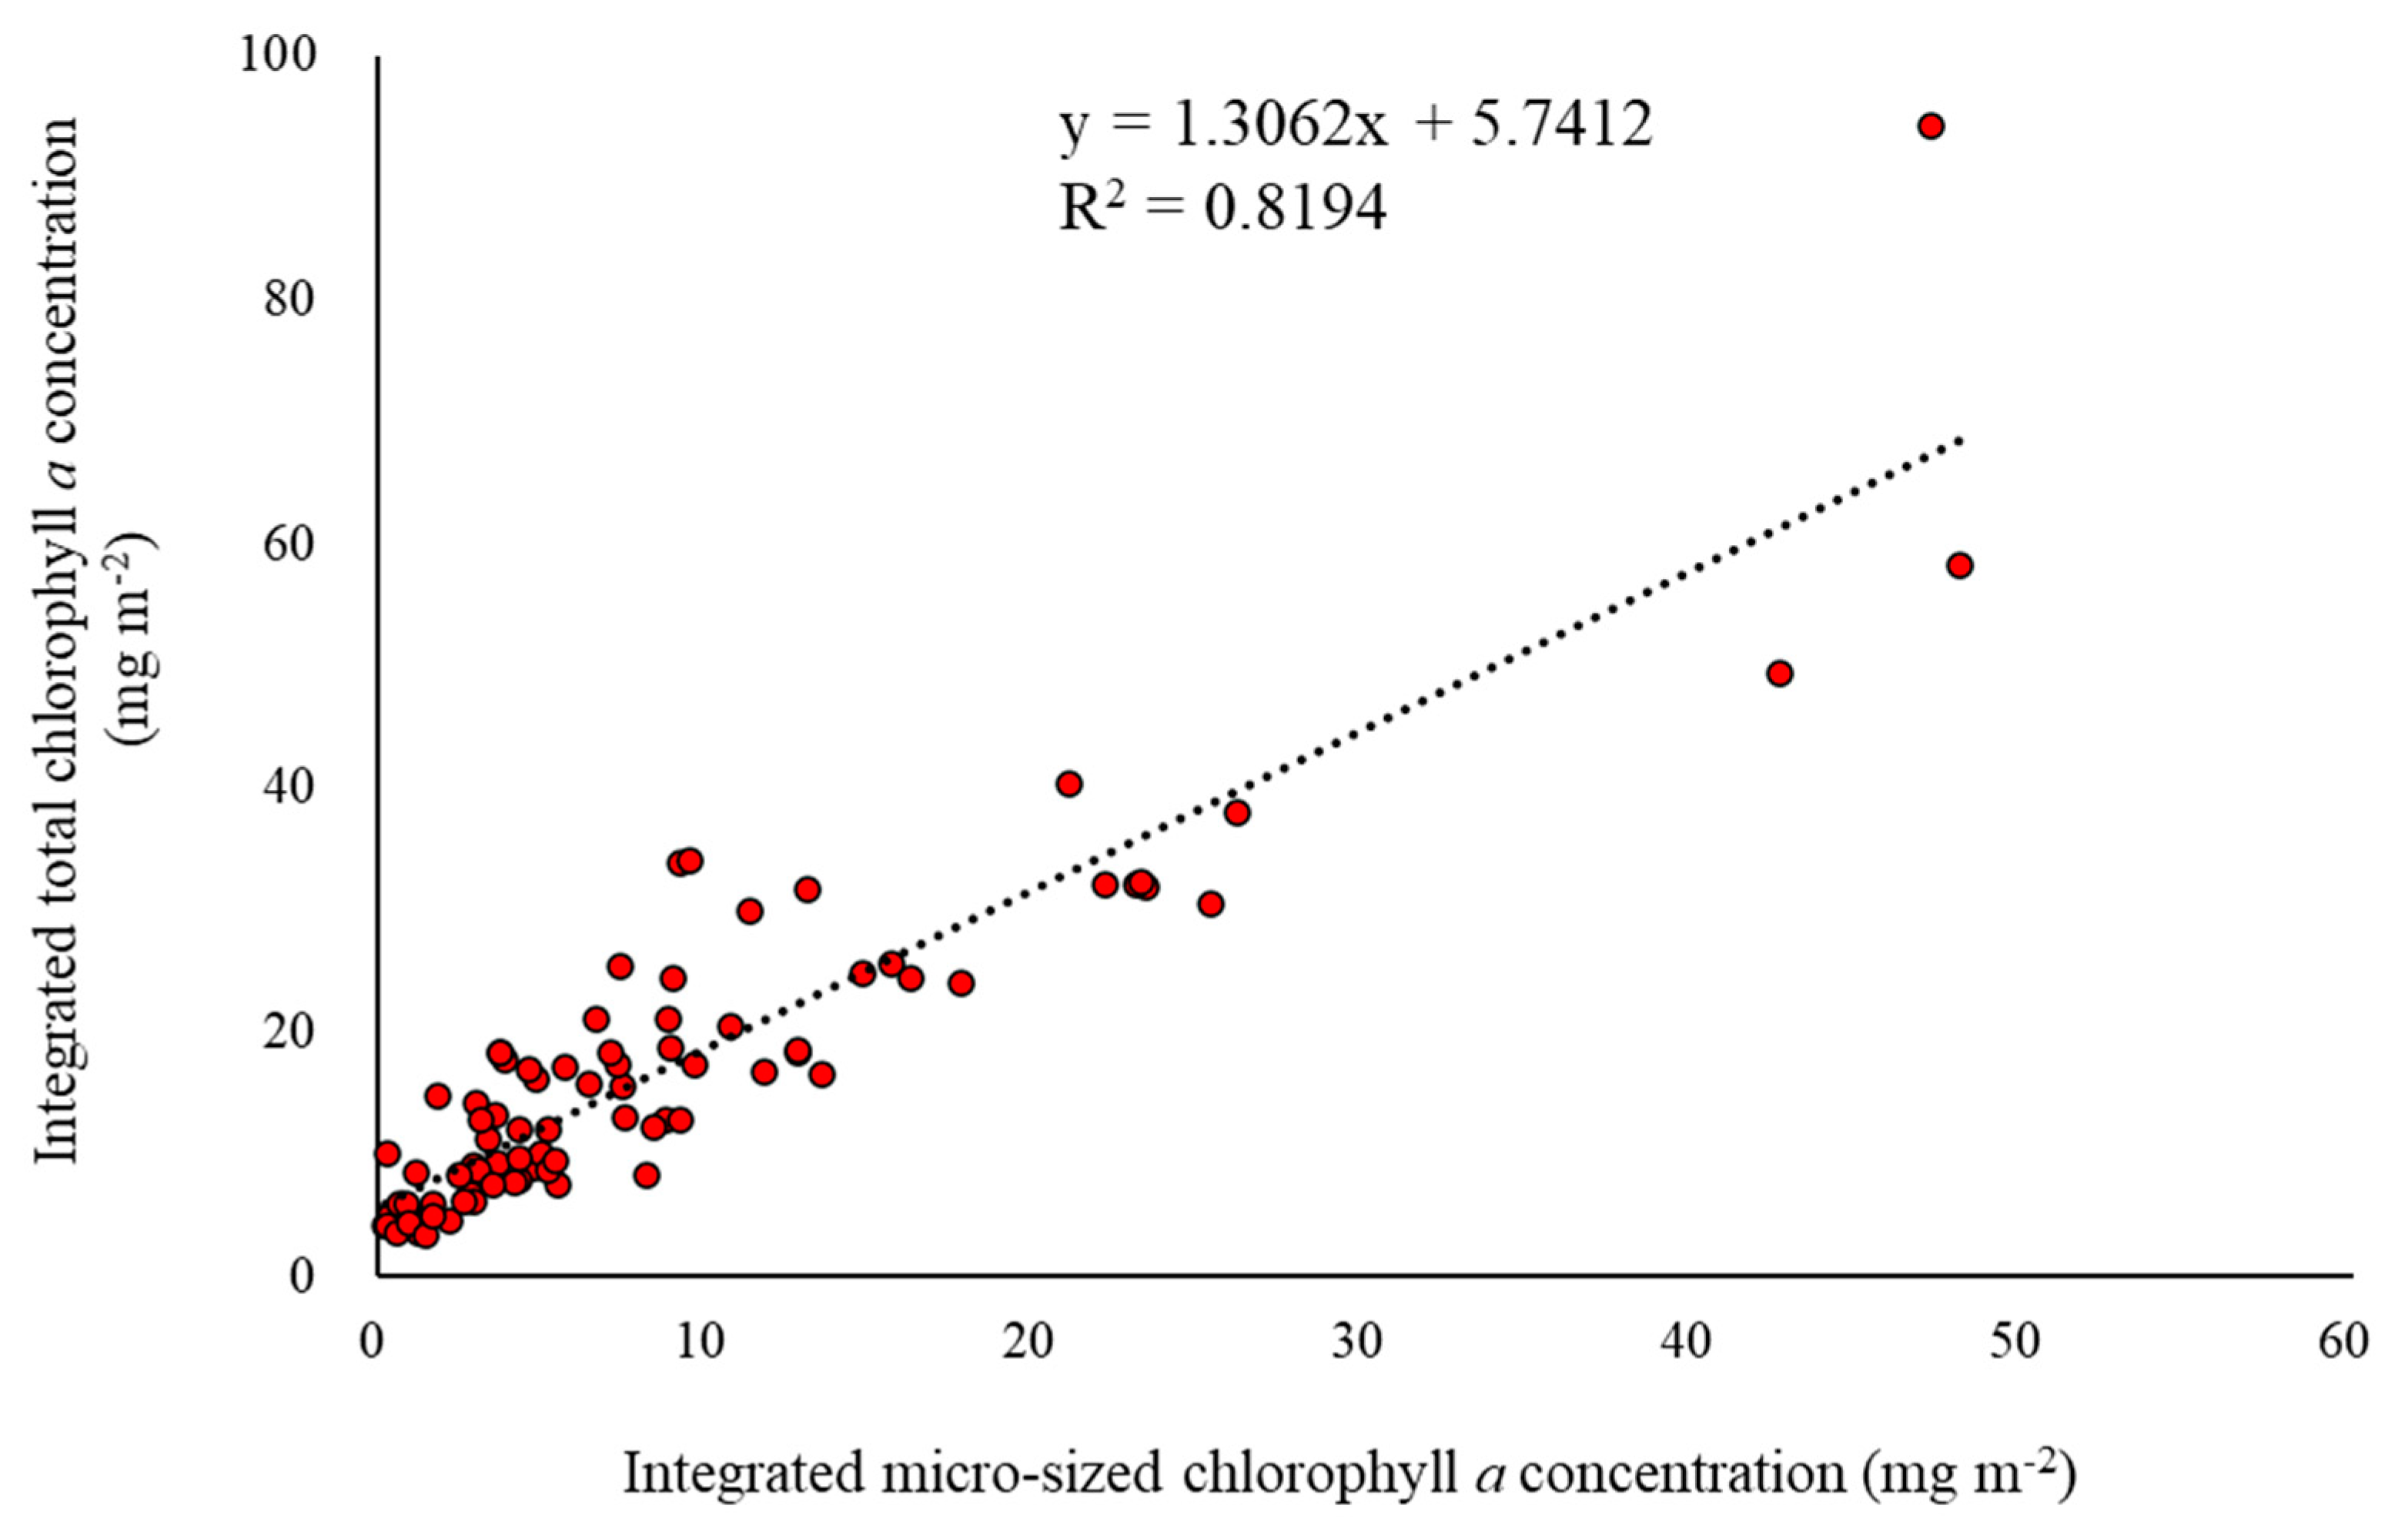
3.1. Monthly Concentrations of Nutrients and Chlorophyll a
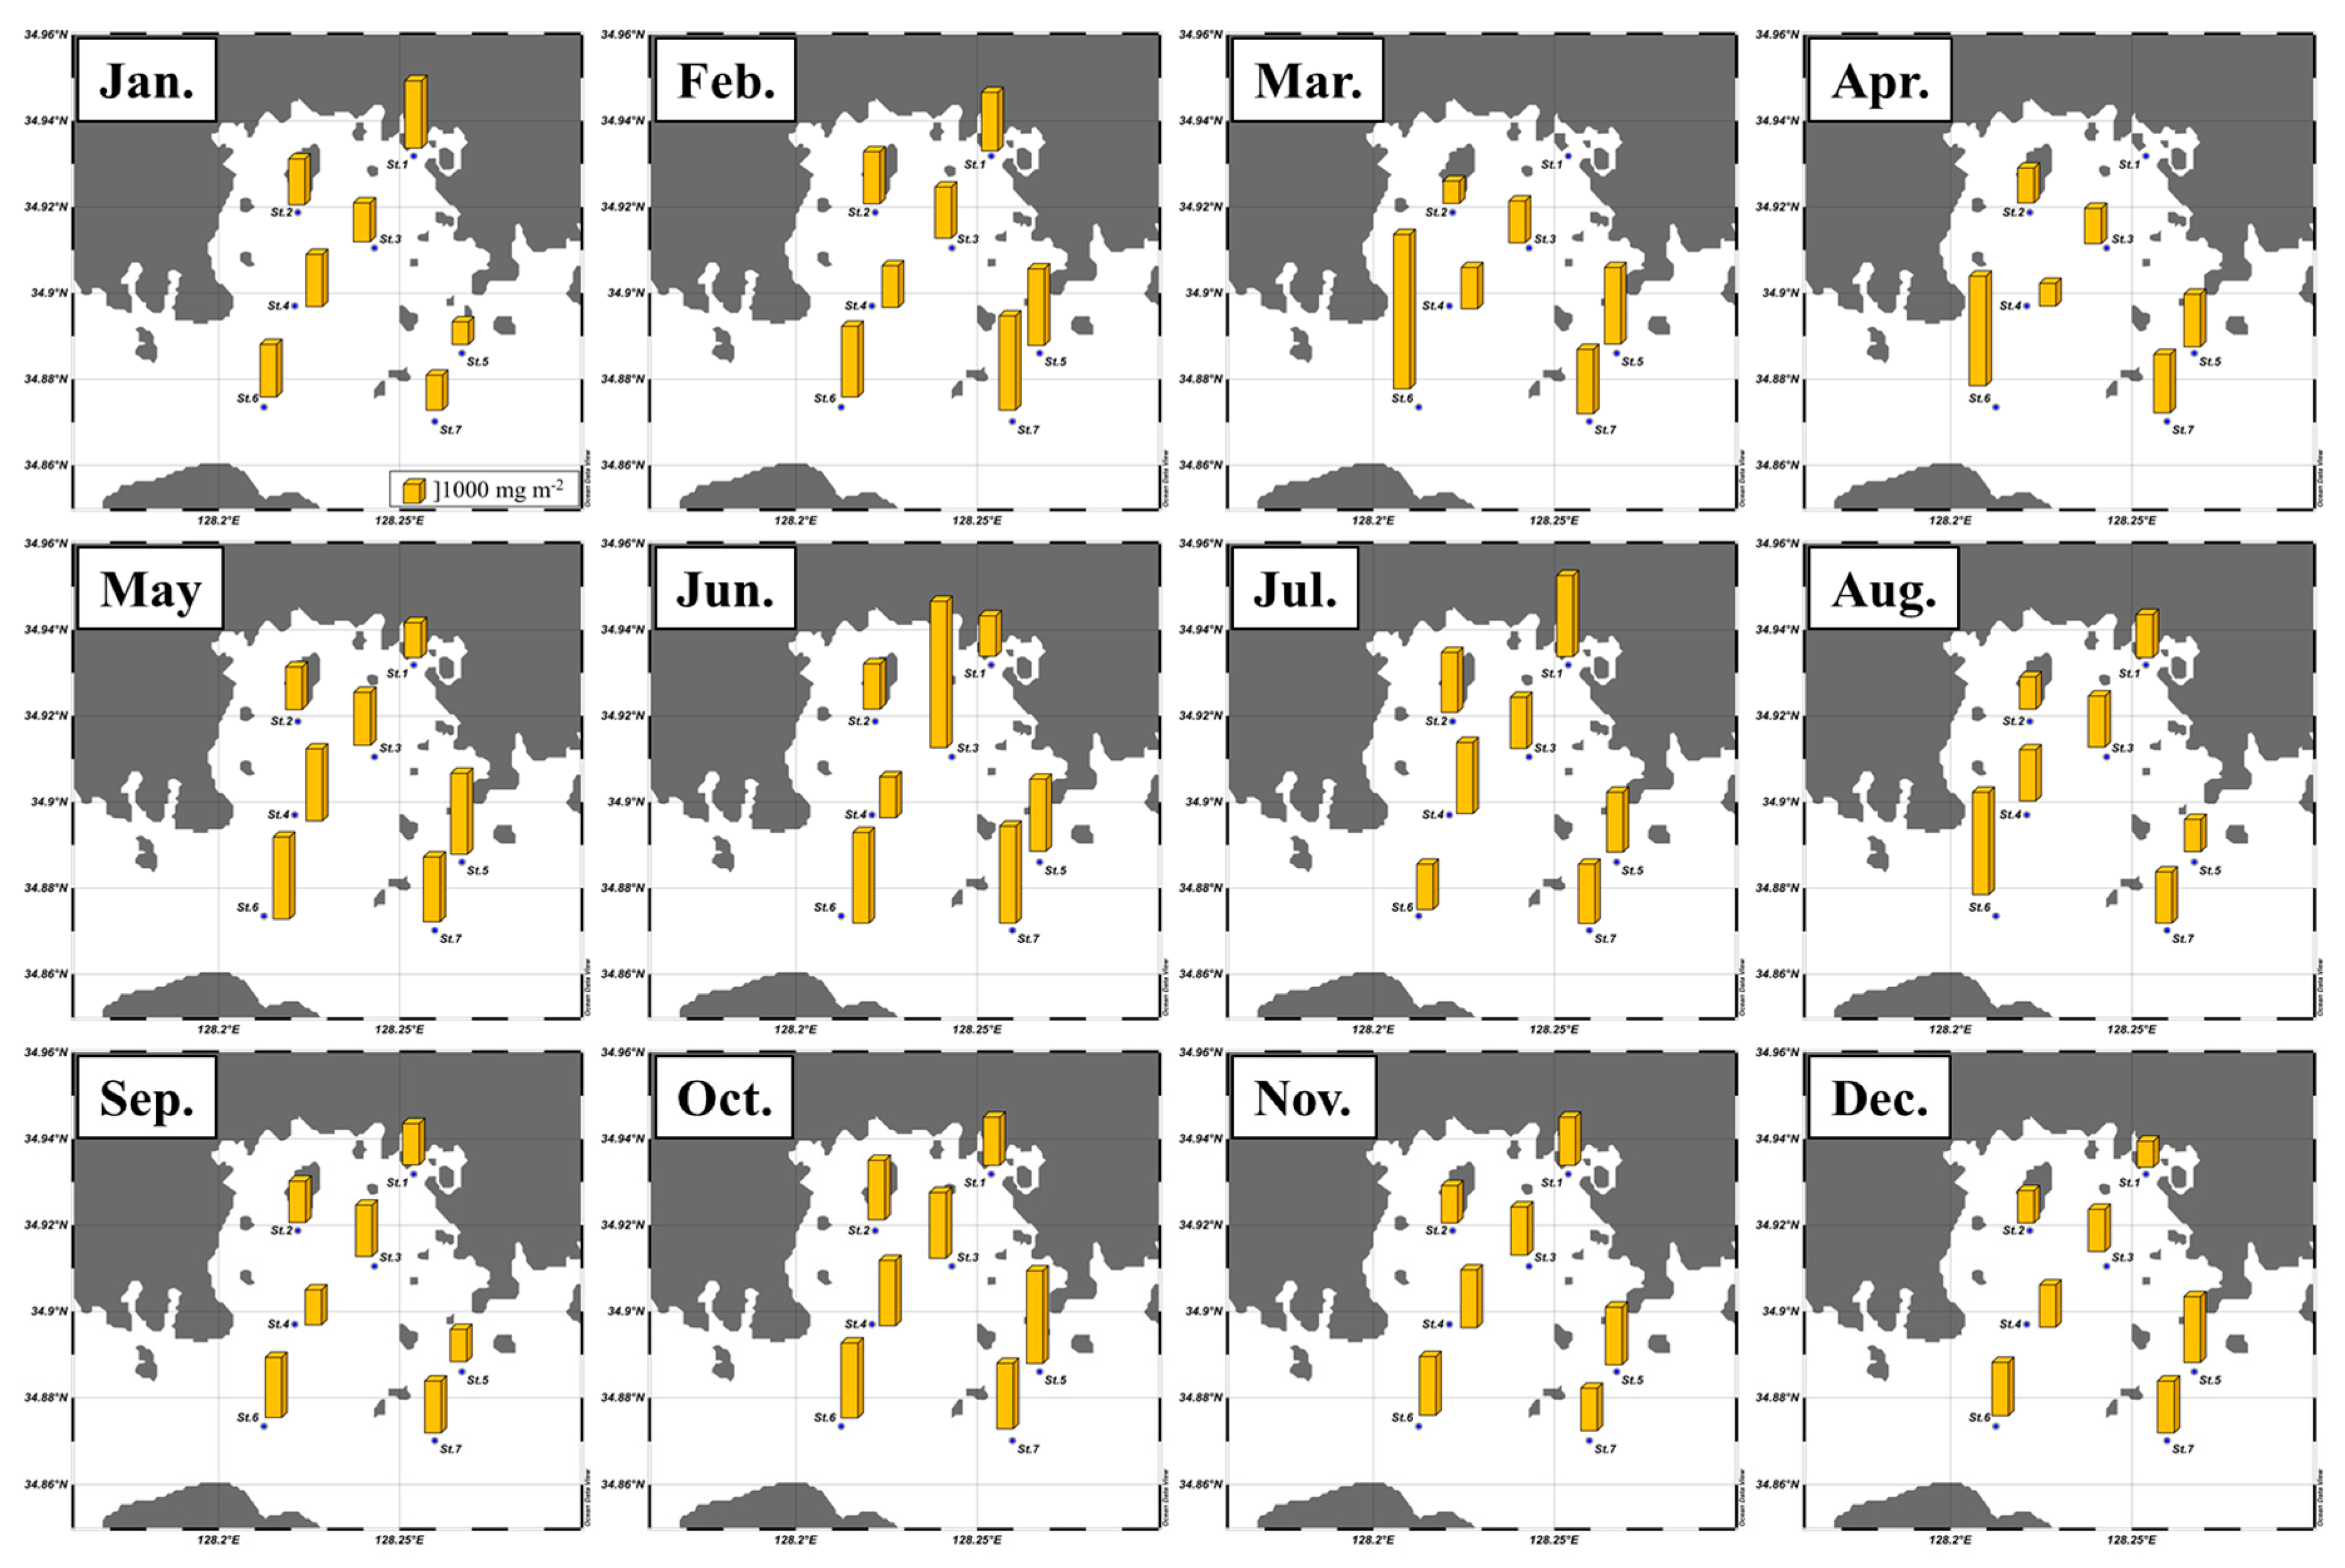
3.2. Spatial and Temporal Variations of the Macromolecular Compositions of POM
3.3. Principal Component Analysis (PCA)
4. Discussion
5. Conclusions
Author Contributions
Funding
Acknowledgments
Conflicts of Interest
References
- Mathiesen, A.M. The state of the World Fisheries and Aquaculture 2012; Food and Agriculture Organization: Rome, Italy, 2012; p. 290. [Google Scholar]
- Cho, C.H.; Park, K. Eutrophication of bottom mud in shellfish farms, the Goseong-Jaran Bay. Korean J. Fish. Aquat. Sci. 1983, 16, 260–264. [Google Scholar]
- Xu, Q.; Yang, H. Food sources of three bivalves living in two habitats of Jiaozhou Bay (Qingdao, China): Indicated by lipid biomarkers and stable isotope analysis. J. Shellfish Res. 2007, 26, 561–567. [Google Scholar] [CrossRef]
- Umehara, A.; Asaoka, S.; Fujii, N.; Otani, S.; Yamamoto, H.; Nakai, S.; Okuda, T.; Nishijima, W. Biological productivity evaluation at lower trophic levels with intensive Pacific oyster farming of Grassostrea gigas in Hiroshima Bay, Japan. Aquaculture 2018, 495, 311–319. [Google Scholar] [CrossRef]
- Lee, J.H.; Lee, D.; Kang, J.J.; Joo, H.; Lee, J.H.; Lee, H.W.; Ahn, S.H.; Kang, C.K.; Lee, S.H. The effects of different environmental factors on the biochemical composition of particulate organic matter in Gwanyang Bay, South Korea. Biogeosciences 2017, 14, 1903–1917. [Google Scholar] [CrossRef]
- Kim, H.C.; Lee, J.H.; Lee, W.C.; Hong, S.; Kang, J.J.; Lee, D.; Jo, N.; Bhavya, P.S. Decoupling of macromolecular compositions of particulate organic matters between the water columns and the sediment in Geoje-Hansan Bay, South Korea. Ocean Sci. J. 2018, 53, 735–743. [Google Scholar] [CrossRef]
- Kim, Y.; Lee, J.H.; Kang, J.J.; Lee, J.H.; Lee, H.W.; Kang, C.K.; Lee, S.H. River discharge effects on the contribution of small-sized phytoplankton to the total biochemical composition of POM in Gwangyang Bay, Korea. Estuar. Coast. Shelf Sci. 2019, 226, 106293. [Google Scholar] [CrossRef]
- Morris, I.; Glover, H.E.; Yentsch, C.S. Products of photosynthesis by marine phytoplankton: The effect of environmental factors on the relative rates of protein synthesis. Mar. Biol. 1974, 21, 1–9. [Google Scholar] [CrossRef]
- Kowallik, W. Blue light effects on carbohydrate and protein metabolism. In Blue Light Responses: Phenomena and Occurrence in Plants; Senger, H., Ed.; CRC Press: Boca Raton, FL, USA, 1978; Volume 1, pp. 8–13. [Google Scholar]
- Suárez, I.; Maranón, E. Photosynthate allocation in a temperate sea over an annual cycle: The relationship between protein synthesis and phytoplankton physiological state. J. Sea Res. 2003, 50, 285–299. [Google Scholar] [CrossRef]
- Mortensen, S.H.; Børsheim, K.Y.; Rainuzzo, J.; Knutsen, G. Fatty acid and elemental composition of the marine diatom Chaetoceros gracilis Schütt. Effects of silicate deprivation, temperature and light intensity. J. Exp. Mar. Biol. Ecol. 1988, 122, 173–185. [Google Scholar] [CrossRef]
- Liebezeit, G. Particulate carbohydrate in relation to phytoplankton in the euphotic zone of the Bransfield Strait. Polar Biol. 1984, 2, 225–228. [Google Scholar] [CrossRef]
- Moal, J.; Jezequel, V.M.; Harris, R.P.; Samain, J.F.; Poulet, S.A. Interspecific and intraspecific variability of the chemical-composition of marine-phytoplankton. Oceanol. Acta 1987, 10, 339–346. [Google Scholar]
- Kilham, S.S.; Kreeger, D.A.; Goulden, C.E.; Lynn, S.G. Effects of nutrient limitation on biochemical constituents of Ankistrodesmus falcatus. Freshw. Biol. 1997, 38, 591–596. [Google Scholar] [CrossRef]
- Lee, S.H.; Kim, H.J.; Whitledge, T.E. High incorporation of carbon into proteins by the phytoplankton of the Bering Strait and Chukchi Sea. Cont. Shelf Res. 2009, 29, 1689–1696. [Google Scholar] [CrossRef]
- Yun, M.S.; Lee, D.B.; Kim, B.K.; Kang, J.J.; Lee, J.H.; Yang, E.J.; Park, W.G.; Chung, K.H.; Lee, S.H. Comparison of phytoplankton macromolecular compositions and zooplankton proximate compositions in the northern Chukchi Sea. Deep Sea Res. Part II 2015, 120, 82–90. [Google Scholar] [CrossRef]
- Jo, N.; Kang, J.J.; Park, W.G.; Lee, B.R.; Yun, M.S.; Lee, J.H.; Kim, S.M.; Lee, D.; Joo, H.; Lee, J.H.; et al. Seasonal variation in the biochemical compositions of phytoplankton and zooplankton communities in the southwestern East/Japan Sea. Deep Sea Res. Part II 2017, 143, 82–90. [Google Scholar] [CrossRef]
- Navarro, J.M.; Clasing, E.; Urrutia, G.; Asencio, G.; Stead, R.; Herrera, C. Biochemical composition and nutritive value of suspended particulate matter over a tidal flat of Southern Chile. Estuar. Coast. Shelf Sci. 1993, 37, 59–73. [Google Scholar] [CrossRef]
- Danovaro, R.; Dell’Anno, A.; Pusceddu, A.; Marrale, D.; Croce, N.D.; Fabiano, M.; Tselepides, A. Biochemical composition of pico-, nano- and microparticulate organic matter and bacterioplankton biomass in the oligotrophic Cretan Sea (NE Mediterranean). Prog. Oceanogr. 2000, 46, 279–310. [Google Scholar] [CrossRef]
- Navarro, J.M.; Thompson, R.J. Seasonal fluctuations in the size spectra, biochemical-composition and nutritive-value of the seston available to a suspension-feeding bivalve ina asub-arctic environment. Mar. Ecol. Prog. Ser. 1995, 125, 95–106. [Google Scholar] [CrossRef]
- Kang, J.J.; Joo, H.; Lee, J.H.; Lee, J.H.; Lee, H.W.; Lee, D.; Kang, C.K.; Yun, M.S.; Lee, S.H. Comparison of biochemical compositions of phytoplankton during spring and fall seasons in the northern East/Japan Sea. Deep Sea Res. Part II 2017, 143, 73–81. [Google Scholar] [CrossRef]
- Lee, S.H.; Whitledge, T.E.; Kang, S. Recent carbon and nitrogen uptake rates of phytoplankton in Bering Strait and the Chukchi Sea. Cont. Shelf Res. 2007, 27, 2231–2249. [Google Scholar] [CrossRef]
- Lee, J.H.; Kim, H.C.; Lee, T.; Lee, W.C.; Kang, J.J.; Jo, N.; Lee, D.; Kim, K.; Min, J.; Kang, S.; et al. Monthly variations in the intracellular nutrient pools of phytoplankton in Jaran Bay, Korea. J. Coast. Res. 2018, 85, 331–335. [Google Scholar] [CrossRef]
- Welschmeyer, N.A. Fluorometric analysis of chlorophyll a in the presence of chlorophyll b and phaeopigments. Limnol. Oceanogr. 1994, 39, 1985–1992. [Google Scholar] [CrossRef]
- Dubois, M.; Gilles, K.; Hamilton, J.K.; Rebers, P.A.; Smith, F. Colormetric method for determination of sugars and related substances. Anal. Chem. 1994, 28, 350–356. [Google Scholar] [CrossRef]
- Stevens, J. Applied Multivariate Statistics for the Social Science; Lawrence Erlbaum: New York, NY, USA, 1986; p. 515. [Google Scholar]
- Camdevyren, H.; Demyr, N.; Kanik, A.; Keskyn, S. Use principal component scores in multiple linear regression models for prediction of Chlorophyll-a in reservoirs. Ecol. Model. 2005, 181, 581–589. [Google Scholar] [CrossRef]
- Wang, Y.S.; Lou, Z.P.; Sun, C.C.; Wu, M.L.; Han, S.H. Multivariate statistical analysis of water quality and phytoplankton characteristics in Daya Bay, China, from 1999 to 2002. Oceanologia 2006, 48, 193–211. [Google Scholar]
- Deutsch, C.; Sarmiento, J.L.; Sigman, D.M.; Gruber, N.; Dunne, J.P. Spatial coupling of nitrogen inputs and losses in the ocean. Nature 2007, 445, 163–167. [Google Scholar] [CrossRef]
- Brun, P.; Vogt, M.; Payne, M.R.; Gruber, N.; O’Brien, C.J.; Buitenhuis, E.T.; Le Quere, C.; Leblanc, K.; Luo, Y.W. Ecological niches of open ocean phytoplankton taxa. Limnol. Oceanogr. 2015, 60, 1020–1038. [Google Scholar] [CrossRef]
- Pedhazur, E. Multiple regression in behavioral science; Holt Rinehart & Winston: Fort Worth, TX, USA, 1982; p. 135. [Google Scholar]
- Lee, Y.S.; Kang, C.K.; Kwon, K.Y.; Kim, S.Y. Organic and inorganic matter increase related to eutrophication in Gamak Bay, South Korea. J. Environ. Biol. 2009, 30, 373–380. [Google Scholar]
- Lee, Y.S.; Kang, C.K. Causes of COD increases in Gwangyang Bay, South Korea. J. Environ. Monit. 2010, 12, 1537–1546. [Google Scholar] [CrossRef] [PubMed]
- Lee, Y.S.; Lim, W.A.; Jung, C.S.; Park, J. Spatial distributions and monthly variations of water quality in coastal seawater of Tongyeong, Korea. J. Korean Soc. Mar. Environ. Eng. 2011, 14, 154–162. [Google Scholar] [CrossRef]
- Jeong, D.H.; Shin, H.H.; Jung, S.W.; Lim, D.I. Variations and characters of water quality during flood and dry seasons in the Eastern coast of South Sea, Korea. Korean J. Environ. Biol. 2013, 31, 19–36. [Google Scholar] [CrossRef]
- Park, J.S.; Yoon, Y.H.; Oh, S.J. Variational characteristics of phytoplankton community in the mouth parts of Gamak Bay, Southern Korea. Korean J. Environ. Biol. 2009, 27, 205–215. [Google Scholar]
- Lee, J.H.; Kang, J.J.; Jang, H.K.; Jo, N.; Lee, D.; Yun, M.S.; Lee, S.H. Major controlling factors for spatio-temporal variations in the macromolecular composition and primary production by phytoplankton in Garolim and Asan bays in the Yellow Sea. Reg. Stud. Mar. Sci. 2020, 36, 101269. [Google Scholar] [CrossRef]
- Desortová, B. Relationship between chlorophyll-a concentration and phytoplankton biomass in several reservoirs in Czechoslovakia. Hydrobiology 1981, 66, 153–169. [Google Scholar] [CrossRef]
- Behrenfeld, M.J.; Boss, E.; Siegel, D.A.; Shea, D.M. Carbon-based ocean productivity and phytoplankton physiology from space. Glob. Biogeochem. Cycles 2005, 19. [Google Scholar] [CrossRef]
- Behrenfeld, M.J.; Boss, E. Beam attenuation and chlorophyll concentration as alternative optical indices of phytoplankton biomass. J. Mar. Res. 2006, 64, 431–451. [Google Scholar] [CrossRef]
- Kruskopf, M.; Flynn, K.J. Chlorophyll content and fluorescence responses cannot be used to gauge reliably phytoplankton biomass, nutrient status or growth rate. New Phytol. 2006, 169, 525–536. [Google Scholar] [CrossRef]
- Kim, T.W.; Lee, K.; Lee, C.K.; Jeong, H.D.; Suh, Y.S.; Lim, W.A.; Kim, K.Y.; Jeong, H.J. Interannual nutrient dynamics in Korean coastal waters. Harmful Algae 2013, 30, 15–27. [Google Scholar] [CrossRef]
- Son, Y.B.; Ryu, J.H.; Noh, J.H.; Ju, S.J.; Kim, S.-H. Climatological variability of satellite-derived sea surface temperature and chlorophyll in the South Sea of Korea and East China Sea. Ocean Polar Res. 2012, 34, 201–218. [Google Scholar] [CrossRef]

| Integrated Nutrients | ||||
|---|---|---|---|---|
| NH4+ | NO2− + NO3− | DIP | SiO2-Si | |
| mmol m−2 | ||||
| Jan. | 8 ± 5 | 21 ± 19 | 3 ± 2 | 64 ± 46 |
| Feb. | 4 ± 3 | 8 ± 6 | 2 ± 1 | 21 ± 11 |
| Mar. | 4 ± 2 | 7 ± 6 | 1 ± 1 | 22 ± 7 |
| Apr. | 7 ± 2 | 12 ± 5 | 2 ± 1 | 47 ± 5 |
| May | 6 ± 1 | 7 ± 2 | 0.5 ± 0.2 | 74 ± 14 |
| Jun. | 8 ± 3 | 12 ± 8 | 1 ± 1 | 167 ± 48 |
| Jul. | 11 ± 4 | 15 ± 10 | 2 ± 1 | 161 ± 31 |
| Aug. | 9 ± 4 | 8 ± 4 | 2 ± 1 | 90 ± 46 |
| Sep. | 48 ± 19 | 33 ± 13 | 6 ± 2 | 146 ± 37 |
| Oct. | 6 ± 2 | 22 ± 23 | 1 ± 2 | 72 ± 70 |
| Nov. | 11 ± 4 | 44 ± 24 | 4 ± 2 | 102 ± 46 |
| Dec. | 9 ± 4 | 46 ± 31 | 4 ± 2 | 106 ± 66 |
| Total chl a | Micro | Nano | Pico | CHO | PRT | LIP | FM | CHO | PRT | LIP | |
|---|---|---|---|---|---|---|---|---|---|---|---|
| (μg L−1) | (%) | (%) | (%) | (μg L−1) | (μg L−1) | (μg L−1) | (μg L−1) | (%) | (%) | (%) | |
| Jan. | 3.2 ± 1.0 | 78 ± 7 | 14 ± 7 | 8 ± 4 | 145 ± 64 | 81 ±19 | 119 ± 34 | 345 ± 84 | 41 ± 9 | 24 ± 4 | 35 ± 8 |
| Feb. | 1.7 ± 0.6 | 72 ± 19 | 15 ± 8 | 13 ± 18 | 243 ± 56 | 65 ± 21 | 134 ± 44 | 442 ± 56 | 55 ± 10 | 15 ± 5 | 30 ± 8 |
| Mar. | 2.5 ± 1.6 | 45 ± 22 | 19 ± 5 | 37 ± 18 | 206 ± 48 | 68 ± 21 | 92 ± 26 | 368 ± 78 | 56 ± 6 | 18 ± 3 | 25 ± 5 |
| Apr. | 1.4 ± 0.7 | 24 ± 19 | 30 ± 6 | 46 ± 18 | 183 ± 37 | 53 ± 17 | 96 ± 31 | 332 ± 57 | 56 ± 8 | 16 ± 3 | 29 ± 7 |
| May | 1.4 ± 0.8 | 32 ± 16 | 38 ± 12 | 29 ± 12 | 163 ± 44 | 103 ± 37 | 129 ± 50 | 395 ± 101 | 42 ± 7 | 26 ± 7 | 32 ± 5 |
| Jun. | 2.5 ± 1.4 | 32 ± 19 | 50 ± 21 | 18 ± 6 | 239 ± 182 | 122 ± 64 | 131 ± 82 | 492 ± 317 | 47 ± 8 | 26 ± 5 | 27 ± 8 |
| Jul. | 3.2 ± 1.8 | 40 ± 15 | 41 ± 15 | 19 ± 6 | 269 ± 94 | 202 ± 108 | 158 ± 99 | 630 ± 250 | 45 ± 11 | 31 ± 8 | 24 ± 6 |
| Aug. | 1.6 ± 1.5 | 62 ± 16 | 21 ± 11 | 16 ± 8 | 168 ± 71 | 101 ± 34 | 101 ± 32 | 370 ± 125 | 45 ± 6 | 28 ± 5 | 28 ± 4 |
| Sep. | 0.8 ± 0.2 | 32 ± 15 | 45 ± 14 | 23 ± 18 | 255 ± 48 | 42 ± 11 | 85 ± 14 | 382 ± 53 | 66 ± 6 | 11 ± 3 | 23 ± 4 |
| Oct. | 4.9 ± 1.6 | 75 ± 11 | 17 ± 8 | 8 ± 3 | 239 ± 48 | 157 ± 43 | 117 ± 18 | 513 ± 83 | 47 ± 6 | 30 ± 6 | 23 ± 3 |
| Nov. | 1.4 ± 0.7 | 51 ± 20 | 28 ± 12 | 20 ± 9 | 240 ± 36 | 45 ± 19 | 89 ± 22 | 375 ± 45 | 64 ± 8 | 12 ± 5 | 24 ± 5 |
| Dec. | 0.9 ± 0.4 | 55 ± 14 | 23 ±6 | 22 ± 13 | 172 ± 23 | 41 ± 14 | 85 ± 32 | 297 ± 49 | 58 ± 7 | 14 ± 4 | 28 ± 7 |
| Variables in | Standardized Weight of Variables in Selected | Loading of Variables (vik) | Communalities | ||||
|---|---|---|---|---|---|---|---|
| PC (tik; I = 1, 2, …, 12 and k = 1, 2) | |||||||
| PC 1 | PC 2 | PC 3 | PC 1 | PC 2 | PC 3 | ||
| Temperature | −0.103 | 0.18 | 0.373 | 0.109 | 0.506 | 0.587 | 0.612 |
| NH4+ | −0.002 | 0.35 | −0.06 | −0.087 | 0.874 | −0.065 | 0.775 |
| NO3− | 0.054 | 0.217 | −0.028 | 0.154 | 0.543 | 0.047 | 0.321 |
| P* | −0.052 | 0.289 | −0.141 | −0.371 | 0.708 | −0.289 | 0.723 |
| SiO2-Si | −0.017 | 0.273 | 0.222 | 0.221 | 0.719 | 0.43 | 0.75 |
| Micro | −0.102 | −0.133 | 0.416 | 0.171 | −0.276 | 0.624 | 0.495 |
| Nano | 0.204 | 0.046 | 0.033 | 0.772 | 0.118 | 0.33 | 0.719 |
| Pico | −0.107 | 0.023 | 0.335 | 0.048 | 0.105 | 0.489 | 0.253 |
| CHO | 0.357 | 0.108 | −0.357 | 0.818 | 0.219 | −0.19 | 0.754 |
| PRT | 0.094 | −0.068 | 0.277 | 0.694 | −0.133 | 0.627 | 0.892 |
| LIP | 0.252 | −0.053 | −0.075 | 0.805 | −0.147 | 0.177 | 0.702 |
| FM | 0.304 | 0.012 | −0.099 | 0.961 | 0.013 | 0.209 | 0.967 |
| Included Independent | Regression | Standard | Standardized Regression | t Statics | p Value | Adjusted R2 (%) |
|---|---|---|---|---|---|---|
| Variables | Coefficient (bk) | Error of bk | Coefficient | |||
| Constant | 337.872 | 12.08 | 27.969 | 0.000 ** | ||
| Nano-chlorophyll a concentration | 112.476 | 8.16 | 0.617 | 13.784 | 0.000 ** | 0.544 |
| Micro-chlorophyll a concentration | 20.115 | 5.412 | 0.156 | 3.716 | 0.000 ** | 0.57 |
| P* | −230.321 | 49.425 | −0.305 | −4.66 | 0.000 ** | 0.582 |
| NH4+ concentration | 19.321 | 5.362 | 0.225 | 3.603 | 0.000 ** | 0.602 |
| Region | Period | Total Chlorophyll a Concentration | FM Concentration | Reference |
|---|---|---|---|---|
| (μg L−1) | (mg m−3) | |||
| Gwangyang Bay, Korea | Seasonally, 2012–2013 | 3.45 (±2.81) | 434.5 (±175.5) | [5] |
| Geoje-Hansan Bay, Korea | Monthly, 2015 | 4.34 (±2.42) | 615.5 (±291.7) | [6] |
| Garolim-Asan Bay, Korea | Seasonally, 2015–2016 | 2.81 (±2.12) | 781.4 (±228.2) | [37] |
| Jaran Bay, Korea | Monthly, 2016 | 2.13 (±1.18) | 411.7 (±93.0) | This study |
Publisher’s Note: MDPI stays neutral with regard to jurisdictional claims in published maps and institutional affiliations. |
© 2020 by the authors. Licensee MDPI, Basel, Switzerland. This article is an open access article distributed under the terms and conditions of the Creative Commons Attribution (CC BY) license (http://creativecommons.org/licenses/by/4.0/).
Share and Cite
Lee, J.H.; Lee, W.-C.; Kim, H.C.; Jo, N.; Kim, K.; Lee, D.; Kang, J.J.; Sim, B.-R.; Kwon, J.-I.; Lee, S.H. Temporal and Spatial Variations of the Biochemical Composition of Phytoplankton and Potential Food Material (FM) in Jaran Bay, South Korea. Water 2020, 12, 3093. https://doi.org/10.3390/w12113093
Lee JH, Lee W-C, Kim HC, Jo N, Kim K, Lee D, Kang JJ, Sim B-R, Kwon J-I, Lee SH. Temporal and Spatial Variations of the Biochemical Composition of Phytoplankton and Potential Food Material (FM) in Jaran Bay, South Korea. Water. 2020; 12(11):3093. https://doi.org/10.3390/w12113093
Chicago/Turabian StyleLee, Jae Hyung, Won-Chan Lee, Hyung Chul Kim, Naeun Jo, Kwanwoo Kim, Dabin Lee, Jae Joong Kang, Bo-Ram Sim, Jae-Il Kwon, and Sang Heon Lee. 2020. "Temporal and Spatial Variations of the Biochemical Composition of Phytoplankton and Potential Food Material (FM) in Jaran Bay, South Korea" Water 12, no. 11: 3093. https://doi.org/10.3390/w12113093
APA StyleLee, J. H., Lee, W.-C., Kim, H. C., Jo, N., Kim, K., Lee, D., Kang, J. J., Sim, B.-R., Kwon, J.-I., & Lee, S. H. (2020). Temporal and Spatial Variations of the Biochemical Composition of Phytoplankton and Potential Food Material (FM) in Jaran Bay, South Korea. Water, 12(11), 3093. https://doi.org/10.3390/w12113093


