1. Introduction
Groundwater discharge into rivers, lakes or the coastal ocean affects the quality of these surface water bodies. Localising spots of sub-water-table groundwater discharge and quantifying the related groundwater discharge rate (and the associated matter fluxes) yields information that is essential for the sustainable management of surface waters.
Field studies that aim at investigating groundwater discharge into surface waters rely commonly on the use of environmental tracers, i.e., of stable isotopes and radionuclides that are naturally present in groundwater. The radionuclides that are most frequently used are radon-222 (
222Rn) (e.g., [
1,
2,
3]) and the radium species radium-224 and radium-223 (
224Ra,
223Ra) (or the ratio thereof) [
4,
5]. Mapping their distribution patterns in a surface water body allows localising groundwater discharge areas. Their defined radioactive decay allows furthermore to quantify the groundwater discharge rate that is required to support the activity inventory that is present in the surface water body of concern.
While 222Rn, 224Ra and 223Ra allow a generally satisfactorily precise localisation of groundwater discharge into lakes, their half-lives (3.8, 3.7 and 11.4 days, respectively) are too long for exact discharge localisation and discharge rate assessment in more dynamic environments such as flowing streams and the coastal sea. A naturally occurring and easily detectable radionuclide that is generally suitable for such investigations in dynamic systems is radon-220 or thoron (220Rn). (Radon has three natural isotopes, 219Rn, 220Rn and 222Rn. However, by common usage, the word “radon”, by itself, means 222Rn. The radon isotope 220Rn was historically called thoron and that term is still in use. The terms, radon and “thoron”, rather than their symbols, are used henceforth throughout this paper, for ease of reading.
Due to its very short half-life of only 56 s, thoron cannot travel far from its source before decaying. Hence, it creates a distribution pattern around a sub-water-table groundwater discharge spot that is much more distinct than that of radon. As a result, it allows a more precise localisation of discharge spots especially in turbulent of flowing waters. A number of published groundwater discharge studies that are based on relative thoron concentration patterns prove this general applicability as a groundwater discharge indicator (e.g., [
6,
7,
8,
9,
10]).
In addition to this hydrological application as groundwater tracer, Burnett et al. introduced a thoron-based approach that enables the detection and location of the build-up of radium-bearing scale inside oil/gas pipelines or domestic water distribution networks [
11]. Using thoron measurements to determine the precise location of such radium deposits helps to minimise the required remediation activities.
In addition to these two practical tracer applications of thoron, it is generally convenient that thoron gives (compared to radon; due to the short half-life of its progeny polonium-216; 216Po) a much faster response in any detection monitors that use electrostatic precipitation of polonium progeny and real-time alpha-energy spectral analysis (such as the RAD7, Durridge, Billerica, MA, USA; see below for details). When radon decays it becomes a polonium-218 (218Po) atom that is driven onto an alpha detector where it later undergoes alpha decay, with a half-life of 3.05 min. That results in a 95% response time to a step change in radon concentration in the detection chamber of about 15 min. Thoron measurement, on the other hand, involves counting 216Po decays. 216Po has a half-life of only about 150 ms, giving a 95% response time to a concentration step change of less than one second. In the case of sub-water-table groundwater discharge mapping, this has the practical result that, when making continuous radon/thoron-in-water measurements on a lake or a river from a moving boat, the different response times of radon and thoron measurement translate to significantly different spatial resolutions of the mapped concentration patterns in the water. Any thoron detected in the water will be close to its 224Ra source, i.e., monitoring thoron allows pinpointing the location of a groundwater discharge spot much more accurately than monitoring radon.
The above applications necessitate only relative readings of radon and thoron in the water, absolute measurement are not necessarily required. Still, absolute measurement of the radon and thoron activity in groundwater gives an immediate measure of the activity of the parent isotopes in the aquifer, 226Ra and 224Ra, respectively. In the case of thoron, the absolute concentration in the water of a sub-water-table spring will be related to the supporting 224Ra activity concentration in the sediment very close to the spring since the detected thoron was created only moments before its observation. If applied for radium scale localisation in pipes, absolute thoron values allow assessing the activity of localised 224Ra pipe scale.
However, absolute thoron-in-water measurements require knowledge of the sensitivity of the used detection system. Determining this detection sensitivity quantitatively is challenging due to the short thoron half-life and the lack of a standardised thoron-in-water standard (such as a NIST standard). The presented paper aims at tackling this challenge by introducing a novel but straight-forward method for calibrating the thoron-in-water sensitivity of on-site thoron detection setups.
2. Equipment and Experimental Setup
2.1. Radon/thoron Detection—General Remarks
All on-site setups are based on the same principle: With an exchanger unit, radon/thoron is extracted from a water pump stream by stripping the gas from the water into an air stream, where its resulting concentration is measured with a real-time radon/thoron-in-air monitor. The air stream can be pumped either in a closed loop circulating continuously through exchanger and radon/thoron monitor (“closed loop mode”) or in an open loop, i.e., fresh air entering the exchanger and being exhausted at the radon/thoron monitor outlet port (“open loop mode”). While on-site detection setups for continuous radon-in-water measurement from a continuous water pump stream simply rely on the distinct partitioning behaviour of radon between water and air at equilibrium [
12,
13], thoron in the air stream can never reach concentration equilibrium with the thoron in the water.
Various types of exchanger units exist. Some spray the water pump stream into the air stream within a closed spray chamber [
3], others use membrane extraction [
14].
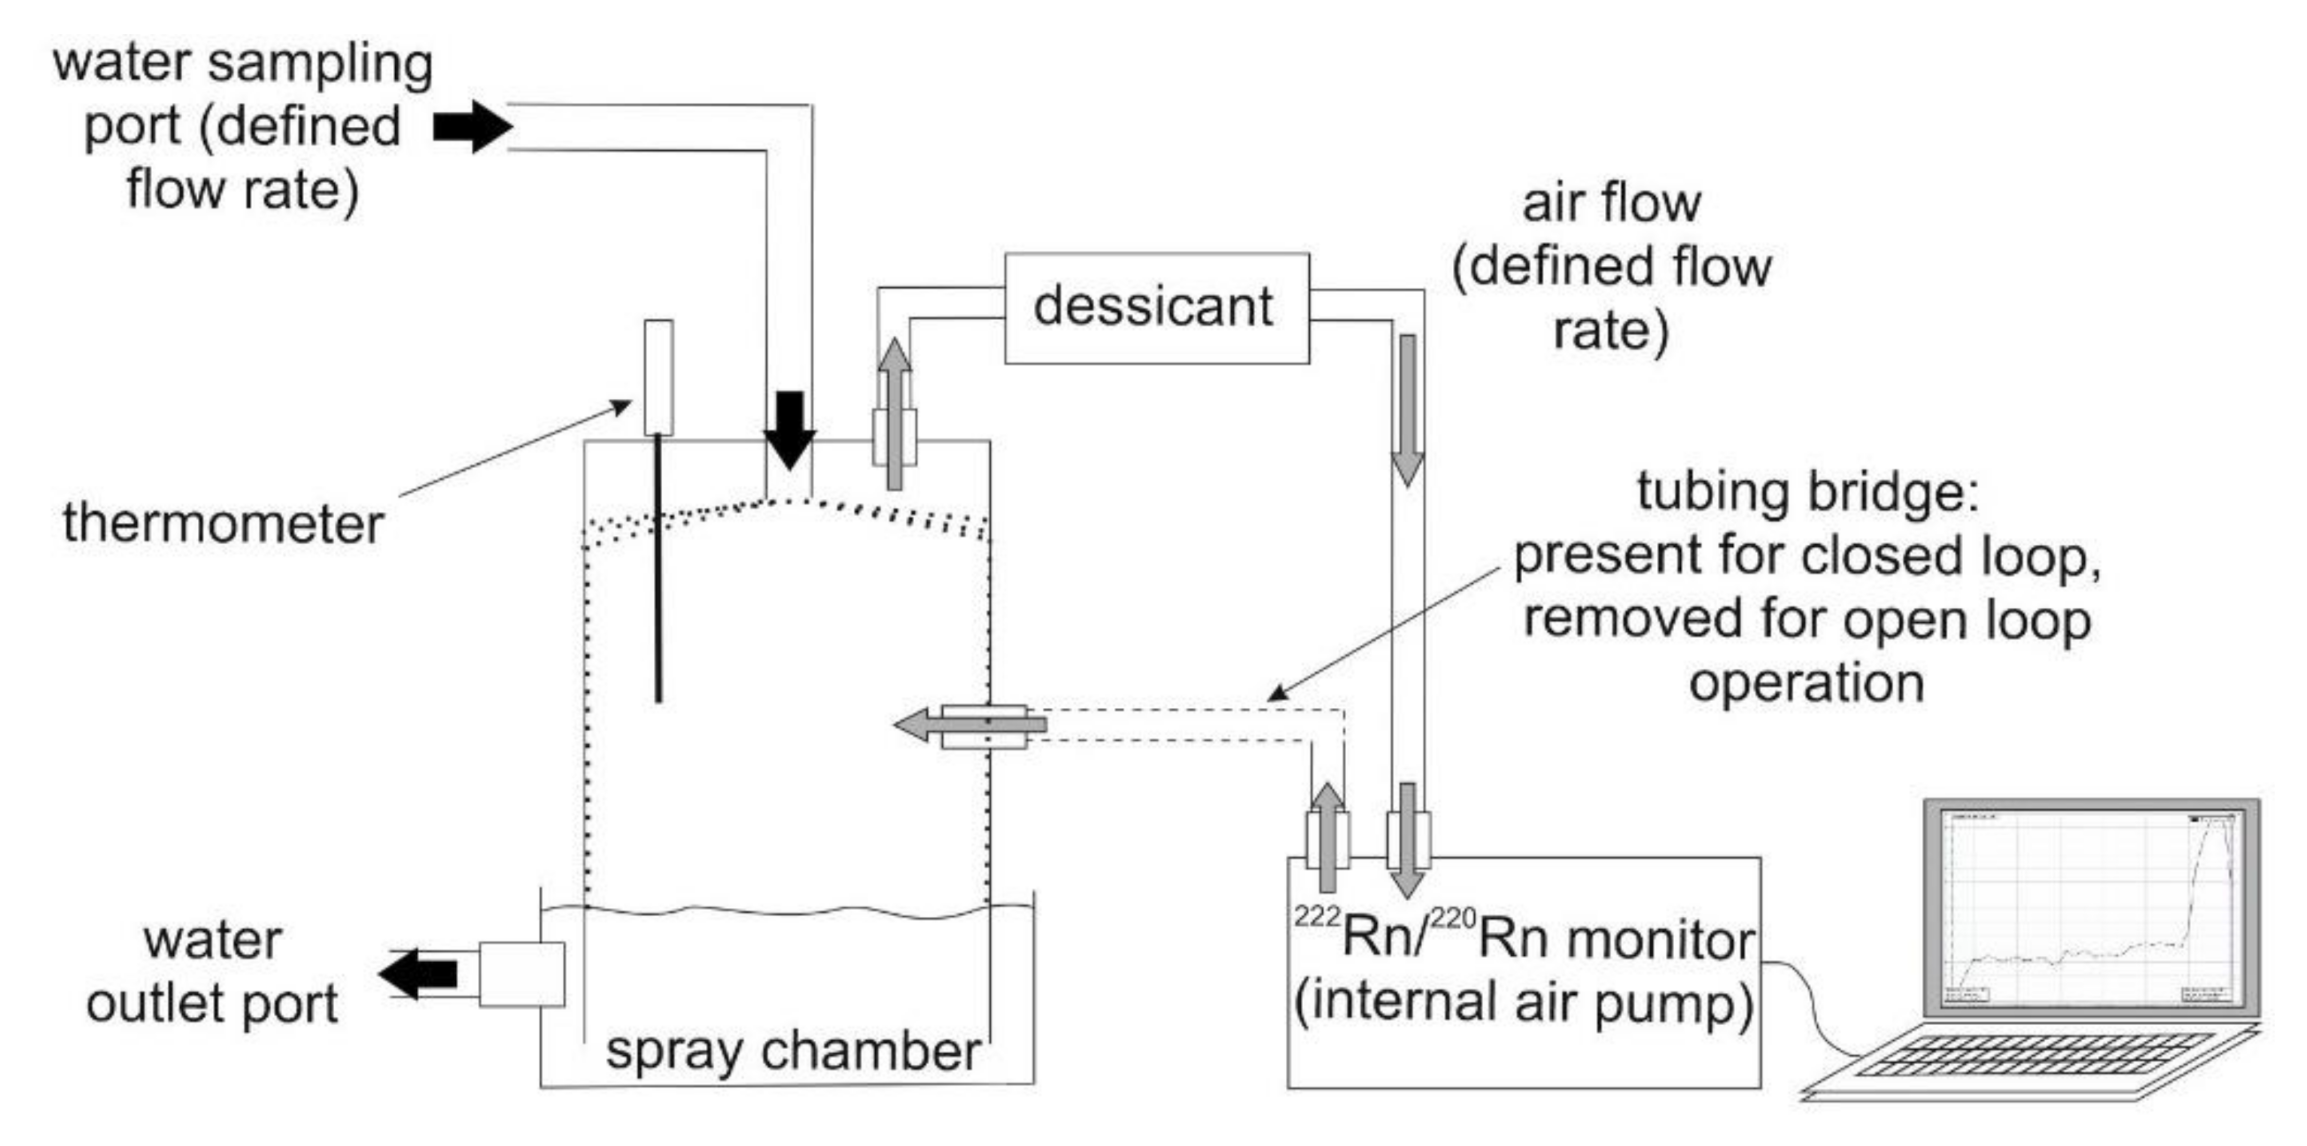
Figure 1 illustrates an on-site detection setup for continuous radon/thoron-in-water measurement with a spray chamber for radon/thoron extraction (such as the RAD AQUA, see below for details) and a radon/thoron monitor (such as the RAD7, which uses electrostatic
218Po/
216Po precipitation with real-time spectral analysis).
The 3.8 days half-life of radon makes onsite radon monitoring by means of the extraction approach rather straightforward since radon decay within the system can be neglected and, in closed loop mode, the radon in the air can reach concentration equilibrium with the radon in the water. The measurement of absolute thoron concentrations, on the other hand, is more involved because the thoron decays during the measurement process and the air thoron concentration never reaches equilibrium with the water thoron concentration. The short thoron half-life necessitates the consideration of (i) the thoron travel time between sampling point and exchanger unit, (ii) the thoron residence time within the exchanger and (iii) the thoron travel time between exchanger and detection chamber, i.e., the total en route thoron concentration drop due to radioactive decay within the detection system from sampling point to measurement chamber. In the following paragraphs it is shown that it is not difficult to calculate (i) the thoron decay in the water travelling from the sampling point to the exchanger unit as well as (ii) the thoron decay in the exchanger. If a RAD7 is used as detector (iii) the correction for decay between the exchanger outlet and the RAD7 measurement chamber can be easily determined based on the RAD7 setup.
(i) The decay between sampling point and exchanger is a simple function of the water residence time, which in turn equals the volume of water tubing divided by the water flow rate.
(ii) The spray in the exchanger illustrated in
Figure 1 is a nearly horizontal fan. Thoron emission from droplets in the fan will occur in milliseconds, or not at all. The residence time of emitted thoron atoms in the exchanger equals the air volume, between the spray fan and the air exit, divided by the air flow rate.
The MiniModule is different in that thoron is emitted at all points along the membrane tubing. To estimate the transit time of a thoron atom inside the MiniModule we need some dimensions, the water linear velocity in the tubes and the air linear velocity outside them. These depend on the type of MiniModule used. The resulting average thoron transit time in the module, again, should be added to the overall delay time.
(iii) The RAD7 itself corrects for thoron decay between its air sampling point and its measurement chamber. The correction is based on a standard thoron setup, see below. If the setup is, indeed, standard, then no further correction is required and the reading on the RAD7 will be the actual thoron concentration at the air exit from the exchanger. If the setup is not standard then a correction, either positive or negative, must be made for the difference.
So, while all these decay-related corrections can be made easily, it is challenging to determine the efficiency of thoron transfer from water to air within the exchanger unit. The actual emission process itself, i.e., radon/thoron penetrating the water/air interface, takes milliseconds or less. In other words it is instantaneous in comparison with the half-life even of thoron. Radon is physically, for all practical purposes, identical to thoron in every respect except for the half-life. We can therefore use radon to study the emission of thoron from water. The experiments described below are all carried out with radon, not thoron. That switch makes the experiments themselves possible but the results are equally valid for thoron and radon.
2.2. Water-To-Air Transfer within the Exchanger Unit
We carried out an extended set of experiments with (i) various flow rates of water with a defined radon concentration and temperature, (ii) various air flow rates in open loop mode and (iii) two conceptually different exchanger types. Since (as discussed above) radon and thoron behave identically in terms of water/air exchange, we conducted all our experiments with radon instead of thoron and thus avoided the complications of dealing with the short half-life of thoron to study this virtually instantaneous process. We used the closed loop mode to determine the incident water radon concentration, and the open loop mode (i.e., fresh air entering the exchanger) to study the water-to-air transfer rate of radon when not in equilibrium.
As discussed in the section above, the key challenges for determining the detection efficiency of a radon/thoron monitoring system is to quantify the rate of radon/thoron water-to-air transfer, i.e., to define and evaluate the related influential parameters. In order to tackle this challenge, we used two different types of exchanger units. One exchanger is the Durridge RAD AQUA spray chamber (referred to as “RAD AQUA”); the other is the 3M™ Liqui-Cel™ MM-1.7 × 8.75 Series Membrane Contactor (hereafter referred to as “MiniModule”). Concerning radon extraction they have a similar performance, but show individual advantages and disadvantages in terms of handling.
Measuring absolute radon-in-water concentrations is possible by simply recirculating the air stream in closed loop mode until the radon-in-air concentration reaches equilibrium with the radon in the water stream (cf.
Figure 1). The equilibrium ratio is determined by the unit-less radon partition coefficient, which is a function of water temperature and water salinity [
12]. In contrast, the air thoron concentration, even in closed loop mode, will never reach equilibrium with the thoron concentration in the water, due to the very fast thoron decay. Hence, in the case of radon, the rate of water-to-air transfer within the exchanger will only affect the response time of the system, but not its sensitivity. In contrast, in the case of thoron, the sensitivity of the system does depend on the thoron transfer rate.
Absolute thoron detection requires therefore (for both types of exchanger) a knowledge of the rate of water-to-air transfer within the exchanger unit. That rate is equal to the rate of delivery of thoron to the exchanger by the water stream (i.e., concentration times water flow rate; (Bq/L × L/s)) times the proportion of thoron that is transferred from the water to the air. That water/air proportion (in the following referred to as “wPa”) has to be considered the most critical parameter for quantifying the extraction process and hence the sensitivity of the system.
The value of wPa is a function of (i) the extent of the water/air interface, i.e., the design of the exchanger unit; (ii) the water flow rate; (iii) the water temperature and salinity, i.e., the radon/thoron partition coefficient; (iv) the flow rate of the air and (v) the concentration of thoron, if any, in the air entering the exchanger. Consequently, the setup for the sensitivity calibration of any thoron detection system must be close to identical to the detection system and setup that will be used for the actual measurements in the field. Likewise, the range of operating conditions used in the calibration should include the operation conditions expected for the measurement in the field. Furthermore, all efficiency experiments in the laboratory must be made in a virtually radon free atmosphere (the ambient radon concentration in the lab should be monitored during the experiments). The ambient air in the field can in general be considered thoron free. To ensure negligible incident thoron concentration, all field thoron measurements are made in open loop configuration, with the incident air entering the exchanger being fresh. In any case radon/thoron free ambient air is required for laboratory/field open-loop measurements because, if there is radon/thoron in the air, the net radon/thoron escape rate from the water into the air stream will be reduced.
The value of wPa is the rate of emission of radon into the air stream divided by the rate of injection of radon with the water into the exchanger. That is (the radon concentration in the air at the outlet times the air flow rate) divided by (the radon concentration in the incoming water times the water flow rate).
2.3. Experimental Setup
The system that we used for studying radon/thoron water-to-air transfer within the exchanger unit consisted of a RAD7 radon/thoron monitor hooked up to either RAD AQUA or MiniModule. The RAD7 detects radon-in-air concentrations by means of a solid-state passivated ion-implanted planar silicon (PIPS) alpha detector for electrostatic collection of alpha-emitters in a one litre detection chamber. The air stream is maintained with an internal pump. Since an air moisture content of less than 20% is desirable for operating the detector, an external desiccant unit is installed in the air stream upstream of the detector (cf.
Figure 1). Radon/thoron detection is executed by decay detection of the short-lived radon and thoron progeny
218Po/
214Po and
216Po/
212Po, respectively.
If the RAD7 is run in “thoron mode” it measures thoron concentration in air with an internal response time of about one second. If the thoron measurement setup is “standard” (see below for details), the thoron-in-air concentration at the outlet port of the RAD AQUA equals the thoron readings recorded by the RAD7 (see RAD7 manual paragraphs 2.4.5, page 28, and 4.5.5. and 4.5.9, page 57). In this detection mode, the RAD7 has the pump running continuously and the display shows two readings, radon and thoron concentrations. For the thoron reading to be a true reading, the RAD7 must be in the standard configuration mentioned above so that the thoron decay is the same as that anticipated in the instrument’s internal thoron setup. This requires the small drying tube, and 0.91 m of tubing (4.8 mm inside diameter) to the inlet filter. External power should be applied to keep the pump running at constant speed. Under those conditions, there is no need for any further correction for decay in the RAD7′s sample acquisition. If the conditions are different, then a correction must be made for the difference from the standard setup.
The RAD AQUA is a spray chamber with an air trap at the base (cf.
Figure 1). As water sprays into the chamber, dissolved gases, including radon and thoron, are transferred from the water to the air stream that is pumped through the chamber. The air, with its radon and thoron, is pumped through the desiccant tube into the RAD7 detection chamber. In closed-loop mode the air is returned from the RAD7 outlet port to the RAD AQUA air inlet. In open-loop mode, the outlet from the RAD7 is fed out of the system and fresh air flows into the RAD AQUA continuously. The RAD AQUA can be equipped with different spray nozzles in order to allow an optimal match to the available water pump rate. Changing nozzle and water pump rate results in a finer/coarser water spray, and hence in a larger/smaller interface between water and air. This will, in turn, change the response behaviour of the system. While for radon-in-water measurements this has hardly any influence on the detection sensitivity of the system, the sensitivity for thoron measurements may vary from one nozzle to another. Hence, if the spray nozzle in the RAD AQUA is changed, a new set of experiments is required to determine the new thoron sensitivity of the changed system. In fact, any mechanical change to the RAD AQUA (or any exchanger unit) would require new experiments to determine the thoron sensitivity change. That means that sensitivity measurements made with one RAD AQUA would not necessarily apply to a different RAD AQUA, depending on the degree of similarity between the two and the precision sought.
The MiniModule utilises a bundle of microporous hollow fibre membrane tubes with parallel water flow through the inside of the hollow fibre (lumen side) and air flow outside the fibre tubes (shell side). The design allows packing a high membrane surface area into a small exchanger volume. The MiniModule allows water flow rates of up to about 4 L/min. An advantage compared to the RAD AQUA is that the MiniModule keeps water and air physically separated, thus avoiding water entering the air stream. A disadvantage is its possibility of clogging.
More details of the devices used can be found on the Durridge.com and 3M.com web sites.
3. Experimental
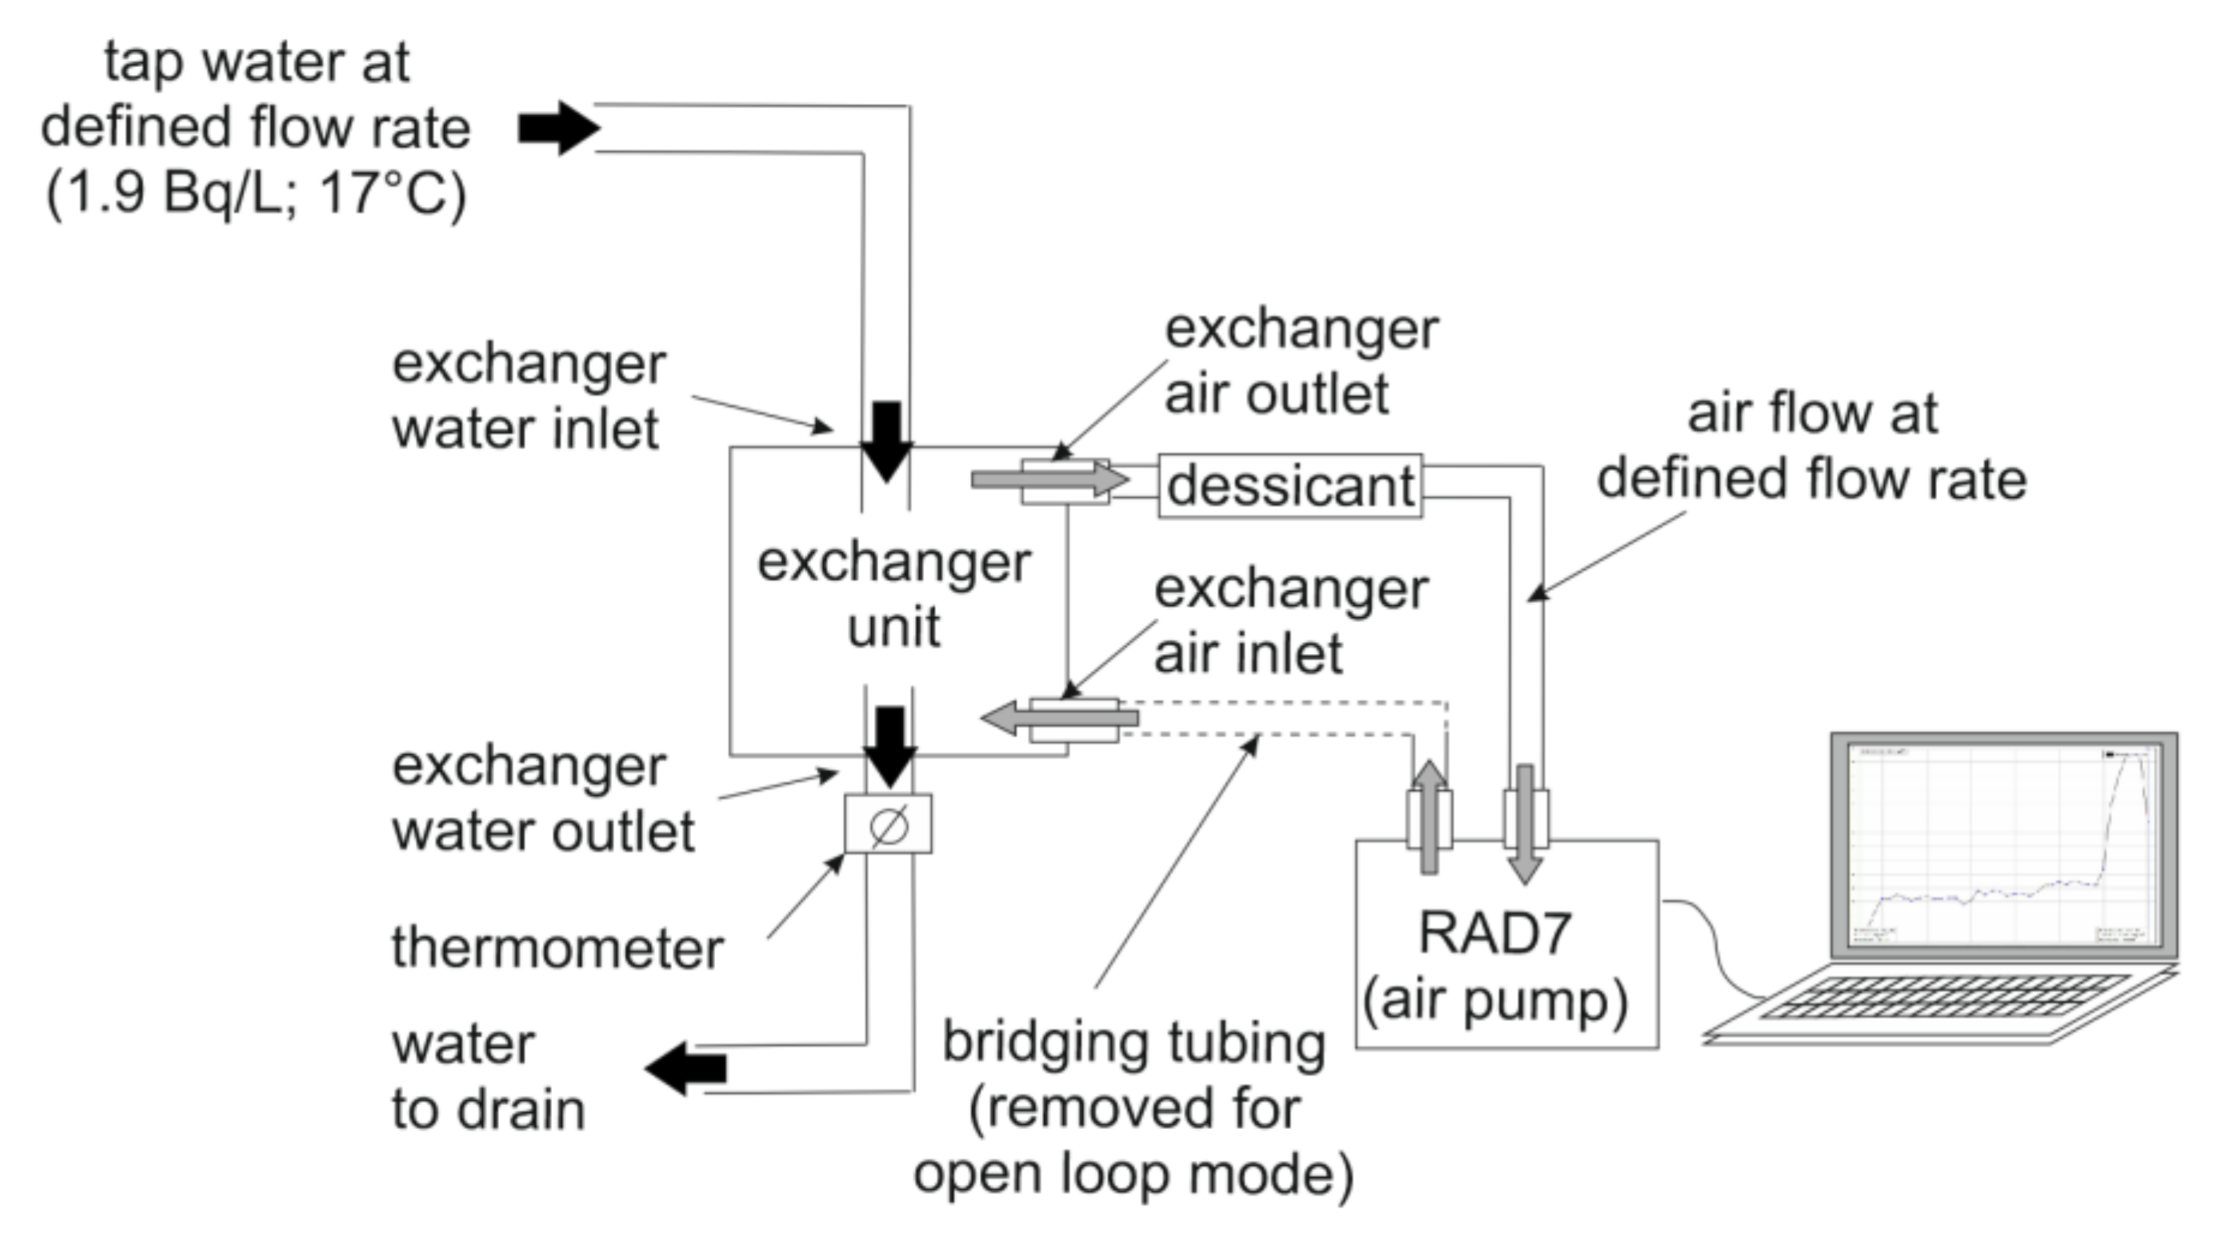
A set of 13 experimental runs, each lasting for about six hours, was carried out at the radionuclide laboratory of the UFZ-Centre for Environmental Research in Leipzig, Germany. For a water source we used tap water that contained a radon concentration of about 1.9 Bq/L (1900 Bq/m
3 or 51 pCi/L). Prior to each experiment we let the water flow for about two hours at about 3 L/min in order to discard any stagnant water from the pipes. All experiments were run using the general setup illustrated in
Figure 2.
For the experiments the tap water was led through a 1 m length of Tygon tubing to the exchanger unit (RAD AQUA or MiniModule). The laboratory tap permitted precise adjustment of the water flow rate between 1 and 4 L/min. Lower water pump rates do not produce a satisfactory spray curtain within the RAD AQUA (with the applied WL 1.5 nozzle). Higher water pump rates are not readily obtained in the field (cf.
Section 5.1). During the individual experiments the water flow rate was regularly checked for constancy.
The water inlet port of the exchanger unit was attached to the discharge end of the Tygon tubing. The water temperature was checked continuously during the experiments and stayed at about 17 °C. After leaving the exchanger unit, i.e., downstream of the water outlet port of the exchanger unit the (stripped) water was discharged into the drain.
Connected to the air inlet and outlet ports of the exchanger unit was the RAD7 monitoring equipment (using 4.8 mm ID Tygon® tubing; Saint-Gobain, La Défense Cedex, France). The internal air pump produces a constant air stream of about 1 L/min (if the RAD7 is attached to an external power supply, i.e., does not run on battery). The air flow was adjusted to the required flow rate by either choking the air flow with a clamp attached to the tube (for air flow rates < 1 L/min) or by attaching up to three RAD7 monitors in parallel (for air flow rates > 1 L/min). During the individual experiments the air flow rate was checked for constancy every 30 min.
Each individual experiment followed the same schedule. In an initial step the experimental setup was run in closed loop mode with a water flow rate and an air flow rate of 1 L/min each. This initial step allowed measurement of the radon concentration of the tap water at the beginning of the experimental series of the day. After reaching radon equilibrium between water and air within the exchanger the concentration was measured for about 30 min in order to prove concentration equilibrium. Subsequently the setup was switched to the open loop mode by disconnecting the return air flow from the RAD7 outlet port to the exchanger air inlet. Running the setup in open loop both the water flow rate and the air flow rate were changed stepwise in various combinations. The water flow was adjusted to rates between 1.36 and 3.80 L/min. The air flow was adjusted to rates between 60 and 2320 mL/min (cf.
Figure 3). Each individual water flow rate/air flow rate setting was kept constant until a statistically reliable number of counts had been collected by the RAD7 (>400 counts). Depending on the individual setting, the measurement times of the individual steps were between about one and three hours. The counting cycle of the RAD7 was set to 10 min. Finally, i.e., at the end of each experimental run, the setting of the experimental setup was returned to closed loop mode, again with a water and an air flow rate of 1 L/min each. This final step allowed detecting the radon concentration of the tap water at the end of the experimental series in order to consider (small if any) long-term concentration change during the series.
Applying the approach described above, 26 experimental settings with different combinations of water flow rate and air flow rate were studied (i.e., two per experimental series in average). Based on (i) the generally stable input radon concentration of the tap water and (ii) the output radon concentration of the air stream in open loop mode a setting specific radon removal rate, i.e., the proportion of radon that is transferred from the water to the air flow, wPa, could be calculated and assigned to a specific water flow rate/air flow rate setting. The radon concentration of the (air conditioned) laboratory was recorded continuously and found to be virtually zero.
4. Results
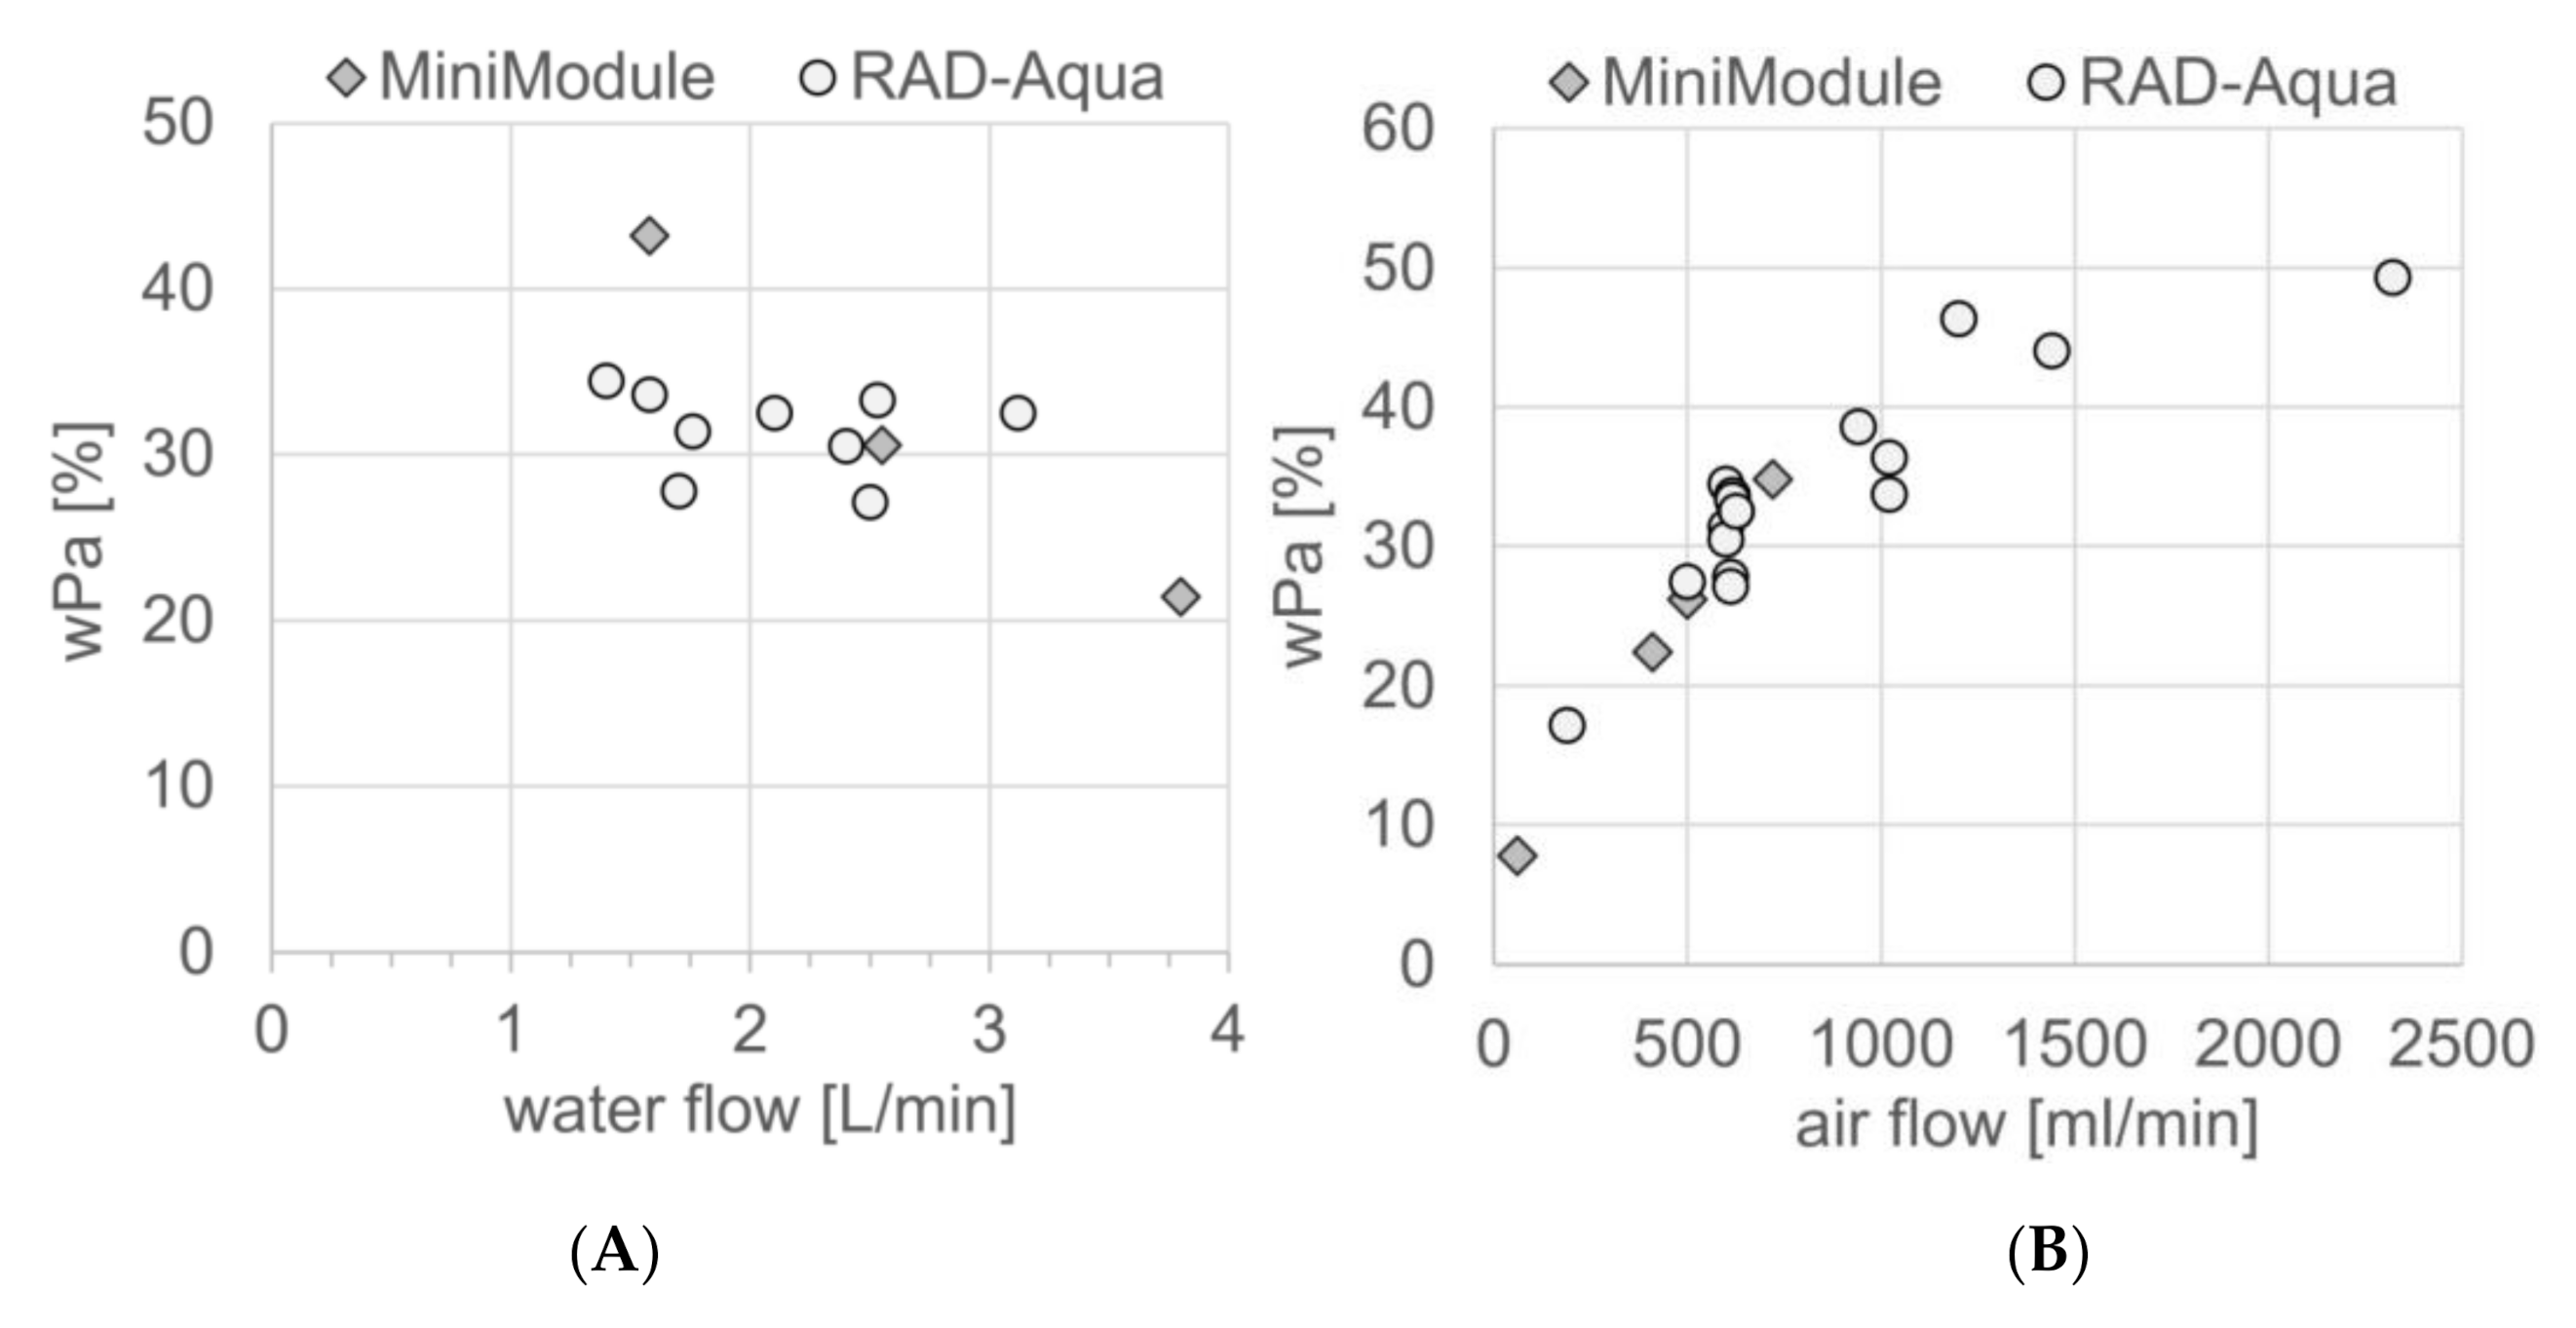
Figure 3 displays the resulting dependence of the proportion of radon that is transferred from the water to the air, i.e., wPa, on the water flow rate (
Figure 3A) and on the air flow rate (
Figure 3B), respectively. All data points result from open loop mode experiments.
The RAD AQUA data points displayed in
Figure 3A shows no dependence of the water/air proportion wPa on the water flow rate (at a constant air flow rate = 0.61 ± 0.1 L/min). On the other hand, wPa is decreasing with increasing water flow rate if the the MiniModule is used as extraction unit. This may be due to the water/air contact time within the MiniModule unit that is decreasing with with an increase of the water flow rate.
Figure 3B clearly shows a non-linear dependence of wPa on the air flow rate. Since it was shown that the water flow rate is of no significance in case of the RAD AQUA, we display all the RAD AQUA data points, regardless of the water flow rate. Since it was also shown that in case of the MiniModule high water flow rates result in decreasing values of wPa, we display only the MiniModule data points that were determined with a fixed water flow rate of 2.1 L/min. Summarizing, it can be stated that a higher airflow rate (within the applied air flow range) results in a higher water/air transfer rate of radon, i.e., a more efficient extraction of radon from the water pump stream.
5. Discussion
5.1. Experimental Results
With the system running in open loop mode, a low air flow rate minimises the injection of fresh air to the system thus maximising the absolute radon concentration at the inlet port of the RAD7 measurement chamber(s). However, in case of the short-lived thoron (and in contrast to radon) we have to consider that a low air flow rate increases the en route thoron decay between exchanger unit and RAD7 as well as within the RAD7 detection chamber. A high air flow rate on the other hand reduces the decay in transit and the residence time within the RAD7. Furthermore, a high air flow rate results in a low radon/thoron concentration within the exchanger unit, thereby minimising the reabsorption of radon or thoron by the water stream so maximising and stabilising wPa.
Summing all these effects up we can say, based on our experimental results, that an air flow rate as high as can reasonably be achieved (but at least 1000 mL/min) should be used for thoron measurement. Our results allow quantifying this relationship based on the radon data (
Figure 3B). The only disadvantage of a high air flow rate (generating a high wPa) is the resulting low absolute radon/thoron concentration in the air leaving the exchanger. This problem can be solved though by using two (or three) RAD7s installed in parallel as we did for all experiments with air flow rates >1 L/min. That allows doubling (or tripling) the detection sensitivity with minimal reduction to the transit time of thoron atoms from the exchanger to the measurement chambers, because the majority of the air flow path is inside the RAD7 chambers. Hence, a multi-RAD7 setting allows keeping the data reliability as high as possible despite the low absolute concentrations because the required measurement time to gain a sufficient number of counts for a desired precision will be less.
Furthermore, the results show no evidence for a substantial dependence of wPa on the water flow rate. Still, we gain in two ways from having a water flow rate as high as feasible. One is the reduced decay of thoron in transit from the water sampling point to the exchanger unit. The other is the maximisation of the radon/thoron rate of injection into the exchanger thereby increasing the statistical reliability of the detection results. Practically however the water flow rate in the field is technically limited because (i) the water pump is in most cases run on battery power and (ii) the exchanger unit (RAD AQUA or MiniModule) creates resistance against the water flow. For instance, while the tap water in the laboratory allowed a freely flowing water stream of ca. 5 L/min, this flow rate was reduced with the attached RAD AQUA (WL 1.5 nozzle) to a maximum water flow rate of 3.2 L/min. With the same tap pressure, the MiniModule allowed a slightly higher water flow rate of 3.8 L/min. Hence, as far as field measurements are concerned (i.e., a bilge pump powered by a battery), the water flow rate will be limited technically. Experience tells us that there may be an upper limit of about 3 L/min without taking extraordinary measures.
5.2. Derivation of the Thoron Sensitivity of the Detection System
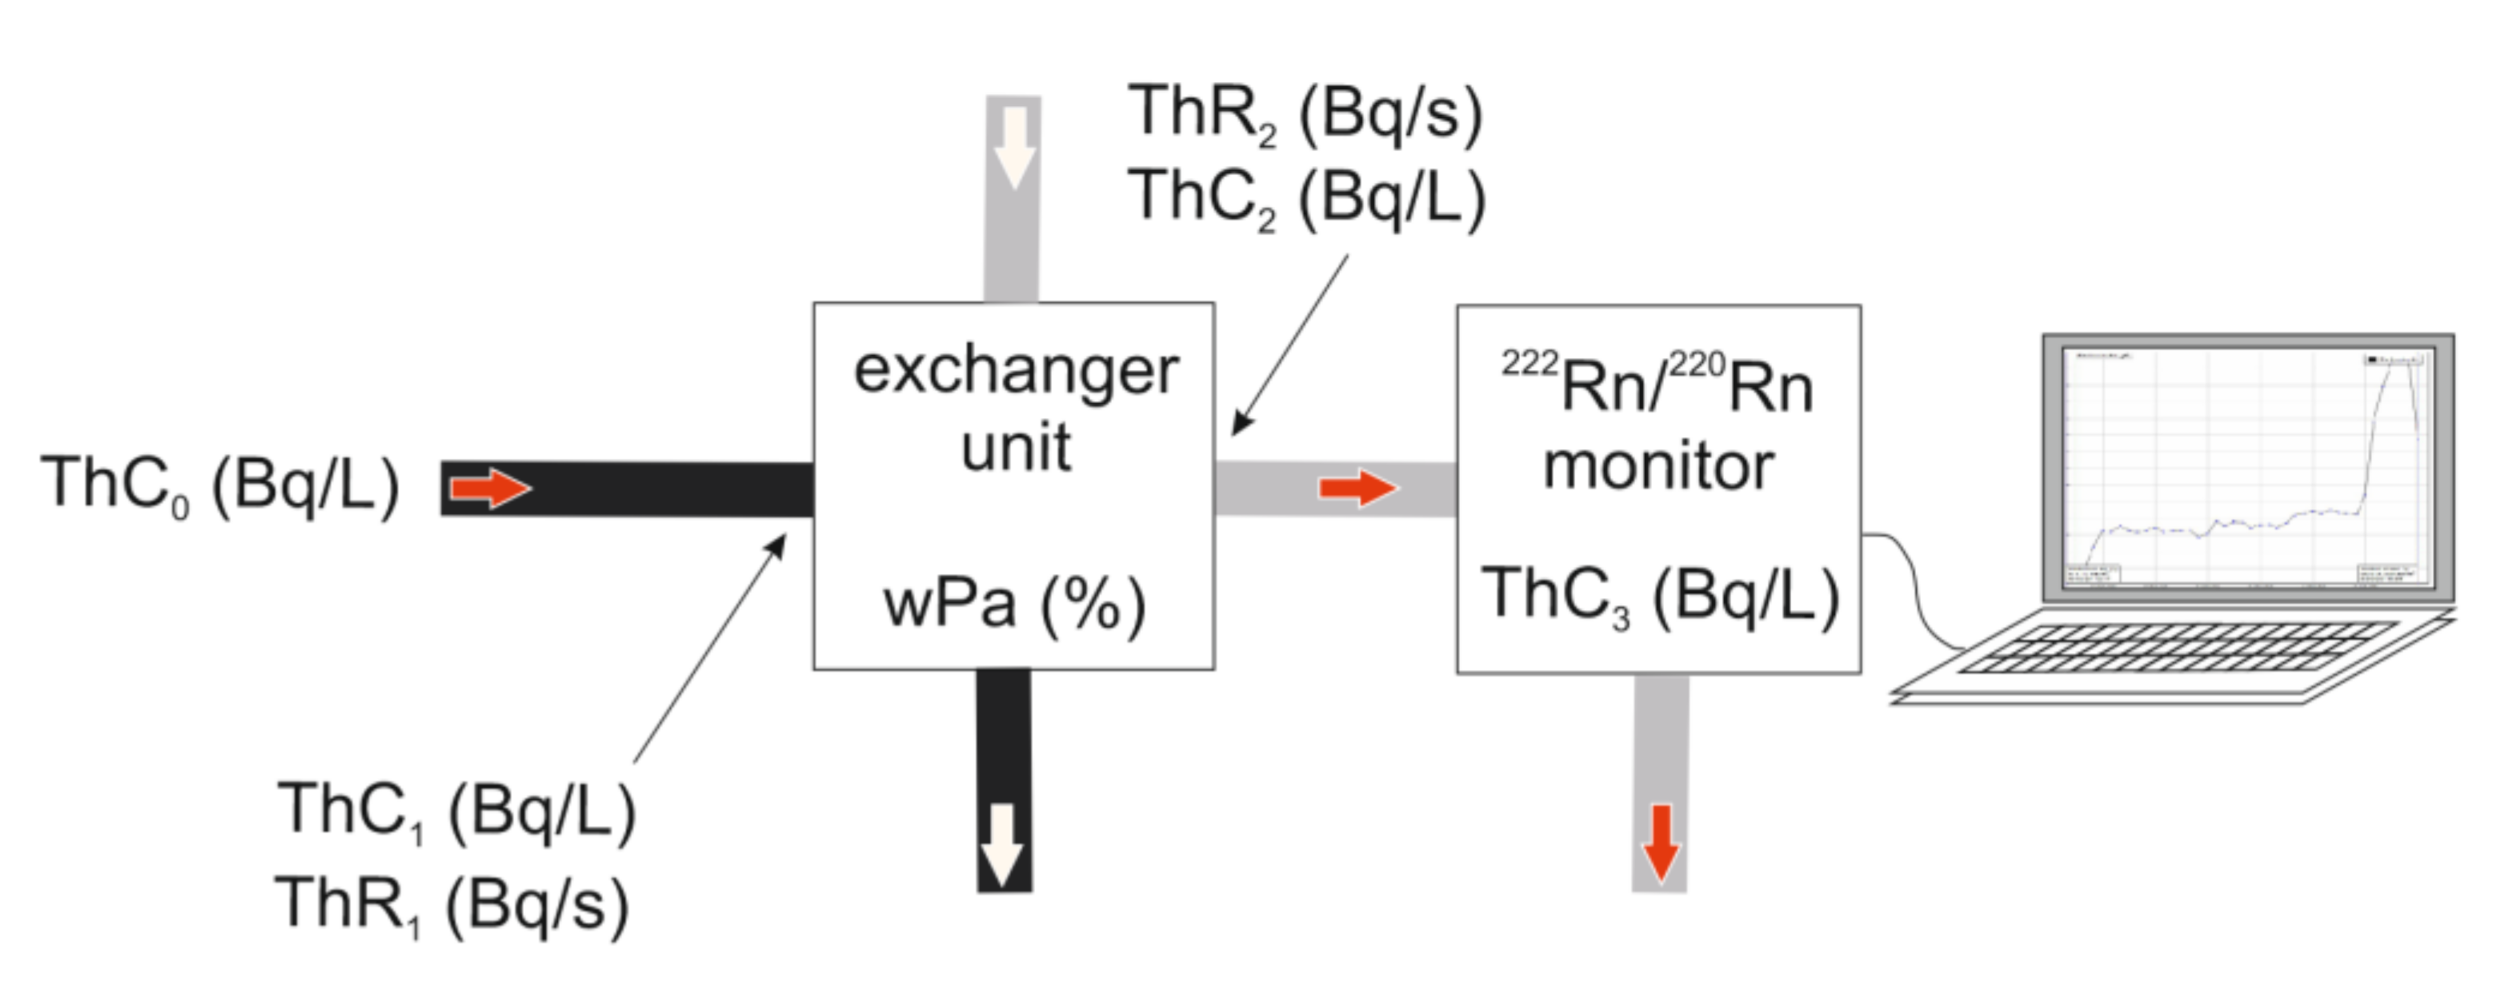
Figure 4 illustrates the derivation of the detection sensitivity of any thoron-in-water monitoring system. All parameters shown in the figure are explained in the section below. The black bold lines illustrate the water flow, the grey lines show the air flow in open loop. The red arrows indicate the flow of thoron that is being extracted from the water and detected by the thoron-in-air monitor.
In
Figure 4 ThC
0 (Bq/L) is the thoron concentration in the water at the sampling point, i.e., the value of interest. ThC
1 (Bq/L) is the concentration in the water pump stream that enters the exchanger unit. The relation between ThC
0 and ThC
1 is defined by the decay equation as given in Equation (1) with λ being the thoron decay constant (0.0125 s
−1).
In the equation t(w), (s) is the transit time of the water from the sampling point to the entry point of the exchanger unit. The transit time depends on the water flow rate W
f (L/s) and the volume of the tubing between the two points V
w (L) as given in Equation (2).
ThC
1 and W
f determine the rate at which thoron enters the exchanger unit, labelled in the following as ThR
1 (Bq/s).
How much of the thoron that is entering the exchanger transfers to the air stream, i.e., at which rate thoron is leaving the exchanger with the air (ThR
2; (Bq/s)), is determined by wPa (%), i.e., the exchanger-specific proportion of thoron in the water that is injected into the airstream, as introduced in
Section 2.2 and discussed in
Section 3 and
Section 4.
t is the time spent by thoron atoms in the air stream inside the exchanger and e
−λt is the decay term. ThR
2 and the air flow rate A
f (L/s) determine the concentration ThC
2 (Bq/L) with which thoron leaves the exchanger unit with the air.
ThC3 is the thoron concentration that is displayed and recorded by the applied thoron monitor. As stated earlier, if a RAD7, run in standard thoron mode, is used as thoron monitor, ThC3 will equal ThC2. If the setup is not standard resulting in a different transit time, a correction will have to be made for the difference between standard and effective transit times, resulting in a positive or negative correction, depending on whether the actual transit time is greater or less than the assumed transit time for a standard setup.
The concept given above allows working back from the detector reading (ThC
3) to the thoron concentration in the water at the sampling point (ThC
0). The following
Table 1 lists experimental values starting with a RAD7 reading of ThC
3 = 10 Bq/L. The example assumes the standard thoron setup using a RAD7 (i.e., ThC
3 = ThC
2), an air flow rate of A
f = 1 L/min, a water to air injection proportion of wPa = 0.35, a water flow rate of W
f = 2 L/min, and a volume of the water tubing of 50 mL. All parameters that result from this given input data are shown in italic, including the final thoron concentration in the water at the sampling point (in bold).
5.3. Simple on-Site Thoron Sensitivity Determination
The following six steps allow determining the thoron sensitivity of the measurement system when on site:
Step 1: Choose a water sampling point where the radon concentration in the water is not negligible.
Step 2: Measure the water radon concentration with the RAD7 in closed loop until sufficient precision has been achieved.
Step 3: Disconnect the RAD7 outlet from the spray chamber air inlet thus switching to open loop mode without changing anything else. Continue the measurement until, again, sufficient precision has been achieved in the open loop reading (with the reduced count rate in the RAD7, this second reading will take longer than the first to reach the same percentage uncertainty).
Step 4: Measure the (constant) water flow rate by timing how long it takes to fill a container of known volume.
Step 5: Measure the (constant) air flow rate by timing how long it takes to displace the water in a flask filled under water and inverted.
Step 6: Calculate wPa as (exiting air radon concentration (step 3) times air flow rate (step 5)) divided by (incident water radon concentration (step 1) times water flow rate (step 4)).
All other parameters listed in
Table 1, above, are easily determined.
6. Conclusions
In conclusion it can be stated that the experimental approach introduced and discussed in this paper may be used to determine the sensitivity of any mobile thoron-in-water detection setup, thus allowing the quantitative measurement of thoron-in-water concentrations in the field. The measurement of relative thoron concentration in surface water bodies facilitates the precise location of sub-water-table groundwater discharge spots, the monitoring of rapid temporal changes in discharge, and quantifying groundwater discharge rates on the small scale. Calibration of the thoron sensitivity of the detection equipment creates the ability to quantify the distribution and activity of 224Ra in sediment, aquifer or in the pipe scale.
The study revealed that the most critical parameter for sensitivity calibration of thoron-in-water detection systems (that are based on thoron extraction from the water) is the system-specific proportion of the thoron injected into the exchanger unit with the incoming water that escapes into the air stream (wPa). This parameter can, and can only, be measured by using radon as the perfect thoron analogue.
The experimental results and their evaluation show that
- (i)
An air flow rate as high as can reasonably be achieved (but at least 1000 mL/min) should be used to transfer thoron from the exchanger to the thoron detector (e.g., RAD7).
- (ii)
Having a water pump rate as high as feasible maximises the statistical precision of the results.
- (iii)
The system setup used for thoron sensitivity calibration in the laboratory should be the same as the setup used for the measurements on site.
- (iv)
The range of critical operating conditions used in the calibration must include the operation conditions expected for the onsite measurements.
- (v)
The introduced method allows working back from the detector reading (ThC3) to the thoron concentration in the water at the sampling point (ThC0).


