Assessment of the Happy River Index as an Integrated Index of River Health and Human Well-Being: A Case Study of the Yellow River, China


Abstract
1. Introduction
2. Methodology
2.1. Definition and Implications of Happy River
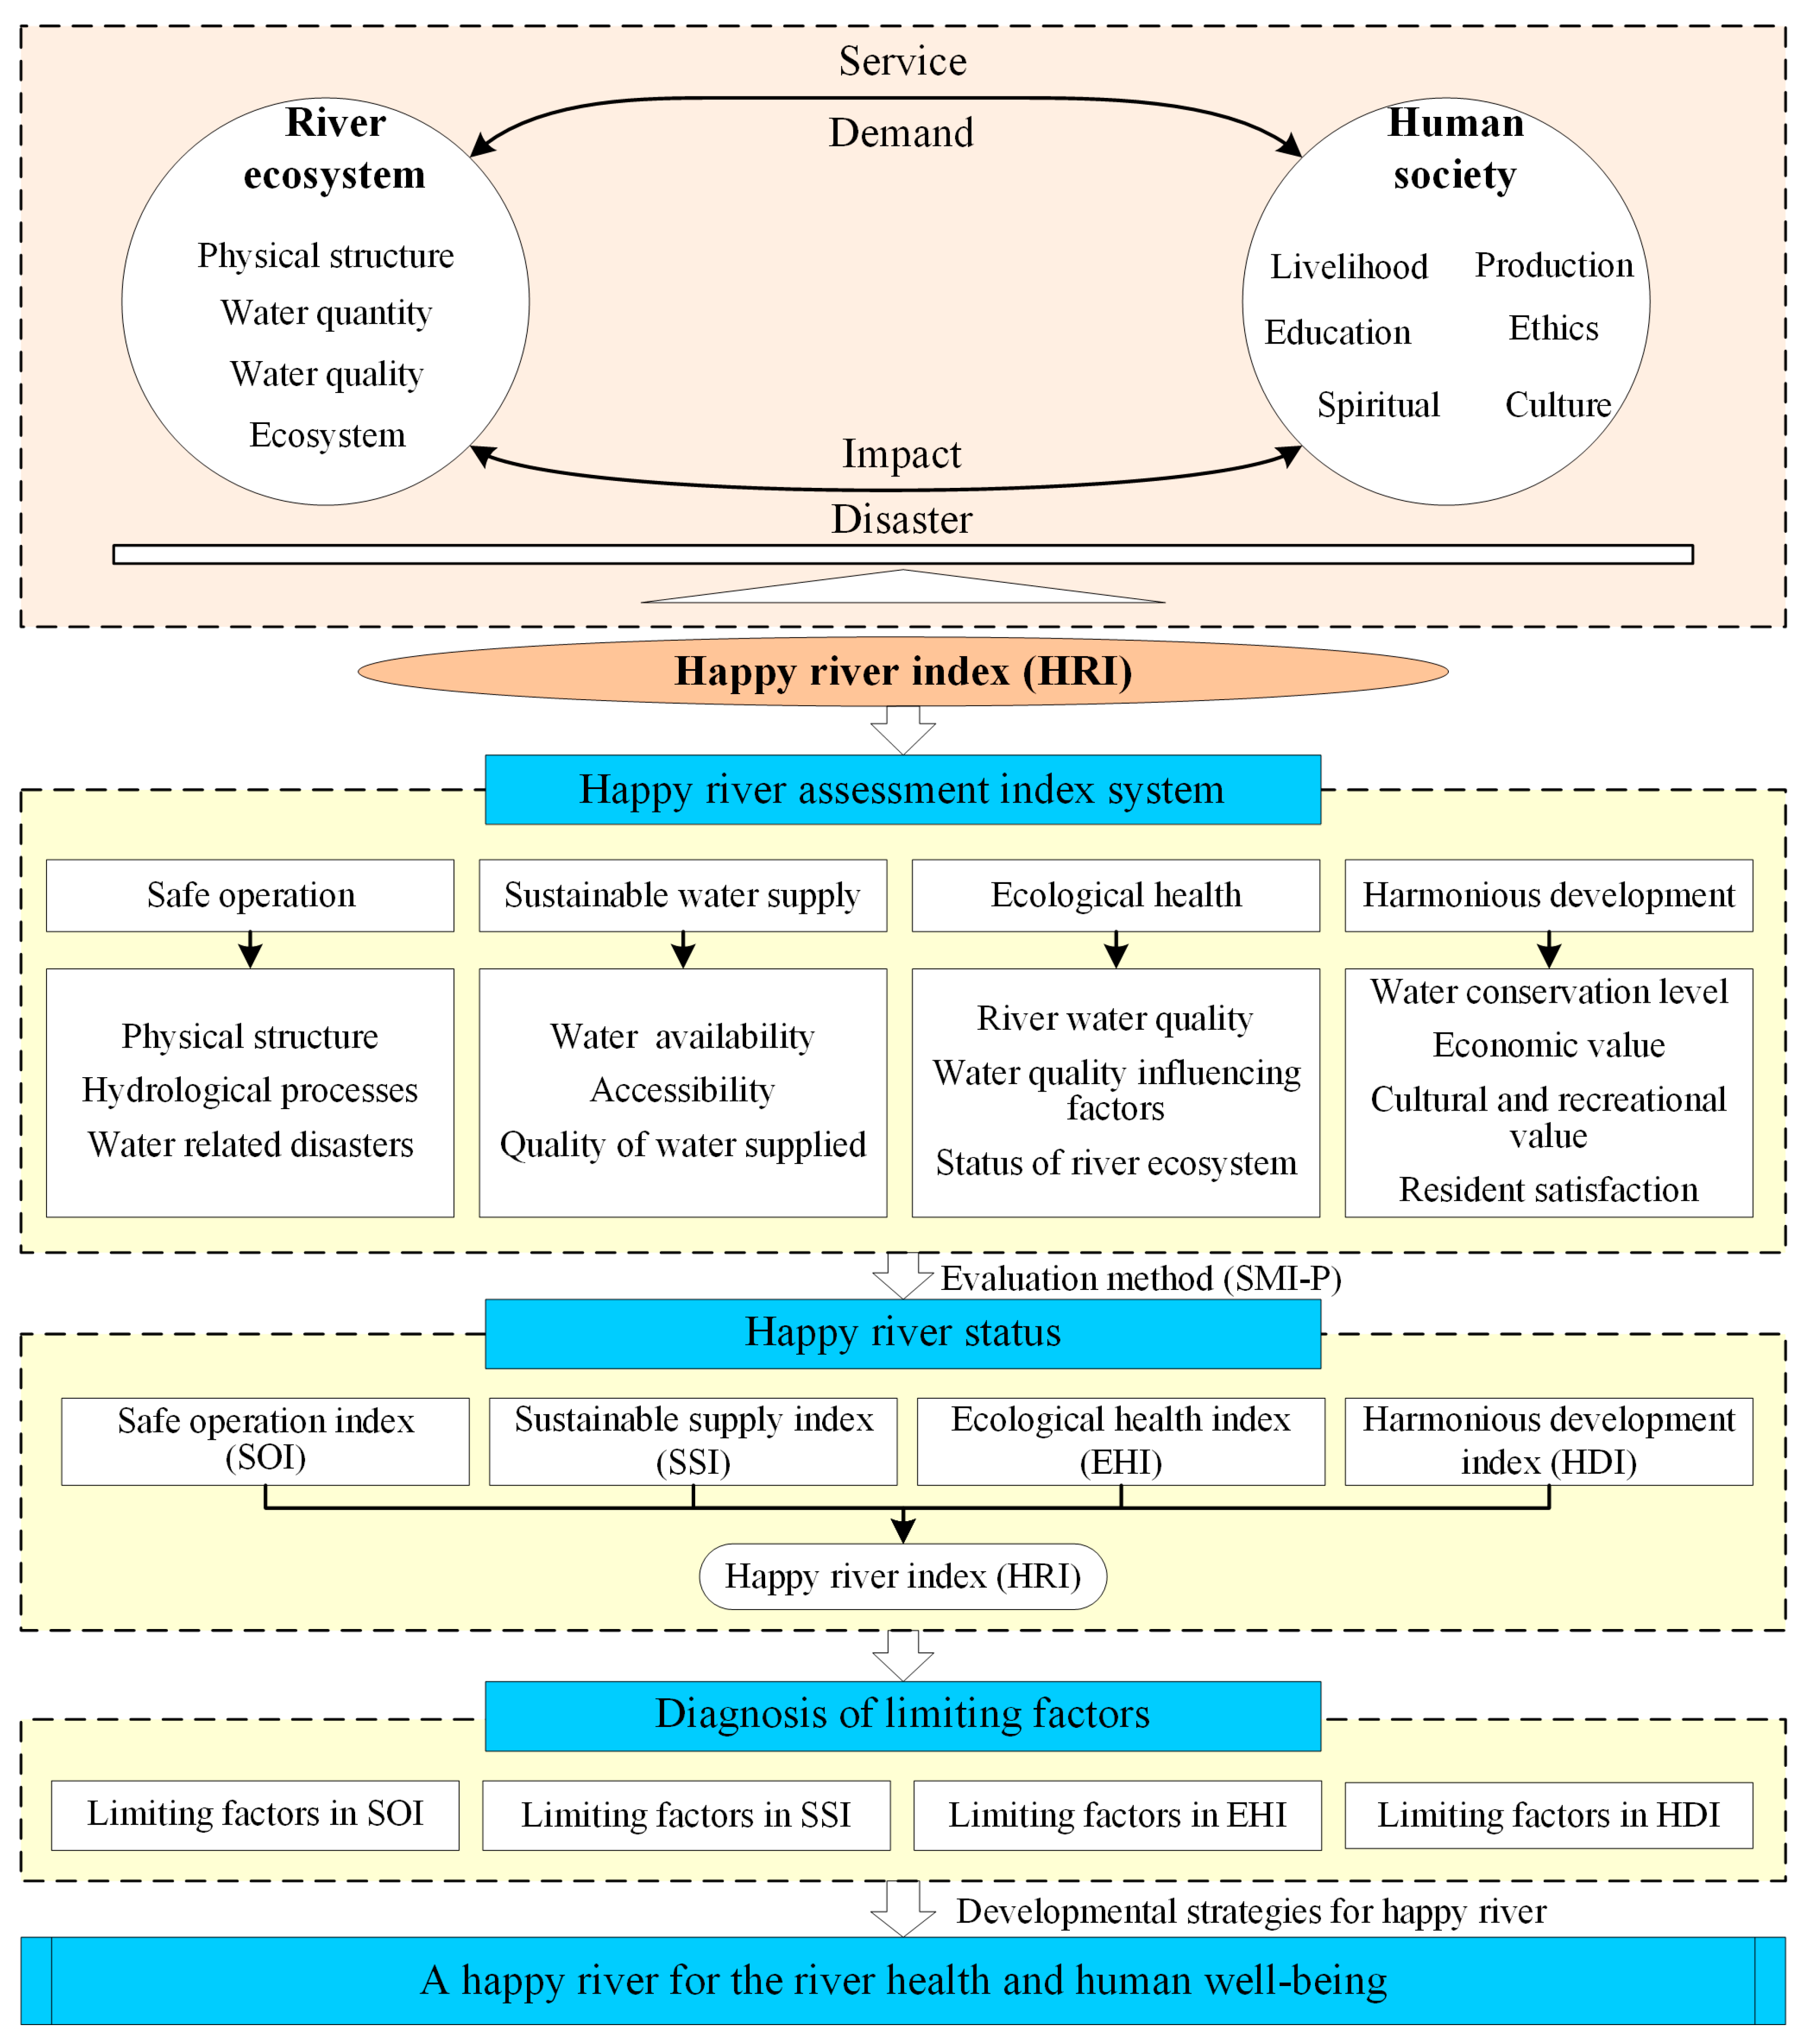
2.2. Framework for the Assessment of Happy River
2.3. River Happiness Assessment Index System
2.3.1. Indicator Selection
2.3.2. Development of the Indictor Standards
2.4. The HRI Assessment Method
2.5. Diagnosis of Limiting Factors
3. Case Study
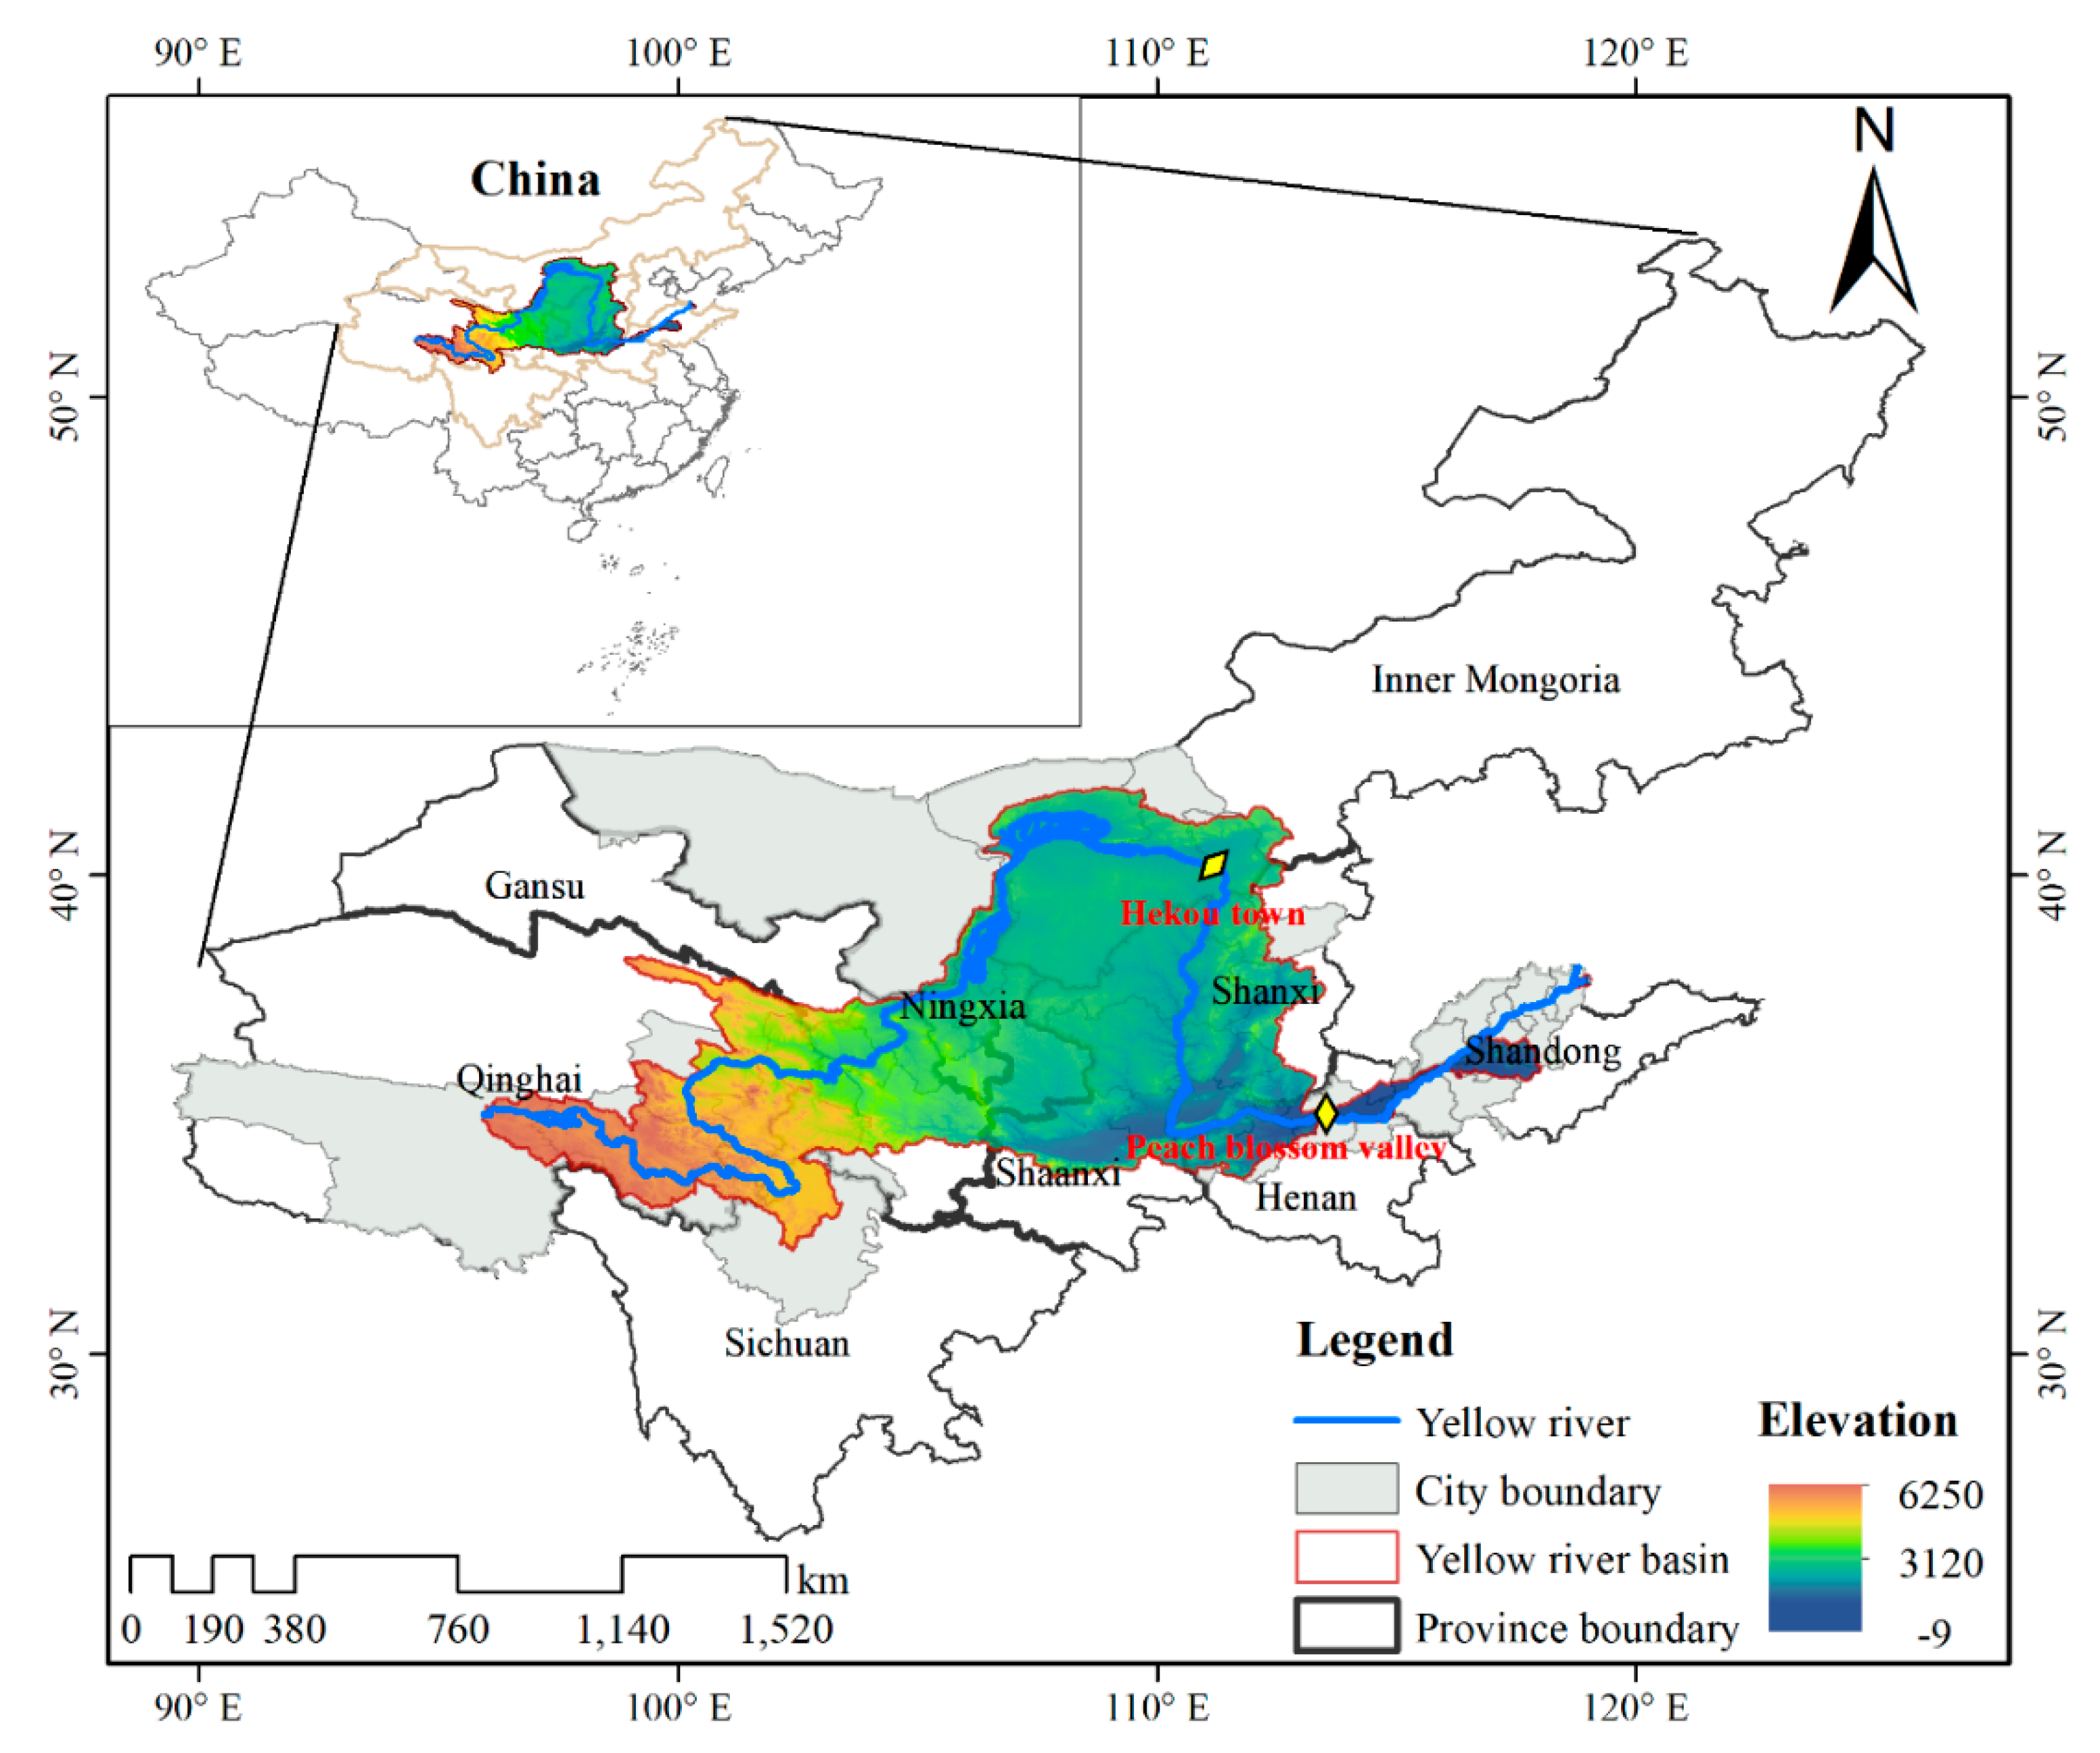
3.1. Study Area
3.2. Data Sources and Processing
4. Results
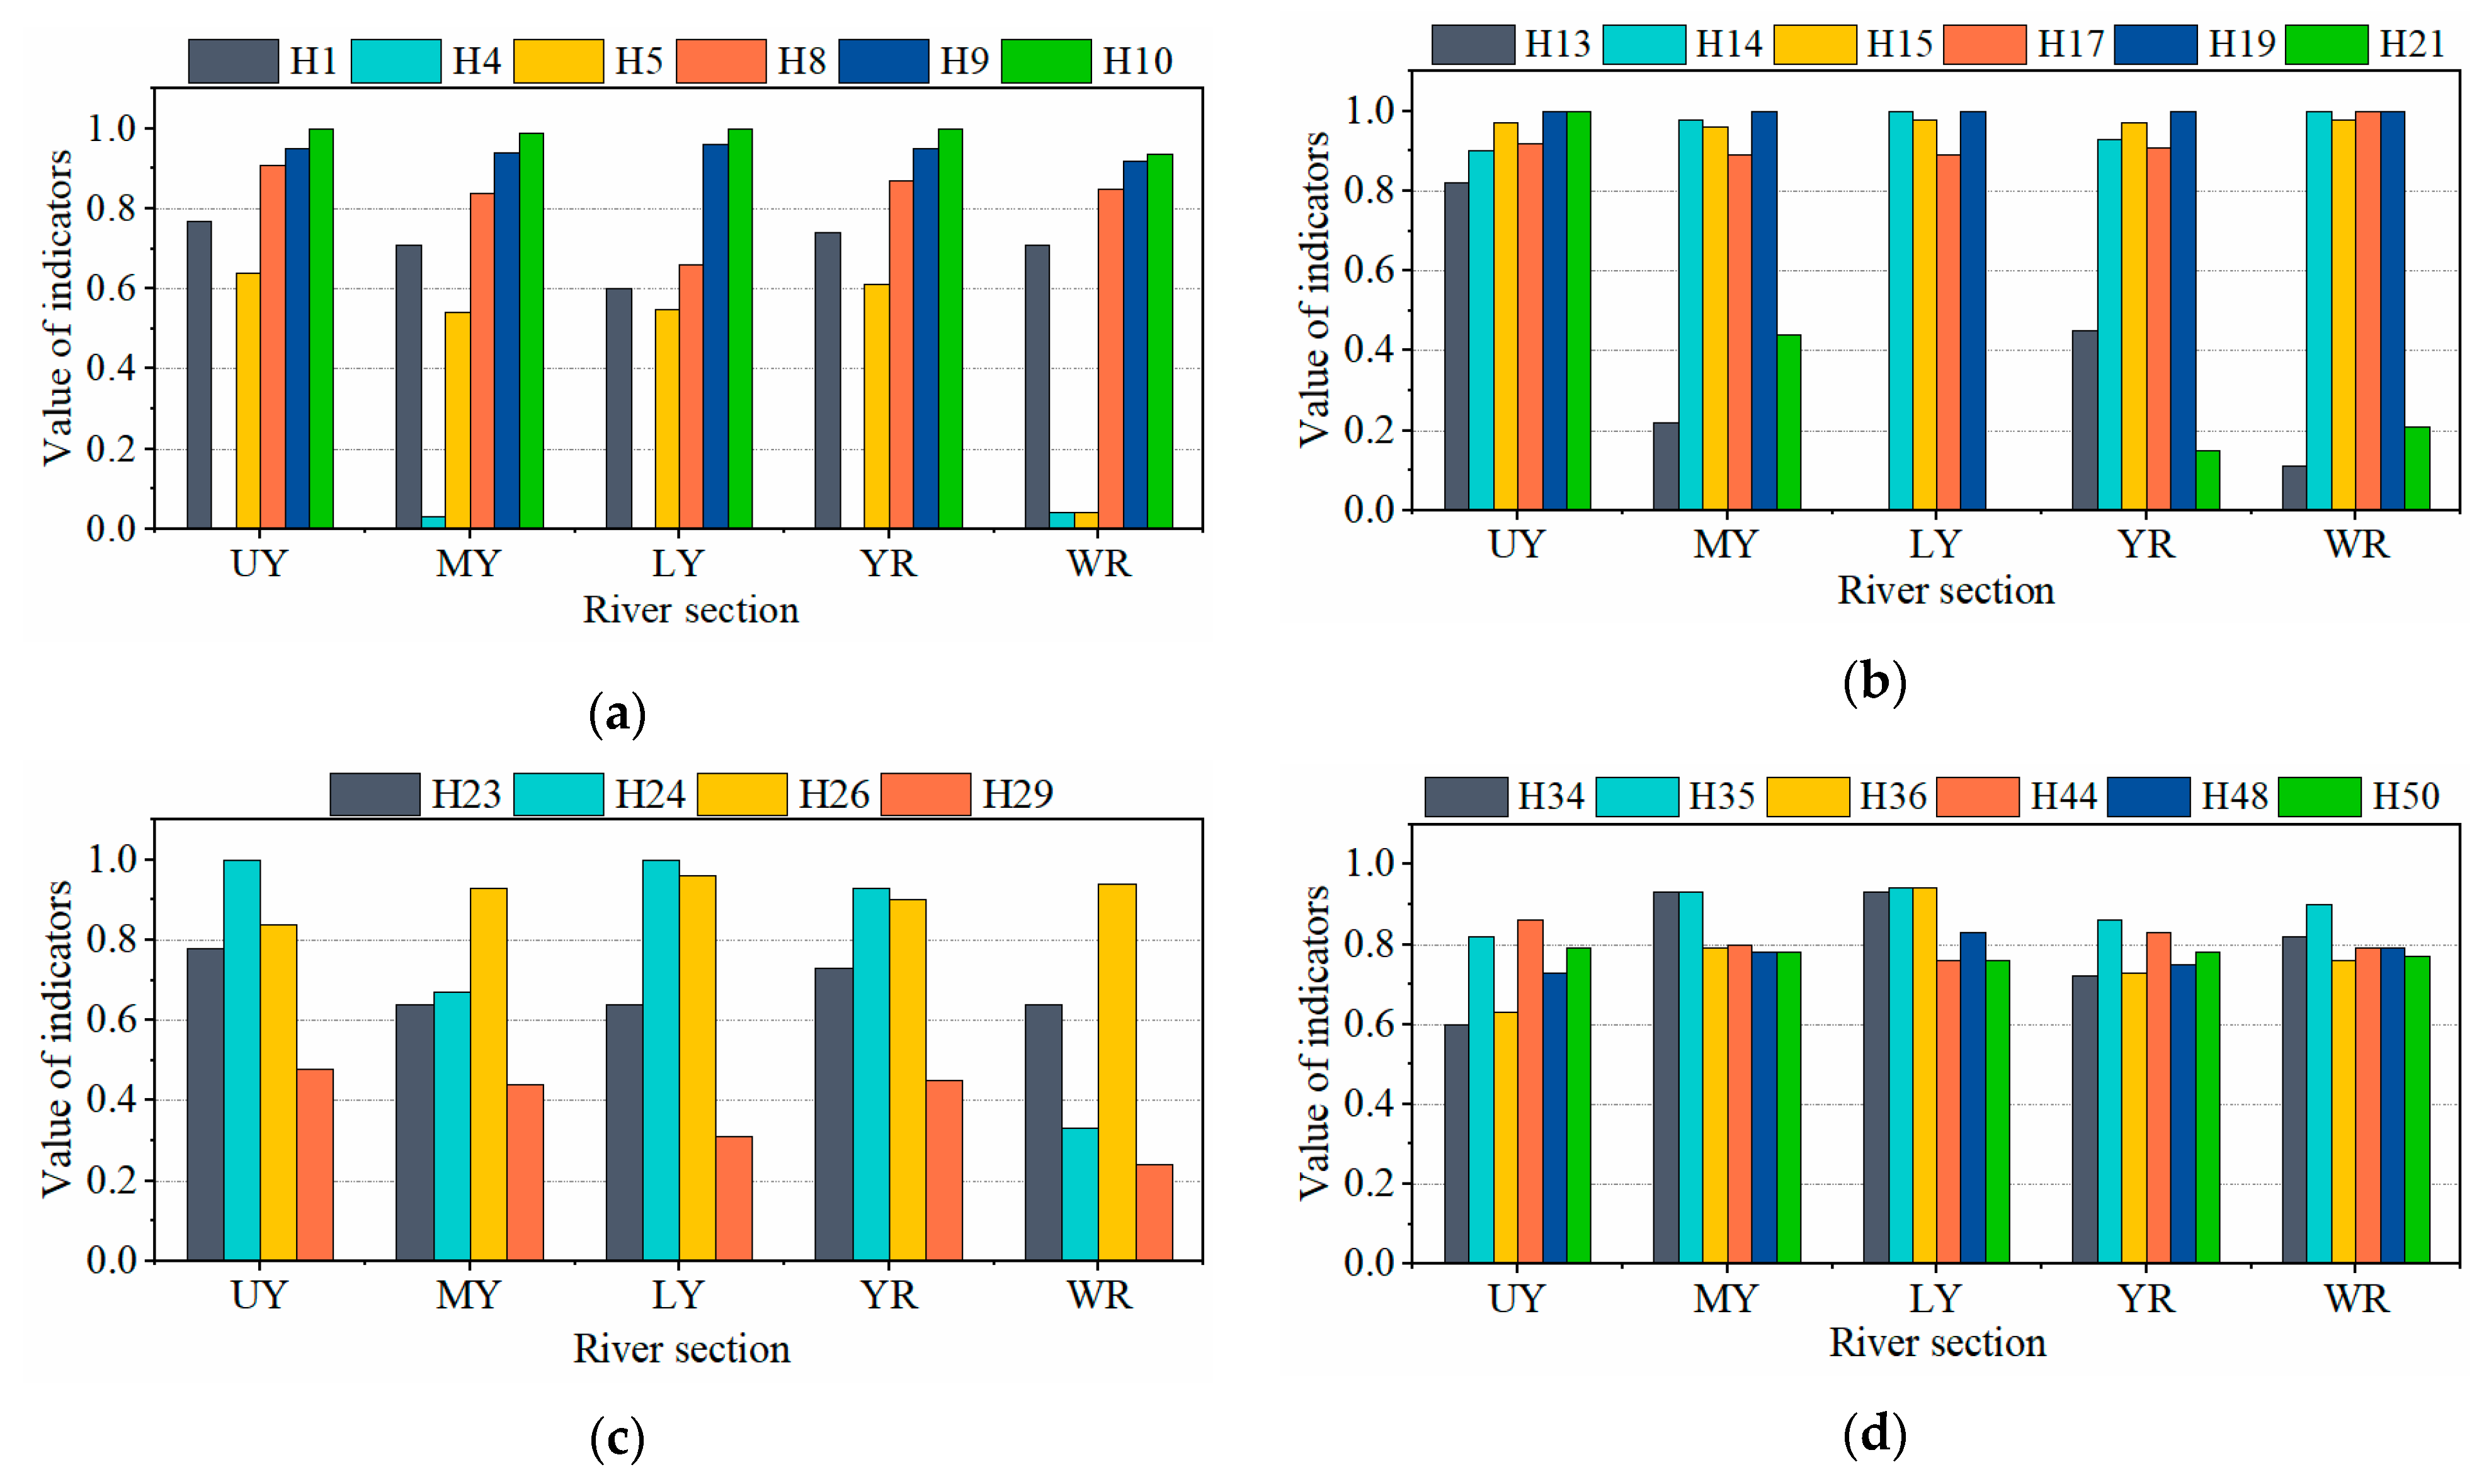
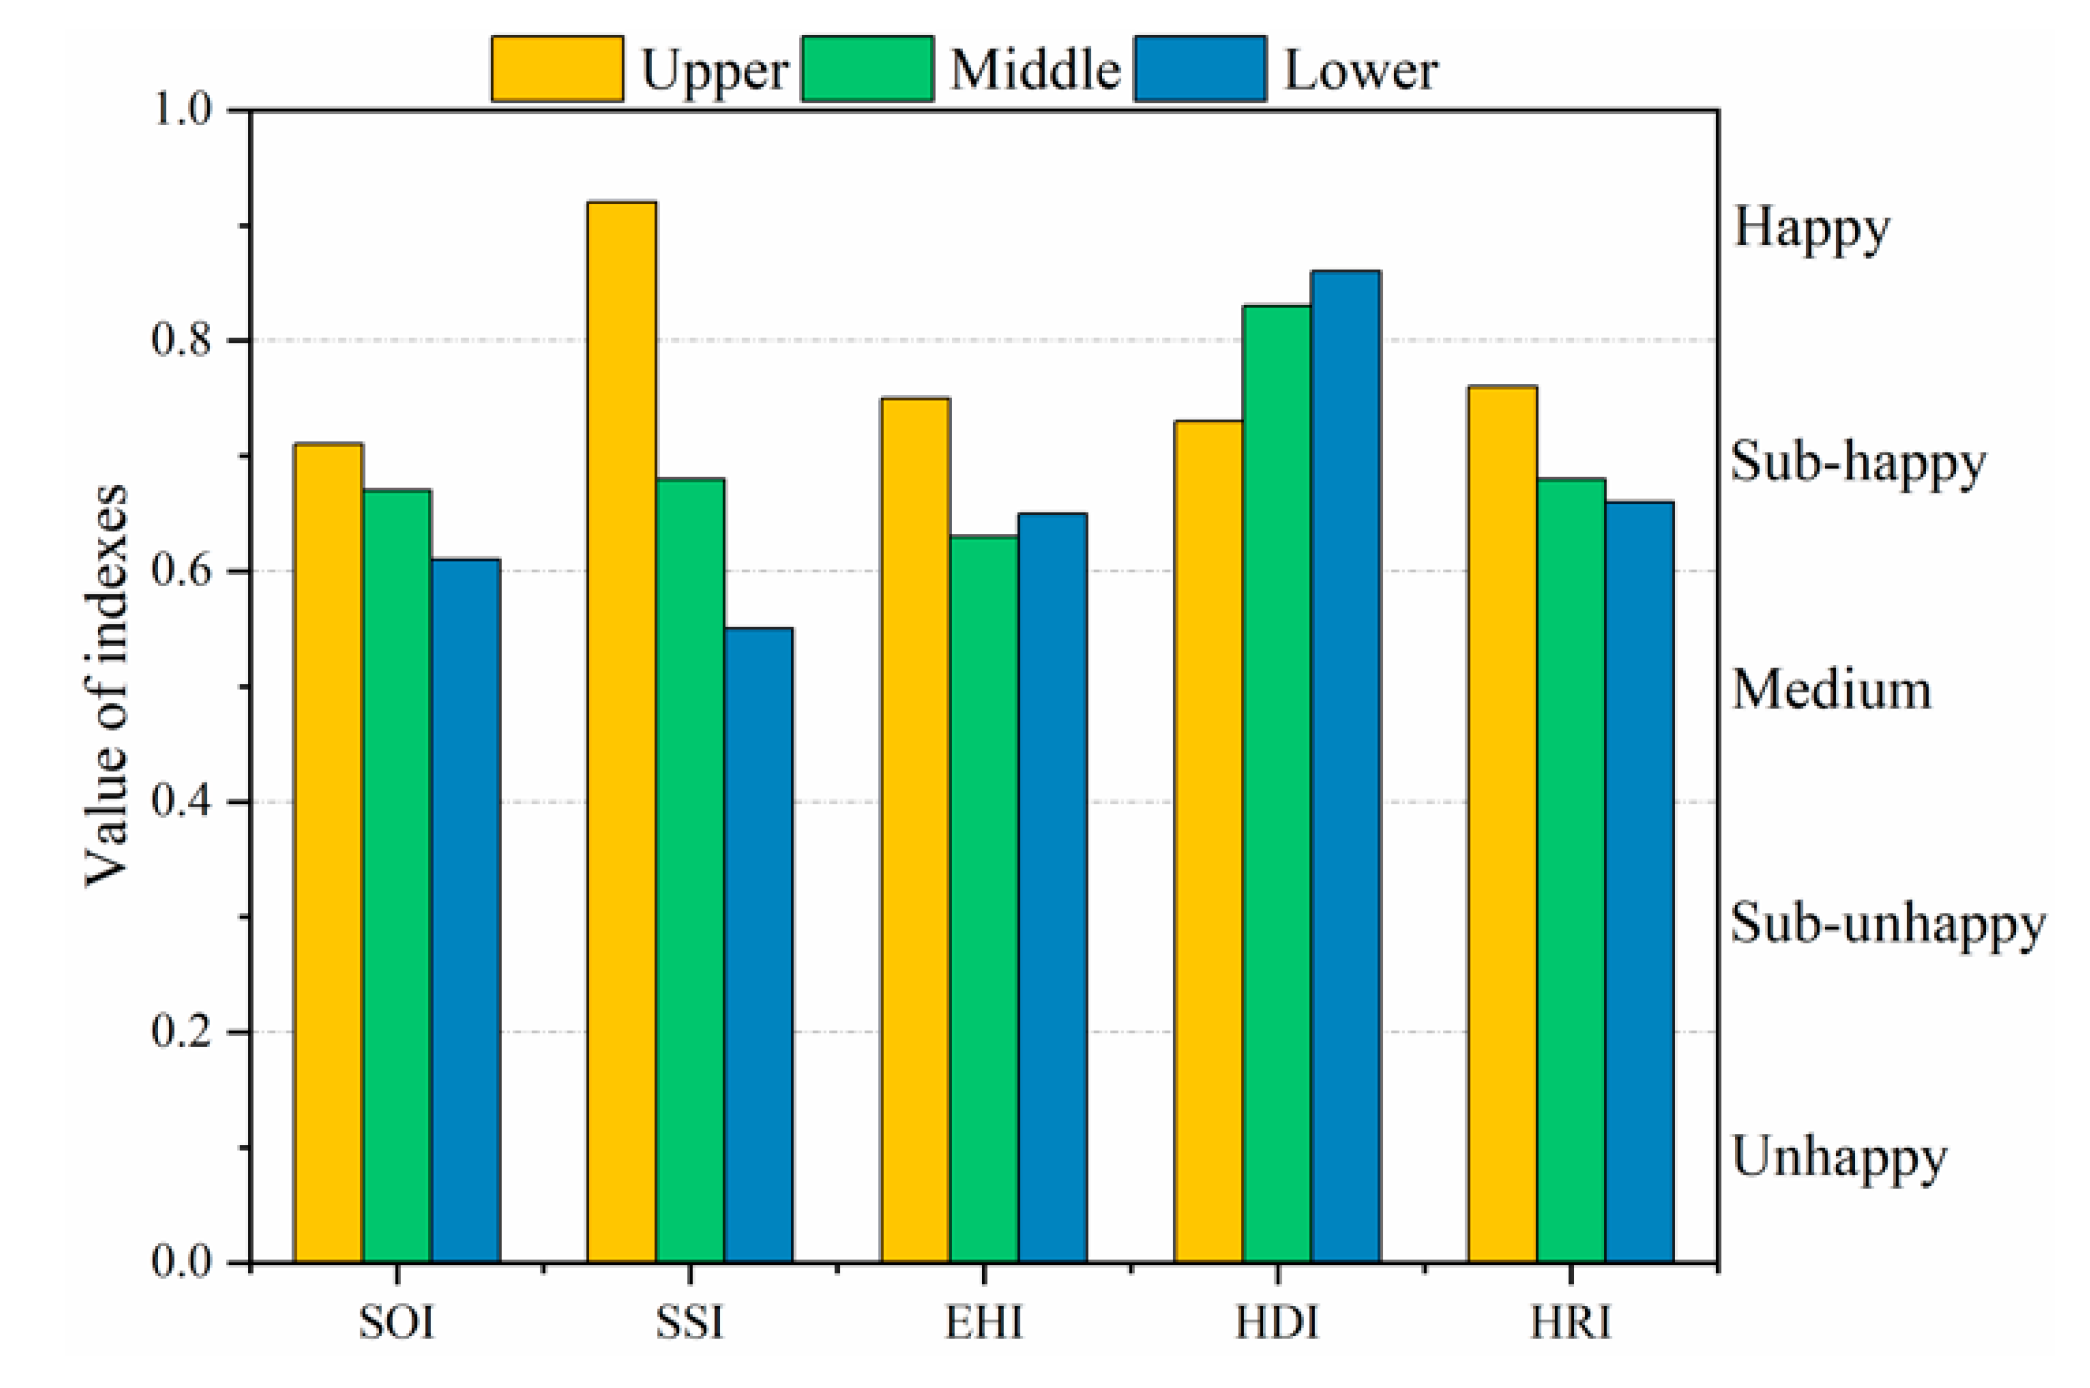
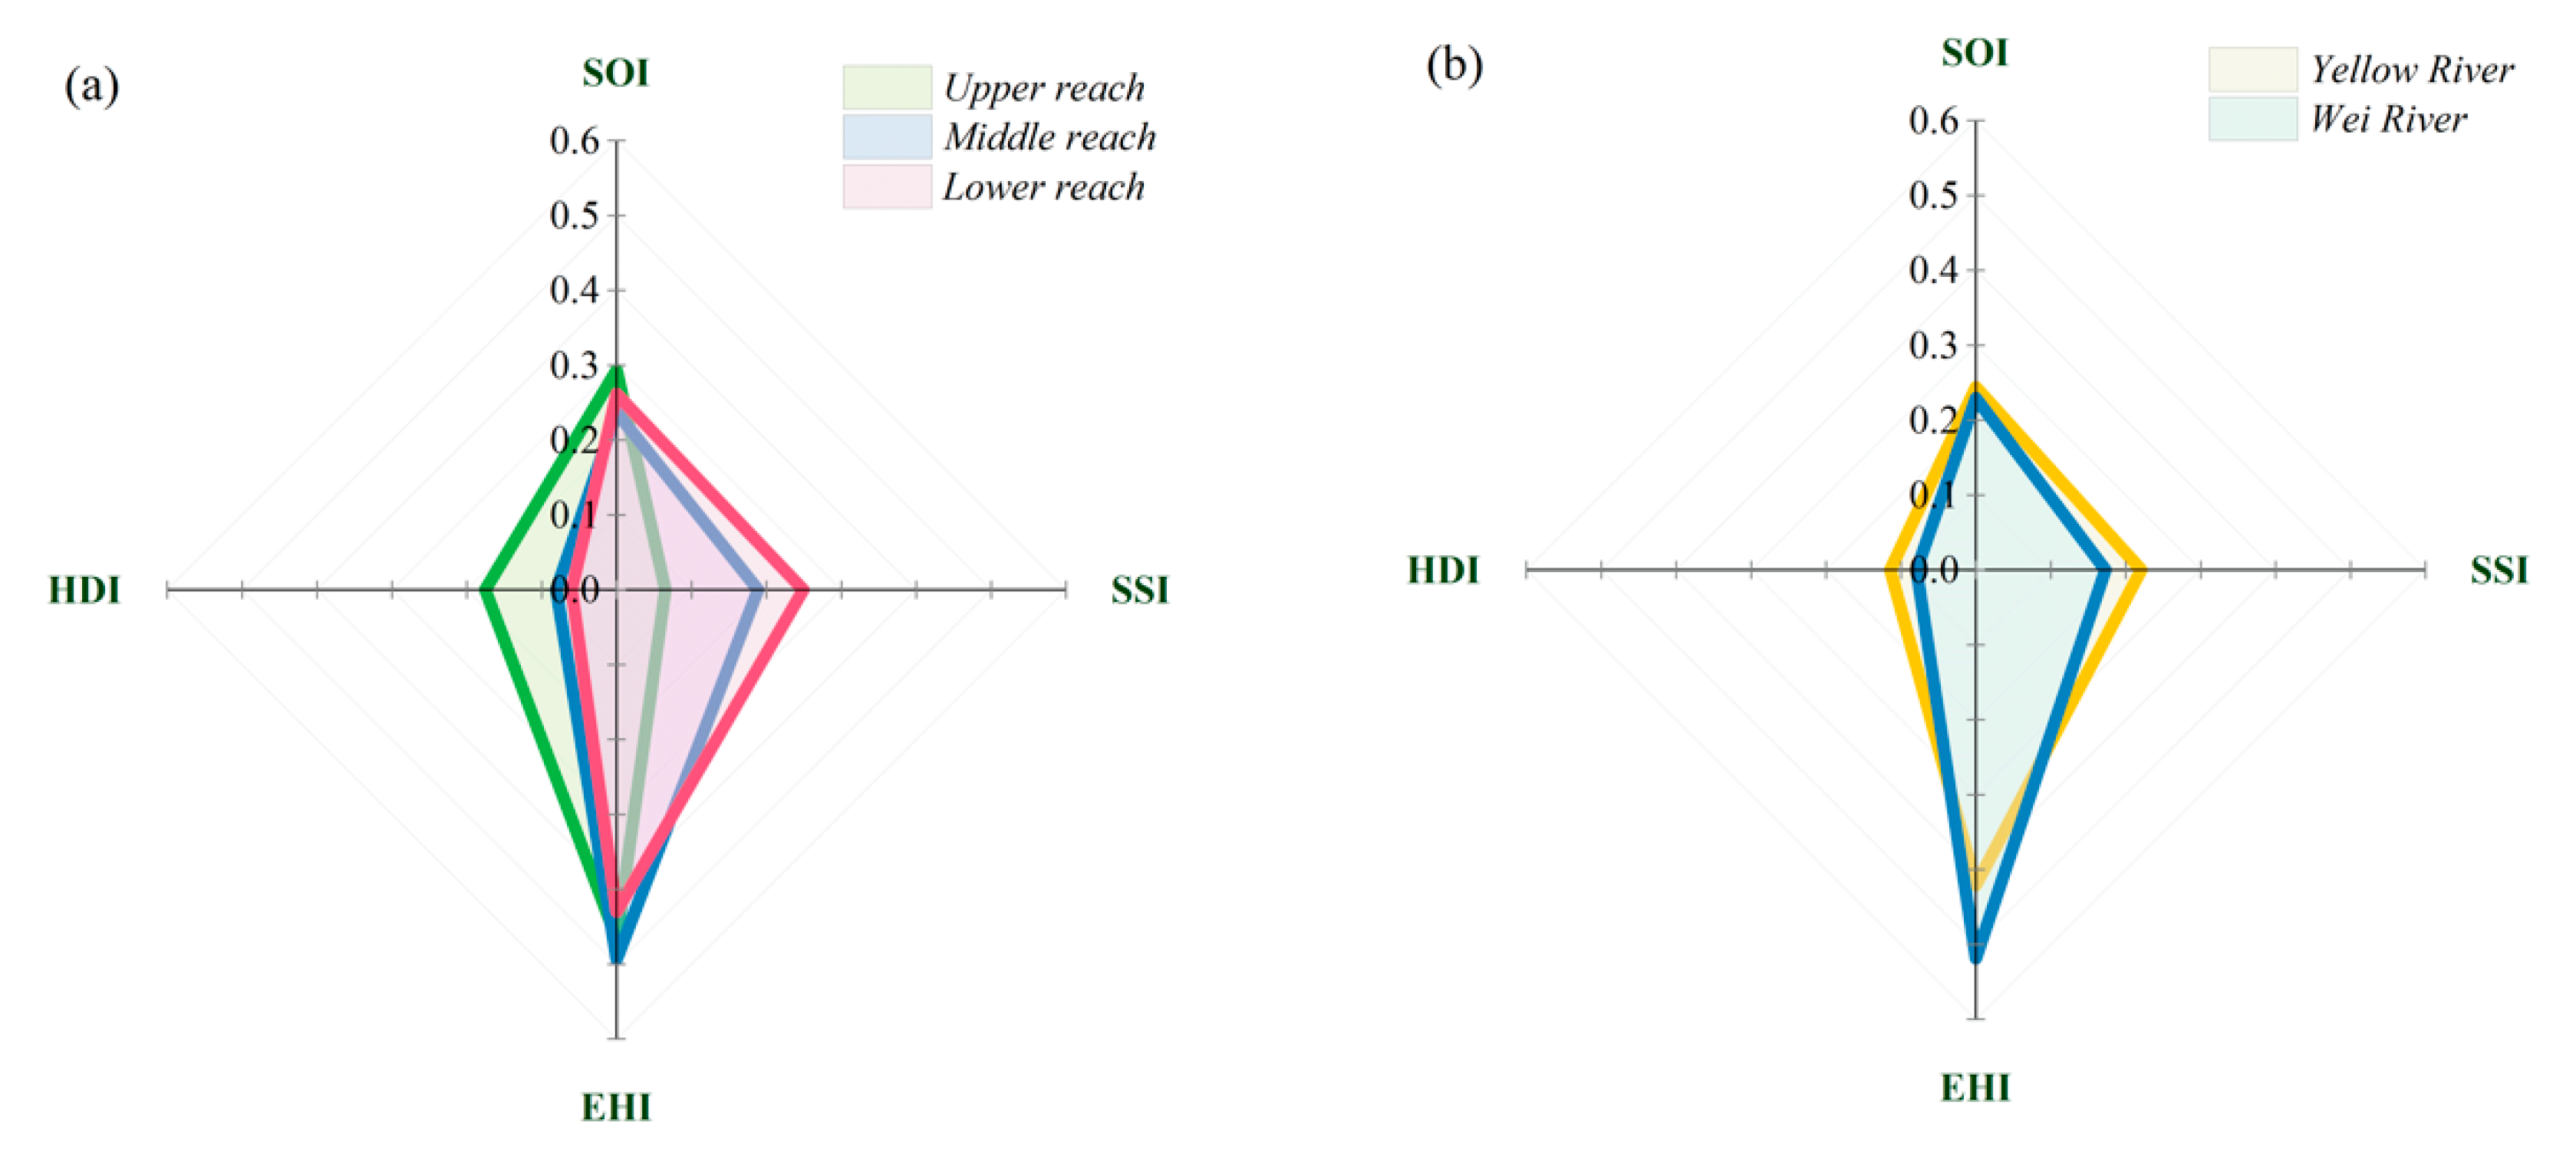
4.1. Happy River Assessment of the Yellow River at the River-Reach Scale
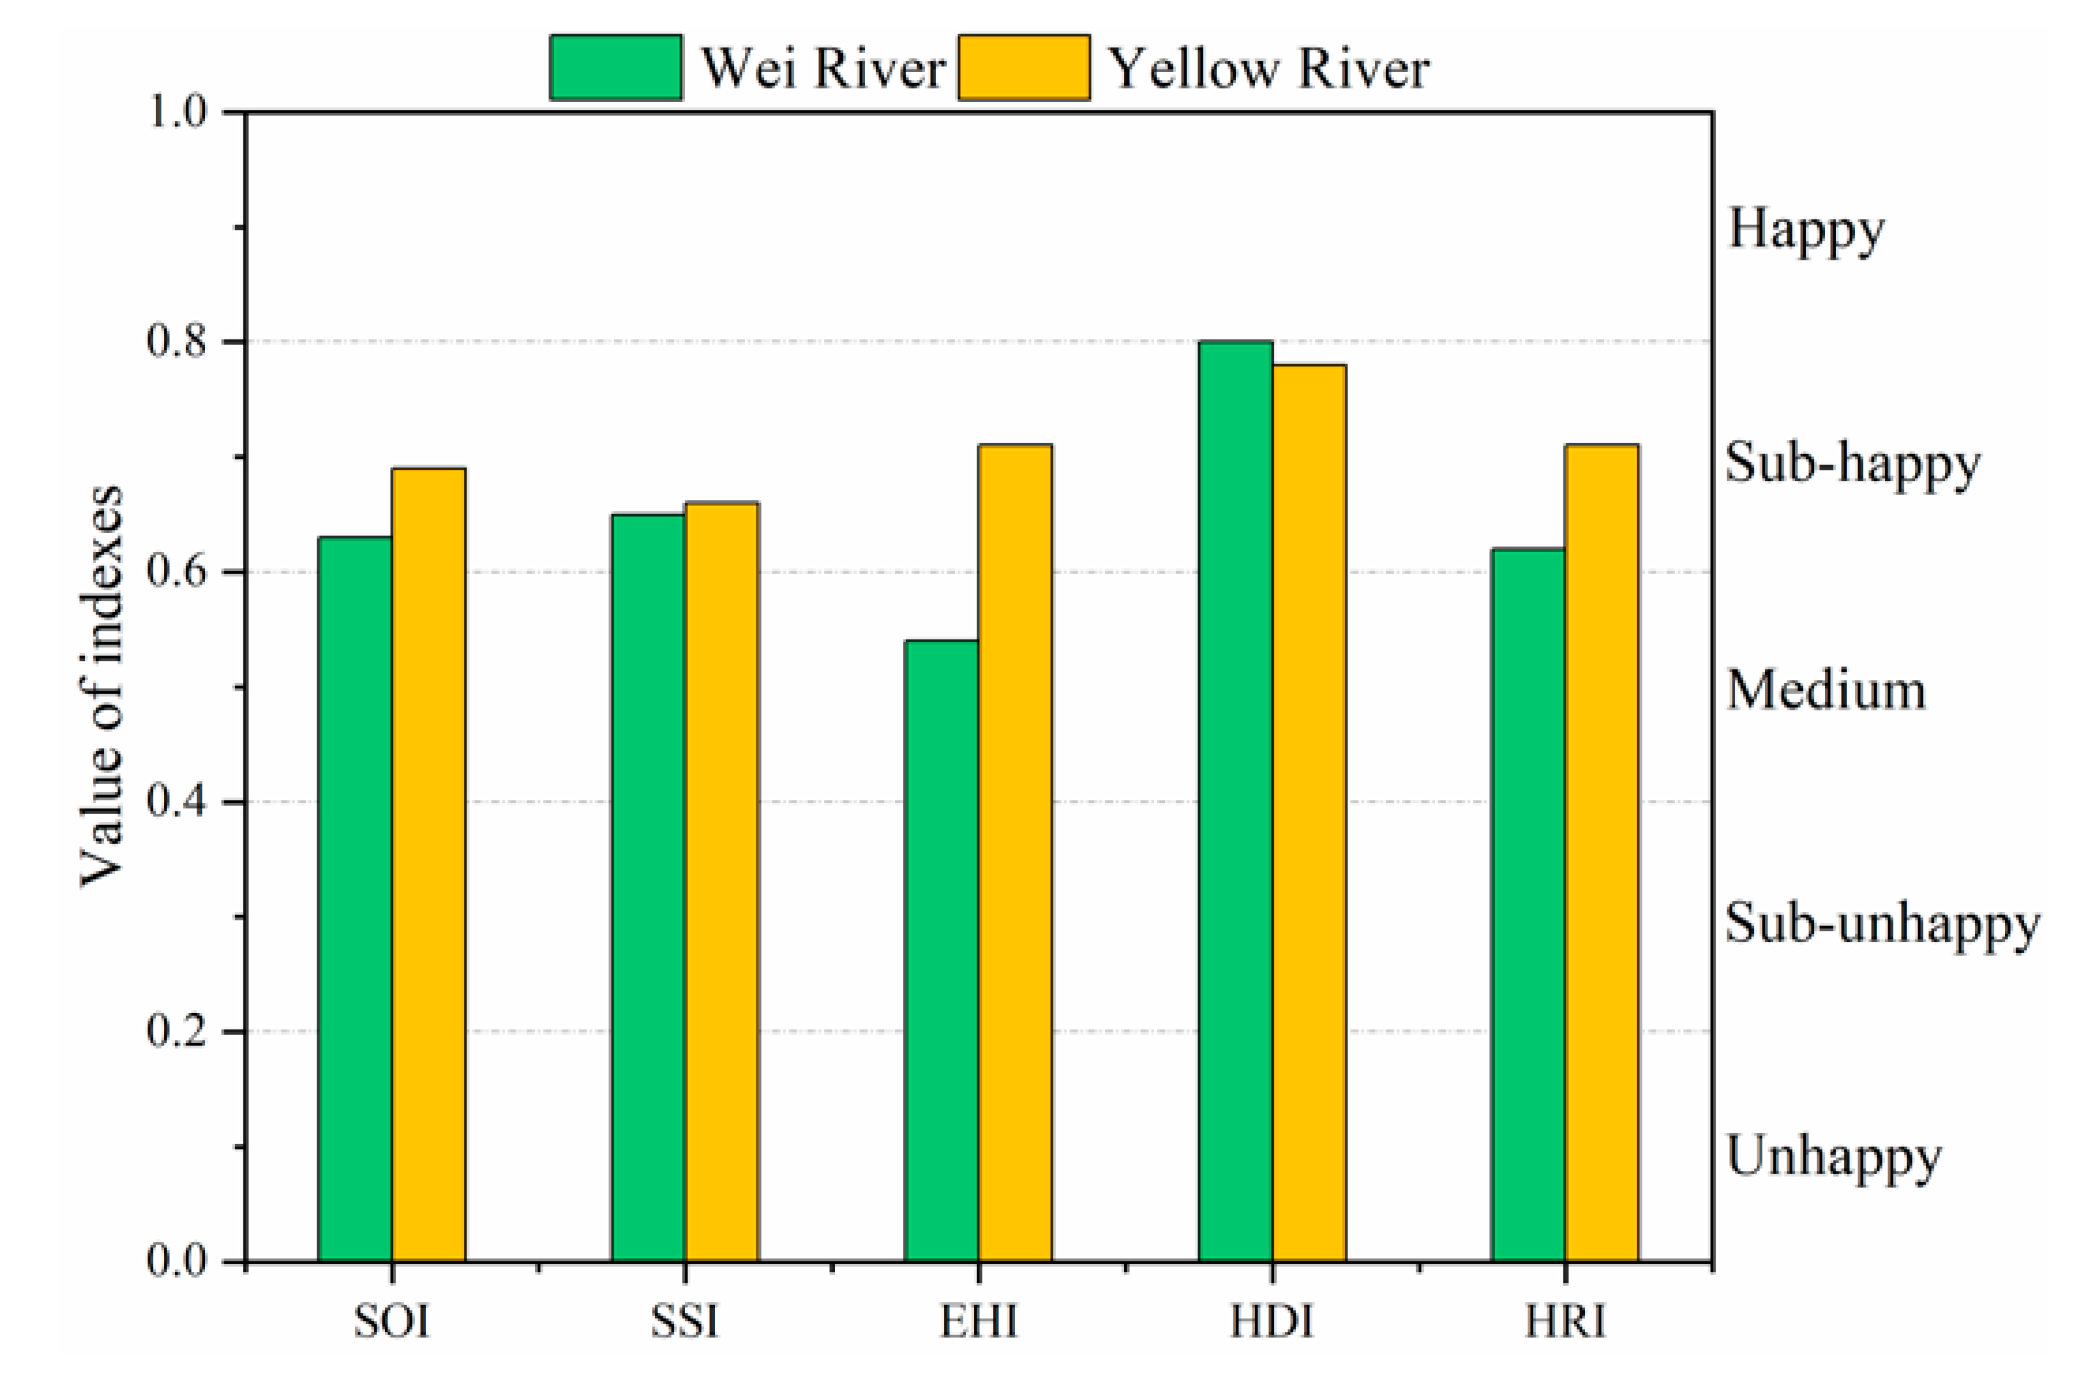
4.2. Happy River Assessment at the Overall Main-Stem Scale within Both the Yellow and Wei Rivers
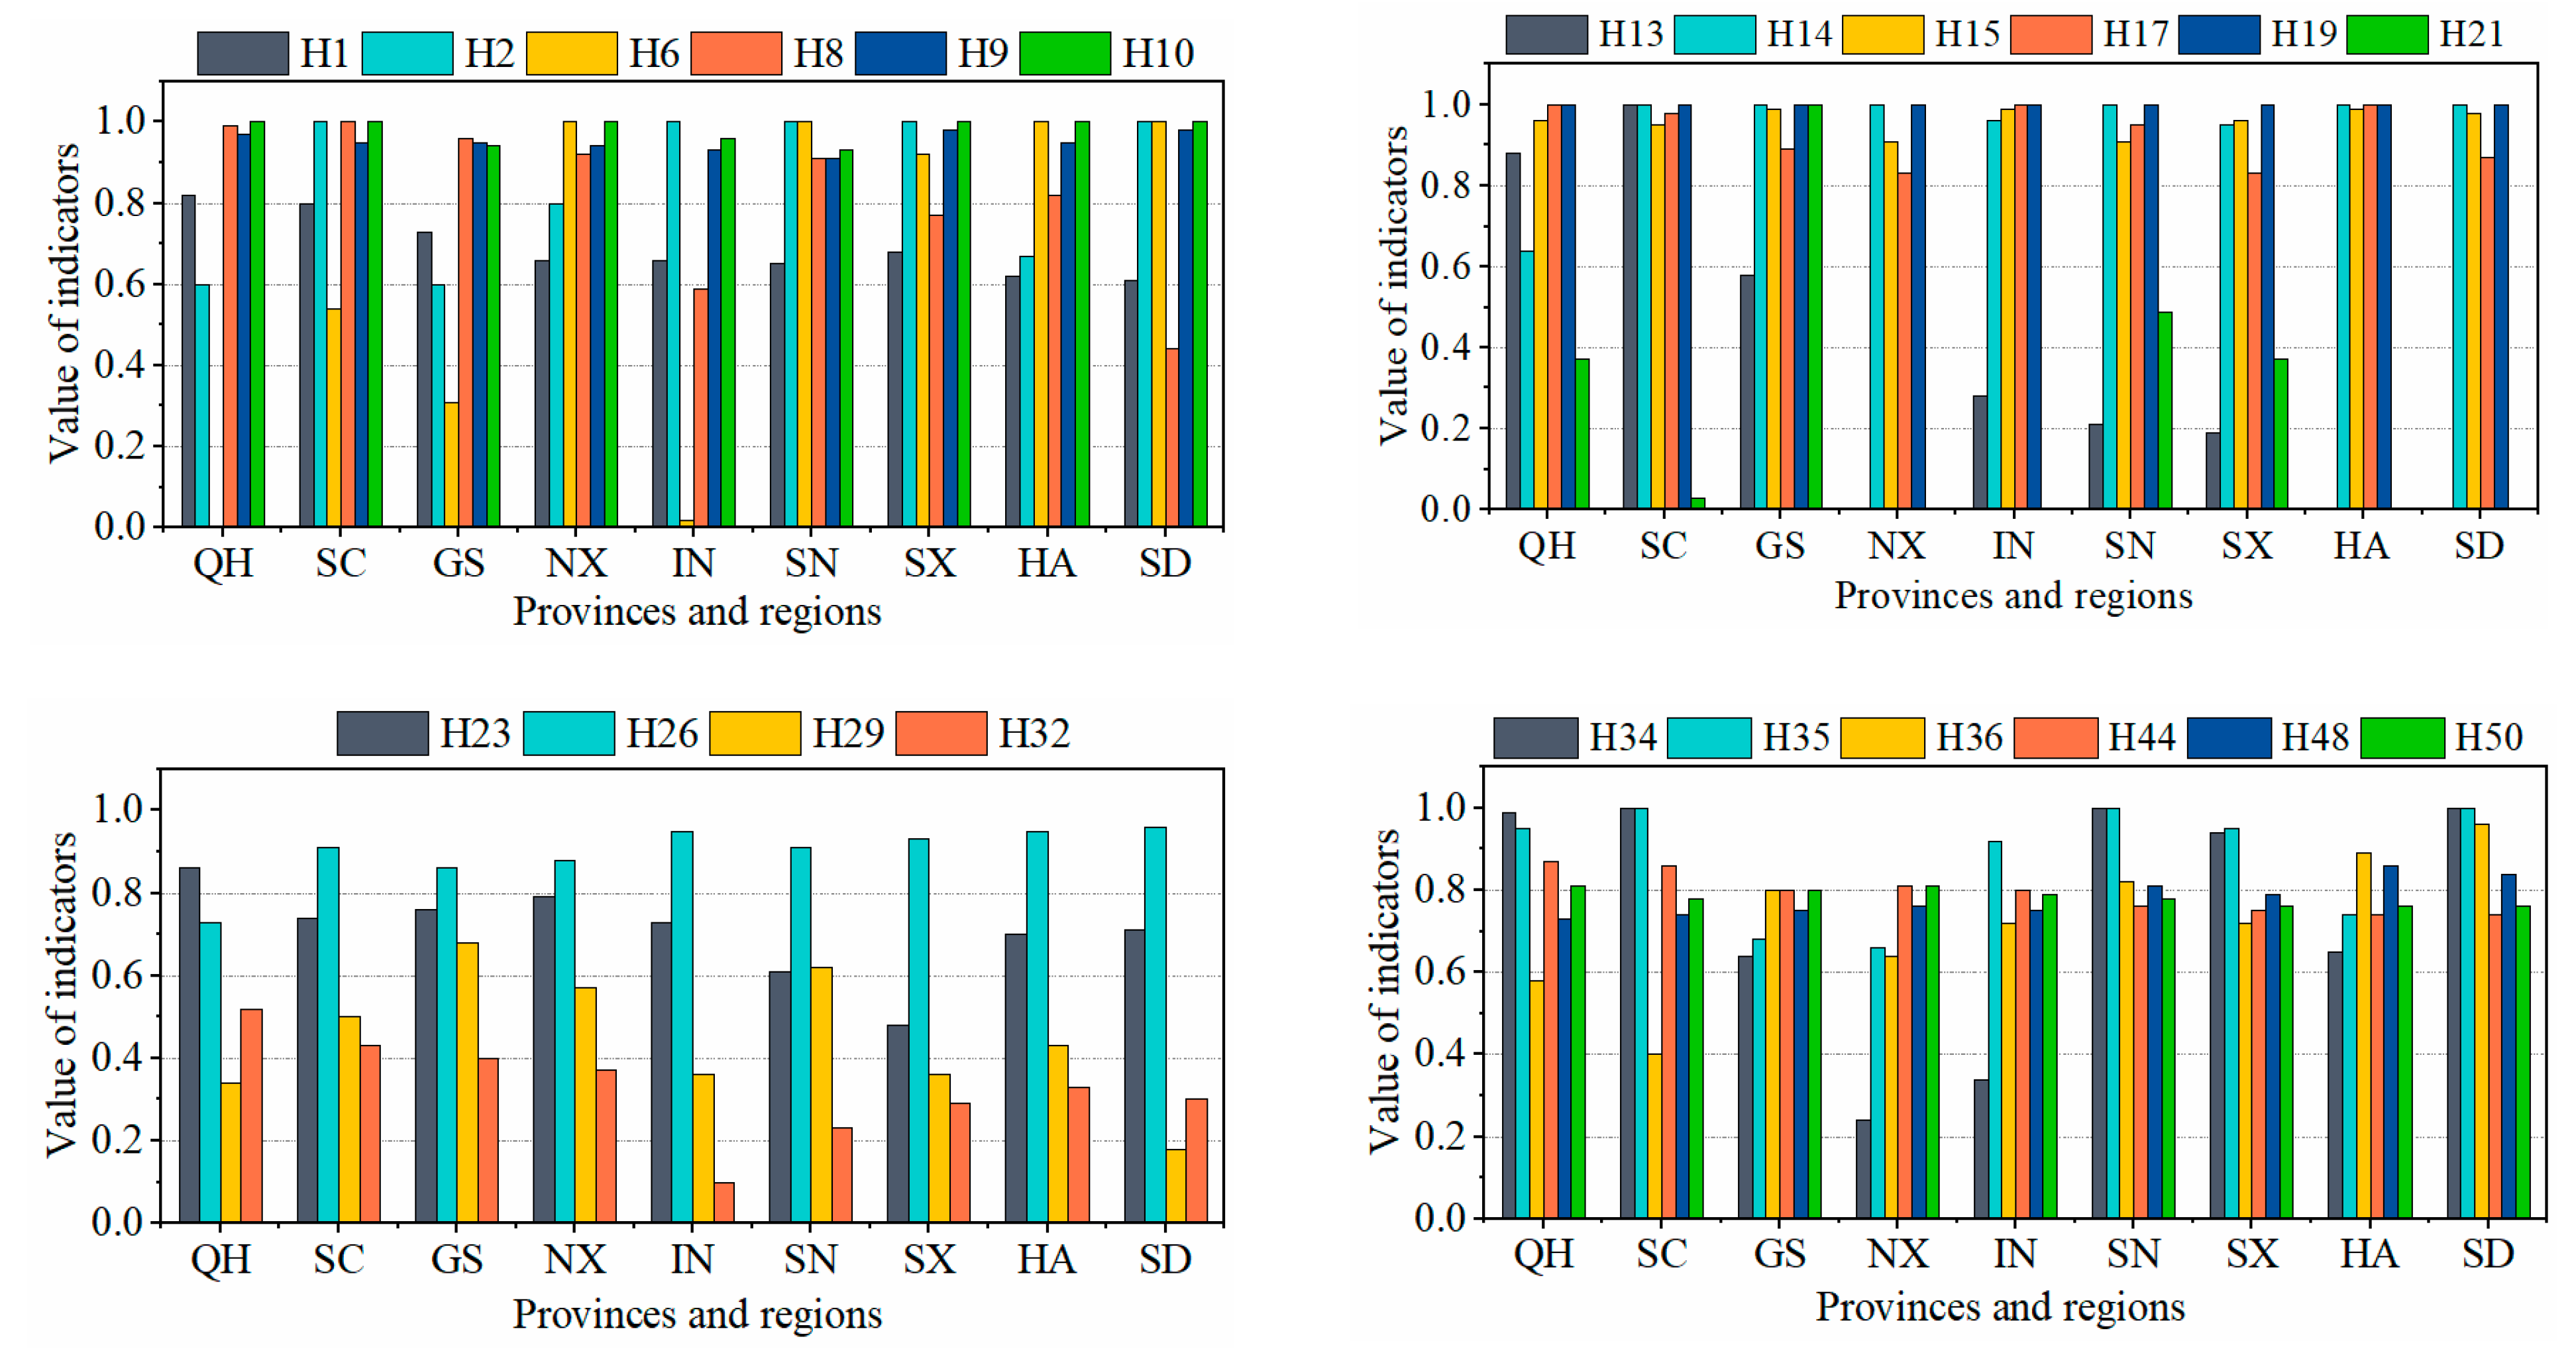
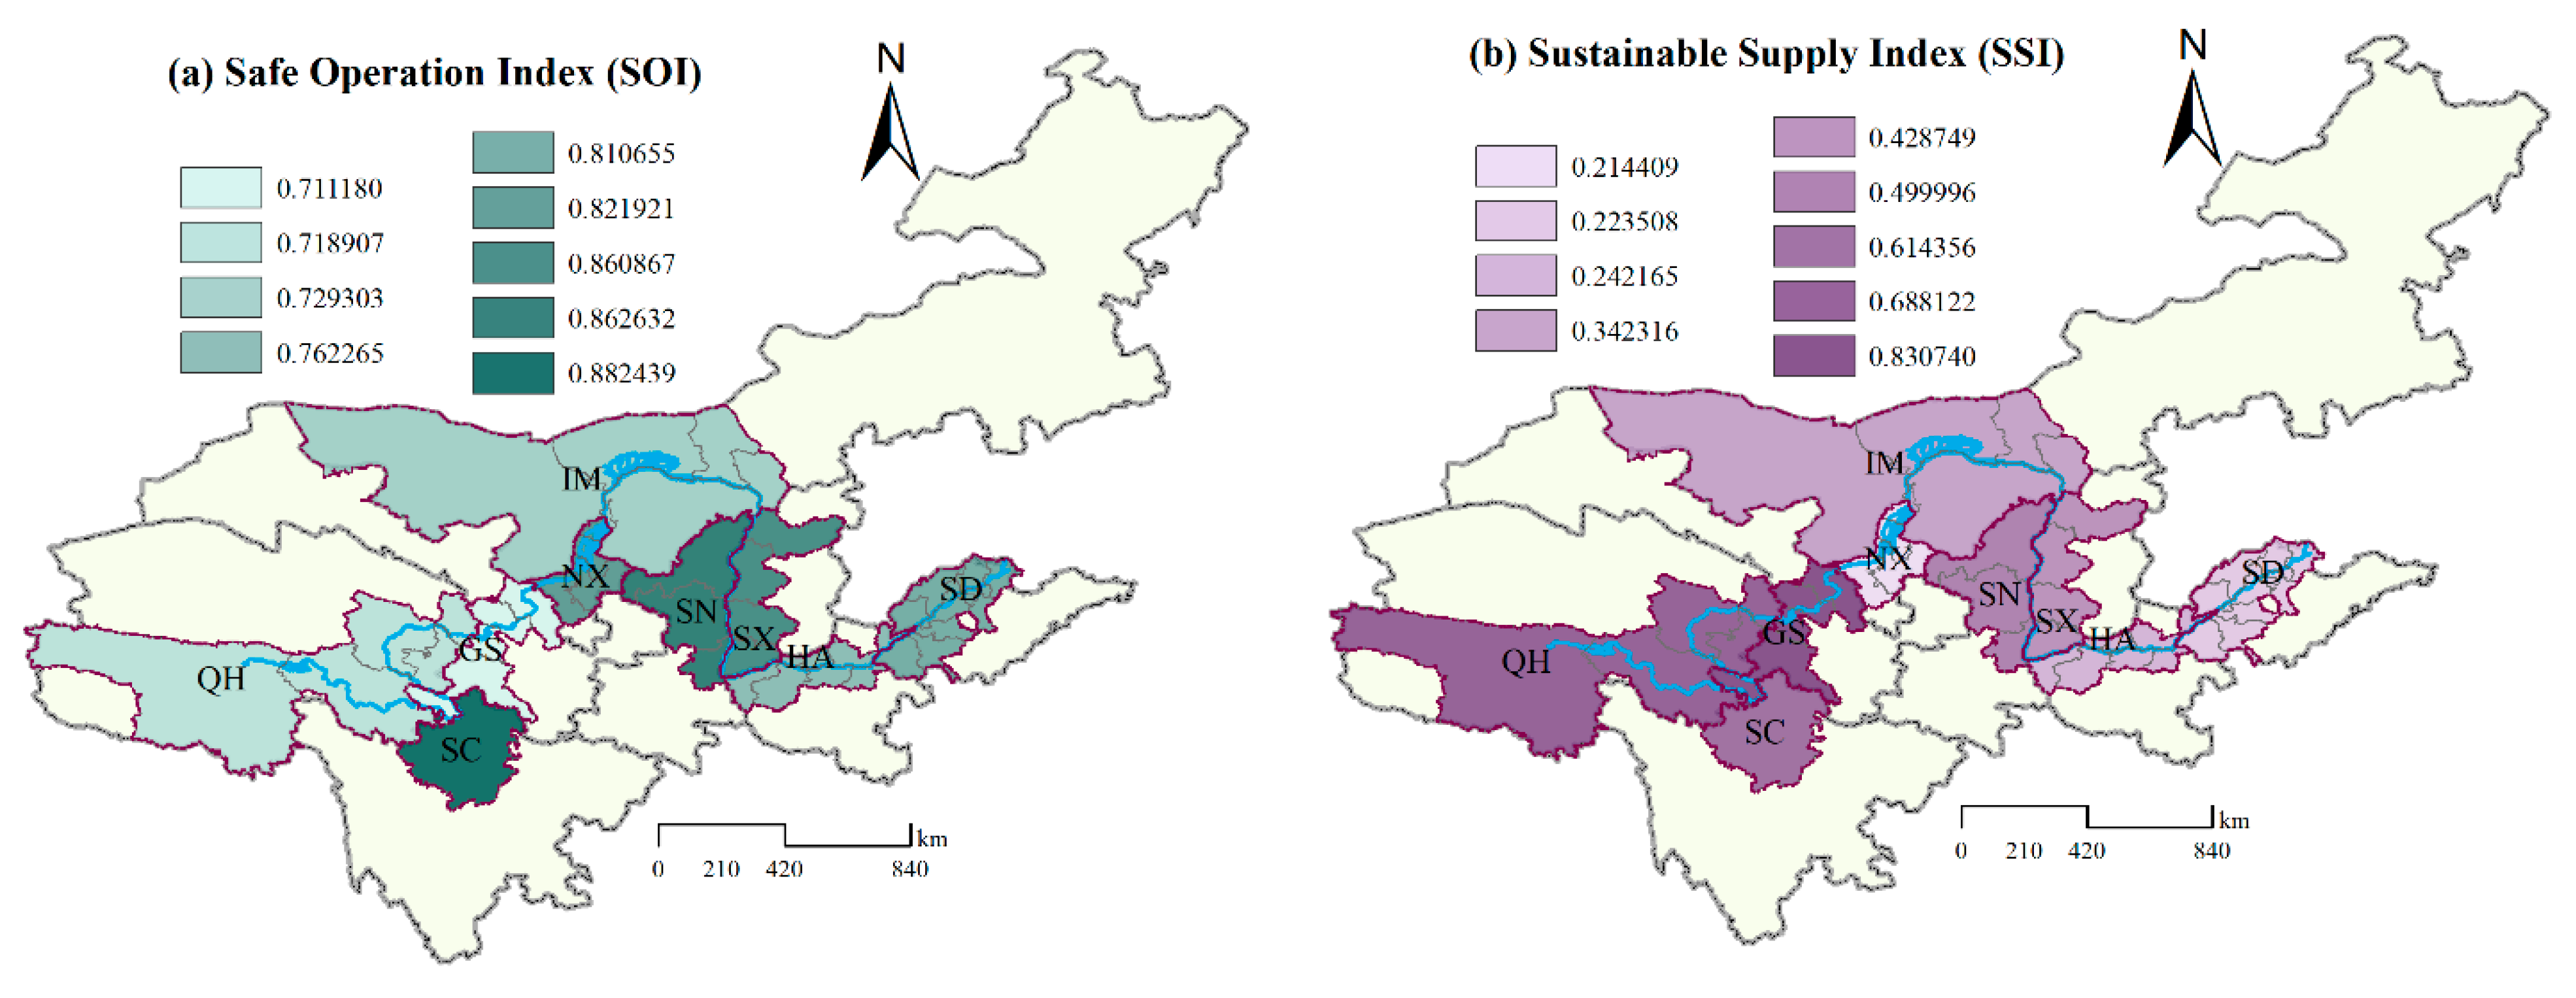
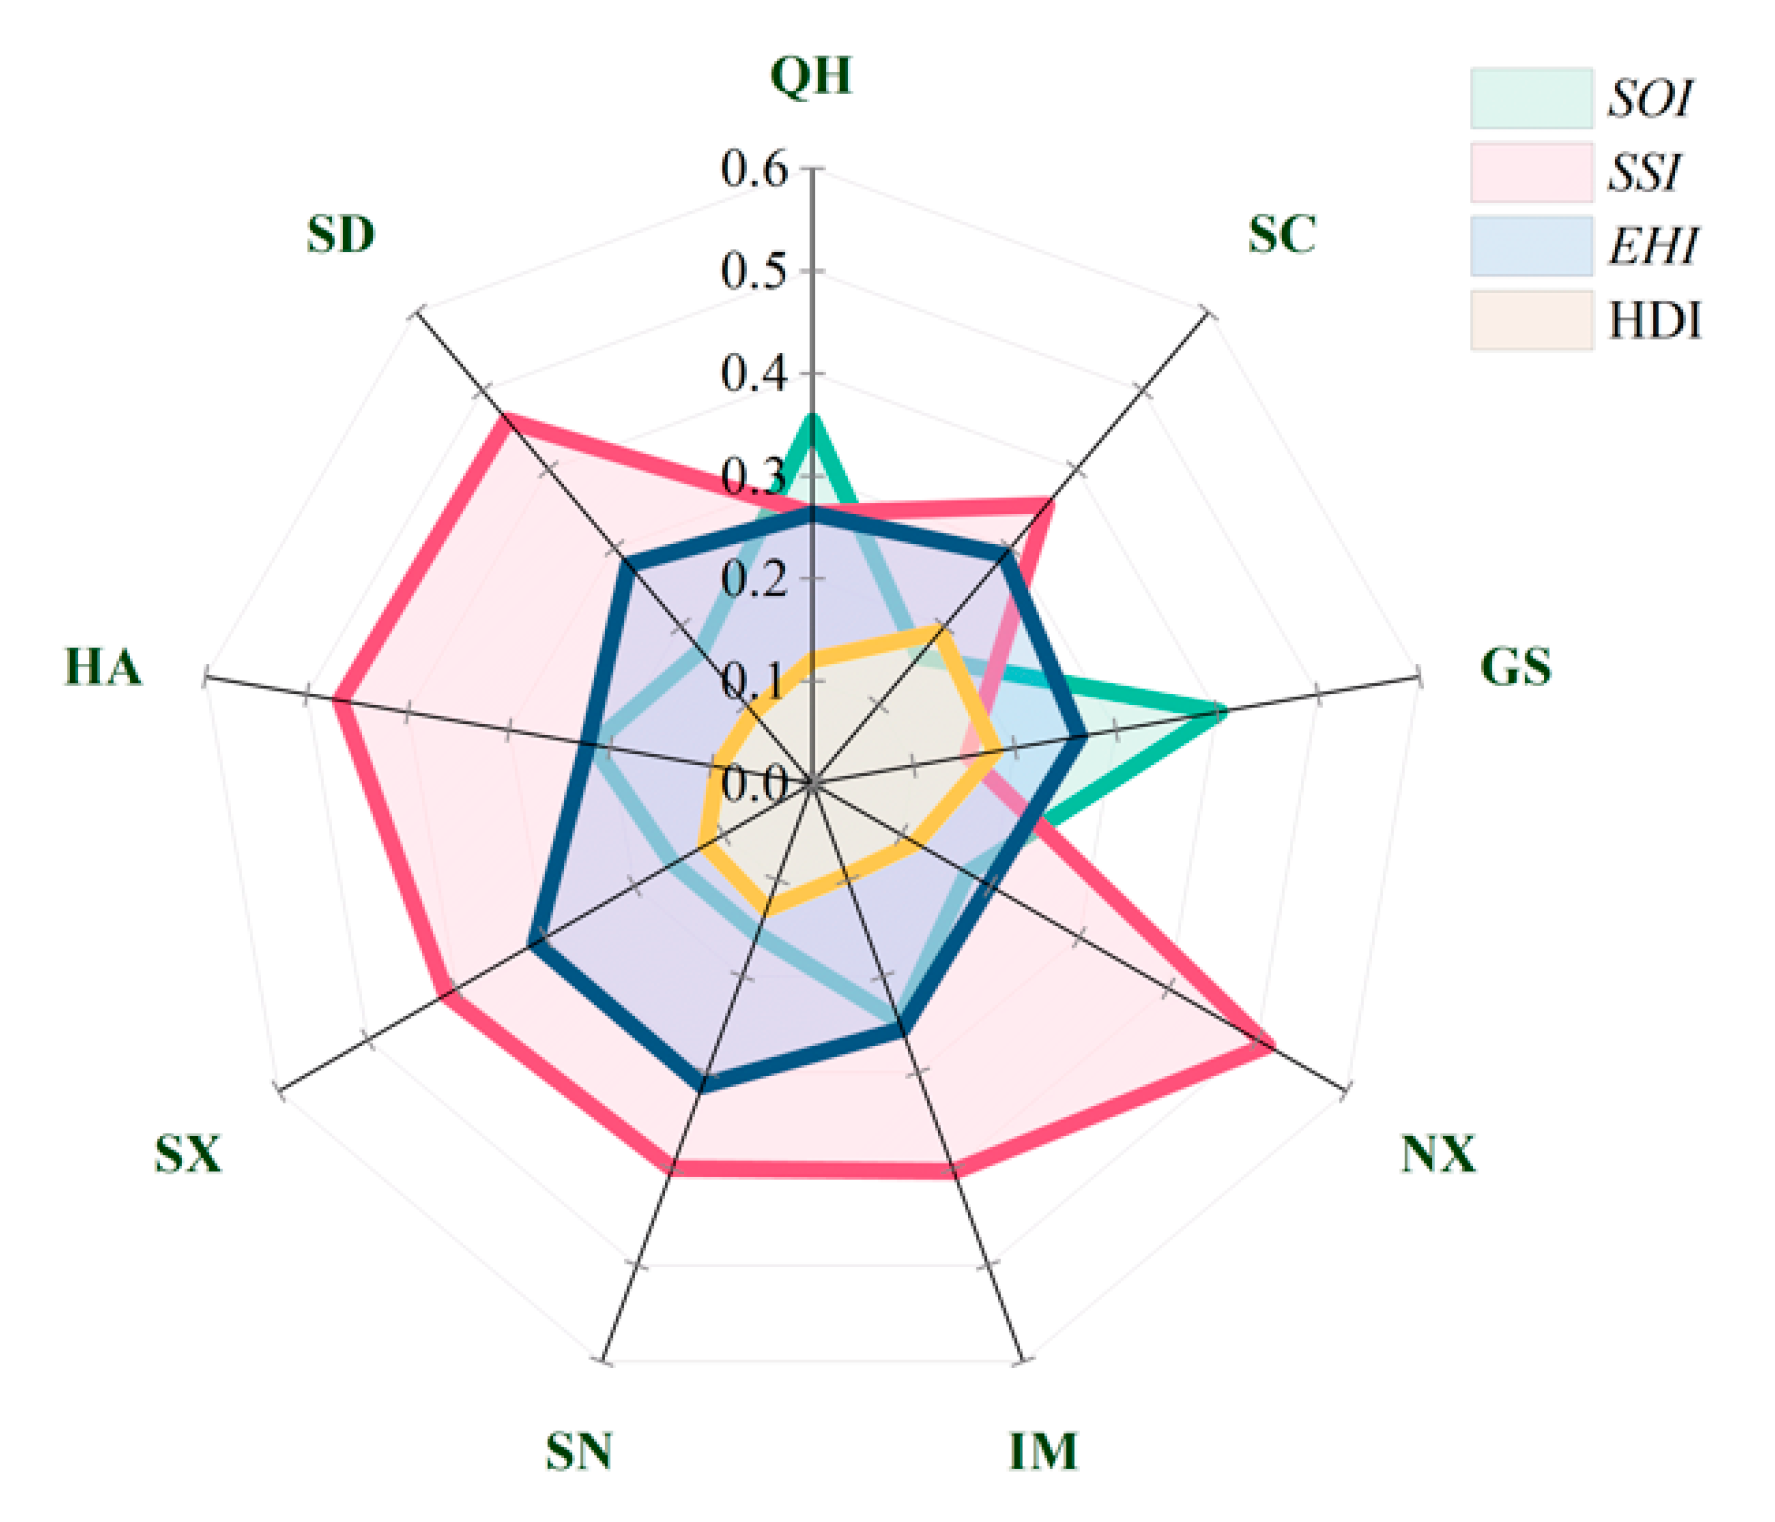
4.3. Happy River Assessment of the Yellow River at the Regional Scale
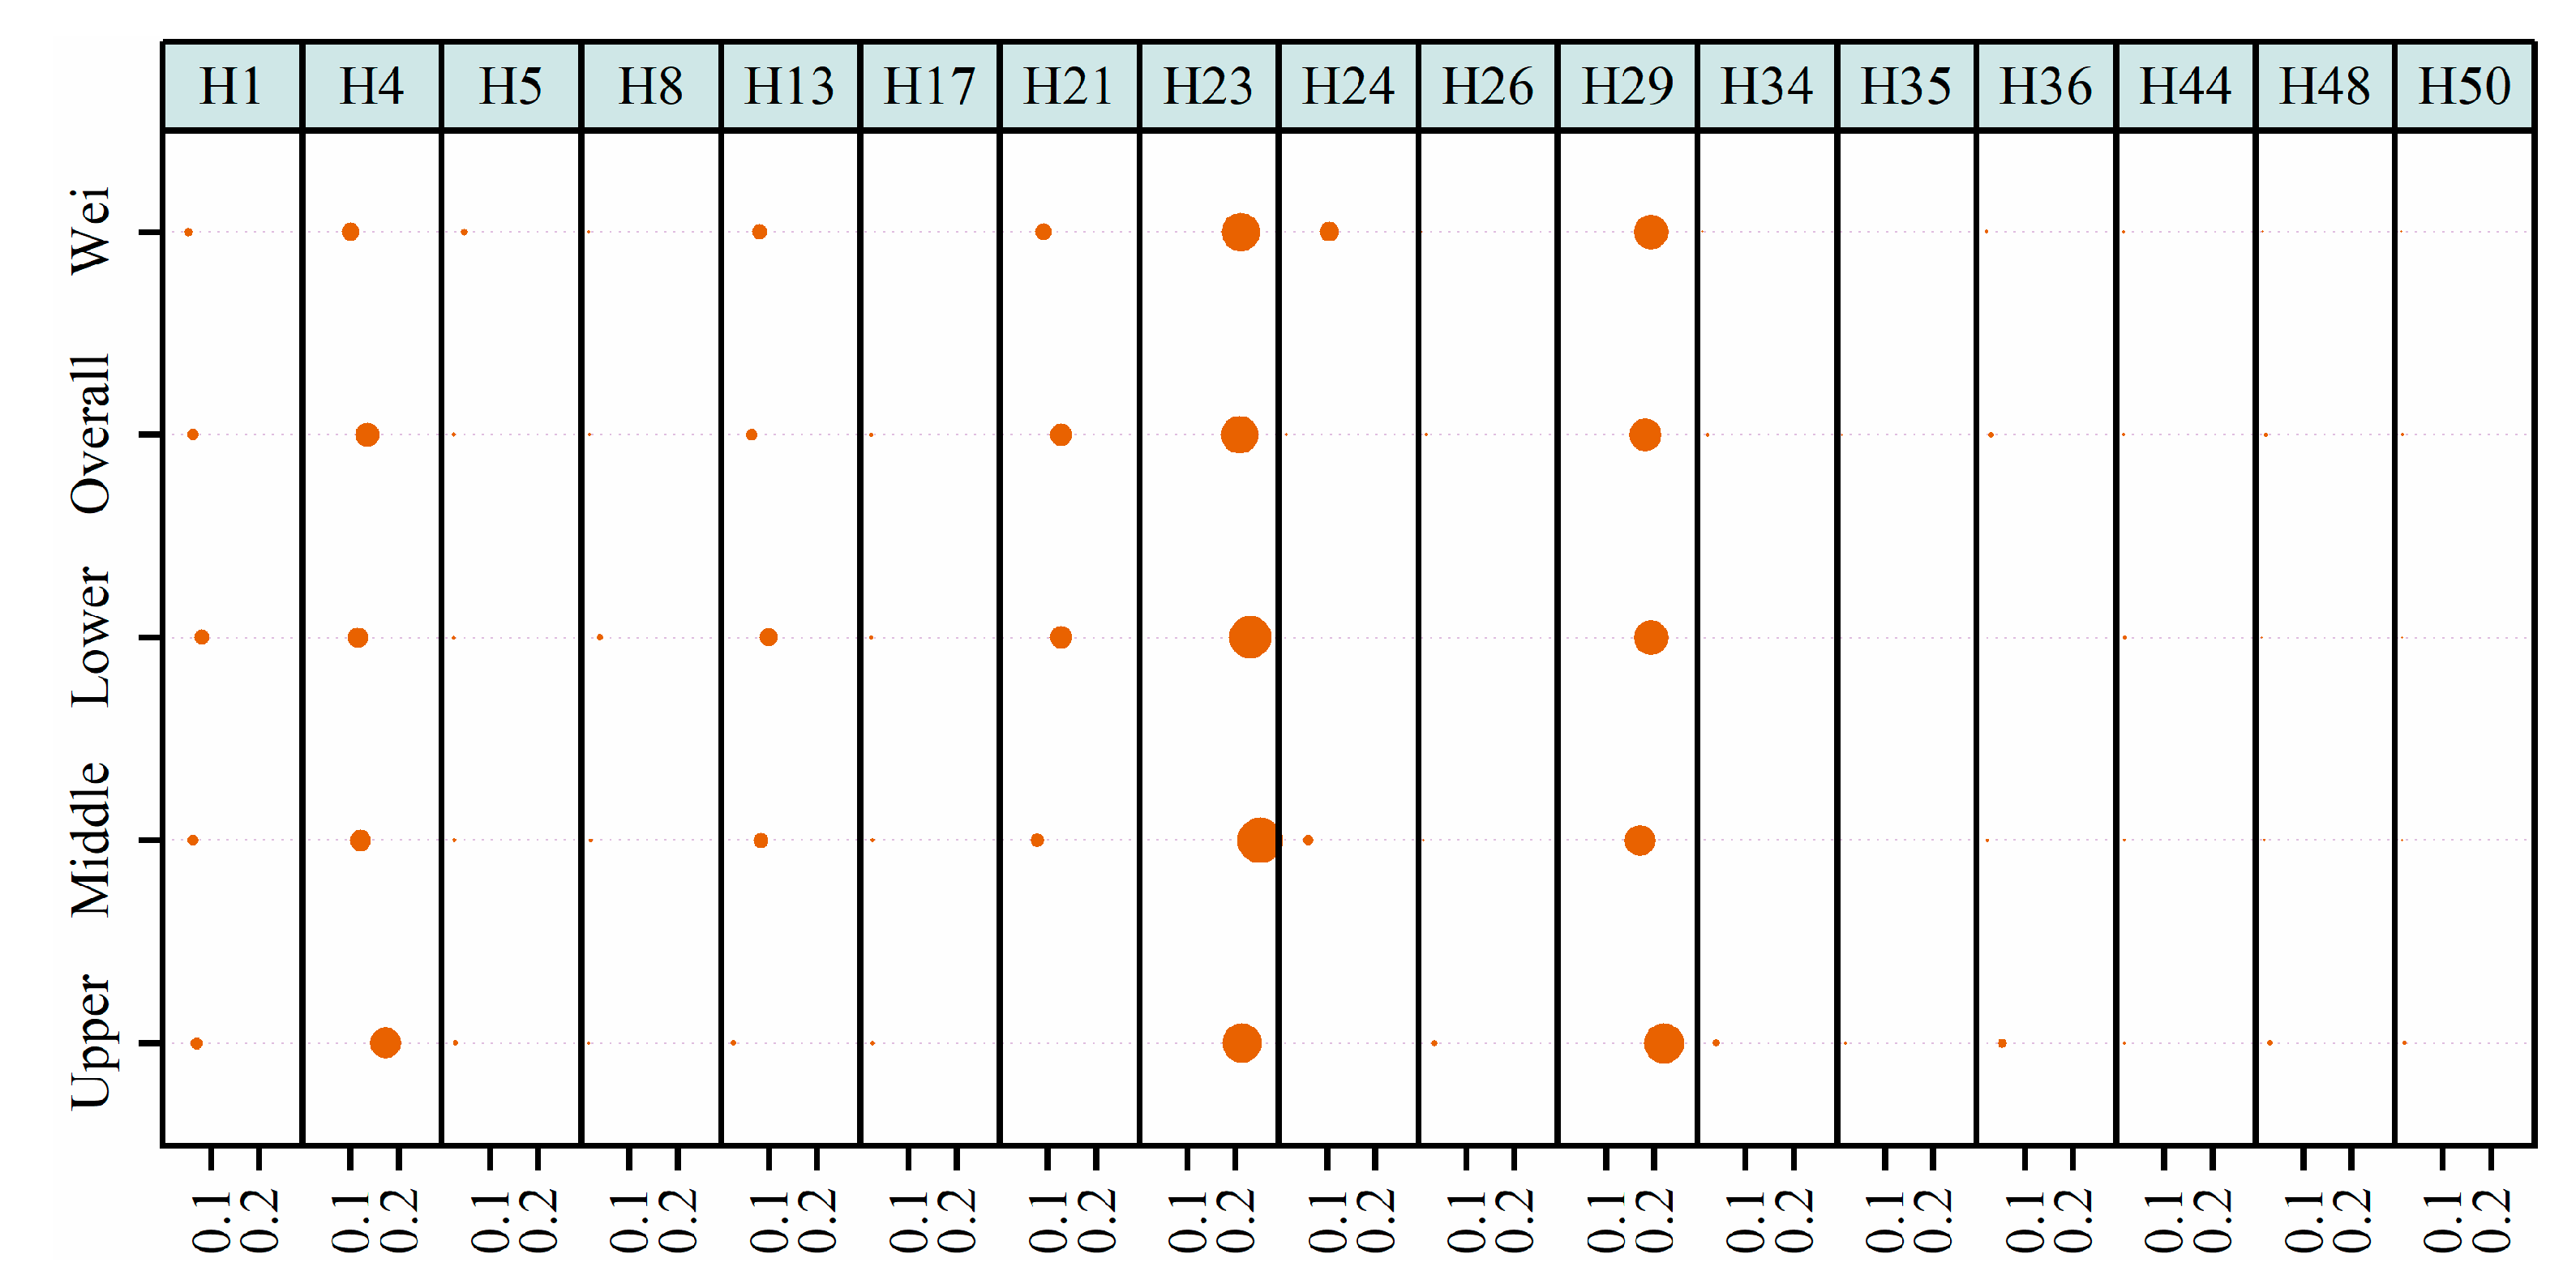
4.4. Analysis on Factors Decreasing HRI
5. Discussion
5.1. Appropriateness of Happy River Assessment Index System for Application to the Yellow River
5.2. The Overall HRI of the Yellow River
5.3. Suggestions for the Happy River Construction of the Yellow River
6. Conclusions
- (1)
- The proposed happy river assessment framework is a new perspective for evaluating river health. Compared to the existing framework, the happy river assessment framework is based on the notion that the natural river system is a sub-system of the whole river system. It is essentially an extension of river health and transcends the limitations of the traditional concept of river health, which led by the ecological environment.
- (2)
- The AHP-entropy weight method considering both subjective and objective weights, and the SMI-P method were used for the happy river assessment, which is flexible and reliable for river assessment. Even though not all indicators provided could help for the happy river assessment, this study can undoubtedly provide the decision-makers with useful information on integrated river management.
- (3)
- The assessment results showed that the overall HRI was low and the shortage of water resources was the dominant obstacle factor in the regions along the Yellow River. The HRI in Yellow River at the river-reach scale in descending order was upper, middle, and lower reach. The HRI in Sichuan was the highest at the regional scale, followed by Gansu and Shaanxi, respectively. While the lowest HRI was that in Inner Mongolia, indicating that the aim of the happy river lies not on the river health or economic development alone, but the well-being of both.
Author Contributions
Funding
Acknowledgments
Conflicts of Interest
References
- Anderson, E.P.; Jackson, S.; Tharme, R.E.; Douglas, M.; Flotemersch, J.E.; Zwarteveen, M.; Lokgariwar, C.; Montoya, M.; Wali, A.; Tipa, G.T.; et al. Understanding rivers and their social relations: A critical step to advance environmental water management. WIREs Water 2019, 6, e1381. [Google Scholar] [CrossRef] [PubMed]
- Bian, J.; Ren, H.; Liu, P. Evaluation of urban ecological well-being performance in China: A case study of 30 provincial capital cities. J. Clean Prod. 2020, 254, 120109. [Google Scholar] [CrossRef]
- Xie, Z.H. China’s historical evolution of environmental protection along with the forty years’ reform and opening-up. Environ. Sci. Ecotechnol. 2020, 1, 100001. [Google Scholar] [CrossRef]
- Babel, M.S.; Shinde, V.R.; Sharma, D.; Dang, N.M. Measuring water security: A vital step for climate change adaptation. Environ. Res. 2020, 185, 109400. [Google Scholar] [CrossRef] [PubMed]
- Habersack, H.; Hein, T.; Stanica, A.; Liska, I.; Mair, R.; Jäger, E.; Hauer, C.; Bradley, C. Challenges of river basin management: Current status of, and prospects for, the River Danube from a river engineering perspective. Sci. Total Environ. 2016, 543, 828–845. [Google Scholar] [CrossRef]
- Shi, T.; Yang, S.Y.; Zhang, W.; Zhou, Q. Coupling coordination degree measurement and spatiotemporal heterogeneity between economic development and ecological environment----Empirical evidence from tropical and subtropical regions of China. J. Clean Prod. 2020, 244, 118739. [Google Scholar] [CrossRef]
- Gimelli, F.; Rogers, B.C.; Bos, J.J. Linking water services and human well-being through the fundamental human needs framework: The case of India. Water Altern. 2019, 12, 715–733. [Google Scholar]
- Luo, P.P.; Sun, Y.T.; Wang, S.T.; Wang, S.M.; Lyu, J.Q.; Zhou, M.M.; Nakagami, K.; Takare, K.; Nover, D. Historical assessment and future sustainability challenges of Egyptian water resources management. J. Clean Prod. 2020, 263, 121154. [Google Scholar] [CrossRef]
- Keigo, N.; Klement, T.; Kunihiko, A. River and wetland restoration: Lessons from Japan. BioScience 2006, 56, 419–429. [Google Scholar]
- The European Parliament and the Council of the European Union. Directive 2000/60/EC of the European Parliament and of the Council Establishing a Framework for Community Action in the Field of Water Policy. OJEC 2000, 43, 1–72. [Google Scholar]
- Arthington, A.H.; Bhaduri, A.; Bunn, S.E.; Jackson, S.E.; Tharme, R.E.; Tickner, D.; Young, B.; Acreman, M.; Baker, N.; Capon, S.; et al. The Brisbane declaration and global action agenda on environmental flows. Front. Environ. Sci. 2018, 6, 45. [Google Scholar] [CrossRef]
- Costanza, R. Valuing natural capital and ecosystem services toward the goals of efficiency, fairness, and sustainability. Ecosyst. Serv. 2020, 43, 101096. [Google Scholar] [CrossRef]
- Sadat, M.A.; Guan, Y.Q.; Zhang, D.R.; Shao, G.W.; Cheng, X.M.; Yang, Y.J. The associations between river health and water resources management lead to the assessment of river state. Ecol. Indic. 2020, 109, 105814. [Google Scholar] [CrossRef]
- Wang, S.; Zhang, Q.; Yang, T.; Zhang, L.Q.; Li, X.P.; Chen, J. River health assessment: Proposing a comprehensive model based on physical habitat, chemical condition and biotic structure. Ecol. Indic. 2019, 103, 446–460. [Google Scholar] [CrossRef]
- Dunham, J.B.; Angermeier, P.L.; Crausbay, S.D.; Cravens, A.E.; Gosnell, H.; McEvoy, J.; Moritz, M.A.; Raheem, N.; Sanford, T. Rivers are social-ecological systems: Time to integrate human dimensions into riverscape ecology and management. WIREs Water 2018, 5, e1291. [Google Scholar] [CrossRef]
- Singh, P.K.; Saxena, S. Towards developing a river health index. Ecol. Indic. 2018, 85, 999–1011. [Google Scholar] [CrossRef]
- Raven, P.J.; Dawson, F.H.; Fox, P.J.A.; Rouen, K.J. River Habitat Quality the Physical Character of Rivers and Stream in the UK and Isle of Man, 2nd ed.; Environment Agency: Bristol, UK, 1998; pp. 1–32. [Google Scholar]
- Ladson, A.R.; White, L.J. An Index of Stream Condition: Reference Manual, 2nd ed.; Department of Natural Resources and Environment: Melbourne, Australia, 1999; pp. 1–40. [Google Scholar]
- Wright, J.F. Development and use of a system for predicting the macroinvertebrate fauna in flowing waters. Austral. Ecol. 1995, 20, 181–197. [Google Scholar] [CrossRef]
- An, K.G.; Park, S.S.; Shin, J.Y. An evaluation of a river health using the index of biological integrity along with relations to chemical and habitat conditions. Ecol. Indic. 2002, 28, 411–420. [Google Scholar] [CrossRef]
- Marzin, A.; Delaigue, O.; Logez, M.; Belliard, J.; Pont, D. Uncertainty associated with river health assessment in a varying environment: The case of a predictive fish-based index in France. Ecol. Indic. 2014, 43, 195–204. [Google Scholar] [CrossRef]
- Luo, Z.L.; Zuo, Q.T.; Shao, Q.X. A new framework for assessing river ecosystem health with consideration of human service demand. Sci. Total Environ. 2018, 640, 442–453. [Google Scholar] [CrossRef]
- Cox, B.; Sue, O.; Taffs, K. A comparison of macroinvertebrate-based indices for biological assessment of river health: A case example from the sub-tropical Richmond River Catchment in northeast New South Wales, Australia. Ecol. Indic. 2019, 106, 105479. [Google Scholar] [CrossRef]
- Ma, D.Y.; Luo, W.G.; Yang, G.L. A study on a river health assessment method based on ecological flow. Ecol. Model. 2019, 401, 144–154. [Google Scholar] [CrossRef]
- Wen, Z.Q.; Li, X.; Li, T.H. Comprehensive study on freshwater ecosystem health of Lancang River Basin in Xishuangbanna of China. Water 2020, 12, 1716. [Google Scholar] [CrossRef]
- Falkenmark, M.; Rockstroem, J. The new blue and green water paradigm: Breaking new ground for water resources planning and management. J. Water Res. Plan. Man. 2006, 132, 129–132. [Google Scholar] [CrossRef]
- Hoff, H. Global water resources and their management. Curr. Opin. Environ. Sus. 2009, 1, 141–147. [Google Scholar] [CrossRef]
- Wang, S.C. Resource-Oriented Water Management: Towards Harmonious Coexistence Between Man and Nature, 1st ed.; China Water&Power Press: Beijing, China, 2003; pp. 121–141. [Google Scholar]
- Zuo, Q.T.; Zhang, Y.; Lin, P. Index system and quantification method for human-water harmony. J. Hydraul. Eng. 2008, 39, 440–447. [Google Scholar]
- Ding, Y.F.; Tang, D.S.; Dai, H.C.; Wei, Y.H. Human-water harmony index: A new approach to assess the human water relationship. Water Resour. Manag. 2014, 28, 1061–1077. [Google Scholar] [CrossRef]
- Zhang, J.X.; Tang, D.S.; Ahmad, I.; Wamg, M. River–human harmony model to evaluate the relationship between humans and water in river basin. Curr. Sci. 2015, 109, 1130–1139. [Google Scholar] [CrossRef]
- Xi, J.P. Speech at the symposium on ecological protection and high-quality development of the Yellow River Basin. China Water Resour. 2019, 20, 1–3. [Google Scholar]
- Zuo, Q.T.; Hao, M.H.; Ma, J.X.; Tao, J. Happy river: The concept, connotation and judgement criteria. Yellow River 2020, 42, 1–5. [Google Scholar]
- Chen, M.S.; Wang, J.P.; Qiao, G.P. Understanding and Reflection on “Happy River” connotation and Evaluation System. Water Resour. Dev. Res. 2020, 20, 3–5. [Google Scholar]
- Gu, S.Z. Thoughts on the build of happy rivers and lakes. China Water 2020, 6, 13–14. [Google Scholar]
- Li, Y.; Dai, J.Y.; Fan, Z.W. The connotation of river and lake health and the management of key issues. China Water 2020, 6, 17–20. [Google Scholar]
- Tang, K.W. Reflections on “Happy River” concept and evaluation methods. China Water 2020, 6, 15–16. [Google Scholar]
- Han, Y.P.; Xia, F. Evaluation of happy river based on hierarchy of needs theory. South-to-North Water Transf. Water Sci. Technol. 2020, 18, 1–7+38. [Google Scholar]
- Ministry of Water Resources of the People’s Republic of China. National River Health Assessment Indicators, Standards and Methods; (Office Resources [2010] No. 484); General Office of the Ministry of Water Resources: Beijing, China, 2010; pp. 22–71. [Google Scholar]
- Hu, C.H.; Chen, J.G.; Sun, X.L.; Guo, Q.C. Health assessment of river course in Lower Yellow River and measures for regulation. J. Hydraul. Eng. 2008, 39, 1189–1196. [Google Scholar]
- Geng, L.H.; Liu, H.; Zhong, H.P.; Liu, C.S. Indicators and criteria for evaluation of healthy rivers. J. Hydraul. Eng. 2006, 37, 253–258. [Google Scholar]
- Ministry of Water Resources of the People’s Republic of China. Evalution Guide of Water Ecological Civilization Construction: SL/Z738-2016; China Water Conservancy and Hydropower Press: Beijing, China, 2016; pp. 3–15. [Google Scholar]
- Yang, Z.; Yang, K.; Su, L.W.; Hu, H. Two-dimensional grey cloud clustering-fuzzy entropy comprehensive assessment model for river health evaluation. Hum. Ecol. Risk Assess 2020, 26, 726–756. [Google Scholar] [CrossRef]
- Jin, J.L.; Wu, K.Y.; Wei, Y.M. Connection number based assessment model for watershed water security. J. Hydraul. Eng. 2008, 39, 401–409. [Google Scholar]
- Zhang, J.; Zhang, C.L.; Shi, W.L.; Fu, Y.C. Quantitative evaluation and optimized utilization of water resources-water environment carrying capacity based on nature-based solutions. J. Hydrol. 2019, 568, 96–107. [Google Scholar] [CrossRef]
- Zhao, Y.W.; Zhou, L.Q.; Dong, B.Q.; Dai, C. Health assessment for urban rivers based on the pressure, state and response framework-A case study of the Shiwuli River. Ecol. Indic. 2019, 99, 324–331. [Google Scholar] [CrossRef]
- Wang, X.S.; Li, X.N.; Wang, J.W. Urban water conservation evaluation based on multi-grade uncertain comprehensive evaluation method. Water Resour. Manag. 2018, 32, 417–431. [Google Scholar] [CrossRef]
- Ministry of Water Resources of the People’s Republic of China. National Lake Health Assessment Indicators, Standards and Methods, (Office Resources [2011] No. 223) [Z]; General Office of the Ministry of Water Resources: Beijing, China, 2011; pp. 24–67. [Google Scholar]
- Yu, Y.; Wang, C.; Wang, P.F.; Hou, J.; Qian, J. Assessment of multi-objective reservoir operation in the middle and lower Yangtze River based on a flow regime influenced by the Three Gorges Project. Ecol. Inform. 2017, 38, 115–125. [Google Scholar] [CrossRef]
- Tang, K.W. Discussion on concept and assessment system of aquatic ecological civilization. Water Resour. Prot. 2013, 29, 1–4. [Google Scholar]
- Zuo, Q.T.; Luo, Z.L.; Ding, X.Y. Harmonious development between socio-economy and river-lake water systems in Xiangyang City, China. Water 2016, 8, 509. [Google Scholar] [CrossRef]
- Wang, D.Y.; Huang, K.; Mo, C.X.; Wu, W.X.; Feng, S.W. Quantitative evaluation of human-water harmony in Guangxi based on comprehensive weight SMI-P method. Water Sav. Irrig. 2018, 7, 107–112. [Google Scholar]
- Luo, Z.L.; Zuo, Q.T. Evaluating the coordinated development of social economy, water, and ecology in a heavily disturbed basin based on the distributed hydrology model and the harmony theory. J. Hydrol. 2019, 574, 226–241. [Google Scholar] [CrossRef]
- Yang, T.; Zhang, Q.; Wan, X.H.; Li, X.P.; Wang, Y.Y.; Wang, W. Comprehensive ecological risk assessment for semi-arid basin based on conceptual model of risk response and improved TOPSIS model-a case study of Wei River Basin, China. Sci. Total Environ. 2020, 719, 137502. [Google Scholar] [CrossRef]
- Zhou, B.; Zhong, L.S.; Chen, T.; Zhang, A.P. Spatio-temporal pattern and obstacle factors of ecological security of tourism destination: A case of Zhejiang province. Sci. Geogr. Sin. 2015, 35, 599–607. [Google Scholar]
- Ou, Z.R.; Zhu, Q.K.; Sun, Y.Y. Regional ecological security and diagnosis of obstacle factors in underdeveloped regions: A case study in Yunnan Province, China. J. Mt. Sci. 2017, 14, 870–884. [Google Scholar] [CrossRef]
- Huang, S.Z.; Huang, Q.; Chang, J.X.; Zhu, Y.L.; Leng, X. Drought structure based on a nonparametric multivariate standardized drought index across the Yellow River basin, China. J. Hydrol. 2015, 530, 127–136. [Google Scholar] [CrossRef]
- Chen, Y.P.; Fu, B.J.; Zhao, Y.; Wang, K.B.; Zhao, M.M.; Ma, J.F.; Wu, J.H.; Xu, C.; Liu, W.G.; Wang, H. Sustainable development in the Yellow River Basin: Issues and strategies. J. Clean Prod. 2020, 263, 121223. [Google Scholar] [CrossRef]
- Tong, S.Y.; Zhou, Z.Y.; Peng, H.Y. Spatial pattern of scarcity of water and it’s shortage types in China. Ecol. Econ. 2016, 32, 168–173. [Google Scholar]
- Li, D.J.; Xu, D.Y.; Wang, Z.Y.; You, X.G.; Zhang, X.Y.; Song, A.L. The dynamics of sand-stabilization services in Inner Mongolia, China from 1981 to 2010 and its relationship with climate change and human activities. Ecol. Indic. 2018, 88, 351–360. [Google Scholar] [CrossRef]
- Gang, C.C.; Zhao, W.; Zhao, T.; Zhang, Y.; Gao, X.R.; Wen, Z.M. The impacts of land conversion and management measures on the grassland net primary productivity over the Loess Plateau, Northern China. Sci. Total Environ. 2018, 645, 827–836. [Google Scholar] [CrossRef]
- Long, X.L.; Ji, X. Economic growth quality, environmental sustainability, and social welfare in China—Provincial assessment based on genuine progress indicator (GPI). Ecol. Econ. 2019, 159, 157–176. [Google Scholar] [CrossRef]
- Liu, Y.; Zhang, Z.X.; Zhang, F.X. Challenges for water security and sustainable socio-economic development: A case study of industrial, domestic water use and pollution management in Shandong, China. Water 2019, 11, 1630. [Google Scholar] [CrossRef]


| Dimensions | Indicators | Characteristic a | Unit | Type b | Calculation | Reference |
|---|---|---|---|---|---|---|
| SOI | Security and stability of riparian zone and riverbed (H1) | + | % | B | (The length of river with safe and stable riparian and the riverbed/Total length of the river section investigated) × 100 or Expert scoring method | [39] |
| Index of connectivity status (H2) | - | /100 km | A | Number of barriers such as breakpoints or nodes (gates, dams)/Total length of the river section | [39] | |
| Requirement rate of bank-full discharge (H3) | + | % | A | (Actual bank full discharge of the river section/Critical bank full discharge under the corresponding water and sediment conditions without channel shrinkage) × 100 | [40] | |
| Change in sediment carrying capacity (H4) | - | % | A | (Sediment concentration variation in value after 10 years/Sediment concentration under the same conditions 10 years ago) × 100 | [41] | |
| Extent of variation in flow process (H5) | - | - | A | The average deviation between the monthly measured runoff and the natural monthly runoff during the assessment year | [39] | |
| The ratio of harnessed water and soil erosion area (H6) | + | % | A | (Area of soil erosion that has been treated/Total area of soil erosion) × 100 | [42] | |
| Index of hydrological regulation (H7) | + | - | A | Regulation storage capacity of various water conservancy engineering facilities in the river/The annual average total runoff of the river | [42] | |
| The flood control and drainage attainment rate (H8) | + | % | B | 1/2 × ((Length of embankment that up to the flood control standards/Length of the total planned embankment) + (Area up to the drainage standard/Total area of areas with drainage standards)) × 100 | [42] | |
| Rate of intact hydraulic engineering facilities (H9) | + | % | B | (Number of intact hydraulic engineering facilities/Total number of hydraulic engineering facilities) × 100 | [43] | |
| Rate of population affected by floods (H10) | - | % | B | (The number of people suffered by floods/Regional population) × 100 | [44] | |
| Flood losses as a percentage of gross domestic product (GDP) (H11) | - | % | A | (Economic losses caused by floods/Regional GDP) × 100 | [44] | |
| SSI | Water resources per km2 (H12) | + | 104 m3/km2 | A | Total amount of water resources/Study area | [45] |
| Water resources per capita (H13) | + | m3/per | A | Total amount of water resources/Total population | [45] | |
| Water supply guarantee rate (H14) | + | % | B | (The number of years when the water supply can meet the demand/The total years of water supply) × 100 | [41] | |
| Tap water provision coverage rate (H15) | + | % | A | (Population of the city with access to piped water supply/City population) × 100 | [42] | |
| Safety of drinking water (H16) | + | % | A | (The number of days in a year that drinking water up to the standard/365) × 100 | [41] | |
| Rate of qualified drinking water sources (H17) | + | % | B | (The number of monitored drinking water sources that up to the standards/The total number of monitored drinking water sources) × 100 | [42] | |
| Irrigation guarantee rate (H18) | + | % | A | (The number of years that the expected irrigation water consumption can be fully satisfied in the years of irrigation/The total number of years) × 100 | [41] | |
| The degree of total water consumption exceeding the standard (H19) | - | % | B | ((Actual total water consumption - the total water consumption target in Chinese “three red line strategy”)/the total water consumption target in Chinese “three red line strategy”) × 100 | [42] | |
| Groundwater over-exploitation rate (H20) | - | % | A | (The area of groundwater over-exploitation/Total regional area) × 100 | [42] | |
| Utilization ratio of water resources (H21) | ± | % | B | (Total water consumption/Multi-year average water resources) × 100 | [39] | |
| EHI | Pollution load index (H22) | - | - | A | 0.5 × (COD discharge/COD discharge target + Ammonia nitrogen discharge/Ammonia nitrogen discharge target) | [46] |
| The ratio of water functional regions with up-to-standard water quality (H23) | + | % | B | (The number of water function regions that reach the water quality standard/The total number of water function regions) × 100 | [39] | |
| Percentage of monitored river sections with water quality equal to or better than Class III (H24) | + | % | A | (The number of monitoring sections with water quality equal to or better than grade III/The total number of river monitoring sections) × 100 | [39] | |
| Compliance rate of industrial wastewater discharge (H25) | + | % | A | (Industrial wastewater standard discharge/Total industrial wastewater discharge) × 100 | [47] | |
| Concentrated treatment rate of sewage (H26) | + | % | A | (Annual municipal wastewater treatment capacity/Annual municipal wastewater production) × 100 | [47] | |
| Eutrophication status of lakes and reservoirs (H27) | - | - | A | w(chl) × TLI (chl) + w(TP) × TLI(TP) + w(TN) × TLI(TN) + w(SD) × TLI(SD) + w(COD) × TLI(COD)c | [48] | |
| Sediment pollution index (H28) | - | - | A | d | [39] | |
| Minimum ecological flow demand guarantee rate (H29) | + | % | B | (The number of months that the section flow is greater than or equal to the ecological base flow/Total statistical months) × 100 | [42] | |
| Rate of river ecological bank protection (H30) | + | % | A | (The length of the river ecological revetment that have been built/The total length of artificial revetment) × 100 | [42] | |
| Index of biological integrity (H31) | + | % | A | e | [42] | |
| Natural wetland retention rate (H32) | + | % | A | (Water surface area at the average annual water level/The total basin area) × 100 | [39] | |
| Water space ratio (H33) | + | South China, % | A | (The area carrying the function of the water body/The total area) × 100 | [42] | |
| North China, % | ||||||
| HDI | Water consumption per 10,000 Yuan RMB of GDP (H34) | + | m3/10,000 RMB | B | Water consumption of regional economic and societal development/The total GDP (unit: 10,000 Yuan RMB) | [45] |
| Water consumption per 10,000 Yuan RMB of industrial added value (H35) | + | m3/10,000 RMB | B | Industrial water consumption/Industrial GDP (unit: 10,000 Yuan RMB) | [45] | |
| Utilization coefficient of agricultural irrigation water (H36) | + | - | B | (Actual net irrigation water consumption in the field/The gross irrigation water consumption in the field) ×100 | [42] | |
| Pipe network leakage rate (H37) | - | % | A | (Water leakage from the pipe network/Total water supply) × 100 | [42] | |
| Rate of water-saving technology uptake (H38) | + | % | A | (The number of water-saving appliances used in public facilities and residents’ lives/Total number of water appliances) × 100 | [42] | |
| Repeated utilization ratio of industry water (H39) | + | % | A | (Repeated industrial water consumption/Total industrial water consumption) × 100 | [47] | |
| Hydropower resources development rate (H40) | - | % | A | (Total installed capacity of hydropower stations in the river basin/Hydropower resources that can be developed) × 100 | [49] | |
| The degree of human-water harmony (H41) | + | - | A | SMI-P | [29] | |
| Guaranteed rate of navigable water level (H42) | + | % | A | (The number of days that the water level is higher than the designed lowest navigable water level in a year/365) × 100 | [41] | |
| Landscape diversity index (H43) | + | % | A | (The number of different ecological types in the landscape/Maximum possible ecological types in the landscape) × 100 | [46] | |
| Hospitable landscape construction intensity (H44) | + | % | B | Questionnaire, Annual average construction length of the hydrophilic trail, guardrail, lighting, pavement, etc. | [46] | |
| The number of river culture carriers (H45) | + | set | A | The number of water conservancy facilities, protected areas, museums, and non-material culture, which has the function of cultural inheritance | [42] | |
| Degree of construction of water laws and regulations (H46) | + | - | A | Questionnaire | ||
| Water resources monitoring capability index (H47) | + | % | A | 1/4 × (Metering rate of water consumption + monitoring rate of water quality in water function area + monitoring rate of sewage outlet to the river + warning and forecast rate of water disaster) × 100 | [42] | |
| Degree of water culture excavation and protection (H48) | + | % | B | Questionnaire, degree of water culture protection, integration of hydraulic engineering facilities and water culture, and industrialization level of water culture were scored | [50] | |
| Public awareness of river ecological protection (H49) | + | % | A | Questionnaire, ((Number of participants in publicity and education activities related to river protection + the number of visitors to the water culture carrier)/Regional population) × 100 | ||
| Public satisfaction with the degree of the happy river (H50) | + | % | B | Questionnaire, (The number of people who are satisfied with the natural and social functions of the river/Total number of people surveyed) × 100 |
| Indicators Code | Grade | ||||
|---|---|---|---|---|---|
| I (Excellent) | II (Good) | III (Moderate) | IV (Poor) | V (Very Poor) | |
| H1 | [98,100] | [85,98) | [70,85) | [50,70) | <50 |
| H2 | [0,0.3] | (0.3,0.5] | (0.5,0.8] | (0.8,1.2] | >1.2 |
| H3 | [95,100] | [80,95) | [60,80) | [30,60) | <30 |
| H4 | [0,5] | (5,10] | (10,15] | (15,25] | >25 |
| H5 | [0,0.1] | (0.1,0.3] | (0.3,1.5] | (1.5,3.5] | (3.5,5] |
| H6 | [95,100] | [80,95) | [60,80) | [40,60) | <40 |
| H7 | ≥40 | [30,40) | [20,30) | [10,20) | <10 |
| H8 | [95,100] | [80,95) | [75,80) | [50,75) | <50 |
| H9 | [98,100] | [90,98) | [75,90) | [60,75) | <60 |
| H10 | [0,2] | (2,5] | (5,10] | (10,20] | >20 |
| H11 | [0,1] | (1,2.5] | (2.5,4] | (4,5.5] | >5.5 |
| H12 | ≥60 | [35,60) | [20,35) | [15,20) | <15 |
| H13 | ≥10,000 | [1670,10,000) | [1000,1670) | [500,1000) | <500 |
| H14 | [95,100] | [80,95) | [65,80) | [50,65) | <50 |
| H15 | [95,100] | [80,95) | [60,80) | [40,60) | <40 |
| H16 | [95,100] | [80,95) | [65,80) | [50,65) | <50 |
| H17 | [98,100] | [85,98) | [75,85) | [60,75) | <60 |
| H18 | [95,100] | [80,95) | [65,80) | [50,65) | <50 |
| H19 | ≤0 | (0, 5] | (5,10] | (10,20] | >20 |
| H20 | [0,2] | (2,10] | (10,15] | (15,20] | >20 |
| H21 | [25,30] | [20,25)(30,40] | [10,20)(40,50] | [5,10)(50,60] | <5>60 |
| H22 | [0,0.5] | (0.5,0.9] | (0.9,1.1] | (1.1,1.5] | >1.5 |
| H23 | [95,100] | [80,95) | [60,80) | [40,60) | <40 |
| H24 | [95,100] | [80,95) | [60,80) | [40,60) | <40 |
| H25 | [95,100] | [90,95) | [85,90) | [70,85) | <70 |
| H26 | [85,100] | [80,85) | [70,80) | [60–70) | <60 |
| H27 | ≤20 | (20,50] | (50,60] | (60,80] | >80 |
| H28 | [0,0.1] | (0.1,0.3] | (0.3,0.5] | (0.5,1] | >1 |
| H29 | [98,100] | [90,98) | [80,90) | [60,80) | <60 |
| H30 | [95,100] | [80,95) | [60,80) | [30,60) | <30 |
| H31 | [85,100] | [70,85) | [50,70) | [30,50) | <30 |
| H32 | [95,100] | [85,95) | [70,85) | [45,70) | <45 |
| H33 (North China) | ≥30 | [20,30) | [10,20) | [6,10) | <6 |
| H33 (South China) | ≥15 | [10,15) | [6,10) | [4,6) | <4 |
| H34 | [95,100] | [85,95) | [70,85) | [50,70) | <50 |
| H35 | [95,100] | [85,95) | [70,85) | [50,70) | <50 |
| H36 | ≥0.65 | [0.55,0.65) | [0.5,0.55) | [0.45,0.5) | <0.45 |
| H37 | ≤8 | (8,12] | (12,18] | (18,25] | >25 |
| H38 | [95,100] | [80,95) | [70,80) | [50,70) | <50 |
| H39 | [95,100] | [75,95) | [40,75) | [30,40) | <30 |
| H40 | ≤50 | (50,60] | (60,70] | (70,80] | >80 |
| H41 | [0.98,1] | [0.8,0.98) | [0.6,0.8) | [0.3,0.6) | [0,0.3) |
| H42 | [95,100] | [80,95) | [65,80) | [50,65) | <50 |
| H43 | [95,100] | [80,95) | [70,80) | [50,70) | <50 |
| H44 | [95,100] | [80,95) | [60,80) | [30,60) | <30 |
| H45 | ≥8 | [6,8) | [3,6) | [1,3) | 0 |
| H46 | [90,100] | [70,90) | [40,70) | [20,40) | <20 |
| H47 | [90,100] | [75,90) | [60,75) | [40,60) | <40 |
| H48 | [95,100] | [80,95) | [60,80) | [30,60) | <30 |
| H49 | ≥20 | [15,20) | [10,15) | [5,10) | [0,5) |
| H50 | [95,100] | [80,95) | [60,80) | [30,60) | <30 |
| HRI | Type |
| 1 | Very happy |
| [0.8,1) | Happy |
| [0.6,0.8) | Sub-happy |
| [0.4,0.6) | Medium |
| [0.2,0.4) | Sub-medium |
| (0,0.2) | Unhappy |
| 0 | Very unhappy |
Publisher’s Note: MDPI stays neutral with regard to jurisdictional claims in published maps and institutional affiliations. |
© 2020 by the authors. Licensee MDPI, Basel, Switzerland. This article is an open access article distributed under the terms and conditions of the Creative Commons Attribution (CC BY) license (http://creativecommons.org/licenses/by/4.0/).
Share and Cite
Zuo, Q.; Hao, M.; Zhang, Z.; Jiang, L. Assessment of the Happy River Index as an Integrated Index of River Health and Human Well-Being: A Case Study of the Yellow River, China. Water 2020, 12, 3064. https://doi.org/10.3390/w12113064
Zuo Q, Hao M, Zhang Z, Jiang L. Assessment of the Happy River Index as an Integrated Index of River Health and Human Well-Being: A Case Study of the Yellow River, China. Water. 2020; 12(11):3064. https://doi.org/10.3390/w12113064
Chicago/Turabian StyleZuo, Qiting, Minghui Hao, Zhizhuo Zhang, and Long Jiang. 2020. "Assessment of the Happy River Index as an Integrated Index of River Health and Human Well-Being: A Case Study of the Yellow River, China" Water 12, no. 11: 3064. https://doi.org/10.3390/w12113064
APA StyleZuo, Q., Hao, M., Zhang, Z., & Jiang, L. (2020). Assessment of the Happy River Index as an Integrated Index of River Health and Human Well-Being: A Case Study of the Yellow River, China. Water, 12(11), 3064. https://doi.org/10.3390/w12113064