Article

Resilience of Micropollutant and Biological Effect Removal in an Aerated Horizontal Flow Treatment Wetland

by
Nadine A. Sossalla
1,2,*,
Jaime Nivala
3,
Beate I. Escher
4,5,
Thorsten Reemtsma
6,7,
Rita Schlichting
4,
Manfred van Afferden
1 and
Roland A. Müller
1
1
Centre for Environmental Biotechnology, Helmholtz Centre for Environmental Research (UFZ), Permoserstrasse 15, 04318 Leipzig, Germany
2
Faculty of Environmental Science, Dresden University of Technology, Helmholtzstraße 10, 01069 Dresden, Germany
3
Research Unit REVERSAAL, French National Research Institute for Agriculture, Food and Environment (INRAE), 5 rue de la Doua, CS 20244, 69625 Villeurbanne CEDEX, France
4
Department of Cell Toxicology, Helmholtz Centre for Environmental Research (UFZ), Permoserstrasse 15, 04318 Leipzig, Germany
5
Center for Applied Geoscience, Eberhard Karls University Tübingen, Schnarrenburgstraße 94-96, 72076 Tübingen, Germany
6
Department of Analytical Chemistry, Helmholtz Centre for Environmental Research (UFZ), Permoserstrasse 15, 04318 Leipzig, Germany
7
Institute of Analytical Chemistry, University of Leipzig, Linnéstrasse 3, 04103 Leipzig, Germany
*
Author to whom correspondence should be addressed.
Water 2020, 12(11), 3050; https://doi.org/10.3390/w12113050
Submission received: 29 September 2020 / Revised: 25 October 2020 / Accepted: 27 October 2020 / Published: 30 October 2020

Abstract

:
The performance of an aerated horizontal subsurface flow treatment wetland was investigated before, during and after a simulated aeration failure. Conventional wastewater parameters (e.g., carbonaceous biological oxygen demand, total nitrogen, and Escherichia coli) as well as selected micropollutants (caffeine, ibuprofen, naproxen, benzotriazole, diclofenac, acesulfame, and carbamazepine) were investigated. Furthermore, the removal of biological effects was investigated using in vitro bioassays. The six bioassays selected covered environmentally relevant endpoints (indicative of activation of aryl hydrocarbon receptor, AhR; binding to the peroxisome proliferator-activated receptor gamma, PPARγ; activation of estrogen receptor alpha, ERα; activation of glucocorticoid receptor, GR; oxidative stress response, AREc32; combined algae test, CAT). During the aeration interruption phase, the water quality deteriorated to a degree comparable to that of a conventional (non-aerated) horizontal subsurface flow wetland. After the end of the aeration interruption, the analytical and biological parameters investigated recovered at different time periods until their initial treatment performance. Treatment efficacy for conventional parameters was recovered within a few days, but no complete recovery of treatment efficacy could be observed for bioassays AhR, AREc32 and CAT in the 21 days following re-start of the aeration system. Furthermore, the removal efficacy along the flow path for most of the chemicals and bioassays recovered as it was observed in the baseline phase. Only for the activation of AhR and AREc32 there was a shift of the internal treatment profile from 12.5% to 25% (AhR) and 50% (AREc32) of the fractional length.

1. Introduction

Treatment wetlands are a nature-based solution that is often used for domestic wastewater treatment in small communities. Treatment wetlands are advantageous compared to other decentralized wastewater treatment technologies because they are robust, have low operation costs and can be built from regionally available materials [1].
Treatment wetland design options range from passive to intensified wetlands [2]. Traditional (passive) subsurface flow wetlands are typically classified into either horizontal flow (HF) or vertical flow (VF) [3]. Fonder and Headley [4] define intensification of treatment wetlands as physicochemical amendments (sorptive media and chemical dosing), additional operational effort or complexity (frequent plant harvesting, cyclical resting, recirculation of flow) and/or increased power consumption (for aeration and pumping). One of the benefits intensified wetland technologies offer is that they have a small area requirement compared to conventional treatment wetland designs [5], as well a higher treatment efficacy for many macro-pollutants such as nitrogen, carbon and bacterial contaminants such as Escherichia coli (E. coli) [6]. More recently, intensified wetlands have also been shown to be effective for removal of micropollutants [7,8] and biological effects [9].
The terms “organic micropollutants” or “contaminants of emerging concern” (CEC) encompass anthropogenic chemicals such as personal care products, industrial chemicals, pesticides, hormones, and pharmaceuticals. They are present in the environment at low concentrations (microgram to pictogram) [3,10]. Direct and indirect release of micropollutants into the environment can result in complex mixtures of chemicals that could cause negative effects on the environment and/or human health [11,12]. In order to minimize the environmental risks associated with treated wastewater, reliable and robust treatment performance is essential. Over the last two decades, research on the ability of treatment wetlands to remove micropollutants has increased significantly [13]. Design, environmental conditions, and operational conditions influence the micropollutant removal in treatment wetlands [8,12,14,15,16]. Biodegradation is known as primary removal pathway for many pollutants in treatment wetlands [12,17,18]. Some micropollutants, however, such as triclosan, clofibric acid, and carbamazepine, are known to be recalcitrant in biological wastewater treatment systems [12,18,19]. The increasing number of micropollutants in use leads to a greater release into the environment, and thus to a greater number of contaminants which can be detected in the environment.
To analyze a water sample for every individual micropollutant is unpractical and extremely costly [18]. Thus, the use of “indicator substances”, which cover groups of chemicals that span a range of biodegradability (recalcitrant, moderate biodegradable, and readily biodegradable) was suggested by Jekel et al. [18]. Kahl et al. [8] applied this approach to a year-long study on six treatment wetlands in Germany. Seven indicator compounds were selected based on their biodegradability (listed according to decreasing biodegradability): caffeine (CAF), ibuprofen (IBU), naproxen (NPX), benzotriazole (BTZ), diclofenac (DCL), acesulfame (ACE), and carbamazepine (CBZ).
In their review, Ilyas et al. [16] compiled information of 66 peer-reviewed journal publications on micropollutants removal treatment systems (e.g., horizontal flow, vertical flow, hybrid; lab, pilot, and full-scale applications; aerated, and non-aerated). On average, high removal efficiencies for CAF (80%), NPX (62%) and IBU (57%) were reported. In contrast, DCL (an analgesic/anti-inflammatory drug), which is listed as candidate contaminants by the European Union, has a removal efficiency of 38%. In a one-year study, Nivala et al. [20] observed 50% removal efficiency at a municipal wastewater treatment plant and 0% to 62% removal efficiency for treatment wetlands (depending on system design) for DCL. Wagner et al. [21] also observed a moderate removal during wastewater treatment for BTZ (38%) in a horizontal subsurface flow constructed wetland. The removal efficiency of CBZ was reported with 22% in previous studies [16].
While chemical analysis quantifies the concentrations of individual compounds, here bioassays are a novel and promising tool that assess the overall effect of all active pollutants in a water sample [22]. By this, not only target chemicals are detected, but also unknown compounds and transformation products with the same mode of action, even if they are below their analytical detection limits [23]. Although the components may be present in very low concentrations, they can still contribute to mixture effects. In the “European technical report” Wernersson et al. [24] defined in-vitro bioassays as bioanalytical tools on cellular basis, which measure effects at the subcellular level. Effects at subcellular levels can include induction of xenobiotic metabolism, receptor-mediated effects, adaptive stress responses, and cytotoxicity [22]. In the current study, a set of five bioassays was applied to quantify the mixture effects. The selection of the bioassay battery was done according to the recommendation of a proof-of-concept-study by Nivala et al. [9]. The test battery includes bioassays indicative of: xenobiotic metabolism (activation of aryl hydrocarbon receptor, AhR; binding to the peroxisome proliferator-activated receptor gamma, PPARγ), hormonal activity (activation of the estrogen receptor alpha, ERα; activation of the glucocorticoid receptor, GR) and adaptive stress response targeting the oxidative stress response pathway (AREc32) mediated by the transcription factor Nrf2. Furthermore, the combined algae test (CAT) was included to detect inhibition of algal growth rate and photosynthesis with pulse-amplitude modulated fluorometry because the CAT is very responsive to herbicides, which also often show poor removal during conventional treatment [25].
While aerated horizontal subsurface flow wetlands exhibit a higher removal efficacy for micropollutants than conventional horizontal flow and vertical flow treatment wetland systems [10], they are more susceptible to technical disturbance, for example by power disruption or failure of the air pump. Resilience of a treatment wetland has been defined as the ability of a system to achieve stable treatment performance during or after a disturbance [26]. Previous studies focused on resilience of treatment wetlands to operational malfunctions, organic carbon removal or nitrogen removal [26,27,28]. The current study investigated the resilience of CEC removal and removal of biological effects (as determined with bioassays) against aeration interruption in a horizontal subsurface flow aerated constructed wetland.

2. Materials and Methods

2.1. Site and System Description

The study took place at a research platform located in Langenreichenbach, Germany. The research platform is located adjacent to a municipal wastewater treatment plant (population equivalent 16,000 PE). For the research site, raw wastewater was pre-treated in a two-chamber septic tank with a nominal hydraulic retention time (nHRT) of approximately two days. The effluent of the septic tank served as influent of the treatment wetland. The wetland received approximately 12 L of wastewater every 30 min throughout the course of the study for a daily inflow rate of 578 L/d.
The investigated treatment system is a saturated horizontal subsurface flow treatment wetland (HA). The system is unplanted. It started operation in June 2010, was run with a windmill-powered air pump between August 2012 and July 2014 [29], and was switched back to continuous aeration in 2014. The system has a surface area of 6.2 m2, a saturated depth of 1.0 m and was continuously aerated (24 h/d) by two pumps (one in the first half: 1.2 m3/h; one in the second half: 1.0 m3/h; Mistral 2000, Aqua Medic).

2.2. Experimental Design

The study was carried out in summer for seven weeks (July–August 2019). Water samples were collected for a three-week baseline, a six-day interruption of aeration phase, a three-day recovery phase, followed by a three-week recovered-baseline phase to assess the full recovery after the disturbance. During the first and last three weeks grab sampling of the influent (IN), internal (12.5%, 25%, 50%, and 75% of the fractional length, depth of 50 cm) and effluent (OUT) of HA was done by hand once a week. Through the interruption of aeration and recovery phase grab samples were taken every day (Table 1). To obtain the internal samples, a stainless-steel piezometer and a peristaltic pump was used. The location of the internal sampling tees is shown in Figure S1. The samples for water quality analysis and micropollutant analyses were collected in 500 mL clear glass bottles. The samples for bioassays were collected in 250 mL clear glass bottles (cleaned beforehand with methanol, ethylacetate, and LC-MS grade water) and stabilized for transportation with 6 M hydrochloric acid to pH 2.

2.3. Water Quality Analysis

Onsite field water temperature (T), pH and oxidation reduction potential (ORP) (SenTix® ORP sensor), electrical conductivity (EC) and dissolved oxygen (DO) (ConOx®, WTW Weilheim) were measured by using handheld meter (WTW Multi 350i Multimeter) and pH meter (WTW pH 96 m). Total Organic Carbon (TOC) was analyzed according to DIN EN 1484 with a TOC-VCSN device (Shimadzu, Duisburg, Germany), Total Nitrogen (TN) according to DIN EN 12260 with a TNM-1 module. Nitrate nitrogen (NO3-N), nitrite nitrogen (NO2-N), and ammonia nitrogen (NH4-N) were determined according to DIN EN ISO 13395, DIN EN 26777, and DIN 38406 E5, respectively by Eppendorf EPOS ANALYZER 5060. Total Suspended Solids (TSS) were analyzed according to DIN 38409 H2-3, Carbonaceous Biochemical Oxygen Demand (CBOD5) according to DIN 38409 H52 by an OxiTop device (WTW Weilheim, Germany). Escherichia coli (E. coli) were determined with the IDEXX Colilert-18 test (IDEXX, Lenexa, KS, USA) according to manufacturer’s specifications (ISO 11133:2014). All samples were analyzed within 24 h.

2.4. Chemical Analysis

Seven indicator substances were analyzed: common pharmaceuticals (ibuprofen, naproxen, diclofenac, and carbamazepine), a corrosion inhibitor (benzotriazole), an artificial sweetener (acesulfame), and a stimulant (caffeine). In brief, samples were filtered (Syringe filters, ProFill, 0.45 µm, LABSOLUTE®) and stored by −18 °C till analysis. Samples were then spiked with isotope-labelled internal standards and the analysis was carried out using high performance liquid chromatography tandem mass spectrometry (HPLC-MS/MS, Agilent 1260 Infinity series HPLC system, Agilent Technologies, Waldbronn, Germany) by direct injection [8]. For a comprehensive description of the choice, biodegradability, and analytical determination the reader is referred to Kahl et al. [8]. Analytical limits of detection (LOD) are given in Table S1.

2.5. Bioanalysis

Within 24 h of collection, all samples were filtered (GF-Mikrofilter Sorte GF/F, 0.7 µm) before enrichment using by an automatic solid phase extraction system (SmartPrep® II Extractor, Biotage Sweden AB, Uppsala, Sweden). Cartridges (Chromabond® HR-X, 200 mg, Macherey Nagel, Düren, Germany) were each preconditioned with 10 mL ethylacetate (CHEMSOLUTE®, Th. Geyer GmbH & Co KG, Hamburg), methanol (CHEMSOLUTE®, Th. Geyer GmbH & Co KG, Hamburg), and LC-MS grade water (OPTIMA LC-MS WATER, Fisher Scientific GmbH, Schwerte/Geisecke), dried gently under nitrogen stream before the elution was done. Elution took place with 10 mL ethylacetate and 10 mL methanol. The extracts were evaporated under a gentle nitrogen stream and finally resuspended in 1 mL methanol. Final extracts were stored at –18 °C until the bioassays were performed. All cell-based bioassays were applied to quantify the mixture effects using the method described by König et al. [11], Neale et al. [30], and Glauch & Escher [31] and are summarized in Table 2. The chosen bioassay battery combines a set of indicator bioassays which cover three different stages of the cellular toxicity pathway. To indicate xenobiotic metabolism two bioassays were used: AhR CALUX (activation of the aryl hydrocarbon receptor; AhR) and PPARɣ-GeneBLAzer (binding to the peroxisome proliferator-activated receptor gamma; PPARɣ). Hormonal activity was covered by the two bioassays indicative of activation of the estrogen receptor (ERα-GeneBLAzer; ERα) and glucocorticoid receptor (GR-GeneBLAzer; GR). Oxidative stress response was evaluated with AREc32. Algal growth and photosynthesis inhibition could be differentiated with combined algae test (CAT), measured with a Maxi-Imaging PAM (IPAM, Maxi-Imaging Pulse-Modulated Fluorometer). The effect concentrations (ECs) listed in Table 2 were determined in the present study and are consistent with previous work.

2.6. Data Evaluation

Micropollutant removal was calculated according to Equation (1), according to influent concentration (Cin) and effluent concentration (Cout). The effect concentration EC10 are concentrations causing 10% of the maximum effect in assays indicative of xenobiotic metabolism and receptor-mediated effects. For the oxidative stress response, the concentration causing an induction ratio of 1.5 was used to calculate ECIR1.5. To be able to compare the measured effects, the bioanalytical equivalent concentration (BEQ) was calculated by dividing the EC value of the reference compound (ECref) by the EC of the sample (ECsample) (Equation (2)). The BEQ is to be understood as an equivalent concentration of a complex mixture expressed as the concentration of a well-known reference substance which triggers the same level of effect [9,34]. Furthermore, by using the BEQ from the influent (BEQin) and the effluent (BEQout) the removal efficacy was calculated according to Equation (3). For a more comprehensive description of the data evaluation the reader is referred to Kahl et al. [8] for the micropollutants data analysis and to Escher et al. [34] and Glauch and Escher [31] for bioassay data evaluation.
Concentration   Percent   Removal   ( % ) = C in C out C in × 100
BEQ = EC 10 ( reference ) EC 10 ( sample )   or   EC IR 1.5 ( reference ) EC IR 1.5 ( sample )
BEQ   Removal   ( % ) = BEQ in BEQ out BEQ in × 100
All steps were conducted in the software environment of, Microsoft Excel 2010, GraphPad Prism (Version 8.4.3) and KNIME (Version 4.1.3). Outliers were identified by visual inspections and excluded from further analysis.
The removal efficacies and standard deviations for all parameters were calculated for the baseline phase. After the aeration was switched back on, the removal efficacies (based on inlet–outlet grab samples for a particular day) were compared to the baseline values. If the removal efficacy for a given pollutant or parameter was in the same range as the baseline phase (mean ± one standard deviation), the removal was considered “recovered”.

3. Results and Discussion

3.1. Weather Condition, Inflow Pollutant Concentrations, and Flow

The mean inflow during the experiment was 578 L/d, the mean outflow 576 L/d. Two heavy precipitation events (20 mm/d) took place on Day 15 (one day after the air was interrupted) and Day 18 (on the fourth day during the air interruption). Further precipitation occurred on Day 3 (1 mm/d), Day 4 (9 mm/d), Days 22 and 24 (each 2 mm/d), Day 33 (5 mm/d), and Day 35 (3 mm/d). Average influent water temperature was 21.9 ± 1.2 °C.
Conventional water quality parameters for the influent wastewater are provided in Table 3. The characteristic of the influent water quality corresponds with the typical characteristics of primary treated domestic wastewater: high EC (2008 µS/cm), high CBOD5 (341 mg/L), high TN (99 mg/L) and TOC (185 mg/L), and high E. coli (6.45 × 10⁶ MPN/100 mL) as well as low concentrations of DO (0.4 mg/L) and a low ORP (−269 mV).

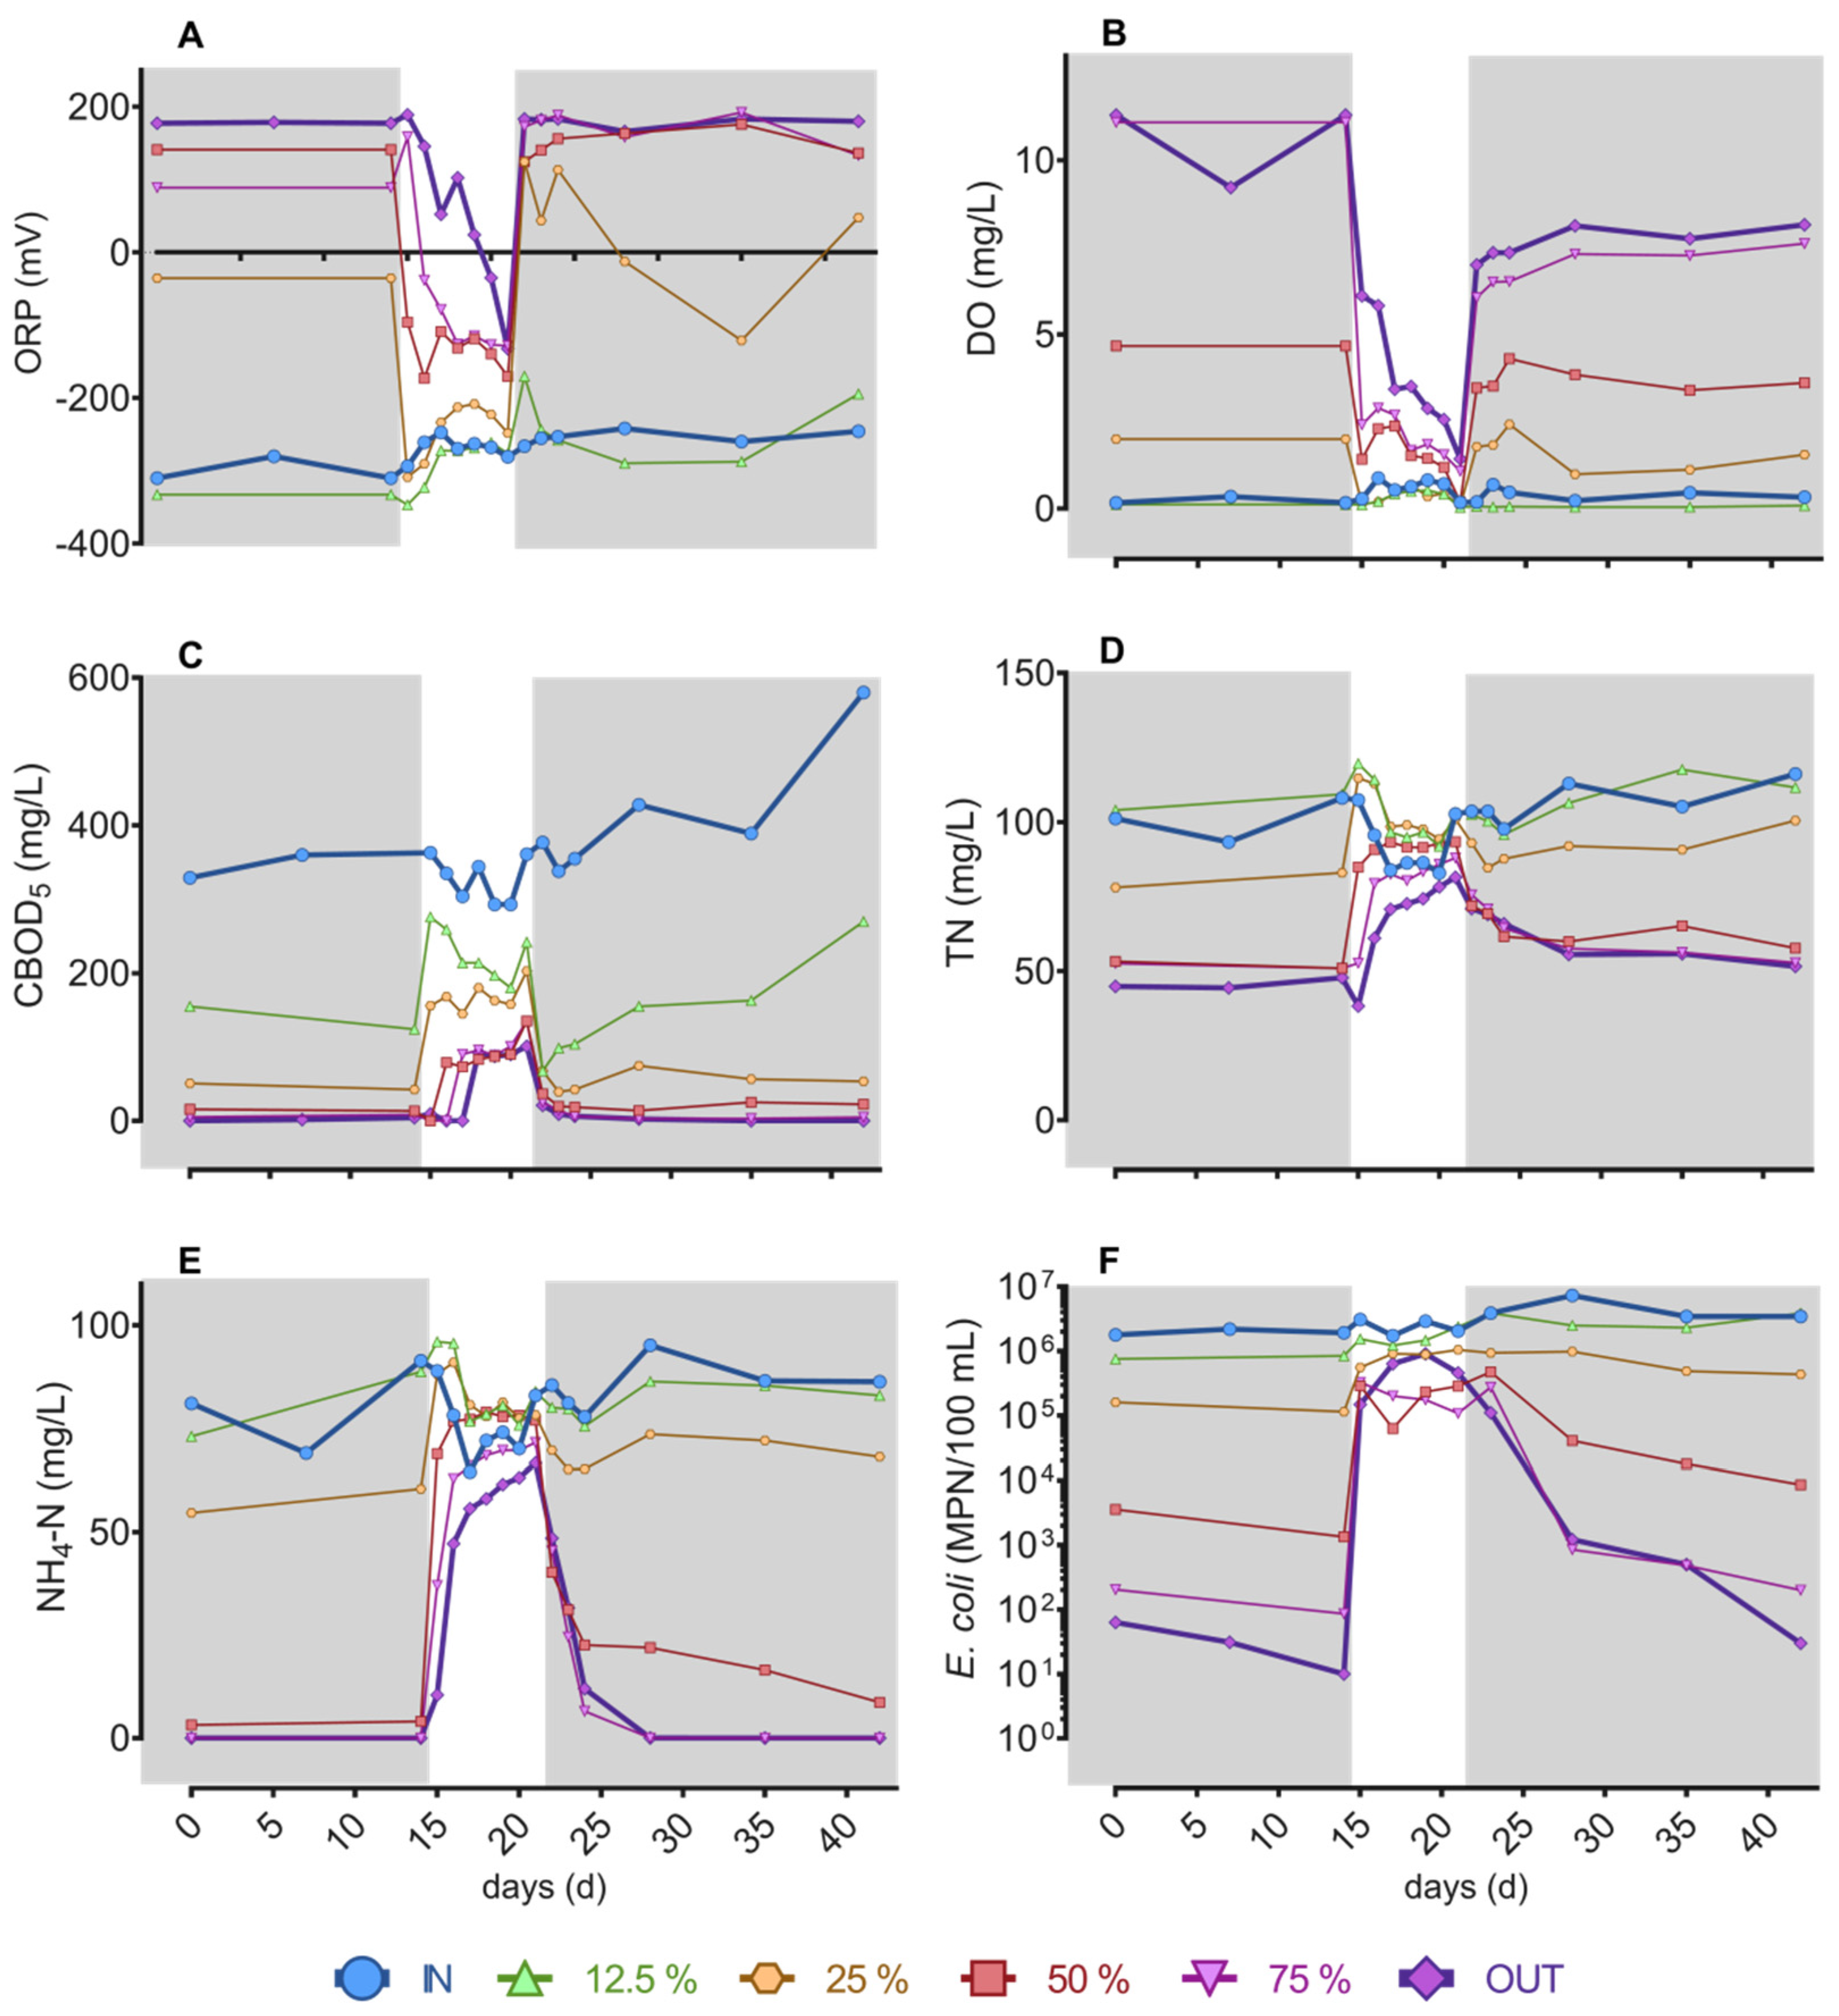
3.2. Conventional Parameters and Pollutants

Selected conventional water quality parameters and pollutants are presented in Figure 1. The detailed dataset of conventional wastewater parameters of the internal profile and effluent of HA is summarized in Figure S2. During the baseline phase, ORP and DO (Figure 1A,B) increased along the fractional length of the wetland. Whereas concentrations of CBOD5, TN, NH4-N, and E. coli decreased along the direction of flow (Figure 1C–F). Ilyas & Masih [35] compared different intensifications of horizontal flow constructed wetlands and exposed that aerated horizontal flow constructed wetlands effluents are characterized by a high treatment performance with regard to COD, NH4-N, and TN, as well as a high DO concentration. Thus, the effluent characteristics during the baseline phase (Days 0–14) of the current study were in the same range as in previous studies summarized in the review of Ilyas & Masih [35].
As soon as the aeration was switched off (Day 14), the internal and effluent values of ORP, DO (Figure 1A,B), and NO3-N decreased (Figure S2). At the same time, internal and effluent concentrations for CBOD5, TN, NH4-N, and E. coli (Figure 1C–F) and IC, DOC, DN, DIC, and EC (Figure S2) increased to levels typically observed for passive (non-aerated) horizontal flow systems [6]. After restarting the aeration on Day 21, the baseline water quality recovered for most of the conventional wastewater parameters within eight days. For pH (Figure S2), a maximum of 8.0 was observed (Day 22). A new equilibrium situation between CO2, CO 3 2 , and HCO 3 might explain this peak in pH [26]. The previously accumulated CO2 might have been removed by switching on the aeration of the system. This would change the carbonate balance (higher HCO 3 concentration). However, when nitrification was resumed, the pH returned to its previous value of approximately 6.8 after three days.
The mean of the inflow concentration of E. coli was 6.45 ± 0.19 × 10⁶ MPN/100 mL. The effluent E. coli concentrations in HA increased immediately after switching off the aeration. After the interruption of aeration phase, E. coli concentrations returned to baseline within 22 days (Figure 1F). Main factors responsible for E. coli removal in subsurface flow constructed wetlands include physical mechanisms (mechanical filtration, sedimentation, and sorption to organic matter), biological mechanisms (retention in biofilms, natural die-off, and competition for limiting nutrients) and chemical mechanisms such as oxidation [36,37]. During the non-aerated phase, several factors together led to an increase in E. coli concentrations. Firstly, the water composition changed in terms of organic concentration and nutrients availability. Here, a significant increase was observed, which provides more ideal growth conditions for E. coli [37]. Furthermore, it is possible that the lack of DO could have led to a decrease in bacterial die-off.
A previous study showed a correlation between DO and bacterial die-off [37]. One possibility is that the lack of aeration led to an adsorption to biofilms and sedimentation within the basin in so-called “dead corners” and a regrowth of E. coli took place. When the aeration was reactivated, it can be possible that the settled particles were partially remobilized, suspended, and rinsed out. Furthermore, the organic and nitrogen availability decreased within a few days, which (in addition to the DO increase) maybe could led to the die-off of the bacteria.

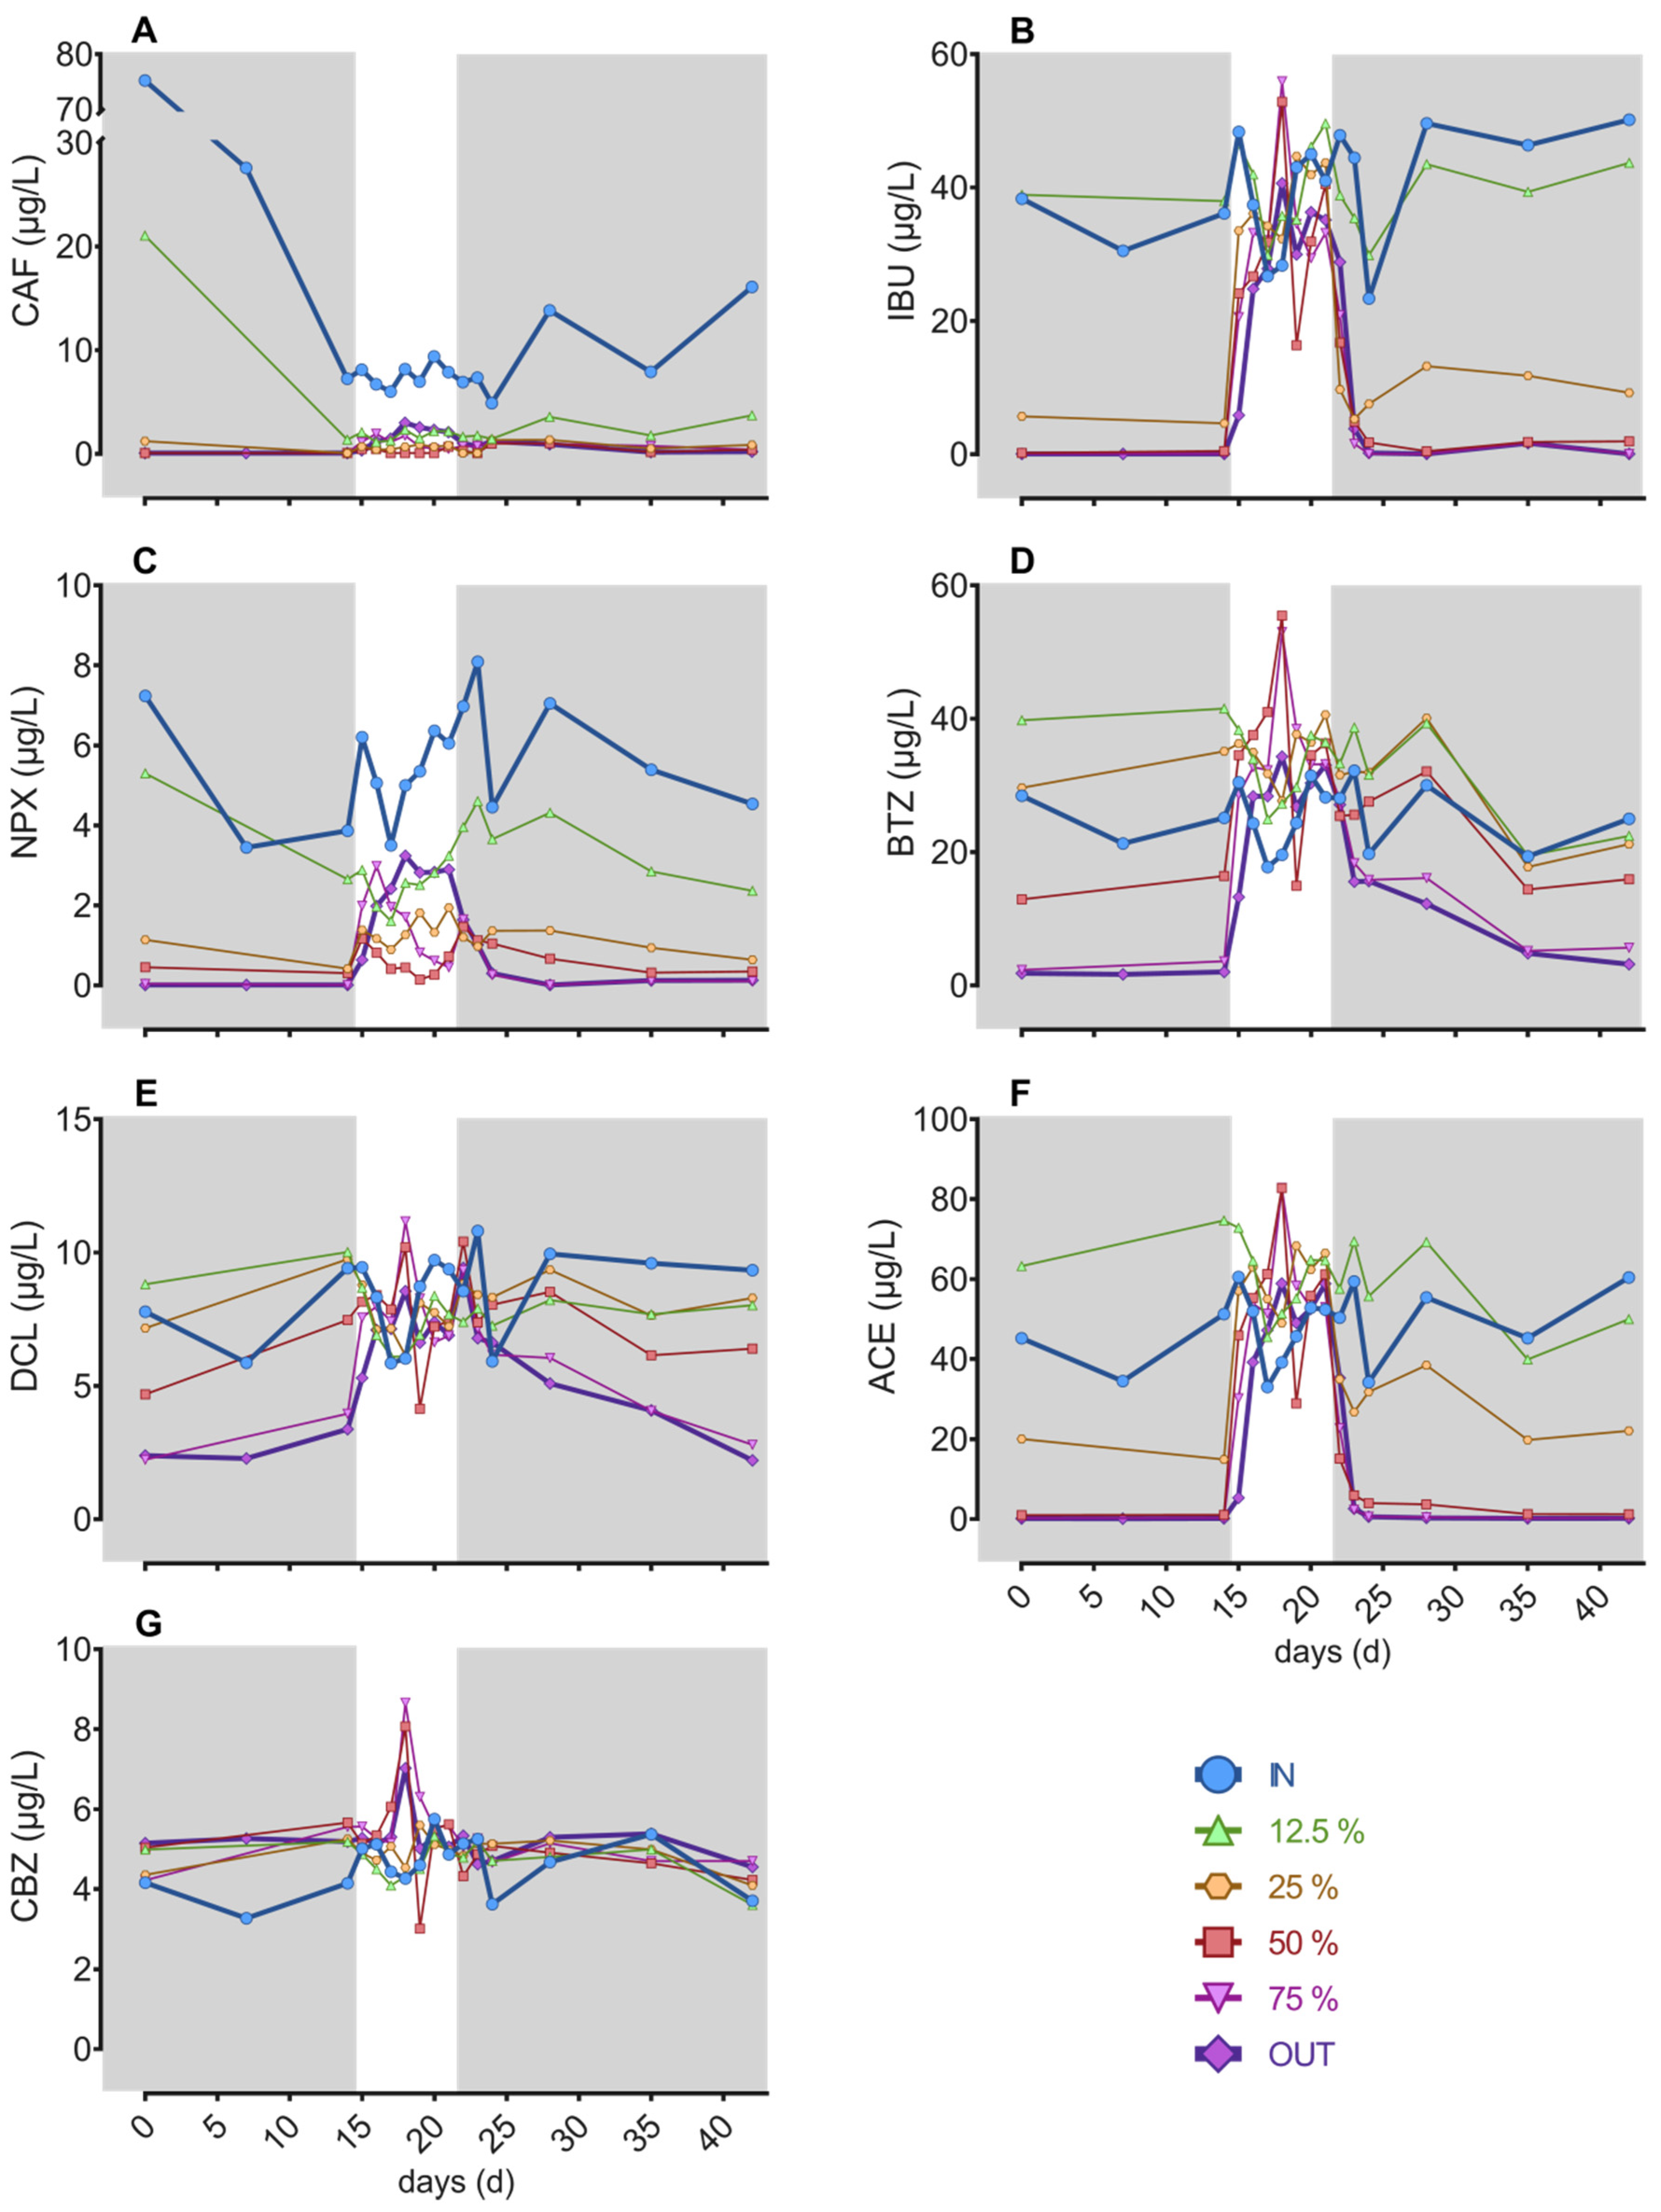
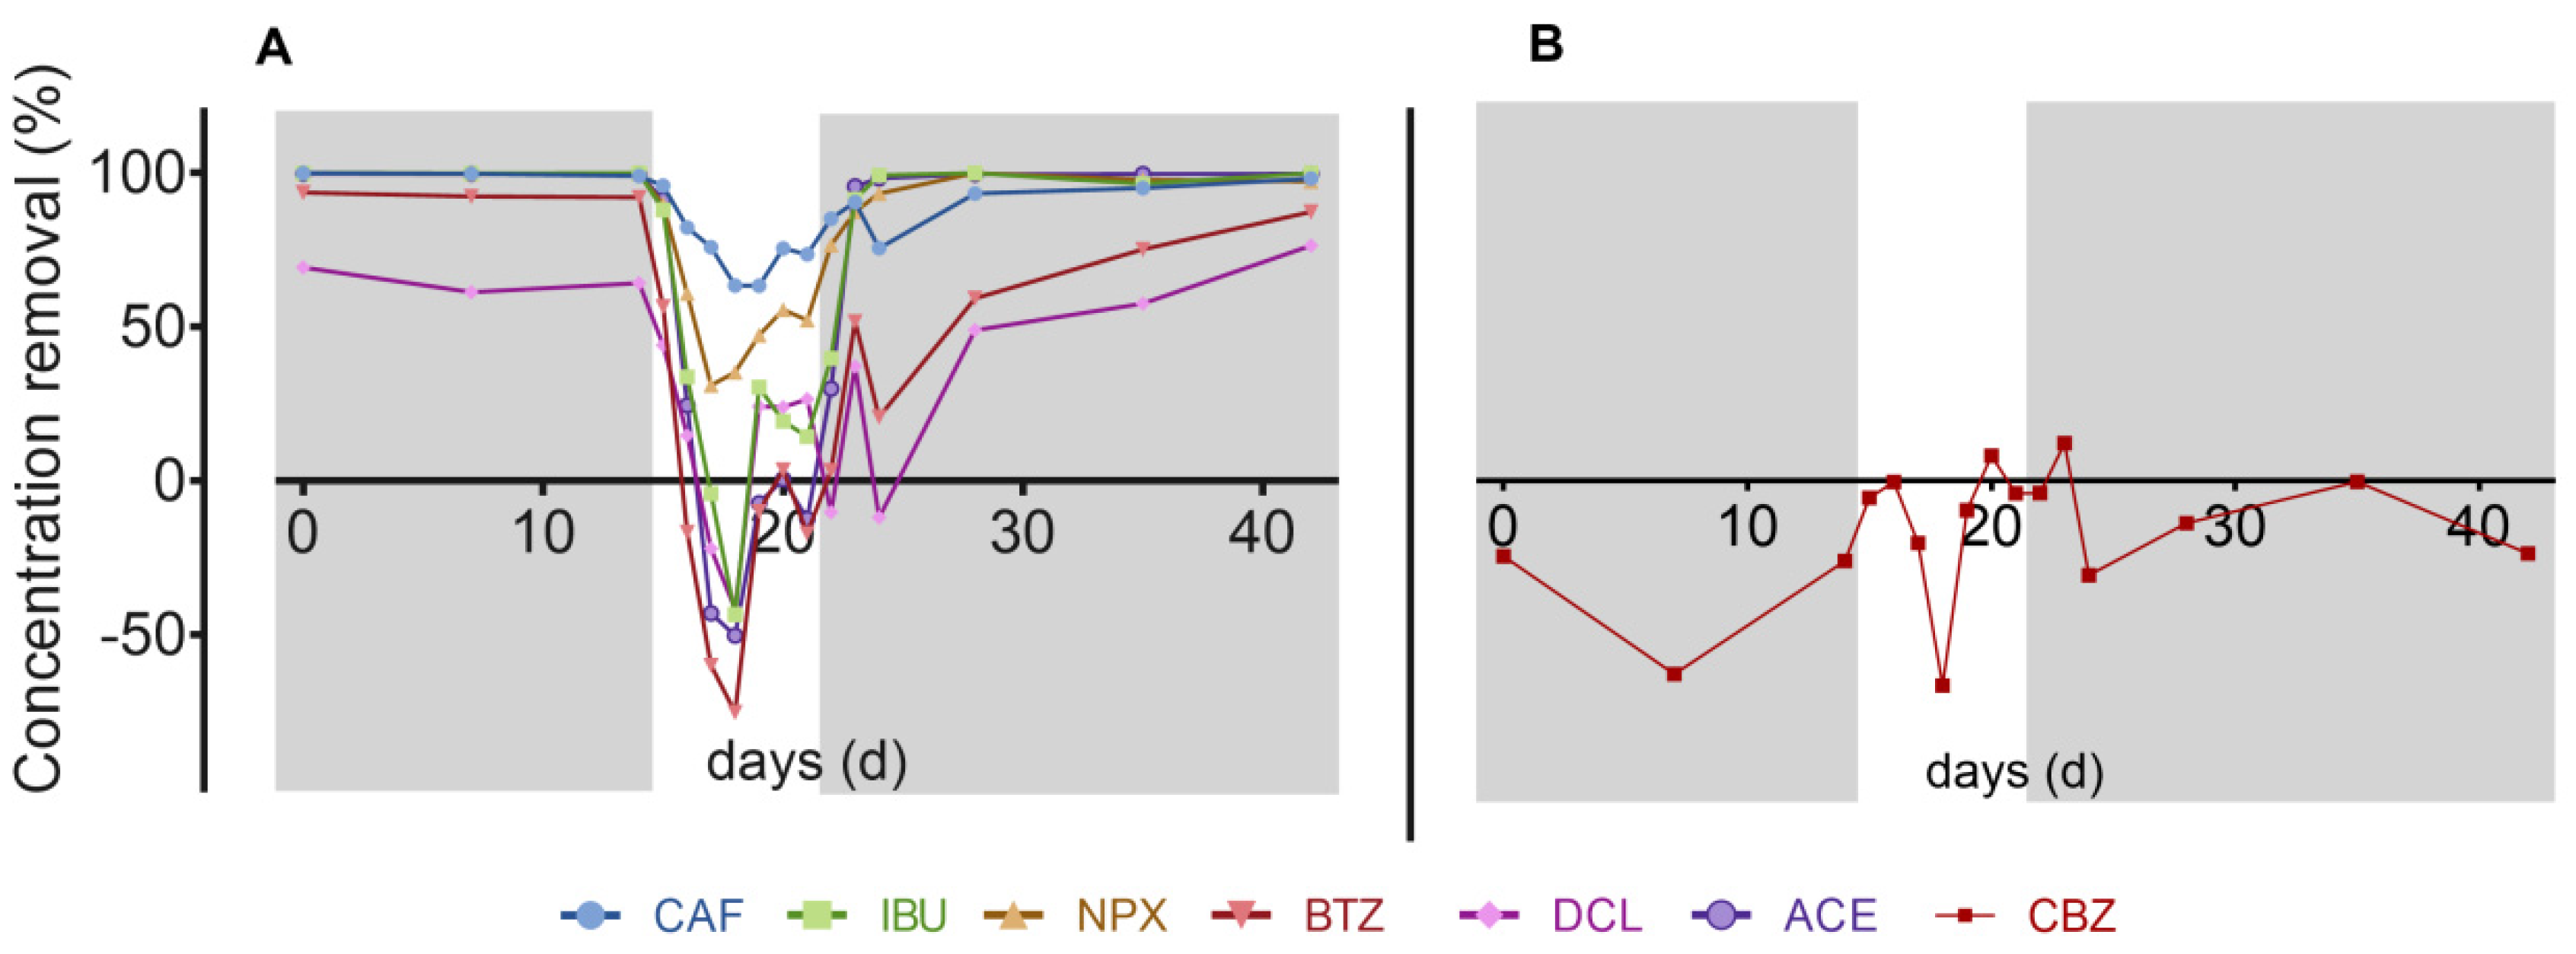
3.3. Contaminants of Emerging Concern
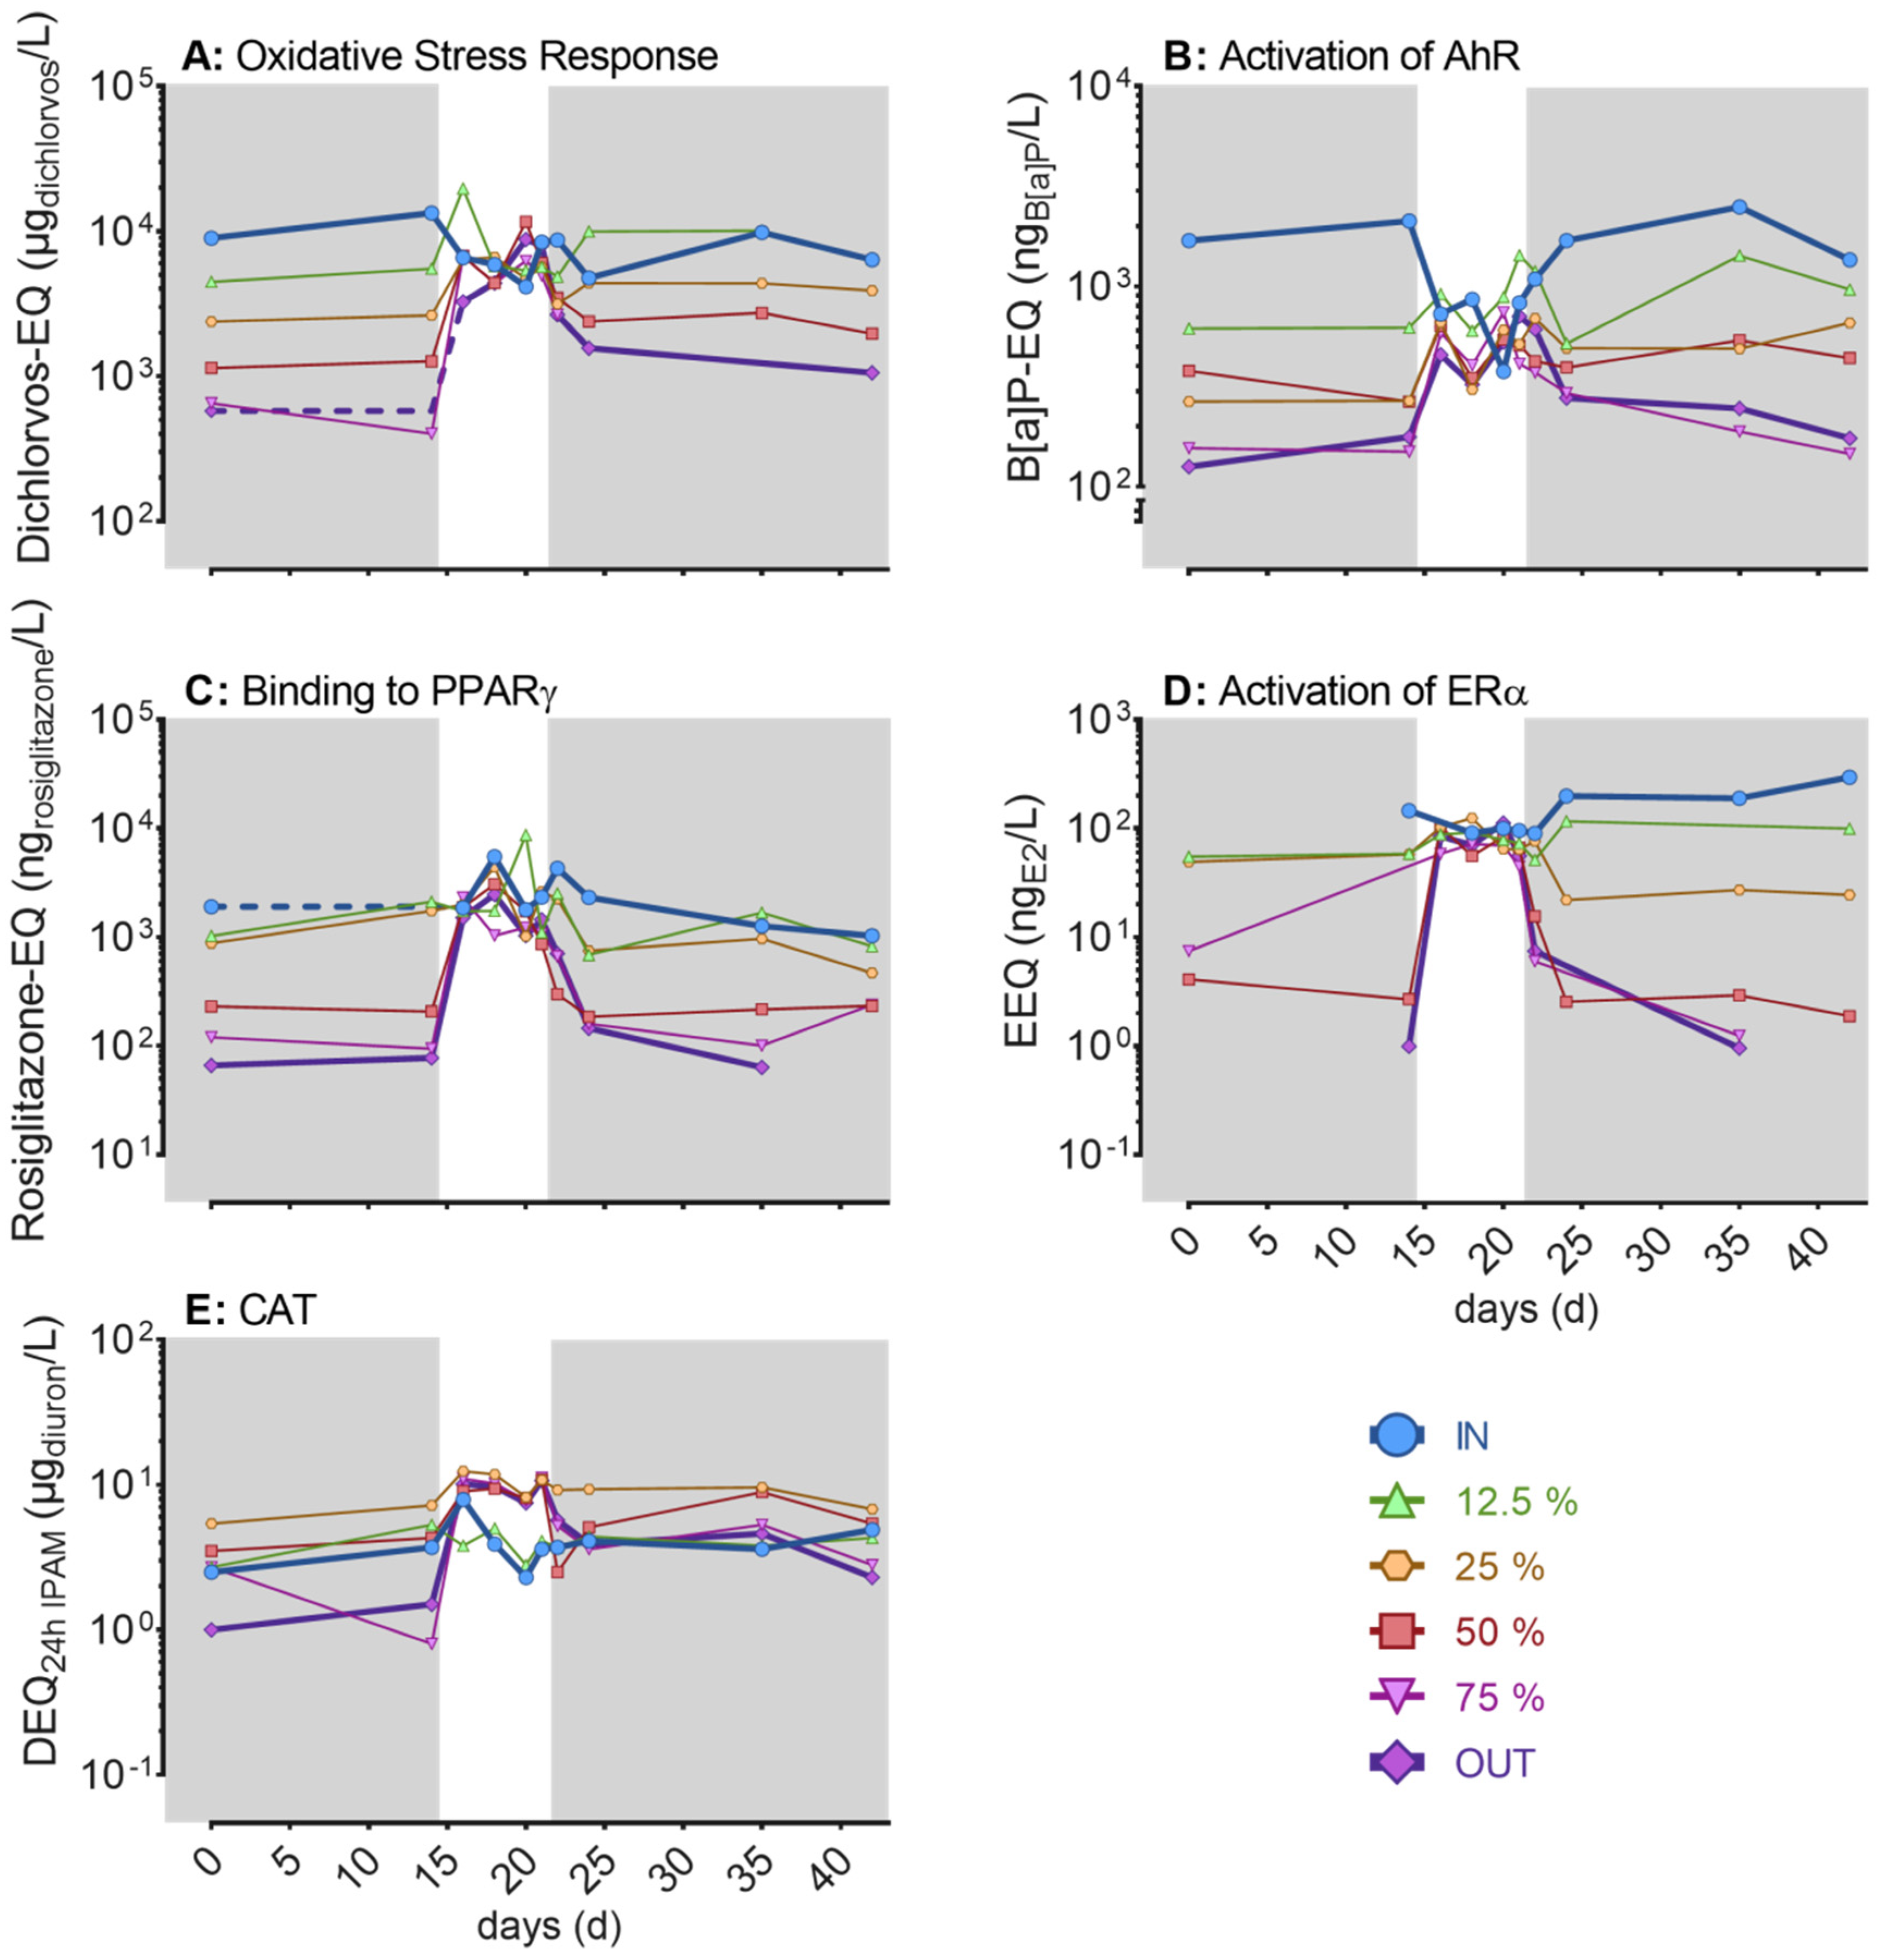
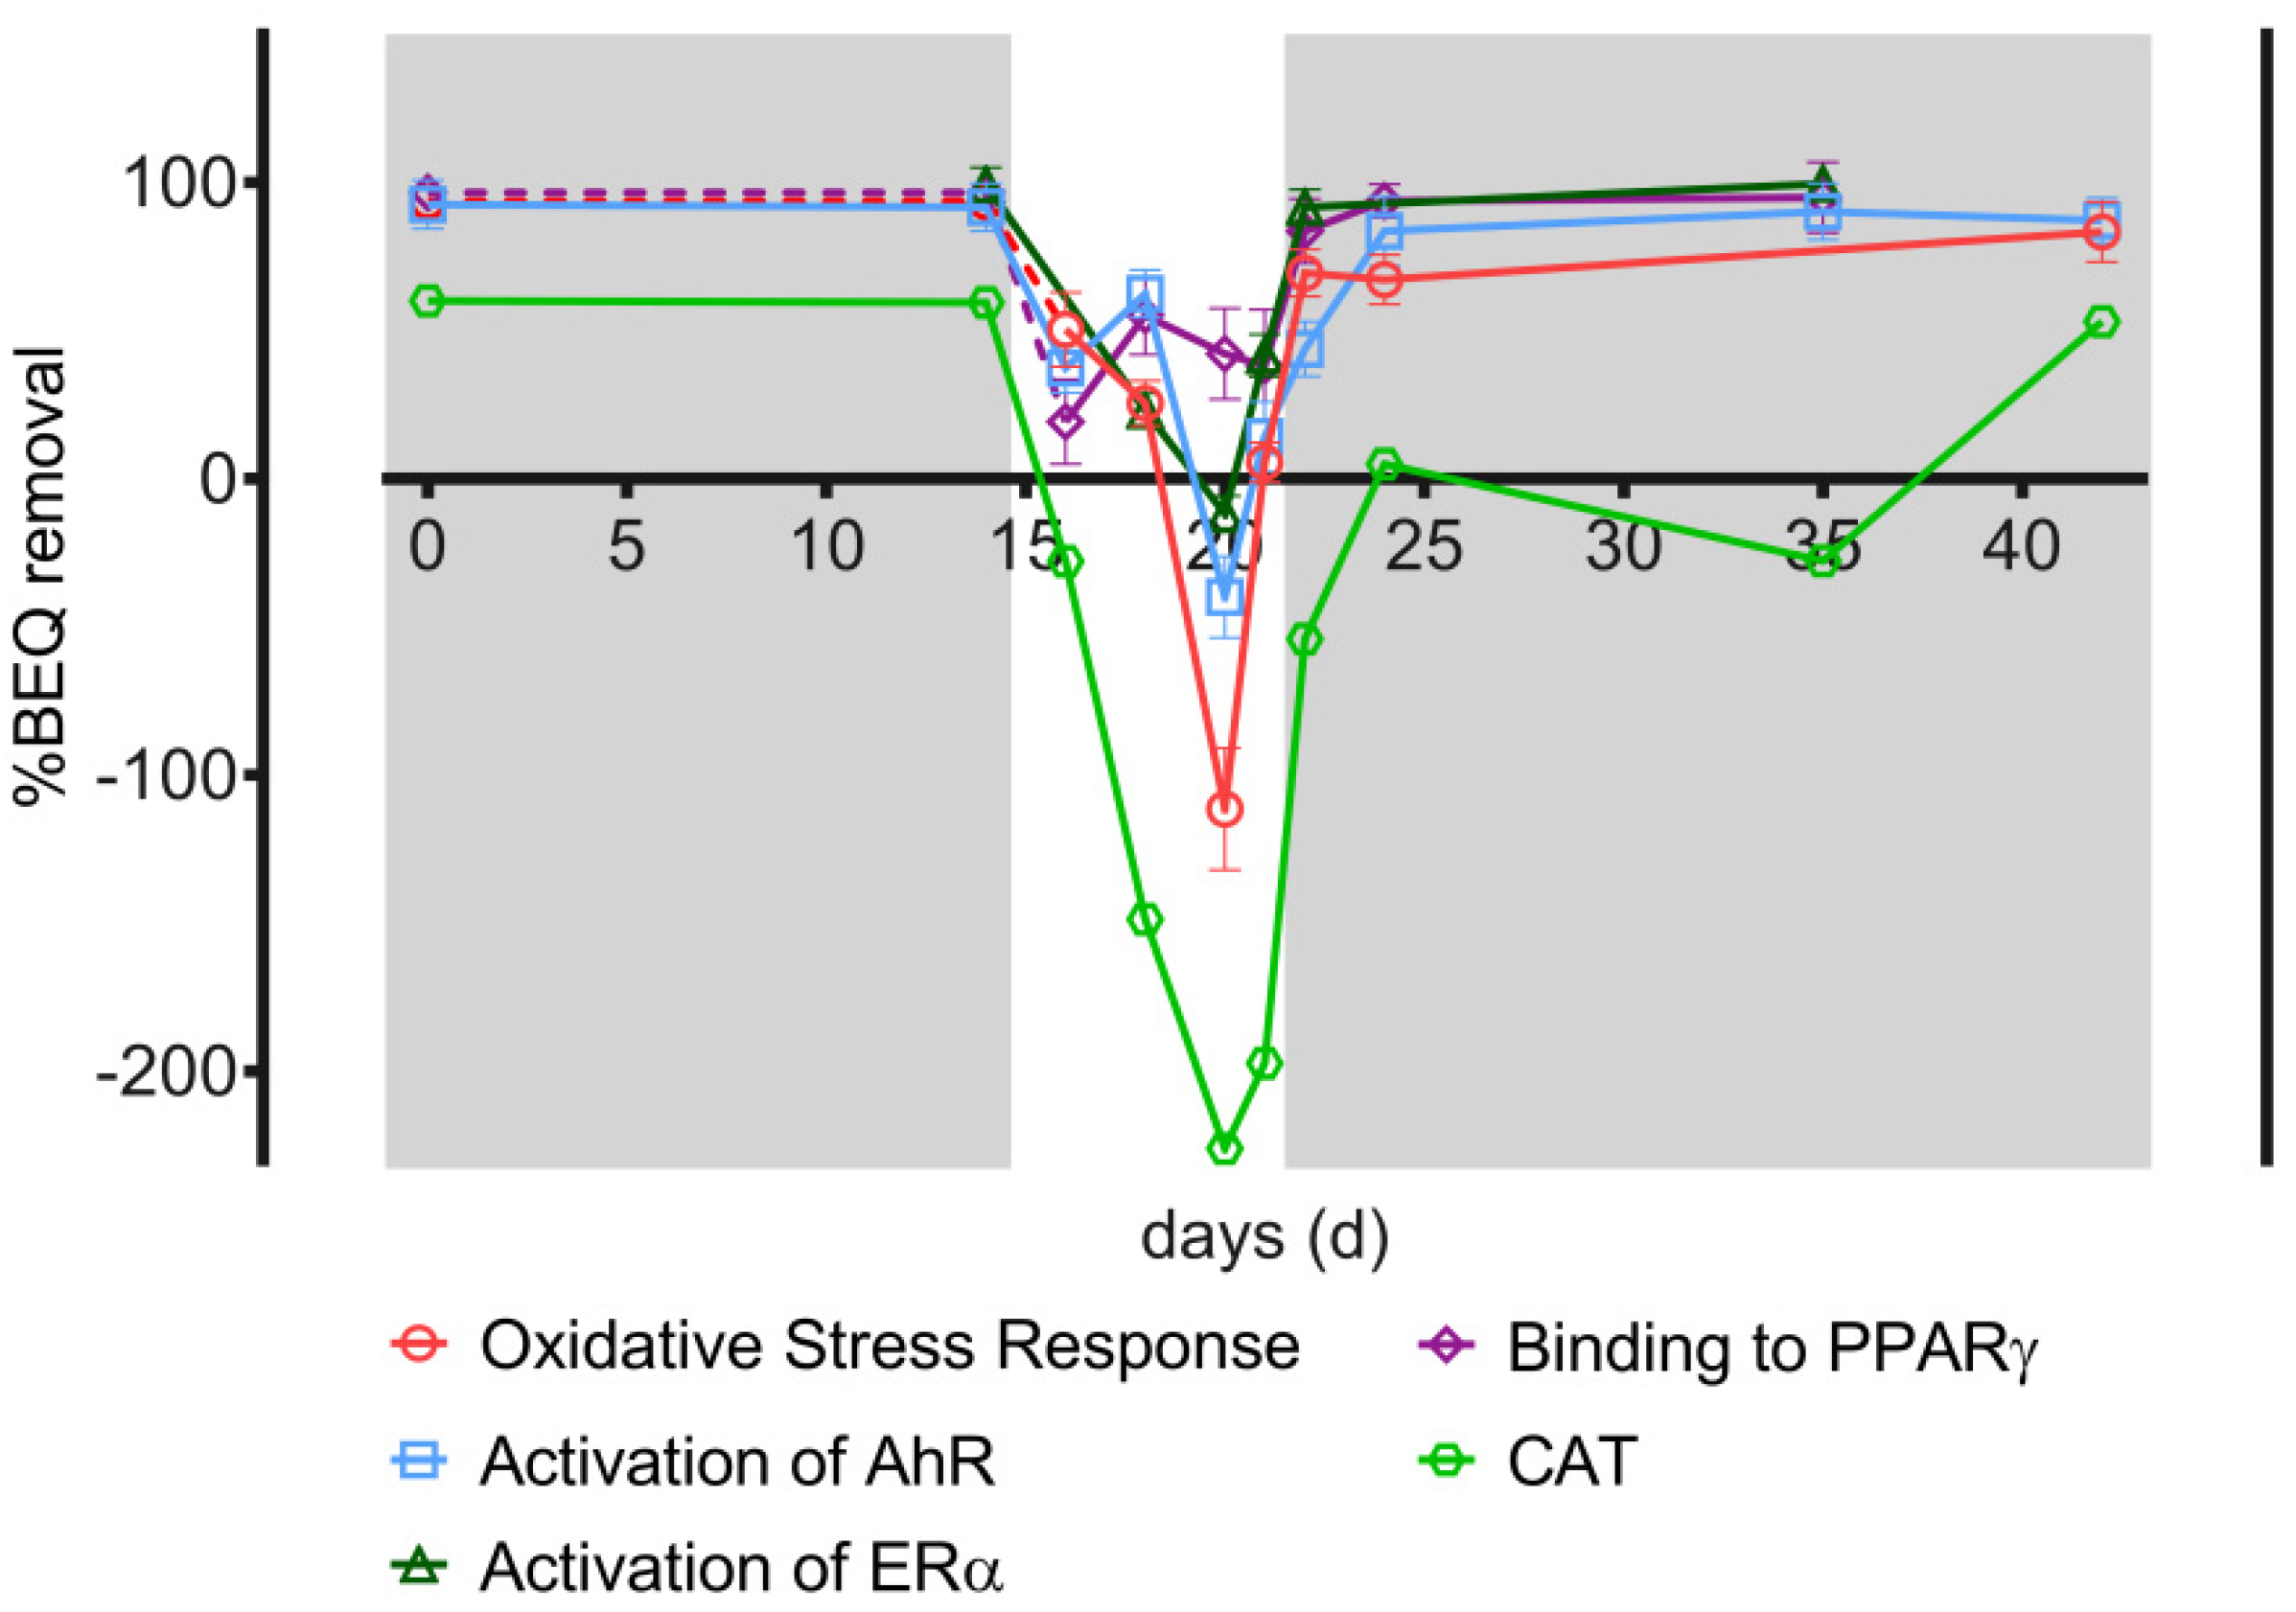
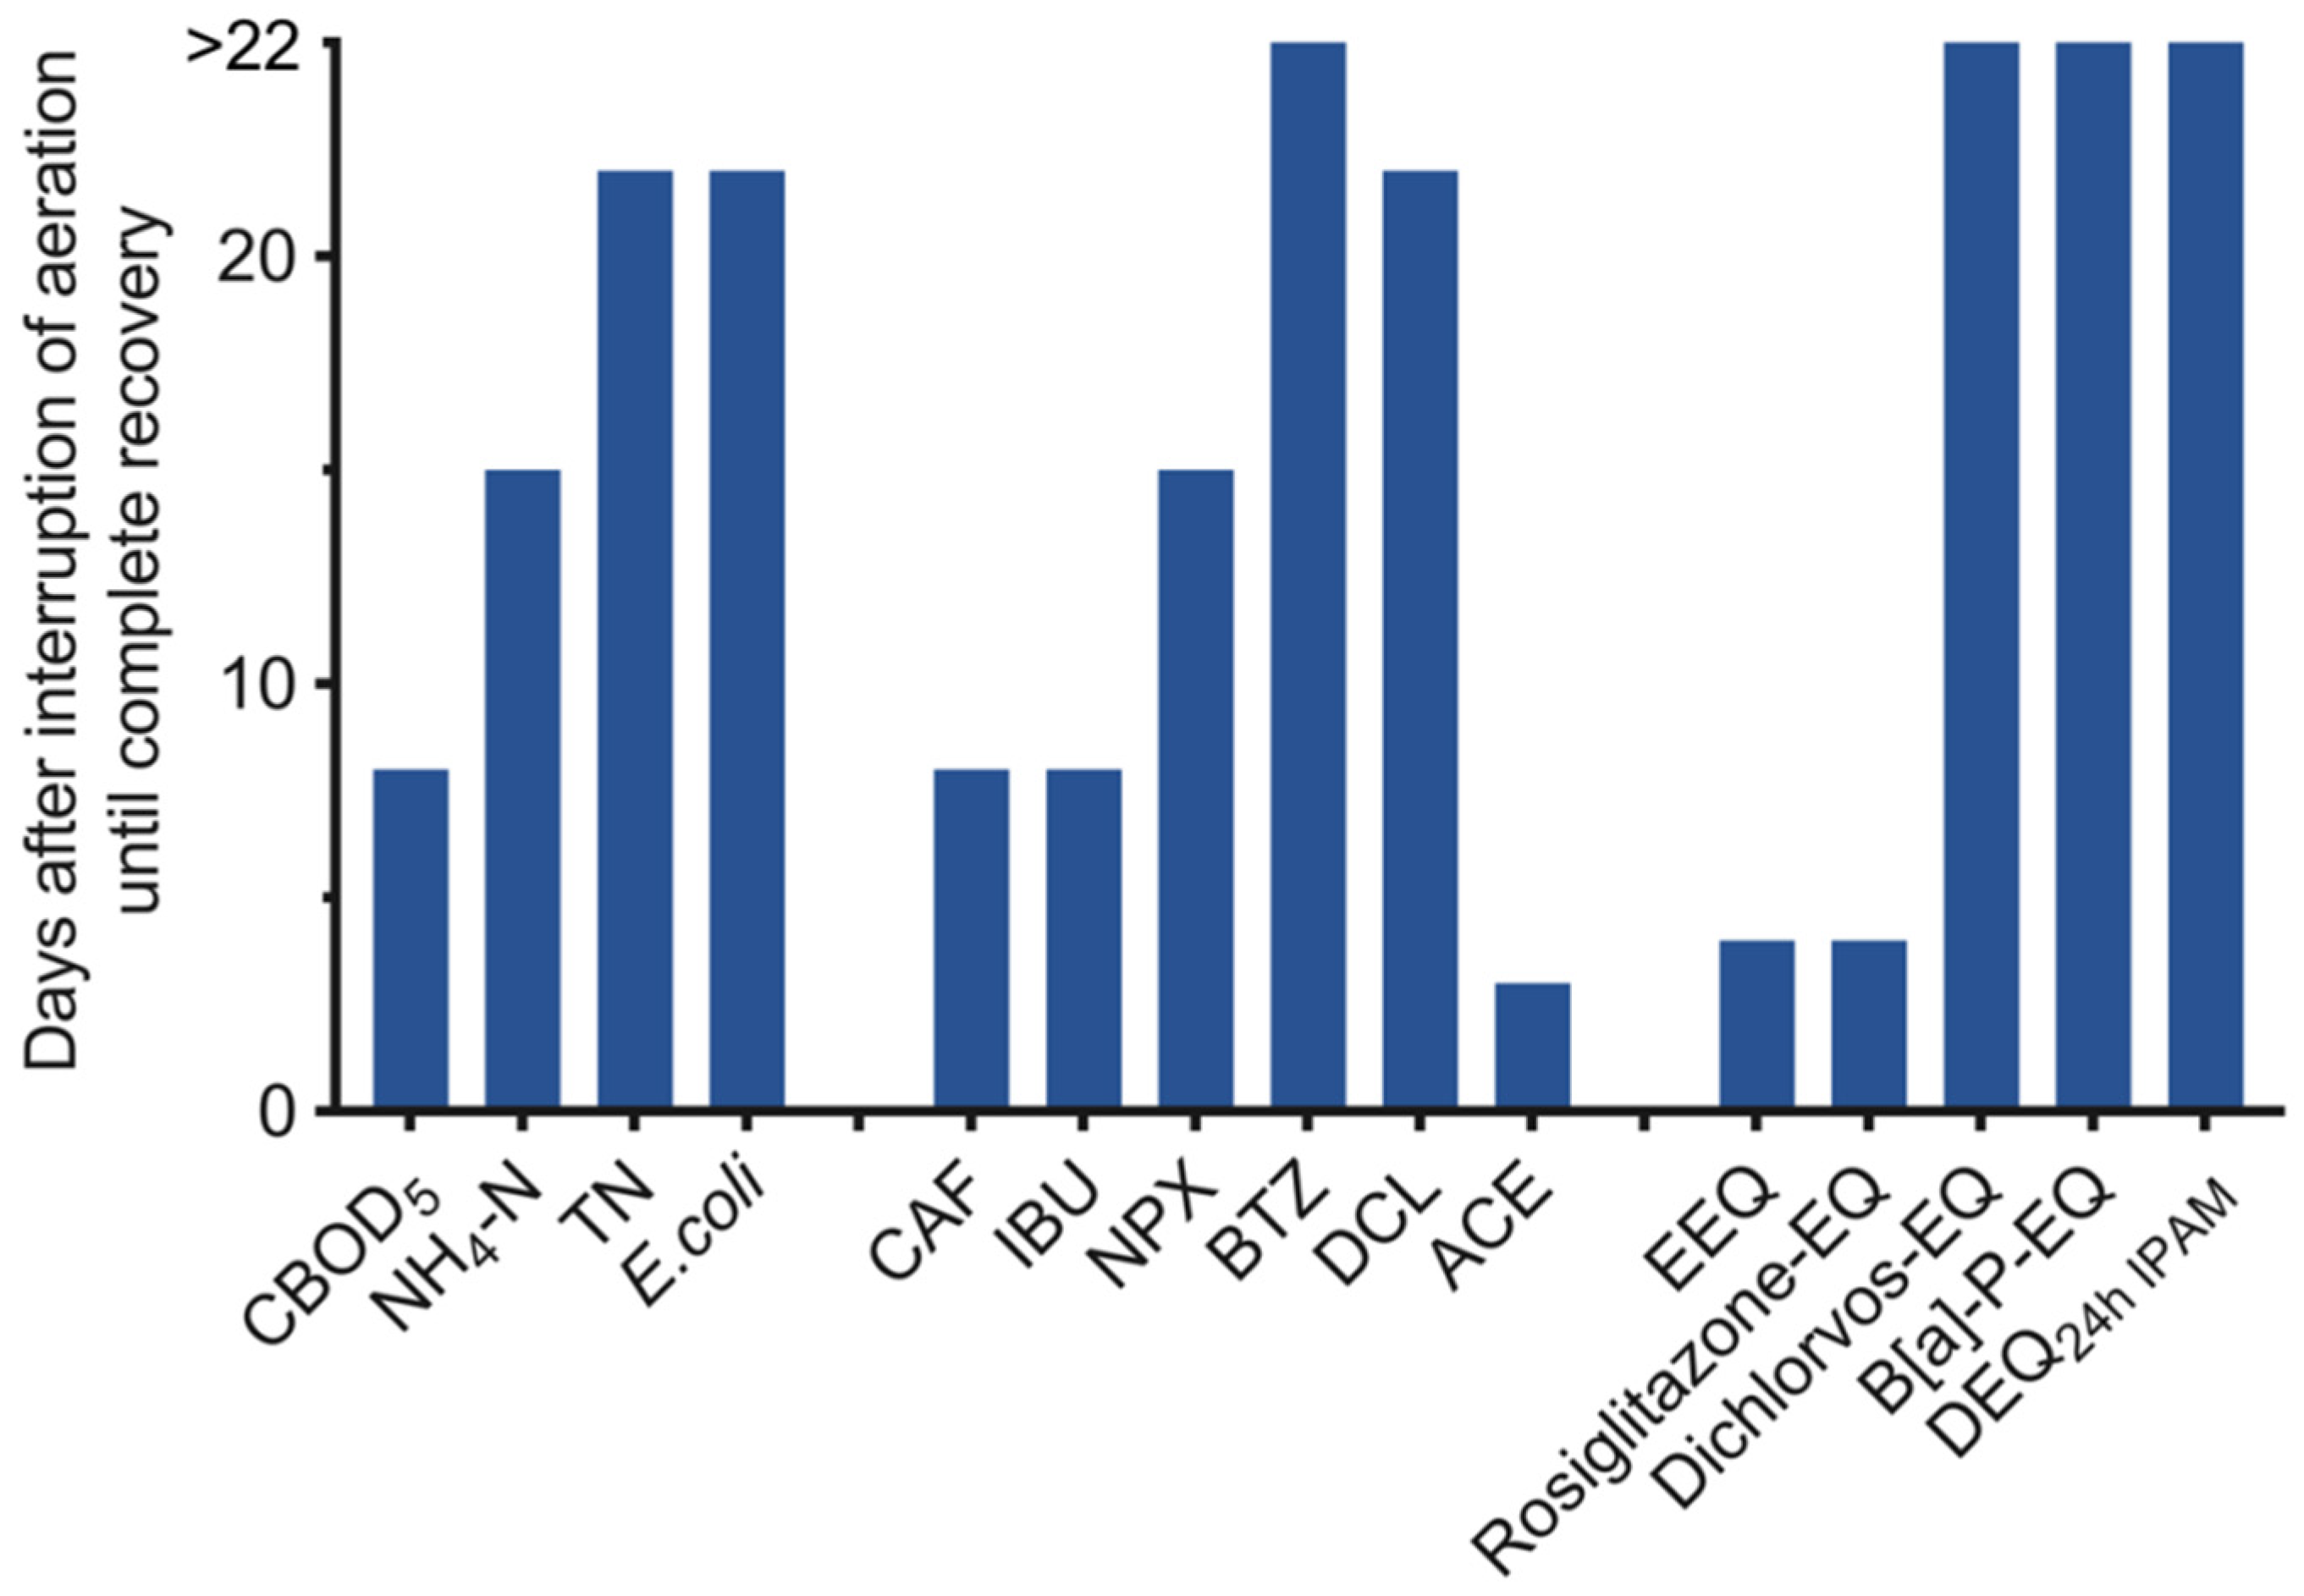
The observed influent concentrations of the CECs were comparable to previous studies conducted at this research site [6,8]. Individual concentrations ranged from 4.6 µg/L (carbamazepine, CBZ) to 48.2 µg/L (acesulfame, ACE). Mean influent concentrations, standard deviations and numbers of samples are shown in Table 4.
Influent, internal profiles, and effluent concentrations of CECs are shown in Figure 2, concentration percent removal are shown in Figure S3. The internal profile showed concentration reduction of all the indicator substances along the flow path, except for CBZ. In the baseline caffeine (CAF), one of the readily degradable micropollutants, was already removed by >72% at 12.5% of the flow length. Starting at 25% of the flow length, CAF is removed almost completely (>98%). During the interruption of aeration phase, removal efficacy decreased initially, but from day 16 onwards, an adaptation of the microbial community seems to take place and CAF removal efficacy increased again despite the lack of oxygen. The decrease to around 63% removal on days 18 and 19 and to <80% on Day 24 can be explained by the previous rainfall events and the resulting dilution effects. Nevertheless, the baseline profile is still formed at the end of the experimental period. For ibuprofen (IBU) and ACE the highest removal could be found from 50% of the path length of the basin. For both, a rapid recovery of the internal profile after the interruption of the aeration was observed. The maximum removal was reached after 75% of the wetland length (naproxen: >99%, diclofenac: >61%, and benzotriazole: >92%). Compared to diclofenac (DCL) and benzotriazole (BTZ), a large part of naproxen (NPX, 84–89%) was removed in the first 25% of the bed. For DCL and BTZ, removal was evenly distributed over the length of the bed. The profile recovery took place evenly over time in the recovery and recovered-baseline phases.
Overall, the more recalcitrant a compound was and the higher the concentrations, the lower the removal efficacies were in the effluent in the baseline phase (Figure 3). Switching aeration off resulted in a marked increase of all CEC concentrations (Figure 2A–F), except CBZ (Figure 2G). The majority of the investigated CECs were effectively removed (>99%) in the baseline phase (Figure 3). The removal of the BTZ turned out to be slightly lower (93%). Moderate removal was achieved for DCL (65%) in the baseline phase.
In the interruption phase, the removal of CECs decreased with decreasing biodegradability and ranged from −75% (BTZ) to 63% (CAF) (Figure 3A). While CAF is effectively removed under all redox conditions [8], a different picture appeared for the other components. With decreasing effluent DO, the removal for IBU, which is readily biodegradable under aerobic conditions, and the moderately degradable NPX also decreases.
The negative removal values for IBU, BTZ, DCL, and ACE can be explained by the two heavy precipitation events on Day 15 and 18. The 20 mm of precipitation that elapsed in each case corresponds to approximately 20% of the daily inflow volume. Thus, a dilution of inlet wastewater occurred, which would have decreased the concentrations of micropollutants in the inlet. This could have led to negative values of concentration percent removal because the removal was calculated independent of flow rate at a given sampling time point. Thus, while the inlet was diluted, the outlet concentrations were still higher from pre-rain higher inlet concentrations.
After restarting aeration, removal of CAF, IBU, and ACE quickly increased (within eight days) back to the range of the baseline phase. The removal performance for the moderately biodegradable CECs NPX, BTZ, and DCL lasted longer than the others, but recovered fully by 15 days (NPX), 21 days (DCL) respectively >22 days (BTZ) after aeration was switched on again.
In the baseline and recovery phase, CBZ was not well removed in the wetland system as evidenced by consistently negative removal efficacy (Figure 3B). CBZ is predominantly excreted from the human body as glucuronide conjugate. These glucuronide conjugates can then be metabolized back into the parent compound CBZ by enzymatic processes during the treatment process [5,38,39]. This can result in an effective increase in CBZ concentration. A distinction between the newly formed parent compound and the actual CBZ removal fraction can therefore not be made. Only during interruption and recovery phase of this study, CBZ showed a less formation. Jekel et al. [18] showed in their study that anaerobic conditions can lead to a significant increase in CBZ removal. Low DO concentrations were observed during the aeration interruption phase could explain the slight increase in CBZ removal (12%, Day 23).

3.4. Bioanalysis

All EC values and REFs are listed in Table S2. Furthermore, Table S3 summarizes the calculated treatment efficacies expressed as BEQ removal. Figure 4 shows the BEQ values of the influent, internal and effluent samples over the course of the experiment. Activation of GR was not be detected and is thus not presented. Previous studies partially showed a masking of GR-mediated activity by other cytotoxic compounds [40]. Due to these masking effects, no valid statement and evaluation of the activation of GR is possible. The combined algae test yields information on three endpoints: photosynthesis inhibition after 2 h (DEQ2h IPAM) and after 24 h (DEQ24h IPAM) as well as inhibition of algal growth (DEQ24h growth). Photosynthesis after 24 h was the most sensitive endpoint, indicating that the mixture effects were not dominated by herbicides, as it was in case of previous studies on conventional treatment plants [25], but other non-herbicidal chemicals in the wastewater contribute to the effect. Therefore, the DEQ2h IPAM and DEQ24h growth are not further discussed.
In the baseline phase, five bioassays showed a BEQ reduction in the effluent, while in the interruption phase an increase in BEQs to the level of the inflow was observed (Figure 4). The removal of four biological effects (Figure 5) was high (>93%) in the baseline phase. Mixture effects could be removed very well (B[a]-EQ removal: 93%; Rosiglitazone-EQ removal: 97%). The removal of the oxidative stress response (94%) and estrogenic activity removal (99%) was equally very high. DEQ24h IPAM was removed by 60%.
The diuron equivalent concentration for photosynthesis inhibition after the treatment system displayed similar ranges (DEQ24h IPAM: 1.0 µg/L and 1.5 µg/L) than in previous studies [41,42] with removal also often lower for algal toxicity than for the other cell-based bioassays [25]. The internal profile showed that three of the BEQs investigated were effectively reduced very early in the system at a fractional length of 12.5% (Rosiglitazone-EQ: >40%; Dichlorvos-EQ > 50%; B[a]P-EQ > 60%). B[a]P-EQs were well removed (>84%) at 25% of the fractional distance; whereas removal of Dichlorvos-EQ (>90%) and Rosiglitazone-EQ (>87%) reached the maximum removal at 25% flow path. Of particular note is the high removal for Rosiglitazone-EQ between 25% and 50% of the flow path. DEQ24h IPAM showed negative removal in the baseline phase until a fractional length of 75%, where it reached its maximum. The internal profile displayed negative DEQ24h IPAM removal in the baseline. This could potentially be explained by a combination of low removal of micropollutants together with the rain event (17 mm/d), which took place four days before the study started, and which could have delivered herbicides from direct road runoff.
During the interruption phase, the BEQ removal efficacy of all observed bioassays dropped to under 50% with some negative values, except Rosiglitazone-EQ removal. The negative removals are likely due to dilution effects caused by the rainfall events, as explained in Section 3.3. Removal of Rosiglitazone-EQ was in a higher range (about 50%) then the other bioassays and also higher than in previous studies in the horizontal non-aerated systems. Nivala et al. [9] reported a removal of 20% for PPARγ in a non-aerated horizontal wetland. The increase in effluent Rosiglitazone-EQ might be explained by the increase in NPX (Figure 2C), DCL (Figure 2E) which are both active in PPARγ-GeneBLAzer [43], and the entry of road runoff into the system. Neale et al. [43] observed more than 232 chemicals in small agricultural streams during rain events. Twenty-one chemicals were active, of which DCL explained up to 35% of the activation of the PPARγ assay, followed by benzothiazole-2-sulfonic acid (25%) and NPX with 1.3%. Benzothiazole-2-sulfonic acid enters the treatment system through road runoff, among other pathways [44]. The reduced degradation of DCL and NPX due to anaerobic conditions in the septic tank and the wetland, as well as the increased input of road runoff due to precipitation could lead to an overall higher effluent load.
After switching aeration back on Rosiglitazone-EQ and EEQ were removed within a few days to the same extent observed in the baseline phase. Furthermore, the internal profile recovered completely. After the interruption of aeration phase, very high removal efficacy (>88%) was achieved after 25% of fractional length for EEQ. Dichlorvos-EQ, B[a]P-EQ, and DEQ24h IPAM on the other hand even showed a deterioration of the removal along the flow path. Although overall removal was maintained, the internal BEQ profiles changed, shifting further along the flow path in the wetland. An effective reduction was already determined at 12.5% of the fractional distance in the baseline for both Dichlorvos-EQ and B[a]P-EQ, but it was only observed at 25% (B[a]P-EQ) and 50% (Dichlorvos-EQ) in the recovered-baseline phase. Dichlorvos-EQ, B[a]P-EQ and DEQ24h IPAM on the other hand did not recover completely in the experiment time. DEQ24h IPAM showed negative removal values on day 35, which could again potentially be associated to two additional rain events on Day 33 (5 mm/d) and Day 35 (3 mm/d).
Internal profiles in the wetland showed a shift in the removal behavior for some water quality parameters, micropollutants and bioassays after the interruption of aeration phase. This could be caused by a change in the microbial community in the wetland. In a study by Murphy et al. [28] recovery of nitrification ability was observed after a two-week interruption of aeration. The authors do not exclude the persistence of the nitrifying microbial community during this time in the wetland, or the presence of facultative bacteria. Button et al. [45] also showed differences in the localization of different microorganisms in a wetland. They observed a decrease in microbial activity and metabolic richness along the flow path in vertical and horizontal flow systems. Community level physiological profiling (CLPP) can be used to determine the metabolic activity of a microbial community using different carbon sources. The knowledge of the microbial community as well as the change of the microbial community over the operating time or a malfunction (e.g., air pump failure) could lead to a support of the microbial community by, e.g., design changes of the wetland. This adaption could lead to a more efficient treatment performance with regard to micropollutants and also the removal of biological effects.
Overall, the recovery for the classical wastewater parameters, micropollutants, and bioassays varied (Figure 6). While CBOD5 and NH4-N showed rapid recovery (<15 days), E. coli and TN did not fully recover until the end of the investigated recovered-baseline phase (22 days). The readily biodegradable micropollutants (CAF, IBU) removals recovered in short time (<8 days). Of particular note is the short removal recovery time for ACE (four days) to a high removal efficacy (>98%). In the literature ACE has been considered as moderate biodegradable with a highly variable removal efficacy depending on the temperature [46,47]. In a one-year study of a municipal wastewater treatment plant and an aerated horizontal subsurface flow treatment wetland, Kahl et al. [46] observed differences in removal efficacies between winter (<15%) and summer (95%). A resilience test conducted under cold (winter) conditions would likely show a longer recovery time for acesulfame removal.
EEQ and Rosiglitazone-EQ removals showed short recovery periods of approximately four days. Dichlorvos-EQ, B[a]P-EQ, and the DEQ24h IPAM did not recover completely within the period of the study. The use of bioassays gives a new insight where overall, the water quality takes considerably longer to reach the level of the baseline phase than conventional parameters (CBOD5, TN) or biodegradable CECs (IBU, CAF, ACE, and NPX) indicate. Future research should investigate the relationship between seasonal influence and removal recovery times for micropollutants and biological effects (as indicated by bioassays) removal. Future research should also address the influence of the length of the aeration interruption and the recovery times for micropollutants and bioassays removal after switching aeration back on. Additional studies might also consider comparing different types of treatment wetlands and their recovery time behavior for micropollutants and biological effect removals after exposure to stress situations.

4. Conclusions

The response of an aerated horizontal flow treatment wetland to aeration interruption was investigated by assessing removal of conventional wastewater parameters, CECs, and biological effects. The combination of chemical analysis and effect-based methods provides a more comprehensive picture of the biologically active substances contained in a water sample than simple chemical analysis alone.
During the interruption of aeration phase a strong and immediate deterioration of the water quality was observed. Treatment efficacy for most water quality parameters recovered within couple of days after switching the aeration back on. The micropollutants (caffeine, CAF; ibuprofen, IBU; and acesulfame, ACE) that were readily biodegradable under aerobic conditions were also removed (>90%) within a short time (<8 d) after aeration was resumed. Naproxen (NPX) removal recovered after 15 days to a level which was observed in the baseline (>99%). Whereas the moderately degradable micropollutant diclofenac (DCL) returned to the level previously observed (64%) in the baseline phase towards the end of the test period (22 d), benzotriazole (BTZ) did not recover completely within the period of the study. For carbamazepine (CBZ), which is considered to be resistant to aerobic biodegradation, a slightly increased percentage of removal (8%) was observed during the interruption phase. During the rest of the test period, the CBZ concentration in the effluent was always higher than the influent concentration, indicating that in the wetland system, conjugates are cleaved from the parent compound CBZ.
In terms of bioassays, the removal of biological activity reached values above 85% in the baseline phase, except for the combined algae test (CAT, 60%). In the interruption of aeration phase, the removal efficacies for oxidative stress response (AREc32), the activation of aryl hydrocarbon receptor (AhR), the activation of the estrogen receptor alpha (ERα), and the inhibition of photosynthesis decreased to negative values. This phenomenon might be explained by the heavy rain events, which led to dilution of the influent water and the water in the wetland. Binding to peroxisome proliferator-activated receptor gamma (PPARγ) dropped to a level of around 50% removal during the interruption of aeration phase. A plausible explanation for this is provided by the increasing concentrations of DCL, NPX and by compounds of the street run-off, which in a previous study had already contributed to an increased binding to PPARγ [43].
In summary, an aerated horizontal treatment wetland is able to recover after a six day air pump failure in summer. However, even if the conventional wastewater parameters indicate good treatment performance and complete recovery after an interruption due to aeration failure, micropollutants removal and removal of biological effects (as indicated by bioassays) might be compromised over a longer time period and should be used as additional indicators of treatment performance.

Supplementary Materials

The following are available online at https://www.mdpi.com/2073-4441/12/11/3050/s1, Figure S1: Profile view of horizontal subsurface flow treatment system with location of internal sampling tees (marked with stars), Figure S2: Water quality profiles. Grey areas represents days with aeration, light one interruption phase. Samples were taken at the wetland influent (IN), fractional distances 12.5%, 25%, 50%, 75%, and the wetland effluent (OUT), Figure S3: Internal profiles of concentration percent removal of indicator EOCs (CBZ, ACE, DCL, BTZ, IBU, NPX, CAF) in HA. Grey shaded areas represent days with aeration, no shading represents the interruption phase. Samples were taken at the wetland influent (IN), fractional distances 12.5%, 25%, 50%, 75%, and the wetland effluent (OUT), Table S1: Analysis method limits of micropollutants and conventional wastewater parameters, Table S2: EC values ± standard errors in units of relative enrichment factor (REF). Cytotoxicity IC10 values provided in brackets. No standard errors are given for the CAT because the EC50 was derived from the log-logistic concentration response curve, Table S3: Removal efficacy of BEQ along the fractional length and over time calculated using Equation (2).

Author Contributions

N.A.S., J.N., R.A.M., M.v.A., B.I.E., and T.R. designed the experiments. N.A.S. conducted the experiments. N.A.S., R.S., J.N., and M.v.A. analyzed and synthesized the data. N.A.S., J.N., B.I.E., T.R., and R.S. wrote the paper. All authors have read and agreed to the published version of the manuscript.

Funding

This research received no external funding.

Acknowledgments

Nadine Sossalla acknowledges the Helmholtz Interdisciplinary Graduated School for Environmental Research (HIGRADE) and the Helmholtz Centre for Environmental Research for additional funding and support. We gratefully acknowledge access to the platform CITEPro (Chemicals in the Terrestrial Environment Profiler) funded by the Helmholtz Association. The authors are particularly grateful to Katy Bernhard for her support in operation and sampling of the facility at Langenreichenbach. Grit Weichert, Monika Möder, Petra Keil and Jürgen Steffen are acknowledged for analytical support. Maria König and Lisa Glauch are thanked for bioassay analysis.

Conflicts of Interest

The authors declare no conflict of interest.

References

  1. Kadlec, R.H.; Wallace, S.D. Treatment Wetlands, 2nd ed.; Taylor & Francis Group: Boca Raton, FL, USA, 2009; ISBN 978-1-56670-526-4. [Google Scholar]
  2. Nivala, J.; Headley, T.; Wallace, S.; Bernhard, K.; Brix, H.; van Afferden, M.; Müller, R.A. Comparative analysis of constructed wetlands: The design and construction of the ecotechnology research facility in Langenreichenbach, Germany. Ecol. Eng. 2013, 61, 527–543. [Google Scholar] [CrossRef]
  3. Dotro, G.; Langergraber, G.; Molle, P.; Nivala, J.; Puigagut, J.; Stein, O.; von Sperling, M. Treatment Wetlands; IWA Publishing: London, UK, 2017; Volume 7, ISBN 9781780408774. [Google Scholar]
  4. Fonder, N.; Headley, T. The taxonomy of treatment wetlands: A proposed classification and nomenclature system. Ecol. Eng. 2013, 51, 203–211. [Google Scholar] [CrossRef]
  5. Ávila, C.; Pelissari, C.; Sezerino, P.H.; Sgroi, M.; Roccaro, P.; García, J. Enhancement of total nitrogen removal through effluent recirculation and fate of PPCPs in a hybrid constructed wetland system treating urban wastewater. Sci. Total Environ. 2017, 584–585, 414–425. [Google Scholar]
  6. Nivala, J.; Boog, J.; Headley, T.; Aubron, T.; Wallace, S.; Brix, H.; Mothes, S.; van Afferden, M.; Müller, R.A. Side-by-side comparison of 15 pilot-scale conventional and intensified subsurface flow wetlands for treatment of domestic wastewater. Sci. Total Environ. 2019, 658, 1500–1513. [Google Scholar] [CrossRef]
  7. Gorito, A.M.; Ribeiro, A.R.; Almeida, C.M.R.; Silva, A.M.T. A review on the application of constructed wetlands for the removal of priority substances and contaminants of emerging concern listed in recently launched EU legislation. Environ. Pollut. 2017, 227, 428–443. [Google Scholar] [CrossRef]
  8. Kahl, S.; Nivala, J.; van Afferden, M.; Müller, R.A.; Reemtsma, T. Effect of design and operational conditions on the performance of subsurface flow treatment wetlands: Emerging organic contaminants as indicators. Water Res. 2017, 125, 490–500. [Google Scholar]
  9. Nivala, J.; Neale, P.A.; Haasis, T.; Kahl, S.; König, M.; Müller, R.A.; Reemtsma, T.; Schlichting, R.; Escher, B.I. Application of cell-based bioassays to evaluate treatment efficacy of conventional and intensified treatment wetlands. Environ. Sci. Water Res. Technol. 2018, 4, 206–217. [Google Scholar] [CrossRef] [Green Version]
  10. Weber, K.P.; Nivala, J. Treatment of micropollutants. In Wetland Technology: Practical Information on the Design and Application of Treatment Wetlands; Langergraber, G., Dotro, G., Nivala, J., Rizzo, A., Stein, O.R., Eds.; Scientific; IWA Publishing: London, UK, 2019; ISBN 9781789060171. [Google Scholar]
  11. König, M.; Escher, B.I.; Neale, P.A.; Krauss, M.; Hilscherová, K.; Novák, J.; Teodorović, I.; Schulze, T.; Seidensticker, S.; Hashmi, M.A.K.; et al. Impact of untreated wastewater on a major European river evaluated with a combination of In Vitro bioassays and chemical analysis. Environ. Pollut. 2017, 220, 1220–1230. [Google Scholar] [CrossRef]
  12. Li, Y.; Zhu, G.; Ng, W.J.; Tan, S.K. A review on removing pharmaceutical contaminants from wastewater by constructed wetlands: Design, performance and mechanism. Sci. Total Environ. 2014, 468–469, 908–932. [Google Scholar]
  13. Carvalho, P.N. Interaction and Fate of Pharmaceuticals in Soil-Crop Systems: The Impact of Reclaimed Wastewater. In Handbook of Environmental Chemistry; Solsona, S.P., Montemurro, N., Chiron, S., Barceló, D., Eds.; Springer: Heidelberg, Germany, 2020; Volume 103, ISBN 978-3-030-61289-4. [Google Scholar]
  14. Hijosa-Valsero, M.; Matamoros, V.; Sidrach-Cardona, R.; Martín-Villacorta, J.; Bécares, E.; Bayona, J.M. Comprehensive assessment of the design configuration of constructed wetlands for the removal of pharmaceuticals and personal care products from urban wastewaters. Water Res. 2010, 44, 3669–3678. [Google Scholar]
  15. Verlicchi, P.; Zambello, E. How efficient are constructed wetlands in removing pharmaceuticals from untreated and treated urban wastewaters? A review. Sci. Total Environ. 2014, 470–471, 1281–1306. [Google Scholar] [CrossRef]
  16. Ilyas, H.; Masih, I.; van Hullebusch, E.D. Pharmaceuticals’ removal by constructed wetlands: A critical evaluation and meta-analysis on performance, risk reduction, and role of physicochemical properties on removal mechanisms. J. Water Health 2020. [Google Scholar] [CrossRef]
  17. Fent, K.; Weston, A.A.; Caminada, D. Ecotoxicology of human pharmaceuticals. Aquat. Toxicol. 2006, 76, 122–159. [Google Scholar] [CrossRef]
  18. Jekel, M.; Dott, W.; Bergmann, A.; Dünnbier, U.; Gnirß, R.; Haist-Gulde, B.; Hamscher, G.; Letzel, M.; Licha, T.; Lyko, S.; et al. Selection of organic process and source indicator substances for the anthropogenically influenced water cycle. Chemosphere 2015, 125, 155–167. [Google Scholar] [CrossRef]
  19. Matamoros, V.; Bayona, J.M. Elimination of Pharmaceuticals and Personal Care Products in Subsurface Flow Constructed Wetlands. Environ. Sci. Technol. 2006, 40, 5811–5816. [Google Scholar] [CrossRef]
  20. Nivala, J.; Kahl, S.; Boog, J.; van Afferden, M.; Reemtsma, T.; Müller, R.A. Dynamics of emerging organic contaminant removal in conventional and intensified subsurface flow treatment wetlands. Sci. Total Environ. 2019, 649, 1144–1156. [Google Scholar] [CrossRef] [PubMed]
  21. Wagner, T.V.; Parsons, J.R.; Rijnaarts, H.H.M.; de Voogt, P.; Langenhoff, A.A.M. Benzotriazole removal mechanisms in pilot-scale constructed wetlands treating cooling tower water. J. Hazard. Mater. 2020, 384, 121314. [Google Scholar] [CrossRef]
  22. Neale, P.A.; Ait-Aissa, S.; Brack, W.; Creusot, N.; Denison, M.S.; Deutschmann, B.; Hilscherová, K.; Hollert, H.; Krauss, M.; Novák, J.; et al. Linking In Vitro Effects and Detected Organic Micropollutants in Surface Water Using Mixture-Toxicity Modeling. Environ. Sci. Technol. 2015, 49, 14614–14624. [Google Scholar] [CrossRef] [Green Version]
  23. Escher, B.I.; Van Daele, C.; Dutt, M.; Tang, J.Y.M.; Altenburger, R. Most Oxidative Stress Response In Water Samples Comes From Unknown Chemicals: The Need For Effect-Based Water Quality Trigger Values. Environ. Sci. Technol. 2013, 47, 7002–7011. [Google Scholar] [CrossRef]
  24. Wernersson, A.-S.; Carere, M.; Maggi, C.; Tušil, P.; Soldàn, P.; James, A.; Sanchez, W.; Dulio, V.; Broeg, K.; Reifferscheid, G.; et al. The European technical report on aquatic effect-based monitoring tools under the water framework directive. Environ. Sci. Eur. 2015, 27, 7. [Google Scholar] [CrossRef] [Green Version]
  25. Neale, P.A.; O’Brien, J.W.; Glauch, L.; König, M.; Krauss, M.; Mueller, J.F.; Tscharke, B.; Escher, B.I. Wastewater treatment efficacy evaluated with In Vitro bioassays. Water Res. X 2020, 9, 100072. [Google Scholar] [CrossRef]
  26. Boog, J.; Nivala, J.; Aubron, T.; Mothes, S.; van Afferden, M.; Müller, R.A. Resilience of carbon and nitrogen removal due to aeration interruption in aerated treatment wetlands. Sci. Total Environ. 2018, 621, 960–969. [Google Scholar] [CrossRef]
  27. Butterworth, E.; Richards, A.; Jones, M.; Mansi, G.; Ranieri, E.; Dotro, G.; Jefferson, B. Performance of four full-scale artificially aerated horizontal flow constructedwetlands for domestic wastewater treatment. Water 2016, 8, 365. [Google Scholar] [CrossRef] [Green Version]
  28. Murphy, C.; Rajabzadeh, A.R.; Weber, K.P.; Nivala, J.; Wallace, S.; Cooper, D.J. Nitrification cessation and recovery in an aerated saturated vertical subsurface flow treatment wetland: Field studies and microscale biofilm modeling. Bioresour. Technol. 2016, 209, 125–132. [Google Scholar] [CrossRef]
  29. Boog, J.; Nivala, J.; Aubron, T.; Wallace, S.; Sullivan, C.; van Afferden, M.; Müller, R.A. Treatment wetland aeration without electricity? lessons learned from the first experiment using a wind-driven air pump. Water 2016, 8, 502. [Google Scholar] [CrossRef] [Green Version]
  30. Neale, P.A.; Altenburger, R.; Aït-Aïssa, S.; Brion, F.; Busch, W.; de Umbuzeiro, G.A.; Denison, M.S.; Du Pasquier, D.; Hilscherová, K.; Hollert, H.; et al. Development of a bioanalytical test battery for water quality monitoring: Fingerprinting identified micropollutants and their contribution to effects in surface water. Water Res. 2017, 123, 734–750. [Google Scholar] [CrossRef] [PubMed] [Green Version]
  31. Glauch, L.; Escher, B.I. The combined algae test for the evalution of mixture toxicity in environmental samples. Environ. Toxicol. Chem. 2020, 1–70. [Google Scholar] [CrossRef]
  32. Brennan, J.C.; He, G.; Tsutsumi, T.; Zhao, J.; Wirth, E.; Fulton, M.H.; Denison, M.S. Development of Species-Specific Ah Receptor-Responsive Third Generation CALUX Cell Lines with Enhanced Responsiveness and Improved Detection Limits. Environ. Sci. Technol. 2015, 49, 11903–11912. [Google Scholar] [CrossRef]
  33. Escher, B.I.; Dutt, M.; Maylin, E.; Tang, J.Y.M.; Toze, S.; Wolf, C.R.; Lang, M. Water quality assessment using the AREc32 reporter gene assay indicative of the oxidative stress response pathway. J. Environ. Monit. 2012, 14, 2877–2885. [Google Scholar] [CrossRef]
  34. Escher, B.I.; Aït-Aïssa, S.; Behnisch, P.A.; Brack, W.; Brion, F.; Brouwer, A.; Buchinger, S.; Crawford, S.E.; Du Pasquier, D.; Hamers, T.; et al. Effect-based trigger values for In Vitro and In Vivo bioassays performed on surface water extracts supporting the environmental quality standards (EQS) of the European Water Framework Directive. Sci. Total Environ. 2018, 628–629, 748–765. [Google Scholar] [CrossRef] [PubMed]
  35. Ilyas, H.; Masih, I. Intensification of constructed wetlands for land area reduction: A review. Environ. Sci. Pollut. Res. 2017, 24, 12081–12091. [Google Scholar] [CrossRef] [Green Version]
  36. Kurzbaum, E.; Kirzhner, F.; Armon, R. Improvement of water quality using constructed wetland systems. Rev. Environ. Health 2012, 27, 59–64. [Google Scholar] [CrossRef]
  37. Wu, S.; Carvalho, P.N.; Müller, J.A.; Manoj, V.R.; Dong, R. Sanitation in constructed wetlands: A review on the removal of human pathogens and fecal indicators. Sci. Total Environ. 2016, 541, 8–22. [Google Scholar] [CrossRef]
  38. Ternes, T.A. Occurrence of drug in german sewage treatment plants and rivers. Water Res. 1998, 32, 3245–3260. [Google Scholar] [CrossRef]
  39. Vieno, N.; Tuhkanen, T.; Kronberg, L. Elimination of pharmaceuticals in sewage treatment plants in Finland. Water Res. 2007, 41, 1001–1012. [Google Scholar] [CrossRef]
  40. Hashmi, M.A.K.; Krauss, M.; Escher, B.I.; Teodorović, I.; Brack, W. Effect-Directed Analysis of Progestogens and Glucocorticoids at Trace Concentrations in River Water. Environ. Toxicol. Chem. 2020, 39, 189–199. [Google Scholar] [CrossRef] [Green Version]
  41. Macova, M.; Toze, S.; Hodgers, L.; Mueller, J.F.; Bartkow, M.E.; Escher, B.I. Bioanalytical tools for the evaluation of organic micropollutants during sewage treatment, water recycling and drinking water generation. Water Res. 2011, 45, 4238–4247. [Google Scholar] [CrossRef] [PubMed]
  42. Tang, J.Y.M.; Escher, B.I. Realistic environmental mixtures of micropollutants in surface, drinking, and recycled water: Herbicides dominate the mixture toxicity toward algae. Environ. Toxicol. Chem. 2014, 33, 1427–1436. [Google Scholar] [CrossRef]
  43. Neale, P.A.; Braun, G.; Brack, W.; Carmona, E.; Gunold, R.; König, M.; Krauss, M.; Liebmann, L.; Liess, M.; Link, M.; et al. Assessing the mixture effects in In-Vitro bioassays of chemicals occurring in small agricultural streams during rain events. Environ. Sci. Technol. 2020, 54, 8280–8290. [Google Scholar] [CrossRef]
  44. Felis, E.; Sochacki, A.; Magiera, S. Degradation of benzotriazole and benzothiazole in treatment wetlands and by artificial sunlight. Water Res. 2016, 104, 441–448. [Google Scholar] [CrossRef]
  45. Button, M.; Nivala, J.; Weber, K.P.; Aubron, T.; Müller, R.A. Microbial community metabolic function in subsurface flow constructed wetlands of different designs. Ecol. Eng. 2015, 80, 162–171. [Google Scholar] [CrossRef]
  46. Kahl, S.; Kleinsteuber, S.; Nivala, J.; van Afferden, M.; Reemtsma, T. Emerging Biodegradation of the Previously Persistent Artificial Sweetener Acesulfame in Biological Wastewater Treatment. Environ. Sci. Technol. 2018, 52, 2717–2725. [Google Scholar] [CrossRef]
  47. Burke, V.; Greskowiak, J.; Grünenbaum, N.; Massmann, G. Redox and Temperature Dependent Attenuation of Twenty Organic Micropollutants—A Systematic Column Study. Water Environ. Res. 2016, 89, 155–167. [Google Scholar] [CrossRef]
Figure 1. Water quality profiles of selected conventional wastewater parameters such as oxidative reduction potential (A), dissolved oxygen (B), carbonaceous biochemical oxygen demand (C), total nitrogen (D), ammonia nitrogen (E), and E. coli (F) during experimental phase. Grey shaded areas represent days with aeration, no shading represents the interruption phase. Samples were taken at the wetland influent (IN), fractional distances 12.5%, 25%, 50%, 75%, and the wetland effluent (OUT).
Water 12 03050 g001
Figure 2. Concentrations of caffeine (A), ibuprofen (B), naproxen (C), benzotriazole (D), diclofenac (E), acesulfame (F) and carbamazepine (G) over the course of the experiment. Shown are the concentrations of IN and OUT as well as the internal profile concentrations at 12.5%, 25%, 50%, and 75% of the fractional length. Grey shaded areas represent days with aeration, no shading represents the interruption phase.
Water 12 03050 g002
Figure 3. Concentration removal of indicator CECs CAF, IBU, NPX, BTZ, DCL, ACE shown in (A), and CBZ (B). Grey shaded areas represent days with aeration, no shading represents the interruption phase. Internal profiles for each CEC concentration percent removal are provided in Figure S3.
Water 12 03050 g003
Figure 4. BEQs of oxidative stress response (A), activation of AhR (B), binding to PPARγ (C), activation of ERα (D), and CAT (E). Shown are the BEQs of IN and OUT as well as the internal profile BEQs at 12.5%, 25%, 50%, and 75% of the fractional length. Grey shaded areas represent days with aeration, no shading represents the interruption phase. For visualization dotted line was manually added in two circumstances, where no effect was observed because of invalid data (masking effects and cytotoxicity) on Day 14 for AREc32 (OUT) and PPARγ (IN).
Water 12 03050 g004
Figure 5. BEQ removals of oxidative stress response (AREc32), activation of AhR (AhR), activation of ERα (ERα), binding to PPARγ (PPARγ), and combined algae test (CAT) after treatment. Grey shaded areas represents days with aeration, no shading represents interruption phase. Internal profiles for each BEQ removal are provided in Figure S5. For visualization dotted line was manually added in two circumstances, where no effect was observed because of invalid data (masking effects and cytotoxicity) on Day 14 for oxidative stress response (OUT) and binding to PPARγ (IN).
Water 12 03050 g005
Figure 6. Recovery times in days after aeration interruption phase for selected chemical wastewater parameters, observed micropollutants and bioassays.
Water 12 03050 g006
Table 1. Timeline for the experiment.
TimePhaseSampling Routine
Conventional Wastewater Parameters and CECsBioassays
Day 0–14Baselineweeklyevery other week
Day 15–21Interruption of aerationdailyevery other day
Day 22–24Recovery phasedailyevery other day
Day 25–42Recovered-baselineweeklyevery other week
Table 2. Overview of applied bioassays, methods, reference compounds, effect concentrations (ECs) and bioanalytical equivalents (BEQs).
AssayEndpointReference CompoundEC ValueReference Compound EC Value (M)Bioanalytical Equivalent (BEQ)
AhR CALUX [32]Activation of the aryl hydrocarbon receptorBenzo[a]pyreneEC10(8.38 ± 0.55) × 10−10Benzo[a]pyrene-EQ (B[a]P-EQ)
AREc32 [33]Oxidative
Stress Response
DichlorvosECIR1.5(7.70 ± 0.30) × 10−6Dichlorvos-EQ
ERα-GeneBLAzer [11]Activation of the estrogen receptor17β-EstradiolEC10(1.57 ± 0.03) × 10−1117β-Estradiol-EQ (EEQ)
GR-GeneBLAzer [11]Activation of glucocorticoid receptorDexamethasoneEC10(4.69 ± 0.06) × 10−10Dexamethasone-EQ
PPARγ-GeneBLAzer [30]Binding to the peroxisome proliferator-activated receptor gammaRosiglitazoneEC10(4.97 ± 0.08) × 10−10Rosiglitazone-EQ
Combined algae test [31]Inhibition of IPAM 2 hDiuronEC50(2.91) × 10−8
(2.76–3.06) × 10−8 a
Diuron-EQ2 h IPAM
(DEQ2 h IPAM)
Inhibition of IPAM 24 hDiuronEC50(4.66) × 10−8
(4.24–5.12) × 10−8 a
Diuron-EQ24 h IPAM
(DEQ24 h IPAM)
Inhibition of growthDiuronEC50(1.26) × 10−6
(0.75–1.95) × 10−6 a
Diuron-EQ24 h growth
(DEQ24 h growth)
a 96% confidence interval.
Table 3. Conventional water quality parameters of the wastewater influent. Means and standard deviations (SD) are shown. Numbers of samples are listed as n.
pHEC
µS/cm
DO
mg/L
ORP
mV
CBOD5
mg/L
TOC
mg/L
TN
mg/L
NH4-N
mg/L
NO3-N
mg/L
NO2-N
mg/L
E. coli
MPN/100 mL
Mean6.920080.4−26934118599800.040.016.45 × 106
SD0.12620.221113411090.000.000.19 × 106
n1616161616161616161611
Table 4. Influent concentrations of the indicator compounds caffeine (CAF), ibuprofen (IBU), naproxen (NPX), benzotriazole (BTZ), diclofenac (DCL), acesulfame (ACE) and carbamazepine (CBZ) for the wastewater. Mean and standard deviations (SD) are shown. Numbers of samples are listed as n.
CAF
(µg/L)
IBU
(µg/L)
NPX
(µg/L)
BTZ
(µg/L)
DCL
(µg/L)
ACE
(µg/L)
CBZ
(µg/L)
Mean13.839.85.525.38.448.24.6
SD17.38.71.44.71.69.20.7
n16161616161616
Publisher’s Note: MDPI stays neutral with regard to jurisdictional claims in published maps and institutional affiliations.

