Review

Water Footprints and Virtual Water Flows Embodied in the Power Supply Chain

by
Like Wang
1,
Yee Van Fan
1,
Petar Sabev Varbanov
1,*,
Sharifah Rafidah Wan Alwi
2 and
Jiří Jaromír Klemeš
1
1
Sustainable Process Integration Laboratory—SPIL, NETME Centre, Faculty of Mechanical Engineering, Brno University of Technology—VUT Brno, Technická 2896/2, 616 69 Brno, Czech Republic
2
Process Systems Engineering Centre (PROSPECT), Research Institute for Sustainable Environment, School of Chemical and Energy Engineering, Faculty of Engineering, Universiti Teknologi Malaysia (UTM), UTM Johor Bahru 81310, Johor, Malaysia
*
Author to whom correspondence should be addressed.
Water 2020, 12(11), 3006; https://doi.org/10.3390/w12113006
Submission received: 10 September 2020 / Revised: 22 October 2020 / Accepted: 23 October 2020 / Published: 26 October 2020
(This article belongs to the Section Water Resources Management, Policy and Governance)

Abstract

:
Water use within power supply chains has been frequently investigated. A unified framework to quantify the water use of power supply chains deserves more development. This article provides an overview of the water footprint and virtual water incorporated into power supply chains. A water-use mapping model of the power supply chain is proposed in order to map the analysed research works according to the considered aspects. The distribution of water footprint per power generation technology per region is illustrated, in which Asia is characterised by the largest variation of the water footprint in hydro-, solar, and wind power. A broader consensus on the system boundary for the water footprint evaluation is needed. The review also concludes that the water footprint of power estimated by a top-down approach is usually higher and more accurate. A consistent virtual water accounting framework for power supply chains is still lacking. Water scarcity risks could increase through domestic and global power trade. This review provides policymakers with insights on integrating water and energy resources in order to achieve sustainable development for power supply chains. For future work, it is essential to identify the responsibilities of both the supply and demand sides to alleviate the water stress.

Graphical Abstract

1. Introduction

Water and energy security have become two major challenges in the world due to the growing gap between demand and supply [1], with constantly emerging new water pollution threats [2] that have to be minimised and prevented. Water use for power production is reported to contribute 25% (51.9 km3) of the total global water consumption in energy production, of which 75% is contributed by fuel production [3]. It is reported that up to 93% of the water for energy production is contributed by the power supply in some Eastern countries [4]. In 2050, the total power generation is estimated to be double that in 2020 (see Figure 1a), while the share of energy sources is projected to be dominated by renewables in 2050 [5]. Figure 1b shows the world power demand for 2020 and the projection for 2050 broken down by regions, whose overall trend is in line with the projection of the power supply. It is essential to understand the water use of the power supply chain to ensure water sustainability in terms of availability, minimising ecosystem pollution and maximising power supply security.
The water footprint [8] is a well-established metric, defined as the volume of consumed or polluted freshwater required to produce a certain amount of goods or services [9]. The water footprint includes green water, referring to the rainwater stored in soils, blue water (freshwater from rivers and wells and greywater), and greywater (polluted water) as has been overviewed [10]. It has been widely used to quantify water use at various scales [11] using the Life Cycle Assessment (LCA), and it has been detailed further [12]. This concept has been extended to be more general so as to describe embodied water when compared to the original definition of virtual water [13]. Virtual water is proposed as a concept to measure the (direct and indirect) embodied water of products or services in international trade [14]. Recently, virtual water has been widely applied to analyse the water resources used in the food trade [15].
The impact of the power supply chain on water sources has been assessed in terms of power supply, trade, and demand. The scope of study on the power supply side mainly focuses on assessing the water footprint for various fuel types [16], different cooling technologies (open-, closed-, hybrid, and dry cooling) [16], low-carbon technologies (solar, wind, and carbon emissions capture technology) [17], and environmental issues (climate change, water scarcity, pollution) contributed by the power supply chain [18]. Power supply and demand are typically spatially nonuniform [19], which induces regional power trade, and regional differences in power supply and water resources are reallocated. Figure 2 shows the power generation and net trade, as well as the global distribution of water scarcity over the world’s regions, for the year 2017. The Water Stress Index (WSI) ranges widely from 0.98 (Egypt) to 0.1 (Canada). The total power generation of the listed countries (24 countries in Figure 2) accounts for over 80% of the global amount. The top three power generation countries in 2017, China (6.2 PWh), the United States (4.0 PWh), and India (1.2 PWh), face a conflict between water resources and electricity generation, with the WSI being as high as 0.48, 0.50, and 0.97. The question of how to assess and evaluate the power trade effect on water resource relocation becomes an issue. This is of increasing concern to virtual water resource transfers in cross-regional power trade. This is motivated by the significant footprints that stem from satisfying power demands via both local generation and regional power trade flows.
A network of transferring virtual water resources was assessed based on the inter-regional power trade [20], and the spatial virtual water transfers were analysed. Water scarcity has been highlighted as another essential indicator for characterising the regional water consumption and availability [21], and it allows for a better understanding of what is causing water scarcity and which regions are suffering from it [22]. To understand and compare the spatial distribution of water use in the power supply chain, it is important to (a) evaluate the water footprint on the supply side, (b) identify the driving water use on the demand side, and (c) assess the virtual water transfers in the power trade that trigger the water scarcity effect.
The currently available reviews are found to be power supply-oriented and to focus on the water footprint of power generation. The supply and trade stages of the supply chains are not well covered. Water footprints of power generation technologies were harmonised, including fossil fuel-based (coal, natural gas, oil), nuclear, and other renewable power [23]. That work provides a foundation and dataset for the further assessment of water footprints in power generation. However, the origin of the data is specific to the United States. The accuracy of the harmonisation results is affected by the method choices, defined boundary, and selected parameters. However, the uncertainties in the results have not been explored or discussed. An inventory of water footprints was presented for power generation technologies in China in [24]. The study is focused on the operation stage, where the footprints of fuel supplies and infrastructures are not considered. These leave open the question of adding the water footprints of natural gas and oil to the assessments, overcoming some of the data limitations.
An inventory of the water footprint for power production was compiled in [25] using a global meta-analysis. It highlights the importance of accounting for different geographic conditions and a complete life cycle stage identification, as well as performance parameters, in estimating water footprints. It cited the research from [23] as an example for analysing the uncertainty caused by differences of data sources. However, the uncertainty analysis in a data source can be relatively simple. Only a qualitative analysis is conducted, using the correlations of different parameters. For the uncertainty in method choices, only process-based and hybrid life cycle assessments are analysed and compared. A more detailed comparison of methods would be beneficial. It should also be noted that the life cycle definition in that work has again been limited to power generation only, leaving out trade and distribution.
With the increase of regional linkages in the inter-regional power trade, a more recent review emphasised footprints from the perspective of power consumption [26]. It identified space cooling/heating and hot water demands as an important part of the water used for power in households. However, the virtual water transfers between power generation and consumption as well as the water scarcity effect have not yet been understood in full. Dai et al. [27] published another review of 35 methods for assessing the water-energy-food nexus and provided a detailed introduction of these methods, grouped by the geographical scale and nexus scope. From the viewpoint of the overall power supply chain and impacts, only some models for assessing water use for power generation are partly discussed, and there is a lack of systematic methods for evaluating water use for power trade, power use, and the link to water footprints.
From the provided analysis, it can be seen that the existing reviews focus on partial aspects in the power supply chains—most notably on power generation. Some of the studies point to the need for a complete Life Cycle evaluation but stop short of including essential stages such as power trade and use, as well as water footprint impacts’ relation to these elements. It has become apparent that a review on assessing the impact of power demand and trade from the perspective of water footprints, including virtual water flows and water scarcity, still requires more development.
This study aims to review the methods for analysing the water footprints from power generation, linked to the virtual water of power trade and the water scarcity effects. The explicit consideration of the strong regional linkages of power supply, demand, and virtual water transfers is considered. This is expected to further help researchers and decision-makers in understanding and evaluating the impact of power trade on water resources. Another goal is to link power demand to the analysis, which would help improve water use efficiency. The objective of linking water footprints and water scarcity on the one hand to power demands on the other via virtual water transfers is essential for completing life cycle definitions and providing a proper understanding, for decision-makers, on how to minimise footprints.

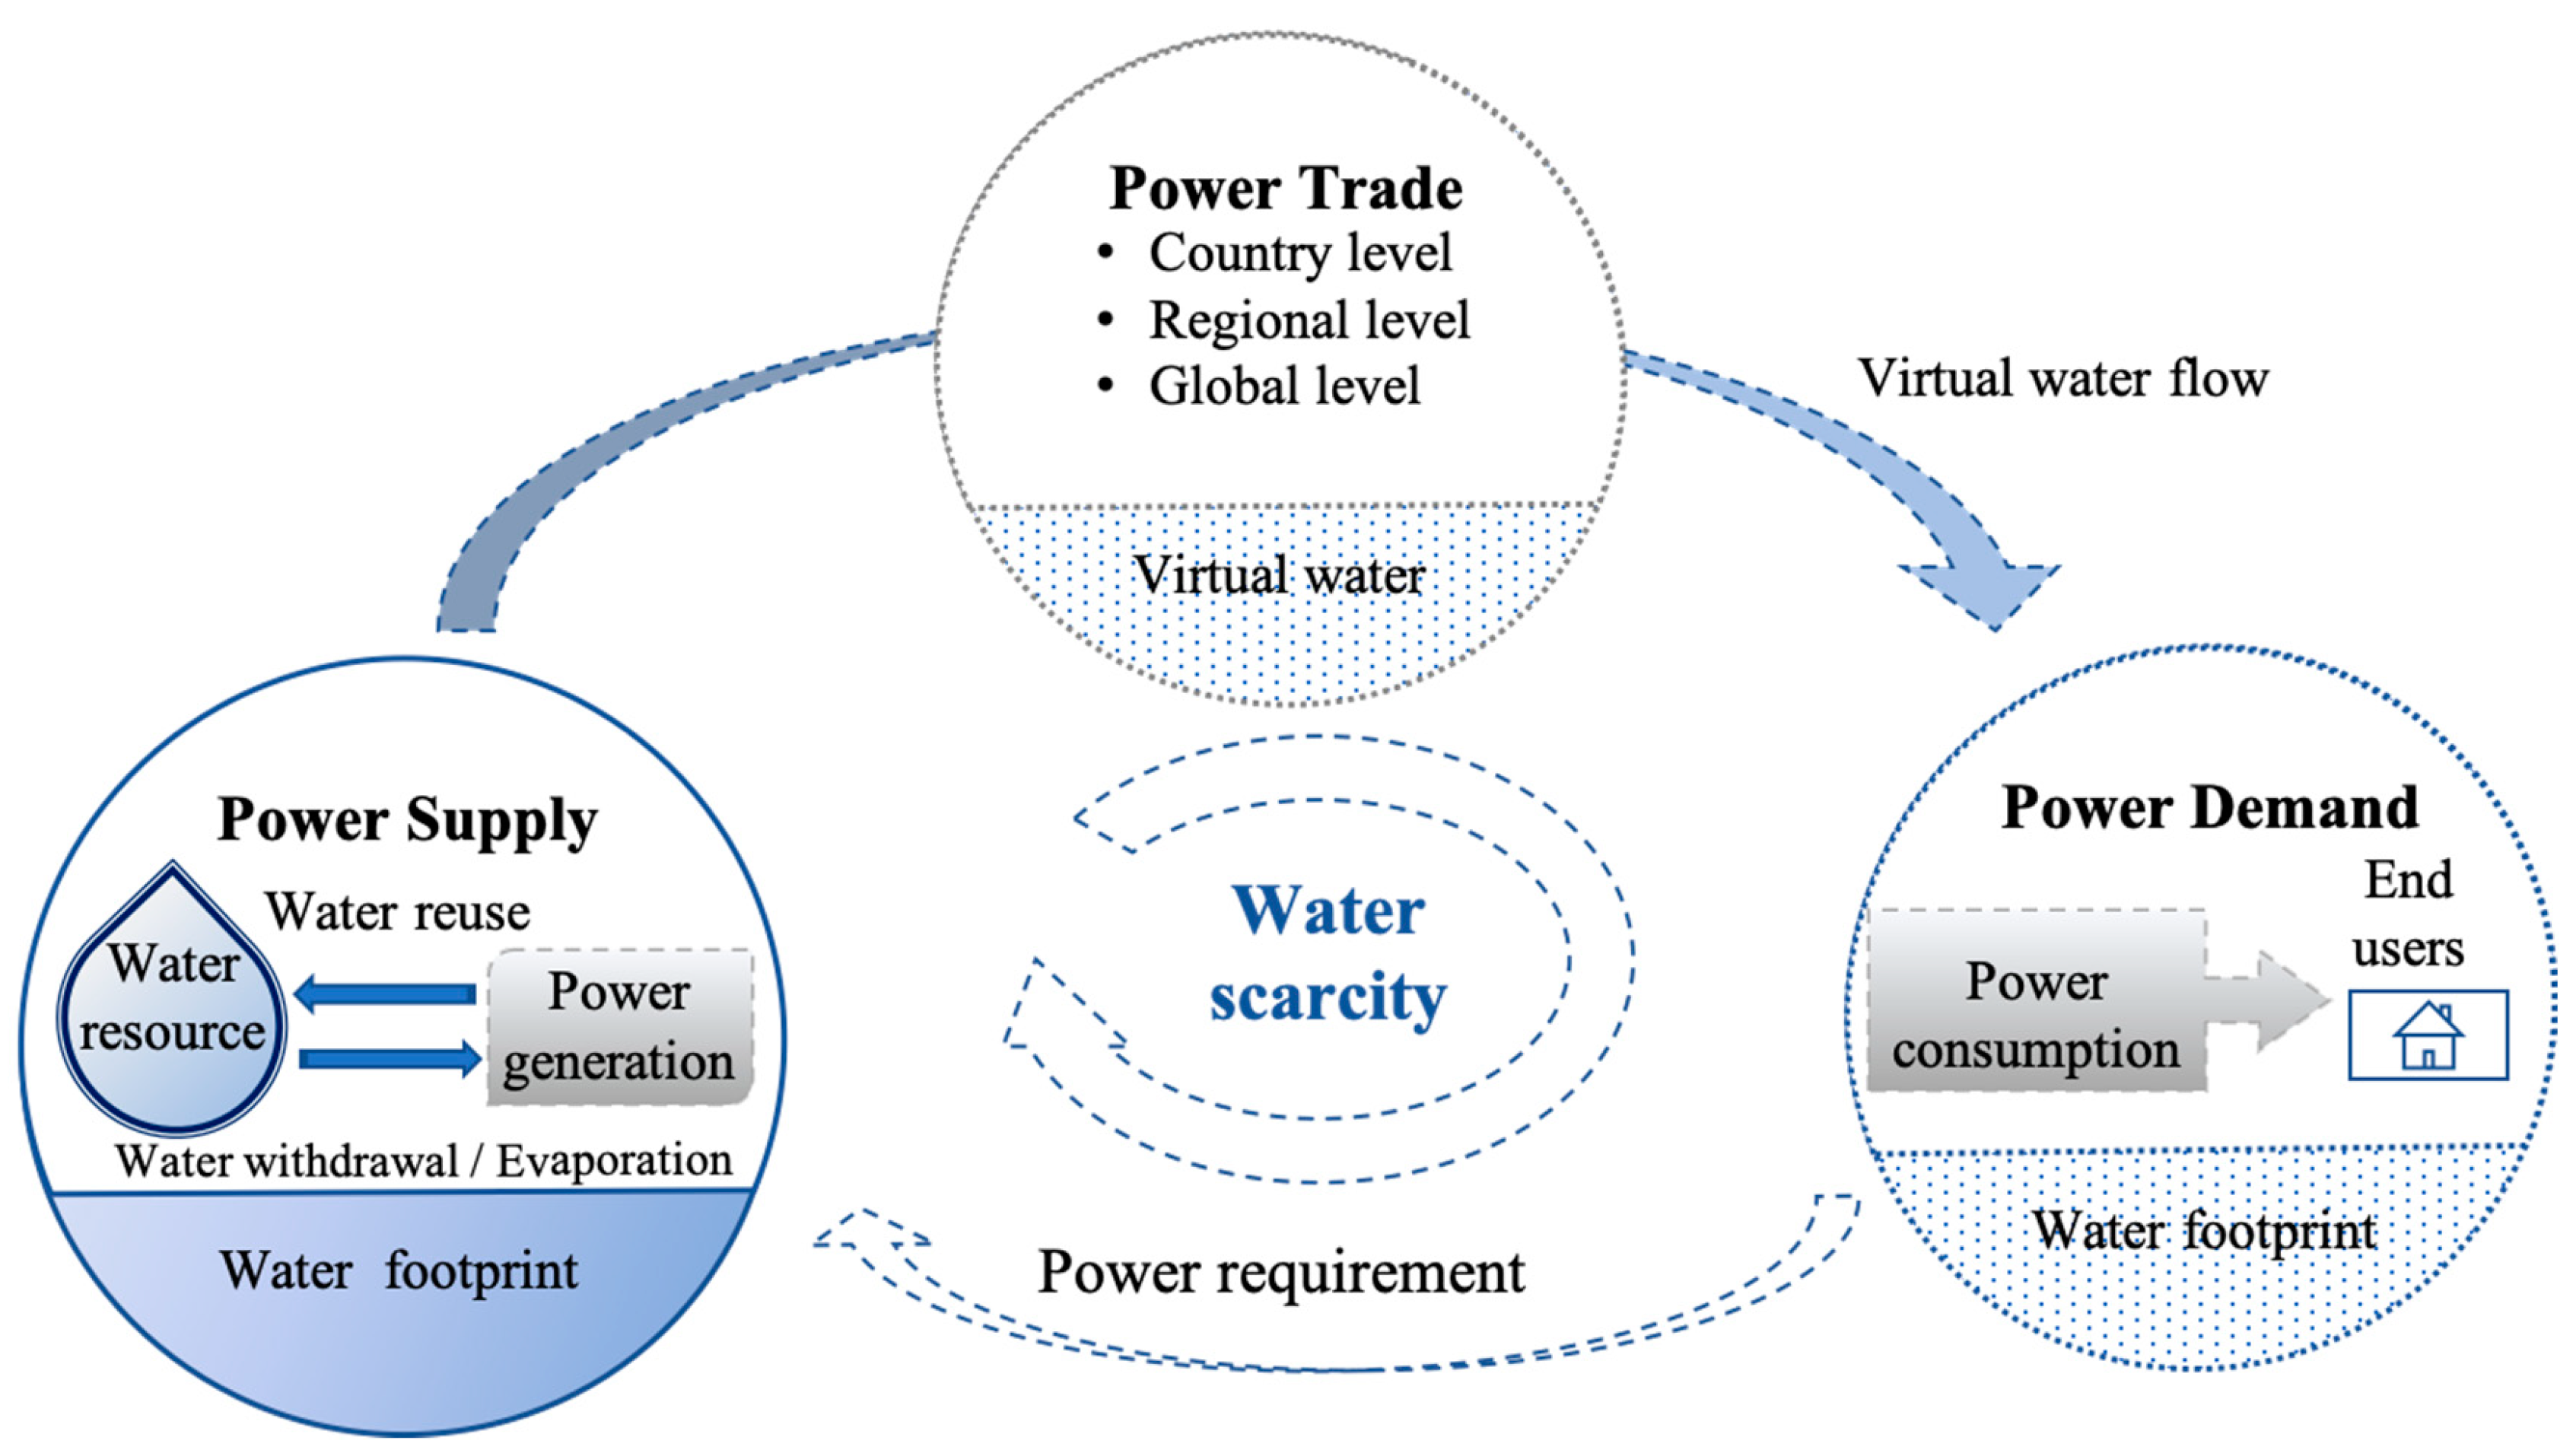
2. Water Footprint and Virtual Water of Power Supply Chains

This section is divided into two parts: one focuses on the water footprint of power generation, and the other is related to the virtual water transfers within power trade.
Figure 3 shows a cause-effect diagram tracking water use in the power supply chain. On the supply side, after water withdrawal, part of the water is consumed in cooling towers (or fuel power plants) or is evaporated from hydroelectric dams [30]. The rest water would return to the natural system through water reuse or discharge [31]. Water consumption in this process is defined as the water footprint of power. Power is traded to the demand side, and water embodied in the power trade is virtual water. Water scarcity plays an important role in the conflict between power generation and water withdrawal, which induces some environmental and social issues during the power supply chain. The increasing power on the demand side increases the required water on the supply side [32]. In particular, when the power transfers from a high water scarcity region (supply side) to a low water scarcity region (demand side), the water stress burden shifts from the demand side to the supply side.

2.1. Water Footprint of Power Supply

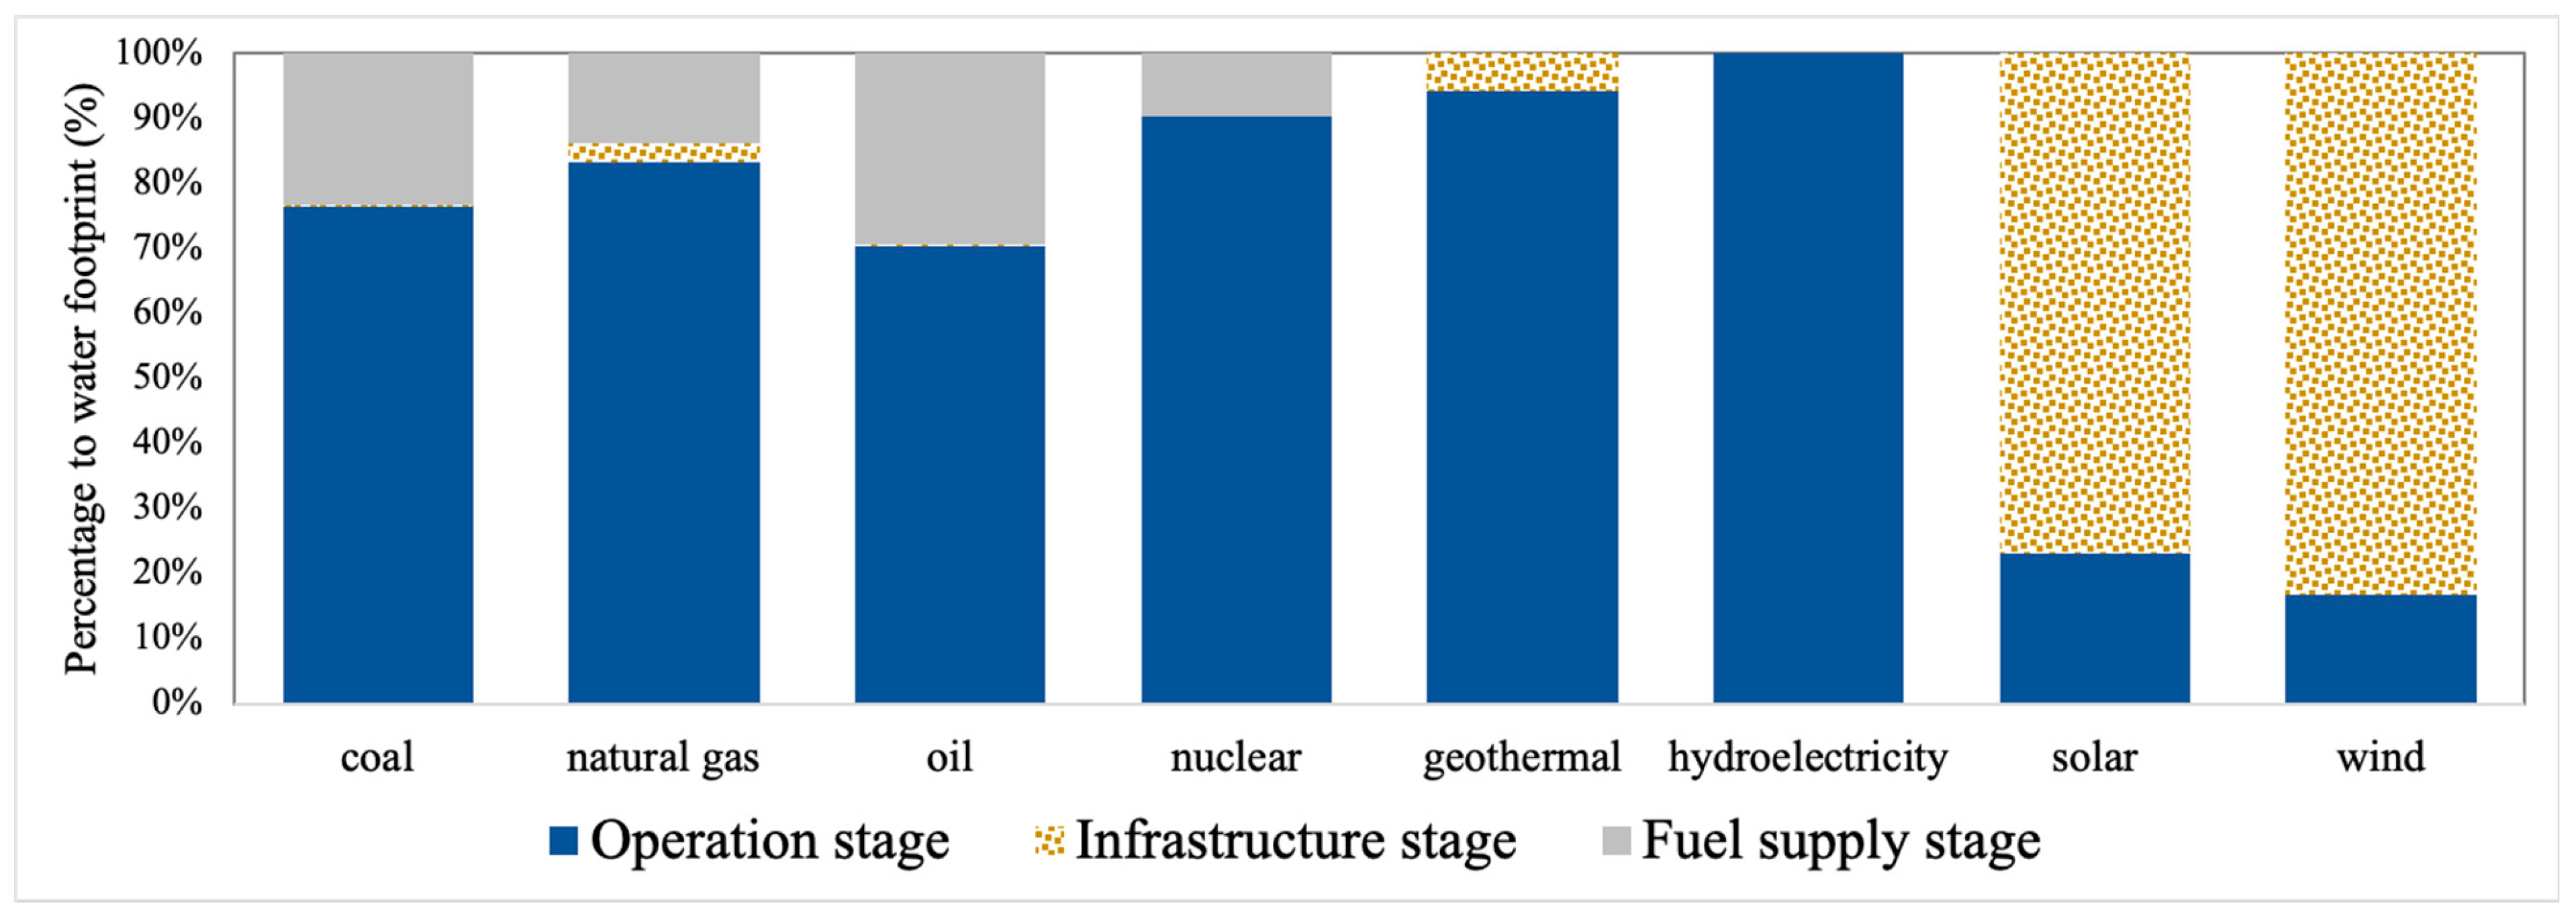
2.1.1. Comparison of Water Footprints of Different Power Types

Power can be generated from fossil fuels or renewable sources. Thermal power generation (including coal, natural gas, oil), accounting for nearly 70% of the global power generation, has been studied the most. A shift to renewable energy, such as hydro-, solar, and wind power, has become a new focus. Water footprint quantification highly depends on the boundary setting. For the water footprints of fossil fuel, nuclear, geothermal, and hydropower, the water footprint of the operation stage accounted for 70% to 94% of the life-cycle water footprint (see Figure 4). The second most significant contribution comes from the stage of fuel supply (extraction, production, transportation)—from 10% to 29% [33]. A similar result is reported by Mekonnen et al. [34], where the operation, fuel supply, and infrastructure stages contribute 57%, 43%, and 0.02% of the global average level. An indirect water footprint incurred during the infrastructure building stage dominates the water footprints of renewable energy—such as solar photovoltaic and wind power [35]. It was shown that more than 70% of the LCA-based water consumption of solar and wind in Europe is due to infrastructure building and materials. A similar result is shown for the solar power infrastructure in China [35].
Figure 5 summarises the water footprint estimation of power generation reported in different reference sources. A significant difference exists in the estimates of the water footprints of power generation. On a comparable basis (specific water footprint per unit of power generation), Asia has the largest variation of water footprints in hydro-, solar, and wind power, while Europe has the largest values in fossil-fuel-based power. Hydropower is the energy generation with the highest reported water footprint and variation (0.11–552 m3/MWh, see Figure 5). The reasons for such a huge gap of three orders of magnitude between the minimum and the maximum can be explained by two observations. One is that the variation changes with geological and climatic conditions, as well as the facility types of hydropower plants [36]. The other possible reason is that there is little agreement on water footprint methods—which stages and flows to include in an assessment. Water footprints may be overestimated if a reservoir’s water use is attributed entirely to power generation only. Besides hydropower generation, more than 40% of the world’s reservoirs have multiple purposes, such as irrigation, residential and industrial water supply, flood protection, fishing and recreation, and more [37]. An economic benefit model was used for water consumption allocation in multipurpose reservoirs, and the results showed that hydropower was the major contributor to economic benefits [38].
The water footprints of coal range from 0.03 m3/MWh [25] to 3.79 m3/MWh [34]; the water footprint of natural gas is 0.4 m3/MWh [39]–3.33 m3/MWh [34]; and the water footprint of oil is 0.33–3.83 m3/MWh [34] (see Figure 5). The differences in water consumption are caused by different technological levels and conditions for burning fossil fuels. For example, comparing the four regions of Europe classified by [45] (see the orange diamond markers shown in Figure 5), the technological levels (such as average hourly loads) lead to the water footprints ranging with different regions, even when using the same method [46]. Based on the different boundary settings (fuel supply stage, infrastructure stage, and operation stage), the water footprint of nuclear power fluctuates between 0.13 and 4.03 m3/MWh. Excluding the water consumption in the fuel supply stage would lead to a lower estimation (36%) [34]. For other renewable powers, when the infrastructure stage is considered, the water footprint is larger than when only the power generation operation stage is considered [47]. An uncertainty analysis is often introduced to provide the ranges of water footprints and to prevent the data from being too deterministic.

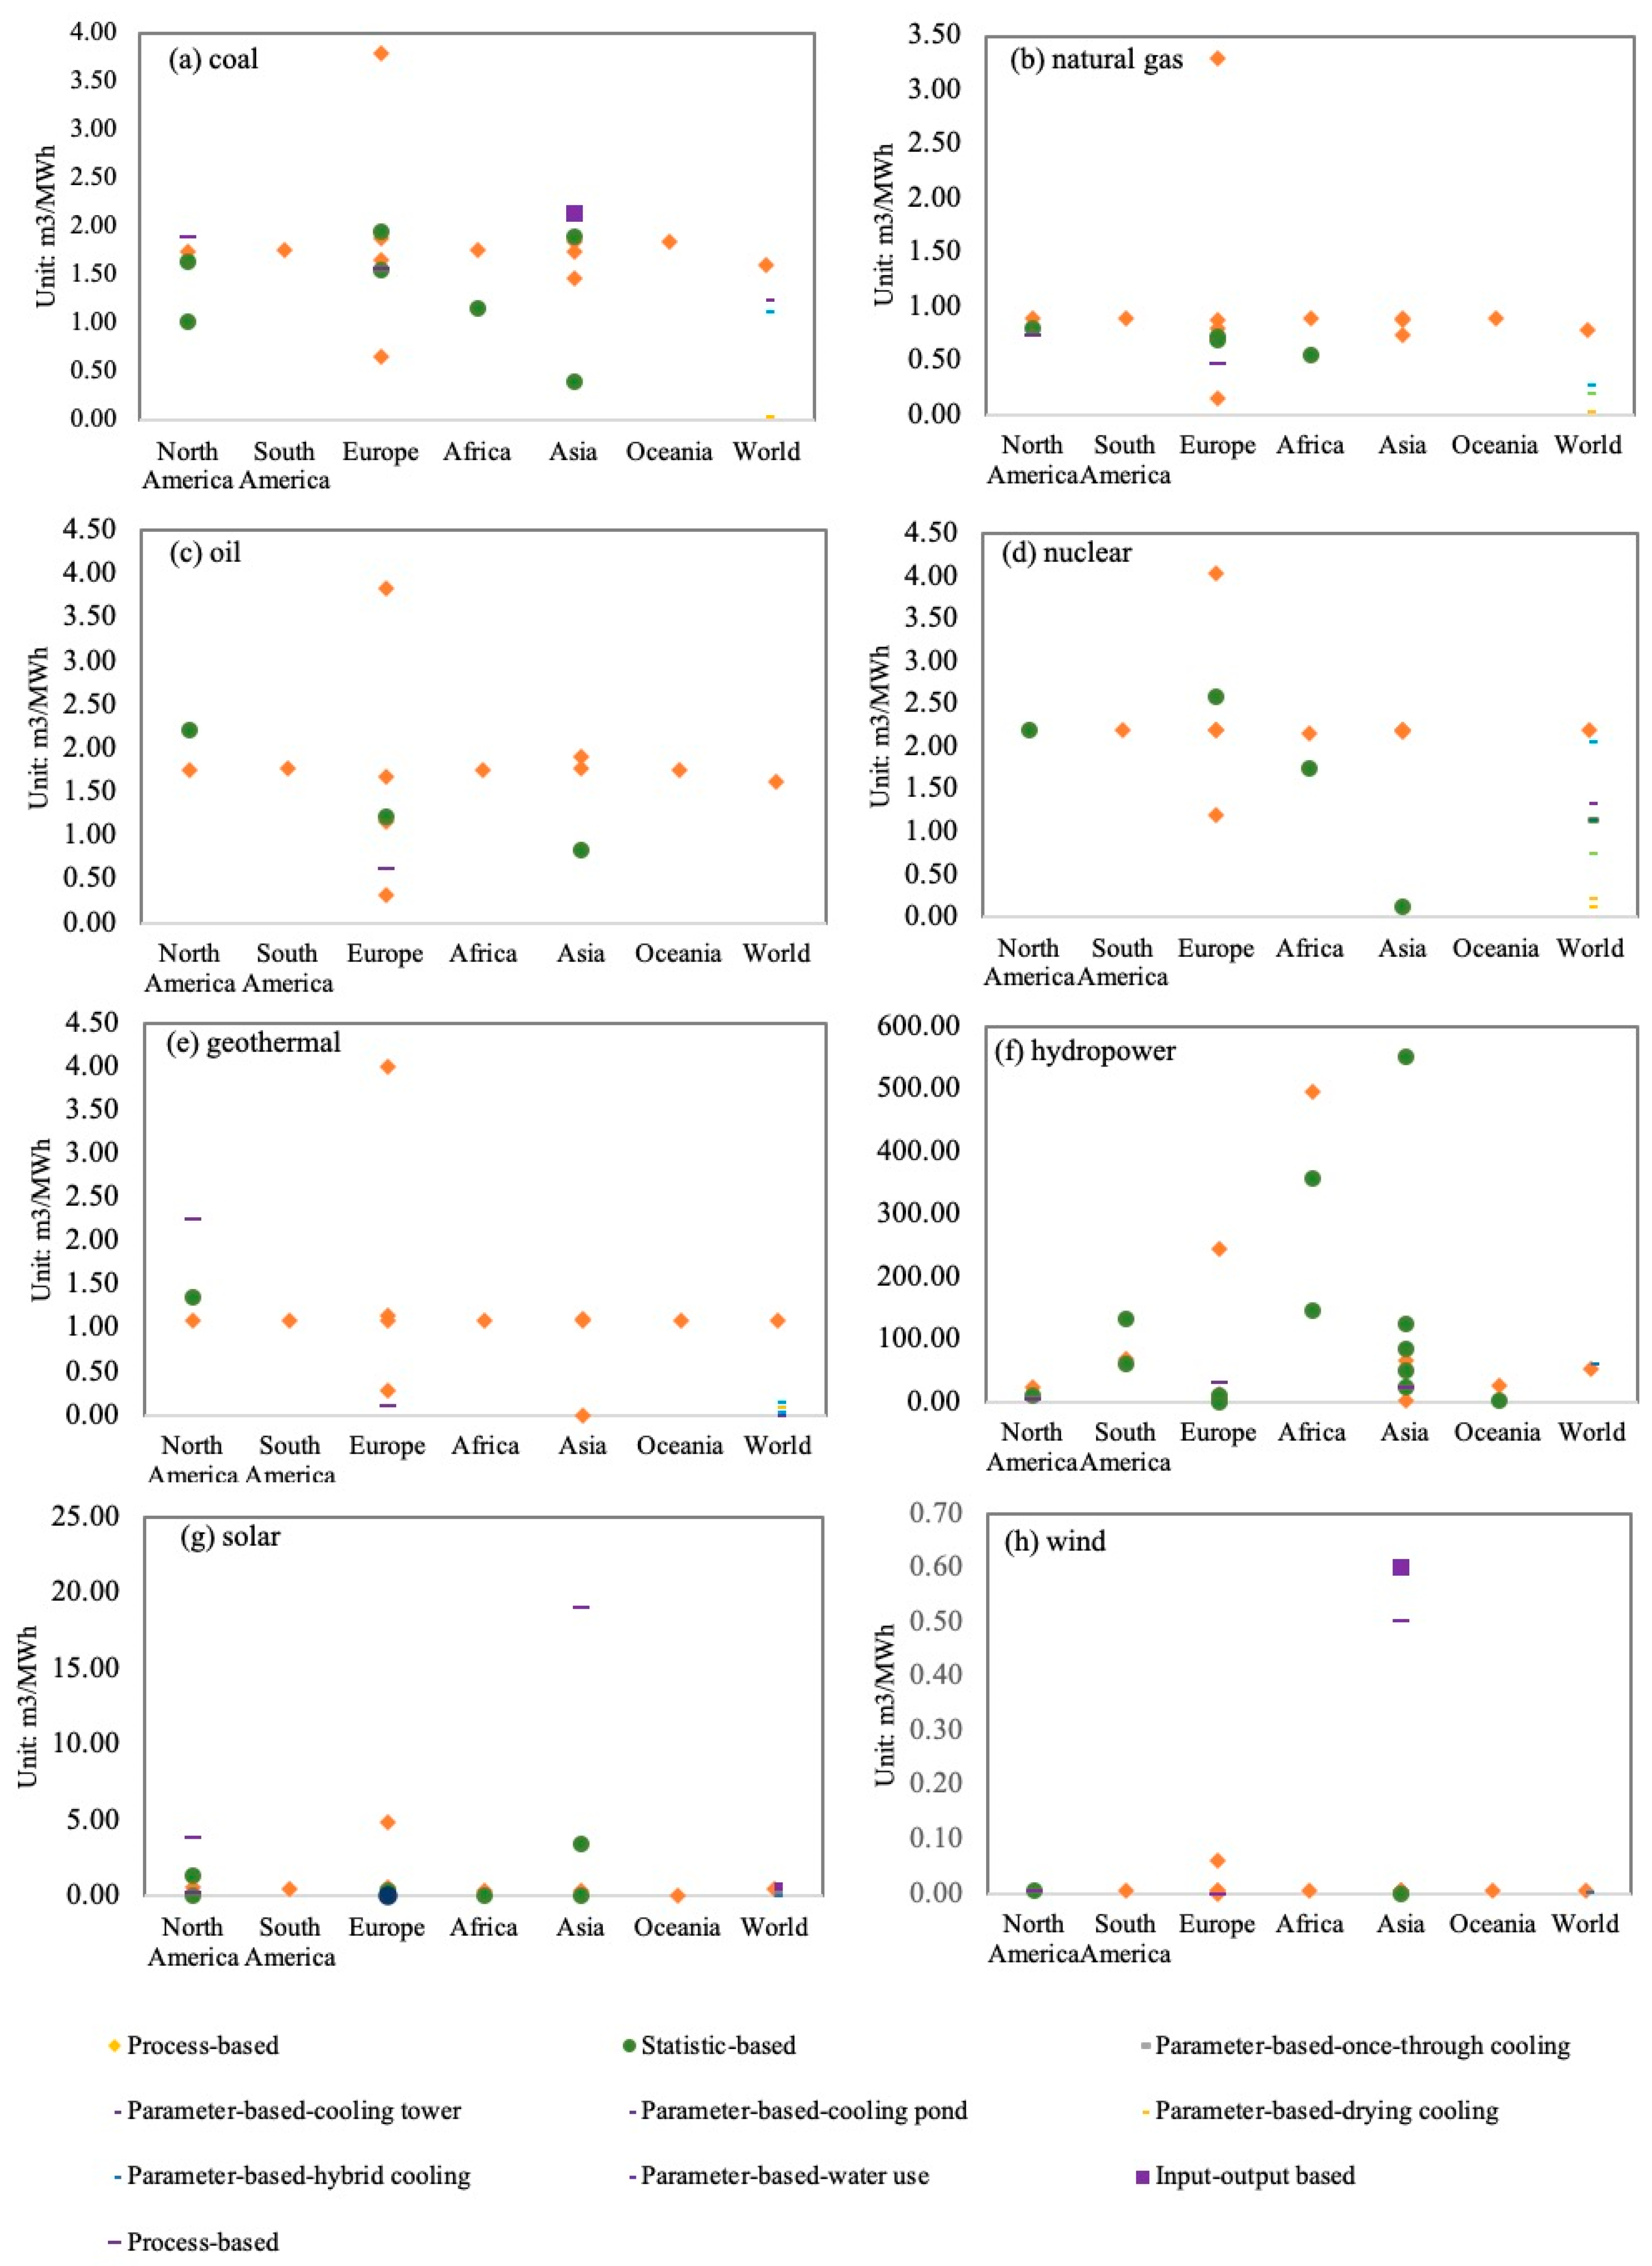
2.1.2. Comparison of Different Methods

The methods applied for the water footprint estimation mainly include the process-based (bottom-up method) and input-output based methods (top-down method) (see Table 1). The process-based method has been widely used to estimate water footprints in Europe [33] and America [44] within different boundary settings. From a life-cycle assessment, Jin et al. [25] compared the estimations by process and hybrid methods for the water footprint of power (such as fossil fuel, nuclear, wind, concentrated solar, and photovoltaic power), and the estimations based on the hybrid method were larger than those using the process method. The opposite result occurred for water footprints of hydropower. This is because the estimation of hydropower largely depends on direct water consumption during the operation stage. It can be found that water footprints in upstream stages (fuel supply and infrastructure stages) are more important for thermal power. The hybrid method has advantages in reflecting the water consumption in the upstream stage, but it is not suitable for estimation at a global level and would render the specific processes for a case study vague. A global assessment for the water footprint of power generation was conducted based on the different regions, using the bottom-up process method, and Europe was identified as featuring the largest water footprints for power generation [34]. The water footprint of a run-of-river plant was lower than that of a reservoir-based plant located in southern Norway, and the annual reinvestment was regarded as an important part of the water footprint in a run-of-river plant [48].
The input-output based method is useful for estimating the water footprint at a regional level [51], applying the Multi-Regional Input-Output (MRIO) model. It is usually calculated through the monetary interactions with other sectors (see Standard and Hybrid MRIO). Weinzettel et al. [50] compared these two methods and found that the hybrid MRIO model could match the total imports and exports with a balanced system; moreover, the standard MRIO model might introduce a significant error due to low resolution and poor data quality. Chai et al. [42] incorporated physical power flows into the Input-Output table rather than only relying on the monetary interaction, indicating that the water footprint based on the Mixed-Unit Input-Output (MUIO) method had a clear physical meaning. There is a lack of comparative studies to verify the advantage of the MUIO model.
Comparing these process-based and Input-Output-based methods, Figure 5 shows (see the purple square) that the water footprints calculated by the input-output method for coal [42] and wind [43] are larger than those calculated by the process-based methods. The reasons for this can be explained by the boundary cut-off of different method choices. The results were compared under assumed and real conditions, using these two methods: the truncation error caused by the boundary cut-off of process-based method outweighed the aggregation error of the input-output-based method [52]. The water footprint calculated by the input-output-based method usually has a higher and more accurate value than the process-based method. However, the use of the input-output-based method is limited by access to the input-output table (only published in a specific year), and the process-based method can be used in more flexible conditions (more data source choices). A more consistent method for the water footprint evaluation of power generation is still missing. This points to the need to analyse the power supply chains in their entirety, which is currently mainly contemplated for power generation [1], in order to be able to assess footprint contributions to the various stages and their interactions.
Using data published by authorised institutions, parameter-based and statistics-based methods can be used to uncover the characteristics of water footprints. The parameter-based method (see the dash symbol indicated in the legend of Figure 5), heavily relying on performance parameters, seems to be more accurate for estimating the water footprint. Water footprints for coal-fired power generation [41], natural gas-fired power generation [39], and seven renewable power generations considering different cooling technologies were developed and compared, where the water footprints were harmonised at the most likely conversion efficiencies assumed in the base case [40]. However, this method may lead to an inaccurate estimation when some key performance parameters are omitted. As Figure 5e illustrates, water footprints of geothermal power technologies are obviously lower than for other methods. The reason for this can be explained: the conditions of air temperature and humidity constraint also have a large impact on water footprints [53]. Only relying on the conversion efficiency parameter would mislead the estimation. The statistics-based method usually provides a more comprehensive and wider inventory for water footprints of different power generation pathways, but it requires high-resolution and accessible data. Jin et al. [25] used the statistics-based method (meta-analysis) to characterise the global water footprints of different power technologies (see the green dot in Figure 5), and Larsen and Drews [54] estimated the water footprints for Europe on spatial-temporal scales, while different data sources with inconsistent system boundaries and unclear definitions cannot be controlled. The water footprint of power was calculated considering the total annual amount of water that evaporated from reservoirs areas [55] and using the data from 875 representative hydro-reservoirs. This argues that the water footprint of hydropower is more consistent with the energy-related water intensity when using the net evapotranspiration from local land cover [56]. Even with a complete and available data source, there is still little agreement on what the exact water footprint range is.
Comparing these four available methods (process-based, input-output based, parameter-based, and statistics-based analyses), the lack of consistent conclusions about the exact impacts of the different technologies on the water resource has become apparent. This reveals the need for a methodological approach in order to perform a more reliable comparison of the water footprints of the various power technologies. A benchmark is needed to compare the different water footprints of power technologies. In this context, the example of the study by Bakken et al. [57] can be seen as a step forward. It proposed that an improved conceptual framework for the water footprint of hydropower was needed in a fairer way, one that did not attribute all evaporation losses from dams to power generation—as further discussed in [58]. There have been studies that have tried to develop benchmark values for water footprints from the life cycle of coal-based power generation [41], natural gas-fired power generation [39], and renewable energy technology-based power generation [40]. However, these factors are regarded as relating to the global level, and in further work, the solution needs to extend to the regional level.

2.2. Virtual Water Transfers of Power Trade

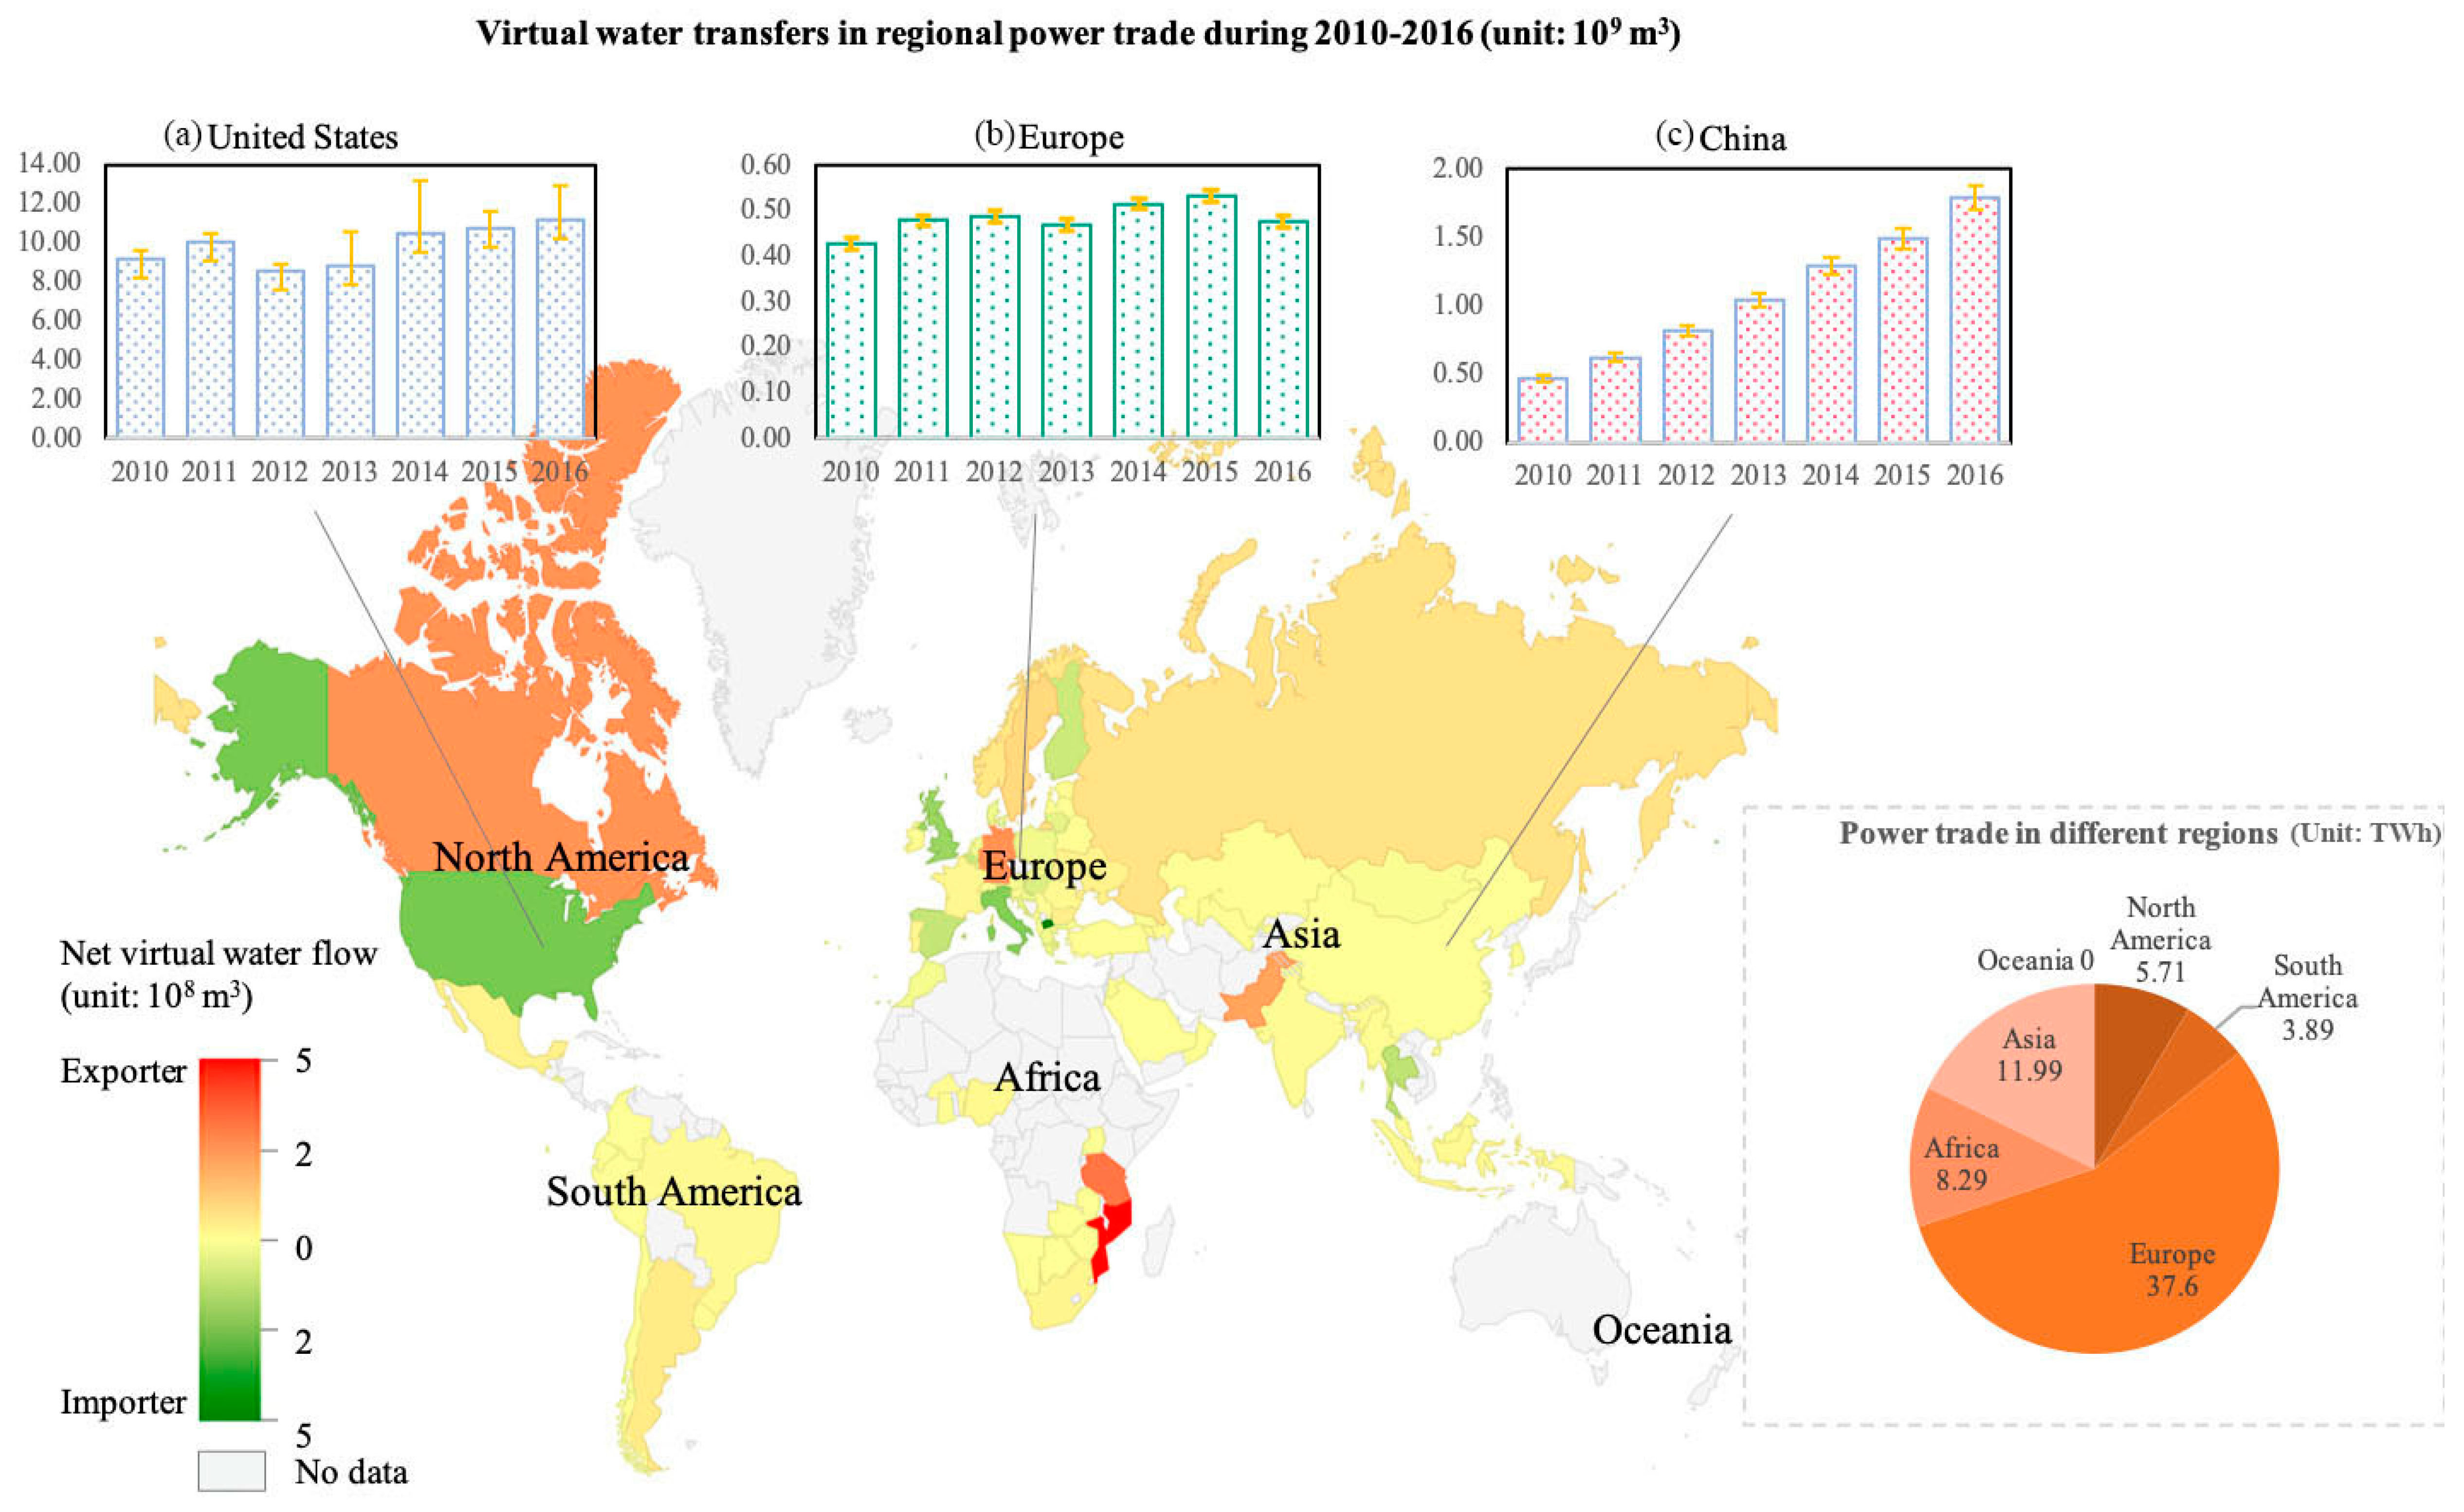
2.2.1. Virtual Water Transfers of Power Trade in Different Countries

Cross-regional power trade brings about an economic benefit for the supply side [59]. Still, it would increase the water requirements for local power generation [60]. A definition of the approximate end-use water from power at different geographic coverages and resolutions could provide the level of detail necessary to inform policy and to characterise a more accurate water-use inventory. It is crucial to analyse the virtual water embodied in power trade. The recent work related to virtual water transfers is summarised in Table 2.
Global power trade has been steadily increasing in the past decades. As illustrated, the global power trade has covered North and South America, Europe, Asia, and the southern parts of Africa. Europe has the largest power trade (up to 37.6 TWh in 2017). Germany (Europe) and Canada (North America) are identified as the largest exporters of virtual water; the United Kingdom, Italy, and the United States (North America) are the largest virtual water importers. Similar results are available from [61] in relation to identifying importers and exporters, but there are only a few studies that seek to cover the detailed power trade pathways on a global level, and just some analyses for a specific region. In Europe, the virtual water was transferred from France to Germany in 2014 but from France to Italy in 2016 [62]. Within specific countries, virtual water transfers increase: from 9.21 km3 to 11.21 km3 in the United States [63] and from 0.47 km3 to 1.79 km3 in China. Only the domestic virtual water transfer effect was involved, which can be explained by the domestic power trade effect being stronger than the global power trade effect in these countries (see Figure 6a,c—the callouts showing the trends of the virtual water flows with time for (a) the United States, (b) Europe, (c) China.). Studies on virtual water transfer and its effect by both global and domestic supply chains are still lacking and present an avenue for further work.
In order to obtain clear accounting boundaries and reliable data, most studies do not include hydropower. For other energy sources, such as wind and solar power, although they impose a small impact due to their negligible water footprints, recent work has begun to pay more attention to renewable power in power trade. The virtual water transfers via China’s electric grids (including renewable power) [64] are nearly four-fold as important as those (excluding renewable power) [65] in 2014. However, renewable power cannot be missing in the power trade.

2.2.2. Comparison of Different Methods

In the exploration of virtual water transfers of power trade, the quantitative method of virtual water transfers has been continuously improved with the improvement of data accuracy. On a coarse level, the MRIO (Multi-Region Input Output) model [70] and ecological network analysis [67] were used to estimate virtual water transfers. As has been mentioned in Section 2.1.1, the measurement of virtual water transfers is not accurate because it depends on monetary or ecological flows rather than physical power flow. A Quasi-Input-Output model [73] was first built to estimate the emission factors for purchased power from interconnected grids at the country and global levels [74]. The total electricity trade amount is divided into many power trade pathways. In this method, however, many power trade pathways are created without reasonable geographical ranges, and the amount of power transfers in real power flows is therefore cut down.
Besides these methods, network-based methods are more suitable for the quantification of virtual water transfers because the model is based on the specific power transmission data of different grids. Direct trade-adjustment [66] and Node-Flow model [69] are two typical methods. The Node-Flow model takes the indirect imports and exports of power into account and is hence more suitable than the direct trade-adjustment approach for quantifying virtual water transfers of power trade. Comparing these two methods, the virtual water transfers in China calculated by the Node-Flow method [64] are twice as important as those calculated with the direct trade-adjustment method [69] in the same year. The large difference of these two methods can be explained as follows: with virtual water estimation, the consumed power may be generated by multiple regional grids, where power is generated under different energy sources, technologies, and different geological and climatic conditions. But in the direct trade-adjustment method, the basic assumption is that consumed power is just generated under the same conditions.
The virtual water transfers in the power sector would increase regional water scarcity. Compared to virtual water trade based on the comparative advantage theory, the results for virtual water transfers within power trade are different. This is because the theory needs to consider the opportunity cost of water resources, which can only play a role when water resources become a limiting factor, and land use and labour also play important roles in the virtual water transfers in the power sector [75]. The key results are as follows:
  • Identification of specific regions that would suffer water scarcity: North-western and central regions are the largest virtual water exporters within China [69]. Germany and France are the largest virtual water exporters in Europe [62].
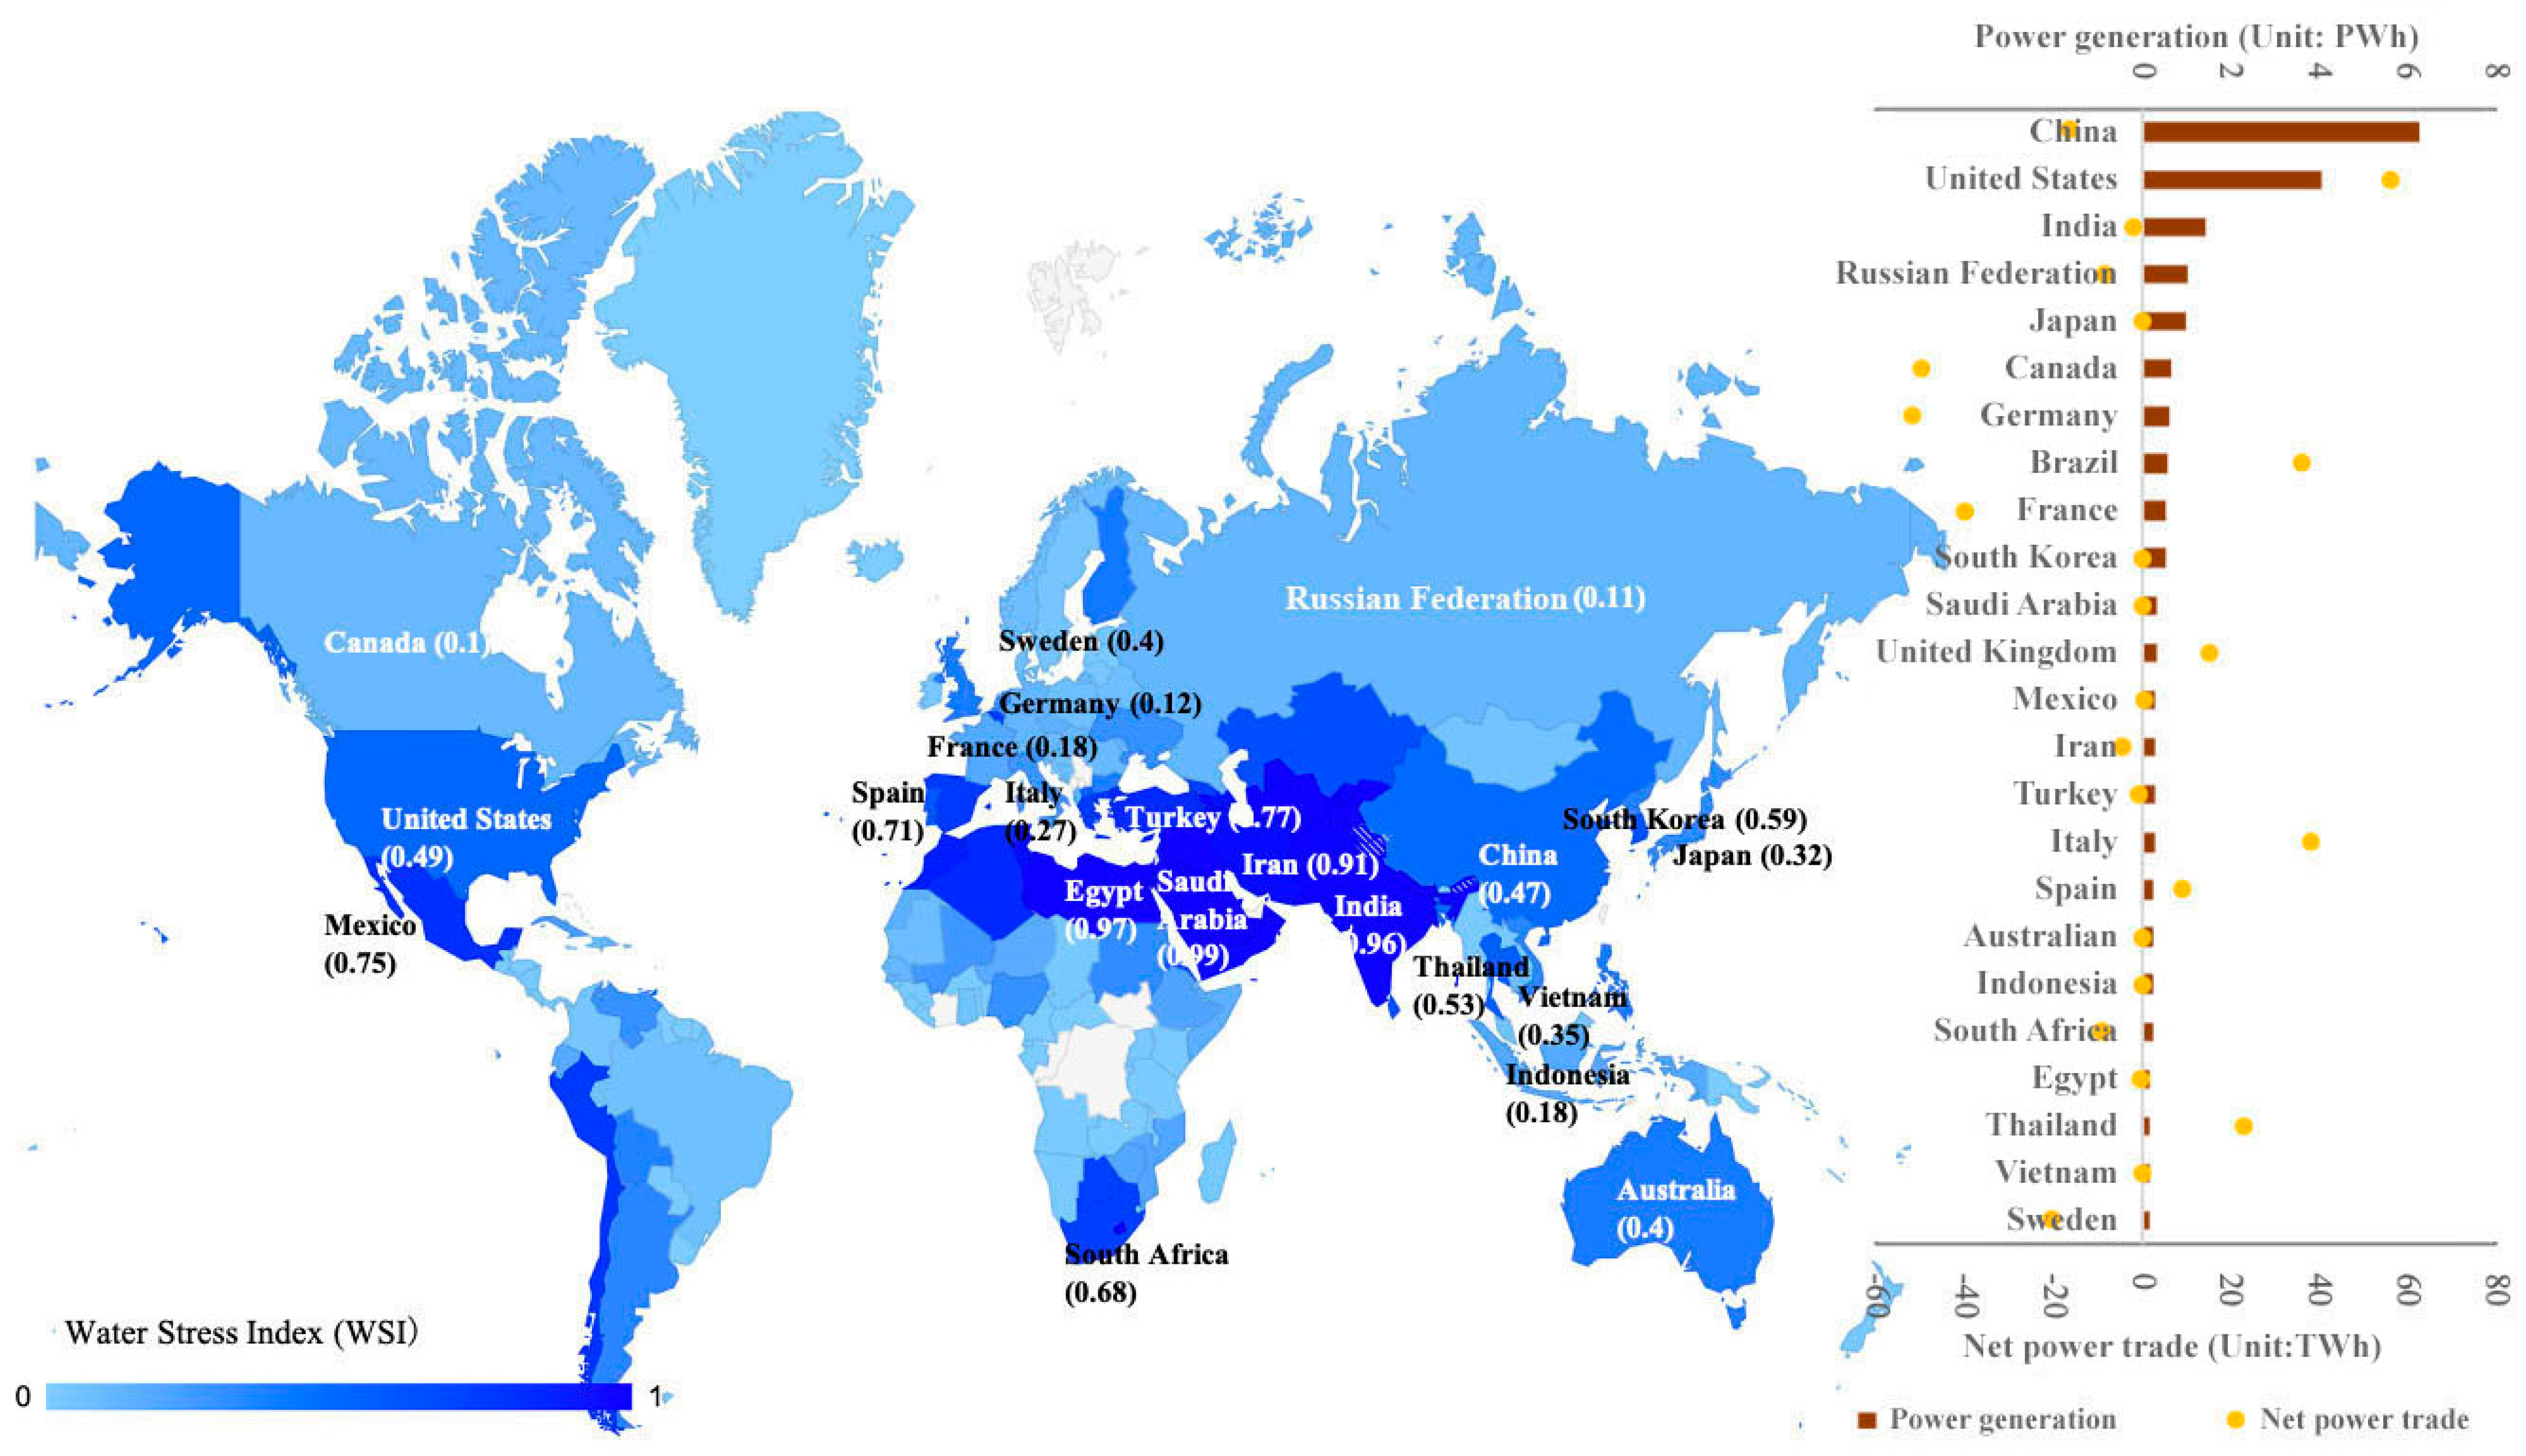
  • Assessment of regional water scarcity using the water stress index (WSI): the virtual scarce water footprint per unit of power consumption is used to value the potential impact of the purchasing power of end-users on water resources. It is suggested that water-stressed regions would be mitigated by using imported power generated in the water-abundant region [68].
  • Future water scarcity in the main water-exporting regions is likely to increase further due to socioeconomic and technical factors. For example, the water scarcity in north-western regions would be serious, with many ongoing long-distance power transmission projects in China [69].

2.3. Effects of Power Supply Chains on Water Scarcity

There is a conflict between water resource sustainability and power development. Water scarcity is a useful concept for characterising the environmental effects (the regional water consumption and availability) caused by the power supply chain (power supply, trade, and demand). Water scarcity can be physical or social, based on political power, policies, and socioeconomic relations. A series of indicators have been developed to describe water scarcity. Recent work has provided an inventory for them (see Table 3). All these indicators can describe the water quantity, but only the LCA-based water stress indicator and Quantity-Quality-Environmental flow requirement (QQE) indicator can describe the water quality. Under the Sustainable Development Goals (SDGs) [76], water use efficiency and the level of water stress, water abstraction, water availability, water storage, Environmental Flow Requirements (EFR), and temporal and spatial disaggregation are considered the essential characteristics of water scarcity [77]. Although there are many indicators to describe water scarcity, only a few indicators (such as the Water Stress Index (WSI)) have been applied in order to measure the impact of the power supply chain on water resources.
There are two approaches that reflect the impact of power generation on a water resource. One method is to measure the related energy by dividing the amount of water used for power generation by the total available water or by the remaining available water after other uses not related to power generation. Another method uses the water scarcity footprint, which is obtained by multiplying the water used for power production by the regional water scarcity index. Therefore, the water scarcity footprint includes the volumetric water footprint (i.e., water use inventory) and regional water scarcity information. An assessment of the water scarcity footprint of power indicated that power generation had put a serious threat to local water availability and storage, especially for northern regions in China [79].
Since local water scarcity risk can be transmitted to downstream sectors in the power supply chain, it is necessary to use virtual water scarcity indicators to characterise water scarcity from the power trade. Under the background of climate change, virtual water scarcity risk was assessed for global trade [80]. Embodied Water Export Risk and Crisis Indexes (EWERCI) is proposed to evaluate the influence quantitatively, and the results show that energy exporters lacking water resources will potentially suffer significant water shortages [61]. Virtual Water Scarcity Risk (VWSR) is used to examine the impacts of local water scarcity risk on the global trade system [81]. At the subnational level, it is necessary to consider regional water scarcity between different regions proposed to assess the scarce water of different regions by multiplying the local WSI [82]. Using this method, some studies focus on regional virtual scarcity water transfers, but a global analysis still needs some extensions. These indicators are related to water quantity, not the water quality within virtual water transfers; Chini et al. [67] tried to measure the water quality for United States electric grids using the concept of greywater, but it could not connect to the local water resources and environmental requirement.

3. Challenges and the Way Forward

The water use in power supply chains helps to understand and clarify the status and problems of water resource allocation and management in some areas, so as to ensure water sustainability alongside power development. However, there are still many issues in the actual operation and application of water footprint accounting, and these issues are also the frontier areas that should be studied in further work.
The water footprint evaluation of power generation is a crucial step, and the results show that water footprints vary significantly according to different assumptions, the selected method, and data, even for the same power generation technology. Particularly for hydropower, the precipitation, temperature, and size of hydropower plants have a significant influence on the estimation of the water footprint. It has been observed that the variations of estimates can reach up to three orders of magnitude, prompting a unification of the selection of system boundaries and elements for an evaluation.
Precipitation has not been taken into consideration in this study due to data limitation, and the accessed data also cannot provide a quantitative uncertainty analysis due to a poor basic dataset. With the development of the database on a spatial-temporal level, further work will provide a good basis for comparisons of different power technologies in different regions. For instance, the European Commission has begun to build a high-resolution database [33]. In addition, previous studies also evaluated virtual water transfer by the single domestic or global power supply chain effects, and further work should consider these two effects. The evaluation of water use embodied in power supply, demand, and trade has been studied alone. A consistent accounting framework for power supply chain evaluation is still lacking.
Water scarcity is useful for characterising the linkages between environmental impacts induced by water consumption in the power supply chain. Current studies assume the water scarcity to be a constant indicator on a temporal level. This would weaken the effects of water scarcity on water footprint quantification and virtual water transfers. The other issue is that water quality has not been well explored when compared to water quantity in terms of these water scarcity indicators. In further work, an impact-oriented water scarcity indicator should be constructed to reveal the impact of the power supply chain on water quality.
More attention should be paid to the environmental effects caused by power trade. The environmental responsibilities related to virtual water transfer are more “invisible” [83]. The exact origin of a power generation source for its end users is difficult to identify due to cross-interregional power transmission [84]. When incorporating water scarcity, the results show that inter-regional power trade can increase the water stress for the supply side, especially for a water-intensive region. It is important to identify the responsibilities on both the supply and demand sides and to compensate for a water-intensive region through subsidies and regulations that will help the development of water resource management in the power supply chain. In assessing the virtual water of power trading, the current accounting is usually limited to the trading of the power grid. The virtual water of outsourced fuel (e.g., biomass) and technology (photovoltaic panels) should also be included for a comprehensive assessment. A link can be made to other economy areas via the water footprint of the power supply chains, as can be seen from the analysis of water footprint research by Zhang et al. [85]. This is a good illustration of the importance of water for all spheres of human activities, all competing for water resources of varying quality.

4. Conclusions

This paper reviews the methods for evaluating water footprints and virtual water flows in the power supply chain. Water footprint quantification principles based on top-down and bottom-up methods are analysed and compared.
The water footprint estimates of the various power generation technologies per region vary widely. They fall within intervals spanning over three orders of magnitude. In general, the water footprint of renewable power is lower than fossil-fuel power, except for hydropower, which is significantly higher. In the available research, the occurrence of such differences could not be explained. More attention is needed for an advanced definition and standard quantification method, especially in relation to the stages and flows to be included in the assessment. A water footprint assessment framework, which considers the quality of water and spatial aspects, could provide a better basis for comparison than using only the amount of water consumed. The main restriction of a water supply arises from the quality and uneven distribution rather than from the amount.
A key observation of this review is that virtual water transfers also feature similar variations with different methods and regions. The trend of virtual water transfers in time features an upward trend in developing countries and regions (such as China), while it is stable for developed countries and regions (such as the United States and Europe). Virtual water transfer caused by domestic power trade is larger than that in regional power trade. This problem points to the need for future research for establishing a unified and agreed framework for water footprint assessment within the power generation and trade areas.
The future framework has to provide sound guidelines for the selection of evaluation methods, and a clear definition of comparable system boundaries, how to obtain and process data, and the assumptions made in the evaluation. A methodological approach is also lacking, one that would provide a more reliable evaluation and comparison of the various water footprints of different power technologies. Despite there having been many assessments on the water footprint of power, a consensus is still difficult to achieve due to the variations of various aspects (e.g., methods, assumptions, location, resources, technologies), as summarised in this review. A meta-analysis can be applied in the future.
Another significant issue that this review has identified is the lack of a method for the global virtual water assessment of the power trade. The association with virtual water transfers within the power trade will provide a new perspective for water footprint assessments.
An improved tool for the management of water and energy resources is needed and should be developed in future work. The identification of the responsibilities of both the supply and demand sides is necessary for the development of water resource management in the power supply chain. One of the essential changes that could potentially help reduce water scarcity could be the switch from higher water footprint energy sources to lower water footprint energy sources.

Author Contributions

L.W.: conceptualisation, writing; Y.V.F.: writing—review & editing, feedback on the analysis; P.S.V.: supervision, writing—review & editing, feedback on the analysis; S.R.W.A.: feedback on the analysis; J.J.K.: supervision and coordination, review & editing and proofreading, funding acquisition. All authors have read and agreed to the published version of the manuscript.

Funding

The funding from the EU-supported project Sustainable Process Integration Laboratory (SPIL), funded as project No. CZ.02.1.01/0.0/0.0/15_003/0000456, by Czech Republic Operational Programme Research and Development, Education, Priority 1: Strengthening the capacity for quality research under the collaboration agreement with Universiti Teknologi Malaysia, Johor Bahru, based on the SPIL project, is gratefully acknowledged.

Acknowledgments

This paper has been dedicated to the memory of passed Arjen Y. Hoekstra creator of water footprint.

Conflicts of Interest

The authors declare no conflict of interest.

Abbreviations

WSIWater Stress Index
LCALife Cycle Assessment
CHPCombined Heat and Power
MRIOMulti-Regional Input-Output (model)
MUIOMixed-Unit Input-Output
WFWater Footprint
DWDirect Water (withdrawal)
AIntermediate consumption matrix, the measurement unit varies from different application
CUpstream or downstream cut-off flows in the system.
yMatrix of final consumption
UNUnited Nations
SDGsSustainable Development Goals
EFREnvironmental Flow Requirements
IWMIInternational Water Management Indicator
QQEQuantity-Quality-Environmental flow requirement
EWERCIEmbodied Water Export Risk and Crisis Indexes
VWSRVirtual Water Scarcity Risk

References

  1. Liu, Y.; Chen, B.; Wei, W.; Shao, L.; Li, Z.; Jiang, W.; Chen, G. Global water use associated with energy supply, demand and international trade of China. Appl. Energy 2020, 257, 113992. [Google Scholar] [CrossRef]
  2. McBean, E. Removal of Emerging Contaminants: The Next Water Revolution. J. Environ. Inform. Let. 2019, 1, 1–7. [Google Scholar] [CrossRef] [Green Version]
  3. Spang, E.S.; Moomaw, W.R.; Gallagher, K.S.; Kirshen, P.H.; Marks, D.H. The water consumption of energy production: An international comparison. Environ. Res. Lett. 2014, 9, 105002. [Google Scholar] [CrossRef]
  4. Ramaswami, A.; Boyer, D.; Nagpure, A.S.; Fang, A.; Bogra, S.; Bakshi, B.; Cohen, E.; Rao-Ghorpade, A. An urban systems framework to assess the trans-boundary food-energy-water nexus: Implementation in Delhi, India. Environ. Res. Lett. 2017, 12, 025008. [Google Scholar] [CrossRef] [Green Version]
  5. IEA. World Energy Outlook. 2019. Available online: https://www.iea.org/reports/world-energy-outlook-2019/electricity#abstract (accessed on 31 May 2020).
  6. IEA. Electricity Information. 2018. Available online: https://www.iea.org/statistics/relateddatabases/electricity information/ (accessed on 31 May 2020).
  7. Liu, Z. (Ed.) Chapter 4—Supply and Demand of Global Energy and Electricity. In Global Energy Interconnection; Academic Press: Boston, MA, USA, 2015; pp. 101–182. [Google Scholar]
  8. Hoekstra, A.Y. Human appropriation of natural capital: A comparison of ecological footprint and water footprint analysis. Ecol. Econ. 2009, 68, 1963–1974. [Google Scholar] [CrossRef] [Green Version]
  9. Klemeš, J.J. Industrial Water Recycle/Reuse. Curr. Opin. Chem. Eng. 2012, 1, 238–245. [Google Scholar] [CrossRef]
  10. Čuček, L.; Klemeš, J.J.; Kravanja, Z. A Review of Footprint analysis tools for monitoring impacts on sustainability. J. Clean. Prod. 2012, 34, 9–20. [Google Scholar] [CrossRef]
  11. Hoekstra, A.Y.; Chapagain, A.K.; Aldaya, M.M.; Mekonnen, M.M. The Water Footprint Assessment Manual: Setting the Global Standard; Earthscan: London, UK, 2011; ISBN 978-1-84971-279-8. [Google Scholar]
  12. Hoekstra, A.Y. The Water Footprint of Industry. In Assessing and Measuring Environmental Impact and Sustainability; Klemeš, J.J., Ed.; Butterworth-Heinemann, Elsevier: Waltham, MA, USA, 2015; Chapter 7; pp. 221–254. [Google Scholar]
  13. Liu, X.; Klemeš, J.J.; Varbanov, P.S.; Čuček, L.; Qian, Y. Virtual carbon and water flows embodied in international trade: A review on consumption-based analysis. J. Clean Prod. 2017, 146, 20–28. [Google Scholar] [CrossRef]
  14. Allan, J.A. Virtual water: A strategic resource global solutions to regional deficits. Ground Water 1998, 36, 545–546. [Google Scholar] [CrossRef]
  15. Liu, W.; Antonelli, M.; Kummu, M.; Zhao, X.; Wu, P.; Liu, J.; Zhuo, L.; Yang, H. Savings and losses of global water resources in food-related virtual water trade. Wiley Interdiscip. Rev. Water 2018, 6, e1320. [Google Scholar] [CrossRef] [Green Version]
  16. Liao, X.W.; Hall, J.W.; Eyre, N. Water use in China’s thermoelectric power sector. Glob. Environ. Chang. 2016, 41, 142–152. [Google Scholar] [CrossRef]
  17. Eldardiry, H.; Habib, E. Carbon capture and sequestration in power generation: Review of impacts and opportunities for water sustainability. Energy Sustain. Soc. 2018, 8, 6. [Google Scholar] [CrossRef] [Green Version]
  18. Ristic, B.; Mahlooji, M.; Gaudard, L.; Madani, K. The relative aggregate footprint of electricity generation technologies in the European Union (EU): A system of systems approach. Resour. Conserv. Recycl. 2019, 143, 282–290. [Google Scholar] [CrossRef]
  19. Enerata. Global Energy Statistical Yearbook. 2019. Available online: https://yearbook.enerdata.net/electricity/electricity-balance-trade.html (accessed on 6 July 2020).
  20. Zhang, Y.; Fang, J.; Wang, S.; Yao, H. Energy-water nexus in electricity trade network: A case study of interprovincial electricity trade in China. Appl. Energy 2020, 257, 113685. [Google Scholar] [CrossRef]
  21. Jia, X.; Klemeš, J.J.; Wan Alwi, S.R.; Varbanov, P.S. Regional Water Resources Assessment using Water Scarcity Pinch Analysis. Resour. Conserv. Recycl. 2020, 157, 104749. [Google Scholar] [CrossRef]
  22. Cai, B.M.; Zhang, W.; Hubacek, K.; Feng, K.S.; Li, Z.L.; Liu, Y.W.; Liu, Y. Drivers of virtual water flows on regional water scarcity in China. J. Clean. Prod. 2019, 207, 1112–1122. [Google Scholar] [CrossRef]
  23. Meldrum, J.; Nettles-Anderson, S.; Heath, G.; Macknick, J. Life cycle water use for electricity generation: A review and harmonisation of literature estimates. Environ. Res. Lett. 2013, 8. [Google Scholar] [CrossRef]
  24. Gao, J.J.; Zhao, P.; Zhang, H.W.; Mao, G.Z.; Wang, Y. Operational Water Withdrawal and Consumption Factors for Electricity Generation Technology in China-A Literature Review. Sustainability 2018, 10, 1181. [Google Scholar] [CrossRef] [Green Version]
  25. Jin, Y.; Behrens, P.; Tukker, A.; Scherer, L. Water use of electricity technologies: A global meta-analysis. Renew. Sustain. Energy Rev. 2019, 115, 109391. [Google Scholar] [CrossRef]
  26. Wang, C.Y.; Lin, L.; Olsson, G.; Liu, Y.; Xu, M. The scope and understanding of the water-electricity nexus. Resour. Conserv. Recycl. 2019, 150, 104453. [Google Scholar] [CrossRef]
  27. Dai, J.Y.; Wu, S.Q.; Han, G.Y.; Weinberg, J.; Xie, X.H.; Wu, X.F.; Song, X.Q.; Jia, B.Y.; Xue, W.Y.; Yang, Q.Q. Water-energy nexus: A review of methods and tools for macro-assessment. Appl. Energy 2018, 210, 393–408. [Google Scholar] [CrossRef]
  28. Pfister, S.; Koehler, A.; Hellweg, S. Assessing the Environmental Impacts of Freshwater Consumption in LCA. Environ. Sci. Technol. 2009, 43, 4098–4104. [Google Scholar] [CrossRef] [Green Version]
  29. UN. UN Comtrade Database. 2018. Available online: https://comtrade.un.org/Data/ (accessed on 6 July 2020).
  30. Averyt, K.; Macknick, J.; Rogers, J.; Madden, N.; Fisher, J.; Meldrum, J.; Newmark, R. Water use for electricity in the United States: An analysis of reported and calculated water use information for 2008. Environ. Res. Lett. 2013, 8, 015001. [Google Scholar] [CrossRef] [Green Version]
  31. Huang, W.L.; Ma, D.; Chen, W.Y. Connecting water and energy: Assessing the impacts of carbon and water constraints on China’s power sector. Appl. Energy 2017, 185, 1497–1505. [Google Scholar] [CrossRef]
  32. Mekonnen, M.M.; Gerbens-Leenes, P.W.; Hoekstra, A.Y. Future electricity: The challenge of reducing both carbon and water footprint. Sci. Total Environ. 2016, 569, 1282–1288. [Google Scholar] [CrossRef] [Green Version]
  33. Vanham, D.; Medarac, H.; Schyns, J.F.; Hogeboom, R.J.; Magagna, D. The consumptive water footprint of the European Union energy sector. Environ. Res. Lett. 2019, 14, 104016. [Google Scholar] [CrossRef]
  34. Mekonnen, M.M.; Gerbens-Leenes, P.W.; Hoekstra, A.Y. The consumptive water footprint of electricity and heat: A global assessment. Environ. Sci. Wat. Res. Technol. 2015, 1, 285–297. [Google Scholar] [CrossRef]
  35. Wu, X.D.; Chen, G.Q. Energy and water nexus in power generation: The surprisingly high amount of industrial water use induced by solar power infrastructure in China. Appl. Energy 2017, 195, 125–136. [Google Scholar] [CrossRef]
  36. Kumar, A.; Schei, T.; Ahenkorah, A.; Rodriguez, R.; Devernay, J.-M.; Freitas, M.; Hall, D.; Killingtveit, Å.; Liu, Z. Hydropower. In Renewable Energy Sources and Climate Change Mitigation; Special Report of the Intergovernmental Panel on Climate Change; Matschoss, P., Kadner, S., Zwickel, T., Eickemeier, P., Hansen, G., Schloemer, S., von Stechow, C., Eds.; Cambridge University Press: Cambridge, UK, 2012; pp. 437–496. [Google Scholar]
  37. Hogeboom, R.J.; Knook, L.; Hoekstra, A.Y. The blue water footprint of the world’s artificial reservoirs for hydroelectricity, irrigation, residential and industrial water supply, flood protection, fishing and recreation. Adv. Water Resour. 2018, 113, 285–294. [Google Scholar] [CrossRef]
  38. Robescu, L.D.; Bondrea, D.A. The water footprint from hydroelectricity: A case study for a hydropower plant in Romania. Sustain. Solut. Energy Environ. 2019, 85, 06012. [Google Scholar] [CrossRef]
  39. Ali, B.; Kumar, A. Development of life cycle water footprints for gas-fired power generation technologies. Energy Convers. Manag. 2016, 110, 386–396. [Google Scholar] [CrossRef]
  40. Ali, B.; Kumar, A. Development of water demand coefficients for power generation from renewable energy technologies. Energy Convers. Manag. 2017, 143, 470–481. [Google Scholar] [CrossRef]
  41. Ali, B.; Kumar, A. Development of life cycle water-demand coefficients for coal-based power generation technologies. Energy Convers. Manag. 2015, 90, 247–260. [Google Scholar] [CrossRef]
  42. Chai, L.; Liao, X.W.; Yang, L.; Yan, X.L. Assessing life cycle water use and pollution of coal-fired power generation in China using input-output analysis. Appl. Energy 2018, 231, 951–958. [Google Scholar] [CrossRef]
  43. Li, X.; Feng, K.; Siu, Y.L.; Hubacek, K. Energy-water nexus of wind power in China: The balancing act between CO2 emissions and water consumption. Energy Policy 2012, 45, 440–448. [Google Scholar] [CrossRef]
  44. Fulton, J.; Cooley, H. The Water Footprint of California’s Energy System, 1990–2012. Environ. Sci. Technol. 2015, 49, 3314–3321. [Google Scholar] [CrossRef]
  45. UN. Standard Country or Area Codes for Statistical Use (Rev. 3); Series M: Miscellaneous Statistical Papers, No. 49; UN: New York, NY, USA, 1996; Available online: ST/ESA/STAT/SER.M/49/Rev.3 (accessed on 6 August 2020).
  46. Tzimas, E.; Georgakaki, A.; Peteves, E. Future Fossil Fuel Electricity Generation in Europe: Options and Consequences; European Commission: Brussels, Belgium, 2009. [Google Scholar] [CrossRef]
  47. Ding, N.; Liu, J.R.; Yang, J.X.; Lu, B. Water footprints of energy sources in China: Exploring options to improve water efficiency. J. Clean. Prod. 2018, 174, 1021–1031. [Google Scholar] [CrossRef]
  48. Bakken, T.H.; Modahl, I.S.; Engeland, K.; Raadal, H.L.; Arnoy, S. The life-cycle water footprint of two hydropower projects in Norway. J. Clean. Prod. 2016, 113, 241–250. [Google Scholar] [CrossRef]
  49. Feng, K.; Hubacek, K.; Siu, Y.L.; Li, X. The energy and water nexus in Chinese electricity production: A hybrid life cycle analysis. Renew. Sustain. Energy Rev. 2014, 39, 342–355. [Google Scholar] [CrossRef] [Green Version]
  50. Weinzettel, J.; Steen-Olsen, K.; Hertwich, E.G.; Borucke, M.; Galli, A. Ecological footprint of nations: Comparison of process analysis, and standard and hybrid multiregional input-output analysis. Ecol. Econ. 2014, 101, 115–126. [Google Scholar] [CrossRef]
  51. Acquaye, A.; Feng, K.; Oppon, E.; Salhi, S.; Ibn-Mohammed, T.; Genovese, A.; Hubacek, K. Measuring the environmental sustainability performance of global supply chains: A multi-regional input-output analysis for carbon, sulphur oxide and water footprints. J. Environ. Manag. 2017, 187, 571–585. [Google Scholar] [CrossRef] [PubMed]
  52. Pomponi, F.; Lenzen, M. Hybrid life cycle assessment (LCA) will likely yield more accurate results than process-based LCA. J. Clean. Prod. 2018, 176, 210–215. [Google Scholar] [CrossRef]
  53. Talati, S.; Zhai, H.; Kyle, G.P.; Morgan, M.G.; Patel, P.; Liu, L. Consumptive Water Use from Electricity Generation in the Southwest under Alternative Climate, Technology, and Policy Futures. Environ. Sci. Technol. 2016, 50, 12095–12104. [Google Scholar] [CrossRef] [PubMed]
  54. Larsen, M.A.D.; Drews, M. Water use in electricity generation for water-energy nexus analyses: The European case. Sci. Total Environ. 2019, 651, 2044–2058. [Google Scholar] [CrossRef]
  55. Liu, J.; Zhao, D.; Gerbens-Leenes, P.W.; Guan, D. China’s rising hydropower demand challenges water sector. Sci. Rep. 2015, 5, 11446. [Google Scholar] [CrossRef] [Green Version]
  56. Grubert, E.A. Water consumption from hydroelectricity in the United States. Adv. Water Resour. 2016, 96, 88–94. [Google Scholar] [CrossRef] [Green Version]
  57. Bakken, T.H.; Killingtveit, A.; Engeland, K.; Alfredsen, K.; Harby, A. Water consumption from hydropower plants—Review of published estimates and an assessment of the concept. Hydrol. Earth Syst. Sci. 2013, 17, 3983–4000. [Google Scholar] [CrossRef] [Green Version]
  58. Bakken, T.H.; Killingtveit, A.; Alfredsen, K. The Water Footprint of Hydropower Production-State of the Art and Methodological Challenges. Glob. Chall. 2017, 1, 1600018. [Google Scholar] [CrossRef]
  59. Ziesemer, T. Renewable electricity supply, infrastructure, and gains from international trade in electric current. Appl. Econ. Lett. 2019, 26, 1439–1443. [Google Scholar] [CrossRef] [Green Version]
  60. Gao, X.R.; Zhao, Y.; Lu, S.B.; Chen, Q.Y.; An, T.L.; Han, X.X.Q.; Zhuo, L. Impact of coal power production on sustainable water resources management in the coal-fired power energy bases of Northern China. Appl. Energy 2019, 250, 821–833. [Google Scholar] [CrossRef]
  61. Zhang, J.C.; Zhong, R.; Zhao, P.; Zhang, H.W.; Wang, Y.; Mao, G.Z. International energy trade impacts on water resource crises: An embodied water flows perspective. Environ. Res. Lett. 2016, 11, 074023. [Google Scholar] [CrossRef] [Green Version]
  62. Chini, C.M.; Stillwell, A.S. The changing virtual water trade network of the European electric grid. Appl. Energy 2020, 260, 114151. [Google Scholar] [CrossRef]
  63. Chini, C.M.; Djehdian, L.A.; Lubega, W.N.; Stillwell, A.S. Virtual water transfers of the US electric grid. Nat. Energy 2018, 3, 1115–1123. [Google Scholar] [CrossRef]
  64. Zhang, Y.; Hou, S.; Liu, J.; Zheng, H.; Wang, J.; Zhang, C. Evolution of Virtual Water Transfers in China’s Provincial Grids and Its Driving Analysis. Energies 2020, 13, 328. [Google Scholar] [CrossRef] [Green Version]
  65. Zhang, C.; He, G.; Zhang, Q.; Liang, S.; Zipper, S.C.; Guo, R.; Zhao, X.; Zhong, L.; Wang, J. The evolution of virtual water flows in China’s electricity transmission network and its driving forces. J. Clean. Prod. 2020, 242, 118336. [Google Scholar] [CrossRef]
  66. Zhu, X.; Guo, R.; Chen, B.; Zhang, J.; Hayat, T.; Alsaedi, A. Embodiment of virtual water of power generation in the electric power system in China. Appl. Energy 2015, 151, 345–354. [Google Scholar] [CrossRef]
  67. Guo, R.; Zhu, X.; Chen, B.; Yue, Y. Ecological network analysis of the virtual water network within China’s electric power system during 2007–2012. Appl. Energy 2016, 168, 110–121. [Google Scholar] [CrossRef]
  68. Wang, R.R.; Zimmerman, J.B.; Wang, C.Y.; Vivanco, D.F.; Hertwich, E.G. Freshwater Vulnerability beyond Local Water Stress: Heterogeneous Effects of Water-Electricity Nexus Across the Continental United States. Environ. Sci. Technol. 2017, 51, 9899–9910. [Google Scholar] [CrossRef]
  69. Zhang, C.; Zhong, L.; Liang, S.; Sanders, K.T.; Jiao, W.; Ming, X. Virtual scarce water embodied in inter-provincial electricity transmission in China. Appl. Energy 2017, 187, 438–448. [Google Scholar] [CrossRef] [Green Version]
  70. Liao, X.W.; Zhao, X.; Hall, J.W.; Guan, D.B. Categorising virtual water transfers through China’s electric power sector. Appl. Energy 2018, 226, 252–260. [Google Scholar] [CrossRef] [Green Version]
  71. Wang, C.; Zhang, L.; Zhou, P.; Chang, Y.; Zhou, D.; Pang, M.; Yin, H. Assessing the environmental externalities for biomass- and coal-fired electricity generation in China: A supply chain perspective. J. Environ. Manag. 2019, 246, 758–767. [Google Scholar] [CrossRef] [PubMed]
  72. Chu, C.; Ritter, W.; Sun, X.H. Spatial variances of water-energy nexus in China and its implications for provincial resource interdependence. Energy Policy 2019, 125, 487–502. [Google Scholar] [CrossRef]
  73. Qu, S.; Wang, H.X.; Liang, S.; Shapiro, A.M.; Suh, S.W.; Sheldon, S.; Zik, O.; Fang, H.; Xu, M. A Quasi-Input-Output model to improve the estimation of emission factors for purchased electricity from interconnected grids. Appl. Energy 2017, 200, 249–259. [Google Scholar] [CrossRef]
  74. Qu, S.; Li, Y.; Liang, S.; Yuan, J.H.; Xu, M. Virtual CO2 Emission Flows in the Global Electricity Trade Network. Environ. Sci. Technol. 2018, 52, 6666–6675. [Google Scholar] [CrossRef] [PubMed]
  75. Zhao, D.D.; Hubacek, K.; Feng, K.S.; Sun, L.X.; Liu, J.G. Explaining virtual water trade: A spatial-temporal analysis of the comparative advantage of land, labor and water in China. Water Res. 2019, 153, 304–314. [Google Scholar] [CrossRef]
  76. UN. About the Sustainable Development Goals. 2015. Available online: https://www.un.org/sustainable development/ (accessed on 6 July 2020).
  77. Vanham, D.; Hoekstra, A.Y.; Wada, Y.; Bouraoui, F.; de Roo, A.; Mekonnen, M.M.; van de Bund, W.J.; Batelaan, O.; Pavelic, P.; Bastiaanssen, W.G.M.; et al. Physical water scarcity metrics for monitoring progress towards SDG target 6.4: An evaluation of indicator 6.4.2 “Level of water stress”. Sci. Total Environ. 2018, 613, 218–232. [Google Scholar] [CrossRef]
  78. Liu, J.G.; Yang, H.; Gosling, S.N.; Kummu, M.; Florke, M.; Pfister, S.; Hanasaki, N.; Wada, Y.; Zhang, X.X.; Zheng, C.M.; et al. Water scarcity assessments in the past, present, and future. Earths Future 2017, 5, 545–559. [Google Scholar] [CrossRef] [PubMed]
  79. Xie, X.; Jiang, X.; Zhang, T.; Huang, Z. Study on impact of electricity production on regional water resource in China by water footprint. Renew. Energy 2020, 152, 165–178. [Google Scholar]
  80. Zhao, H.; Qu, S.; Guo, S.; Zhao, H.; Liang, S.; Xu, M. Virtual water scarcity risk to global trade under climate change. J. Clean. Prod. 2019, 230, 1013–1026. [Google Scholar] [CrossRef]
  81. Qu, S.; Liang, S.; Konar, M.; Zhu, Z.Q.; Chiu, A.S.F.; Jia, X.P.; Xu, M. Virtual Water Scarcity Risk to the Global Trade System. Environ. Sci. Technol. 2018, 52, 673–683. [Google Scholar] [CrossRef]
  82. Pfister, S.; Saner, D.; Koehler, A. The environmental relevance of freshwater consumption in global power production. Int. J. Life Cycle Assess. 2011, 16, 580–591. [Google Scholar] [CrossRef] [Green Version]
  83. Hertwich, E.G.; Peters, G.P. Carbon Footprint of Nations: A Global, Trade-Linked Analysis. Environ. Sci. Technol. 2009, 43, 6414–6420. [Google Scholar] [CrossRef] [Green Version]
  84. Kodra, E.; Sheldon, S.; Dolen, R.; Zik, O. The North American Electric Grid as an Exchange Network: An Approach for Evaluating Energy Resource Composition and Greenhouse Gas Mitigation. Environ. Sci. Technol. 2015, 49, 13692–13698. [Google Scholar] [CrossRef] [PubMed]
  85. Zhang, Y.; Huang, K.; Yu, Y.; Yang, B. Mapping of water footprint research: A bibliometric analysis during 2006–2015. J. Clean. Prod. 2017, 149, 70–79. [Google Scholar] [CrossRef]
Figure 1. Global power supply and demand. (a) Global power generation from 2000–2050; (b) Comparison of power demand in different regions worldwide in 2020 and 2050. (Data source: The International Energy Agency during the period 2000–2017) [6]; the predicted data from 2020–2050 [7].
Water 12 03006 g001
Figure 2. The global distribution of water scarcity, regional power generation, and net trade-in 2017. (High values of WSI represent high water scarcity in regions; data source: WSI comes from [28], the power generation data comes from [6]. The total power generation of the listed countries accounted for over 80% of the global amount; power trade data comes from [29]; the global map was extracted from the Advanced World Data Map in Microsoft Excel.)
Water 12 03006 g002
Figure 3. A cause-effect diagram tracking water use in power supply chains based on the water footprint and virtual water.
Water 12 03006 g003
Figure 4. Percentage contributions of life-cycle stages to water footprints in power generation (Data are extracted from [33]).
Water 12 03006 g004
Figure 5. Water footprints of different power technologies in resolutions of North America, South America, Europe, Africa, Asia, Oceania, and the world. (a) coal; (b) natural gas; (c) oil; (d) nuclear; (e) geothermal; (f) hydropower; (g) solar; (h) wind. (Note: The orange diamond marker in Figure 5 represents the process-based method at the regional level [34]. The purple process-based marker represents the assessment at the country level. For example, a country in Asia). (In the calculation of the water use of power generation for Combined Heat and Power (CHP) systems, the fuel input provides both heat and power. It is assumed that thermal production contributes 90% of the total water use and heat contributes 10% and that no cooling water is required for district heating systems [34]; the green dot denotes the statistic-based method using a meta-analysis [25]; the short line is the parameter-based method for different cooling technologies for natural gas-fired power generation [39], renewable power generation [40], and coal-fired power generation [41]; the purple square is the input-output method for calculating the water footprint of coal-fired [42] and wind power [43] in China; the long line represents the process method in Europe [33] and in the USA [44].)
Water 12 03006 g005
Figure 6. The global virtual water flow of power trade in 2017 (the power trade data are extracted from the United Nations database [29], and the virtual water flows are estimated using the water footprints provided by [3]); virtual water transfers of regional power trade during 2010–2016. Virtual water transfers in the United States [63] and Europe [62] are calculated by the direct trade-adjustment method, and the Node-Flow method is used for virtual water transfers in China [64]. Callouts: trends of the virtual water flows with time (a) the United States, (b) Europe, (c) China.
Water 12 03006 g006
Table 1. Comparisons of different methods for quantifying water footprints.
Process-Based Method (Bottom-Up Approach)Input-Output Based Method (Top-Down Approach)
Process [41]Hybrid [49]Standard MRIO [50]Hybrid MRIO [50]MUIO [42]
Data sourceMeasurement data or Empirical dataInput-Output Table and power statisticsInput-Output TableInput-Output Table and power statisticsInput-Output Table and power statistics
Units in tracking production chainPhysicalPhysical (for power processes) and monetary for all sectorsMonetaryPhysical (for power sector) and monetary for all other sectorsPhysical (for power sector) and monetary for all other sectors
Matrix Allocation-Economic valueEconomic valueEconomic valuePhysical flows for the power sector; Economic value for all other sectors
Life cycle coverageDependent on selective life-cycle stagesYesYesYesYes
Technology assumedSpecific case/country/regional/global averageSpecific caseAverage case/specific countryAverage case/specific countryAverage case/specific country
Cut-off errorYesYesNoNoNo
WF of a single power technology W F = i D W i W F = ( D W p 0 0 D W I O ) × ( A p C d C u I A I O ) 1 W F = D W p × ( I A ) 1 × y n W F = D W c × ( I A ) 1 × y n + D W y np W F = D W × ( I ( e l e c t r i c i t y e l e c t r i c i t y ( M W h M W h ) e l e c t r i c i t y o t h e r   s e c t o r ( M W h m o n e y ) o t h e r   s e c t o r e l e c t r i c i t y ( m o n e y M W h ) o t h e r   s e c t o r o t h e r   s e c t o r ( m o n e y m o n e y ) ) ) 1
Note: MRIO refers to Multi-Regional Input-Output; MUIO refers to Mixed-Unit Input-Output. WF denotes water footprint; DW is the direct water withdrawal in power generation; A usually represents the intermediate consumption matrix; y is the matrix of final consumption; C represents the upstream or downstream cut-off flows in the system.
Table 2. Virtual water transfers in power trade.
StudyMethod to Account for Power TradeGeographic Coverage and ResolutionTime Frame-WorkThe Source of PowerMain Results
Zhu et al. [66]Direct trade-adjustmentChina2010Thermal HydropowerInterregional virtual water flows largely depend on the water stress index (WSI) and virtual scarce flow concept.
The virtual water transmission pattern varies with the WSI.
Guo et al. [67]Ecological network analysisChina2007–2012Thermal powerThe northern and central grids were the most important import and export for virtual water during 2007–2012.
Wang et al. [68]Direct trade-adjustmentRegional level2010–2014Thermal powerThe water problem in water-stressed regions was mitigated by power imports from a water-abundant region.
Zhang et al. [69]Network-basedChina2011Thermal powerWater stress in north-western regions would be serious, resulting from long-distance power transmission projects.
Liao et al. [70]MRIO modelChina2000–2015Thermal Hydro-Virtual water transfers across provinces accounted for 47.5% of the power sector’s water use.
Chini et al. [63]Direct trade-adjustmentUnited States2010–2016Thermal powerVirtual water transfers in power transmission increased significantly.
Wang et al. [71]Direct trade-adjustmentChina2014PowerInterbasin power transmission would lead to a 12% increase in the water-stressed population, especially in the southern part of China.
Chu et al. [72]Direct trade-adjustmentChina2014Thermal, hydro, nuclear and otherEfforts should also be made to improve the provincial self-sufficiency through demand-side conservation and supply diversification.
Chini and Stillwell [62]Direct trade-adjustmentEurope2010–2017Thermal powerThe largest virtual water exporters are Germany and France.
Zhang et al. [65]Network-basedChina2006–2016Thermal powerWater stress in north-western China increased with virtual water exporters.
The improvement of water efficiency was the main driver for decreasing virtual water transfers.
Zhang et al. [64]Network-basedChina2005–2014Thermal, hydro-, wind, and solarVirtual water increase is mainly driven by the change of the power generation mix and power transmission.
Table 3. Summary of the characteristics of physical water scarcity indicators [78].
Indicator NameMeasurementWater QuantityWater QualityEFR
Falkenmark indicator (water shortage)Per capita water availability
Water stress indexThe ratio of water use to availability
International Water Management Indicator (IWMI) (physical and economic water scarcity)The proportion of water supply that is water availability, accounting for water infrastructure
Water Poverty IndexThe weighted average of five components (water availability, access, capacity, use, and environment)
Water Footprint-based assessmentThe ratio of water footprint to water availability
Cumulative abstraction-to-demand ratioCumulative abstraction-to-demand ratio
The LCA-based water stress indicatorThe ratio of water use of water footprint to availability
Quantity-Quality-Environmental flow requirement (QQE) indicatorIncorporating water quantity, quality, and EFR
Publisher’s Note: MDPI stays neutral with regard to jurisdictional claims in published maps and institutional affiliations.

