Review

A Review on Mariculture Effluent: Characterization and Management Tools

1
State Key Laboratory of Water Environment Simulation & School of Environment, Beijing Normal University, Beijing 100875, China
2
School of Science and Engineering, University of Dundee, Dundee DD1 4HN, Scotland, UK
3
Department of Civil, Architectural and Environmental Engineering, University of Napoli Federico II, Corso Umberto I 40, 80138 Napoli, Italy
4
Tang Scholar, Beijing Normal University, Beijing 100875, China
*
Author to whom correspondence should be addressed.
Water 2020, 12(11), 2991; https://doi.org/10.3390/w12112991
Submission received: 23 September 2020 / Revised: 22 October 2020 / Accepted: 23 October 2020 / Published: 25 October 2020
(This article belongs to the Special Issue Advances in Environmental Hydraulics)

Abstract

:
While marine aquaculture, or mariculture, has been growing rapidly and globally in recent decades, many environmental concerns remain to be fully addressed to achieve its long-term goal of sustainable development. This paper aims to provide a synthesized perspective on these issues by reviewing and discussing the characterization, transport, and current modelling and management tools associated with effluents released from mariculture sites. Specifically, we examined the effluent characteristics and behavior from source-to-sink, including the composition and load of effluent discharge, its transport and transformation processes in the water column and at the seabed, and its impacts on the pelagic and benthic environments. We then focused on management-related issues, including the setting of the regulatory mixing zone, the establishment of environmental standards, monitoring measures, and modelling techniques to depict the current state-of-the-art modes in a global context. Our study shows that while substantial progress has been made in understanding the nature of the mariculture effluent, as well as in monitoring and modelling its transport and fate, the regulatory framework still lags behind in many countries where the mariculture industry is relevant. This is particularly evident in the lack of consistent criteria for the definition of regulatory mixing zones and the associated environmental standards for water quality and benthic impacts. Besides, as new predictive models are emerging quickly, their proper evaluation and validation are imperative in view of their increasing application in regulatory practices. This review is intended to provide references for advancing regulatory management of mariculture effluents, as well as for promoting sustainable mariculture development.

1. Introduction

Marine aquaculture, or mariculture, is one of the fastest-growing food-producing industries in the world. Globally, the scale and production of mariculture have expanded rapidly to fulfill the protein demand for an ever-increasing population to achieve the United Nations’ sustainable development goals [1,2]. Mariculture is dominated by unfed cultivation of aquatic plants, filter-feeding bivalves and mollusks, the fed cultivation of marine finfish (primarily salmonoid species), and shrimps [3]. Geographically, mariculture is distributed worldwide, with production concentrated in specific countries including China, Indonesia, India, Norway, Chile, Japan, and Scotland, amongst which China is by far the largest producer (20.65 million tons in 2019).
The potential interaction and conflict between mariculture activities and marine environments and ecosystems is a long-known issue of concern [4], with aquaculture-derived effluents one of the most critical aspects that contribute to detrimental environmental impacts. Through recurring input of feeds, fertilizers, and chemicals that are necessary to ensure the health and growth within the culture, mariculture systems generate considerable amounts of effluent that can have undesirable impacts on the environment [5,6]. Abundant loads of organic wastes, nutrients, and chemicals in the effluent are discharged into the receiving waters, and are subsequently transported in the water column and settle on the seabed, impacting the adjacent area (near-field) and beyond (far-field) [7,8]. These can cause significant environmental and ecological issues such as low levels of dissolved oxygen (i.e., hypoxia), eutrophication, heavy metal pollution, and habitat destruction [9]. Appropriate stringent regulatory measures are therefore required to manage the discharge of mariculture effluents and their impacts [10,11,12].
At the same time, by impacting the local aquatic environment with a given assimilative capacity, the effluent discharge also affects the ecological carrying capacity of the mariculture site, i.e., the maximum production without unacceptable impacts on ecosystems [13]. Sustainable mariculture requires the ability to balance human development goals while simultaneously sustaining marine systems to provide natural food resources and ecosystem services [14,15,16]. Assessment of this carrying capacity is therefore critical for the sustainability of mariculture, in which the characteristics and impacts of the associated effluent discharge constitute important elements that need to be taken into account alongside the location, type, and size of mariculture systems. In addition to these potential negative effects, some environmental and economic benefits of mariculture effluent have been recently assessed to achieve the balance between economic income and environmental loss [17]. For instance, the integrated multi-trophic aquaculture (IMTA) [18,19] is currently gaining popularity worldwide, as it spatially integrates organic waste and nutrient discharge systems such as fish cages with the culture of nutrient-extracting organisms such as mussels and algae [20]. In either case, it is necessary to elucidate the underlying nature and behavior of the effluent from its source to sink so that carrying capacity assessment and sustainable management can be properly designed and assessed.
To provide a synthesized perspective on the issue of mariculture effluent, this review focuses on the discharge characteristics, transport and transformation processes of effluent from the mariculture system, as well as the associated environmental impacts and current management measures and tools. From a global perspective, we compared environmental quality standards and regulatory policies of discharged effluent and mixing zones from a number of major mariculture countries. The monitoring and modelling techniques utilized to measure and predict impacts were reviewed to identify state-of-the-art regulatory practices. Consequently, this review was intended to provide an overview of the environmental impacts of current mariculture discharge and references for advancing regulatory management of mariculture effluent discharge, as well as promoting sustainability in future mariculture developments.

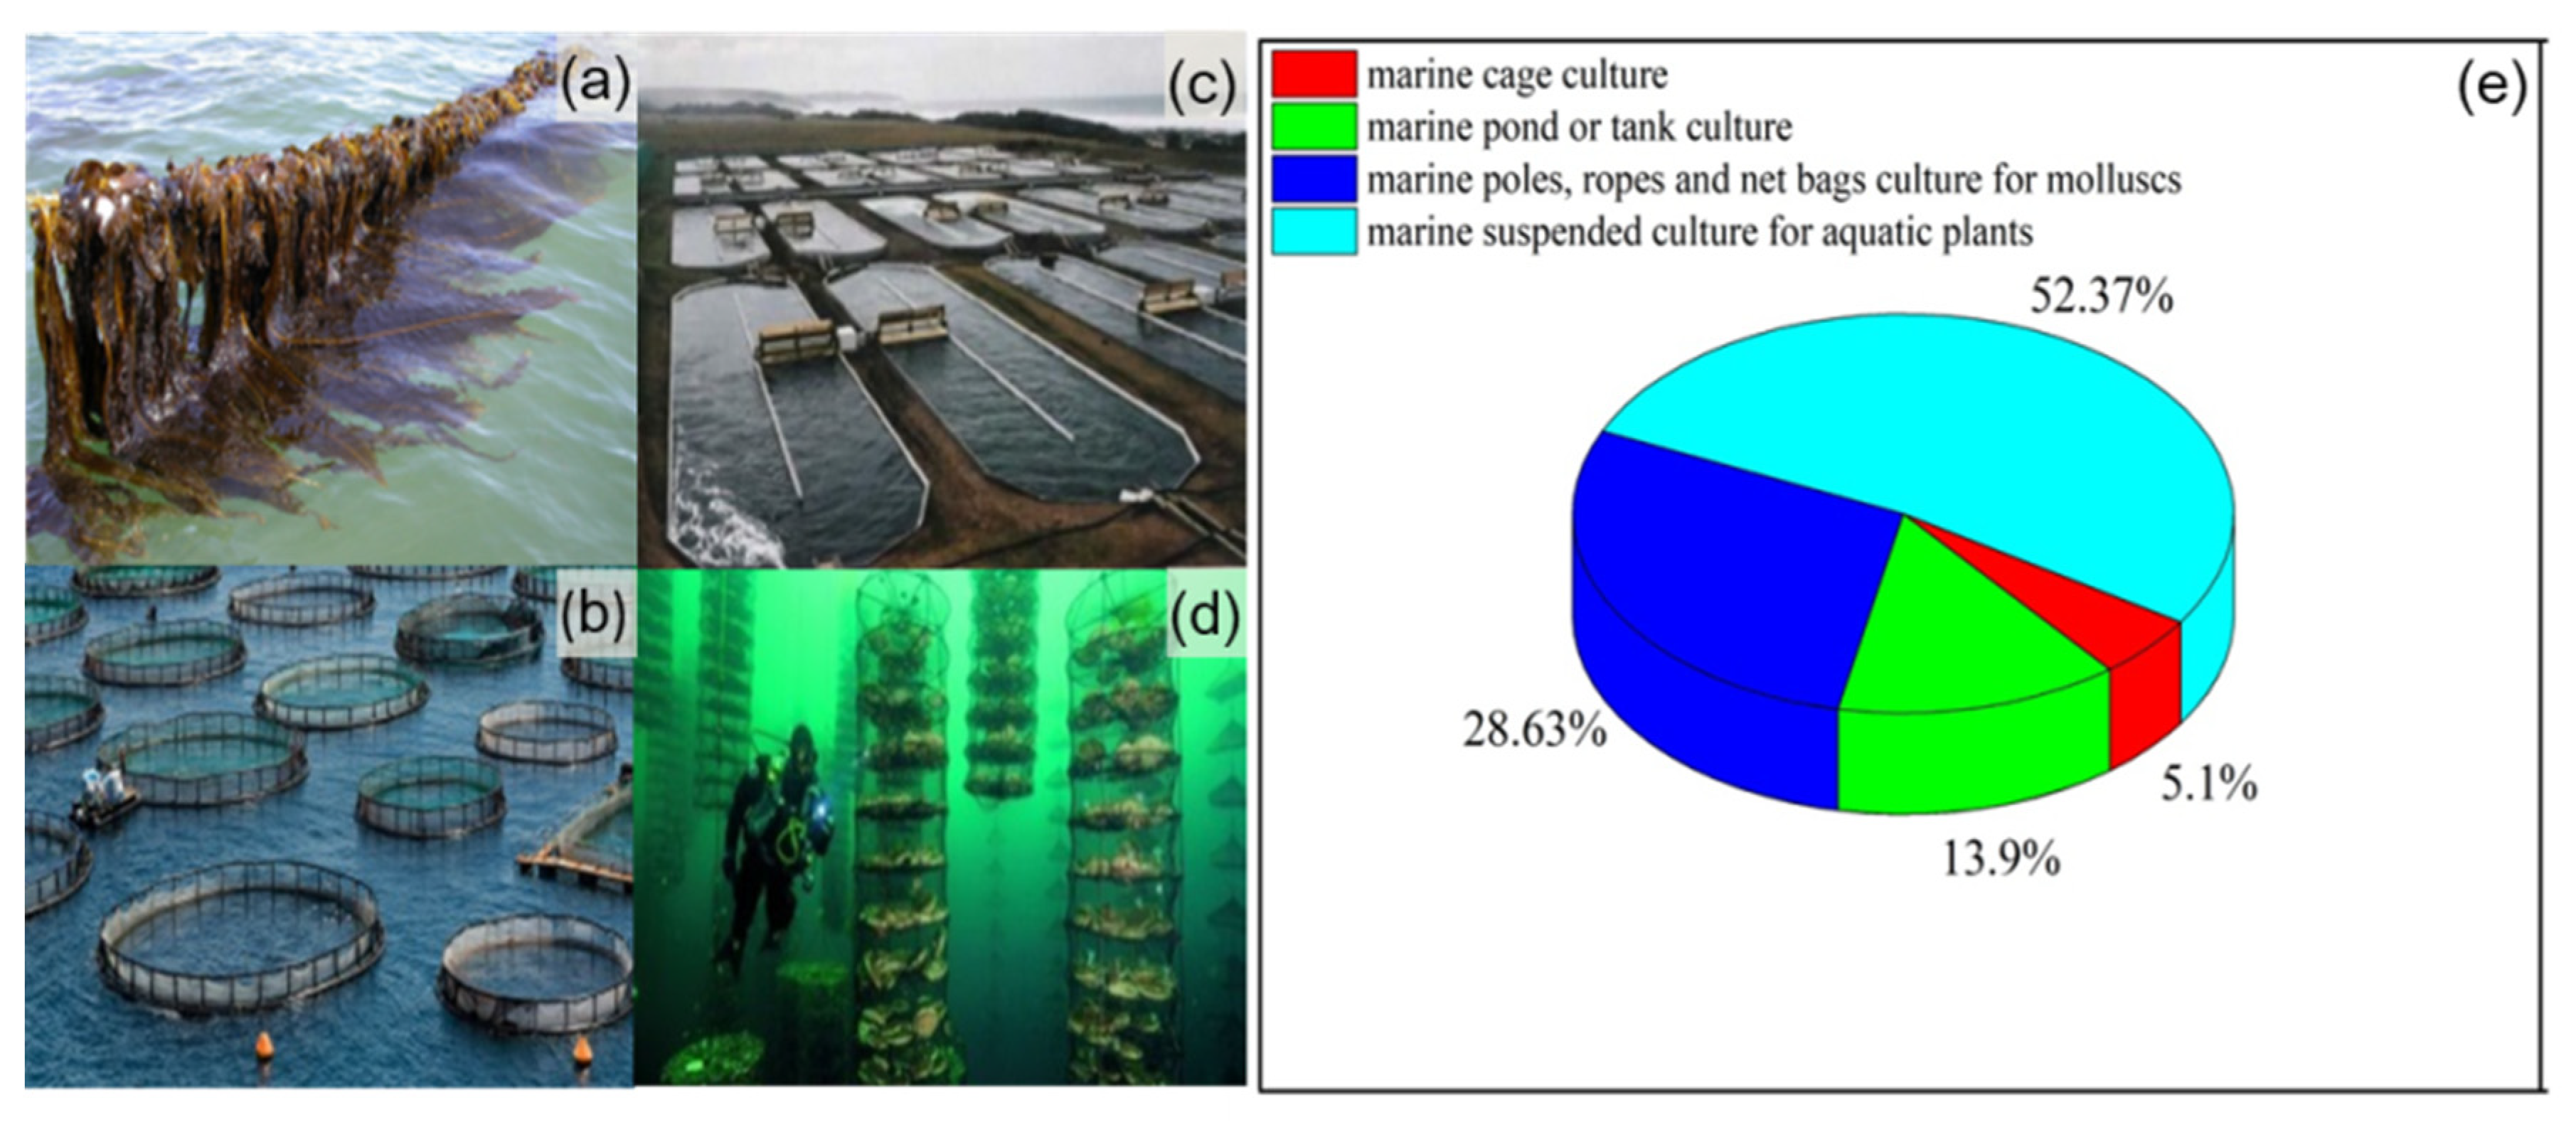
2. Types of Mariculture Systems

The majority of mariculture sites are distributed in nearshore marine waters and inter-tidal regions (e.g., mudflats) based on the habitat requirements of the breeding species. There have also been significant recent developments in the emerging area of offshore mariculture driven partly by deterioration in the nearshore environment and the advancement of offshore technologies [21]. The mariculture systems are comprised of four typical types: marine cage culture, marine pond or tank culture, marine poles, ropes, and net bags culture for mollusks and marine suspended culture for aquatic plants (detailed information on typical mariculture systems can be found in [22]) (Figure 1).
Marine cage culture is generally used for fish farming and refers to the activity of setting enclosed structures such as cages and pens near the surface in seawater bodies and cultivating fish within them [23]. Currently, such cage cultivation systems provided the vast majority of fish products globally, alongside other cultivation systems producing other aquatic products such as shellfish and seaweeds [24]. Since the fish cages are essentially an open system where water passes freely through them and interact strongly with the environment, cage systems tend to produce wastes that are released directly into the marine environment [25]. Moreover, fish cage cultivation, unlike the cultivation of other species, requires feeding with additional concentrations of nutrients and chemicals to promote fish growth and help prevent disease, while the metabolic processes of fish also yield excessive pollutants [26]. Therefore, cage cultivation represents the main source of waste effluent discharge among all mariculture systems (even though it only constitutes about 5% of total mariculture production, Figure 1). As such, this paper focused mainly on these marine cage systems and the effluents produced.

3. Mariculture Effluents: Composition, Waste-Load, and Environmental Impacts
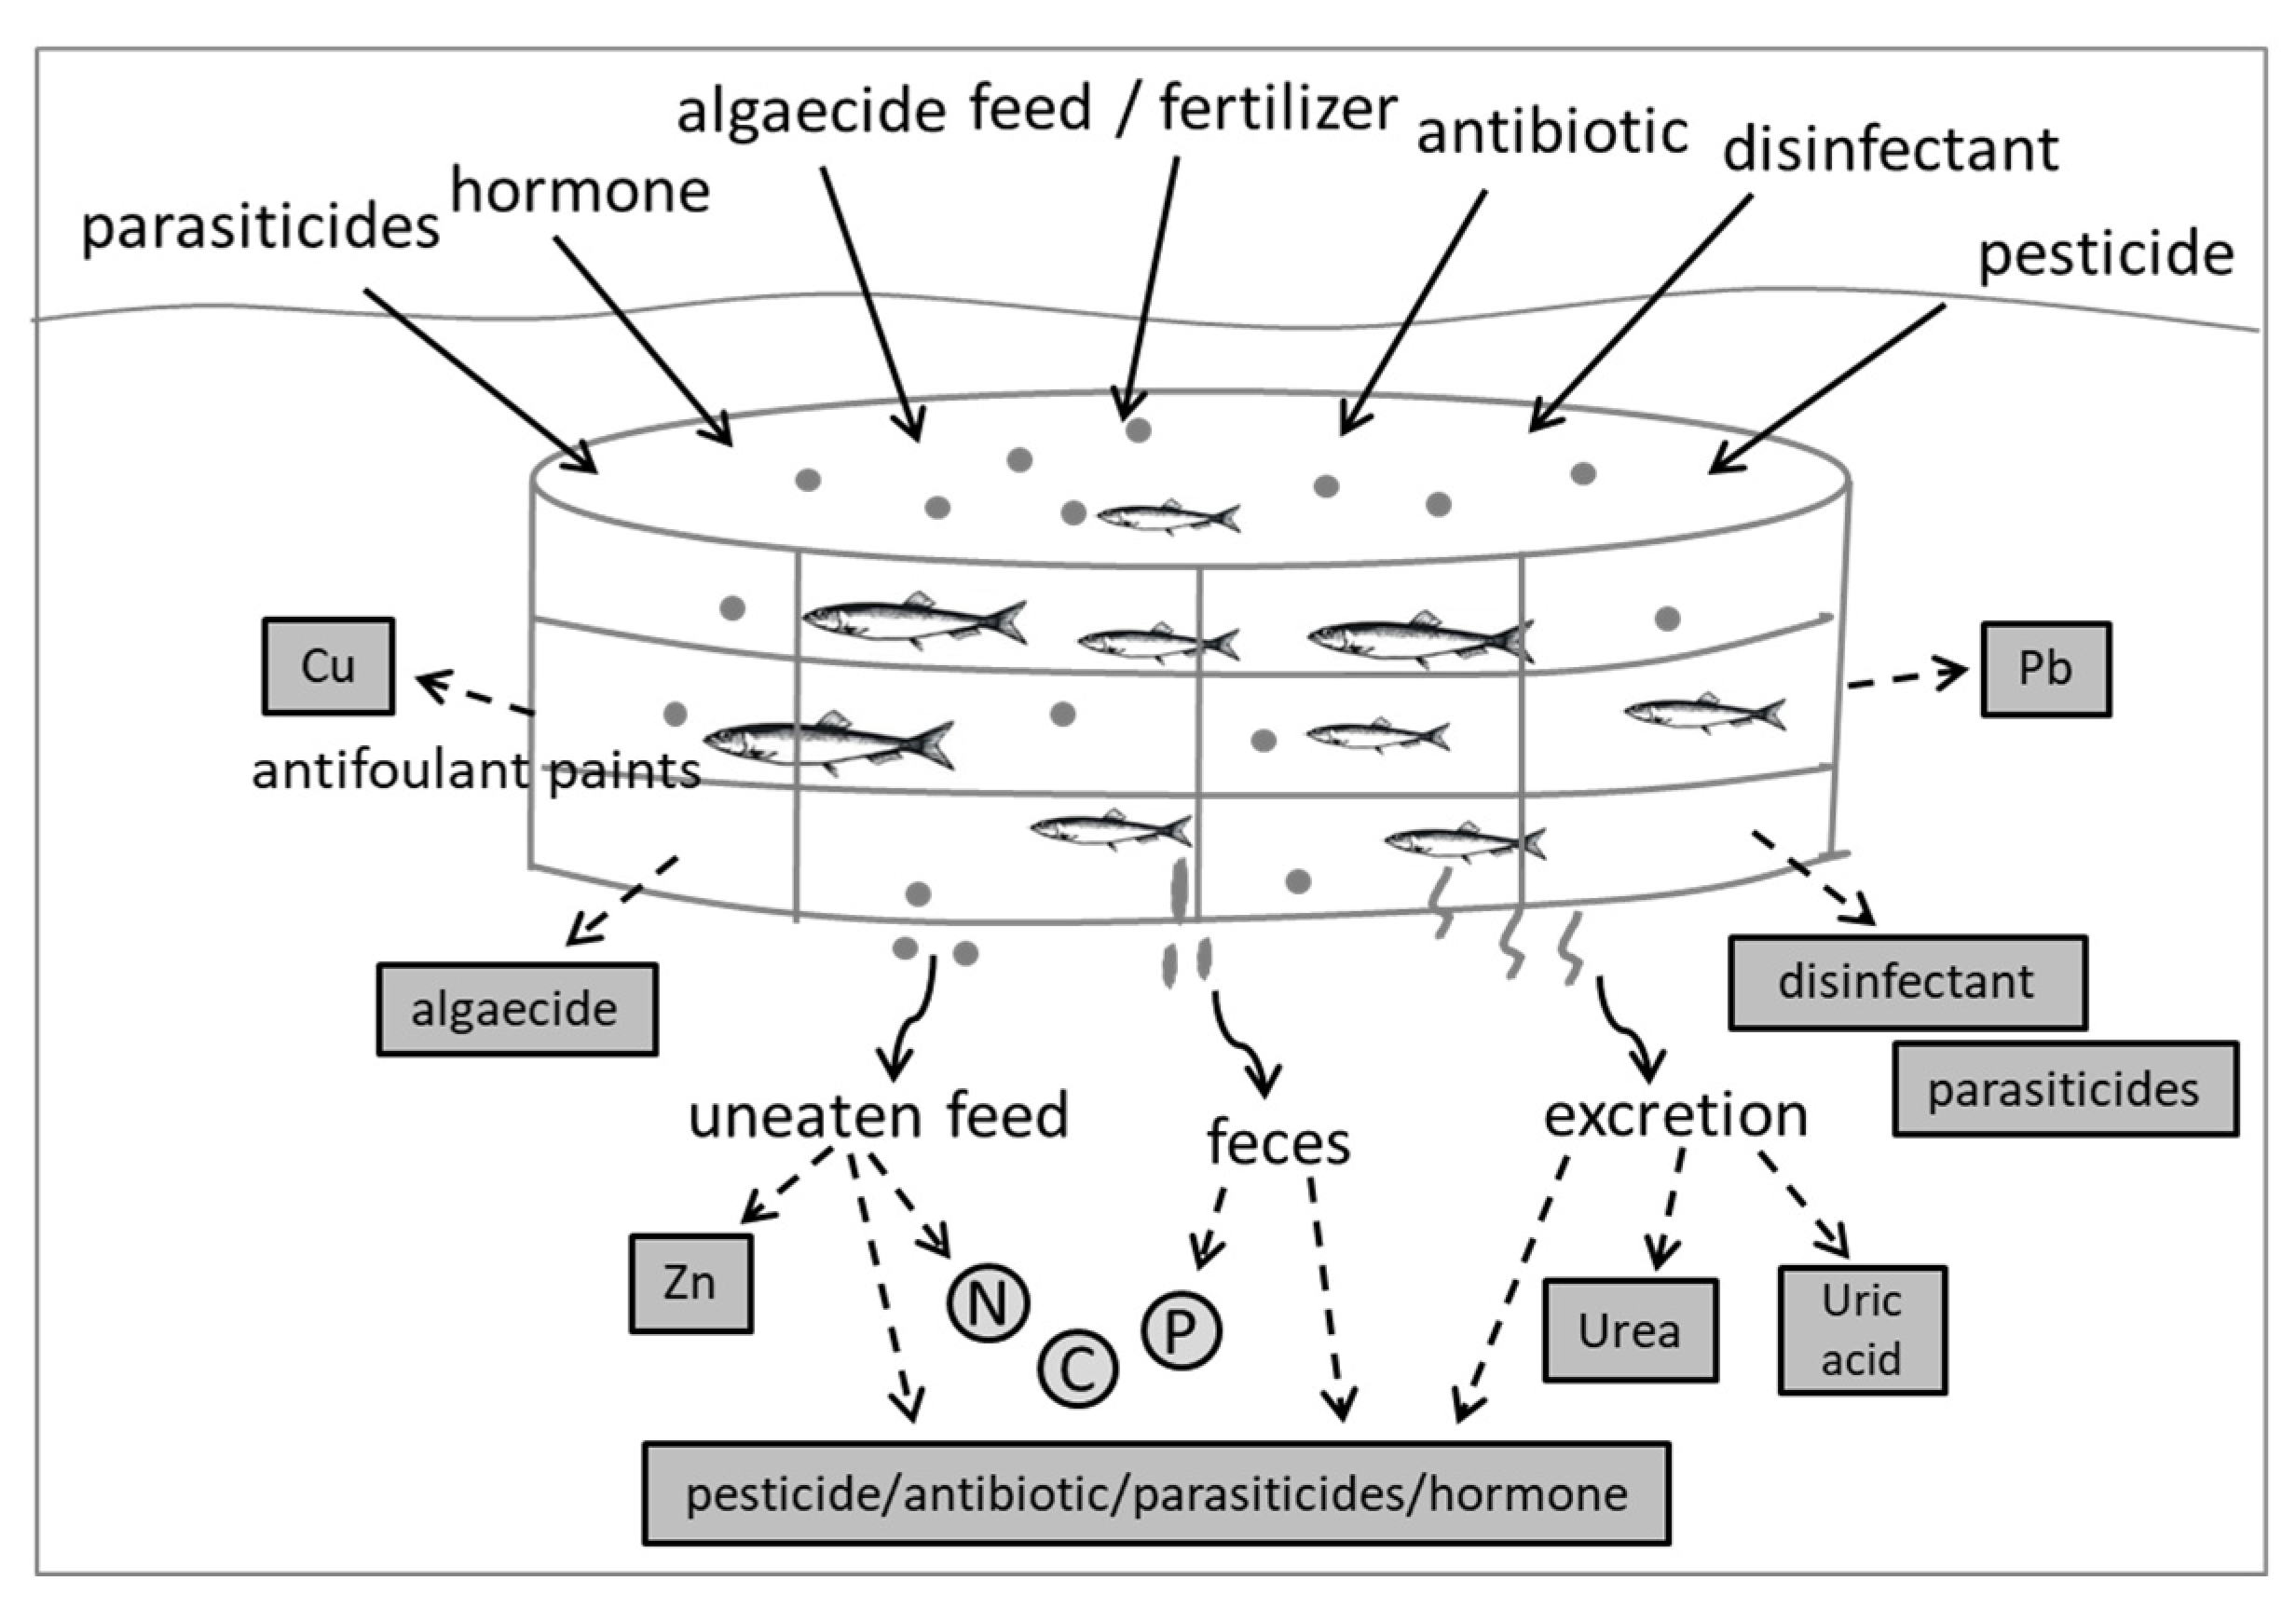
3.1. Composition

3.1.1. Organic Matter and Nutrients

The types of waste contained in the mariculture effluent mainly include organic matters such as organic carbon, urea, uric acid, and nutrients such as nitrogen (N) and phosphorus (P) [28]. These organic compounds and nutrients originate from fertilizers, feeds, and metabolic processes, such as uneaten feed, ingested but undigested food (feces), or food ingested and eliminated as excretion during production (Table 1, Figure 2). Fertilizers and feeds are introduced into cage or pond culture to promote the production of fish, shrimp, or other species. These substances contain high contents of protein, carbohydrates, lipid, nitrogen, and phosphorous, which could be transformed to dissolved organic matters and nutrients when in contact with water [29]. Detritus, uneaten feed pellets, and metabolic fecal matter provide organic particulates and nutrients in the water column, which can subsequently settle to, and deposit upon, seabed sediments [30].

3.1.2. Chemicals

Chemical contamination from the mariculture systems mainly include chemicals and heavy metals. Therapeutants are the most commonly used chemicals for a wide variety of purposes, including antibiotics to control disease, algaecides, pesticides, and parasiticides to control algae; pest species and parasites (e.g., sea lice) [31]; hormones to enhance productivity; and disinfectants to maintain hygiene throughout the production cycle (Table 1, Figure 2) [32]. Uneaten feed, feces, and biliary excretion are the main sources of antibiotics, pesticides, parasiticides, and hormones, whereas disinfectants and algaecides are commonly administered as a bath directly added to the water column and discharged outside the farm [33]. Moreover, heavy metals such as zinc, copper, and lead are often contained in antifoulant paints and coatings for the cage structures [34], ingredients of fish feed, or algaecides and pesticides such as copper sulfate to prevent infections and algal overgrowth [35]. These heavy metals can therefore find their way into marine environments with relatively high concentrations of mariculture infrastructure and effluents, and can concentrate both in the water column and benthic sediments in the area surrounding the cultivation site [36].

3.2. Waste Load

Waste load from mariculture systems has been largely studied with the main focus on nutrients discharge, especially N and P. Nutrient loading depends on several factors including the feed type used, the proportion unconsumed, and fecal production [37]. The amount of feed required for cage cultivation is dictated by feed types, feeding frequency, and cage stocking density [38]. The actual amount of feed supplied to the cage that is consumed by fish and its digestibility are the two most important factors that determine the amount of uneaten feed and the fecal wastes produced [39]. In most studies, the nutrients released to the environment are calculated theoretically using models based on mass balance equations [40]. A traditional model to calculate the load of N and P uses a feed conversion ratio (FCR) based regression model that takes account of feed loss, FCR, and nutrient contents in the feed to predict the nutrient load for a given diet [41]. The model has been upgraded using the dry matter conversion rate (DMCR) instead of FCR to simulate more effectively the relationship between feed input, fish production, and waste generation [42]. Moreover, the nutrient load model can be coupled with fish growth models to simulate the temporal pattern of nutrient loads and identify maximum discharge during fish growth [43].
Chemical loading also depends on the types of chemicals utilized in treatments and the treatment frequency. Available chemical treatments in mariculture are strongly restricted by regulatory legislation and policies and may vary among different types of mariculture farms and between different countries. Discharge of chemicals such as medicines or antibiotics that are added directly to feed or fertilizer depends largely on the absorption rate of the fish and their fecal production [31,44]. In general, chemical load modeling has received relatively little attention, with conventional chemical assay mostly used to analyze chemical constituents in the effluent [45].

3.3. Environmental Impacts

The most significant negative environmental impacts of intensive mariculture are those related to high loads of organic matter, including nutrients and solids. Organic matter contributes to nutrient pollution, which further leads to hypoxia and eutrophication through fertilized aquatic plant growth and respiration [46]. Significant concentrations of organic matter and nutrients cause the excessive growth of phytoplankton, which reduces the transparency of the water column, affecting the photosynthesis of aquatic plants and impairing the balance between primary and secondary productivity [29]. Furthermore, eutrophication and high levels of organic matter lead to low dissolved oxygen concentrations in the water column. This may result in a reduction of wild fish populations and have detrimental impacts on other aquatic organisms as a result of deteriorated habitat quality [30]. Conversely, uneaten feeds can also provide a potential trophic resource used by biofouling communities attached to the cage structures, as well as wild fish in the surrounding waters. This can result in the aggregation of fish or other trophic creatures around the cage facilities, stimulating biological activity [47]. Organic and nutrient enrichment may also change the physicochemical compositions of seabed sediments and further affect the abundance, biomass and biodiversity of the benthic communities [48]. An increase of total organic carbon accumulation in the sediment would be harmful to benthos due to decreasing oxygen availability [49]. On the contrary, the enrichment in lipid content due to the accumulation of uneaten food pellets on seabed would become nutrient resources to promote microbenthic algal growth [8]. Besides, the environmental impact of effluent on benthic domain varies with different substrates and the soft substrates without vegetation tend to accumulate more pollution than vegetated areas [8].
Mariculture effluent can also increase the concentration of heavy metals and chemical compounds in the adjacent water column and seabed sediments. Heavy metals are accumulated in benthic sediments, where they are incorporated into several biological and chemical cycles [50]. High concentrations of zinc, copper, or other metal elements are toxic to macrobenthic fauna and microalgae, which are crucial elements in the food-chain for natural fisheries production [51]. Moreover, the residues of medicines, antibiotics, and vaccines found in the effluent are common sources of anthropogenic chemical pollution derived from mariculture operations [52]. They may harm unintended species outside the mariculture systems, leading to antibiotic resistance and other toxicity side effects, resulting in cascading effects throughout the marine food web [53].

4. Transport and Transformation Processes of Mariculture Effluent

The transport and transformation processes dictate the spatio-temporal distribution and the final fate of effluent discharged from the mariculture systems, which in turn determine their effects on sensitive marine habitats and ecosystems. Therefore, improved understanding of the physicochemical and biological processes associated with the transport and fate of mariculture-derived effluents is crucial for the appropriate regulation and management of mariculture operations around the world.

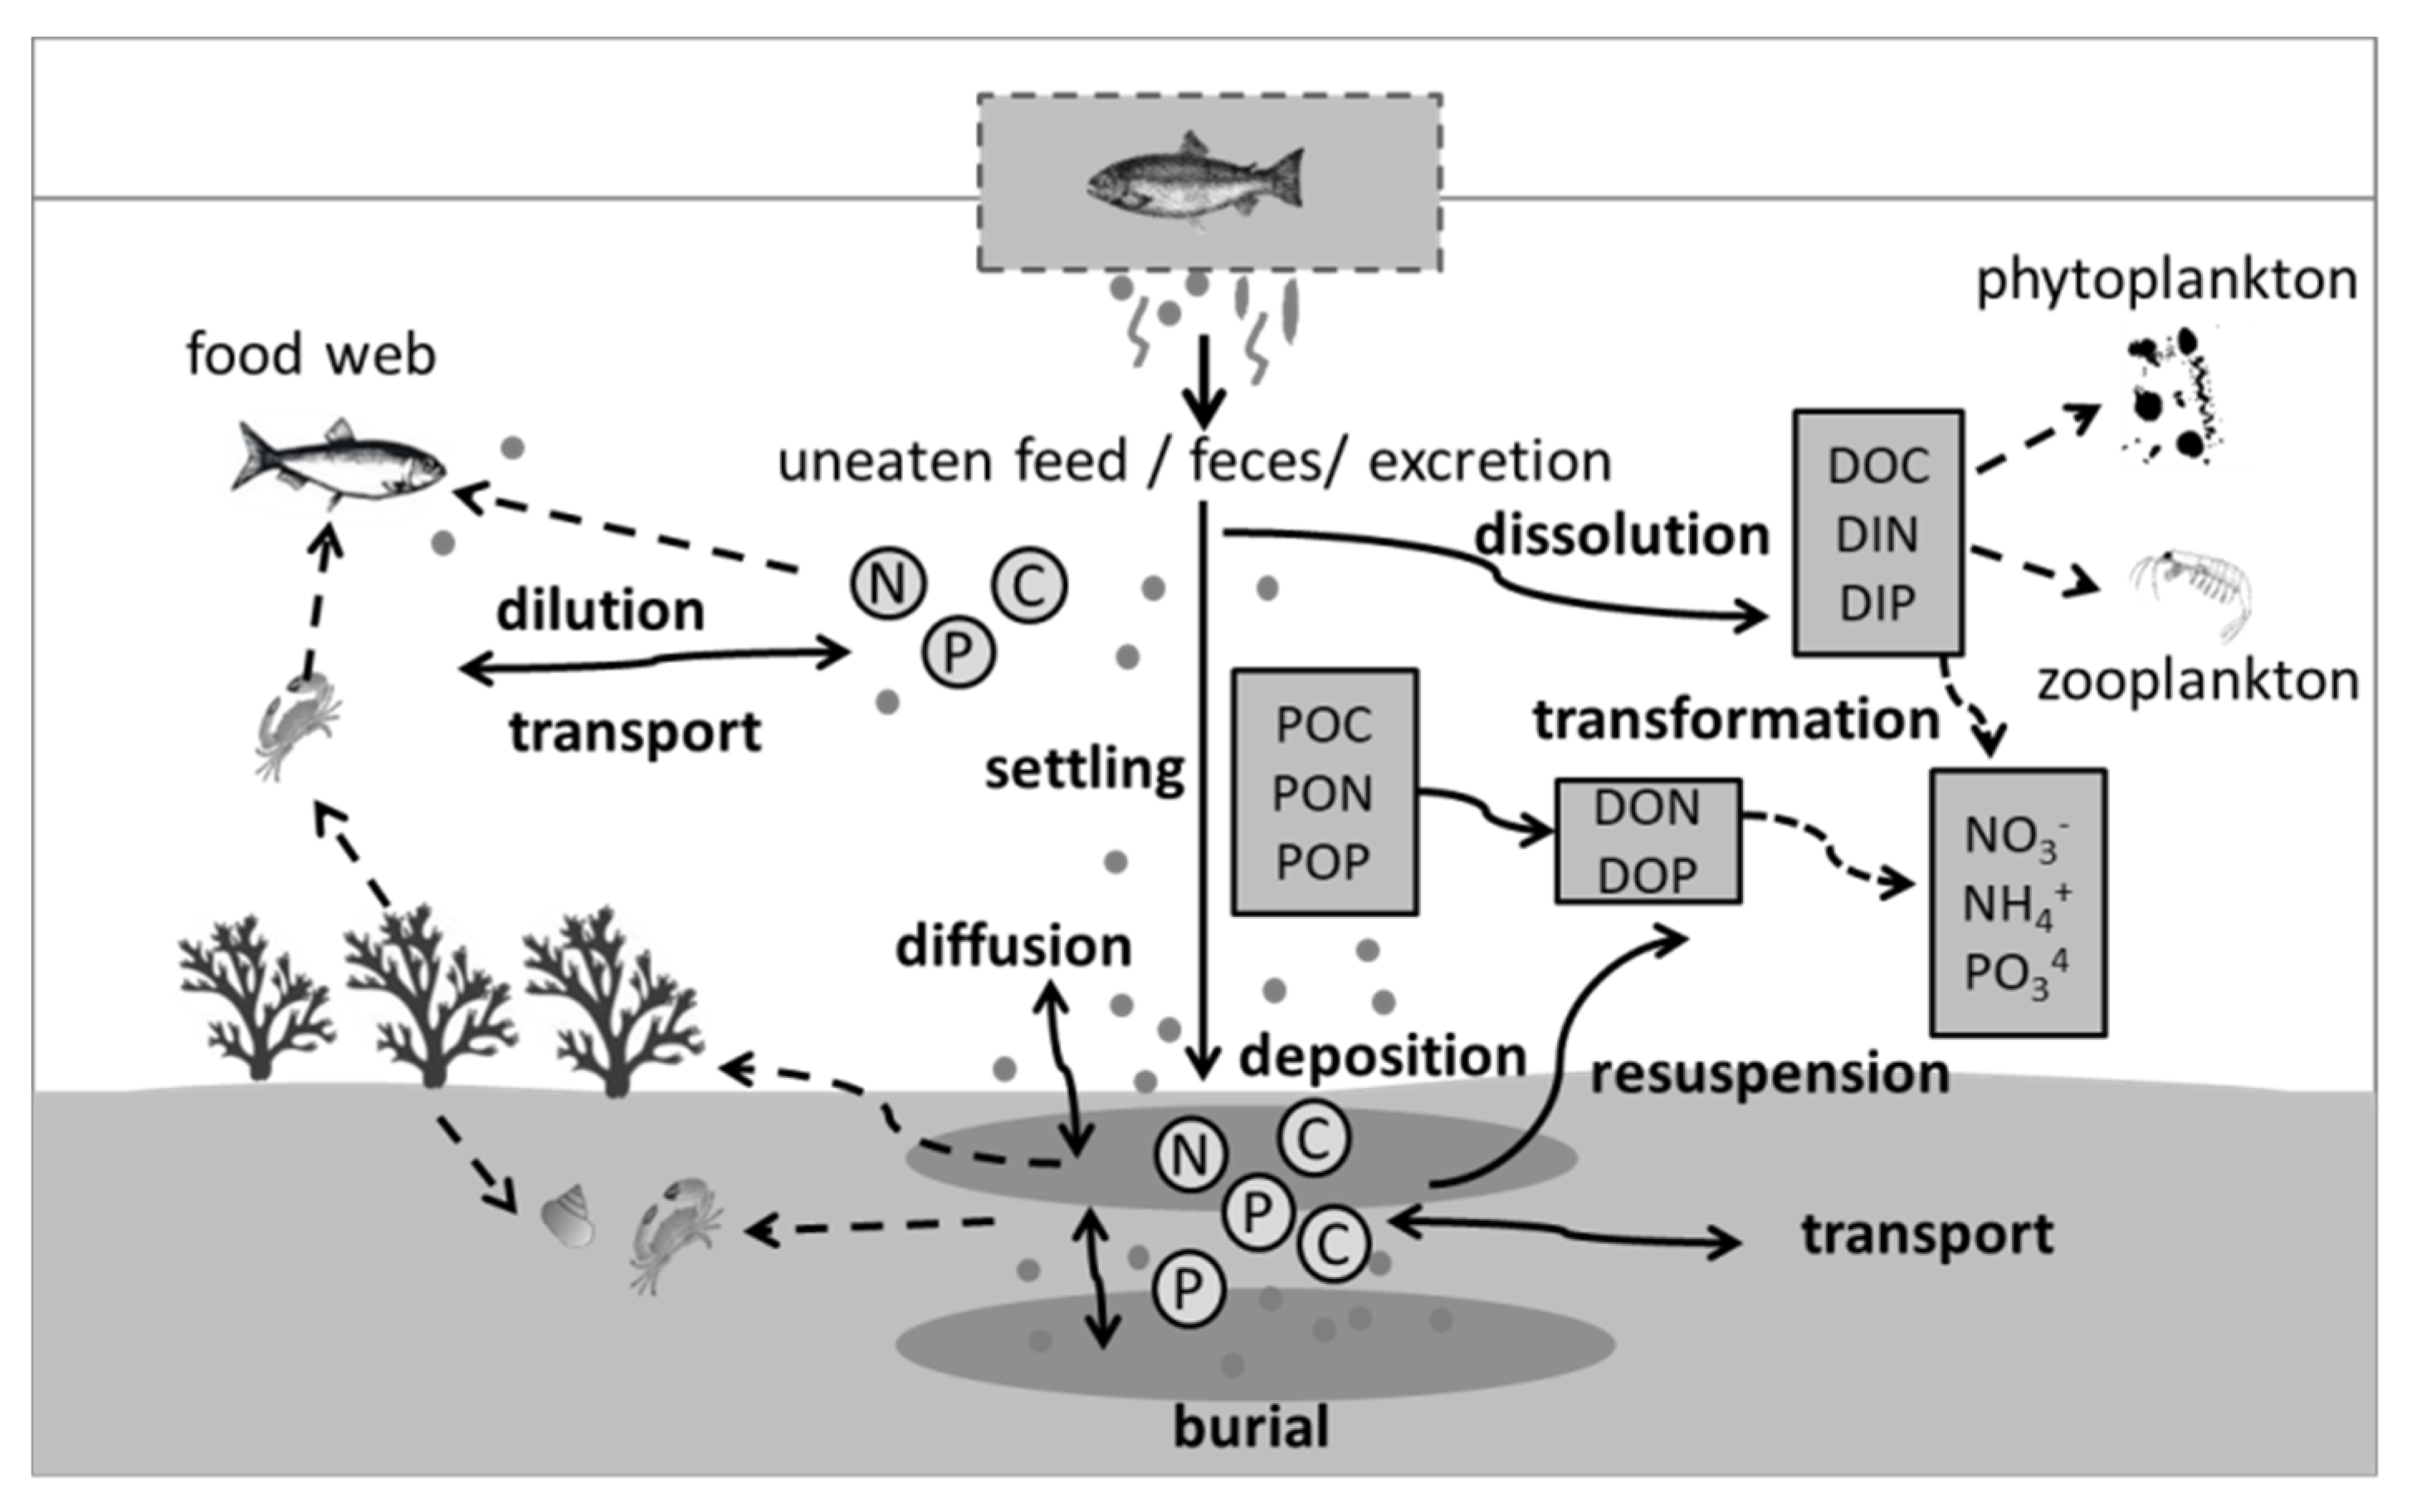
4.1. Transport and Transformation Processes in the Water Column

Traditionally, the process of transport of an effluent is divided into three phases: near-field, mid-field, and far-field, all of which correspond to different spatial and temporal scales [54]. After the effluent has been discharged, the processes of initial mixing and turbulent diffusion/dilution take place in the water column. The initial dilution process is determined by hydrodynamic conditions at the discharge site and is typically accommodated by a regulatory mixing zone. The ambient flow field can also be altered significantly by the presence of the cage structures due to their partial blockage of the flow, especially in locations with clustering of large quantities of cages [55]. Subsequently, the dissolved and particulate organic matters and nutrients are transported and mixed as passive tracers in the ambient flow, and can affect not only the near field but also distant areas after being transported over large distances (Figure 3) [56]. Mixing of dissolved wastes, due to dispersion and diffusion processes, also varies with hydrodynamic conditions (e.g., winds, waves, tides, and currents), which collectively influence how far a waste plume will spread from the source [57]. Previous studies have suggested that the mixing distance of dissolved waste is dependent primarily on local current speed (and direction), water depth, and total effluent load from the mariculture site [58]. It has also been suggested that at low water depths, dissolved nutrients tend to attain higher concentrations in the water column and spread more rapidly in a short time, while in deep waters, they tend to release nutrients during the settling process and spread more slowly [59]. Hence, the nutrients would spread more slowly and last longer in deep water than in shallow water [60].
The particulate fraction of mariculture wastes tend to settle in the water column after dilution. The settling velocity of the particles is mainly influenced by their physical characteristics such as density, the hydrodynamic conditions such as flow turbulence, and water viscosity [61]. For example, fecal particulates sink much more slowly than food pellets, partly because fecal particulates tend to absorb water and disintegrate, and thus reduce their density and settling velocity when descending through the water column [56,62]. Flow turbulence is also critical to settling as it breaks particles into smaller ones and maintain them longer in suspension and thus need more time to settle [63]; however, its precise effect is still poorly understood at present. Moreover, environmental conditions such as the seawater temperature and salinity affect water viscosity and thus have indirect impacts on particulate settling velocities. Previous studies have shown that the settling velocities of particulate matter tend to be larger at higher temperature [61] and seawater salinity [64] due to the resultant reduction in water viscosity.
In terms of the transformation processes, as soon as uneaten feeds and fertilizers are discharged from the mariculture system, a proportion of dissolved organic matter and nutrients are diluted directly within the water column [65] and transformed into dissolved organic carbon [66], dissolved inorganic nitrogen (DIN) and phosphorus (DIP) (Figure 3) [29]. Detritus, uneaten feed pellets, and fecal particulates produced by metabolism can be transformed into particulate organic matter [67] and nutrients such as particulate organic carbon (POC), nitrogen (PON), and phosphorus (POP) present in the water column, which subsequently settles to the seabed and often form a deposited layer on the benthic sediments [30]. Dissolved organic nutrients (e.g., DON and DOP) can be further released through dissolution and resuspension from the deposited particulate fractions, while DIN, DIP, DON, and DOP present in the water column are further transformed into nitrates, ammonium, and phosphates through chemical processes such as ammonification, nitrification, and phosphorus assimilation [68]. The dissolution rate of particulate matter in the effluent is dependent on matter size, surface area–volume ratio, composition, and environmental conditions. It is known that smaller particulates with a larger surface area–volume ratios leach more nutrients for a given time, and nitrogen is dissolved at a faster rate than phosphorus, as the latter is mainly found in particulate form [69]. Besides, environmental conditions such as water temperature also affect the dissolution rate, which increases as temperature raises until the maximum dissolved concentration is reached [61]. Globally, the waste-load of nutrients from warm water systems would potentially be larger than from cold water systems under the same emission [70].

4.2. Transport and Transformation Processes at the Seabed Sediments

The larger particulates associated with mariculture effluents (e.g., feces, uneaten food) tend to gradually settle to the seabed and deposit on the sediment (Figure 3) [64]. The deposition of particulate wastes and spatial distribution on the seabed sediment depends primarily on the current conditions, particulate settling velocities and water depth, which collectively determine the overall settling period of the particles from their release from cages to deposition on the seabed. In quiescent waters, the maximum concentrations of deposited particulates are usually found directly beneath the fish cages, and their concentration declining gradually away from the cage area [71]. Moreover, previous studies have indicated that an increase in the current velocity appears to elongate the overall impact area of deposited particles, particularly on benthic sediments [72]. Meanwhile, deposited fecal matter tends to distribute more widely than food pellets on the seabed sediment under the same current, due to their lower settling velocity and greater sensitivity to the current velocity [60]. The deposition of individual particles is also attenuated by the bottom shear stress that low shear stress allows a larger probability for deposition [73].
When the deposited particulates have accumulated on the seabed over an extended period, they can be resuspended back into the water column when the threshold condition for resuspension is attained (Figure 3). The threshold condition for particulate resuspension from the seabed depends on the near-bed current velocity, shear stress, and water depth [74]. The critical bed shear stress is one of the main thresholds for resuspension, which depends strongly on substrate roughness and material type. Specifically, smooth substrates typically require lower critical stresses for material resuspension than rough surfaces [75], while the critical shear stress also varies greatly among different particulate materials with varying size and cohesiveness. For instance, smaller-sized particulates tend to have lower resuspension thresholds, and resistance to resuspension increases with increasing cohesiveness, consolidation and biostabilization of the benthic sediment layer [63,76]. Moreover, numerical simulations have demonstrated that water depth also has a significant influence on the occurrence of particulate resuspension. For example, in a shallow water environment with a 12 m depth, one-third of the resuspension is attributed to surface waves, whereas at depths greater than 60 m, typically almost no particulate resuspension occurs and very limited mixing of deposited particulate wastes is observed [77].
The burial process of deposited particulates initiates when the deposited flux is larger than that of resuspension, which forms a deep sediment layer below the active deposited sediment layer [78]. The burial efficiency of particulate nutrients or organic carbon is found to be influenced by settling velocity and sediment porosity, and decreases with increasing depth [79]. However, the dominant controlling factors are not completely clear. Meanwhile, with continuous deposition and burial of particulate waste such as N and P at the seabed, a fraction of nutrients is diffused from porewater to the overlying water column. The diffusive flux is determined by concentration gradient of the sediment-water interface and effective diffusion coefficient in porewater, which is influenced by sediment tortuosity and porosity [80].

5. Regulatory Mixing Zones

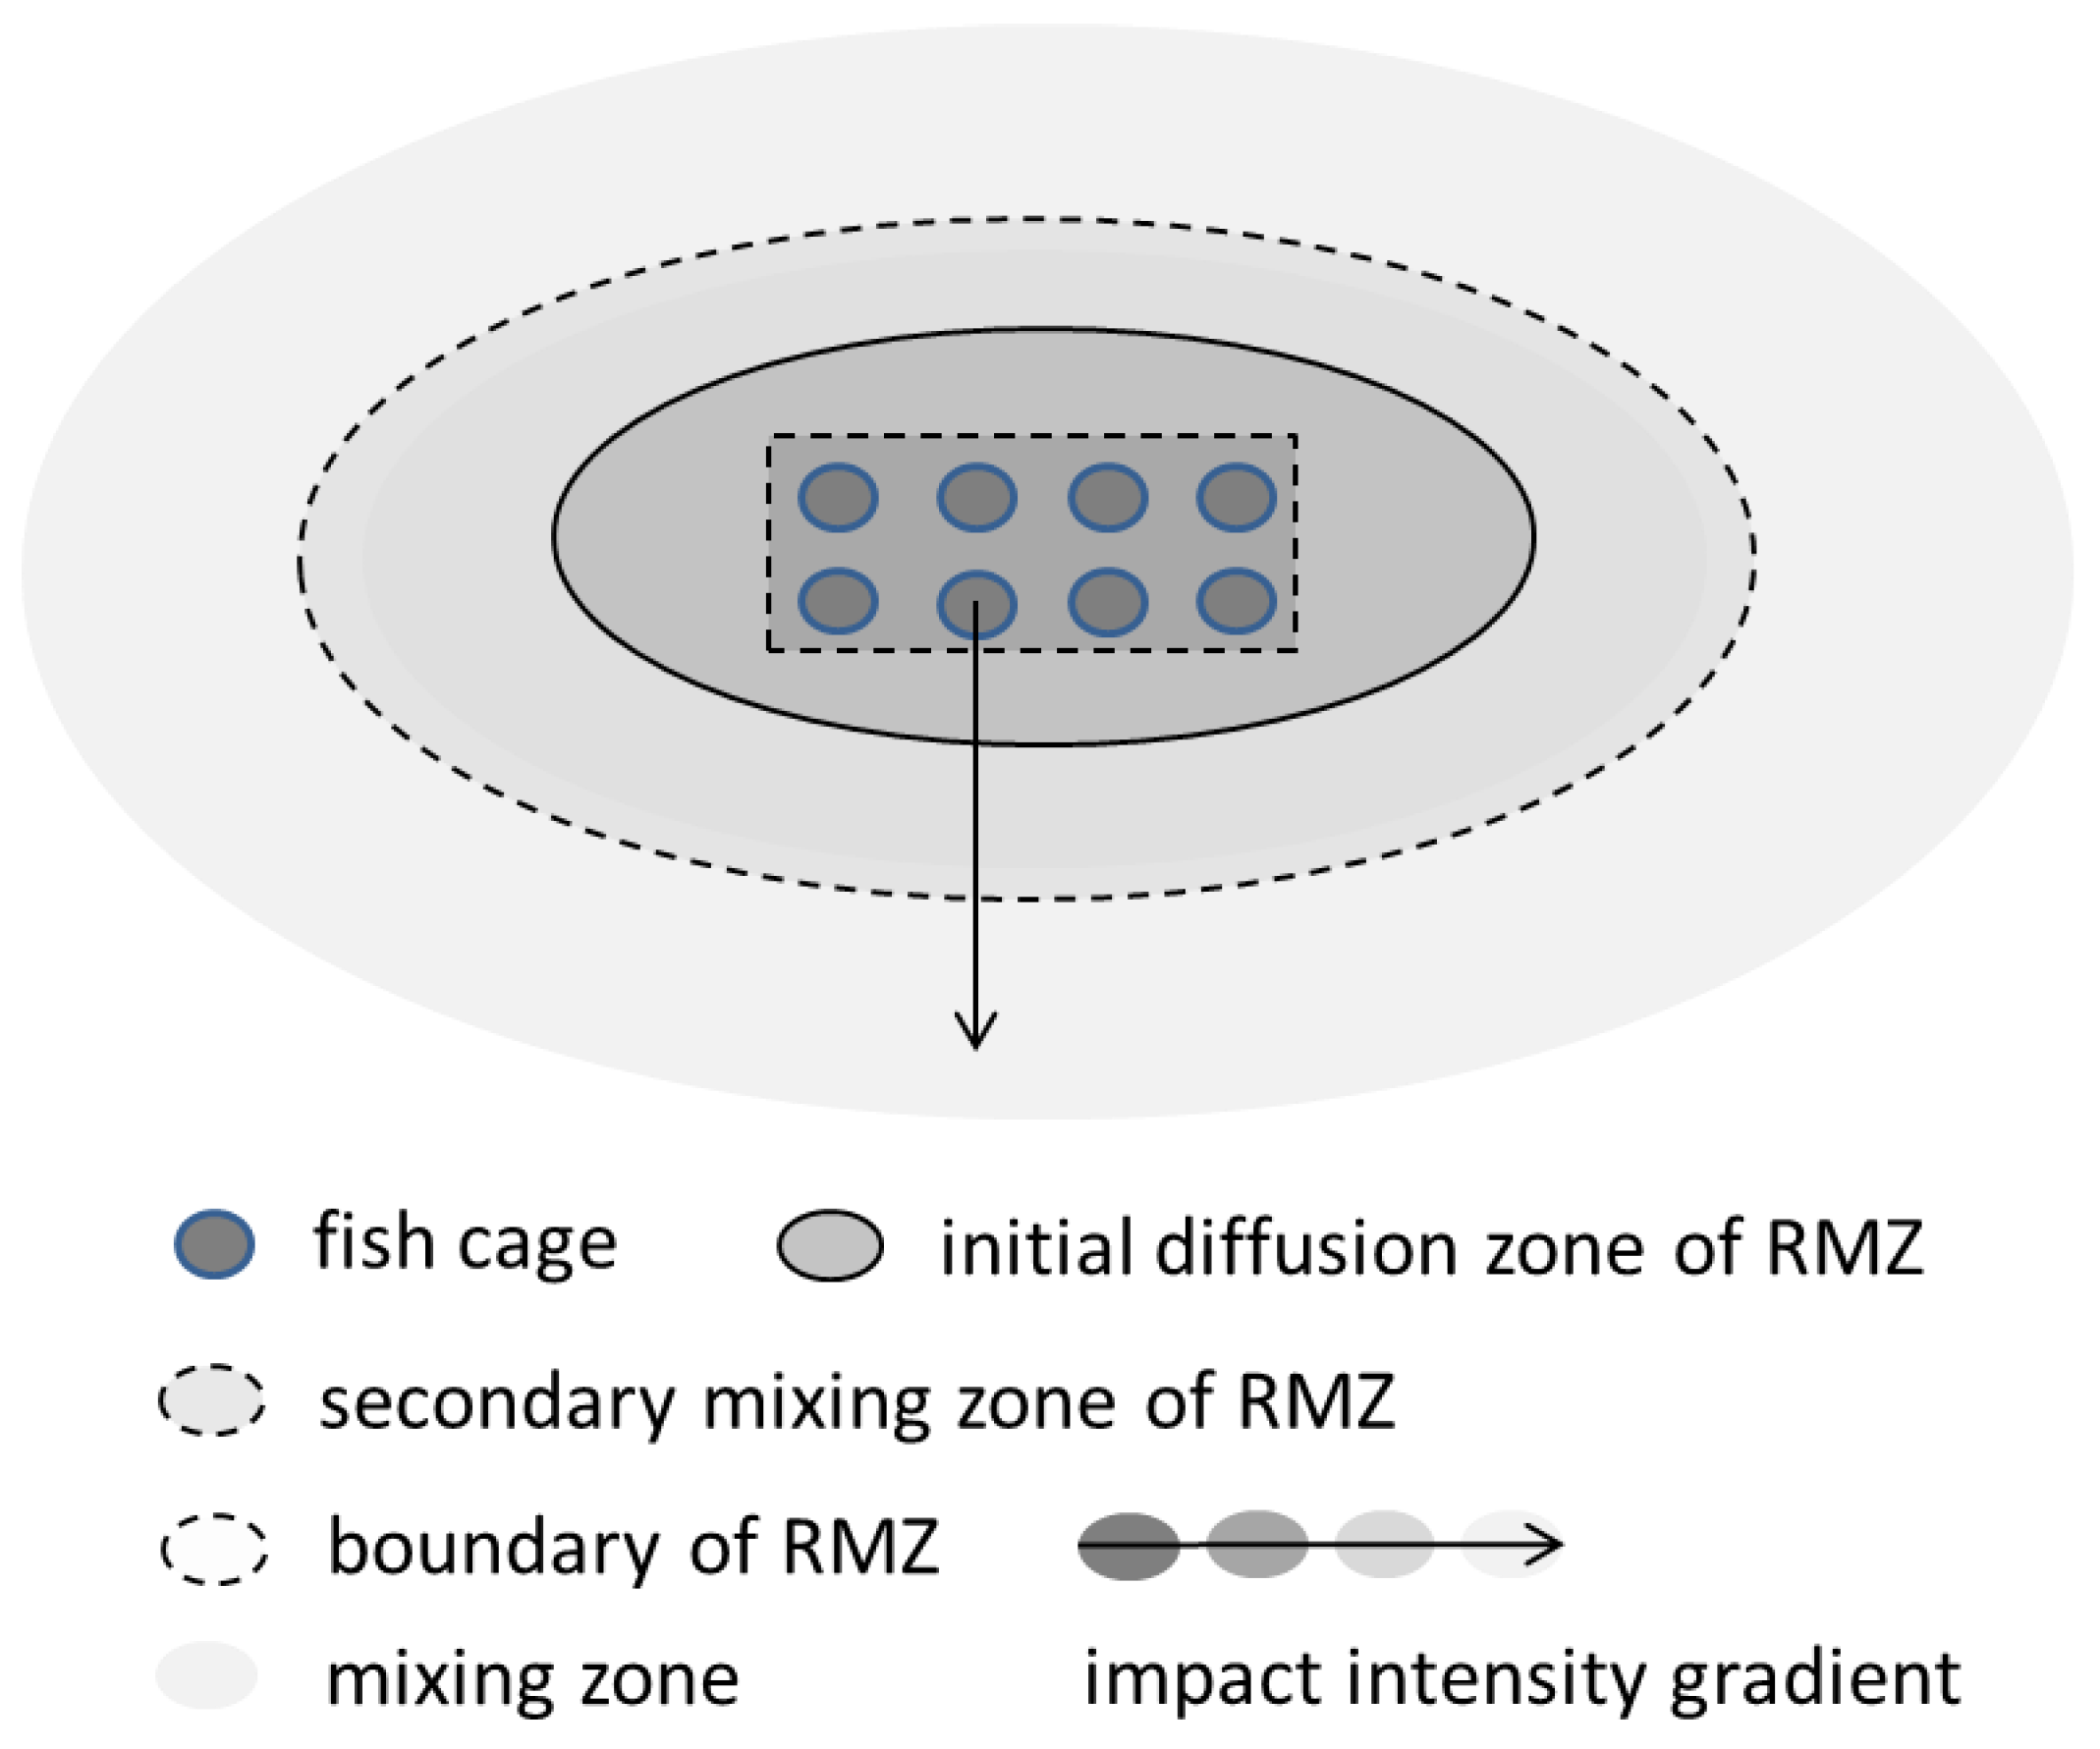
5.1. Concepts of Regulatory Mixing Zones

Similar to marine wastewater discharges, the mixing zone for mariculture effluent is defined as the area immediately around the cage culture system where the effluent is physically mixed and dispersed into the surrounding environment [81]. Emission limit values (ELVs) and environmental quality standards (EQSs) are established in the mixing zone for important contaminants present in the effluent, which apply to the water quality at the end of point-source and within the receiving environment, respectively [82]. ELVs are set according to the assimilative capacity of the receiving waters to achieve the goal that the final environmental concentrations will comply with EQSs after mixing in the receiving waters [83]. Hence, a regulatory mixing zone (RMZ) is required to define a fraction of the MZ where EQSs can be exceeded, but higher environmental standards must be met outside the boundary of RMZ (Figure 4) [84]. The RMZ consists of the initial diffusion zone and the secondary mixing zone [85,86]: the initial diffusion zone is around the point-source where the initial contact with the receiving water occurs, and thus it is with the greatest concentration of the effluent [87], and the secondary mixing zone covers a more extensive area in which the effluent is mixed by turbulence so as to protect the whole waterbody from being polluted by the mariculture system [86]. Depending on the context, the RMZ is also termed as the allowable zone of effect (AZE) or inner zone, and some additional information regarding the RMZ is as follows [88,89,90]:
(a)
The RMZ applies only to the point-source discharge of effluent to a surface waterbody.
(b)
The RMZ contains the initial mixing process in a restricted area and is thus subject to the highest concentration of the effluent that could potentially exceed the EQSs therein. However, the water quality deterioration in the RMZ does not impair the integrity of the water body as a whole, and there is no lethality to organisms passing through the mixing zone.
(c)
The objective of the RMZ is to manage the load and water quality of effluent discharge and achieve the highest attainable level of ambient water quality or the minimum environmental impact from dilution and mixing.

5.2. Characteristics of Regulatory Mixing Zones

The RMZ determines the extent to which effluent is allowed to initially mix and plays a vital role in limiting the pollution of receiving water bodies from the mariculture system. If the regulatory mixing zones are not defined and implemented appropriately, they could adversely affect mobile species passing through the mixing zone as well as settled species such as macrobenthic communities in the benthic sediments near the effluent sources [86]. The key characteristics and descriptions of RMZ in the major mariculture countries and regions, including location, size, and shape, are listed in Table 2. The member states of the European Union, including the accession countries such as Norway and the UK (including Scotland) [83], need to comply with the Water Framework Directive. In Australia and the United States [91], most states have their own legislation and policies but still broadly follow a nationwide management framework, and Canada tends to follow US EPA guidance for RMZ management [86]. Some major mariculture countries such as China are found to lack specific regulations on the designation of regulatory mixing zones as a prominent issue [92,93]. Amongst the various countries and regions, the RMZ is typically set concerning the location of the aquaculture system, while considering local ecosystem requirements and existing uses of the waterbody. The size of the RMZ appears to be more variable as a site-specific feature but mostly varying in the range of 100–200 m in radius. The shape of the RMZ is often not specified in the regulations of many countries.

6. Environmental Standards of Mariculture Effluent

In the context of regulation, regulators are required to establish the relevant environmental standards that apply to the quality of the effluent discharged at the end of point-source (ELVs) and receiving environment outside the regulatory mixing zones (EQSs), respectively, thus avoiding irreversible environmental impacts. Regular monitoring is also required to assess whether individual farms meet the required standards.

6.1. Emission Limit Values (ELVs) of Mariculture Effluent

ELVs of discharged effluent can be found in national and international legislation for different types of effluent discharge, e.g., the ANZECC (2000) water quality guidelines in Australia [91], the Federal Water Pollution Control Act (FWPC) (1972) in the USA [94], and the Marine Aquaculture Water Discharge Requirements (2007) in China [95]. The most relevant water quality parameters for mariculture effluent, including the abiotic and biotic parameters, are listed in Table 3. Some parameters are related to the discharge of organic matter and nutrients such as the concentration of dissolved oxygen (DO), biochemical oxygen demand (BOD), chemical oxygen demand (COD), total suspended solids (TSS), total nitrogen [96], total phosphorus [97], ammonia, nitrate, total organic carbon [98], and chlorophyll-a. Other parameters are related to the release of chemicals such as the concentration of copper, zinc, chromium, nickel, cadmium, lead, mercury, and free residual chlorine [95]. In addition, some fundamental features of the seawater such as pH and temperature are also included [99]. Notably, it is beyond the scope of this paper to provide an exhaustive overview of ELVs of mariculture effluent at a global scale, and the typical parameters in some major countries are documented in Table 3 for reference.

6.2. Environmental Quality Standards (EQSs) of Regulatory Mixing Zones (Receiving Environment)

Many countries have proposed environmental quality standards and regulatory policies to safeguard the water and sediment quality of receiving environment, e.g., the Marine Water Quality Standard (1997) in China [102], the National Aquaculture Policy Framework (2013) in South Africa [103], the Aquaculture Management and the Environment Protection (Water Quality) Policy (2003) in Australia [104], the Technical Support Document for Water Quality-based Toxics Control (USEPA 1991), and Water Quality Standards Handbook: Second Edition (USEPA 1994) in the USA [105]. The EQSs are prescribed with respect to the RMZ, and mainly concern water quality and sediment quality.

6.2.1. Water Quality Standards

The key environmental standards associated with the receiving waters of mariculture effluents are associated with water quality within the RMZ and the fact that this should not impair the integrity of the receiving water as a whole, and that there is no lethality to organisms passing through the RMZ. Therefore, many countries and regions have proposed environmental standards to manage the water quality of the RMZ (Table 4). Generally, the parameters are part of those applied to effluent discharged, particularly the abiotic parameters such as suspended solids, total nitrogen, total phosphorus, and dissolved oxygen.

6.2.2. Sediment Quality Standards

Many countries and regions have also proposed environment standards to regulate the sediment quality of the RMZ (Table 5). The parameters include biotic ones such as contents of sulfide, carbon, zinc, copper [106], and biotic ones, such as biodiversity index and composition of benthos [107]. It is evident that considerable variability still exists in the parameters and the respective critical concentrations prescribed from different countries, which need to be thoroughly examined in the future to achieve better consistency across the world.

6.3. Techniques for Environmental Monitoring

Once environmental quality standards are established, monitoring measures to assess the mariculture compliance is also required to be put in place, with the purpose of acquiring and analyzing environmental data at various spatio-temporal scales to evaluate whether the effluent discharge meets the required environmental standards [10]. If the concentration and/or impact area is found through monitoring to be larger than the maximum allowable standards (i.e., defined by the regulatory mixing zone (RMZ) and allowable zone of effect (AZE)), appropriate regulatory steps are taken to reduce the effluent discharge and thus the resultant environmental and ecological impacts. In recent years, mariculture effluent monitoring techniques have developed rapidly from traditional manual point sampling techniques (e.g., visual diver surveys [109]) to cover increased monitoring areas using more time-efficient and cost-effective approaches (e.g., remote sensing [110], video monitoring [111]). In the following, we mainly focus on current mainstream monitoring techniques that permit both wide spatial coverage and high temporal resolution in data collection of important physical and biochemical parameters.
Wireless sensor networks (WSNs) have been recently adopted to provide continuous monitoring of water quality at high spatial and temporal resolutions. These systems allow a large number of water quality sensors to be installed around the mariculture site for detailed monitoring of dissolved oxygen (DO), salinity, total suspended solids (TSS), temperature, water level, and ammonia nitrogen [112,113]. Compared with more traditional point sampling techniques, WSNs are more reliable and cover the widespread dispersal of the effluent plume [114]. The application of remote sensing in mariculture monitoring is also now widely conducted using an array of optical (e.g., Landsat Thematic Mapper (TM), China–Brazil Earth Resources Satellite (CBERS)-3/4 and Sentinel-2A), and radar-based space-borne instruments (e.g., CosmoSkyMed, Radarsat and Sentinel-1A), to measure and monitor water quality parameters such as chlorophyll-a, suspended particulate matter, turbidity, and colored dissolved organic matter at varying spatio-temporal scales [110]. Acoustic doppler current profilers (ADCP) combined with free-fall multi-parameter profiler could be used to monitor the flow structures and water quality parameters such as conductivity, temperature, fluorescence, turbidity, and dissolved oxygen to show the possible distribution of effluent materials [115]. In addition, in-situ video surveys are used to monitor changes to benthic communities resulting from mariculture without the need for destructive sampling [111], as well as the feed uptake by fish stocks within the mariculture cages themselves.
Complementary to physical techniques, biochemical monitoring can trace the source of waste from aquaculture system to further identify environmental change caused by aquaculture effluent. Biochemical tracing techniques such as fatty acid (FA) analysis [116], stable isotopic signatures [117] and soya DNA [118] are relatively recent innovations now used increasingly as effective monitoring tools to trace mariculture waste in the water column or benthic system. They could effectively differentiate between aquaculture waste and marine source waste, as well as information on the overall influence of mariculture in marine ecosystems. Moreover, biological indicators are also widely used to monitor effluent discharge and the quality of receiving environment. Amongst them, macroalgal bioindicators can monitor and identify nutrient pollution between multiple effluent sources in the water column [119], whereas protistan groups can be used as bioindicators in environmental DNA barcoding methods to monitor the environmental impacts on macrobenthic communities [120].

7. Water Quality Modelling of Mariculture Discharges

The objective of achieving sustainable mariculture production hinges on the knowledge of the local and regional interactions between mariculture effluents and marine ecosystems. It is thus crucial to be able to predict the dispersal, deposition, resuspension, and accumulation of particulate organic matter, as well as dissolved nutrients and chemicals that emanate from the mariculture site within the surrounding near-field (local) and far-field (regional) pelagic and benthic habitats. Additionally, we need to accurately predict forecasting for the carrying capacity of the mariculture site, the assimilate capacity of receiving water body, and the severity of potential environmental impacts [121]. A number of modelling techniques have been developed to simulate the magnitude and extent of potential contamination from mariculture activities (Table 6), informing both the regulatory framework under which such activities are licensed and the site management and monitoring activities to ensure that compliance is achieved.

7.1. Near-Field Models

Water quality models simulating the near-field impacts from mariculture sites have been applied in many areas such as Scotland, Norway, and the Mediterranean [60]. Amongst them, a simple two-dimensional model termed DUCHESS has been developed to simulate particle waste dispersion from cages in the water column [123]. Models for particle settling, deposition, resuspension, and transport have also been developed to assess the impacts of particulate wastes on the benthic ecosystem. Simple particle tracking models such as AutoDEPOMOD [125] have been used to predict the deposition of waste material to the seabed without considering the prevalent hydrodynamic conditions in the receiving water body. The model predicted the benthic impacts from a fish farm site on a 1 km-by-1 km area around the farm [154]. Subsequently, mariculture waste deposition models such as MERAMOD have been developed to track organic solids particle incorporation and degradation in seabed sediments by combining the hydrodynamic model with a transport module, and predict the response of the benthic community [126]. The near-field resuspension model such as CODMOD that predicts the subsequent resuspension of bed materials in cod farming has been further developed by combining the particle tracking model with the resuspension model and incorporating particulate resuspension thresholds [127,128]. More recently, the NewDEPOMOD has been further developed to incorporate the resuspension process and the effects of varying bathymetry in the deposition process, along with potential integration with regional hydrodynamic models (e.g., FVCOM) to simulate more realistic flow patterns [124] and thus provide a link to far-field impact modelling.

7.2. Far-Field Models

Recent modelling efforts have been shifted gradually towards assessing the far-field effects of mariculture effluent that can extend kilometers away from individual sites, as well as investigating and quantifying the potential interactions between adjacent farms. These far-field models differ considerably from near-field modelling approaches in that they predict the effluent dispersion under varying hydrodynamic conditions at regional scales [7], while some far-field water quality models simulate the waste transport process in the water column. For example, the aquaculture waste transport simulator (AWATS) was a two-dimensional flow model coupled with a particle tracking model to simulate organic waste transport under spatially varying current around the study area [123]. The Mike21 hydrodynamic model is also a 2D model that has been used to simulate the spreading of dissolved wastes and particle feces through the advection and dispersion processes [41]. Subsequently, many hydrodynamic models have been used widely by coupling them to other water quality models to simulate the dispersion of mariculture effluent. For example, the MEC (Marine Environmental Committee) hydrodynamic model has been coupled with a fish cage drag model and particulate organic waste transport model to simulate the far-field impacts from mariculture effluents [134]. Other three-dimensional hydrodynamic models, such as the Bergen Ocean Model [74,132], TELEMAC-3D [59], MOHID [137], and Delft3D [139], have also been coupled with particle tracking models to simulate particle dispersion in the far-field. Another recent model development is the LAMP3D model that couples a fully 3D hydrodynamic model (the Princeton Ocean Model, POM) and a Lagrangian transport model to simulate the time-varying mixing and impact of the solid wastes, in which the changes in fish feeding behavior has also been considered [141]. Other models also simulate the far-field impact of settled particles deposition, transport and impact on the benthic sediment. Some hydrodynamic models, such as the Finite-Volume Community Ocean Model (FVCOM) coupled with a 3D Lagrangian particle tracking model, have been used to simulate the far-field impact of feed solid waste transport and deposition on sediment and benthic ecosystems [143]. Similarly, the Regional Ocean Modelling System (ROMS), also coupled with the Lagrangian transport model, was further developed to simulate the time-varying impact of the solid wastes on benthic sediment with changes in fish feeding behavior [141].

7.3. Coupled Near- and Far-Field Model

Notably, there are also some models that simulate the impact of mariculture waste dispersion and transport in both near- and far-field. For instance, SUNTANS incorporates the local/regional seabed environment (e.g., bathymetry, sediments) and prevalent hydrodynamic conditions (i.e., tides and wind-induced currents and waves) to assess the waste transport behavior in both near-field fish-farm site and far-field regional area [57].

7.4. Modelling Techniques for Ecological Carrying Capacity and Environmental Impact Assessment

Models have been developed to simulate the ecological carrying capacity of the mariculture system and are used as effective management tools in site selection and coastal zone management [155]. Some models used to assess the ecological carrying capacity have also incorporated the process of effluent discharge. For example, the management system model MOM (modelling ongrowing fish farms monitoring) has been widely used to analyze the carrying capacity of cage culture, which couples the fish model, water quality model, and benthic model, assisting in maintaining satisfactory environmental conditions around fish farms [147]. The SMILE framework has developed a comprehensive carrying capacity model by coupling the Delft3D model with cultured species growth model (ShellSIM) and ecosystem models (EcoWin2000) to assess aquaculture stocks of shellfish over multi-year periods [149].
Yet some other models have been developed to assess the environmental impacts of cage mariculture on marine ecosystems, in which effluent discharge modules also have been incorporated to predict waste dispersion impacts. For example, the Integrated Coastal Zone Management (ICZM) tool has been established by coupling a three-level nested hydrodynamic model, particle tracking module and GIS model to assist in locating new facilities and monitoring stations [151]. The site-specific multimedia fate model has also been developed and used to assess the environmental risk of chemical waste (e.g., antibiotics) as well as the spatial distribution of chemical concentration in the water column [153].
Generally, state-of-the-art water quality models have been applied to simulate the near-field impact of effluent wastes on water column and benthic sediment around fish farms, as well as far-field impact on local or regional marine system. In addition to the modelling of dissolved waste transport, some models are also integrated with a particle tracking module, to predict the transport of particulate waste. However, modeling of the nutrients such as carbon and phosphorus cycle is still lacking, as well a proper consideration of food web effects through incorporation of essential trophic levels such as phytoplankton. At the same time, the applications of far-field models are still subject to high computational cost and instability issues, and are less adaptive to discharge management and regulatory compliance. Finally, an efficient and effective coupling of near- and far-field models poses another prominent challenge as for other marine wastewater discharge modelling practices.

8. Conclusions & Recommendations

Effluent discharges from mariculture sites, especially cage cultures, are mainly composed of organic matter, nutrients, and chemicals from the uneaten feed, feces, and excretions, which may pose negative effects on the marine environment and ecosystems. In this study, we have reviewed the characteristics of effluents, their transport and transformation processes, as well as the associated environmental impacts on the water column and seabed sediments. Second, we have compared the relevant environmental standards of mariculture effluent including the concept of regulatory mixing zone from major mariculture countries. The monitoring techniques and water quality models most widely applied to assess the environmental impacts of mariculture effluents on near- or far-fields have also been reviewed to identify the state-of-the-art techniques and need for further development. It is found that the waste loading fluxes and transport processes of effluent depends primarily on feeding activities, stocking capacity, and environment conditions. The objective of the regulatory mixing zone is to minimize the environmental impacts of effluent through dilution and mixing. Emission limit values and environmental quality standards are established in many countries to regulate the discharged effluent quality. In addition, regular monitoring is also required to assess whether actual farming activities meet the required standards. Considerable variability has been found in the effluent parameters and the respective critical contaminant concentrations prescribed from different countries, which need to be thoroughly reviewed in the future.
Many of the main countries involved in mariculture activities, such as China, currently lag behind in the management and regulation of effluents (e.g., specific regulations are lacking in the location, size, and environmental standards of mixing zones) compared to Western Countries, which therefore needs to be addressed to promote sustainable development within the mariculture industry. Several water quality models have been developed in the past decades as cost-effective tools to study and predict transport and transformation processes of mariculture effluents and the related environmental impacts as well as, ultimately, for mariculture regulation. However, a proper incorporation of the ecological impacts such as the food web effects as well as the effective coupling of near- and far-field models are some of the open challenges needed to be addressed. Whilst new models are continually emerging, regulatory authorities are increasingly turning to predictive models to make informed decisions regarding the licensing of new marine fish farms with their effluents discharged into receiving waters. As such, the need to evaluate and validate these predictive models remains imperative to ensure their appropriate use and application in the management of mariculture sites. Monitoring projects are also continuing to play a vital role in mariculture planning and management and can be optimized by combining with water quality models to enhance efficiency and effectiveness.
Overall, this paper is intended to provide a state-of-the-art review of characterization and management tools of mariculture effluents in order to push forward their regulatory management and, ultimately, to promote a sustainable mariculture development into the future.

Author Contributions

Conceptualization, D.S., C.G., and A.C.; literature survey and analysis, X.W., C.G., and D.S.; writing—original draft preparation, X.W.; writing—review and editing, D.S., C.G., and A.C.; graphics, X.W.; supervision, D.S. All authors have read and agreed to the published version of the manuscript.

Funding

This work was supported by the National Natural Science Foundation of China (Grant No. 51779012 and 51811530316), National Key Research and Development Program of China (Grant No. 2018YFC1406404) and Interdisciplinary Research Funds of Beijing Normal University.

Acknowledgments

The authors (DDS and AC) are grateful for financial support provided by the Royal Society through an International Exchange Cost Share [156] 2017 Grant (Grant No. IEC\NSFC\170104) that facilitated bilateral research visits between Beijing Normal University and the University of Dundee. Financial support for CG from the State Administration of Foreign Experts Affairs of China (Grant No. GDW20181100033) is also grateful acknowledged.

Conflicts of Interest

The authors declare no conflict of interest.

References

  1. Gentry, R.R.; Froehlich, H.E.; Grimm, D.; Kareiva, P.; Parke, M.; Rust, M.; Gaines, S.D.; Halpern, B.S. Mapping the global potential for marine aquaculture. Nat. Ecol. Evol. 2017, 1, 1317–1324. [Google Scholar] [CrossRef] [PubMed]
  2. Froehlich, H.E.; Gentry, R.R.; Halpern, B.S. Global change in marine aquaculture production potential under climate change. Nat. Ecol. Evol. 2018, 2, 1745–1750. [Google Scholar] [CrossRef] [PubMed]
  3. Clavelle, T.; Lester, S.E.; Gentry, R.; Froehlich, H.E. Interactions and management for the future of marine aquaculture and capture fisheries. Fish Fish. 2019, 20, 368–388. [Google Scholar] [CrossRef]
  4. Kluger, L.C.; Filgueira, R. Thinking outside the box: Embracing social complexity in aquaculture carrying capacity estimations. ICES J. Mar. Sci. 2020. [Google Scholar] [CrossRef]
  5. Bambaranda, B.V.A.S.M.; Tsusaka, T.W.; Chirapart, A.; Salin, K.R.; Sasaki, N. Capacity of Caulerpa lentillifera in the Removal of Fish Culture Effluent in a Recirculating Aquaculture System. Processes 2019, 7, 440. [Google Scholar] [CrossRef] [Green Version]
  6. Joesting, H.M.; Blaylock, R.; Biber, P.; Ray, A. The use of marine aquaculture solid waste for nursery production of the salt marsh plants Spartina alterniflora and Juncus roemerianus. Aquac. Rep. 2016, 3, 108–114. [Google Scholar] [CrossRef] [Green Version]
  7. Bannister, R.J.; Johnsen, I.A.; Hansen, P.K.; Kutti, T.; Asplin, L. Near- and far-field dispersal modelling of organic waste from Atlantic salmon aquaculture in fjord systems. ICES J. Mar. Sci. 2016, 73, 2408–2419. [Google Scholar] [CrossRef] [Green Version]
  8. Pusceddu, A.; Fraschetti, S.; Mirto, S.; Holmer, M.; Danovaro, R. Effects of intensive mariculture on sediment biochemistry. Ecol. Appl. 2007, 17, 1366–1378. [Google Scholar] [CrossRef]
  9. Carballeira, C.; Cebro, A.; Villares, R.; Carballeira, A. Assessing changes in the toxicity of effluents from intensive marine fish farms over time by using a battery of bioassays. Environ. Sci. Pollut. Res. 2018, 25, 12739–12748. [Google Scholar] [CrossRef]
  10. Department of Agriculture, Forestry and Fisheries. Environmental Integrity Framework for Marine; Enviro-Fish Africa (Pty.) Ltd.: Eastern Cape, South Africa, 2012. [Google Scholar]
  11. Primavera, J.H. Overcoming the impacts of aquaculture on the coastal zone. Ocean Coast. Manag. 2006, 49, 531–545. [Google Scholar] [CrossRef]
  12. Crab, R.; Avnimelech, Y.; Defoirdt, T.; Bossier, P.; Verstraete, W. Nitrogen removal techniques in aquaculture for a sustainable production. Aquaculture 2007, 270, 1–14. [Google Scholar] [CrossRef] [Green Version]
  13. Yucel-Gier, G.; Eronat, C.; Sayin, E. The Impact of Marine Aquaculture on the Environment; the Importance of Site Selection and Carrying Capacity. Agric. Sci. 2019, 10, 259–266. [Google Scholar] [CrossRef] [Green Version]
  14. Neori, A.; Shpigel, M.; Ben-Ezra, D. A sustainable integrated system for culture of fish, seaweed and abalone. Aquaculture 2000, 186, 279–291. [Google Scholar] [CrossRef]
  15. Ferreira, J.G.; Hawkins, A.J.; Monteiro, P.; Moore, H.; Edwards, A.; Goven, R.; Lourenco, P.; Mellor, A.; Nunes, J.P.; Ramos, L.; et al. SMILE Sustainable Mariculture in Northern Irish Lough Ecosystems; Department of Agriculture and Rural Development for Northern Ireland: Belfast, UK, 2007.
  16. Boyd, C.E.; D’Abramo, L.R.; Glencross, B.D.; Huyben, D.C.; Juarez, L.M.; Lockwood, G.S.; McNevin, A.A.; Tacon, A.G.J.; Teletchea, F.; Tomasso, J.R., Jr.; et al. Achieving sustainable aquaculture: Historical and current perspectives and future needs and challenges. J. World Aquac. Soc. 2020, 51, 578–633. [Google Scholar] [CrossRef]
  17. Zheng, W.; Shi, H.; Chen, S.; Zhu, M. Benefit and cost analysis of mariculture based on ecosystem services. Ecol. Econ. 2009, 68, 1626–1632. [Google Scholar] [CrossRef]
  18. Troell, M.; Joyce, A.; Chopin, T.; Neori, A.; Buschmann, A.H.; Fang, J.-G. Ecological engineering in aquaculture—Potential for integrated multi-trophic aquaculture (IMTA) in marine offshore systems. Aquaculture. 2009, 297, 1–9. [Google Scholar] [CrossRef]
  19. Barrington, K.; Chopin, T.; Robinson, S. Integrated Multi-Trophic Aquaculture (Imta) in Marine Temperate Waters; FAO Fisheries and Aquaculture Technical Paper; FAO: Rome, Italy, 2009; Volume 529, pp. 7–46. [Google Scholar]
  20. Ndiaye, N.A.; Maiguizo-Diagne, H.; Diadhiou, H.D.; Ndiaye, W.N.; Diedhiou, F.; Cournac, L.; Gaye, M.L.; Fall, S.; Brehmer, P. Methanogenic and fertilizing potential of aquaculture waste: Towards freshwater farms energy self-sufficiency in the framework of blue growth. Rev. Aquac. 2019, 12, 1435–1444. [Google Scholar] [CrossRef]
  21. Kapetsky, J.M.; Aguilar-Manjarrez, J.; Jenness, J. A Global Assessment of Offshore Mariculture Potential from a Spatial Perspective; FAO Fisheries and Aquaculture Technical Paper; FAO: Rome, Italy, 2013; Volume 549, p. I. [Google Scholar]
  22. Soe, M.; Nguyen, M.R.; Wattoo, S.A. Regional Review on Livelihood Opportunities Related to Mariculture Development; FAO Fisheries Proceedings; FAO: Rome, Italy, 2008. [Google Scholar]
  23. Aguilar-Manjarrez, J.; Lovatelli, A. Technical Workshop on Marine Cage Culture in the Islamic Republic of Iran; FAO Aquaculture Newsletter; FAO: Rome, Italy, 2017; Volume 56, p. 22. [Google Scholar]
  24. Price, C.; Black, K.D.; Hargrave, B.T.; Morris, J.A. Marine cage culture and the environment: Effects on water quality and primary production. Aquac. Environ. Interact. 2015, 6, 151–174. [Google Scholar] [CrossRef] [Green Version]
  25. Zhao, Y.; Zhang, J.; Liu, Y.; Sun, K.; Zhang, C.; Wu, W.; Teng, F. Numerical assessment of the environmental impacts of deep sea cage culture in the Yellow Sea, China. Sci. Total Environ. 2020, 706, 135752. [Google Scholar] [CrossRef]
  26. Qi, Z.; Shi, R.; Yu, Z.; Han, T.; Li, C.; Xu, S.; Xu, S.; Liang, Q.; Yu, W.; Lin, H. Nutrient release from fish cage aquaculture and mitigation strategies in Daya Bay, southern China. Mar. Pollut. Bull. 2019, 146, 399–407. [Google Scholar] [CrossRef]
  27. FAO. FAO Yearbook of Fishery and Aquaculture Statistics; FAO: Rome, Italy, 2019; pp. 22–29. [Google Scholar]
  28. Turcios, A.E.; Papenbrock, J. Sustainable treatment of aquaculture effluents—What can we learn from the past for the future? Sustainability 2014, 6, 836–856. [Google Scholar] [CrossRef] [Green Version]
  29. Silva, C.; Yanez, E.; Martin-Diaz, M.L.; Riba, I.; DelValls, T.A. Integrated ecotoxicological assessment of marine sediments affected by land-based marine fish farm effluents: Physicochemical, acute toxicity and benthic community analyses. Ecotoxicology 2013, 22, 996–1011. [Google Scholar] [CrossRef] [PubMed]
  30. Li, Q.; Zhang, Y.; Juck, D.; Fortin, N.; Greer, C.W. Impact of Intensive Land-Based Fish Culture in Qingdao, China, on the Bacterial Communities in Surrounding Marine Waters and Sediments. Evid. Based Complementary Altern. Med. 2011, 1–8. [Google Scholar] [CrossRef] [PubMed]
  31. Weston, D.P. Ecological effects of the use of chemicals in aquaculture. In Use of Chemicals in Aquaculture in Asia; Aquaculture Department, Southeast Asian Fisheries Development Center: Iloilo, Philippines, 1996. [Google Scholar]
  32. Rico, A.; Satapornvanit, K.; Haque, M.M.; Min, J.; Nguyen, P.T.; Telfer, T.C.; van den Brink, P.J. Use of chemicals and biological products in Asian aquaculture and their potential environmental risks: A critical review. Rev. Aquac. 2012, 4, 75–93. [Google Scholar] [CrossRef]
  33. Tornero, V.; Hanke, G. Chemical contaminants entering the marine environment from sea-based sources: A review with a focus on European seas. Mar. Pollut. Bull. 2016, 112, 17–38. [Google Scholar] [CrossRef] [PubMed]
  34. Amara, I.; Miled, W.; Ben Slama, R.; Ladhari, N. Antifouling processes and toxicity effects of antifouling paints on marine environment. A review. Environ. Toxicol. Pharmacol. 2018, 57, 115–130. [Google Scholar] [CrossRef] [PubMed]
  35. Cao, J.S.; Wang, C.; Fang, F.; Lin, J.X. Removal of heavy metal Cu(II) in simulated aquaculture wastewater by modified palygorskite. Environ. Pollut. 2016, 219, 924–931. [Google Scholar] [CrossRef] [PubMed]
  36. Squadrone, S.; Brizio, P.; Stella, C.; Prearo, M.; Pastorino, P.; Serracca, L.; Ercolini, C.; Abete, M.C. Presence of trace metals in aquaculture marine ecosystems of the northwestern Mediterranean Sea (Italy). Environ. Pollut. 2016, 215, 77–83. [Google Scholar] [CrossRef]
  37. Montojo, U.M.; Baldoza, B.J.S.; Perelonia, K.B.S.; Cambia, F.D.; Garcia, L.C. Estimation of Nutrient Load from Aquaculture Farms in Manila Bay, Philippines. Philipp. J. Fish. 2020, 27, 30–39. [Google Scholar] [CrossRef]
  38. Enduta, A.; Jusoh, A.; Ali, N.; Wan Nik, W.B. Nutrient removal from aquaculture wastewater by vegetable production in aquaponics recirculation system. Desalin. Water Treat. 2011, 32, 422–430. [Google Scholar] [CrossRef]
  39. Islam, M.S. Nitrogen and phosphorus budget in coastal and marine cage aquaculture and impacts of effluent loading on ecosystem: Review and analysis towards model development. Mar. Pollut. Bull. 2005, 50, 48–61. [Google Scholar] [CrossRef] [PubMed]
  40. Sara, G.; Lo Martire, M.; Sanfilippo, M.; Pulicano, G.; Cortese, G.; Mazzola, A.; Manganaro, A.; Pusceddu, A. Impacts of marine aquaculture at large spatial scales: Evidences from N and P catchment loading and phytoplankton biomass. Mar. Environ. Res. 2011, 71, 317–324. [Google Scholar] [CrossRef] [PubMed] [Green Version]
  41. Ahrendt, K.; Sterr, H.; Krost, P.; Windhorst, W.; Schultz, M. Potential, constrains and solutions for marine aquaculture in Kiel Bay & Fjord. J. Coast. Conserv. 2017, 22, 115–130. [Google Scholar]
  42. Cai, H.; Sun, Y. Management of marine cage aquaculture. Environmental carrying capacity method based on dry feed conversion rate. Environ. Sci. Pollut. Res. Int. 2007, 14, 463–469. [Google Scholar]
  43. Piedecausa, M.A.; Aguado-Giménez, F.; Cerezo-Valverde, J.; Hernández-Llorente, M.D.; García-García, B. Simulating the temporal pattern of waste production in farmed gilthead seabream (Sparus aurata), European seabass (Dicentrarchus labrax) and Atlantic bluefin tuna (Thunnus thynnus). Ecol. Model. 2010, 221, 634–640. [Google Scholar] [CrossRef]
  44. Goncalves Ferreira, C.S.; Nunes, B.A.; de Melo Henriques-Almeida, J.M.; Guilhermino, L. Acute toxicity of oxytetracycline and florfenicol to the microalgae Tetraselmis chuii and to the crustacean Artemia parthenogenetica. Ecotoxicol. Environ. Saf. 2007, 67, 452–458. [Google Scholar] [CrossRef]
  45. Durso, L.; Cook, K. Impacts of antibiotic use in agriculture: What are the benefits and risks? Curr. Opin. Microbiol. 2014, 19C, 37–44. [Google Scholar] [CrossRef]
  46. Kemp, W.M.; Testa, J.M.; Conley, D.J.; Gilbert, D.; Hagy, J.D. Temporal response of coastal hypoxia to nutrient loading and physical controls. Biogeosciences 2009, 6, 2985–3008. [Google Scholar] [CrossRef] [Green Version]
  47. Ballester-Moltó, M.; Sanchez-Jerez, P.; Aguado-Giménez, F. Consumption of particulate wastes derived from cage fish farming by aggregated wild fish. An experimental approach. Mar. Environ. Res. 2017, 130, 166–173. [Google Scholar]
  48. Martinez-Porchas, M.; Martinez-Cordova, L.R. World Aquaculture: Environmental Impacts and Troubleshooting Alternatives. Sci. World J. 2012, 1–9. [Google Scholar] [CrossRef] [Green Version]
  49. Fabi, G.; Manoukian, S.; Spagnolo, A. Impact of an open-sea suspended mussel culture on macrobenthic community (Western Adriatic Sea). Aquaculture 2009, 289, 54–63. [Google Scholar] [CrossRef]
  50. Zhang, W.; Liu, X.; Cheng, H.; Zeng, E.Y.; Hu, Y. Heavy metal pollution in sediments of a typical mariculture zone in South China. Mar. Pollut. Bull. 2012, 64, 712–720. [Google Scholar] [CrossRef] [PubMed]
  51. Parsaian, M.; Shokri, M.R.; Pazooki, J. The response of benthic foraminifera to aquaculture and industrial pollution: A case study from the Northern Persian Gulf. Mar. Pollut. Bull. 2018, 135, 682–693. [Google Scholar] [CrossRef] [PubMed]
  52. Han, Q.; Zhao, S.; Zhang, X.; Wang, X.; Song, C.; Wang, S. Distribution, combined pollution and risk assessment of antibiotics in typical marine aquaculture farms surrounding the Yellow Sea, North China. Environ. Int. 2020, 138, 105551. [Google Scholar] [CrossRef] [PubMed]
  53. Liu, S.; Zhao, H.; Lehmler, H.-J.; Cai, X.; Chen, J. Antibiotic Pollution in Marine Food Webs in Laizhou Bay, North China: Trophodynamics and Human Exposure Implication. Environ. Sci. Technol. 2017, 51, 2392–2400. [Google Scholar] [CrossRef]
  54. Fischer, H.B.; List, E.J.; Koh, R.C.Y.; Imberger, J.; Brook, N.H. Mixing in Inland and Coastal Waters; Academic Press: New York, NY, USA, 1979; p. 484. [Google Scholar]
  55. Klebert, P.; Lader, P.; Gansel, L.; Oppedal, F. Hydrodynamic interactions on net panel and aquaculture fish cages: A review. Ocean Eng. 2013, 58, 260–274. [Google Scholar] [CrossRef]
  56. Fernandez-Jover, D.; Sanchez-Jerez, P.; Bayle-Sempere, J.; Carratala, A.; Leon, V.M. Addition of dissolved nitrogen and dissolved organic carbon from wild fish faeces and food around Mediterranean fish farms: Implications for waste-dispersal models. J. Exp. Mar. Biol. Ecol. 2007, 340, 160–168. [Google Scholar] [CrossRef]
  57. Venayagamoorthy, S.K.; Ku, H.; Fringer, O.B.; Chiu, A.; Naylor, R.L.; Koseff, J.R. Numerical modeling of aquaculture dissolved waste transport in a coastal embayment. Environ. Fluid Mech. 2011, 11, 329–352. [Google Scholar] [CrossRef]
  58. Yeo, S.E.; Binkowski, F.P.; Morris, J.E. Aquaculture Effluents and Waste By-Products Characteristics, Potential Recovery, and Beneficial Reuse; NCRAC Technical Bulletin no. 6; North Central Regional Aquaculture Center, Iowa State University: Ames, IA, USA, 2004. [Google Scholar]
  59. Matta, E.; Selge, F.; Gunkel, G.; Rossiter, K.; Jourieh, A.; Hinkelmann, R. Simulations of nutrient emissions from a net cage aquaculture system in a Brazilian bay. Water Sci. Technol. 2016, 73, 2430–2435. [Google Scholar] [CrossRef] [Green Version]
  60. Perez, O.; Almansa, E.; Riera, R.; Rodriguez, M.; Ramos, E.; Costa, J.; Monterros, O. Food and faeces settling velocities of meagre (Argyrosomus regius) and its application for modelling waste dispersion from sea cage aquaculture. Aquaculture 2014, 420, 171–179. [Google Scholar] [CrossRef]
  61. Merino, G.E.; Piedrahita, R.H.; Conklin, D.E. Settling characteristics of solids settled in a recirculating system for California halibut (Paralichthys californicus) culture. Aquac. Eng. 2007, 37, 79–88. [Google Scholar] [CrossRef]
  62. Chen, Y.S.; Beveridge, M.C.M.; Telfer, T.C. Settling rate characteristics and nutrient content of the faeces of Atlantic salmon, Salmo salar L., and the implications for modelling of solid waste dispersion. Aquac. Res. 1999, 30, 395–398. [Google Scholar] [CrossRef]
  63. Masaló, I.; Guadayol, Ò.; Peters, F.; Oca, J. Analysis of sedimentation and resuspension processes of aquaculture biosolids using an oscillating grid. Aquac. Eng. 2008, 38, 135–144. [Google Scholar] [CrossRef]
  64. Reid, G.K.; Liutkus, M.; Robinson, S.M.C.; Chopin, T.R.; Blair, T.; Lander, T.; Mullen, J.; Page, F.; Moccia, R.D. A review of the biophysical properties of salmonid faeces: Implications for aquaculture waste dispersal models and integrated multi-trophic aquaculture. Aquac. Res. 2009, 40, 257–273. [Google Scholar] [CrossRef]
  65. Neofitou, N.; Papadimitriou, K.; Domenikiotis, C.; Tziantziou, L.; Panagiotaki, P. GIS in environmental monitoring and assessment of fish farming impacts on nutrients of Pagasitikos Gulf, Eastern Mediterranean. Aquaculture 2019, 501, 62–75. [Google Scholar] [CrossRef]
  66. Cullen-Unsworth, L.C.; Nordlund, L.M.; Paddock, J.; Baker, S.; McKenzie, L.J.; Unsworth, R.K.F. Seagrass meadows globally as a coupled social-ecological system: Implications for human wellbeing. Mar. Pollut. Bull. 2014, 83, 387–397. [Google Scholar] [CrossRef]
  67. Kendrick, G.A.; Pomeroy, A.W.; Orth, R.J.; Cambridge, M.L.; Shaw, J.; Kotula, L.; Lowe, R.J. A novel adaptation facilitates seed establishment under marine turbulent flows. Sci. Rep. 2019, 9, 1–8. [Google Scholar] [CrossRef]
  68. Belias, C.; Dassenakis, M.; Scoullos, M. Study of the N, P and Si fluxes between fish farm sediment and seawater. Results of simulation experiments employing a benthic chamber under various redox conditions. Mar. Chem. 2007, 103, 266–275. [Google Scholar] [CrossRef]
  69. Pupulawaththa, A.W. Disintegration and Degradation of Fish Feed Pellets and Feces under Aerobic Marine Conditions. Master’s Thesis, Universitetet i Sørøst-Norge, Buskerud, Norway, 2018. [Google Scholar]
  70. Piedrahita, R.H. Reducing the potential environmental impact of tank aquaculture effluents through intensification and recirculation. Aquaculture 2003, 226, 35–44. [Google Scholar] [CrossRef]
  71. Ali, A.; Thiem, O.; Berntsen, J. Numerical modelling of organic waste dispersion from fjord located fish farms. Ocean Dyn. 2011, 61, 977–989. [Google Scholar] [CrossRef] [Green Version]
  72. Sara, G.; Scilipoti, D.; Milazzo, M.; Modica, A. Use of stable isotopes to investigate dispersal of waste from fish farms as a function of hydrodynamics. Mar. Ecol. Prog. Ser. 2006, 313, 261–270. [Google Scholar] [CrossRef] [Green Version]
  73. Maa, P.Y.; Kwon, J.I.; Hwang, K.N.; Ha, H.K. Critical Bed-Shear Stress for Cohesive Sediment Deposition under Steady Flows. J. Hydraul. Eng. 2008, 134, 1767–1771. [Google Scholar] [CrossRef] [Green Version]
  74. Bombardelli, F.A.; Moreno, P.A. Exchange at the bed sediments-water column interface. In Fluid Mechanics of Environmental Interfaces, 2nd ed.; Gualtieri, C., Mihailovic, D.T., Eds.; CRC Press/Balkema: Leiden, The Netherlands, 2012; pp. 221–253. [Google Scholar]
  75. Carvajalino-Fernández, M.A.; Keeley, N.B.; Fer, I.; Law, B.A.; Bannister, R.J. Effect of substrate type and pellet age on the resuspension of Atlantic salmon faecal material. Aquac. Environ. Interact. 2020, 12, 117–129. [Google Scholar] [CrossRef] [Green Version]
  76. Cromey, C.J.; Nickell, T.D.; Black, K.D.; Provost, P.G.; Griffiths, C.R. Validation of a fish farm waste resuspension model by use of a particulate tracer discharged from a point source in a coastal environment. Estuaries 2002, 25, 916–929. [Google Scholar] [CrossRef]
  77. Wu, Y.; Chaffey, J.; Law, B.; Greenberg, D.A.; Drozdowski, A.; Page, F.; Haigh, S. A three-dimensional hydrodynamic model for aquaculture: A case study in the Bay of Fundy. Aquac. Environ. Interact. 2014, 5, 235–248. [Google Scholar] [CrossRef] [Green Version]
  78. Chapra, S.C. Surface Water-Quality Modeling; McGraw-Hill: New York, NY, USA, 1997; p. 846. [Google Scholar]
  79. Gualtieri, C. Sediments burial velocity estimation in Venice Lagoon. In Proceedings of the XXVIII IAHR Congress, Graz, Austria, 22–27 August 1999; pp. 22–27. [Google Scholar]
  80. Iversen, N.; JøRgensen, B.B. Diffusion coefficients of sulfate and methane in marine sediments: Influence of porosity. Geochim. Et Cosmochim. Acta 1993, 57, 571–578. [Google Scholar] [CrossRef]
  81. Ben Brahim, M.; Mabrouk, L.; Hamza, A.; Mahfoudhi, M.; Bouain, A.; Aleya, L. Spatial scale variability in shoot density and epiphytic leaves of Posidonia oceanica on Kerkennah Island (Tunisia) in relation to current tide effects. Mar. Ecol. Evol. Perspect. 2015, 36, 1311–1331. [Google Scholar] [CrossRef]
  82. EU Commission. Water Environmental Quality Standards; EU: Brussels, Belgium, 2007; Volume 16. [Google Scholar]
  83. Bleninger, T.; Jirka, G.H. Mixing zone regulation for effluent discharges into EU waters. In Proceedings of the Institution of Civil Engineers-Water Management; Thomas Telford Ltd.: London, UK, May 2011; Volume 164, pp. 387–396. [Google Scholar]
  84. SEPA. Potection of the Marine Environment; Scottish Environment Protection Agency: Stirling, UK, 2019. [Google Scholar]
  85. Mugg, J.; Serrano, A.; Liberti, A.; Rice, M.A. Aquaculture effluents: A Guide for Water Quality Regulators and Aquaculturists; No. 00-003; NRAC Publication, University of Massachusetts Dartmouth: North Dartmouth, MA, USA, 2007. [Google Scholar]
  86. USEPA. Water Quality Standards Handbook Chapter 5: General Policies; USEPA: Washington, DC, USA, 2014.
  87. Queenland. Licensing Wastewater Releases from Existing Marine Prawn Farms in Queensland; Operational Policy-Marine Prawn Aquaculture; Department of Environment and Science: Queenland, MD, USA, 2015.
  88. Department of Agriculture. Permits and Regulatory Requirements for Aquaculture in Hawaii; Aquaculture Planning & Advocacy: Kaneohe, HI, USA, 2011. [Google Scholar]
  89. Cooke, J.; Milne, P.; Rutherford, K. A Review of Definitions of “Mixing Zones” and “Reasonable Mixing” in Receiving Waters; A report prepared for Auckland Regional Council. Auckland Regional Council Technical Report 2010/045, August 2010, ISSN 1179-0512 (Online); Auckland Regional Council: Auckland, New Zealand, 2010; ISBN 978-1-927135-01. [Google Scholar]
  90. Wilson, A.; Magill, S.; Black, K.D. Review of Environmental Impact Assessment and Monitoring in Salmon Aquaculture; FAO Fisheries and Aquaculture Technical Paper; FAO: Rome, Italy, 2009; Volume 527, pp. 455–535. [Google Scholar]
  91. ANZECC. Australia and New Zealand Environment Council Guidelines for Fresh and Marine Water Quality; ANZECC: Artarmon, Australia, 2000; Volume 2. [Google Scholar]
  92. Li, X.; Li, J.; Wang, Y.; Fu, L.; Fu, Y.; Li, B.; Jiao, B. Aquaculture Industry in China: Current State, Challenges, and Outlook. Rev. Fish. Sci. 2011, 19, 187–200. [Google Scholar] [CrossRef]
  93. Yu, J.; Yin, W.; Liu, D. Evolution of mariculture policies in China: Experience and challenge. Mar. Policy 2020, 119, 104062. [Google Scholar] [CrossRef]
  94. Nixon, R.M. Federal Water Pollution Control Act (FWPC); USEPA: Washington, DC, USA, 1972.
  95. Ministry of Agriculture and Rural Affairs of the People’s Republic of China. Marine Aquaculture Water Discharge Requirements; Ministry of Agriculture and Rural Affairs of the People’s Republic of China: Beijing, China, 2007.
  96. Holen, S.M.; Yang, X.; Utne, I.B.; Haugen, S. Major accidents in Norwegian fish farming. Saf. Sci. 2019, 120, 32–43. [Google Scholar] [CrossRef]
  97. Singer, A.; Schuckel, U.; Beck, M.; Bleich, O.; Brumsack, H.J.; Freund, H.; Geimecke, C.; Lettmann, K.A.; Millat, G.; Staneva, J.; et al. Small-scale benthos distribution modelling in a North Sea tidal basin in response to climatic and environmental changes (1970s-2009). Mar. Ecol. Prog. Ser. 2016, 551, 13–30. [Google Scholar] [CrossRef] [Green Version]
  98. Bostock, J.; McAndrew, B.; Richards, R.; Jauncey, K.; Telfer, T.; Lorenzen, K.; Little, D.; Ross, L.; Handisyde, N.; Gatward, I.; et al. Aquaculture: Global status and trends. Philos. Trans. R. Soc. B Biol. Sci. 2010, 365, 2897–2912. [Google Scholar] [CrossRef] [PubMed]
  99. Ferreira, N.C.; Bonetti, C.; Seiffert, W.Q. Hydrological and Water Quality Indices as management tools in marine shrimp culture. Aquaculture 2011, 318, 425–433. [Google Scholar] [CrossRef]
  100. EPA. Aquaculture Management and the Environment Protection (Water Quality) Policy; EPA: Adelaide, Australia, 2005.
  101. Environment Agency of UK. The Water Framework Directive (Standards and Classification) Directions (England and Wales); Environment Agency of UK: Bristol, UK, 2015.
  102. Ministry of Natural Resources of the People’s Republic of China. Marine Water Quality Standard; Ministry of Natural Resources of the People’s Republic of China: Beijing, China, 1997.
  103. Department of Agriculture, Forestry and Fisheries. National Aquaculture Policy Framework in South Africa; Department of Agriculture, Forestry and Fisheries: Eastern Cape, South Africa, 2013.
  104. Fisheries & Aquaculture. South Australia Environment Protection (Water Quality) Policy; Fisheries & Aquaculture: Adelaide, Australia, 2003. [Google Scholar]
  105. USEPA. Water Quality Standards Handbook, 2nd ed.; USEPA: Washington, DC, USA, 1994.
  106. Dean, R.J.; Shimmield, T.M.; Black, K.D. Copper, zinc and cadmium in marine cage fish farm sediments: An extensive survey. Environ. Pollut. 2007, 145, 84–95. [Google Scholar] [CrossRef]
  107. DEP. Maine Pollutant Discharge Elimination Sysytem Permit Marine Waste Discharge License; Maine Department of Environmental Protection: Augusta, ME, USA, 2014.
  108. Maroni, K. Monitoring and regulation of marine aquaculture in Norway. J. Appl. Ichthyol. 2000, 16, 192–195. [Google Scholar] [CrossRef]
  109. Carroll, M.L.; Cochrane, S.; Fieler, R.; Velvin, R.; White, P. Organic enrichment of sediments from salmon farming in Norway: Environmental factors, management practices, and monitoring techniques. Aquaculture 2003, 226, 165–180. [Google Scholar] [CrossRef]
  110. Ottinger, M.; Clauss, K.; Kuenzer, C. Aquaculture: Relevance, distribution, impacts and spatial assessments—A review. Ocean Coast. Manag. 2016, 119, 244–266. [Google Scholar] [CrossRef]
  111. Hamoutene, D.; Salvo, F.; Bungay, T.; Mabrouk, G.; Couturier, C.; Ratsimandresy, A.; Dufour, S.C. Assessment of Finfish Aquaculture Effect on Newfoundland Epibenthic Communities through Video Monitoring. N. Am. J. Aquaculture 2015, 77, 117–127. [Google Scholar] [CrossRef]
  112. Ma, D.K.; Ding, Q.S.; Li, D.L.; Zhao, L.L. Wireless Sensor Network for Continuous Monitoring Water Quality in Aquaculture Farm. Sens. Lett. 2010, 8, 109–113. [Google Scholar] [CrossRef]
  113. Parra, L.; Lloret, G.; Lloret, J.; Rodilla, M. Physical sensors for precision aquaculture: A Review. IEEE Sens. J. 2018, 18, 3915–3923. [Google Scholar] [CrossRef] [Green Version]
  114. Harun, A.; Ndzi, D.L.; Ramli, M.F.; Shakaff, A.Y.M.; Ahmad, M.N.; Kamarudin, L.M.; Zakaria, A.; Yang, Y. Signal propagation in aquaculture environment for wireless sensor network applications. Prog. Electromagn. Res.-Pier 2012, 131, 477–494. [Google Scholar] [CrossRef] [Green Version]
  115. Yamazaki, H.; Aoyama, W.; Masunaga, E.; Tanaka, M. Observation of three-dimensional flow structures and effluent transport around fish cages using a towed ADCP and free-fall multi-parameter profiler. Aquac. Res. 2019, 50, 1107–1116. [Google Scholar] [CrossRef]
  116. White, C.A.; Woodcock, S.H.; Bannister, R.J.; Nichols, P.D. Terrestrial fatty acids as tracers of finfish aquaculture waste in the marine environment. Rev. Aquac. 2019, 11, 133–148. [Google Scholar] [CrossRef] [Green Version]
  117. Xie, B.; Huang, J.; Huang, C.; Wang, Y.; Shi, S.; Huang, L. Stable isotopic signatures (δ13C and δ15N) of suspended particulate organic matter as indicators for fish cage culture pollution in Sansha Bay, China. Aquaculture 2020, 522, 735081. [Google Scholar] [CrossRef]
  118. Woodcock, S.H.; Troedsson, C.; Strohmeier, T.; Balseiro, P.; Skaar, K.S.; Strand, Ø. Combining biochemical methods to trace organic effluent from fish farms. Aquac. Environ. Interact. 2017, 9, 429–443. [Google Scholar] [CrossRef]
  119. Howarth, L.M.; Filgueira, R.; Jiang, D.; Koepke, H.; Frame, M.K.; Buchwald, C.; Finnis, S.; Chopin, T.; Costanzo, S.D.; Grant, J. Using macroalgal bioindicators to map nutrient plumes from fish farms and other sources at a bay-wide scale. Aquac. Environ. Interact. 2019, 11, 671–684. [Google Scholar] [CrossRef] [Green Version]
  120. Stoeck, T.; Kochems, R.; Forster, D.; Lejzerowicz, F.; Pawlowski, J. Metabarcoding of benthic ciliate communities shows high potential for environmental monitoring in salmon aquaculture. Ecol. Indic. 2018, 85, 153–164. [Google Scholar] [CrossRef]
  121. Law, B.A.; Hill, P.S. Spatial and temporal variation in cumulative mass eroded and organic matter percentage in surface sediments near areas of active salmon aquaculture. Aquac. Environ. Interact. 2019, 11, 305–320. [Google Scholar] [CrossRef] [Green Version]
  122. Heerschap, M.E. User’s Manual for the Computer Program CUFUS: Quick Design Procedure for a CUt-Out in a FUSelage Version 1.0. Delft University of Technology, 1997. Available online: https://www.narcis.nl/publication/RecordID/oai:tudelft.nl:uuid:717630e4-194c-4d2a-b4d1-d7f3929b5608 (accessed on 14 July 2020).
  123. Dudley, R.W.; Panchang, V.G.; Newell, C.R. Application of a comprehensive modeling strategy for the management of net-pen aquaculture waste transport. Aquaculture. 2000, 187, 319–349. [Google Scholar] [CrossRef]
  124. SAMS. DEPOMOD Modelling Software. 2017. Available online: https://www.sams.ac.uk/science/projects/depomod/ (accessed on 16 July 2020).
  125. Cromey, C.J.; Nickell, T.D.; Black, K.D. DEPOMOD-modelling the deposition and biological effects of waste solids from marine cage farms. Aquaculture 2002, 214, 211–239. [Google Scholar] [CrossRef]
  126. Cromey, C.J.; Thetmeyer, H.; Lampadariou, N.; Black, K.D.; Kogeler, J.; Karakassis, I. MERAMOD: Predicting the deposition and benthic impact of aquaculture in the eastern Mediterranean Sea. Aquac. Environ. Interact. 2012, 2, 157–176. [Google Scholar] [CrossRef] [Green Version]
  127. Cromey, C.J.; Nickell, T.D.; Treasurer, J.; Black, K.D.; Inall, M. Modelling the impact of cod (Gadus morhua L.) farming in the marine environment—CODMOD. Aquaculture 2009, 289, 42–53. [Google Scholar] [CrossRef]
  128. Nickell, T.D.; Cromey, C.J.; Borja, Á.; Black, K.D. The benthic impacts of a large cod farm—Are there indicators for environmental sustainability? Aquaculture 2009, 295, 226–237. [Google Scholar] [CrossRef]
  129. Panchang, V.; Cheng, G.; Newell, C. Modeling hydrodynamics and aquaculture waste transport in coastal maine. Estuaries 1997, 20, 14–41. [Google Scholar] [CrossRef]
  130. Danish Hydraulic Institute. MIKE 21 Hydrodynamic Module Step-By-Step Training Guide; 2017; Available online: https://manuals.mikepoweredbydhi.help/2017/Coast_and_Sea/MIKE21_HD_Step_By_Step.pdf (accessed on 21 July 2020).
  131. Engø-Monsen, K. The Bergen Ocean Model Benchmark 1.0. University of Bergen, 2000. Available online: https://www.academia.edu/5474148/The_Bergen_Ocean_Model_Benchmark_1_0 (accessed on 21 July 2020).
  132. Ali, A.; Thiem, Ø.; Berntsen, J. Numerical simulation of flow and aquaculture organic waste dispersion in a curved channel. Ocean Dyn. 2013, 63, 1073–1082. [Google Scholar] [CrossRef]
  133. Sato, T.; Tonoki, K.; Yoshikawa, T.; Tsuchiya, Y. Numerical and hydraulic simulations of the effect of Density Current Generator in a semi-enclosed tidal bay. Coast. Eng. 2006, 53, 49–64. [Google Scholar] [CrossRef]
  134. Zhang, J.; Kitazawa, D. Numerical analysis of particulate organic waste diffusion in an aquaculture area of Gokasho Bay, Japan. Mar. Pollut. Bull. 2015, 93, 130–143. [Google Scholar] [CrossRef]
  135. Open TELEMAC-MASCARET. User Manual Telemac-3d. 2020. Available online: http://wiki.opentelemac.org/doku.php?id=user_manual_telemac-3d (accessed on 27 July 2020).
  136. MARETEC. MOHID Water Modelling System. 2018. Available online: http://mohid.com/pages/home/whatismohid.shtml (accessed on 27 July 2020).
  137. Moreno Navas, J.; Telfer, T.C.; Ross, L.G. Application of 3D hydrodynamic and particle tracking models for better environmental management of finfish culture. Cont. Shelf Res. 2011, 31, 675–684. [Google Scholar] [CrossRef]
  138. Deltares. Delft3D Open Source Community. 2015. Available online: https://oss.deltares.nl/web/delft3d (accessed on 27 July 2020).
  139. Windupranata, W.; Mayerle, R. Decision support system for selection of suitable mariculture site in the western part of Java Sea, Indonesia. J. Eng. Technol. Sci. 2009, 41, 77–96. [Google Scholar] [CrossRef] [Green Version]
  140. Doglioli, A.M. Lagrangian Assessment for Marine Pollution 3D Model. 2004. Available online: https://people.mio.osupytheas.fr/~doglioli/ (accessed on 28 July 2020).
  141. Mestres, M.; Chaperon, W.; Pau Sierra, J. Modeling the benthic loading of particulate wastes from a gilthead seabream (Sparus aurata) farm during a complete rearing cycle. Cienc. Mar. 2016, 42, 179–194. [Google Scholar] [CrossRef] [Green Version]
  142. Liu, C.H.; Beardsley, R.C. An unstructured, finite-volume, three-dimensional, primitive equation ocean model: Application to coastal ocean and estuaries. J. Atmos. Ocean. Technol. 2003, 20, 159–186. [Google Scholar]
  143. Zhao, Y.; Zhang, J.; Wu, W.; Teng, F.; Kelly, R.M.; Sun, K.; Liu, Y.; Qu, D.; Liu, Y.; Zhu, Y. Assessing environmental carrying capacity of sea cage culture in the Yellow Sea, China, using a coupled diffusion model. Aquaculture 2020, 520, 735009. [Google Scholar] [CrossRef]
  144. Shchepetkin, A.F.; Mcwilliams, J.C. The regional oceanic modeling system (ROMS): A split-explicit, free-surface, topography-following-coordinate oceanic model. Ocean Model. 2005, 9, 347–404. [Google Scholar] [CrossRef]
  145. Fringer, O.B.; Gerritsen, M.; Street, R.L. An unstructured-grid, finite-volume, nonhydrostatic, parallel coastal ocean simulator. Ocean Model. 2006, 14, 139–173. [Google Scholar] [CrossRef]
  146. Ervik, A.; Hansen, P.K.; Aure, J.; Stigebrandt, A.; Johannessen, P.; Jahnsen, T. Regulating the local environmental impact of intensive marine fish farming I. The concept of the MOM system (Modelling-Ongrowing fish farms-Monitoring). Aquaculture 1997, 194, 75–92. [Google Scholar] [CrossRef]
  147. Zhang, J.; Ren, L.; Wu, T.; Zhang, M.; Wang, W.; Fang, J. Assessment of the local environmental impact of abalone suspended long-line culture—Application of the MOM system in Sungo Bay. Fish. Mod. 2011, 38, 1–6. [Google Scholar]
  148. Hawkins, A.; Duarte, P.; Fang, J.; Pascoe, P.; Zhu, M. A functional model of responsive suspension-feeding and growth in bivalve shellfish, configured and validated for the scallop Chlamys farreri during culture in China. J. Exp. Mar. Biol. Ecol. 2002, 281, 13–40. [Google Scholar] [CrossRef]
  149. Ferreira, J.G.; Hawkins, A.J.S.; Monteiro, P.; Moore, H.; Service, M.; Pascoe, P.L.; Ramos, L.; Sequeira, A. Integrated assessment of ecosystem-scale carrying capacity in shellfish growing areas. Aquaculture 2008, 275, 138–151. [Google Scholar] [CrossRef]
  150. Turner, R.K. Integrating natural and socio-economic science in coastal management. J. Mar. Syst. 2000, 25, 447–460. [Google Scholar] [CrossRef]
  151. Tironi, A.; Marin, V.H.; Campuzano, F.J. A management tool for assessing aquaculture environmental impacts in Chilean Patagonian Fjords: Integrating hydrodynamic and pellets dispersion models. Environ. Manag. 2010, 45, 953–962. [Google Scholar] [CrossRef]
  152. Choi, K.W.; Lee, J.H.W. Distributed entrainment sink approach for modeling mixing and transport in the intermediate field. J. Hydraul. Eng. 2007, 134, 804–815. [Google Scholar] [CrossRef]
  153. Kim, W.; Lee, Y.; Kim, S.D. Developing and applying a site-specific multimedia fate model to address ecological risk of oxytetracycline discharged with aquaculture effluent in coastal waters off Jangheung, Korea. Ecotoxicol. Environ. Saf. 2017, 145, 221–226. [Google Scholar] [CrossRef] [PubMed]
  154. Symonds, A.M. A comparison between far-field and near-field dispersion modelling of fish farm particulate wastes. Aquac. Res. 2011, 42, 73–85. [Google Scholar] [CrossRef]
  155. Weitzman, J.; Filgueira, R. The evolution and application of carrying capacity in aquaculture: Towards a research agenda. Rev. Aquac. 2019, 12, 1297–1322. [Google Scholar] [CrossRef]
  156. The People’s Republic of China Ministry of Agriculture. China Fisheries Yearbook; The People’s Republic of China Ministry of Agriculture: Beijing, China, 2019.
Figure 1. Types of typical mariculture systems: (a) marine suspended culture for aquatic plants; (b) marine cage culture; (c) marine pond culture; (d) marine poles, ropes, and net bags culture for mollusks; (e) the proportion of yield in typical mariculture systems (Food and Agriculture Organization of the United Nations, FAO, 2019 [27]).
Water 12 02991 g001
Figure 2. Schematic diagram of mariculture effluent discharge.
Water 12 02991 g002
Figure 3. Schematic diagram of mariculture effluent transport and transformation processes.
Water 12 02991 g003
Figure 4. Schematic diagram of the regulatory mixing zone (adapted from Scottish Environment Protection Agency, SEPA [84]).
Water 12 02991 g004
Table 1. List of composition and main source of mariculture effluent in cage system.
Composition Main Source
Organic matter and nutrientsOrganic carbonUneaten feed, feces
UreaExcretion
Uric acidExcretion
Nitrogen (N) Uneaten feed, feces
Phosphorus (P)Uneaten feed, feces
ChemicalsAntibioticUneaten feed, feces, and biliary excretion
PesticideUneaten feed, feces, and biliary excretion
ParasiticidesUneaten feed, feces, biliary excretion, and water column (bath)
AlgaecideWater column (bath)
DisinfectantWater column (bath)
HormoneUneaten feed, feces, and biliary excretion
ZincFeed, algaecides and pesticides
CopperAntifoulant paints, algaecides, and pesticides
LeadAntifoulant paints
Table 2. List of the key characteristics of regulatory mixing zones (RMZs) in different countries and regions.
Country/Region LocationSizeShape
EU (including Norway) The mixing zone should be adjacent to points of discharge and up to 25 m from the cages [83].The size should be as small as possible, without compromising the receiving water standards or significantly affecting aquatic life [83].N/A
UK (including Scotland)The mixing zone should lie within 100 m of the pens in all directions [84].The size of the mixing zone should not exceed the equivalent symmetrical area [84].The shape of the mixing zone does not have to be symmetrical [84]
USA and CanadaThe mixing zone should be 100 m from the point of discharge [86].The size should be as small as possible [86].The shape should be a simple configuration that is easy to locate in a body of water [86].
AustraliaThe mixing zone is set up at 200 m from the mean low water mark of the coast at spring tides [91].The size should not have a radius exceeding 100 m [91].N/A
New ZealandThe mixing zone is limited to 200 m downstream of the point of discharge [89].The size of the mixing zone will vary with the effluent flow, effluent concentration, background concentration, and bed characteristics [89]N/A
Table 3. List of abiotic and biotic parameters of emission limit values (ELVs) in different countries and regions.
Abiotic ParametersCritical ConcentrationCountryReference
Free residual chlorine<0.1 mg/LChina[95]
<13 μg/LUSA[86]
Dissolved oxygen4–6 mg/LCanada[99]
>6 mg/LChina, Australia[95,100]
>5.7 mg/LUK[101]
Turbidity<10 mg/LAustralia[100]
<12 mg/LUK[101]
Chemical oxygen demand≤10 mg/LChina[95]
Biochemical oxygen demand≤6 mg/LChina[95]
<10 mg/LAustralia[100]
pH6.5–9.0Australia[100]
6.5–8.5USA[86]
6.0–9.0Canada[99]
7.0–8.5China[95]
Seawater temperaturethe optimum temperature for shrimp is 27 °CCanada[99]
Total suspended solids<100 mg/LCanada[99]
<40 mg/LChina[95]
Total nitrogen<3 mg/LAustralia[87]
Total phosphorus<0.5 mg/LAustralia[100]
Ammonia<2 mg/LCanada[99]
Nitrate<0.09 mg/LCanada[99]
Total organic carbon<10 mg/LAustralia[100]
CaCO3>100 mg/LCanada[99]
Sulfide<0.002 mg/LAustralia[100]
Copper<4.8 μg/LUSA[86]
<5 μg/LChina[95]
<3.76 μg/LUK[101]
Zinc<90 μg/LUSA[86]
<20 μg/LChina[95]
<5 μg/LAustralia[100]
<6.8 μg/LUK[101]
Chromium<1100 μg/LUSA[86]
Nickel<74 μg/LUSA[86]
<100 μg/LAustralia[100]
Cadmium<40 μg/LUSA[86]
Lead<210 μg/LUSA[86]
Mercury<0.05 μg/LAustralia[100]
Biotic ParametersCriticalConcentrationCountryReference
Chlorophyll-a0.01 mg/LCanada[99]
Total marine bacteria1000 CFU/LCanada[99]
Table 4. List of water quality standards of regulatory mixing zone (receiving environment) in different countries and regions.
Country Standards of Water QualityReference
ChinaDissolved oxygen > 6 mg/L; Chemical oxygen demand ≤ 1 mg/L[102]
AustraliaConcentrations of suspended solids, total nitrogen, and total phosphorus must not exceed background concentrations (determined by administering authority) at a boundary of the regulatory mixing zone.[87]
USAPollutant concentrations are not lethal to organisms passing through the mixing zone.[86]
UKConcentrations of organic waste outside of the mixing zone are low enough to avoid adverse impacts on the status of sea life.[84]
South AfricaDissolved oxygen ≥ 60%.[10]
Table 5. List of sediment quality standards of regulatory mixing zone (receiving environment) in different countries and regions.
Country Standards of Sediment QualityReference
USASulfide ≤ 1500 μM; the Shannon–Wiener diversity index of benthic < 0.5 and percent Capitella capitate of benthic > 25%.[107]
UKZinc ≤ 410 μg/g, copper ≤ 270 μg/g, indicating benthic impacts that are “probably adverse”, and Zinc ≤ 270 μg/g, copper ≤ 108 μg/g represent benthic impacts that are “potentially problematic”.[106]
NorwayTotal organic carbon ≤ 20 mg/g.[108]
South AfricaFaunal benthic composition, electroconductibility, sediment carbon content.[10]
Table 6. List of models used in the management of mariculture effluents.
ModelSimulated Systems/DimensionalityModel StructureSimulated Processes Applications
Near-Field Model
DUCHESS [122]
  • water column
  • 2-dimensional
hydrodynamics model coupled with particle tracking modelparticle waste transport processaquaculture particle waste transport tracking [123]
NewDEPOMOD [124]water column and seabed sedimentparticle tracking model
integration with regional hydrodynamic models (e.g., FVCOM)
deposition of waste to the seabedused in the site selection of a new farm to investigate the proposed farm position and biomass levels [125]
MERAMOD [126]water column and seabed sedimentparticle tracking model coupled with benthic response modulesdeposition of waste to the seabedassess the benthic effects of particulate waste in Mediterranean area [13]
CODMOD [127]water column and seabed sedimentparticle tracking model coupled with cod-specific data.dispersion and resuspension process of waste feed and fecal particlesassess the benthic effects of cod farm [128]
Far-Field Model
Aquaculture waste transport simulator (AWAST) [129]
  • water column
  • 2-dimensional
flow model coupled with particle tracking modelphysical dispersion of finfish aquaculture wastessafeguard the long-term use of fish farm sites [123]
Mike21 [130]
  • water column
  • 2-dimensional
MIKE21 HD,
MIKE21 AD, MIKE21 PT
  • spreading of dissolved matters
  • transport and dispersal of suspended feces
  • optimization of mariculture systems
  • environmental impact assessment of mariculture infrastructures [41]
Bergen Ocean Model [74,131]
  • water column and seabed sediment
  • 3-dimensional
hydrodynamic σ-coordinate model coupled with a Lagrangian particle tracking simulator dispersion and deposition process of particulate organic matter particulate organic matter dispersion and deposition simulation [132]
Marine Environmental Committee (MEC) ocean
model [133]
  • water column
  • 3-dimensional
coupled with submodules of fish cage drag and the diffusion of particulate organic waste.particle waste transport processprovide references for the time and location of IMTA systems [134]
TELEMAC-3D [135]
  • water column
  • 3-dimensional
hydrodynamics model coupled with particle tracking modeldispersion process of particle wastesassess the installation of new aquaculture systems [59]
MOHID [136]
  • water column
  • 3-dimensional
hydrodynamics model coupled with particle tracking modeldispersion process of particle wastessimulate the particles dispersion through Lagrangian tracers in the far-field [137]
Delft3D [138]
  • water column
  • 3-dimensional
hydrodynamics model coupled with particle tracking modeldispersion process of particle wastessimulate the waste dispersion in the offshore area and provide a reference for site selection [139]
LAMP3D [140]
  • water column
  • 3-dimensional
hydrodynamics model coupled with particle tracking modeltransport of dissolved nutrients, fecal particulates and uneaten feedsimulate the time-varying dispersion with different pollutants and/or with different conditions of release [141]
Finite-Volume Community Ocean Model (FVCOM) [142]
  • water column and seabed sediment
  • 3-dimensional
hydrodynamic model coupled with sediment transport modeltransport, deposition and resuspension of particulate wastespredict the far-field distribution and potential environmental effects of particulate waste [143]
Regional Ocean Modelling System (ROMS) [144]
  • water column and seabed sediment
  • 3-dimensional
hydrodynamic model coupled with particle tracking modeltransport, and deposition of particulate wastessimulate the time-varying impact on benthic sediment with changes in fish feeding behavior [141]
Coupled Near- and Far-Field Model
SUNTANS [145]
  • water column
  • 3-dimensional
two-dimensional shallow water equations together with the depth-averaged continuity equationmixing and transport process of waste under oscillatory flow conditionsassess the impact of aquaculture fish pens on coastal water quality in both near- and far- field
Ecological Carrying Capacity Assessment Model
Modelling ongrowing fish farms monitoring (MOM) [146]system-scalefish model, coupled with dispersion model and benthic model
  • release of particulate material from the farm
  • dispersion and deposition of organic waste
  • decomposition at the benthic boundary layer
provide references for the size of fish farms and the hydrodynamic and topographic conditions of the selected areas [147]
SMILE framework [148]system-scaleDelft3D model coupled with cultured species growth model (ShellSIM) and ecosystem models (EcoWin2000)interactions between environmental variables and aquaculture activities
  • estimate the carrying capacity in shellfish farms
  • tools for management in sustainable development of shellfish aquaculture [149]
Environmental Impact Assessment Model
Integrated Coastal Zone Management (ICZM) [150]system-scale3-level nested hydrodynamic model coupled with particle tracking module and GIS model dispersion and deposition of organic wasteThe model offers an
open source alternative to particulate waste modeling and
evaluation, contributing valuable information for local
decision makers in the process of locating new facilities
and monitoring stations.
Offers information for new farm and monitoring stations locating [151]
Site-specific multimedia fate model [152]system-scaleJETLAG model integrated into the fugacity modeltransport and transformation of chemicals assess the ecological risk of therapeutants from aquaculture effluent [153]
Publisher’s Note: MDPI stays neutral with regard to jurisdictional claims in published maps and institutional affiliations.

