Abstract
The Darcy–Buckingham (DB) law, critical to the prediction of unsaturated flow, is widely used but has rarely been experimentally tested, and therefore may not be adequate in certain conditions. Failure of this law would imply that the unsaturated hydraulic conductivity is not constant for a given water content, as assumed in nearly all subsurface flow models. This study aims to test the DB law on unsaturated porous rock, complementing the few previous tests, all done on soils. Two lithotypes of calcareous porous rocks were tested. The quasi-steady centrifuge method was used to measure the flux density for different centrifugal driving forces while maintaining essentially constant water content, as required. Any deviations from the direct proportionality of the measured flux and the applied force would indicate a violation of the DB law. Our results show that, for the tested rocks and conditions, no physical phenomena occurred to cause a failure of the DB law.
1. Introduction
Darcy’s law has been central to subsurface hydrology for well over a century [1]. Its application to flow in unsaturated media, made possible by essential concepts developed by Buckingham [2] and often referred to for this purpose as the Darcy–Buckingham (DB) law, is a principal foundation of the hydrology of soils and rock above the water table. Although it is routinely applied without question in hydrology, agriculture, soil mechanics, ecology, waste disposal, mining, and contaminant transport, it has been subjected to remarkably few rigorous tests. The possibility of serious deviations from the DB law is an open question [3], p. 236.
The defining principle of Darcy’s law in any form is a direct proportionality between the flux through a porous medium and the net force that drives it. The water flow thus can be expressed for a saturated medium by
or for an unsaturated medium by the DB law:
where q[L T−1] is the flux density, Ksat[L T−1] is the saturated hydraulic conductivity, ∇Φ is the net driving force, expressed here as the gradient of the total hydraulic potential, and K[L T−1] is the hydraulic conductivity at the given volumetric water content, θ. Both formulas state the direct proportionality with hydraulic conductivity as the proportionality constant. The basic experimental test of these laws is to measure the flux at multiple values of driving force, all other conditions remaining constant, and assess whether the resulting data represent direct proportionality.
The dominant driving forces for hydrologic purposes are normally gravity and pressure gradient. For unsaturated conditions, the relevant pressure is matric pressure, or matric potential, symbolized here as ψ[M L−1 T−2]. With these two components of driving force, the DB law in one dimension is:
where ρ[M L−3] is the water density, g[L T−2] is the gravitational acceleration, and z is the vertical distance, positive downward. The proportionality constant here is divided by ρg in order to use K with the usual L T−1 dimensions.
For the unsaturated case, two crucial differences from the saturated case are (1) K depends on water content and (2) driving force depends on matric potential, which relates hysteretically and nonlinearly to water content and therefore to K. These differences cause tremendous complications and difficulty, not only in the use of the DB law to predict unsaturated flow, but also in the testing of its validity.
1.1. Practical Consequences of DB Law Invalidity
There are serious, though seldom considered, consequences if the DB law does not adequately represent flux–force relations. Unlike saturated media, unsaturated media can experience an enormous range of driving force, from essentially zero to a magnitude far greater than the force of earth’s gravity. The linkage of matric potential and water content means that unsaturated soil goes through wide swings of driving force in the normal cycling of wetting and drying. The near-zero situation is very common, occurring for example wherever a soil profile is undergoing the late stages of approach to hydrostatic equilibrium. Strong driving forces are also common, as with the very strong matric potential gradients near a sharp wetting front. Variations between these extremes occur routinely as soils are exposed to alternating wetting and drying influences.
Since it is widely taken for granted, departures from the nonlinearity of flux and force would contribute error to calculations and predictions of subsurface water flow. A non-Darcian relationship would increase uncertainty, probably with a unidirectional bias that causes systematic errors, in any calculation of the soil water dynamics. This issue is also important for fundamental research and understanding in situations of strong or highly variable matric potential gradients, such as the physics of wetting fronts [4].
The hydraulic conductivity of pores depends on their geometry and changes with a change in the distribution of local friction drag on the pore walls [5]. This affects the intrapore fluid flow making the flow behavior nonlinear and leading to the failure of Darcy’s law. Fluid flow behavior modifications caused by different diverging–converging pore geometries bear important implications for addressing many critical issues including, for example, in natural settings, the flow and fate of nutrients and contaminants as mediated by microbes and biofilms [6,7].
Nonlinear multiphase flow, analogous to unsaturated flow, at full-aquifer scale in a broad range of geological formations, such as gravel, karstic or fractured aquifers, is widely addressed in the literature [8,9]. At large scale, Darcy’s law, and deviations from the law due to high-velocity flow, is important in the petroleum industry and reservoir engineering to control the efficiency of oil/gas production wells, and in the groundwater resources such as in the leaky aquifer assumed to obey a non-Darcian flow law [10,11,12,13,14,15,16]. The understanding of nonlinear liquid or gas flow behavior in porous media, such as rock, consolidated or unconsolidated material and packed-bed-reactors is a key factor in reservoir engineering applications [17,18,19,20] and chemical and technical industries [21].
1.2. Possible Causes of DB Law Failure
In a saturated medium, the proportionality of flux and force can fail due to several causes, such as:
- Inertial flow [22];
- Turbulent flow and roughness;
- Pore-scale heterogeneity [23,24];
- Multiphase flow [10,25];
- Compressibility or other non-Newtonian characteristics of the fluid.
For hydrologic applications with single-phase water flow in the Earth’s subsurface, the very slight deviations from Newtonian characteristics are negligible. Additionally, restricting the application to domains where the continuum formulation is valid, there remains the possibility of inertial or turbulent flow. Heterogeneity can cause a failure to meet REV (Representative Elementary Volume) criteria necessary for a continuum formulation [26].
Inertial effects of concern include: the loss of kinetic energy in the restriction and constrictions of the pores [22,27], bends in flow paths [28], change in the spatial distribution of kinetic energy within the pore–throat curvature and the structure of the medium [29]. These effects cause deviations from proportionality if they are significant in comparison to viscous effects. Adverse influence on the proportionality is recognized where the Reynolds number, Re, the ratio of inertial forces to viscous forces, exceeds a certain threshold, often taken to be approximately 1 [26,30,31,32]. Additionally, it is possible for flow in subsurface materials to be fast enough to cause turbulence [33,34], an even more disturbing influence on Darcy’s law. Turbulence occurs at Re values much greater than 1.
In an unsaturated medium, the possible problems are more numerous and complicated. In addition to those discussed above for saturated flow, there is the complex physics of unsaturated flow. Special flow modes may occur, meaning that the flow violates some of the standard assumptions of traditional unsaturated flow theory [35]. Special flow modes can result from various factors, including extreme nonlinearities, hysteresis, the influence of dynamic air–water (AW) interfaces, nonlaminar flow, and the dependence of driving force on the changeable distribution of wetness. Additionally, traditional theory assumes that capillarity determines (1) whether a pore is filled or not (pores being assumed to conduct only when filled), and (2) also the shape of AW interfaces. Special flow modes are especially likely in partially filled macropores [36] where gravity is the dominant driving force and capillarity does not determine the geometrical form of the liquid phase as it does in small pores. Special flow modes indicating violations include:
- Free-surface films [37,38];
- Pendular-ring flow [39,40];
- Straight or meandering rivulets whose confining capillary interfaces are not fixed in place [41,42,43];
- Wavy film flow [44];
- Sliding drops [45].
A general problem for special flow modes is that the AW interface, if not fixed in place and controlled by capillary forces, is free to move in response to changing flux or force, and causes a change in water-filled space thickness, hence a change of the pore’s conductance. The K of the unsaturated medium is determined by the size, shape, and especially thickness of the water-filled space within the pores [39,46].
In consolidated media, another factor is the presence of intergranular cement or other solid linkage between the grains. It rigidifies the medium and alters its pore structure. Pore shapes differ from those of media with unconsolidated grains, for example in reducing sharp corners that affect the AW interface geometry. Whether this makes a difference in adherence to the DB law is not known, but needs examination because all previous tests of the DB law have been for unconsolidated media.
An additional possible factor causing a violation of the DB law is the effect of a body force, such as centrifugal force, Fc, on the configuration of the AW interface. If the interface shape changes with a change in force, then the conductance of the water enclosed by that interface may change, even though the water content, θ, is unchanged. Without Fc, the surface tension, γ[M T-2] would dominate over gravitational force, Fg, and the AW interface would have an essentially hemispherical configuration. If Fc acts, the AW interface may tend to be flat and broad in its lower portion, thin and adherent to the pore wall in its upper portion (Figure 1). Such distortion may reduce the pore conductance, even at the same θ.
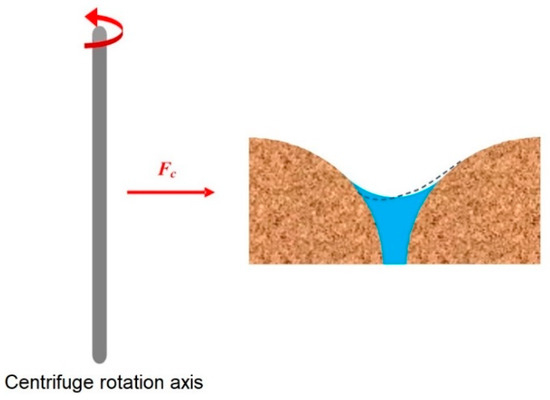
Figure 1.
Distortion of the air–water interface under the effect of the centrifugal force, Fc.
Moreover, it has been shown that the contact angle also changes with centrifugal acceleration and depends on drainage or imbibition and on the flow rate [47,48,49]. The alteration of either the contact angle or interface shape or dynamic effect of the matric potential [50] can change the conductance of the unsaturated pore without changing the amount of water within it, thus altering K in a violation of the DB law. This is a factor to be considered in a test using centrifugal force e.g., [51]. If results are not in accordance with the DB law, further analysis would be needed to evaluate causes. If results confirm the DB law, it indicates that this influence, along with the other possibilities, was not a problem.
1.3. Experimental Testing of The DB Law
The basis for a rigorous test of the DB law is to measure flux for different driving forces, with all other conditions remaining unchanged, and see if the relationship is a direct proportionality. The requirement is not only for linearity, but for a relationship whose linear extrapolation indicates zero flux for zero driving force.
Many experimental tests of Darcy’s law have been conducted for the saturated case, but very few for the unsaturated case. Childs and Collis-George [52] conducted the first test of the DB law on unsaturated sands for a given moisture content. Vachaud [53] used two different experimental tests, horizontal infiltration and a capillary rise test for checking the validity of the DB law and for obtaining capillary conductivity at various water contents on silt loam samples. Olson and Swartzendruber [54] showed the validity of the DB law by obtaining the general proportionality between the flow velocity and tension gradient for sand–silica–kaolinite and sand–silica samples. Nimmo et al. [51] verified the validity of the DB law by testing the proportionality between q and a centrifugal driving force for the same water content on unsaturated Oakley sand.
A major reason for the rarity of tests of the DB law is that they are very difficult because of the extreme complexities associated with unsaturation. Unsaturated K, water content, and matric potential (and consequently also driving force) are entangled in hysteretic and nonlinear relationships. In particular, two differences for unsaturated case are crucial, that K depends on water content, and that the driving force depends on the matric potential. Uniform, constant water content during unsaturated flow can only be achieved under certain circumstances [55]. A gradient of matric potential necessitates a gradient of water content and K. To achieve the necessary variations in driving force by varying the matric potential gradient violates the requirement of uniform, constant water content. A further difficulty is that the flow generated during the test moves water that can alter the water content, and hence also both the K and matric potential. Ruling out matric potential gradients as the variable driving force leaves the possibility of gravity, which cannot be easily changed in a lab on the surface of the earth. This difficulty is why Childs and Collis-George [52] conducted their test with columns tilted to various degrees, and Nimmo et al. [51] used an adjustable centrifugal force.
Any given experimental test does not demonstrate that the DB law is universally valid, but rather that it works adequately for the particular media and conditions tested. It is then reasonable to assume this law is adequate for different media of comparable character over a similar range of water contents, flow rates, and driving forces. Tests done so far are for soils and soil-like granular materials of sandy or finer texture, repacked manually into structurally-disturbed samples. Media and conditions within the earth’s unsaturated zone include many untested circumstances that may lead to a failure of the DB law, by some of the influences elaborated above.
The aim of this study was to test the DB law for certain important cases not yet tested. Specifically, these include consolidated porous media, bimodal pore-size distribution, and the presence of some pores that are larger than those of repacked sand. These conditions are applicable to water flow through coarse-textured sedimentary porous rocks, under unsaturated conditions, important to hydrologic processes such as recharge. The chief measurement technique is the quasi-steady centrifuge (QSC) method [56]. The QSC method is appropriate because it allows (i) a wide range of force, and (ii) measurements rapid enough to test many water contents, hydraulic conductivities and amounts of force in a reasonable time.
2. Materials and Methods
The samples tested in this study represent two different lithotypes of porous rock and come from distinct areas of the Apulia region, in southern Italy. Lithotype C was collected in a quarry district known as “Le Tufarelle” in Canosa di Puglia, lithotype M in a quarry district known as “Caprocetta” in Massafra. Both belong to a geologic formation known as the “Calcarenite di Gravina”, a marine origin carbonatic sedimentary rock, widespread in the Mediterranean basin, where it often constitutes a thick layer of the unsaturated zone. The Calcarenite di Gravina Formation (Pliocene–Early Pleistocene) belongs to the bradanic sedimentation cycle and consists of transgressive and deepening-upward deposits above the Mesozoic carbonate platform [57]. This rock consists of lithoclastic and/or bioclastic components bound by cement and soaked in a spatic matrix. Lithotypes C and M are coarse-grain grainstone and fine-grain packstone [58], respectively. Both C and M are characterized by a bimodal pore-size distribution testified by mercury intrusion porosimetry experiments (Figure 2). Specifically, C has some pores, related to bioclasts, larger than those surroundings. The thin sections were observed on a microscope giving an average particle diameter of 250 μm.
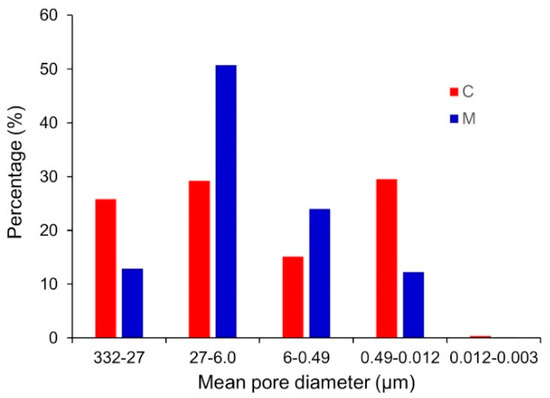
Figure 2.
Pore-size distributions for the lithotypes C and M, measured by the mercury intrusion porosimetry method.
Following the standard test procedure outlined in International Society for Rock Mechanics [59], the bulk properties were determined on fresh calcarenite samples and are shown in Table 1.

Table 1.
Bulk properties of the samples.
In the preparation procedures, the samples were trimmed with a standard rock saw to 6.1 cm in height and 7.8 cm in diameter. Procedures included saturation under high vacuum, after flooding the pores with carbon dioxide gas. Because the samples were of competent consolidated rock, they did not need an outside container for support. Because they were unsaturated during all measurement procedures, they did not need an outside container to retain water that would have seeped out the sides. Thus, no seal or retainer was necessary for the cylindrical surfaces, and none was used.
2.1. The Quasi-Steady Centrifuge Method
In order to have θ constant for testing the validity of the DB law, we used the QSC method [56]. The DB law in the centrifugal field and the relation to solve becomes:
where ρ[M L−3] is the water density, g[L T−2] is the gravitational acceleration, ψ[M L−1T−2] is the matric potential per unit volume (e.g., kPa), r[L] is the radial distance between the rotor axis and force measurement point, ω[T−1] is the angular speed. In head units, ρg (the weight of water per unit volume) equals dimensionless unity and ψ takes dimensions of length.
The QSC method was used to test the validity of the DB law in the centrifugal field and to measure the triplet of values K, θ and ψ in Equation (4). The QSC method uses an experimental apparatus inserted in the bucket of a floor-standing centrifuge [56] described in Appendix A.
The water flow rate through the sample was established by a layer of a specific granular material (cake) which is inside a flow-control reservoir that sits above the sample. Particle diameter distributions (Figure 3) of flow-control cakes were measured by laser diffraction, giving values ranging from 7 to 650 μm, as required for the purpose of this study. In order to achieve the measurements of K in a wide range of θ, inert, insoluble, non-cohesive, and physically stable flow-control cakes, different in particle size, were used.
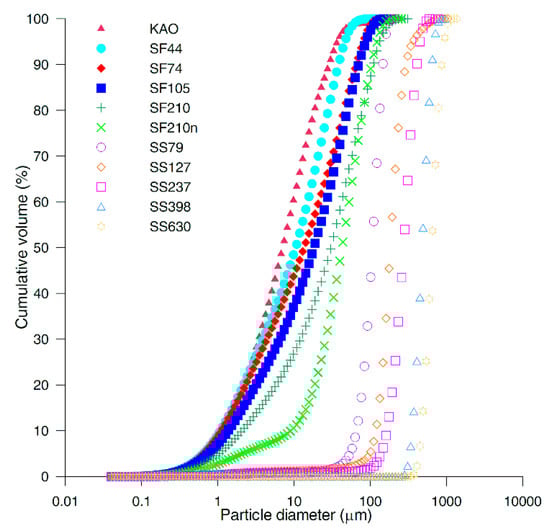
Figure 3.
Cumulative particle diameter distributions of the flow-control granular materials (cakes) measured by the laser diffraction method: kaolinite (KAO), silica flour (SF), and silica sands (SS). The values of the median particle diameter obtained for each granular material are: KAO = 7.07 μm, SF44 = 10.47 μm, SF74 = 13.53 μm, SF105 = 18.17 μm, SF210 = 30.37 μm, SF210n = 42.53 μm, SS79 = 106.33 μm, SS127 = 183.96 μm, SS237 = 272.49 μm, SS398 = 481.05 μm, SS630 = 638.60 μm.
The falling-head centrifuge (FC) [60] and falling-head by gravity methods [61] were used to measure the saturated hydraulic conductivity, Ksat, of the granular materials (Figure 4). The series of runs in the centrifuge allows the achievement of flow steadiness. The fluxes are determined from the change in the weight of the inflow and outflow reservoirs, and likewise for the sample, according to the procedure described in [56].
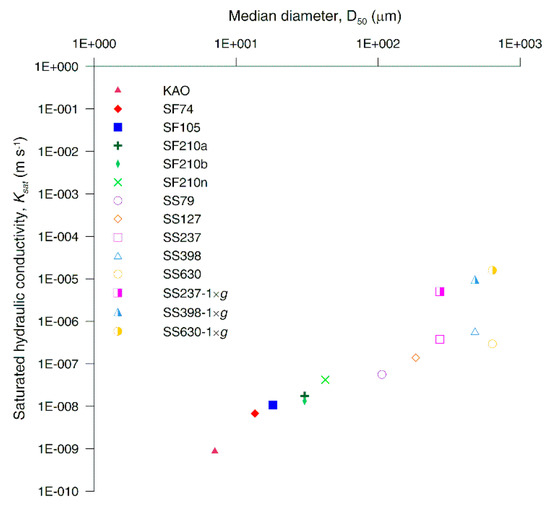
Figure 4.
Saturated hydraulic conductivity, Ksat, as a function of the measured median diameter, D50, of flow-control granular material.
Repeated centrifuge runs establish the achievement of the quasi-steady state that yields data for calculating K and θ. Tensiometer measurements after a quasi-steady run determine ψ. The QSC method is suitable for this purpose because it allows the θ value within the sample to remain essentially constant for K measurements using different amounts of centrifugal driving force. This was facilitated by important operating conditions, including the quick braking of the centrifugal run, the operator’s rapidity in collecting the data of each run before significant evaporation or water transfers occur, and the low height-to-diameter ratio of the sample.
2.2. The Matric Potential Profile and Gradient
The shape of the matric potential profile is important to see whether the matric potential, on which the water content strongly depends, is uniform so that θ is homogeneously distributed inside the sample. If the matric potential along the sample height is sufficiently uniform, dψ/dr is negligible. This allows the use of a simplified form of the DB Equation (4). The nature of the ψ distribution along the sample can be represented by a set of several shape elements [51].
Results were calculated using the KOPCEN code [62,63] which uses a fifth-order Runge–Kutta algorithm [64] to solve the DB law in the centrifugal field for ψ(r), where r [L] is the distance along the axis of the sample from the outflow surface of the sample, measured from the center of rotation. Table 2 shows the input data for the KOPCEN code to compute the profile shape for each run (Figure 5). Each profile of Figure 5 has a nearly vertical portion sufficiently long for a valid K determination. A lower elbow position correlates with a more uniform ψ profile.
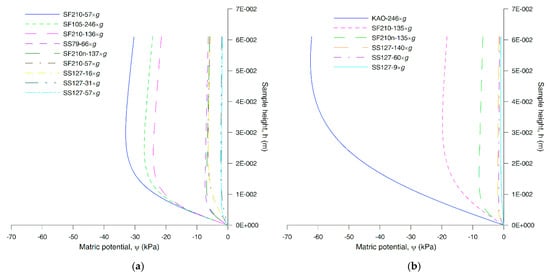
Figure 5.
Matric potential profiles along the sample height computed by the KOPCEN calculation code: (a) lithotype C; and (b) lithotype M.
Calculated values of Δψ, the difference between the ψ value at the point of maximum elbow curvature and the one at the top of the sample, are listed in Table 3. This table also includes values of the gradient, dψ/dr, calculated as the ratio of the difference between two ψ values at specific heights along the sample to the difference between the heights. The gradient dψ/dr along the sample height reported in Table 3 ranges from 0.06 to 0.87 kPa m−1 for C, and from 0.04 to 0.56 kPa m−1 for M. Thus, none of these exceed the equivalent of one-tenth of the force of gravity, much smaller than the centrifugal driving force.
Table 3.
Matric potential gradient, dψ/dr, calculated by using the KOPCEN code.
To optimize the determination of ψ(r) and K(θ, ψ), the calculations for the entire data set of each sample were iterated, each time using the newly computed ψ(r) to produce a revised estimate of K(ψ), which in turn gives a revised ψ(r). The computed K(ψ) relations were thus optimized using the results from all valid centrifuge runs. The input parameter values for each QSC run were: the sample height, the rotating radius at the sample outflow, the ψ = 0 boundary condition of the free-water surface at the bottom of the sample, the rotational speed, the q applied by the reservoir, the measured average θ of the sample, and the ψ measured by the tensiometer. Iteration using a Newton–Raphson scheme can quickly produce an optimal K(ψ) and best estimated ψ(r), which are then used to compute the best K values for the corresponding θ and ψ measured after each run.
For the optimization calculations, the measured ψ and θ values were fitted by the Brooks and Corey [65] model for the water retention curve (Figure 6):
where Se is the saturation; ψ0 the air-entry value, above which Se is set equal to 1; ψ the measured matric potential, and λ the pore-size distribution index. To fit the K values, the Gardner [66] model for K was applied (Figure 7):
where ψ′ is the value of ψ where K is half of its saturated value and n is an empirical exponent. Table 4 summarizes the fitting parameters of Brooks and Corey and Gardner models.
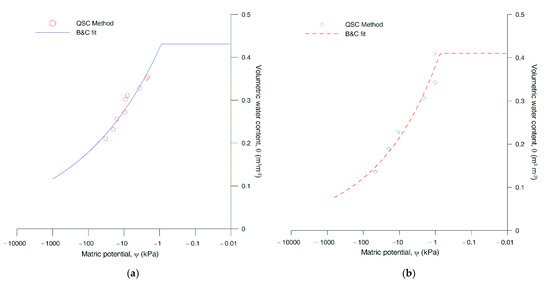
Figure 6.
Fitting of the experimental water retention points with the Brooks and Corey model: (a) lithotype C; and (b) lithotype M.
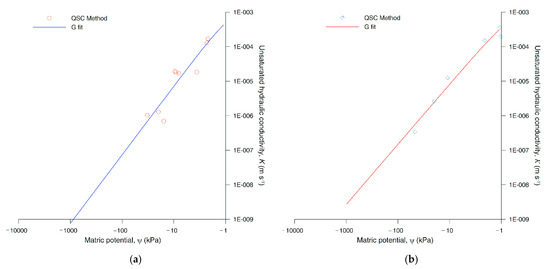
Figure 7.
Fitting of measured hydraulic conductivity values with the Gardner model: (a) lithotype C; and (b) lithotype M.
Table 4.
The fitting parameters used for the curves in Figure 6 and Figure 7. θmax is the maximum water content measured by the QSC, ψ0 is the air-entry value, and λ is the pore distribution index, Ksat is the saturated hydraulic conductivity, n is an empirical parameter, and GoF is the root mean square goodness of fit. The parameters were obtained by the KOPCEN code [63].
The KOPCEN code supplies not only the matric potential gradient, dψ/dr, but also the centrifugal force along the sample, allowing the net driving force at a specific point to be determined via their sum and to compare the matric potential gradient with the centrifugal force magnitude (Figure 8). As noted above, in our results, in the upper and middle portions of the sample, the matric potential gradient is a small addition to the centrifugal force, so the net driving force is well defined for a valid calculation of K.
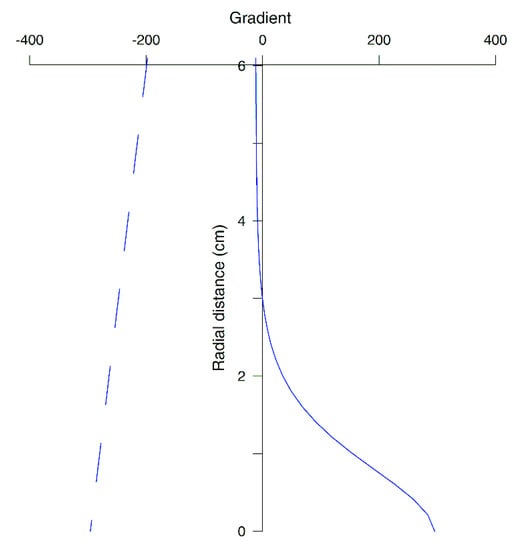
Figure 8.
Comparison of the matric potential gradient (continuous line) to centrifugal gradient (dash lines) for lithotype C, run with cake SF210 at a centrifugal driving force of 57× g. The graph shows that the centrifugal gradient overwhelms the matric potential gradient. This is verified for all the combinations of granular materials and centrifugal driving forces with differences of gradients measured at the top of the sample ranging from 30 to 200 (the case of this figure).
2.3. Test of the Darcy–Buckingham Law and Flow Regime
The measured values of q were plotted against the centrifugal driving force values for very restricted θ ranges, in which θ did not differ more than 0.015 between different runs of the same sample by using the same cake. Within these ranges, because θ is essentially the same for the different driving forces, the DB law prediction is that q would vary proportionally to the centrifugal acceleration. Therefore, in the graph of q vs. acceleration, the measured values in each of the narrow θ ranges should fall along a straight line passing through the origin. The least squares regression was used to calculate the slope of the resulting line, giving the K value for θ corresponding to the midpoint of each range. The determination coefficient, R2, was also calculated.
The Re at various fluid velocities was determined in order to see whether the flow is laminar or turbulent.
3. Results
The water retention curves (Figure 9) are measured by using the QSC method, which is based on steady state individual point measurements. The maximum θ values (0.431 m3 m−3 for C and 0.41 m3 m−3 for M) were nearly equal to the porosity (0.432 for C and 0.41 for M) because the samples were brought to full saturation by using the CO2 injection method. Overall, for the same ψ, θ is lower for M than for C, especially for high suction values where there was a difference of θ of 0.06 m3 m−3 at 46.9 kPa.
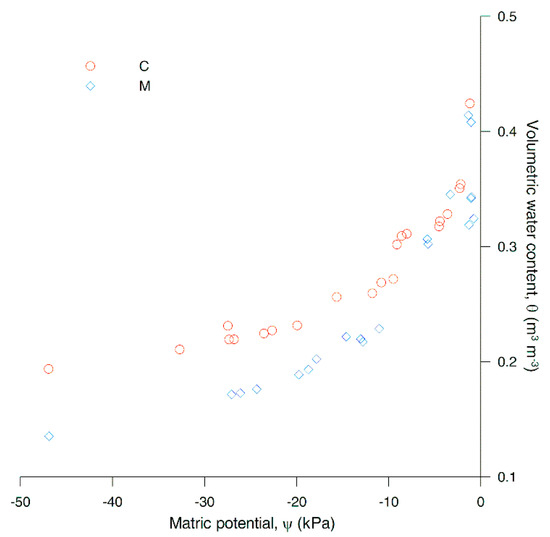
Figure 9.
Water retention curves, θ(ψ), measured by the QSC method for lithotypes C and M.
Because C is coarser, it is expected that C would lose more water and more quickly than M. Instead, C retains more water than M because C has more small pores, as exhibited in the pore-size distributions measured by mercury intrusion porosimetry (Figure 2). Specifically, the pore-size distribution of C is strongly bimodal compared to M, having more pores in the pore-range of 0.49–0.012 µm. The bimodal porosity may create a favorable condition for the flow characterized by dual velocity systems or special flow modes.
Figure 10 shows K vs. θ. For each θ lower than 0.27, K is generally greater for M than for C since fine-textured media tend to have a higher K than coarser ones at intermediate ψ because of the greater continuity of capillary pores filled with water. The inflection point at K values of about 1 × 10⁻⁷ m s−1 reflects a bimodality of the pore size distribution for both lithotypes [67]. The curves in Figure 11 show that K increases steeply as ψ approaches zero for both lithotypes.
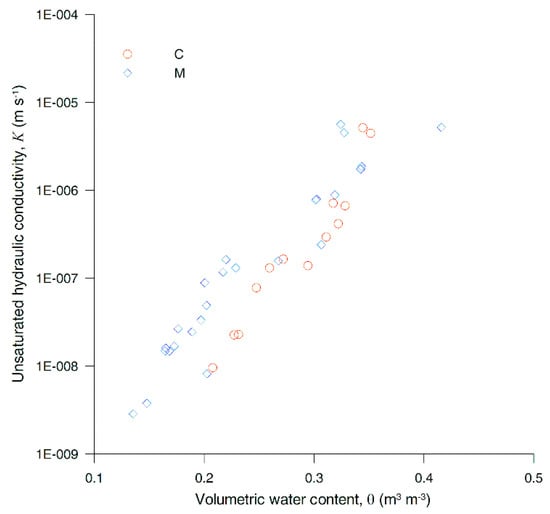
Figure 10.
Hydraulic conductivity, K(θ), measured by the QSC method for lithotypes C and M.
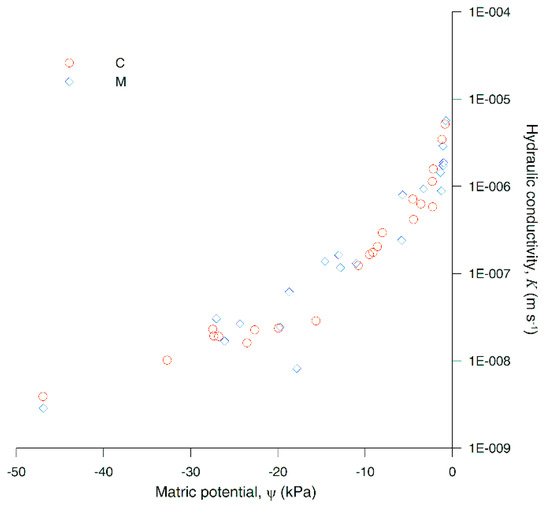
Figure 11.
Hydraulic conductivity, K(ψ), measured by the QSC method for lithotypes C and M.
For one type of test, whether K(θ) changes when the centrifugal force changes, the K(θ) points measured for M by using centrifugal driving forces lower than 200× g were compared to those obtained with forces higher than 200× g (Figure 12). The two point sets overlap, suggesting that K was not affected by the difference in the driving force.
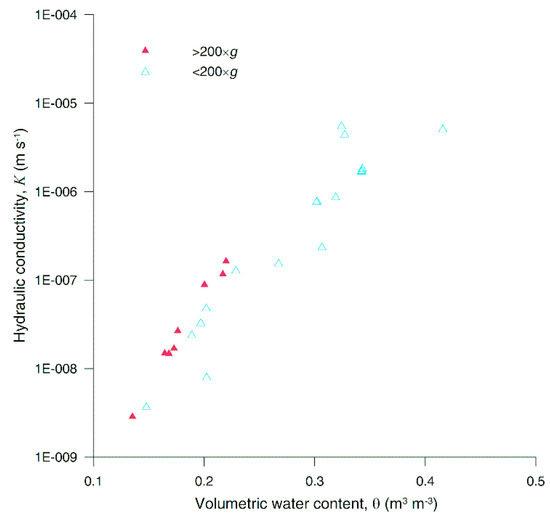
Figure 12.
Hydraulic conductivity, K(θ), measured for lithotype M by the QSC method for driving forces lower (solid symbols) and higher (open symbols) than 200× g.
Figure 13 shows the main evidence that the DB law is valid for the tested unsaturated porous rocks in the centrifugal field. The figure depicts measured q values vs. different centrifugal driving forces, for a nearly uniform θ. Specifically, each fitted line is for points grouped within a restricted range of a θ value, differing less than 0.010–0.015 m3 m−3. The q is directly proportional to the driving force, as predicted by the DB law, demonstrated by two or more measured data points falling on a straight line passing through the origin.
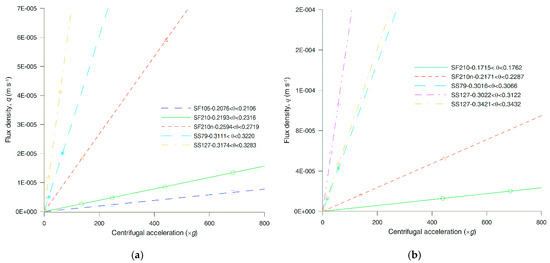
Figure 13.
Flux density vs. centrifugal acceleration: (a) lithotypes C; (b) lithotype M. The samples were tested with different flow-controlling cakes, water contents, and centrifugal forces. The line is a least squares regression on points up to 800× g.
The overall results are consistent with the DB law for K between 9.68 × 10⁻⁹ and 1.83 × 10⁻⁶ m s−1 with θ between 0.343 and 0.21 m3 m−3, and forces ranging from 135.6 to 684.9 times natural gravity, exhibiting R2 between 0.912 and 0.998. Re ranged from 6.37 × 10⁻⁹ to 2.66 × 10⁻⁴ (mean value 1.85 × 10⁻⁵) and 6.73 × 10⁻⁹ to 3.44 × 10⁻⁴ (mean value 2.82 × 10⁻⁵) for C and M, respectively.
4. Discussion and Implications
The experimental results reveal that the DB law is strongly supported. For these porous rocks, under the conditions tested, physical phenomena leading to failures of DB law did not occur. For these media, the phenomena of concern include: (i) flow modes such as free-surface film flow, dual-velocity system flow characterized by two different systems of pores and other types of partially filled flow in which the liquid phase is not rigidly held in a fixed configuration, (ii) the deformation of the AW interface configuration due to the centrifugation, (iii) the change in pore space and AW interface geometry due to the cement in the consolidated media, and (iv) the inertial forces due to high centrifugal acceleration.
The samples, which came from depths ranging between 30 and 80 m, are not heterogeneous and have no significant fractures. Pendular-ring flow, which could be especially vulnerable to deformations caused by centrifugal force, likely is not a significant influence in the moderate θ values of the tests. Even with the strong centrifugal driving force, inertial effects were weak. In fact, the centrifuge flow rates being greater by approximately the factor that is the g-force applied, is in accordance with standard practice as used in centrifugal scaling tests.
The low Re calculated indicates that no turbulence occurs and flow is laminar. The dynamic effect that occurs in the early part of the experiment, when conditions are not yet steady, but approaching steadiness, does not affect the data actually used in calculations and analysis, as established by the rigorous verification of the quasi-steady state.
The QSC method is strengthened by these experiments not only because of the consistency of the measured results with the DB law, but also in demonstrating new operating conditions (the character and thickness of the flow-controlling granular materials, rotational speed, and run duration). The benefit is in expanded versatility, with a greater range of K values of porous rocks, and a solidified basis for confidence in the results. Further measurements could give more points on the q-centrifugal acceleration curves. Further tests may be of value for fractured or otherwise contrasting media, lower water contents, heterogeneous samples, or different fluids.
5. Conclusions
Even though we deal with (i) high water flow rates generated by the centrifugation, (ii) material with large pores, and (iii) cemented and consolidated material, no flow special modes leading to non-Darcian behavior occur, demonstrated by the direct proportionality between flux density and driving force. In light of the results, it can be concluded that, for the media and conditions investigated, special flow regimes (affected by deviations from the assumption of unsaturated flow theory) did not occur, the impact of the AW interface alterations with driving force is negligible, and cementation, which is definitely a characteristic of the consolidated media samples tested in this study, does not affect the unsaturated hydraulic conductivity. For previously untested properties and situations, including consolidated media, bimodal pore-size distribution, and the possible deformation of the AW interface, we established a strong confirmation of the Darcy–Buckingham law.
Author Contributions
Conceptualization, J.R.N.; methodology, M.C.C., J.R.N. and K.S.P.; software, J.R.N.; validation, A.C.T.; formal analysis, M.C.C. and J.R.N.; investigation, A.C.T.; resources, M.C.C.; data curation, J.R.N., M.C.C., K.S.P. and A.C.T.; writing—original draft preparation, A.C.T., M.C.C. and J.R.N.; writing—review and editing, A.C.T., J.R.N. and M.C.C.; supervision, M.C.C. and J.R.N.; funding acquisition, M.C.C. All authors have read and agreed to the published version of the manuscript.
Funding
This research was funded by ITALIAN MINISTRY OF FOREIGN AFFAIRS AND INTERNATIONAL COOPERATION (MAECI) within the project “Predictive methods for unsaturated zone preferential flow in porous and fractured rock”.
Acknowledgments
The authors acknowledge Leia Gaten-Slahor for her support in using the KOPCEN code and David Stonestrom for sample preparation assistance.
Conflicts of Interest
The authors declare no conflict of interest. The funders had no role in the design of the study; in the collection, analyses, or interpretation of data; in the writing of the manuscript, or in the decision to publish the results.
Appendix A
The quasi-steady centrifuge (QSC) method [56] was used to test the validity of the Darcy–Buckingham (DB) law in the centrifugal field by measuring the triplet of values K, θ and ψ. The QSC method uses an experimental apparatus inserted in the bucket of a floor-standing centrifuge (Figure A1).

Figure A1.
Experimental apparatus of the QSC method.
The water flow rate through the sample was established by a layer of a specific granular material (cake) which is inside a flow-control reservoir rested above the sample having 6 cm in height and 7.8 cm in diameter. The series of runs in the centrifuge allows the achievement of flow steadiness.
The procedure to follow for each run involves the measurement of different weights, W, described below:
- W1 = bucket with the bottom support and saturated ceramic plate;
- W2 = W1 + saturated sample;
- W3 = W2 + flow-control reservoir containing a cake specific and water;
- W4 = flow-control reservoir containing the cake and water after the run carried out with specific centrifugal rotational speed and run duration;
- W5 = sample weight after the run.
Applying the DB law in the centrifugal field required the measurement and calculation of the following quantities:
- Water column heights before, hwb, and after, hwa, each run:
- Volume of water fallen, Vw(L3):
- Volume flux, Q(L3 T−1) during the run, Δt(T):
- Flux density, q(L T−1) considering A (L2) as the sample area:
- Volumetric water content, θ(L3 L−3).
For the calculation of the values of θ, ψ and K, refer to [56]. Greater water contents are not measured because highly saturated conditions would have required coarser granular material to form the cakes, and larger reservoirs.
References
- Darcy, H. Les Fontaines Publiques de la Ville de Dijon; Victor Dalmont: Paris, France, 1856. [Google Scholar]
- Buckingham, E. Studies on the Movement of Soil Moisture; US Department of Agriculture, Bureau of Soils: Washington, DC, USA, 1907.
- Kirkham, D.; Powers, W.L. Advanced Soil Physics; Wiley: New York, NY, USA, 1972. [Google Scholar]
- Witelski, T.P. Motion of wetting fronts moving into partially pre-wet soil. Adv. Water Resour. 2005, 28, 1133–1141. [Google Scholar] [CrossRef]
- Chaudhary, K.; Cardenas, M.B.; Deng, W.; Bennett, P.C. Pore geometry effects on intrapore viscous to inertial flows and on effective hydraulic parameters. Water Resour. Res. 2013, 49, 1149–1162. [Google Scholar] [CrossRef]
- Bennett, P.C.; Hiebert, F.K.; Rogers, J.R. Microbial control of mineral-groundwater equilibria: Macroscale to microscale. Hydrogeol. J. 2000, 8, 47–62. [Google Scholar] [CrossRef]
- Guglielmini, L.; Rusconi, R.; Lcuyer, S.; Stone, H.A. Three-dimensional features in low-Reynolds-number confined corner flows. J. Fluid Mech. 2011, 668, 33–57. [Google Scholar] [CrossRef]
- Moutsopoulos, K.N.; Tsihrintzis, V.A. Approximate analytical solutions of the Forchheimer equation. J. Hydrol. 2005, 309, 93–103. [Google Scholar] [CrossRef]
- Moutsopoulos, K.N. One-dimensional unsteady inertial flow in phreatic acquifers, induced by a sudden change of the boundary head. Trans. Porous Med. 2007, 70, 97–125. [Google Scholar] [CrossRef]
- Muskat, M. The Flow of Homogeneous Fluids through Porous Media; JW Edwards Inc: Ann Arbor, MI, USA, 1946. [Google Scholar]
- Tek, M.R.; Coats, K.H.; Katz, D.L. The effects of turbulence on flow of natural gas through porous reservoirs. J. Petrol. Technol. Trans. AIME 1962, 14, 799–806. [Google Scholar] [CrossRef]
- Scheidegger, A.E. The Physics of Flow through Porous Media; University of Toronto Press: Toronto, ON, Canada, 1972. [Google Scholar]
- Katz, D.L.; Lee, R.L. Natural Gas Engineering: Production and Storage; McGraw-Hill: New York, NY, USA, 1990. [Google Scholar]
- Sen, Z. Non-Darcian groundwater flow in leaky aquifers. Hydrol. Sci. J. 2000, 45, 595–606. [Google Scholar] [CrossRef][Green Version]
- Wu, Y.S. Numerical simulation of single-phase and multiphase non-Darcy flow in porous and fractured reservoirs. Trans. Porous Med. 2002, 49, 209–240. [Google Scholar] [CrossRef]
- Van Lopik, J.H.; Snoeijers, R.; van Dooren, T.C.G.W.; Raoof, A.; Schotting, R.J. The effect of grain size distribution on nonlinear flow behavior in sandy porous media. Trans. Porous Med. 2017, 120, 37–66. [Google Scholar] [CrossRef]
- Mijic, A.; Mathias, S.A.; LaForce, T.C. Multiple well systems with non-Darcy flow. Groundwater 2013, 51, 588–596. [Google Scholar] [CrossRef] [PubMed]
- Wen, Z.; Liu, K.; Chen, X. Approximate analytical solution for non-Darcian flow toward a partially penetrating well in a confining acquifer. J. Hydrol. 2013, 498, 124–131. [Google Scholar] [CrossRef]
- Yeh, H.D.; Chang, Y.C. Recent advances in modeling of well hydraulics. Adv. Water Resour. 2013, 51, 27–51. [Google Scholar] [CrossRef]
- Houben, G.J. Review: Hydraulics of water wells flow laws and influence of geometry. Hydrogeol. J. 2015, 23, 1633–1657. [Google Scholar] [CrossRef]
- Jafari, A.; Zamankhan, P.; Mousavi, S.M.; Pietarinen, K. Modeling and CFD simulation of flow behavior and dispersivity through randomly packed bed reactors. Chem. Eng. J. 2008, 144, 476–482. [Google Scholar] [CrossRef]
- Agnaou, M.; Lasseux, D.; Ahmadi, A. Origin of the inertial deviation from Darcy’s law: An investigation from a microscopic flow analysis on two-dimensional model structures. Phys. Rev. E 2017, 96. [Google Scholar] [CrossRef]
- Muljadi, B.P.; Blunt, M.J.; Raeini, A.Q.; Bijeljic, B. The impact of porous media heterogeneity on non-Darcy flow behaviour from pore-scale simulation. Adv. Water Resour. 2016, 95, 329–340. [Google Scholar] [CrossRef]
- El-Zehairy, A.A.; Mousavi Nezhad, M.; Joekar-Niasar, V.; Guymer, I.; Kourra, N.; Williams, M.A. Pore-network modelling of non-Darcy flow through heterogeneous porous media. Adv. Water Resour. 2019, 131, 103378. [Google Scholar] [CrossRef]
- Wang, Y.; Aryana, S.A.; Allen, M.B. An extension of Darcy’s law incorporating dynamic length scales. Adv.Water Resour. 2019, 129, 70–79. [Google Scholar] [CrossRef]
- Bear, J. Dynamics of Fluids in Porous Media; American Elsevier: Dover, DE, USA, 1972. [Google Scholar]
- Van den Berg, E.H.; Perfect, E.; Tu, C.; Knappett, P.S.K.; Leao, T.P.; Donat, R.W. Unsaturated hydraulic conductivity measurements with centrifuges: A review. Vadose Zone J. 2009, 8, 531–547. [Google Scholar] [CrossRef]
- Hayes, R.E.; Afacan, A.; Boulanger, B. An equation of motion for an incompressible Newtonian fluid in a packed bed. Trans. Porous Med. 1995, 18, 185–198. [Google Scholar] [CrossRef]
- Andrade, J.S.; Costa, U.M.S.; Almeida, M.P.; Makse, H.A.; Stanley, H.E. Inertial effects on fluid flow through disordered porous media. Phys. Rev. Lett. 1999, 82, 5249–5252. [Google Scholar] [CrossRef]
- MacDonald, I.F.; El-Sayed, M.S.; Mow, K.; Dullien, F.A.L. Flow through porous media the Ergun equation revisited. Ind. Eng. Chem. Fundament. 1979, 18, 199–208. [Google Scholar] [CrossRef]
- Cvetković, V.D. A continuum approach to high velocity flow in a porous medium. Trans. Porous Med. 1986, 1, 63–97. [Google Scholar] [CrossRef]
- Venkataraman, P.; Rao, P.R.M. Darcian, transitional, and turbulent flow through porous media. J. Hydraul. Eng. ASCE 1998, 124, 840–846. [Google Scholar] [CrossRef]
- Logsdon, S.D. Flow mechanisms through continuous and buried macropores. Soil Sci. 1995, 160, 237–242. [Google Scholar] [CrossRef]
- Sedghi-Asl, M.; Rahimi, H.; Salehi, R. Non-Darcy flow of water Through a Packed Column. Trans. Porous Med. 2014, 101, 215–227. [Google Scholar] [CrossRef]
- Miller, E.E.; Miller, R.D. Physical theory for capillary flow phenomena. J. Appl. Phys. 1956, 27, 324–332. [Google Scholar] [CrossRef]
- Nimmo, J.R.; Malek-Mohammadi, S. Quantifying water flow and retention in an unsaturated fracture-facial domain. In Dynamics of Fluids and Transport in Fractured Porous Systems; Faybishenko, B., Benson, S.M., Gale, J.E., Eds.; Geophysical Monograph Series: Washington, DC, USA, 2015; pp. 169–179. [Google Scholar]
- Dragila, M.I.; Wheatcraft, S.W. Free-surface films. In Conceptual Models of Flow and Transport in the Fractured Vadose Zone; National Academies Press: Washington, DC, USA, 2001; pp. 217–241. [Google Scholar]
- Nimmo, J.R. Theory for source-responsive and free-surface film modeling of unsaturated flow. Vadose Zone J. 2010, 9, 295–306. [Google Scholar] [CrossRef]
- Tokunaga, T.K.; Wan, J. Water film flow along the fracture surfaces of porous rock. Water Resour. Res. 1997, 33, 1287–1295. [Google Scholar] [CrossRef]
- Tokunaga, T.K. Hydraulic properties of adsorbed water films in unsaturated porous media. Water Resour. Res. 2009, 45, 1–9. [Google Scholar] [CrossRef]
- Su, G.W.; Geller, J.T.; Pruess, K.; Wen, F. Experimental studies of water seepage and intermittent flow in unsaturated, rough-walled fractures. Water Resour. Res. 1999, 35, 1019–1037. [Google Scholar] [CrossRef]
- Su, G.W.; Geller, J.T.; Pruess, K.; Hunt, J.R. Solute transport along preferential flow paths in unsaturated fracture. Water Resour. Res. 2001, 37, 2481–2491. [Google Scholar] [CrossRef]
- Dragila, M.I.; Weisbrod, N. Flow in menisci corners of capillary rivulets. Vadose Zone J. 2004, 3, 1439–1442. [Google Scholar] [CrossRef]
- Schmuki, P.; Laso, M. On the stability of rivulet flow. J. Fluid Mech. 1990, 215, 125–143. [Google Scholar] [CrossRef]
- Podgorski, T.; Flesselles, J.M.; Limat, L. Corners, cusps, and pearls in running drops. Phys. Rev. Lett. 2001, 87, 036102. [Google Scholar] [CrossRef]
- Klute, A. Some theoretical aspects of flow of water in unsaturated soils. Soil Sci. Soc. Am. J. Proc. 1952, 16, 144–148. [Google Scholar] [CrossRef]
- Van Brakel, J.; Heertjes, P.M. Capillary rise in porous media. Part III: Role of the contact angle. Powder Technol. 1977, 16, 91–96. [Google Scholar] [CrossRef]
- Schubert, H. Kapillarität in Porösen Feststoffsystemen; Springer: Berlin, Germany, 1982. [Google Scholar]
- Knight, M.A.; Mitchell, R.J. Modelling of light nonaqueous phase liquid (LNAPL) releases into unsaturated sand. Can. Geotech J. 1996, 33, 913–925. [Google Scholar] [CrossRef]
- Li, Y.; Li, H.; Cai, J.; Ma, Q.; Zhang, J. The dynamical effect in capillary pressure during the displacement process in ultra-low permeability sandstone reservoirs. Capillarity 2018, 1, 11–18. [Google Scholar] [CrossRef][Green Version]
- Nimmo, J.R.; Rubin, J.; Hammermeister, D.P. Unsaturated flow in a centrifugal field: Measurement of hydraulic conductivity and testing of Darcy’s law. Water Resour. Res. 1987, 23, 124–134. [Google Scholar] [CrossRef]
- Childs, E.C.; Collis-George, N. The permeability of porous materials. Proc. R. Soc. Ser. A 1950, 201, 392–405. [Google Scholar] [CrossRef]
- Vachaud, G. Determination of the hydraulic conductivity of unsaturated soils from an analysis of transient flow data. Water Resour. Res. 1967, 3, 697–705. [Google Scholar] [CrossRef]
- Olson, T.C.; Swartzendruber, D. Velocity-gradient relationships for steady-state unsaturated flow of water in nonswelling artificial soils. Soil Sci. Am. Proc. 1968, 32, 457–462. [Google Scholar] [CrossRef]
- Swartzendruber, D. An introduction to the physical basis of soil water phenomena. Soil Sci. Soc. Am. J. 1970, 34. [Google Scholar] [CrossRef]
- Caputo, M.C.; Nimmo, J.R. Quasi-steady centrifuge method of unsaturated hydraulic properties. Water Resour. Res. 2005, 41, 1–5. [Google Scholar] [CrossRef]
- Ciaranfi, N.; Pieri, P.; Ricchetti, G. Note alla carta geologica delle Murge e del Salento (Puglia centro-meridionale). Mem. Soc. Geol. Ital. 1988, 41, 449–460. [Google Scholar]
- Dunham, R.J. Classification of carbonate rocks according to depositional texture. In Classification of Carbonate Rocks; Ham, W.E., Ed.; American Association of Petroleum Geologists: Tulsa, OK, USA, 1962; pp. 108–121. [Google Scholar]
- International Society for Rock Mechanics. Suggested methods for determining water content, porosity, density, adsorption and related properties and swelling and slake durability index properties. Int. J. Rock Mech. Min. Sci. Abs 1979, 16, 141–156. [Google Scholar]
- Nimmo, J.R.; Mello, K.A. Centrifugal techniques for measuring saturated hydraulic conductivity. Water Resour. Res. 1991, 27, 1263–1269. [Google Scholar] [CrossRef]
- Klute, A.; Dirksen, C. Hydraulic conductivity and diffusivity: Laboratory methods. In Methods of Soil Analysis, Part 1: Physical and Mineralogical Methods; Klute, A., Ed.; American Society of Agronomy: Madison, WI, USA, 1986; pp. 687–732. [Google Scholar]
- Nimmo, J.R.; Stonestrom, D.A.; Akstin, K.C. The feasibility of recharge rate determinations using the steady-state centrifuge method. Soil Sci. Soc. Am. J. 1994, 58, 49–56. [Google Scholar] [CrossRef]
- Nimmo, J.R.; Perkins, K.S.; Lewis, A.M. Steady-state centrifuge. In Methods of Soil Analysis Part 4: Physical Methods; Dane, J.H., Topp, G.C., Eds.; Soil Science Society of America: Madison, WI, USA, 2002; pp. 903–916. [Google Scholar]
- Press, W.H. Numerical Recipes; Cambridge University Press: Cambridge, UK, 1989. [Google Scholar]
- Brooks, R.H.; Corey, A.T. Hydraulic Properties of Porous Media; Colorado State University: Fort Collins, CO, USA, 1964. [Google Scholar]
- Gardner, W.R. Representation of soil aggregate-size distribution by a logarithmic-normal distribution. Soil Sci. Soc. Am. Proc. 1956, 20, 151–153. [Google Scholar] [CrossRef]
- Othmer, K.; Diekkrüger, B.; Kutilek, M. Bimodal porosity and unsaturated hydraulic conductivity. Soil Sci. 1991, 152, 139–150. [Google Scholar] [CrossRef]
© 2020 by the authors. Licensee MDPI, Basel, Switzerland. This article is an open access article distributed under the terms and conditions of the Creative Commons Attribution (CC BY) license (http://creativecommons.org/licenses/by/4.0/).