Article

Effects of Tropical Cyclones on Sea Surface Salinity in the Bay of Bengal Based on SMAP and Argo Data

1
College of Electronic and Information Engineering, Guangdong Ocean University, Zhanjiang 524088, China
2
Southern Marine Science and Engineering Guangdong Laboratory, Guangzhou 510301, China
3
Guangdong Key Laboratory of Ocean Remote Sensing, South China Sea Institute of Oceanology, Chinese Academy of Sciences, Guangzhou 510301, China
4
State Key Laboratory of Tropical Oceanography, South China Sea Institute of Oceanology, Chinese Academy of Sciences, Guangzhou 510301, China
*
Author to whom correspondence should be addressed.
Water 2020, 12(11), 2975; https://doi.org/10.3390/w12112975
Submission received: 3 September 2020 / Revised: 21 October 2020 / Accepted: 21 October 2020 / Published: 23 October 2020
(This article belongs to the Section Oceans and Coastal Zones)

Abstract

:
This paper uses the Argo sea surface salinity (SSSArgo) before and after the passage of 25 tropical cyclones (TCs) in the Bay of Bengal from 2015 to 2019 to evaluate the sea surface salinity (SSS) of the Soil Moisture Active Passive (SMAP) remote sensing satellite (SSSSMAP). First, SSSArgo data were used to evaluate the accuracy of the 8-day SMAP SSS data, and the correlations and biases between SSSSMAP and SSSArgo were calculated. The results show good correlations between SSSSMAP and SSSArgo before and after TCs (before: SSSSMAP = 1.09SSSArgo−3.08 (R2 = 0.69); after: SSSSMAP = 1.11SSSArgo−3.61 (R2 = 0.65)). A stronger negative bias (−0.23) and larger root-mean-square error (RMSE, 0.95) between the SSSSMAP and SSSArgo were observed before the passage of 25 TCs, which were compared to the bias (−0.13) and RMSE (0.75) after the passage of 25 TCs. Then, two specific TCs were selected from 25 TCs to analyze the impact of TCs on the SSS. The results show the significant SSS increase up to the maximum 5.92 psu after TC Kyant (2016), which was mainly owing to vertical mixing and strong Ekman pumping caused by TC and high-salinity waters in the deep layer that were transported to the sea surface. The SSSSMAP agreed well with SSSArgo in both coastal and offshore waters before and after TC Roanu (2016) and TC Kyant (2016) in the Bay of Bengal.

1. Introduction

The Bay of Bengal (BoB) is a semi-enclosed basin and strongly influenced by the seasonally reversing monsoon winds. The Bay receives a large quantity of freshwater from both rainfall and river runoff of the bordering countries [1]. The sea surface salinity (SSS) is very low in the northern BoB, especially in summer and winter. The influx of freshwater into the BoB forms obvious seasonal variations in the horizontal salinity gradient in the northern bay [2,3].
Tropical cyclones (TCs) occur in the BoB during the pre-monsoon period (April–May) and the post-monsoon period (October–December) [4,5,6]. It is well known that TCs can induce dramatic physical processes (strong mixing and upwelling) in the upper ocean, which has a large impact on sea surface temperature, SSS, chlorophyll concentration, dissolved oxygen and so on [4,7,8,9,10,11,12,13]. The SSS can be affected by the TC-induced physical processes (strong mixing and Ekman pumping) and the large rainfall. Based on Aquarius and Soil Moisture and Ocean Salinity (SMOS) salinity observations, Grodsky et al. reported that an increase of 1.5 psu occurred during the passage of Hurricane Katia in the Amazon/Orinoco plume of the Atlantic Ocean [14]. Reul et al. also found a strong surface salinity enhancement (up to 1.7 psu) detected by SMOS due to the passage of Hurricane Igor in the Amazon-Orinoco river plume [15].
The remote sensing data of SSS in previous studies were mainly obtained from the SMOS satellite. Compared with SMOS SSS data, the latest released sensor named Soil Moisture Active Passive (SMAP, 1 April 2015) provides SSS data with better quality over the BoB [16], which gives more details of SSS changes under TCs, especially in the BoB where strong salinity stratification often exists. As SMAP salinity data are relatively new, it is necessary to evaluate the changes of SMAP salinity data using the in situ Argo salinity before and after the passage of TCs. Menezes et al. revealed that the SMAP salinity satellite reproduced SSS well in the BoB, and the correlations for Level 3 data were 0.81–0.93 [17]. The SSS in the BoB cannot only be affected by normal rainfall and massive runoff, but also the TC-induced heavy rainfall, mixing and upwelling. Chacko documented that TC Vardah induced SSS increase (up to 1.5 psu) in the BoB based on SMAP salinity observations [18].
Although previous studies have used SMAP salinity satellite data to explore the impact of individual TC on the SSS in the BoB, there are no long-time series and large-scale SMAP salinity data validations under the impact of TCs. Data sharing of a large number of Argo floats in the BoB thus provides a good chance for evaluating and detecting SSS variations affected by TCs around this area. Therefore, this paper uses the Argo salinity data before and after the passage of 25 TCs in 2015–2019 to verify the accuracy of the SMAP salinity data. Then, two specific TCs are chosen to explore the impact of TCs on the SSS in the BoB.

2. Data and Methods

2.1. Tropical Cyclones and Satellite Data

The track data of TCs were obtained from the India Meteorological Department (http://www.rsmcnewdelhi.imd.gov.in/). The storm track data set consists of six hourly time series of locations of the TC center and the maximum sustained wind speed (MSW) at 10 m above the mean sea level. This study chose 25 TCs from April 2015 to December 2019, which must accompany by Argo floats within 3° to their tracks. Figure 1 shows the tracks of these 25 TCs in the BoB, and Table 1 presents the basic information about these 25 TCs.
The 8-day SMAP salinity data were version 4.0 of Level 3 ocean surface salinity. The spatial resolution of the 8-day SMAP salinity is approximate to 70 km. The 70 km fields are the best used since they have significantly lower noise than 40 km data. The origin data were interpolated to the geospatial resolution of 0.25°, which can be downloaded from the website http://www.remss.com/missions/smap. The 8-day averaged SMAP data with geospatial resolution of 0.25° × 0.25° were available since 1 April 2015. The daily rainfall with spatial resolution of 0.25° × 0.25° was obtained from https://disc.gsfc.nasa.gov/datasets/TRMM_3B42RT_Daily_7/.

2.2. Argo Data

The salinity of Argo floats used in this study was extracted from the International Argo Program (www.argodatamgt.org/). The salinity (<10 m) from Argo was used to represent the surface salinity. The average depth of Argo salinity data was 3.76 ± 2.32 m.
Since the passage of a TC may have an effect on the regional hydrography a week later, and our objective was to assess the 8-day averaged SMAP data, we chose the periods from 8 days before and 8 days after the passage of a TC. Some previous studies documented the maximum effect of TCs on the changes of sea surface temperature, the CO2 partial pressure at the sea surface and the heavy rainfall can reach around three geographic degrees from the TC tracks [10,19,20]. According to the tracks of 25 TCs, salinity data of Argo were selected from 8 days before TCs to 8 days after the passage of TCs within 3° to their tracks.
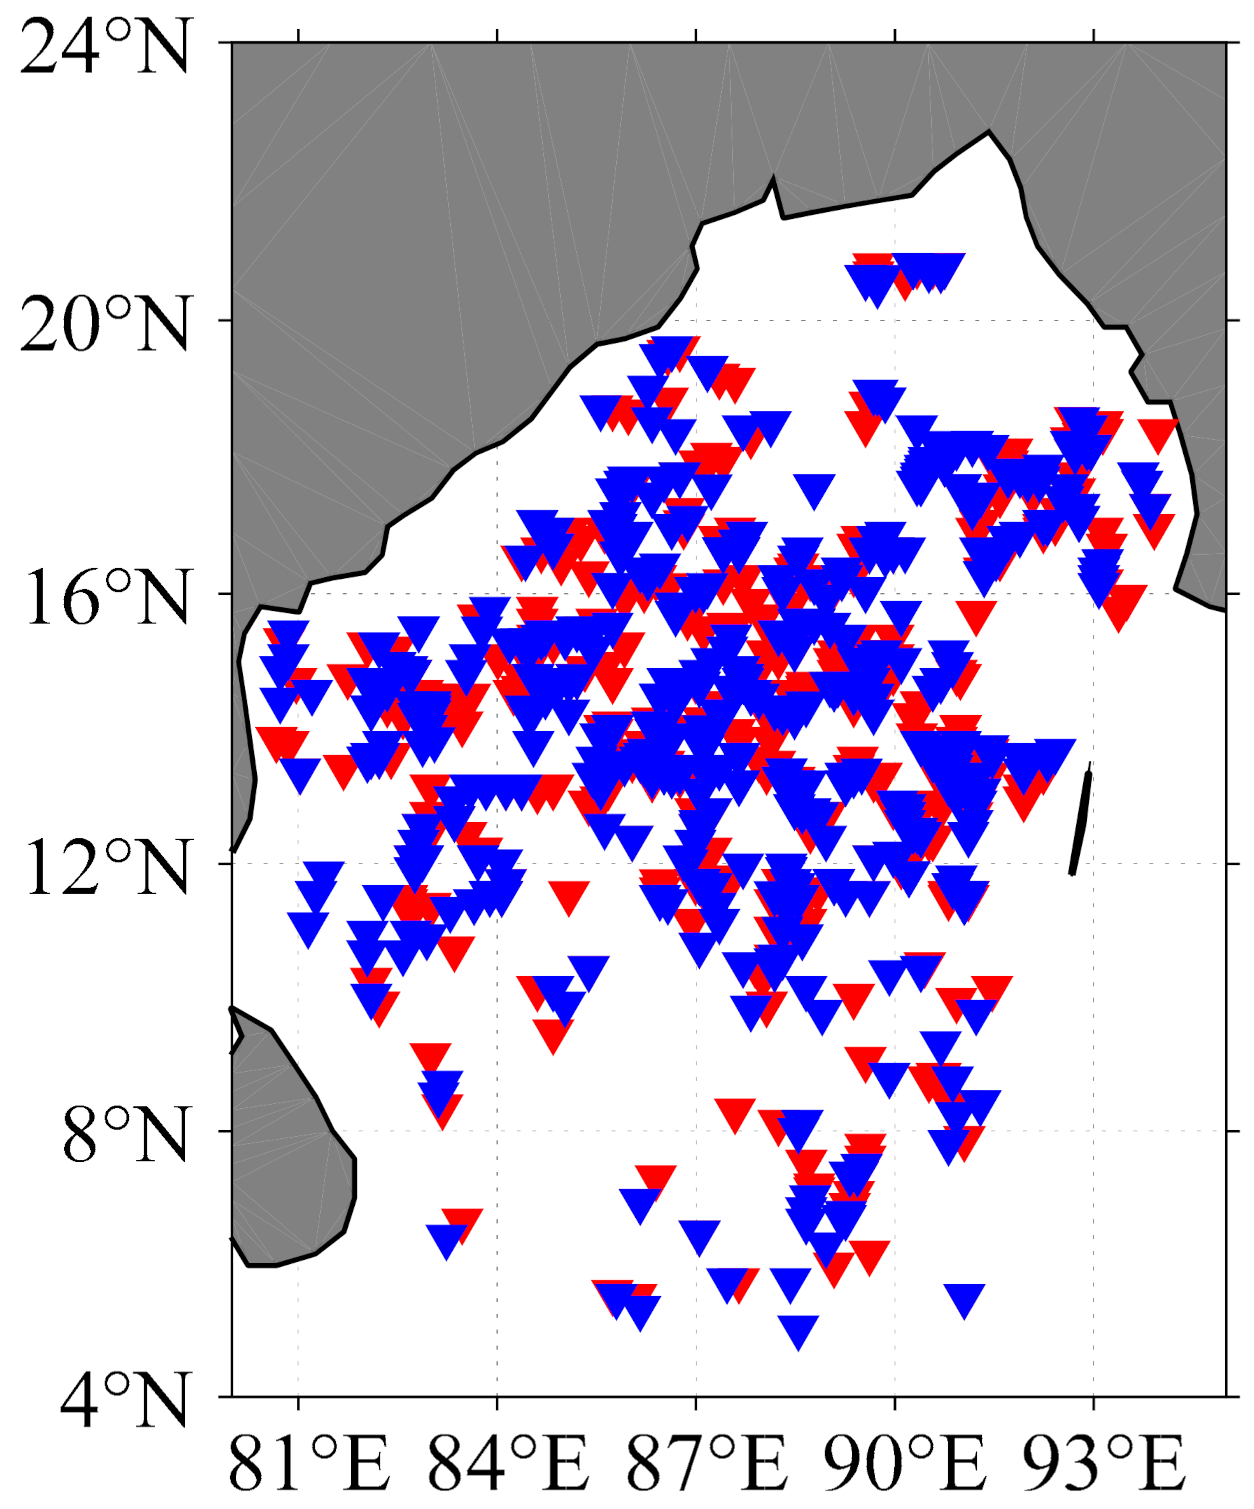
This study divided the TC track into daily track and chose the Argo SSS and SMAP SSS between 8 days before and 8 days after each day within 3° from the TC’s center. For example, the TC Roanu occurred during 17–22 May 2016. We divided the TC track into daily tracks (tracks on 17–22 May). We chose the track of first day (May 17), then chose all Argo floats in a period of +/− 8 days and within 3° to the TC center. The 8-day average SMAP SSS data between 8 days before 17 May and 8 days after 17 May were chosen. A matched pair of Argo and satellite observation was selected when the Argo observations were within +/− 8 days of SMAP observation and when the satellite observation was within 27.75 km (0.25°, the interpolated product) of the Argo positions. On the next day, we proceeded the same way. Figure 2 presents the locations of all selected Argo floats in the BoB (Figure 2). For each of these data pairs, we define
ΔS = SSSSMAP(position of Argo) − SSSArgo(position of Argo)
Basic statistics such as the mean, standard deviation (STD), linear correlation coefficient, root-mean-square error (RMSE, 1 N i = 1 N ( SSS SMAP ( i ) S S S A r g o ( i ) ) 2 ) and bias were calculated for SSSSMAP and SSSArgo to assess SMAP performance in the BoB under the influence of TC passage.

3. Results and Discussion

3.1. SMAP Data Validation with Individual Argo

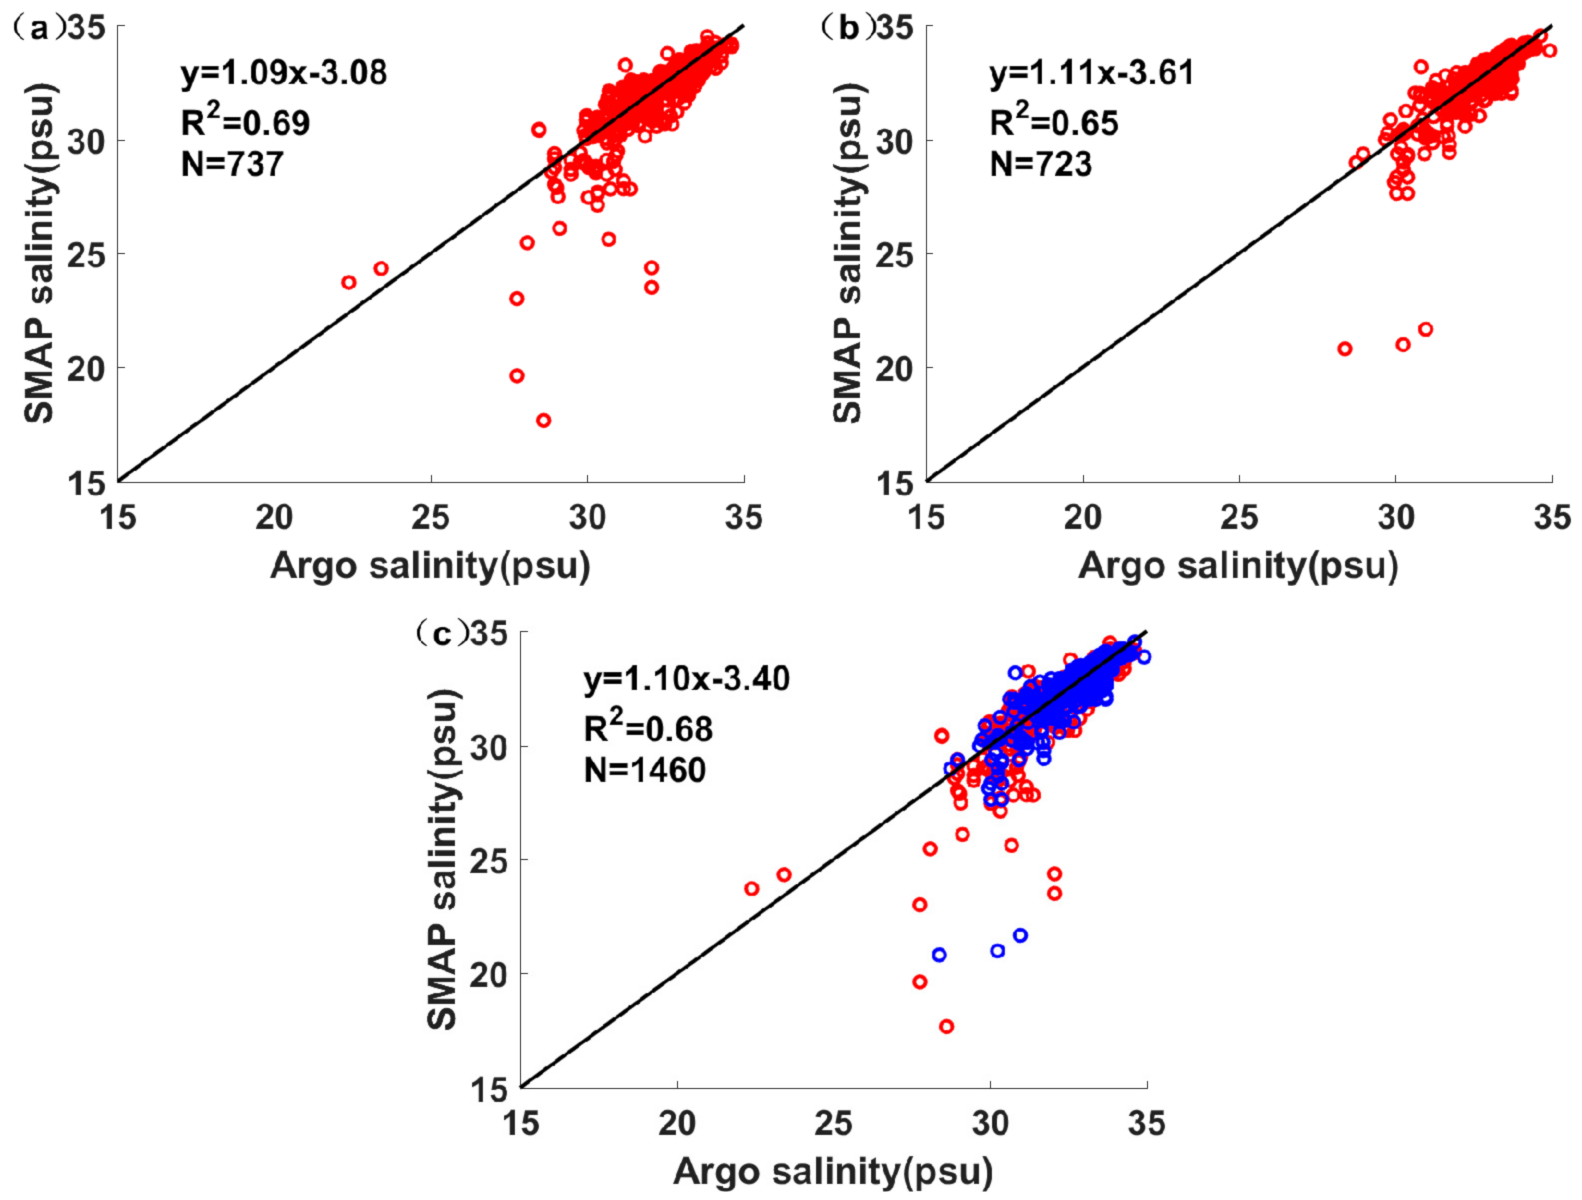
This study divided the SSS from Argo and SMAP into three groups: data before TCs, data after TCs and data of total SSS both before and after TCs. To evaluate the retrieval accuracy over the BoB, the scatter plots of three groups of SSSArgo versus SSS SMAP are shown (Figure 3a–c). The relational expressions were SSSSMAP = 1.09SSSArgo−3.08 (N = 737, R2 = 0.69) before the TCs passage, SSSSMAP = 1.11SSSArgo−3.61 (N = 723, R2 = 0.65) after the TCs passage, and SSSSMAP = 1.10SSSArgo−3.40 (N = 1460, R2 = 0.68) of total SSS before and after TCs passage, respectively. The best correlation (R2 = 0.69) was before TCs passage because the satellite observations and Argo observations were not influenced by the passage of 25 TCs. The R2 (0.65) after the passage of TCs was lower than the value (0.68) of total SSS. In general, the SSSSMAP product agreed well with SSSArgo. Moreover, Table 2 shows the correlations of each TC between SSSArgo and SSSSMAP before and after 25 TCs. The results indicate that most of correlations between SSSArgo and SSSSMAP before and after 25 TCs were relatively high. It should be noted that there are a few bad correlations (R2 < 0.3) between SSSArgo and SSSSMAP after the passage of four TCs (SCS Mora, Cyclonic Storm Daye, VSCS Titli and SCS Phethai). There is only one TC (Depression occurred 19 October to 22 October 2017) which had a bad correlation (R2 < 0.3) between SSSArgo and SSSSMAP before the passage of TC.
Systematic biases existed between the SSSArgo and SSSSMAP before and after TCs (Table 3). The mean SSSArgo before TCs was 32.36 psu, which was close to the mean SSSSMAP (32.14 psu) before TCs.
The mean SSSArgo after TCs was 32.71 psu, which was close to the mean SSSSMAP (32.58 psu) after TCs. When combining all the data before and after TCs together, the means of SSSSMAP before and after TCs were smaller than those of SSSArgo. The differences between the satellite and the in situ observations (Argo) include the errors in the satellite observations and Argo observations, and sampling errors introduced by differences in the sampling characteristics and the distance in space and time between the matched pairs. The effects of surface roughness induced by the high winds of the TCs can result in variations in the satellite observed brightness temperature, which was used to calculate the final SSS data [18,21]. Based on the correlations of 25 TCs, the bad correlations after four TCs may be due to this reason. In addition, the SSSArgo close to 3.76 ± 2.32 m was chosen as the surface salinity, while the SSSSMAP was measured within the uppermost cm of the sea surface. Owing to the heavy rainfall induced by TCs, heavy rainfall can create a stronger near-surface salinity stratification than light or no rainfall [2]. These differences in sampling depth of surface data might cause the biases between SSSArgo and SSSSMAP. These aspects covered most of the SSS bias. In this paper, the bias and RMSE of total SSSSMAP and total SSSArgo were −0.18 and 0.86, respectively (Table 3). Menezes reported the bias and RMSE between 70 km SSS SMAP and Argo observations were −0.07 and 0.35 in the BoB, which were smaller than those in this study [17]. The stronger negative bias and higher RMSE in this study mainly were due to the sampling errors and the impact of the TC passage, which occupied more than 50% of the bias and RMSE.
The negative bias between the SSSArgo and SSSSMAP was −0.23 before the passage of TCs, which was stronger than the negative bias (−0.13) after the passage of 25 TCs. The root-mean-square error (RMSE) between the SSSArgo and SSSSMAP was 0.95 before the passage of TCs, which was larger than the RMSE (0.75) after the passage of TCs. Lin et al. showed the large SSS RMSE in the northern bay was largely induced by small-scale variations in SSS, owing to the heavy rainfall and runoff. Frequent heavy precipitation in the BoB induced a freshening bias that lasted for less than 6 h and caused the high RMSE values [2]. It is well known that most rainfall occurred one or two days before the TC arrival. Hence this pre-arrived rainfall would generate the high RMSE values. On the other hand, the passage of TCs generated strong mixing, which could break the near-surface salinity stratification in the upper ocean. The homogenization of sea water would reduce the differences between the SSSSMAP and the SSSArgo. Thus, the passage of TCs had a certain influence on the correlations between SSSArgo and SSSSMAP.

3.2. The Seasonal SMAP SSS during 2015–2019

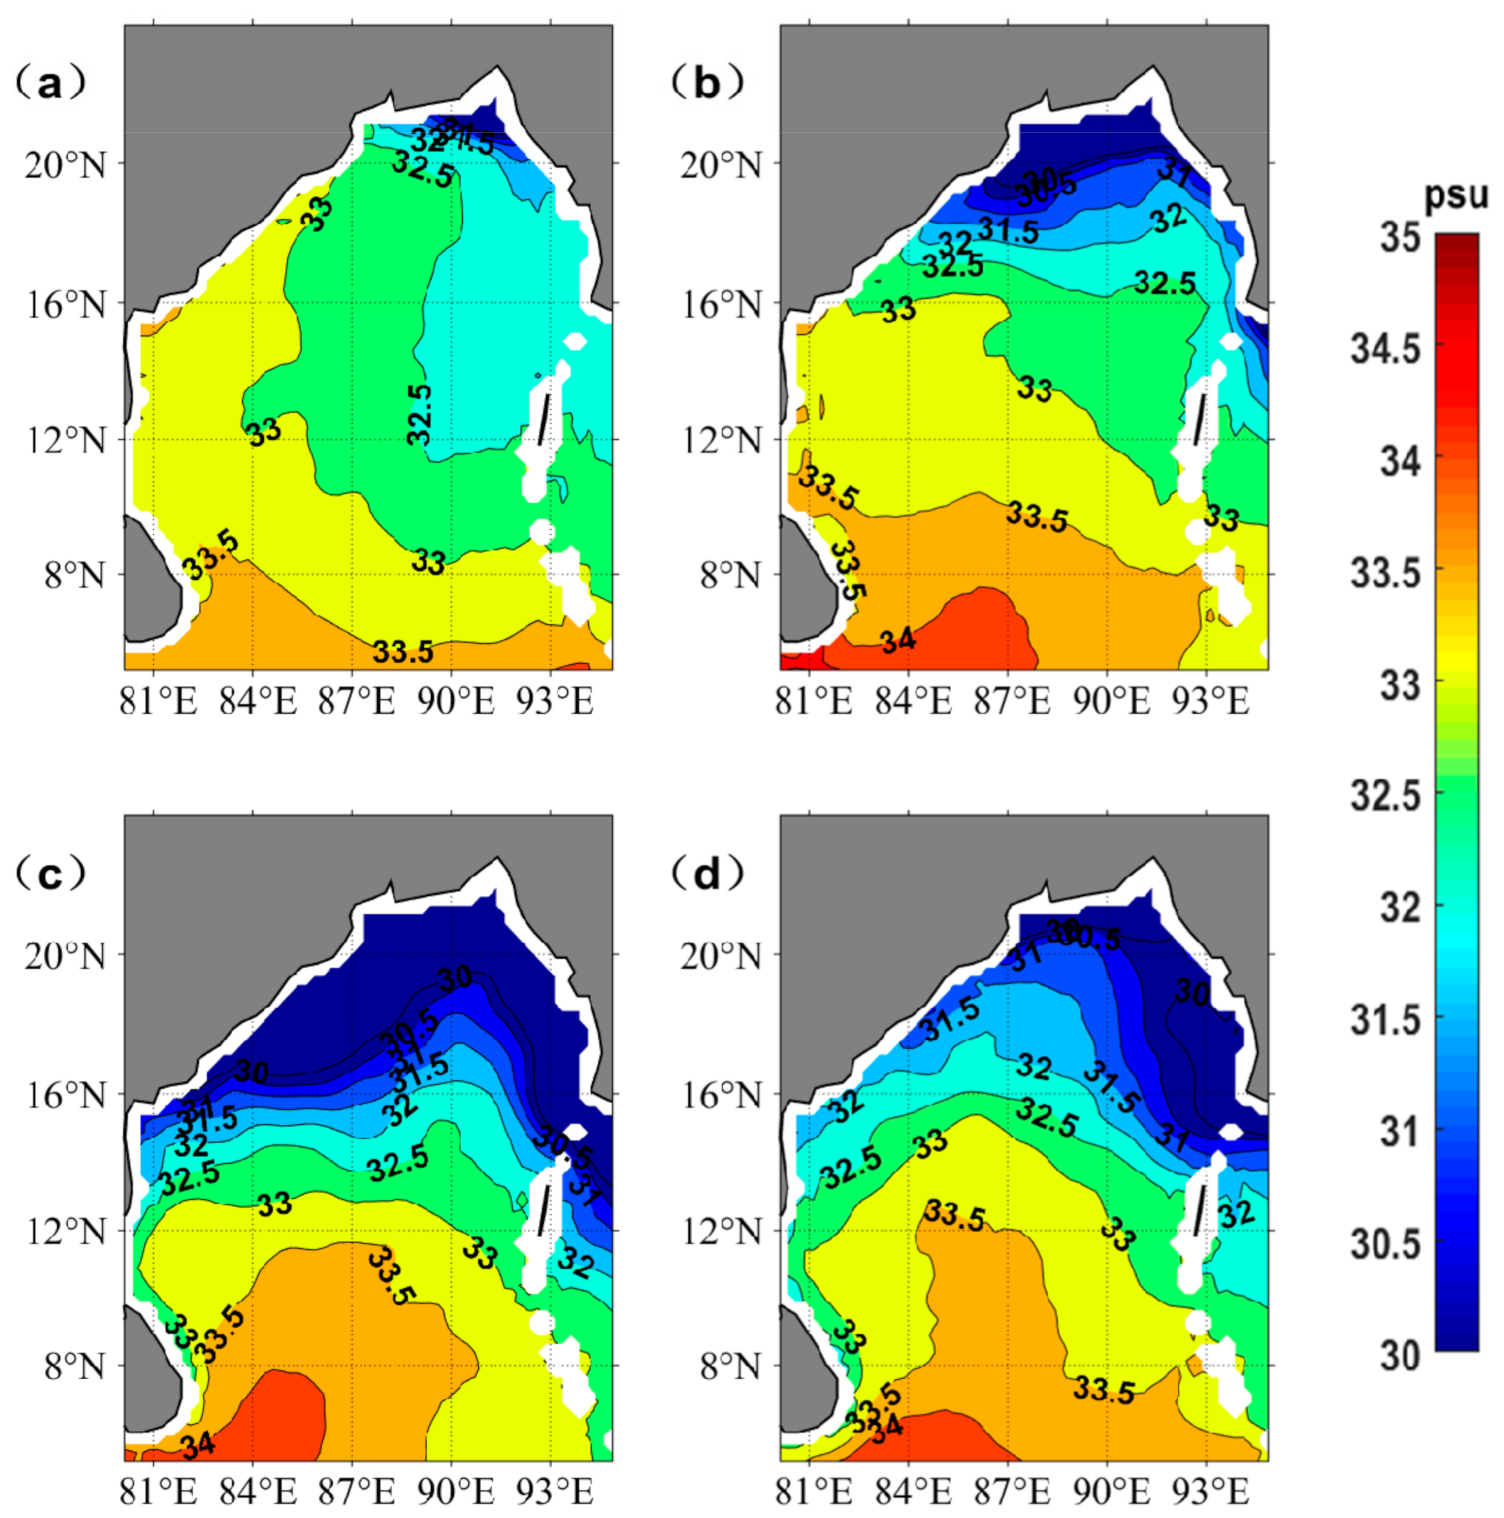
The seasonal SSS distributions based on the SMAP data from 2015 to 2019 in the BoB are shown in Figure 4. The SSS in the BoB had obvious seasonal variability. In spring (March–May), the small areas with low-salinity (<32 psu) waters were only located in the north of 20 °N. In summer (June–August), the areas with low-salinity waters gradually expanded to 17 °N. In autumn (September–November), the biggest areas with low-salinity waters expanded to 14 °N. The low-salinity waters gradually retreated back northwards in winter (December–February), which then finally reached their minimal extent in following spring. This typical distribution of SSS in the BoB was consistent with previous studies [1,2,16]. The low-salinity waters were located in the northern coast of the BoB owing to the large runoff and heavy rain. The overall average of salinity in the spring from 2015 to 2019 in the BoB was 32.93 psu, with its maximum of 34.07 psu and its minimum of 19.59 psu. The spatial distribution of SSS in the BoB varied significantly in autumn. The overall average of SSS (31.97 psu) in the autumn from 2015 to 2019 was much smaller than the value in spring, with its maximum of 34.27 psu and its minimum of 8.68 psu.

3.3. Two Specific TCs to Study the TC Impact on the SSS

There were 27 TCs which passed over the BoB from 2015 to 2019, and the Argo only provided SSS data during 25 of them. Two specific TCs (TC Roanu (2016) and TC Kyant (2016)) were chosen to study the TC impact on the SSS in the BoB. TC Roanu occurred in coastal waters, and the SSS change was the smallest among these 25 TCs. TC Kyant went through the central BoB and induced the most significant change of SSS in the BoB.
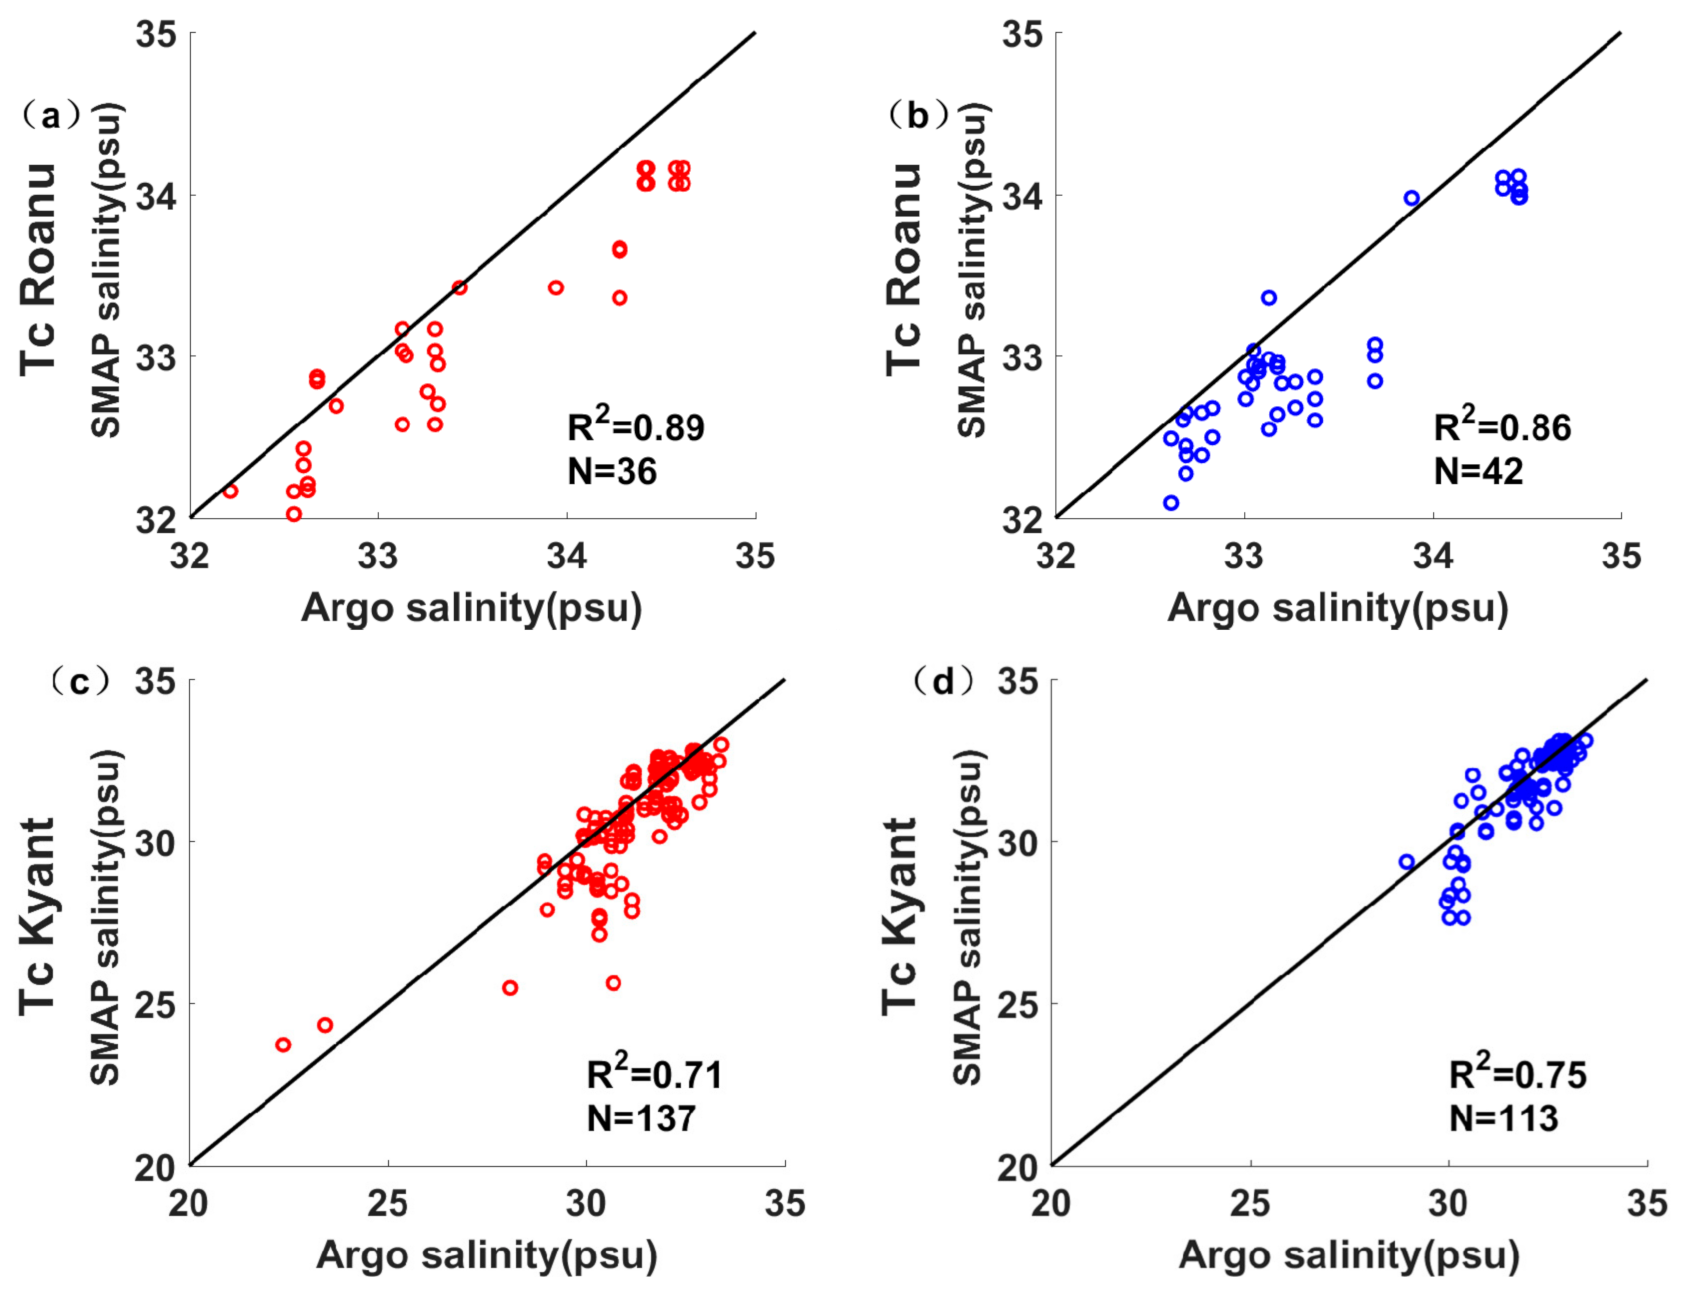
The correlations between SSSArgo and SSSSMAP before and after the TC Roanu were high (0.89 and 0.86, respectively, p < 0.05), while the correlations between SSSArgo and SSSSMAP before and after TC Kyant were good (0.71 and 0.75, respectively, p < 0.05) but less relevant compared with that of TC Roanu (Figure 5). These indicate that the SSSSMAP agreed well with the in situ SSS (SSSArgo) in the coastal waters and offshore waters.
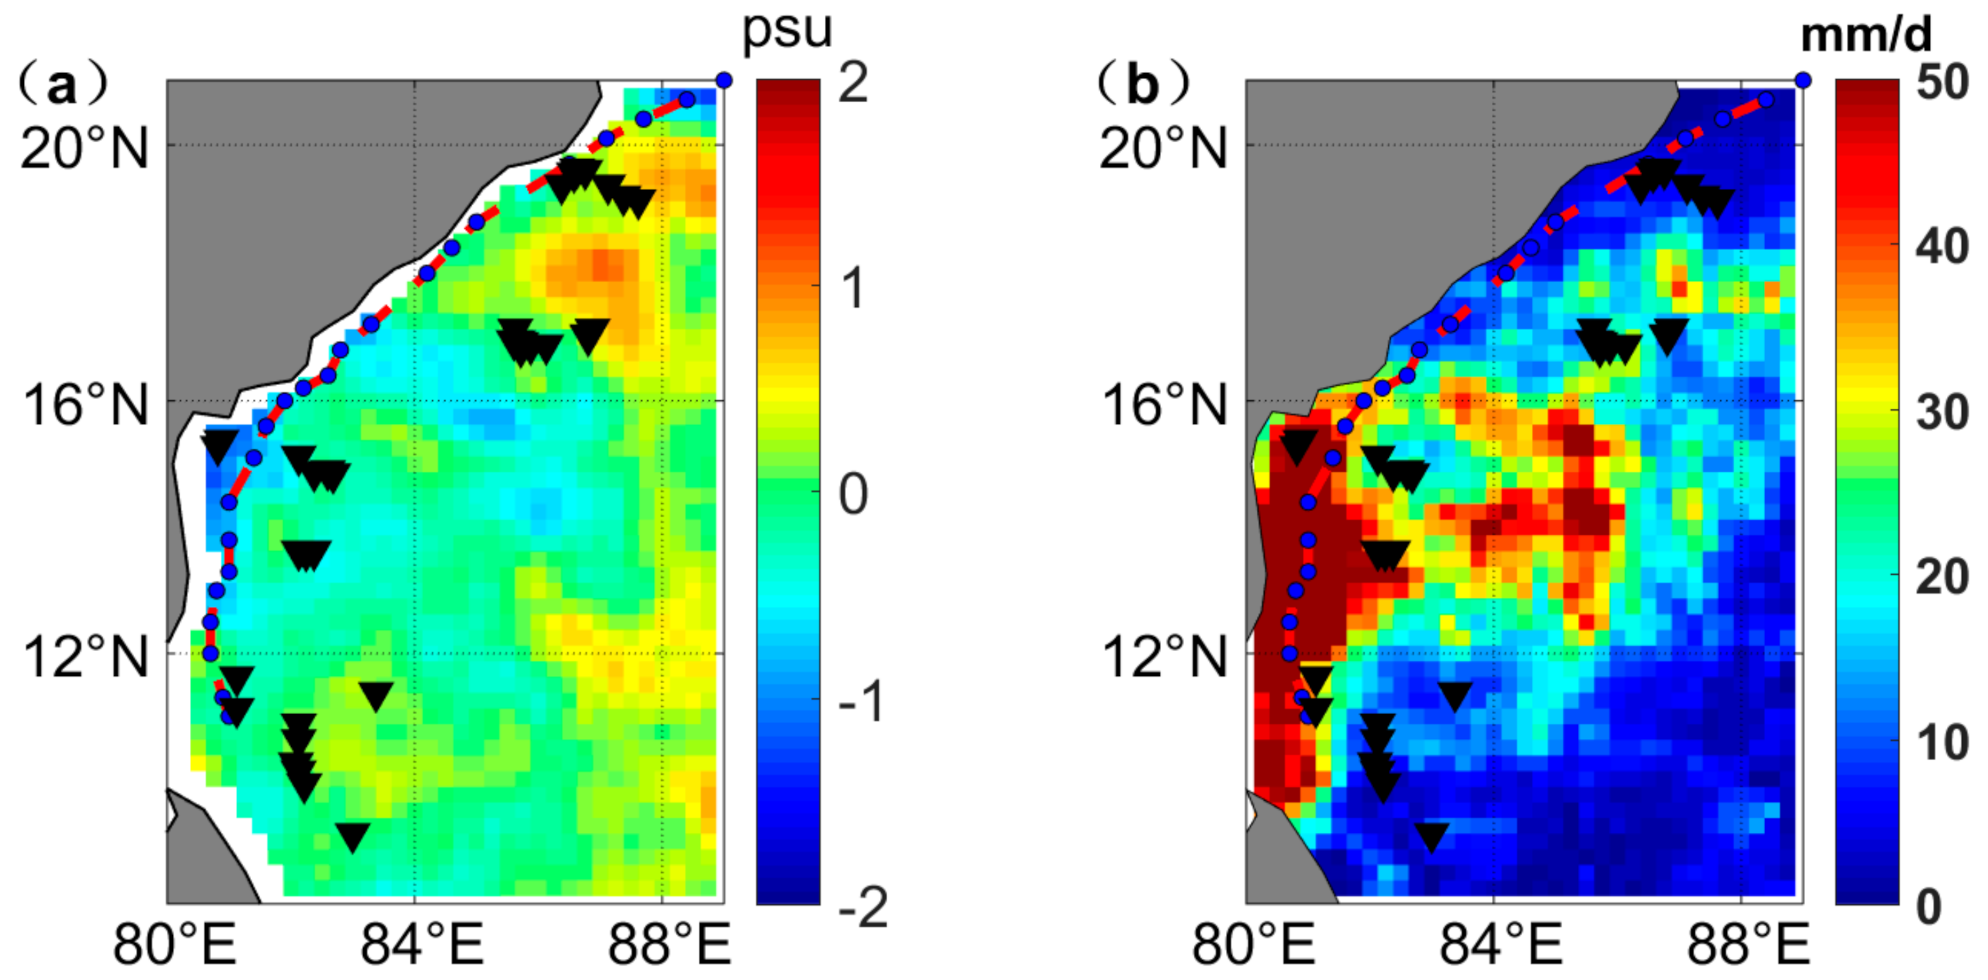
The SSS changes before and after TCs mainly were due to physical processes (such as the intense mixing and upwelling caused by TCs), rainfall and runoff. The SSS changes in most of the areas along the track were smaller than ±1 psu under the impact of TC Roanu (Figure 6). It should be noted the SSS in the coastal waters decreased slightly after the TC. The Argo (ID: 2902087) on the left side of the TC’s track was chosen to analyze the hydrological changes. The hydrological changes of temperature and salinity indicated that the cooler and saltier waters were uplifted to a shallow layer or even to the surface (Figure 7). Xu et al. reported that the Ekman pumping over the area occupied by this Argo was 1.4 × 10⁻⁴ m s−1, which indicated that the strong TC-induced upwelling brought the saltier waters in the deep layer up to the surface [10]. Moreover, the TC Roanu induced heavy rain (the maximum was 109 mm day−1 during 16–18 May 2016). Owing to the offset between the saltier waters from the deeper layer and the heavy rain, the SSS changes were small. It cannot be ignored that the large runoff caused by TC Roanu may be another important factor of the SSS decrease in the coastal waters.
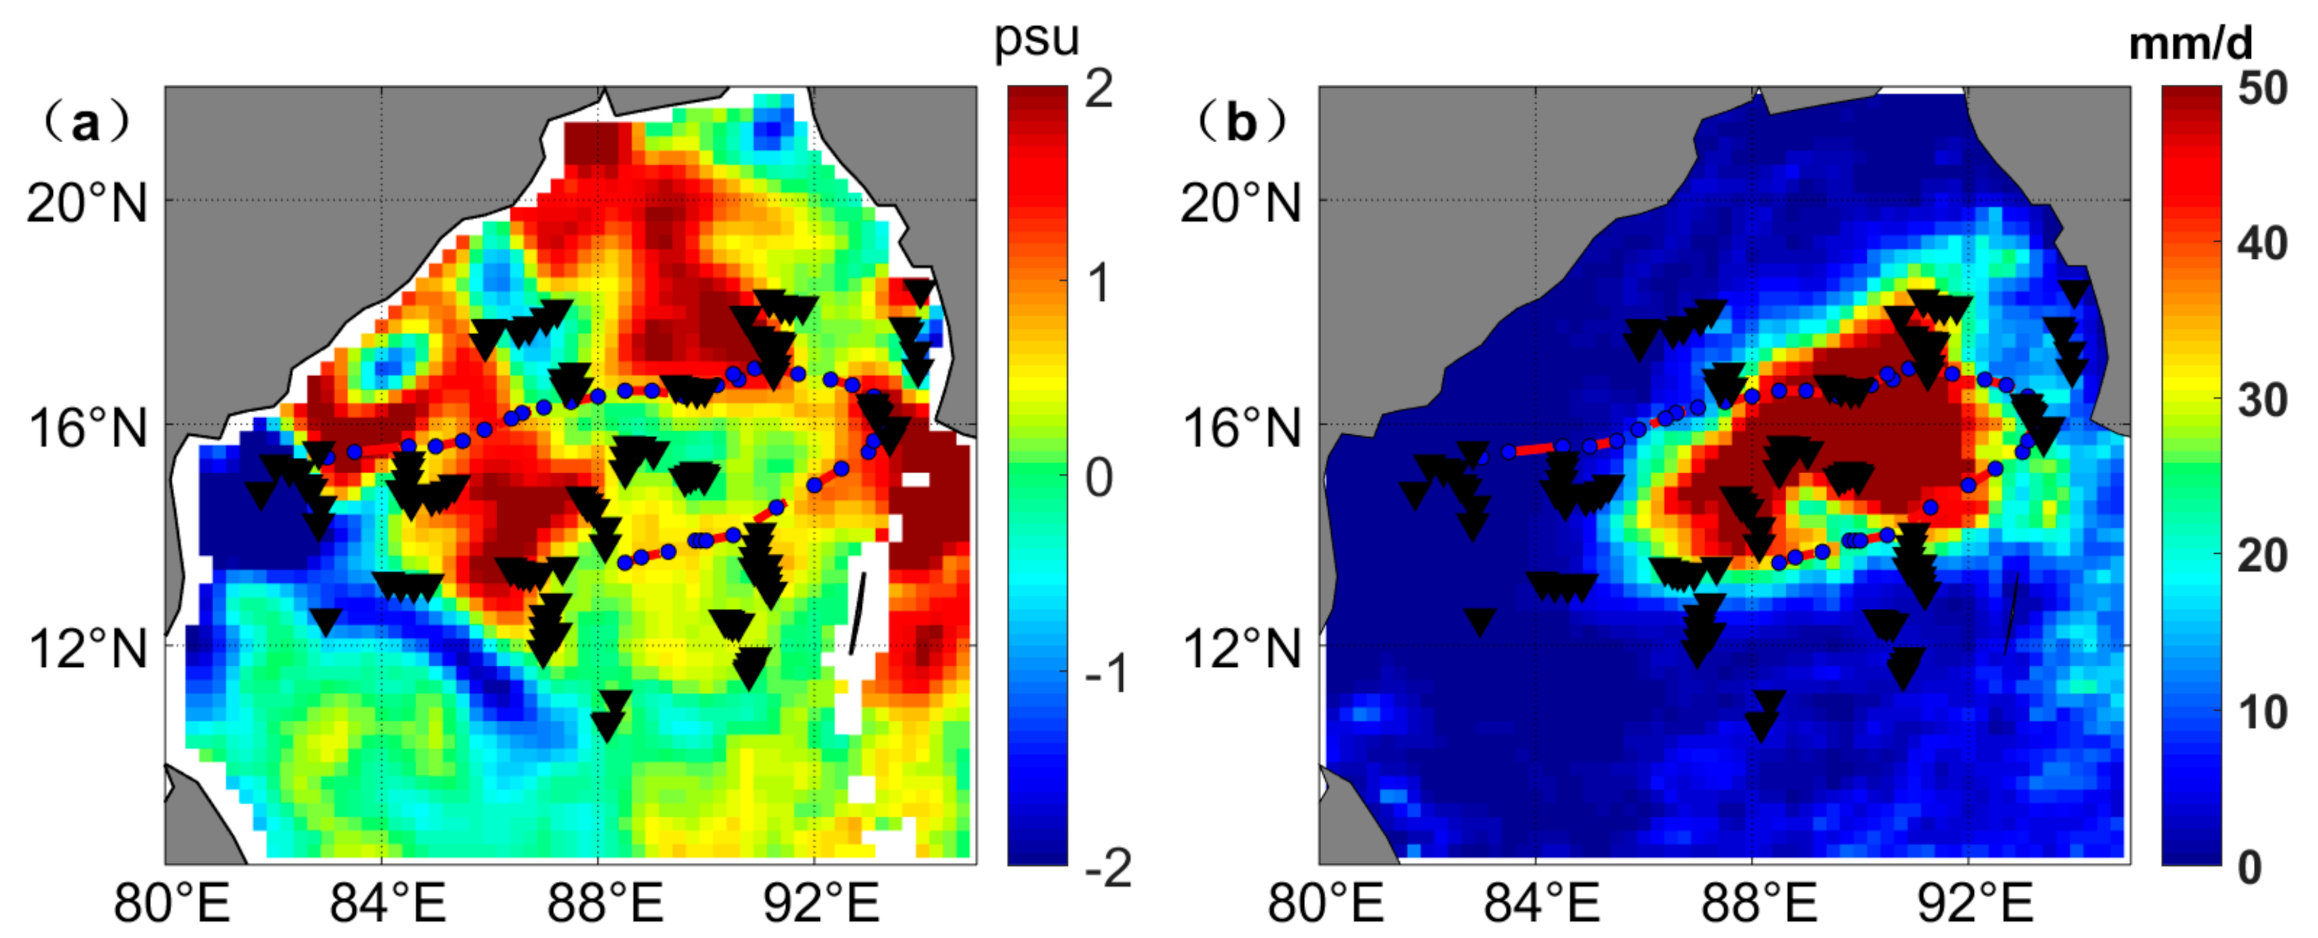
Compared to the changes of SSS after TC Roanu, TC Kyant caused a significant increase in SSS, with the maximum increase of 5.92 psu in the BoB (Figure 8a). TC Kyant brought heavier rainfall (the maximum rainfall was 93.82 mm day−1) on the left side of the TC track in the BoB during 21 October to 25 October 2016 (Figure 8b), which was consistent with previous studies [8,19,22,23]. The areas of small SSS variability were located in the area where TC Kyant induced heavy rainfall. Heavy rainfall led to the SSS decrease, which inhibited the SSS increase owing to the strong mixing and upwelling caused by TC Kyant.
In the cases of TC Roanu and TC Kyant, the cyclonic wind direction probably played an important role in the SSS variability. TC Roanu moved northwestwards and lay over Sri Lanka and adjoining areas of Gulf of Mannar. This movement would bring the runoff waters with low salinity to the offshore areas. Owing to the mixing and upwelling induced by TC, TC Roanu would bring the high salinity waters in the deep layer to the surface waters. Under the combined effect of these two aspects and heavy rain, the SSS of the coastal waters slightly decreased and the offshore waters slightly increased. Under the effect of TC Kyant, TC Kyant firstly moved northeast, which brought the high-salinity waters in the central BoB to the coastal waters to lead the increase of SSS in the coastal waters.
From the remote data of the SSSSMAP and the rainfall, we can conclude that the SSS decrease in the coastal area of BoB mainly was due to the river runoff and heavy rainfall, and the SSS increase in the central BoB was mainly controlled by physical processes (TC-induced mixing and Ekman pumping), even though heavy rainfall occurred. For the other 23 TCs, most could cause the obvious SSS increase in the large areas of central BoB where there is no heavy rainfall. This phenomenon was consistent with a previous study that showed the TC Vardah caused the SSS increase up to 1.5 psu in the BoB [18]. In the coastal waters, however, owing to the large runoff, the SSS slightly increased, and even decreased, during the passage of TCs. The changes of SSS under the TCs are complicated and related to many factors, such as the different wind intensities, wind directions, the speed of TCs, the Ekman pumping transport, the rain, the runoff and so on.

4. Conclusions

This work uses the Argo sea surface salinity (SSSArgo) to evaluate the 8-day sea surface salinity of the new Soil Moisture Active Passive (SMAP) remote sensing satellite (SSSSMAP) before and after 25 tropical cyclones (TCs). Results show that the SSSSMAP had a high correlation with the in situ salinity observations measured by Argo with considerable bias. A stronger negative bias between the SSSSMAP and SSSArgo was observed before the passage of TCs compared to the bias after the passage of TCs. The root-mean-square errors (RMSEs) between the SSSArgo and SSSSMAP before the TCs were larger than the values after the TCs. This mainly was due to the TC-induced strong mixing, which broke the near-surface salinity stratification and unified the near-surface waters. While analyzing two specific TCs Roanu (2016) and Kyant (2016), the results show that the SSSSMAP had high correlations with the SSSArgo either before TCs or after TCs in both coastal and offshore waters in the BoB. The variability of SSS in the BoB during two TCs was mainly determined by TC-induced vertical mixing, Ekman pumping, rainfall and runoff.

Author Contributions

Conceptualization: H.X., D.F., Y.L., D.T.; Formal analysis: R.Y., H.X., S.W.; Funding acquisition: H.X., D.F., D.T.; Investigation: H.X., D.T.; Resources: R.Y., H.X.; Software: R.Y., H.X.; Supervision: D.F., D.T.; Writing—original draft: H.X., R.Y.; Writing—review & editing: H.X., D.F., Y.L., S.W., D.T. All authors have read and agreed to the published version of the manuscript.

Funding

This research was funded by Guangdong Special Support Program (2019BT02H594), scientific research start-up funds of Guangdong Ocean University (R20008), State Key Laboratory of Tropical Oceanography, South China Sea Institute of Oceanology, Chinese Academy of Sciences (LTO2015), Guangdong Key Laboratory of Ocean Remote Sensing (South China Sea Institute of Oceanology, Chinese Academy of Sciences) (2017B030301005-LORS2008).

Acknowledgments

We sincerely thank two anonymous reviewers for their constructive suggestions and insightful comments to improve the quality of the manuscript. Argo data were obtained freely from the International Argo Program at http://www.argodatamgt.org/.

Conflicts of Interest

The authors declare that they have no competing or conflict of interest to influence the work reported in this paper.

References

  1. Chaitanya, A.V.S.; Durand, F.; Mathew, S.; Gopalakrishna, V.V.; Papa, F.; Lengaigne, M.; Vialard, J.; Kranthikumar, C.; Venkatesan, R. Observed year-to-year sea surface salinity variability in the Bay of Bengal during the 2009–2014 period. Ocean Dyn. 2015, 65, 173–186. [Google Scholar] [CrossRef]
  2. Lin, X.; Qiu, Y.; Cha, J.; Guo, X. Assessment of Aquarius sea surface salinity with Argo in the Bay of Bengal. Int. J. Remote Sens. 2019, 40, 8547–8565. [Google Scholar] [CrossRef]
  3. Chowdary, J.S.; Srinivas, G.; Fousiya, T.S.; Parekh, A.; Gnanaseelan, C.; Seo, H.; MacKinnon, J.A. Representation of Bay of Bengal Upper-Ocean Salinity in General Circulation Models. Oceanography 2016, 29, 38–49. [Google Scholar] [CrossRef] [Green Version]
  4. Xu, H.; Tang, D.; Sheng, J.; Liu, Y.; Sui, Y. Study of dissolved oxygen responses to tropical cyclones in the Bay of Bengal based on Argo and satellite observations. Sci. Total Environ. 2019, 659, 912–922. [Google Scholar] [CrossRef] [PubMed]
  5. Neetu, S.; Lengaigne, M.; Vincent, E.M.; Vialard, J.; Madec, G.; Samson, G.; Kumar, M.R.R.; Durand, F. Influence of upper-ocean stratification on tropical cyclone-induced surface cooling in the Bay of Bengal. J. Geophys. Res. Oceans 2012, 117, C12020. [Google Scholar] [CrossRef] [Green Version]
  6. Girishkumar, M.S.; Ravichandran, M. The influences of ENSO on tropical cyclone activity in the Bay of Bengal during October-December. J. Geophys. Res. Oceans 2012, 117, C02033. [Google Scholar] [CrossRef]
  7. Price, J.F. Upper Ocean Response to a Hurricane. J. Phys. Oceanogr. 1981, 11, 153–175. [Google Scholar] [CrossRef] [Green Version]
  8. Lin, I.I. Typhoon-induced phytoplankton blooms and primary productivity increase in the western North Pacific subtropical ocean. J. Geophys. Res. Oceans 2012, 117, C03039. [Google Scholar] [CrossRef]
  9. Chacko, N. Chlorophyll bloom in response to tropical cyclone Hudhud in the Bay of Bengal: Bio-Argo subsurface observations. Deep Sea Res. Part I Oceanogr. Res. Pap. 2017, 124, 66–72. [Google Scholar] [CrossRef]
  10. Xu, H.; Tang, D.; Liu, Y.; Li, Y. Dissolved oxygen responses to tropical cyclones “Wind Pump” on pre-existing cyclonic and anticyclonic eddies in the Bay of Bengal. Mar. Pollut. Bull. 2019, 146, 838–847. [Google Scholar] [CrossRef]
  11. Ye, H.; Sheng, J.; Tang, D.; Siswanto, E.; Kalhoro, M.A.; Sui, Y. Storm-induced changes in pCO2 at the sea surface over the northern South China Sea during Typhoon Wutip. J. Geophys. Res. Oceans 2017, 122, 4761–4778. [Google Scholar] [CrossRef]
  12. Ye, H.; Kalhoro, M.A.; Sun, J.; Tang, D. Chlorophyll blooms induced by tropical cyclone Vardah in the Bay of Bengal. Indian J. Geo-Mar. Sci. 2018, 47, 1383–1390. [Google Scholar]
  13. Shi, Y.; Xie, L.; Li, M.; Wang, L.; Zheng, M.; Shen, Y. Impacts of Typhoon Mujigea on Sea Surface Temperature and Chlorophyll-a Concentration in the Coastal Ocean of Western Guangdong. J. Guangdong Ocean Univ. 2017, 37, 49–58. (In Chinese) [Google Scholar]
  14. Grodsky, S.A.; Reul, N.; Lagerloef, G.; Reverdin, G.; Carton, J.A.; Chapron, B.; Quilfen, Y.; Kudryavtsev, V.N.; Kao, H.-Y. Haline hurricane wake in the Amazon/Orinoco plume: AQUARIUS/SACD and SMOS observations. Geophys. Res. Lett. 2012, 39, L20603. [Google Scholar] [CrossRef] [Green Version]
  15. Reul, N.; Quilfen, Y.; Chapron, B.; Fournier, S.; Kudryavtsev, V.; Sabia, R. Multisensor observations of the Amazon-Orinoco river plume interactions with hurricanes. J. Geophys. Res. Oceans 2014, 119, 8271–8295. [Google Scholar] [CrossRef] [Green Version]
  16. Akhil, V.P.; Vialard, J.; Lengaigne, M.; Keerthi, M.G.; Boutin, J.; Vergely, J.L.; Papa, F. Bay of Bengal Sea surface salinity variability using a decade of improved SMOS re-processing. Remote Sens. Environ. 2020, 248, 111964. [Google Scholar] [CrossRef]
  17. Menezes, V.V. Statistical Assessment of Sea-Surface Salinity from SMAP: Arabian Sea, Bay of Bengal and a Promising Red Sea Application. Remote Sens. 2020, 12, 447. [Google Scholar] [CrossRef] [Green Version]
  18. Chacko, N. Insights into the haline variability induced by cyclone Vardah in the Bay of Bengal using SMAP salinity observations. Remote Sens. Lett. 2018, 9, 1205–1213. [Google Scholar] [CrossRef]
  19. Liu, F.; Zhang, H.; Ming, J.; Zheng, J.; Tian, D.; Chen, D. Importance of Precipitation on the Upper Ocean Salinity Response to Typhoon Kalmaegi (2014). Water 2020, 12, 614. [Google Scholar] [CrossRef] [Green Version]
  20. Ye, H.; Sheng, J.; Tang, D.; Morozov, E.; Kalhoro, M.A.; Wang, S.; Xu, H. Examining the Impact of Tropical Cyclones on Air-Sea CO2 Exchanges in the Bay of Bengal Based on Satellite Data and In Situ Observations. J. Geophys. Res. Oceans 2019, 124, 555–576. [Google Scholar] [CrossRef] [Green Version]
  21. Yin, X.B.; Boutin, J.; Martin, N.; Spurgeon, P. Optimization of L-Band Sea Surface Emissivity Models Deduced from SMOS Data. IEEE Trans. Geosci. Remote Sens. 2012, 50, 1414–1426. [Google Scholar] [CrossRef]
  22. Xu, W.; Jiang, H.; Kang, X. Rainfall asymmetries of tropical cyclones prior to, during, and after making landfall in South China and Southeast United States. Atmos. Res. 2014, 139, 18–26. [Google Scholar] [CrossRef]
  23. Liu, Y.; Tang, D.; Tang, S.; Morozov, E.; Liang, W.; Sui, Y. A case study of Chlorophyll a response to tropical cyclone Wind Pump considering Kuroshio invasion and air-sea heat exchange. Sci. Total Environ. 2020, 741, 140290. [Google Scholar] [CrossRef]
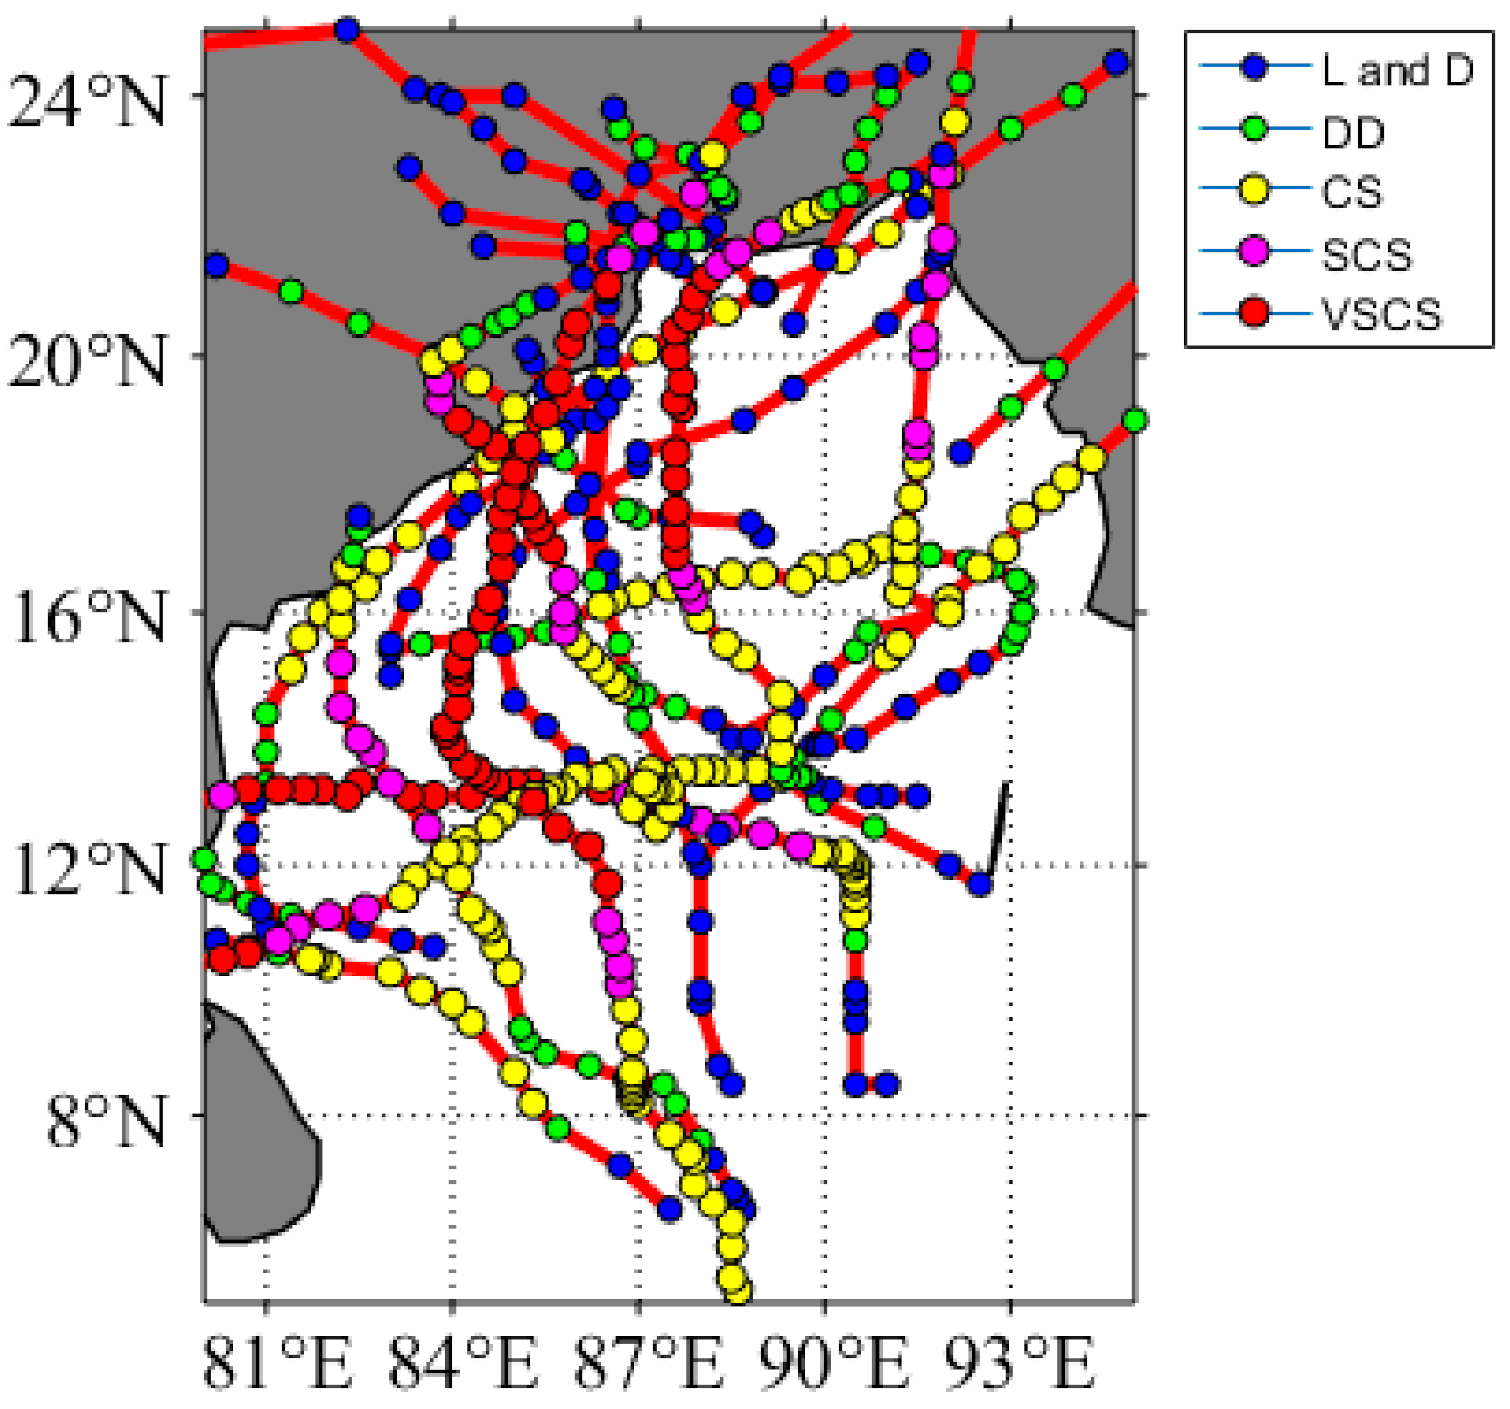
Figure 1. The tracks of 25 tropical cyclones (TCs) in the Bay of Bengal (BoB) from April 2015 to December 2019. The tracks of the 25 TCs are marked by red solid lines. The blue dots represent Low Pressure (L) and Depression (D); green, yellow, purple and red dots represent Deep Depression (DD), Cyclonic storm (CS), Severe Cyclonic Storm (SCS) and Very Severe Cyclonic Storm (VSCS), respectively, according to the India Meteorological Department.
Water 12 02975 g001
Figure 2. The locations of all selected Argo floats in the BoB from 8 days before the passage to 8 days after passage of 25 TCs. (note: the red and blue inverted triangles represent the Argo floats before and after the passage of corresponding TCs respectively).
Water 12 02975 g002
Figure 3. Scatter map of Soil Moisture Active Passive (SMAP) salinity satellite data and Argo salinity data. (a) Correlation before passage; (b) correlation after passage; (c) total correlation (note: the red dots represent the data before the TCs passage and the blue dots represent the data after the TCs passage). Each dot represents collocated data pairs and black lines show a 1:1 relationship. The linear correlation coefficients were significantly different from zero at 95% confidence (p-value).
Water 12 02975 g003
Figure 4. The seasonal SSS distribution based on SMAP from 2015 to 2019 in the BoB: (a) spring (March–May), (b) summer (June–August), (c) autumn (September–November) and (d) winter (December–February).
Water 12 02975 g004
Figure 5. Scatter map of SMAP salinity satellite data and Argo salinity data before and after TC Roanu and TC Kyant (a) before the passage of TC Roanu, (b) after the passage of TC Roanu, (c) before the passage of TC Kyant and (d) after the passage of TC Kyant (note: the red dots represent the data before the passage of TC, the blue dots represent the data after the passage of TC). Each dot represents collocated data pairs, and black lines show a 1:1 relationship.
Water 12 02975 g005
Figure 6. (a) The change of SSS before (8 May to 16 May 2016) and after (17 May to 25 May 2016) TC Roanu. (b) The average rainfall during the passage of TC Roanu (16 May to 18 May 2016) (note: the black inverted triangles represent the Argo floats which provided the salinity data from 8 days before the TC passage to 8 days after the TC passage).
Water 12 02975 g006
Figure 7. Vertical profiles of temperature (T, °C) and salinity (S, psu) in the upper 200 m observed by 2902087 on the left side of the TC track before and after the passage of TC Roanu, respectively. Labels “5–16”, “5–21” and “5–26” stand for 16, 21 and 26 May 2016 respectively.
Water 12 02975 g007
Figure 8. (a) The change of SSS before (12 October to 20 October 2016) and after (21 October to 29 October 2016) TC Kyant. (b) The average rainfall during the passage of TC Kyant (21 October to 25 October 2016) (note: the black inverted triangles represent the Argo floats that provided the salinity data from 8 days before the TC passage to 8 days after the TC passage).
Water 12 02975 g008
Table 1. The basic information about 25 TCs from April 2015 to December 2019 in the BoB.
DateNameThe Minimum Pressure (hpa)
8–10 November 2015Deep Depression996
17–22 May 2016Cyclonic Storm Roanu983
21–28 October 2016Cyclonic Storm Kyant996
2–6 November 2016Depression1000
29 November–2 December 2016Cyclonic Storm Nada1000
6–13 December 2016VSCS Vardah975
15–17 April 2017Cyclonic Storm Maarutha996
28–31 May 2017SCS Mora978
11–13 June 2017Deep Depression988
18–19 July 2017Depression992
9–10 October 2017Land Depression996
19–22 October 2017Depression997
15–17 November 2017Depression1001
6–9 December 2017Deep Depression1002
29–30 May 2018Deep Depression992
10–11 June 2018Depression988
21–23 July 2018Depression989
7–8 August 2018Depression992
6–7 September 2018Deep Depression-
19–22 September 2018Cyclonic Storm Daye992
8–13 October 2018VSCS Titli972
10–19 November 2018VSCS Gaja976
13–18 December 2018SCS Phethai992
26 April–4 May 2019ESCS Fani932
5–11 November 2019VSCS Bulbul976
Table 2. The correlations between SSSArgo and SSSSMAP before and after 25 TCs (note: when the pairs of SSSArgo and SSSSMAP are less than 6, the R2 between the SSSArgo and SSSSMAP is not calculated, and we use “NaN” to represent).
DateNameR2 before TCsR2 after TCs
8–10 November 2015Deep DepressionNaN (3)NaN (5)
17–22 May 2016Cyclonic Storm Roanu0.89 (36)0.86 (42)
21–28 October 2016Cyclonic Storm Kyant0.71 (137)0.75 (113)
2–6 November 2016Depression0.77 (63)0.76 (74)
29 November–2 December 2016Cyclonic Storm Nada0.88 (16)0.87 (18)
6–13 December 2016VSCS Vardah0.71 (128)0.51 (121)
15–17 April 2017Cyclonic Storm Maarutha0.68 (54)0.71 (49)
28–31 May 2017SCS Mora0.4 (46)0.22 (53)
11–13 June 2017Deep DepressionNaN (0)0.76 (15)
18–19 July 2017DepressionNaN (2)NaN (2)
9–10 October 2017Land DepressionNaN (2)NaN (2)
19–22 October 2017Depression0.07 (9)0.72 (8)
15–17 November 2017Depression0.55 (20)0.74 (14)
6–9 December 2017Deep Depression0.71 (49)0.78 (37)
29–30 May 2018Deep DepressionNaN (4)NaN (4)
10–11 June 2018DepressionNaN (2)NaN (1)
21–23 July 2018DepressionNaN (3)NaN (4)
7–8 August 2018DepressionNaN (3)NaN (3)
6–7 September 2018Deep DepressionNaN (2)NaN (2)
19–22 September 2018Cyclonic Storm Daye0.98 (9)0.03 (12)
8–13 October 2018VSCS Titli0.51 (31)0.03 (28)
10–19 November 2018VSCS Gaja0.6 (38)0.76 (38)
13–18 December 2018SCS Phethai0.42 (14)0.02 (12)
26 April–4 May 2019ESCS Fani0.61 (35)0.43 (38)
5–11 November 2019VSCS Bulbul0.73 (31)0.71 (28)
Table 3. Comparison of SMAP salinity (SSSSMAP) and Argo salinity (SSSArgo) data before and after the passage of 25 TCs. STD: standard deviation; Δ: differences between Argo and SMAP observations (SSSSMAP-SSSArgo); bias: mean difference (bias = Δ ¯ ); RMSE: root-mean-square error.
SSSArgo before TCsSSSSMAP before TCsSSSArgo after TCsSSSSMAP after TCsAll SSSArgoAll SSSSMAP
Mean32.3632.1432.7132.5832.5432.36
STD1.251.640.901.231.101.47
Bias−0.23−0.13−0.18
RMSE0.950.750.86
p-value<0.01<0.01<0.01
Publisher’s Note: MDPI stays neutral with regard to jurisdictional claims in published maps and institutional affiliations.