Article

Temporal Dynamics of Fish Assemblages as a Reflection of Policy Shift from Fishing Concession to Co-Management in One of the World’s Largest Tropical Flood Pulse Fisheries

1
Laboratoire Evolution & Diversité Biologique, UMR 5174, Université Paul Sabatier-Toulouse III, 118 routes de Narbonne, CEDEX 4, 31062 Toulouse, France
2
Wonders of the Mekong Project, c/o Inland Fisheries Research and Development Institute, Fisheries Administration, # 186, Preah Norodom Blvd., P.O. Box 582, Phnom Penh 12300, Cambodia
3
Inland Fisheries Research and Development Institute, Fisheries Administration, #186, Preah Norodom Blvd., PO Box 582, Phnom Penh 12300, Cambodia
4
Department of Biology and Global Water Center, University of Nevada, 1664 N. Virginia Street, Reno, NV 89557, USA
5
Mekong River Commission Secretariat, P.O. Box 6101, 184 Fa Ngoum Road, Unit 18, Vientiane 01000, Laos
*
Author to whom correspondence should be addressed.
First co-author; these authors contributed equally to this work.
Water 2020, 12(11), 2974; https://doi.org/10.3390/w12112974
Submission received: 31 July 2020 / Revised: 10 October 2020 / Accepted: 16 October 2020 / Published: 23 October 2020

Abstract

:
Inland fisheries management in Cambodia has undergone two major policy reforms over the last two decades. These reforms led to the abolishment of a century-old commercial fishing lot system in 2012 and the establishment of new fish sanctuary and community fishing areas. However, the status of fisheries and fish assemblages following the reforms is not well understood. Here, we investigated the temporal changes in fish catch weight and fish assemblage structure for the period 1995–2000 before fishing lot abolishment (BLA) and for the period 2012–2015 after the removal of all fishing lots (after lot abolishment-ALA) using time-series fish catch data recorded from the Tonle Sap Lake (TSL), one of the world largest inland fisheries. We found (i) mean catch trends vary seasonally, with stable catch trends during the BLA and decreasing catch trends during the ALA and (ii) significant shifts in fish assemblage composition, notably a shift from large-bodied, migratory, and/or predatory species during the BLA toward more short-distance migratory and/or floodplain, small-bodied species during the ALA. Fishing lot abolishment coincided with substantial changes to floodplain habitats and increases in fishing pressure, threatening TSL fish stocks. Flow alterations caused by dams and climate change may exacerbate the problem. Therefore, to realize the fisheries reform objectives, it is imperative to strengthen the fisheries’ governance and management system, including effective law enforcement, institutional strengthening, improved planning, cooperation, and coordination as well as clearly defined roles and responsibilities among concerned stakeholders at all levels.

1. Introduction

The Tonle Sap Lake (TSL) is the largest inland lake in Southeast Asia [1]. The Tonle Sap basin hosts at least 296 fish species [2], including globally significant populations of several threatened and endangered species such as the Mekong giant catfish (Pangasianodon gigas) and giant carp (Catlocarpio siamensis) [3]. Fish in the TSL system are strongly adapted to the seasonal flood-pulse dynamics, with fish abundance and assemblage structure varying in relation to seasonal hydrology [4,5,6]. For instance, predictable peak fish catch is observed to occur in the early flood period in the upper Cambodian Mekong and during the early flood recession period in the Tonle Sap River (TSR) and TSL [7,8]. The TSL fish catch constituted more than 60% of Cambodia’s total annual production (1995–1998) of inland capture fisheries of 767,000 metric tons [9,10,11]. The lake, therefore, plays a crucial role in the support of nutrition and food security of people in the Lower Mekong Basin, including over 15 million Cambodians. The TSL is considered a world biodiversity hotspot [12] and the Mekong’s main fish factory [6] and has been recognized as a world heritage biosphere reserve by the United Nations Educational, Scientific, and Cultural Organization (UNESCO) since 1997 [13].
In the past, the management and governance of Cambodia’s inland fisheries was centered on the management of fishing lots, a centrally allocated commercial private fishing right rendered by the government to the highest bidder through a formal auction process for the exclusive exploitation of fisheries resources. Fishing lots were usually situated in very productive fishing grounds and are “geographically defined locations on a stretch of the river, river beach, or temporarily flooded land, which may or may not include flooded forest areas” [14]. The fishing lot system, introduced during the pre-colonial period and modified and simplified by the French colonial administration to collect fishing taxes, was basically a government tool to extract a resource rent from inland fisheries [15,16]. While generating national revenues by auctioning the most productive fishing grounds particularly in the TSL and the area south of Phnom Penh, the lot system was also a source of conflict between commercial fishing lot owners and subsistence fishers over their access rights to fishing grounds [16,17,18,19].
For this reason, and to ensure the equity of benefit sharing among resource users, as well as sustain fish diversity and productivity, the Royal Government of Cambodia introduced two major fisheries policy reforms to remove private commercial user rights in favor of community-based fisheries management. The first reform in 2001 led to the abolishment of 56% (540,000 ha) of fishing lot areas in favor of community access [18], and the second reform in 2012 permanently abolished all the commercial fishing lots countrywide [19]. As a result of the reforms, former commercial fishing areas (more than 1 million ha) were divided into newly designated conservation areas (~24%; and currently the conservation areas cover 5.5% of the TSL area [20]) and community-use areas (~76%) for subsistence fishing [19,21].
The permanent removal of the fishing lot system was applauded by international organizations and local civil societies and was perceived by fishers to bring benefits to local communities through better access to more productive fishing grounds [19,22,23]. This event was also perceived to greatly reduce fishing effort and as an essential step toward maintaining fishery productivity and protecting biological diversity [19]. For instance, the former 38 fishing lots in the TSL were believed to have near-complete removal of fish seasonally from about 20% of the TSL area for decades [19]. Apart from being a source of conflict in the inland fisheries sector, the fishing lot system was also blamed for decades of indiscriminate fishing through the introduction of destructive fishing methods such as dry-pumping of fishing areas, use of electrofishing, use of brush parks to attract fish for exploitation, use of enormous nets, use of nets with excessively small mesh size, trawling (sweeping) river beds, and sub-leasing fishing areas [14,16,24,25,26,27]. Alternatively, it was expected that the removal of Cambodian fishing lots would greatly reduce fishing effort and pressure on the Tonle Sap fisheries [19]. However, the evidence related to the quantitative impact of Cambodian fisheries reform on inland fish biodiversity and productivity remains unclear.
To date, much research has focused on fisheries reforms on the TSL fisheries from management, governance, and policy perspectives [17,18,19,22,28,29,30,31,32,33,34]. None of the studies has quantitatively assessed the temporal trends in fish catch weight and temporal changes in fish assemblages and their species composition before and after the reforms took effect. Our study, therefore, uniquely contributes to the better understanding of fish catch weights and assemblage dynamics in the TSL before and after the abolishment of this unique century-old fishing lot system.
Overall, the study investigated the temporal changes in fish catch (measured using weights of individual fish) and fish assemblage structure in the TSL for the period 1995–2000 before fishing lot abolishment (BLA) and for the period 2012–2015 after the removal of all fishing lots (ALA). We present three related hypotheses: first, we expected that, by reducing fishing effort as a result of fishing lot abolishment in the TSL, there will be seasonal changes in fish catch weight with stable or increasing catch trends particularly for the ALA period 2012–2015; second, we expected that there will be changes in assemblage composition between the two study periods given species-specific vulnerability to fishing pressure (i.e., changes in fishing effort) and other human-induced disturbances; third, and closely linked to the second hypothesis, we expected that abundance trends will be related to species-specific morphological and biological traits because these traits inform the ability of species to recover after disturbances, e.g., endangered, long-lived, large-bodied, and long-distance migrants are more vulnerable to overfishing or species loss than small-bodied, short-lived species [7,35]. To test these hypotheses, we used monthly fish catch weight data of stationary gillnets monitored by the Mekong River Commission (MRC) before (1995–2000) and after (2012–2015) the TSL fisheries reforms. In addition, we also used fish morphological and biological trait data obtained from FishBase and existing literature to examine whether the species changes are related to specific traits.

2. Materials and Methods

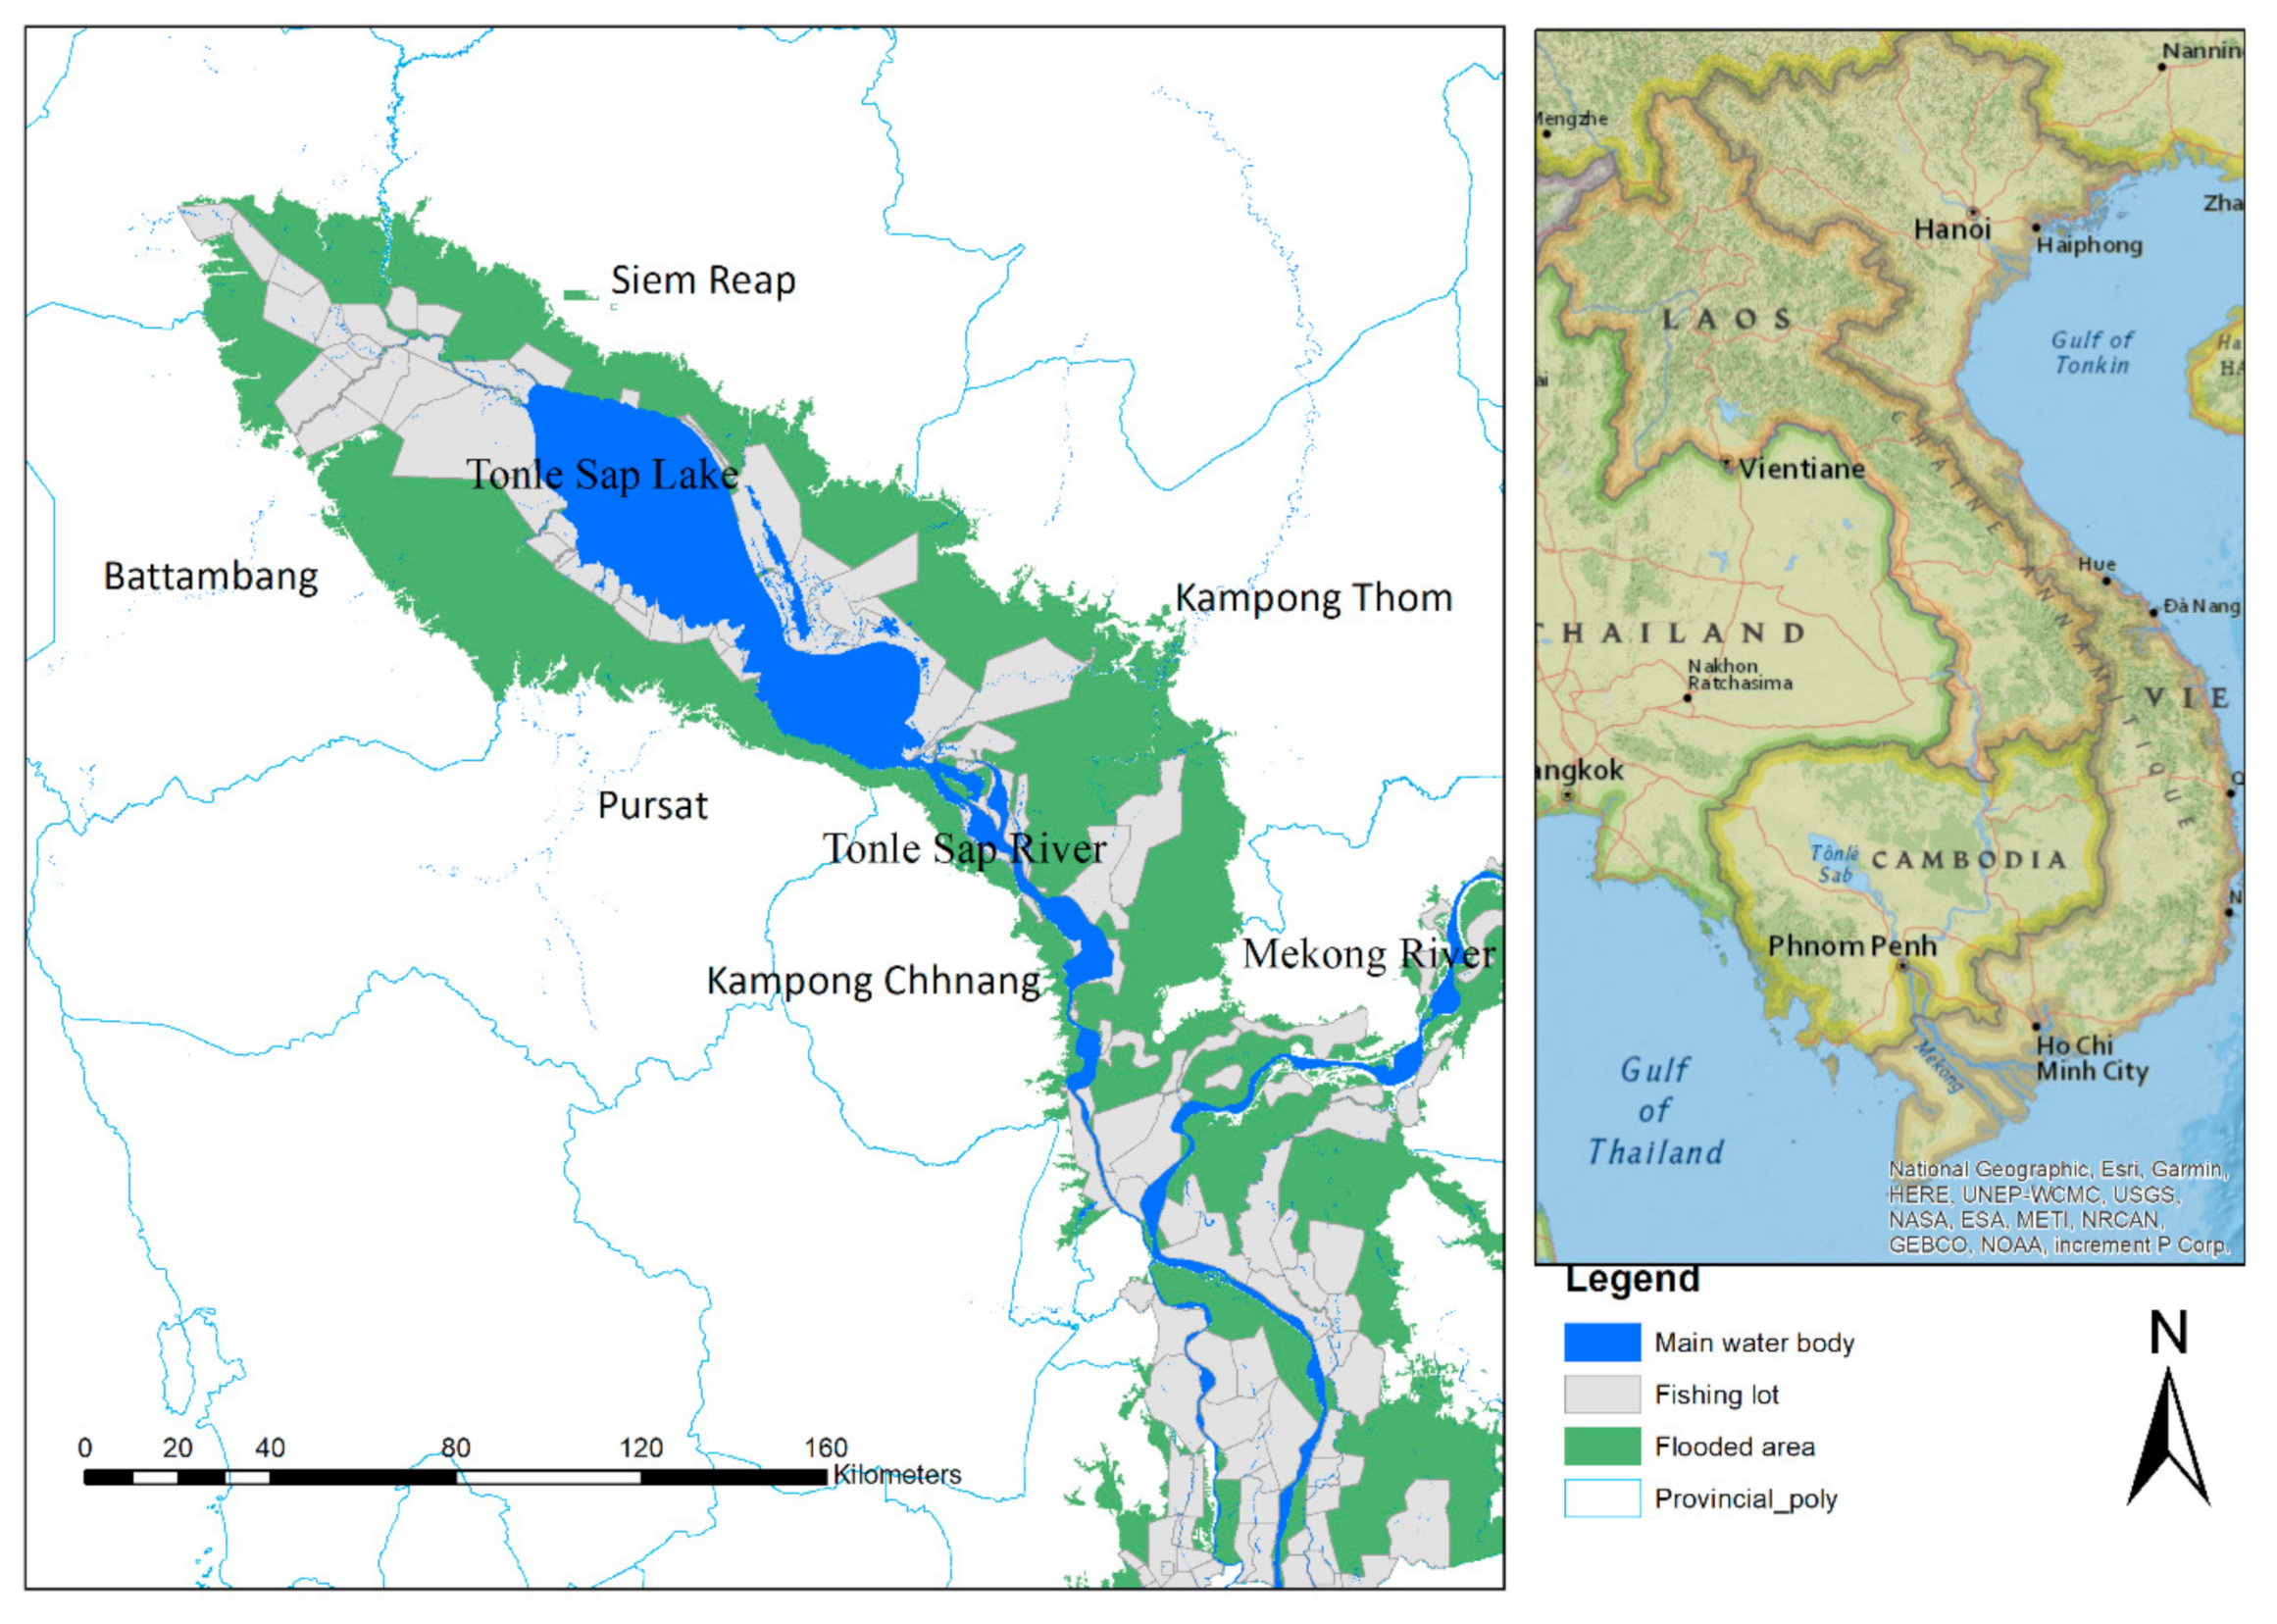
2.1. Sites Description

The study was carried out in the TSL located in northwest Cambodia (Figure 1). The TSL is the largest floodplain of the Mekong Basin and an integral part of the history, culture, ecology, and economics of Southeast Asia [10,36]. The Tonle Sap catchment represents approximately 11% (or 85,790 km2) of the Mekong River Basin [37]. The TSL is connected to the Mekong River by the TSR. The TSL, the TSR, and their tributaries form a large natural ecosystem called the Tonle Sap Ecosystem (TSE) [38]. The TSE hydrological flows are influenced by flood waters of the Mekong River driven by the Southeast Asia tropical monsoon, and this creates a complex flood-pulse ecosystem [1,39]. The TSE is a tropical flood-pulse system due to its seasonal and predictable periodicity in hydrological flows [8]. In the wet season (May–October), the water flows into the TSL through the TSR when water levels in the Mekong River rise faster than those in the TSL, and during the dry season (November–April), the water flow reverses and moves from the TSL to the Mekong River through the TSR, essentially draining the TSE [1]. Consequently, the water levels highly vary between seasons with a minimum depth of about half a meter in April and a maximum depth of up to almost 10 m in late September or early October, making the lake expand its size from about 3500 km2 in the dry season to around 14,500 km2 in the wet season [1,40]. Moreover, the water volume stored in the lake ranges from 1–2 billion m3 in the dry season up to 50–80 billion m3 in the flood season [1]. Water sources for the TSL include the Mekong River (54%), the lake’s tributaries (34%), and precipitation (12.5%) [39]. Mean discharge at the TSR was estimated at about 83.1 and 81.9 billion m3 during the inflow and outflow periods, respectively [39]. Inundation of the vast floodplains during the inflow period enables many fish species to gain temporary access to a large area for breeding, rearing, and foraging, driving an enormous production of fish. Furthermore, the flow-pulse into the lake from the Mekong River contributed approximately 70% to the average annual sediment load of 7 million tons [41,42]. The sediment contains paramount nutrient resources (e.g., phosphorus and nitrate contents) and other materials that support primary production and food webs in the TSE [41,43,44].

2.2. Data Collection

This study used monthly fish catch weight data (kg) from stationary gillnets that were monitored before (1995–2000) and after (2012–2015) fishing lot abolishment around the TSL (Figure 1). The fish catch weight data used in this study were provided by the Fisheries Programme of the Mekong River Commission (MRC) in collaboration with the Inland Fisheries Research and Development Institute (IFReDI) of the Cambodian Department of Fisheries (currently known as the Fisheries Administration [FiA]) and the Tonle Sap Authority with financial support by the Danish International Development Agency (DANIDA) [10,45,46]. Our focus here was to examine the catch weight trends and compare fish assemblage composition patterns between the two periods, i.e., before and after the fishing lot removal. We used only the datasets that contained comparable monitoring methods and fishing effort between the datasets, collected for the two study periods, i.e., stationary gillnets with mesh sizes ranging between 2.5 and 7 cm before the fishing lot abolishment, and stationary gillnets with mesh sizes ranging from 2 to 6.5 cm after the fishing lot abolishment period. Standard sampling protocols were applied in each monitoring period, during BLA [47] and ALA [46], which allows the temporal comparison of catch weight within each monitoring period.
From 1995 to 2000, the fish catch weight data were assessed monthly by species in the five provinces around the TSL. The catch weight data were then summed by species, by month, and by gear to obtain the monthly total catch by species for the TSL. After fishing lot abolishment, data collection on catch weight of the stationary gillnet was carried out on a daily basis in the five provinces around the TSL from January 2012 to December 2015, and these were later aggregated into monthly catch weights to be comparable with the catch weight surveyed from 1995 to 2000. The data for the two periods were collected by provincial fisheries officers and local fishers who were trained in sampling and subsampling techniques, fish identification, and field data recording [45,48]. We assumed that fishers caught as many fishes as possible because fisheries in the region are very important for food security and are characterized by indiscriminate fishing, where fishes are exploited across habitats, season, species, and sizes [7,49,50]. Field data collectors were regularly (on a monthly to quarterly basis) visited by research officers from the IFReDI/FiA and the MRC to provide technical assistance and to check and verify the correctness and completeness of the collected data registered on the field data forms and bring those data back to the IFReDI/FiA for data entry, processing, and analysis. Fish species lists and identification guides were based on [51,52] and the species names were then updated based on [53].
In addition to the catch data, we collected fish morphological (maximum length) and biological (trophic level, position in the water column, and migration) trait data for this study from FishBase [54] and from existing literature (e.g., [52,55,56]). The summary of fish morphological and biological traits is given in Supplementary Material Table S1.

2.3. Data Preparation

In this study, we used the most common 55 fish species recorded in the stationary gillnet data from 1994/1995 to 1999/2000 before the BLA, and these same 55 species were also extracted from the stationary gillnet monitoring data after the ALA in the TSL. Similarly, to reduce the effect of sampling efforts on the gillnet size selectivity and total catch weight between the two periods, (i) we used only the monthly catch weight by species from gillnet mesh sizes between 2.5 and 7 cm during the BLA, and between 2 and 6.5 cm during the ALA, (ii) we transformed the time-series monthly catch weight data between the two periods into relative catch weight for the principal component analysis (PCA), and (iii) we scaled the monthly catch weight between 0 and 1 for each period separately for the temporal trend analysis. This allowed for comparisons to be made on fish assemblage composition and structure as well as for catch trend visualizations between the two study periods.

2.4. Statistical Analyses

First, the zero–one scale (also known as min–max scaling), a method that scaled the data from zero (minimum) to one (maximum), was performed for each monthly average fish catch dataset separately using the formula: (x − minimum(x))/(maximum(x) − minimum(x)), where x represents the original time-series catch dataset. This normalized method allowed the catch datasets in the two study periods to get the same-scale catch for trends visualization in these two periods. Later, simple moving average (SMA), a time-series smoothing method, was applied on the zero–one scale time-series datasets to demonstrate the temporal trends in the average monthly fish catch weight over the two study periods. Additionally, Mann–Whitney test was applied to compare the yearly maximum water level to basically see whether there was a significant change in the maximum flow in the TSE between the two study periods.
Then, PCA was performed to visualize the difference in distribution patterns of fish assemblage composition between the BLA and ALA. PCA biplot was performed using the “factorextra” package [57] and the “FactoMineR” package [58].
Analysis of similarity (ANOSIM) [59] was used to test for significant differences in fish assemblage composition between the BLA and ALA. ANOSIM is a nonparametric multivariate procedure broadly analogous to analysis of variance (ANOVA), widely used for testing whether or not groups of sites are statistically significantly different with respect to their relative similarities in the community composition [59]. ANOSIM was performed on Bray–Curtis dissimilarities matrix calculated among samples [60]. The ANOSIM result was assessed according to a p-value (significant difference between groups) and the statistic-R value, which provides a measure of effect size [59]. A statistic-R value ranges from −1 to +1 and is based on the rank similarities of samples within versus among a priori group. A large R-value (close to 1) is indicative of complete separation between groups, while a small value (close to 0) implies little or no separation, and R-values below zero suggest that dissimilarities are greater within groups than between groups [61]. We conducted 999 random permutations to assess statistical significance.
Then, we further applied the similarity percentages (SIMPER) [59] to assess which species most significantly contributed to the dissimilarity of the assemblage composition between the BLA and ALA. SIMPER identifies which fish species made the highest contribution to the differences between the two groups in a Bray–Curtis dissimilarity matrix [61]. The contribution of each species to Bray–Curtis measurement was calculated after square root transformation, and then the species were ranked into two separated groups, percentage and cumulative percentage [61]. SIMPER analysis produces average contribution from taxa to overall dissimilarity between two groups (i.e., a & b) (average), standard deviation of contribution (sd), average to sd ratio (ratio), average abundances per group (av.a & av.b), and ordered cumulative contribution (cum) [59,61]. We conducted 99 random permutations to assess statistical significance.
Finally, a principal component analysis (PCA) was computed to relate the status of fish species (i.e., decreasing, increasing or stable) to their morphological and biological traits (see Supplementary Material Table S1). This analysis allows us to summarize information about how changes were related to specific groups or fish functional traits.
We selected the 95% confidence interval as a significance criterion for ANOSIM and SIMPER. Here, ANOSIM, SIMPER, and PCA were performed using the “vegan” package [60]. The SMA was carried out using the “ggplot2” package [62]. All statistical analyses were performed using R program v.3.3.3 for Windows statistical software package (http://www.r-project.org) [63].

3. Results

3.1. Temporal Changes in Monthly Catch Weight

The results from our study showed that there was a strong seasonal variation in the monthly catch weight for the 1995–2000 period, and such a seasonal variation was relatively less pronounced for the 2012–2015 period (Figure 2). The trend in monthly catch weight was relatively stable for the period 1990–2000 and was declining for the period 2012–2015 (Figure 2). We also found that the maximum water levels were not significantly different between the two study periods (Mann–Whitney test, W = 14.5, p-value = 0.753; Supplementary Material Figure S1).

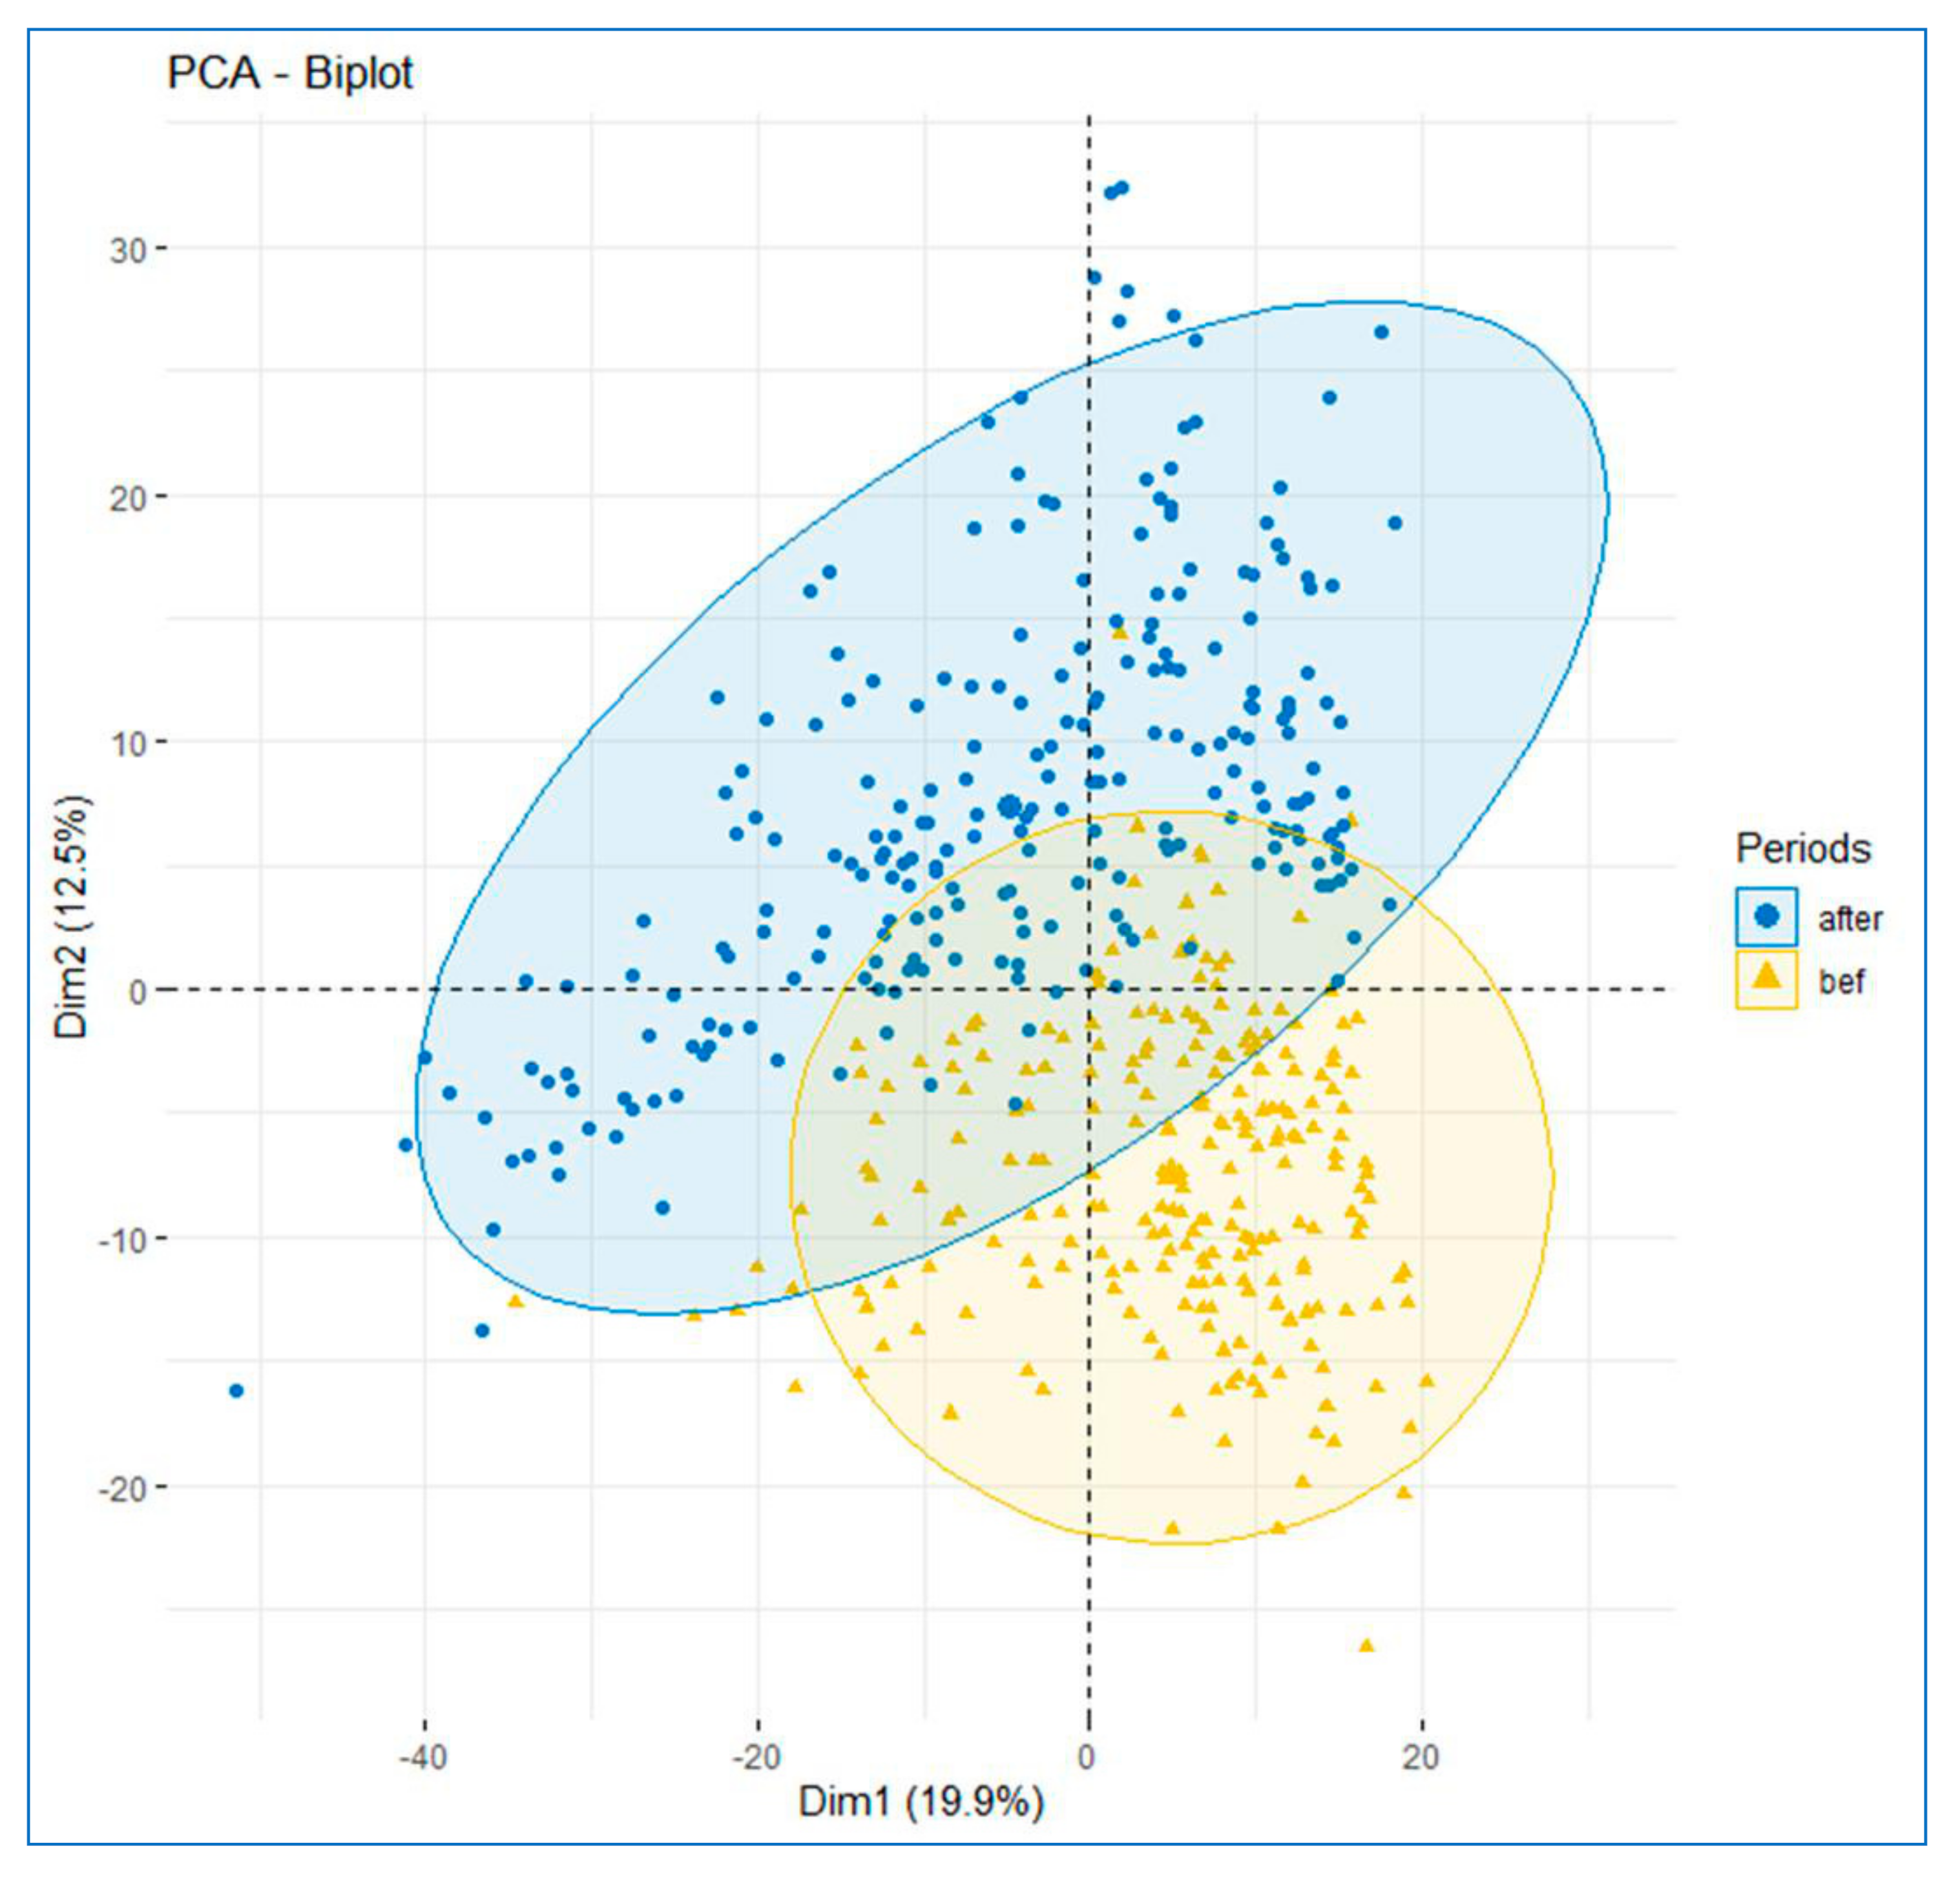
3.2. Temporal Changes in Assemblage Composition and Species’ Catch Weight

The PCA biplot performed on fish’s relative catch weights highlighted the dissimilarity in fish assemblage composition between the two periods: BLA and ALA (Figure 3). The first two axes of the PCA accounted for 32.40% of the total variance (19.90% and 12.5%, respectively; see also the Supplementary Material Figure S2). Despite some similarities in the assemblage composition found between the BLA and ALA, the analysis of similarity (ANOSIM) revealed a significant difference (global RANOSIM = 0.377, p-value = 0.001).
SIMPER analysis showed the species that contributed to the change between the BLA and ALA (Table 1). Overall, some species had a stable (N) or increasing trend (+), whereas others had a decreasing trend (−) between the two periods. Some common species with significantly increasing trends in terms of relative catch were Gymnostomus spp., Puntioplites proctozystron, Labiobarbus siamensis, Paralaubuca typus, Mystus spp., Osteochilus vittatus, Notopterus notopterus, Clarias spp., Anabas testudineus, etc.; whereas, species with decreasing trends included Osteochilus melanopleura, Pangasianodon hypophthalmus, Cirrhinus microlepis, Belodontichthys truncatus, Chitala ornata, Wallago attu, etc. Species with stable trends comprised Parambassis wolffii, Parambassis apogonoides, Amblyrhynchichthys micracanthus, Probarbus jullieni, and Channa lucius, etc. (Table 1).

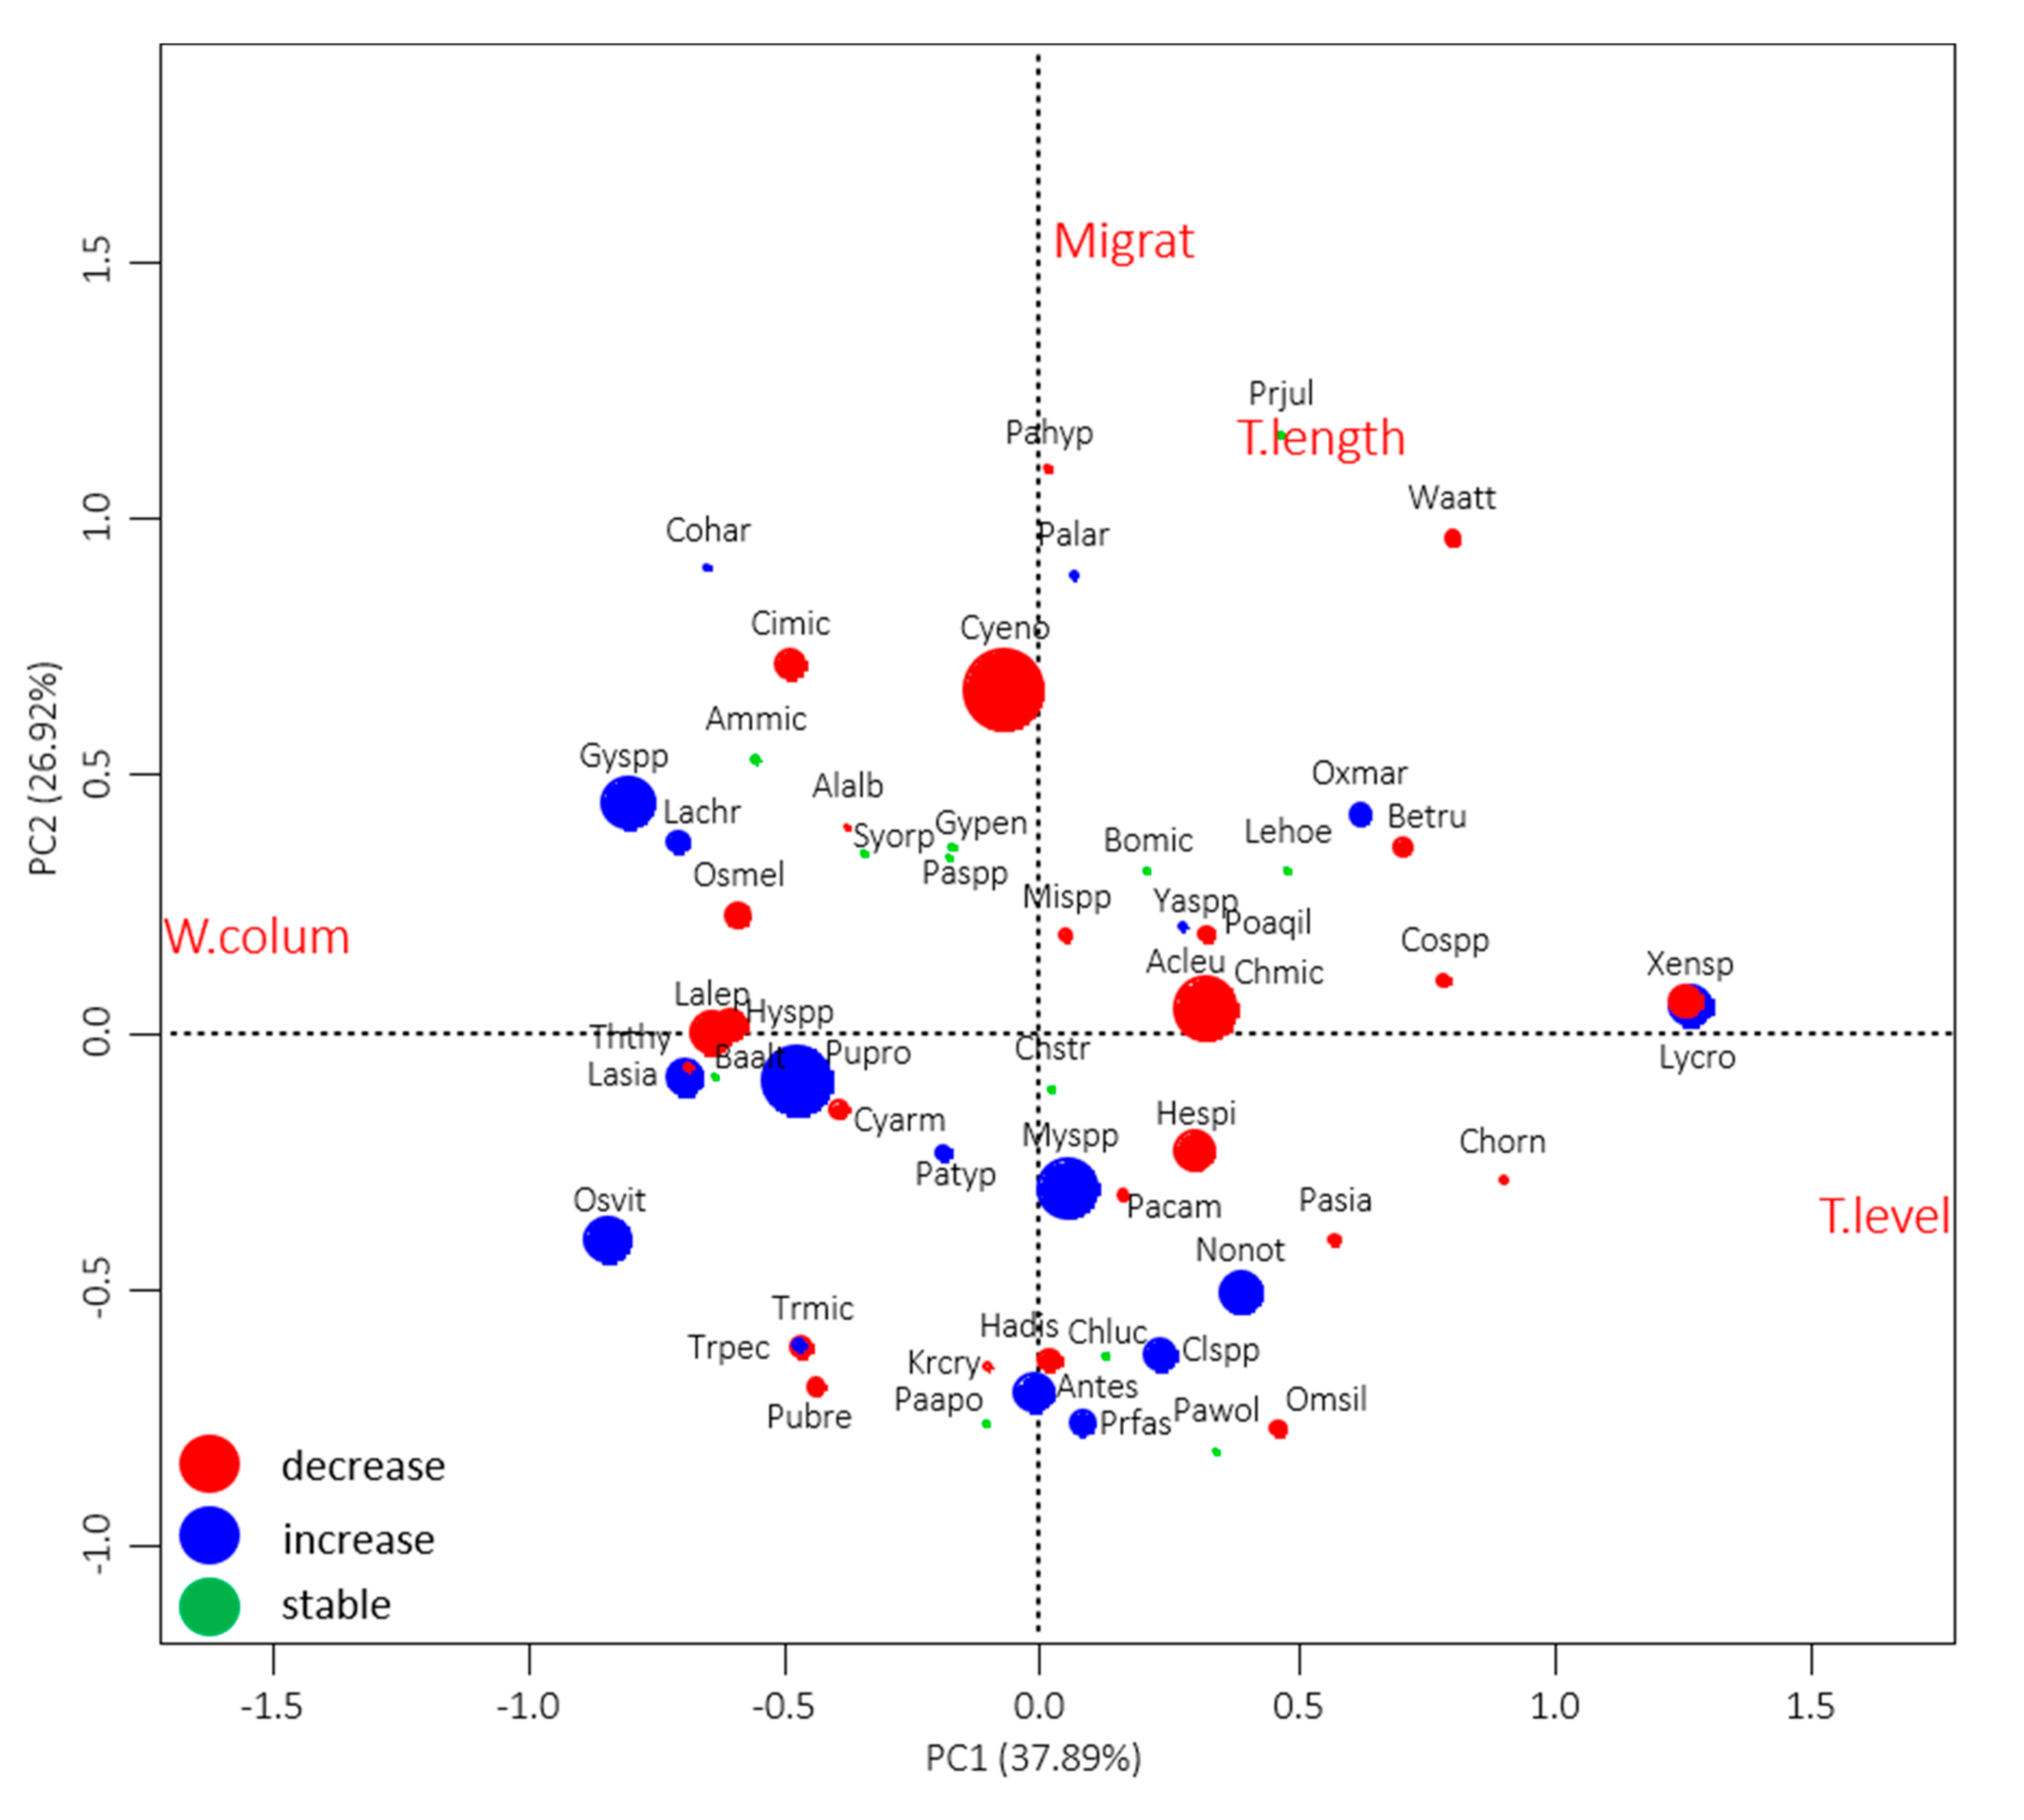
3.3. Relationship of Fish Species’ Status with Their Traits

The PCA biplot (Figure 4) demonstrated the association of species’ status, i.e., increasing, stable, or decreasing trends with fish morphological and biological traits. Overall, the first two axes of the PCA explained 64.81% of the total variance (37.89% and 26.92%, respectively; see also the Supplementary Material Figure S3). As can be seen from the biplot, species with increasing trends (blue solid points) were positively associated with species preferring a benthopelagic habitat, i.e., species living and feeding on the bottom to near the surface in the water column, and negatively correlated with the trophic level (PCA axis 1). This group of species often represents small-bodied, low tropic level, opportunistic feeders. These species included Gymnostomus spp. (Gyspp), Labiobarbus siamensis (Lasia), Puntioplites proctozystron (Pupro), and Osteochilus vittatus (Osvit). Moreover, increasing trends appeared to be linked to species with short-distance migrations, e.g., floodplain residents (such as Clarias spp. (Clspp), Anabas testudineus (Antes)), and species that do lateral migrations between floodplains and rivers or local tributaries such as Mystus spp. (Myspp), Notopterus notopterus (Nonot), and Pristolepis fasciata (Prfas) (PCA axis 1, 2). In contrast, declining trends (red solid points) were more associated with medium- and large-bodied, long-distance migratory species, i.e., species that inhabit river channels for the main part of the year, migrate into the flooded plains during flooding seasons for rearing and feeding, and return to the main river channel in the early dry season for dry season refuge and spawning. These species included Cyclocheilos enoplos (Cyeno), Cirrhinus microlepis (Cimic), Pangasianodon hypophthalmus (Pahyp), and Belodontichthys truncatus (Betru). Furthermore, species with decreasing trends tended to be connected with predatory species such as Channa micropeltes (Chmic), Wallago attu (Waatt), Chitala ornata (Chorn), and Lycothrissa crocodilus (Lycro). Finally, species with stable trends (green solid points) were spread-out in the PCA two-dimensional space (Figure 4).

4. Discussion

We found that the monthly mean catch weight trends varied seasonally, with a stable catch trend observed during the BLA and a decreasing catch trend discerned during the ALA (Figure 2). As expected, the result supported seasonal variation (albeit being weaker for the ALA period) in catch weight for both study periods with different catch trends. Surprisingly, however, contrary to what we expected in our first hypothesis, we found decreasing trends in the fish catch weight of multi-species fisheries in the TSL during the ALA although all commercial, large-scale fishing lots were abolished in 2012. In addition, we also found significant changes in the fish assemblage composition between the BLA and ALA, and these changes are linked to fish morphological and biological traits. These results support our second and third hypotheses that there was a significant shift in the assemblage composition, with relatively fewer long-distance migratory, large-bodied, and/or predatory fishes and more short-distance migratory and/or floodplain, small-bodied species (Figure 3 and Figure 4, and Table 1).
The stronger seasonal variation of the monthly catches observed during the BLA was indeed a characteristic of tropical flood-pulse fishery when overall environmental conditions were still naturally stable, and that is generally expected for the tropical inland (unregulated) flood-pulse fisheries where the life cycle of many fishes, e.g., seasonal migrations between critical habitats, is fine-tuned with the regular seasonal change of the system’s environment conditions, e.g., hydrologic cycle. Our results are indeed in line with previous studies indicating annual fish peak migrations in the lower Mekong system occurring during the transition period of rising and falling water levels [8,56,64]. Specifically, in the lower Mekong River below the geological fault line at the Khone Falls close to the Laos–Cambodia border, riverine fishes migrate downstream from the upper Cambodian Mekong to the rearing habitats of the Tonle Sap floodplain and the Mekong delta in around May–August and, in the TSR, months with the highest peak fish abundance predictably take place in December and January during falling water levels when many migratory species return from the Tonle Sap floodplains to the Mekong River [6,7,15,36,65]. In contrast, the relatively weaker seasonal variation in the fish catch weight found during the ALA period could reflect disturbed fish assemblages that likely respond to changes in the fisheries management regime and environmental conditions in the TSE.
We also found that trends in the monthly catch weight of multi-species fisheries declined during the ALA. While we do not have fishery-independent data to confirm our datasets, our results are consistent with recent studies that indicate significant declines in fish catchability following the fisheries reforms [28] and in the biological diversity (i.e., evenness index) and catch weight of many fish species utilizing the Tonle Sap floodplains particularly the large-bodied, slower growing, riverine fishes that tend to feed high in the trophic position [7,66]. Moreover, the declines in catches are primarily explained by intensive fishing pressure and unsustainable fishing practices, which employ a variety of fishing gears to exploit fish across seasons, habitats, species, and sizes [7,49,66,67]. After fishing lots were removed, the system was opened to the public and local communities with insufficient institutional arrangements, e.g., effective law enforcement [17,18,29,31], which likely by default triggered the situation of a “tragedy of the commons” for the TSL natural resources including fisheries [68]. In other words, fishing lot abolishment created an open-access situation, where fishers harvested as much as possible, on the “first come, first served principle” without considering the collective negative effects on fish stocks, resulting in fishing down the food web or a recent indiscriminate fishing effect [7,49]. A similar situation has been described for many inland lakes around the world, leading to what has been termed “the tragedy of the inland lakes” [69]. Moreover, the declines are in part explained by the floodplain habitat alteration because substantial changes in land cover were observed recently during the ALA period, (e.g., decrease in scrubland, grassland, and flooded forest cover but increase in agricultural land), and flooded forest areas were shifted to woody savannah, grassland, and permanent wetland [31,70,71,72]. By contrast, land cover did not change significantly during the BLA period [71], suggesting that fishing lot removal was likely a major factor influencing land cover change in the TSE. We also found increases in catch weight of some small-bodied species such as Gymnostomus spp., Labiobarbus siamensis, Osteochilus vittatus, Anabas testudineus, and Mystus spp. during the ALA. Such patterns could be because of the decline in the large-bodied or predatory fishes, which may lead to the reduction in predation and higher probability of survival for prey or small-bodied species. Subsequently, this causes top–down effects on the food web and fish community structure where large-bodied, higher trophic level fishes are replaced by small-bodied, lower trophic level fishes [50,73,74,75,76]. Moreover, these small-bodied fish species are less likely impacted by intensive fishing pressure as they mature and reproduce quickly, tend to be opportunist feeders or generalists, and possess general habitat preferences as well as contain functionally redundant traits that ensure recovery after disturbances [7,35,54,56].
Furthermore, contrasting to the non-government, civil society, and government organization’s expectation, the intensive fishing pressure found during the ALA was the result of an increase in the number of fishers and widespread use of highly effective fishing methods and illegal fishing practices such as the use of different techniques of electrofishing, mosquito netting with fences, trawlers, motorized push nets, and dry-pumping that have been observed to become widespread both in space (i.e., open access and conservation areas) and time (i.e., close and open fishing seasons) particularly following the two waves of fisheries policy reforms. For instance, indiscriminate fishing with the introduction of destructive fishing methods was observed to be commonplace particularly during the transition period following the first fisheries policy reform in 2001, when more than half of the former private fishing lot areas were transferred to be co-managed by local communities [18,34]. The situation became more severe when all fisheries inspectors at all levels were also withdrawn from field duty stations as part of this first reform policy [18]. Fish and other resources in the TSL during the period, once regulated through private patrols by fishing lot operators (who regulated rights to fishing grounds, gear type and gear dimension, fishing season, stocking indigenous wild breeding fishes for the next fishing season as well as protection of flooded forest), soon became unregulated and were effectively opened for all [18,34,77]. Fishers, both ordinary and opportunistic, poured into the fishing business, and fish stocks in the TSL were indiscriminately and heavily exploited, for a relatively short time period, with very little or no room for replenishment [18,34,77]. A similar situation also took place for flooded forests and shrubland (i.e., rearing, breeding, and feeding shelters for fish) that were previously protected as part of fishing lot management; after the reforms, flooded forests were cut and cleared for various purposes, especially to expand agricultural land including dry-season rice farming [34,77].
Such intensive pressures on fish stocks have been prolonged following the second wave of fisheries reform in 2012 when all fishing lots were eliminated from the TSL and throughout Cambodia. Our results indeed strengthen the findings of many qualitative studies assessing the impacts of the two fisheries post-reform policies, consistently indicating that, while the reforms provided more access rights to small-scale fishers, the positive impacts of reforms on fish stocks in the TSL remain elusive. Fishing pressure, clearance of flooded forests, and industrial crop farming practices are indeed intensifying particularly in the TSL, threatening the TSL fish diversity and productivity [17,22,23,29,31,72,78]. These challenges were mainly attributed to the lack of effective legal and institutional instruments to implement the new fisheries policy and poor governance, e.g., lack of inter-sectoral coordination and cooperation among the government line agencies and other stakeholders at multiple levels, lack of knowledge on co-management regimes, and other basic means including funds to implement the policy, limited decentralization of roles and responsibilities from national to sub-national and community levels, overlapping stakeholders’ roles and responsibilities among the government agencies to manage the TSL natural resources, pervasive illegal fishing activities, and strong livelihoods dependency of the local communities on fisheries, etc. [18,31,34,77,79,80,81]. These pressing challenges are also recognized in the update Strategic Planning Framework for Fisheries 2015–2024 of the Fisheries Administration of the Ministry of Agriculture, Forestry, and Fisheries [82].
There are many other human-induced disturbances, including hydropower dams and climate change, that threaten the basin ecosystems and fish stocks through modifying timing, magnitude, and frequencies of flow seasonality and predictability [78,83]. Changes in flow have been demonstrated to have significant effects on overall fisheries productivity particularly in the lower Mekong system including the TSL [36,84,85,86,87]. Flow alterations caused by anthropogenic activities have degraded fish biological diversity, modifying the seasonal and inter-annual dynamics of fish assemblages, which is likely to have adverse effects on fisheries productivity in the lower Mekong system [8,56,88]. Such significant flow changes were also observed during the ALA period, i.e., the maximum seasonal flows recorded at Kampong Loung Hydrological Station on the TSL was 9.9, 7.5, 9.0, 7.3, and 5.3 m in 2011, 2012, 2013, 2014, and 2015, respectively [4]. Such flow changes could also be a contributing factor to the changes in fish catch weight observed during the ALA. For instance, the very low flow in 2015 may affect fish spawning success, fish dispersal ability for rearing and feeding habitats, and food availability as fewer areas were inundated, and fish also were more prone to being trapped or captured because they were concentrated in only deeper areas of water bodies. These likely diminished fisheries productivity at both local (TSL) and regional spatiotemporal scales.

5. Conclusions

While the fisheries policy reforms may have benefited small-scale fishers through more access rights to larger fishing grounds, the objectives of the fisheries reforms related to maintaining fish biodiversity and fishery productivity in the TSL have not been realized, since the overall catch trend from the multi-species assemblage from this region is declining. We report declining trends for large-bodied, migratory, and/or predatory species with late maturity, while the catch trend of some small-bodied, faster-growing species that mature earlier are showing proportionally increasing trends. Such trait-based temporal changes of the stocks in the multi-species fisheries are an indication of overfishing. This conclusion supports recent research, indicating that governance issues, leading to intensive fishing pressure and substantial changes in floodplain habitats, are a major threat to the TSL fish stocks. Other factors such as the conversion of flooded forest into agricultural land, agricultural intensification, and flow alterations caused by human actions such as dams and climate change are among the key contributing factors, negatively impacting fish stocks, and are indeed exacerbating the problems of overfishing [89,90,91,92]. Therefore, to realize the fisheries reform objectives, it is imperative to have a clear, coherent, and implementable legal framework for effectively enforcing fisheries law in both space and time, improving fisheries planning, cooperation, and coordination as well as defining clear roles and responsibility among stakeholders at all levels across multiple agencies and sectors [31,92]. This analysis supports the assertion that fishing pressure has increased, not decreased, since fishing lot abolishment, and as such the key to better fisheries management practices is likely to do with the development, compliance, and enforcement of rules and regulations that encourage more sustainable exploitation rates and resource use. For future study, it may be worthwhile to model different drivers (e.g., fishing effort, flow, land cover, water quality, climatic condition, etc.) that explain the variation in the fish catches from the TSL. This will provide a better quantification of the drivers responsible for the changes in fisheries productivity. This information is urgently needed to implement effective fisheries management and conservation policy in the face of current and foreseeable global change.

Supplementary Materials

The following are available online at https://www.mdpi.com/2073-4441/12/11/2974/s1, Table S1: Summary of morphological and biological traits for fish species, Figure S1: Box and Whisker plot showing the maximum water level between the two periods: before the fishing lot abolishment (BLA) and after fishing lot abolishment (ALA), Figure S2: Eigenvalue of the Figure 3 PCA indicating axes contribution on the total variance. The first two axes that contribute 32.40% of the total variance are in black, Figure S3: Eigenvalue of the Figure 4 PCA indicating axes contribution on the total variance. The first two axes that contribute 64.81% of the total variance are in black.

Author Contributions

Conceptualization, B.C., P.B.N., Z.S.H., S.B. and S.L.; Methodology, B.C., S.B. and S.L.; Validation, P.B.N., S.B., Z.S.H. and S.L.; Formal Analysis, B.C. and S.L.; Resources, P.B.N. and N.S.; Data Curation, B.C., P.B.N., and S.L.; Writing-Original Draft Preparation, B.C.; Writing-Review & Editing, B.C., P.B.N., N.S., Z.S.H., S.B. and S.L.; Visualization, B.C., P.B.N., Z.S.H.; Supervision, S.B., Z.S.H. and S.L.; Project Administration, S.L. and Z.S.H.; Funding Acquisition, S.L. and Z.S.H. All authors have read and agreed to the published version of the manuscript.

Funding

The study was financially supported by the Lotus+ Project of the European Union’s Erasmus Mundus Programme, the USAID-supported project: Wonders of the Mekong, and Laboratoire Evolution et Diversité Biologique (EDB). The EDB lab is supported by “Investissement d’Avenir” grants (CEBA, ref. ANR-10-LABX-0025; TULIP, ref. ANR-10-LABX-41).

Acknowledgments

We are also grateful to the Inland Fisheries Research and Development Institute (IFReDI) of the Cambodia Fisheries Administration and the Fisheries Programme of the Mekong River Commission (MRC) for providing datasets used in this study.

Conflicts of Interest

The authors declare no conflict of interest.

References

  1. Mekong River Commission. Overview of the Hydrology of the Mekong Basin; Red Plough International Co. Ltd., Ed.; Mekong River Commission: Vientiane, Laos, 2005; p. 73. ISBN 17283248. [Google Scholar]
  2. Baran, E.; So, N.; Degen, P.; Chen, X.-Y.; Starr, P. Updated information on fish and fisheries in the Mekong Basin. Catch Cult. 2013, 19, 24–25. [Google Scholar]
  3. Hogan, Z.S.; Ngor, P.B.; Zalinge, N.V. Status and conservation of two endangered fish species, the Mekong giant catfish Pangasianodon gigas and the giant carp Catlocarpio siamensis, in Cambodia’s Tonle Sap River. Nat. Hist. Bull. Siam Soc. 2001, 49, 269–282. [Google Scholar]
  4. Ngor, P.B.; Grenouillet, G.; Phem, S.; So, N.; Lek, S. Spatial and temporal variation in fish community structure and diversity in the largest tropical flood-pulse system of South-East Asia. Ecol. Freshw. Fish 2018, 27, 1087–1100. [Google Scholar] [CrossRef]
  5. Baran, E. Fish Migration Triggers in the Lower Mekong Basin and Other Freshwater Tropical Systems; Mekong River Commission: Vientiane, Laos, 2006; p. 56. [Google Scholar]
  6. Poulsen, A.F.; Ouch, P.; Viravong, S.; Suntornratana, U.; Nguyen, T.T. Fish Migrations of the Lower Mekong River Basin: Implications for Development, Planning and Environmental Management; Mekong River Commission: Phnom Penh, Cambodia, 2002; p. 62. ISSN 1683-1489. [Google Scholar]
  7. Ngor, P.B.; McCann, K.S.; Grenouillet, G.; So, N.; McMeans, B.C.; Fraser, E.; Lek, S. Evidence of indiscriminate fishing effects in one of the world’s largest inland fisheries. Sci. Rep. 2018, 8, 1–12. [Google Scholar] [CrossRef] [Green Version]
  8. Ngor, P.B.; Oberdorff, T.; Phen, C.; Baehr, C.; Grenouillet, G.; Lek, S. Fish assemblage responses to flow seasonality and predictability in a tropical flood pulse system. Ecosphere 2018, 9, 1–17. [Google Scholar] [CrossRef] [Green Version]
  9. Hortle, K.G.; Bamrungrach, P. Fisheries Habitat and Yield in the Lower Mekong Basin; Mekong River Commission: Phnom Penh, Cambodia, 2015; p. 80. ISSN 1683-1489. [Google Scholar]
  10. Zalinge, N.V.; Nao, T.; Touch, S.T. Where there is water, there is fish? Fisheries issues in the Lower Mekong Basin from a Cambodian perspective. In Proceedings of the Contribution to the Mekong Panel at the Seventh Common Property Conference of the International Association for the Study of Common Property, Vancouver, Canada, 10—14 June 1998. [Google Scholar]
  11. Vaidyanathan, G. Dam controversy: Remaking the Mekong. Nature 2011, 478, 305–307. [Google Scholar] [CrossRef]
  12. Allen, D.J.; Smith, K.G.; Darwall, W.R.T. The Status and Distribution of Freshwater Biodiversity in Indo-Burma; Complier, Ed.; IUCN: Cambridge, UK and Gland, Switzerland, 2012; ISBN 9782831714240. [Google Scholar]
  13. UNESCO Tonle Sap Biosphere Reserve. Available online: http://www.unesco.org/new/en/phnompenh/natural-sciences/biosphere-reserves/tonle-sap-biosphere-reserve/ (accessed on 12 January 2018).
  14. Degen, P.; Nao, T. Historical, cultural and legal perspectives on the fishing lot system in Cambodia. In Proceedings of the Common Property in the Mekong: Issues of Sustainability and Subsistence; Ahmed, M., Hirsch, P., Eds.; ICLARM Stud. Rev.: Phnom Penh, Cambodia, 2000; pp. 49–60. [Google Scholar]
  15. Lieng, S.; Yim, C.; Zalinge, N.P. Van Freshwater fisheries of Cambodia, I: The bagnet (Dai) fishery in the Tonle Sap River. Asian Fish. Sci. 1995, 8, 255–262. [Google Scholar]
  16. Degen, P.; Acker, F.V.; van Zalinge, N.V.; Nao, T.; Ly, V. Taken for granted: Conflicts over the Cambodia’s fresh water resources. In Proceedings of the Constituting the Commons: Crafting sustainable commons in the New Millennium, the Eighth Biennial Conference of the International Association for the Study of Common Property; The Internaitonal Association for the Study of the Commons (ASCP): Bloomington, IN, USA, 2000. [Google Scholar]
  17. Dina, T.; Sato, J. Is greater fishery access better for the poor? Explaining de-territorialisation of the Tonle Sap, Cambodia. J. Dev. Stud. 2014, 50, 962–976. [Google Scholar] [CrossRef]
  18. Ratner, B.D. Community management by decree? Lessons from Cambodia’s fisheries reform. Soc. Nat. Resour. 2006, 19, 79–86. [Google Scholar] [CrossRef]
  19. Cooperman, M.S.; So, N.; Arias, M.; Cochrane, T.A.; Elliott, V.; Hand, T.; Hannah, L.; Holtgrieve, G.W.; Kaufman, L.; Koning, A.A.; et al. A watershed moment for the Mekong: Newly announced community use and conservation areas for the Tonle Sap Lake may boost sustainability of the world’ s largest inland fishery. Cambodian J. Nat. Hist. 2012, 2012, 101–106. [Google Scholar]
  20. Hannah, L.; Costello, C.; Elliot, V.; Owashi, B.; Nam, S.; Oyanedel, R.; Chea, R.; Vibol, O.; Phen, C.; McDonald, G. Designing freshwater protected areas (FPAs) for indiscriminate fisheries. Ecol. Modell. 2019, 393, 127–134. [Google Scholar] [CrossRef]
  21. MRC. Cambodia abolishes fishing lots. Catch Cult. 2012, 18, 12–21. [Google Scholar]
  22. Chap, S.; Touch, P.; Diepart, J.-C. Fisheries Reforms and Right-based Fisheries: Insights from Community Fisheries across Cambodia; The Learning Institute: Phnom Penh, Cambodia, 2016. [Google Scholar]
  23. Oeur, I.; Kosal, M.; Sour, K.; Ratner, B.D. Innovations to Strengthen Aquatic Resource Governance on Cambodia’s Tonle Sap Lake. Rrogram Report; WorldFish: Penang, Malaysia, 2014. [Google Scholar]
  24. Van Acker, F. Cambodia’s Commons: Changing Governance, Shifting Entitlements? Centre for ASEAN Studies and Centre for International Management and Development Antwerp: Phnom Penh, Cambodia, 2003. [Google Scholar]
  25. Touch, S.; Todd, B. The Inland and Marine Fisheries Trade of Cambodia; Oxfam America: Phnom Penh, Cambodia, 2003. [Google Scholar]
  26. Degen, P.; Vuthy, L.; Thyda, P.C.; Dara, Y.; Piseth, C.; Saroeun, L. People, power and fishery policy: Fisheries management reform addressing community fisheries in Cambodia. In Proceedings of the 4th Technical Symposium on Mekong Fisheries; Inland Fisheries Research Development Institute of Cambodia & Mekong River Commission: Phnom Penh, Cambodia, 2002; pp. 11–28. [Google Scholar]
  27. Ngor, P.B. Informal aspects of fishing lot auctions in Cambodia: A case study in Prey Veng Province; A research paper submitted in partial fulfillment for the Degree of Master of Environmental Management and Development; The Australian National University: Canberra, Australia, 2007. [Google Scholar]
  28. KC, K.B.; Elliott, V.; Seng, R.; Pomeroy, R.S.; Schenkels, J.; Fraser, E.D.G. Evaluating community fishery management using Fishers’ perceptions in the Tonle Sap lake of Cambodia. Environ. Dev. 2020, 33, 100503. [Google Scholar] [CrossRef]
  29. Dina, T.; Sato, J. The cost of privatizing the commons: Overlapping property systems in Tonle Sap, Cambodia. Int. J. Commons 2015, 9, 261–280. [Google Scholar] [CrossRef]
  30. Ratner, B.D.; Mam, K.; Halpern, G. Collaborating for resilience: Conflict, collective action, and transformation on Cambodia’s Tonle Sap Lake. Ecol. Soc. 2014, 19, 31. [Google Scholar] [CrossRef] [Green Version]
  31. Ratner, B.D.; So, S.; Mam, K.; Oeur, I.; Kim, S. Conflict and collective action in Tonle Sap fisheries: Adapting governance to support community livelihoods. Nat. Resour. Forum 2017, 41, 71–82. [Google Scholar] [CrossRef]
  32. Say, S. Limited state and strong social forces: Fishing lot management in Cambodia. J. Southeast Asian Stud. 2014, 45, 174–193. [Google Scholar]
  33. Ngor, P.B.; Heng, K.; Thor, S.; Thomson, D. Pilot Participatory Policy Impact Assessment Fisheries Policy Related to Community Fisheries Development Stung Treng, Kampot/Kep, Koh Kong and Siem Reap Provinces; Fisheries Administration: Phnom Penh, Cambodia, 2010. [Google Scholar]
  34. Thay, S. Current perceptions of local fishers of community fisheries or co-management of fisheries: A case study. In Proceedings of the 4th Technical Symposium on Mekong Fisheries, 10–11 December 2001; MRC Conference Series No. 2. Hewitt, M.M., Ed.; Mekong River Commission: Phnom Penh, Cambodia, 2002; pp. 29–42. [Google Scholar]
  35. Teichert, N.; Lepage, M.; Sagouis, A.; Borja, A.; Chust, G.; Ferreira, M.T.; Pasquaud, S.; Schinegger, R.; Segurado, P.; Argillier, C. Functional redundancy and sensitivity of fish assemblages in European rivers, lakes and estuarine ecosystems. Sci. Rep. 2017, 7, 1–11. [Google Scholar] [CrossRef] [Green Version]
  36. Halls, A.S.; Paxton, B.R.; Hall, N.; Ngor, P.B.; Lieng, S.; Ngor, P.; So, N. The Stationary Trawl (Dai) Fishery of the Tonle Sap-Great Lake System, Cambodia; Mekong River Commission: Phnom Penh, Cambodia, 2013; p. 142. ISSN 1683-1489. [Google Scholar]
  37. MRC. State of the Basin Report: 2003. Executive Summary; Mekong River Commission: Phnom Penh, Cambodia, 2003; p. 50. ISSN 1728:3248. [Google Scholar]
  38. Lamberts, D. The Tonle Sap Lake as a productive ecosystem. Int. J. Water Resour. Dev. 2006, 22, 481–495. [Google Scholar] [CrossRef]
  39. Kummu, M.; Tes, S.; Yin, S.; Adamson, P.; Józsa, J.; Koponen, J.; Richey, J.; Sarkkula, J. Water balance analysis for the Tonle Sap Lake-floodplain system. Hydrol. Process. 2014, 28, 1722–1733. [Google Scholar] [CrossRef]
  40. Adamson, P.T.; Rutherfurd, I.D.; Peel, M.C.; Conlan, I.A. The hydrology of the Mekong River. In The Mekong Biophysical Environment of an International River Basin; Campbell, I.C., Ed.; Elsevier Inc.: Amsterdam, The Netherlands, 2009; pp. 53–76. [Google Scholar]
  41. Kummu, M.; Penny, D.; Sarkkula, J.; Koponen, J. Sediment: Curse or blessing for Tonle Sap Lake? Ambio 2008, 37, 158–163. [Google Scholar] [CrossRef]
  42. Kummu, M.; Koponen, J.; Sarkkula, J. Modelling sediment and ecosystem in Tonle Sap Lake for impact assessment. Mater. Geoenvironment 2005, Volume 52, 87. [Google Scholar]
  43. Sarkkula, J.; Kiirikki, M.; Koponen, J.; Kummu, M. Ecosystem processes of the Tonle Sap Lake. In Proceedings of the 1st Workshop of Ecotone Phase II, Phnom Penh and Siem Reap, Cambodia, January 2003; pp. 1–14. [Google Scholar]
  44. Sarkkula, J.; Baran, E.; Chheng, P.; Keskinen, M.; Koponen, J.; Kummu, M. Tonle Sap pulsing system and fisheries productivity. In Proceedings of the XXIXe International Congress of Limnology, Lahti, Finland, 08–14 August 2004; pp. 1–5. [Google Scholar]
  45. MRC. Monitoring Fish Abundance and Diversity in the Lower Mekong Basin: Methodological Guidelines; Mekong River Commission: Phnom Penh, Cambodia, 2007. [Google Scholar]
  46. Ngor, P.B.; Hortle, K.G.; So, N. Standard Sampling Procedures for Fish Abundance and Diversity Monitoring in the Lower Mekong Basin; Mekong River Commission: Phnom Penh, Cambodia, 2016. [Google Scholar]
  47. Stamatopoulos, C. Sample-Based Fishery Surveys: A Technical Handbook; Food and Agriculture Oranization of the United Nations: Rome, Italy, 2002. [Google Scholar]
  48. Ly, S.; Van Zalinge, N.P. Catch Statistics of Cambodian Freshwater Fisheries 1994–1997, Report for Project: The Management of the Freshwater Capture Fisheries of Cambodia Phase 1; Mekong River Commission, Department of Fisheries and Danish International Development Agency: Phnom Penh, Cambodia, 1998. [Google Scholar]
  49. McCann, K.S.; Gellner, G.; McMeans, B.C.; Deenik, T.; Holtgrieve, G.; Rooney, N.; Hannah, L.; Cooperman, M.; Nam, S.; Giacomini, H. Food webs and the sustainability of indiscriminate fisheries 1. Can. J. Fish. Aquat. Sci. 2016, 665, 656–665. [Google Scholar] [CrossRef]
  50. Allan, J.D.; Abell, R.; Hogan, Z.; Revenga, C.; Taylor, B.W.; Welcomme, R.L.; Winemiller, K. Overfishing of inland waters. Bioscience 2005, 55, 1041–1051. [Google Scholar] [CrossRef] [Green Version]
  51. Rainboth, W.J. Fishes of the Cambodian Mekong; Food and Agriculture Organisation of the United Nations: Rome, Italy, 1996; ISBN 92-5-103743-4. [Google Scholar]
  52. MFD. Mekong Fish Database: A Taxonomic Fish Database for the Mekong Basin; Mekong River Commission: Phnom Penh, Cambodia, 2003. [Google Scholar]
  53. So, N.; Utsugi, K.; Shibukawa, K.; Thach, P.; Chhuoy, S.; Kim, S.; Chin, D.; Nen, P.; Chheng, P. Fishes of the Cambodian Freshwater Bodies; Inland Fisheries Research and Development Institute, Fisheries Administration: Phnom Penh, Cambodia, 2019; p. 197. [Google Scholar]
  54. Froese, R.; Pauly, D.; FishBase. World Wide Web electronic publication. Available online: www.fishbase.org (accessed on 10 February 2017).
  55. Poulsen, A.F.; Hortle, K.G.; Chan, S.; Chhuon, C.K.; Viravong, S.; Bouakhamvongsa, K.; Suntornratana, U.; Yoorong, N.; Nguyen, T.T.; Tran, B.Q. Distribution and Ecology of some Important Riverine Fish Species of the Mekong River Basin; Mekong River Commission: Phnom Penh, Cambodia, 2004; pp. 1–116. ISSN 1683-1489. [Google Scholar]
  56. Ngor, P.B.; Legendre, P.; Oberdorff, T.; Lek, S. Flow alterations by dams shaped fish assemblage dynamics in the complex Mekong-3S river system. Ecol. Indic. 2018, 88, 103–114. [Google Scholar] [CrossRef]
  57. Kassambara, A.; Mundt, F. Factoextra: Extract and visualize the results of multivariate data analyses. 2020. Available online: https://CRAN.R-project.org/package=factoextra.
  58. Le, S.; Josse, J.; Husson, F. FactoMineR: An R package for multivariate analysis. J. Stat. Softw. 2008, 25, 1–18. [Google Scholar] [CrossRef] [Green Version]
  59. Clarke, K.R. Non-parametric multivariate analyses of changes in community structure. Aust. J. Ecol. 1993, 18, 117–143. [Google Scholar] [CrossRef]
  60. Oksanen, J.; Blanchet, F.G.; Fiendly, M.; Kindt, R.; Legendre, P.; McGlinn, D.; Minchin, P.R.; O’Hara, R.B.; Gavin, L.; Simpson, G.L.; et al. Vegan: Community Ecology Package. 2019; Available online: https://CRAN.R-project.org/package=vegan.
  61. Clarke, K.R.; Warwick, R.M. Change in Marine Communities: An Approach to Statistical Analysis and Interpretation, 2nd ed.; PRIMER-E: Plymouth, UK, 2001. [Google Scholar]
  62. Wickham, H. Ggplot2: Elegant Graphics for Data Analysis; Springer: New York, NY, USA, 2009. [Google Scholar]
  63. R Core Team R: A language and environment for statistical computing 2019, R version 1.2.1335; R Foundation for Statistical Computing: Vienna, Austria, 2019; Available online: https://www.R-project.org/.
  64. Valbo-Jorgensen, J.; Poulsen, A.F. Using local knowledge as a research tool in the study of river fish biology: Experiences from the Mekong. Environ. Dev. Sustain. 2000, 2, 253–276. [Google Scholar] [CrossRef]
  65. Ngor, P.B. Dai fisheries in the Tonle Sap River of Phnom Penh and Kandal province (including a Review of the Census Data of 1996–1997). In Proceedings of the Management aspects of Cambodia’s Freshwater Capture Fisheries and Management Implications, Eleven Presentation Given at the Annual Meeting of the Department of Fisheries of the Ministry of Agriculture, Forestry and Fisheries, Phnom Penh, Cambodia., 27–27 January 2000. [Google Scholar]
  66. KC, K.B.; Bond, N.; Fraser, E.D.G.; Elliott, V.; Farrell, T.; McCann, K.; Rooney, N.; Bieg, C. Exploring tropical fisheries through fishers’ perceptions: Fishing down the food web in the Tonlé Sap, Cambodia. Fish. Manag. Ecol. 2017, 24, 452–459. [Google Scholar] [CrossRef]
  67. Deap, L.; Degen, P.; Zalinge, N.S. Fishing Gears of the Cambodian Mekong; Inland Fisheries Research and Development Institude of Cambodia (IFRdDI): Phnom Penh, Cambodia, 2003; p. 269. ISSN 1726-3972. [Google Scholar]
  68. Hardin, G. The tragedy of the commons. Science 1968, 162, 1243–1248. [Google Scholar]
  69. Sonneveld, B.; Thoto, F.; Houessou, D.; Wesenbeeck, L.V. The tragedy of the inland lakes. Int. J. Commons 2019, 13, 609–636. [Google Scholar] [CrossRef] [Green Version]
  70. Mahood, S.P.; Poole, C.M.; Watson, J.E.M.; Sharma, S.; Garnett, S.T.; Mackenzie, R.A. Agricultural intensification is causing rapid habitat change in the Tonle Sap Floodplain, Cambodia. Wetl. Ecol. Manag. 2020, 1. [Google Scholar] [CrossRef]
  71. Lohani, S.; Dilts, T.E.; Weisberg, P.J.; Null, S.E.; Hogan, Z.S. Rapidly accelerating deforestation in Cambodia’s Mekong River Basin: A comparative analysis of spatial patterns and drivers. Water 2020, 2191, 1–29. [Google Scholar]
  72. Daly, K.; Ahmad, S.K.; Bonnema, M.; Beveridge, C.; Hossain, F.; Nijssen, B.; Holtgrieve, G. Recent warming of Tonle Sap Lake, Cambodia: Implications for one of the world’s most productive inland fisheries. Lake Resevoirs 2020, 2020, 1–10. [Google Scholar] [CrossRef]
  73. Pauly, D.; Christensen, V.; Guénette, S.; Pitcher, T.J.; Sumaila, U.R.; Walters, C.J.; Watson, R.; Zeller, D. Towards sustainability in world fisheries. Nature 2002, 418, 689–695. [Google Scholar] [CrossRef] [PubMed]
  74. Welcomme, R.L.; Cowx, I.G.; Coates, D.; Béné, C.; Funge-Smith, S.; Halls, A.; Lorenzen, K. Inland capture fisheries. Philos. Trans. R. Soc. Lond. B. Biol. Sci. 2010, 365, 2881–2896. [Google Scholar] [CrossRef]
  75. Frank, K.T.; Petrie, B.; Choi, J.S.; Leggett, W.C. Trophic cascades in a formerly cod-dominated ecosystem. Science 2005, 308, 1621–1623. [Google Scholar] [CrossRef] [Green Version]
  76. Andersen, K.H.; Gislason, H. Unplanned ecological engineering. Proc. Natl. Acad. Sci. USA 2017, 114, 634–635. [Google Scholar] [CrossRef] [Green Version]
  77. CFDO. Policy Reform Impact Assessment, Cambodia: Impacts of the Fisheries Policy Reforms; Cambodian Department of Fisheries: Phnom Penh, Cambodia, 2004; p. 84. [Google Scholar]
  78. Hecht, J.S.; Lacombe, G.; Arias, M.E.; Dang, T.D.; Piman, T. Hydropower dams of the Mekong River basin: A review of their hydrological impacts. J. Hydrol. 2019, 568, 285–300. [Google Scholar] [CrossRef]
  79. Sokhem, P.; Sunada, K. The governance of the Tonle Sap Lake, Cambodia: Integration of local, national and international levels. Int. J. Water Resour. Dev. 2006, 22, 399–416. [Google Scholar] [CrossRef]
  80. Thay, S.; Schmidt, U. Aquatic Resources Management: The Tonle Sap Great Lake, Cambodia. In The International Conference on Sustainable Aquatic Resources are more than Managing Fish; The Eco-System Approach in Inland Fisheries and the Role of Intra-country Linkages: Penang, Malaysia, 2004. [Google Scholar]
  81. Kurien, J.; Kaing, K.; Pech, B. Cambodia: Towards a modern commons. Samudra Rep. 2016, 72, 15–19. [Google Scholar]
  82. MAFF. The Strategic Planning Framework for Fisheries: Update for 2015–2024 “Fishing for the Future”; Ministry of Agriculture, Forestry & Fisheries of the Royal Government of Cambodia: Phnom Penh, Cambodia, 2015; p. 52.
  83. Pokhrel, Y.; Burbano, M.; Roush, J.; Kang, H.; Sridhar, V.; Hyndman, D.W. A review of the integrated effects of changing climate, land use, and dams on Mekong river hydrology. Water 2018, 10, 266. [Google Scholar] [CrossRef] [Green Version]
  84. Baran, E.; Van Zalinge, N.P.; Ngor, P.B. Floods, floodplains and fish production in the Mekong Basin: Present and past trends. In Proceedings of the Second Asian Wetlands Symposium, Penang, Malaysia, 27–30 August 2001; Ali, A., Ed.; Penerbit Universiti Sains Malaysia: Pulau Pinang, Malaysia, 2001; pp. 920–932. [Google Scholar]
  85. Ziv, G.; Baran, E.; So, N.; Rodriguez-Iturbe, I.; Levin, S.A. Trading-off fish biodiversity, food security, and hydropower in the Mekong River Basin. Proc. Natl. Acad. Sci. USA 2012, 109, 5609–5614. [Google Scholar] [CrossRef] [PubMed] [Green Version]
  86. Sabo, J.L.; Ruhi, A.; Holtgrieve, G.W.; Elliott, V.; Arias, M.E.; Ngor, P.B.; Räsänen, T.A.; Nam, S. Designing river flows to improve food security futures in the Lower Mekong Basin. Science 2017, 358, eaao1053. [Google Scholar] [CrossRef] [Green Version]
  87. Winemiller, K.O.; McIntyre, P.B.; Castello, L.; Fluet-Chouinard, E.; Giarrizzo, T.; Nam, S.; Baird, I.G.; Darwall, W.; Lujan, N.K.; Harrison, I.; et al. Balancing hydropower and biodiversity in the Amazon, Congo, and Mekong. Science 2016, 351, 128–129. [Google Scholar] [CrossRef] [Green Version]
  88. Phomikong, P.; Fukushima, M.; Sricharoendham, B.; Nohara, S.; Jutagate, T. Diversity and community structure of fishes in the regulated versus unregulated tributaries of the mekong river. River Res. Appl. 2014, 31, 14. [Google Scholar] [CrossRef]
  89. Arias, M.E.; Cochrane, T.A.; Elliott, V. Modelling future changes of habitat and fauna in the Tonle Sap wetland of the Mekong. Environ. Conserv. 2013, 41, 165–175. [Google Scholar] [CrossRef] [Green Version]
  90. Daskalova, G.N.; Myers-smith, I.H.; Bjorkman, A.D.; Blowes, S.A. Landscape-scale forest loss as a catalyst of population and biodiversity change. Science 2020, 1347, 1341–1347. [Google Scholar] [CrossRef] [PubMed]
  91. Ngor, P.B.; Lek, S.; McCann, K.S.; Hogan, Z.S. Dams threaten world’s largest inland fishery. Nature 2018, 563. [Google Scholar] [CrossRef] [PubMed]
  92. Arias, M.E.; Holtgrieve, G.W.; Ngor, P.B.; Dang, T.D.; Piman, T. Maintaining perspective of ongoing environmental change in the Mekong floodplains. Curr. Opin. Environ. Sustain. 2019, 37, 1–7. [Google Scholar] [CrossRef]
Figure 1. Map showing the fishing lots in the Tonle Sap Lake, Tonle Sap River, Bassac River, and Mekong River. The dry season area of the Tonle Sap Lake is shown in blue and the green represents a maximal area of the Tonle Sap Lake during the flooded season in 2005. The former fishing lot areas are in grey.
Water 12 02974 g001
Figure 2. (A) Monthly fish catchweight for 1995–2000 before fishing lot abolishment and (B) for the period 2012–2015 after fishing lot abolishment. Monthly catch weights are scaled between 0 and 1 and represented by the black solid line, while the red dotted line denotes the monthly average moving trends using simple moving average for the two study periods.
Water 12 02974 g002
Figure 3. A principal component analysis (PCA) biplot showing fish assemblages from before and after the fishing lot abolishment. The yellow triangles and blue dots symbolize the samples of fish collected before and after fishing lot abolishment, respectively. The ellipses represent the 95% confidence interval.
Water 12 02974 g003
Figure 4. PCA biplot showing the association between the status of fish species (increase, decrease, or stable) in relative catchweight before (1995–2000) and after (2012–2015) fishing lot abolishment and their morphological and biological traits. The blue, red, and green dots symbolize species with increasing, decreasing, and stable trends, respectively. The size of the dot represents the level of change (proportion) of fish species caught between the two periods. Abbreviations include: T.Length = maximum total length; T.level = trophic level; W.colum = water column; Migrat = migration guilds. The full names of fish species are given in Table 1.
Water 12 02974 g004
Table 1. Similarity percentage (SIMPER) results showing the dynamics of fish species according to a pairwise comparison between before and after the fishing lot abolishment. Abbreviations are as follows: av. before = average catch weight before fishing lot abolishment; av. after = average catch weight after fishing lot abolishment; cumsum = ordered cumulative contribution; “−” = decreasing trend; “+” = increasing trend; “N” = non-change or stable. Fish species with significant change (p-value <0.05) are in bold.
SpeciesCodeav. beforeav. afterCumsump-ValueChange
Gymnostomus spp.Gyspp11.96016.2800.0960.010+
Cyclocheilos enoplosCyeno13.3972.7910.1810.010
Puntioplites proctozystronPupro2.95110.6120.2470.010+
Mystus spp.Myspp3.5758.8970.3010.010+
Channa micropeltesChmic7.0440.6960.3510.010
Trichopodus microlepisTrmic5.1634.1680.3980.010
Osteochilus vittatusOsvit4.5037.9300.4450.010+
Hypsibarbus spp.Hyspp6.3584.6400.4830.010
Channa striataChstr3.0923.1030.5160.130N
Labiobarbus leptocheilusLalep3.9910.9390.5470.010
Hemibagrus spilopterusHespi4.1721.7430.5780.010
Notopterus notopterusNonot0.9133.8310.6050.010+
Xenentodon sp.Xensp0.3583.2840.6310.010+
Anabas testudineusAntes1.2423.5630.6560.010+
Cyclocheilichthys armatusCyarm2.4101.6100.6770.010
Labeo chrysophekadionLachr1.6532.7600.6960.010+
Labiobarbus siamensisLasia0.3772.4290.7150.010+
Clarias spp.Clspp0.5162.2330.7330.010+
Thynnichthys thynnoidesThthy1.8941.5430.7490.010
Osteochilus melanopleuraOsmel2.2910.9740.7650.010
Pangasianodon hypophthalmusPahyp1.5281.3550.7800.010
Paralaubuca typusPatyp0.8421.5790.7950.030+
Pristolepis fasciataPrfas0.7802.1360.8090.010+
Cirrhinus microlepisCimic1.8720.3040.8230.010
Parambassis wolffiiPawol1.5231.5030.8370.320N
Lycothrissa crocodilusLycro1.8370.0000.8500.010
Boesemania microlepisBomic0.7480.9740.8600.260N
Hampala disparHadis1.3590.1880.8700.010
Puntius brevisPubre1.1360.2430.8790.010
Coilia spp.Cospp0.9220.3830.8880.010
Albulichthys albuloidesAlalb0.6710.5040.8960.030
Amblyrhynchichthys micracanthusAmmic0.4820.8770.9040.130N
Oxyeleotris marmorataOxmar0.0431.0770.9120.010+
Belodontichthys truncatusBetru0.9660.1450.9190.010
Pangasius larnaudiiPalar0.4230.8030.9260.030+
Wallago attuWaatt0.9400.1670.9340.010
Parachela siamensisPasia0.7190.2170.9400.010
Pangasius spp.Paspp0.3810.6020.9460.700N
Polynemus aquilonarisPoaqi0.8020.0320.9520.010
Micronema spp.Mispp0.6390.1050.9570.010
Ompok siluroidesOmsil0.6340.0100.9610.010
Systomus rubripinnisSyorp0.3680.2670.9660.100N
Chitala ornataChorn0.5160.1210.9700.010
Leptobarbus rubripinnaLehoe0.2790.4290.9740.140N
Trichopodus pectoralisTrpec0.0620.5300.9780.010+
Pao cambodgiensisPacam0.5170.0090.9820.010
Kryptopterus cryptopterusKrcry0.4620.0280.9860.010
Cosmochilus harmandiCohar0.1300.3810.9890.010+
Yasuhikotakia spp.Yaspp0.0670.3970.9920.010+
Probarbus jullieniPrjul0.2730.0850.9950.130N
Parambassis apogonoidesPaapo0.1000.2490.9970.590N
Barbonymus altusBaalt0.0480.1320.9980.060N
Gyrinocheilus pennockiGypen0.0020.1330.9990.070N
Achiroides leucorhynchosAcleu0.0660.0101.0000.010
Channa luciusChluc0.0020.0021.0000.710N
Publisher’s Note: MDPI stays neutral with regard to jurisdictional claims in published maps and institutional affiliations.

