1. Introduction
The agricultural sector, particularly irrigated agriculture, represents one of the principal socio-economic bases of the Segura River Basin. This sector, which is directly linked to the availability of water, accounts for more than 80% of the basin’s demands and, therefore, needs an appropriate management of resources under normal circumstances and particularly in situations of drought.
Natural resources depend directly and inevitably on climate conditions, and through increasing regulatory capacity, a multi-year management can be achieved so as to soften the effect of small climate variations. With the arrival of resources from the Tajo-Segura transfer 40 years ago, and with the application of new non-conventional resources, such as the reuse of regenerated and desalinated sea water, a greater availability of resources has been achieved together with a lower dependence on climate conditions through the comprehensive management of all of the resources.
As established in the Provisional Schema of Important Issues, 2021/27 (PSII), the production value generated in the agricultural sector in the Segura River Basin exceeds 3000M€/year and the net margin almost 1400 M€/year, considering as well the generation of employment in the area, which creates more than 115,000 jobs [
1].
The estimate of the production value in the Segura River Basin Hydrological Plan (SBHP 2015/21) is calculated as the product of the yields of each crop and the average prices of their production. On the other hand, in order to estimate the net margin, first the gross margin was obtained, subtracting direct costs, the costs of machinery and salaried labour from the production value. Finally, the indirect costs and depreciation were subtracted from the gross margin, giving the net margin [
2].
On the other hand, the gross value added (GVA) in the Segura River Basin for the agricultural sector amounts to almost 1600 M€. This sector, particularly irrigated fruit and vegetable crops, is a net exporter and constitutes the basis of an agri-food industrial sector that has been extensively developed in the basin [
1].
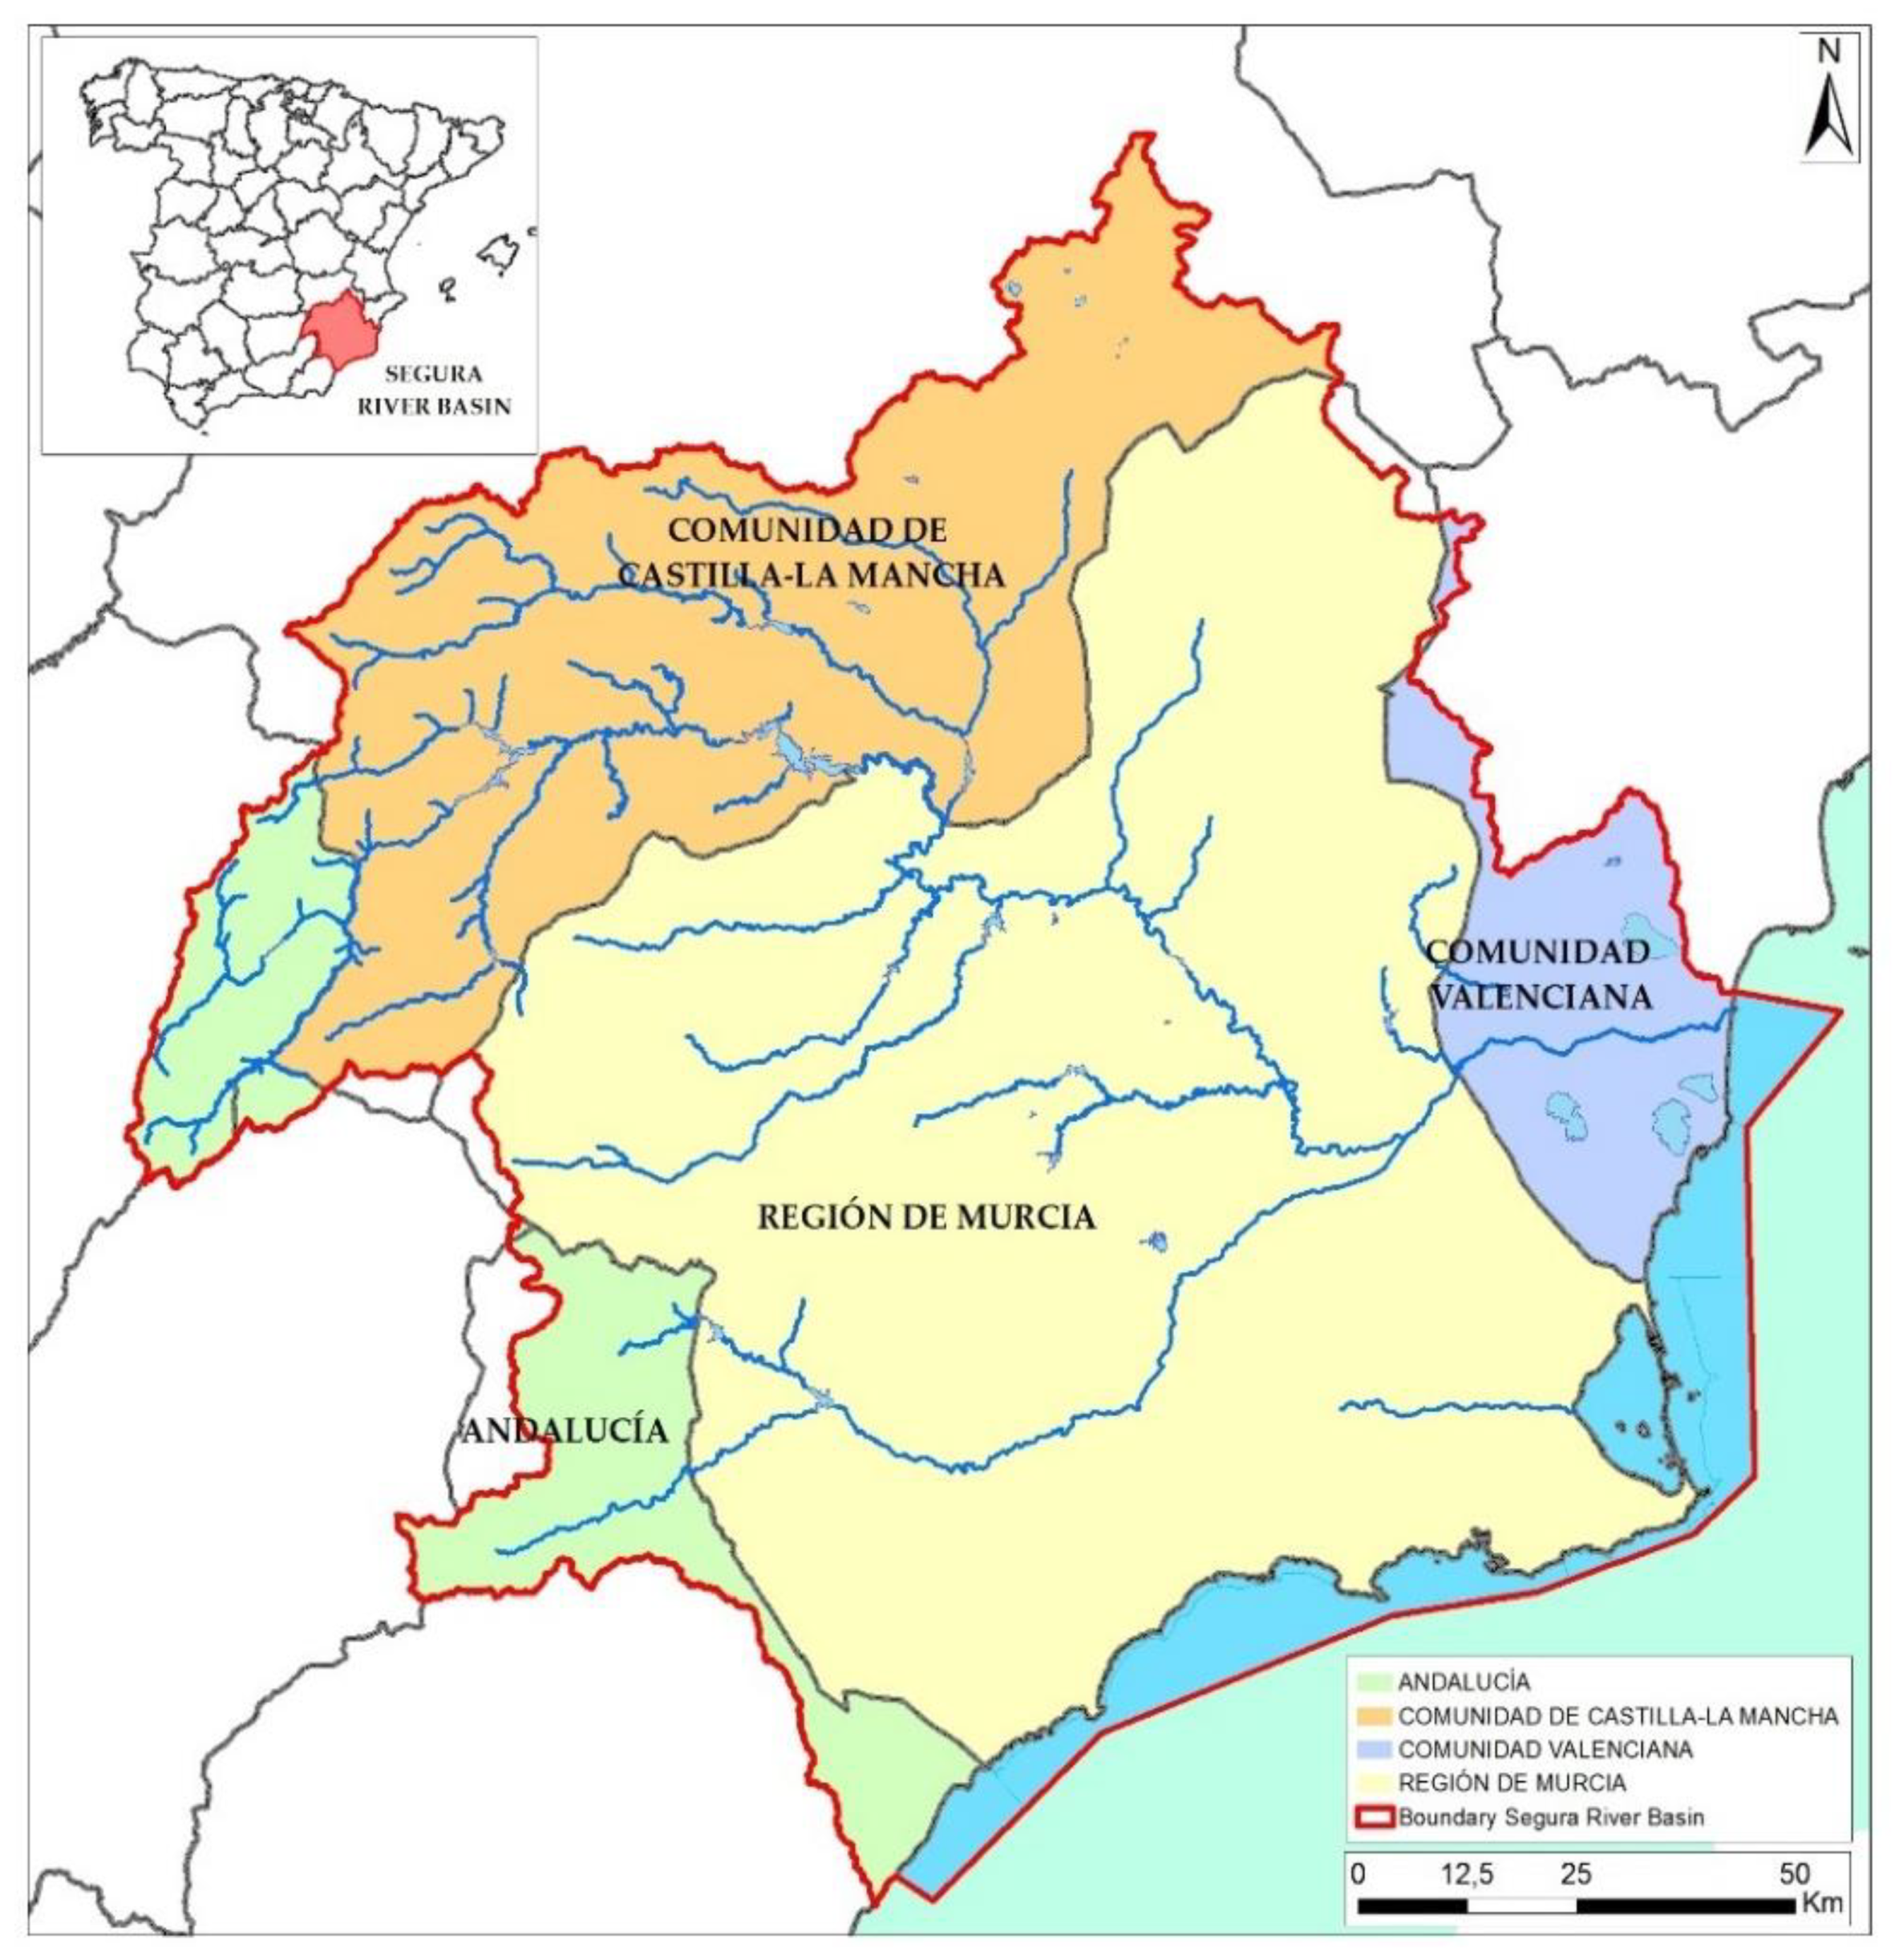
South-east Spain, and specifically the Segura River Basin (
Figure 1), has historically suffered countless episodes of drought. Since the 1980s, three drought periods have been recorded. The first was between 1980 and 1983, when marked reductions in the contributions and rainfall were registered which were mitigated with the authorisation of drought wells and with the Tajo-Segura transfer. Between 1993 and 1995 there was another similar episode which aggravated the structural problems of overexploitation. The situation was repeated between 2005 and 2008 and impacts were substantially reduced through the implementation of strategic drilling batteries, contracts for assigning water rights with irrigators of the Tajo and the increase in the volumes of reclaimed and desalinated resources [
3,
4].
The two main factors that give rise to droughts are first, the climate factor, generated by a decrease in rainfall and, second, the hydrological factor, generated by a reduction in the water resources necessary to meet demand. These situations can occur individually or together, causing socio-economic impacts on all sectors of society and the environment [
3].
One of the objectives defined by the Spain´s National Hydrological Plan (Law 10/2001 of 5 July) is to study how to adapt to these situations so as to ensure the resilience of the exploitation systems of the river basins when faced with these scenarios. Early diagnosis, through the use of indicators, and a rapid response capacity, through the activation of measures, enables the adverse effects to be anticipated and mitigated [
5].
This national resolve is reflected in the Special Drought Plans SDP) approved by the Order TEC/1399/2018 of 28 November [
6]. The principal objectives are focused on:
Guaranteeing the availability of water, minimising the negative effects of drought and scarcity on urban supply.
Avoiding or minimising the negative effects of droughts on the status of bodies of water.
Minimising the negative effects on economic activities, according to the prioritisation of uses established in the water legislation and the hydrological plans of the basin.
Defining early warning mechanisms and assessing situations of prolonged drought and temporary shortages as well as defining the actions and measures to apply in the different scenarios.
Ensuring transparency and public participation in the development of the plans.
At the same time, the procedure for elaborating the hydrological plans of the basin must follow a series of steps established by normative provisions. One of the important elements in the planning process, as this has been contemplated since the European Union (EU) Water Framework Directive (WFD) came into force, is the elaboration of the document Schema of Important Issues of the Basin.
As established in the hereafter PSII 2021/27 of the Segura River Basin, it is estimated that the repercussions of climate change will be manifested in an overall reduction in water resources, thereby increasing scarcity which will worsen throughout the twenty-first century. There will also be a change in the hydrological drought regime which, according to the majority of climate forecasts, will increase in frequency as the 21st century progresses [
7].
Currently, climate change is a major global concern, as established in the 5th report issued by the International Panel for Climate Change (IPCC) in 2014 which states that the current greenhouse gas emissions will generate an increase in global warming, producing long-lasting changes on climate and increasing the incidence of extreme events [
8]. The recent impact assessment reports [
9] indicate that climate change will increase the frequency of meteorological droughts (less rainfall) and agricultural droughts (reduced soil moisture) at the end of the twenty-first century in already dry regions. This will probably increase the frequency of short hydrological droughts in some areas of southern and eastern Europe [
3].
2. Hypothesis and Objectives
On 8 May 2015, the Spanish Government approved Royal Decree 356/2015 [
10], which declared a situation of drought in the territorial area of the Segura River Basin and adopted exceptional measures for the management of water resources. Due to the persistence of this situation, four extensions were subsequently approved [
11,
12,
13], the last being valid until 30 September 2019 (RD 1210/2018) [
14].
This drought situation has prevailed in the Segura River Basin for more than five years, generating a depletion of water resources. For this reason other related legislation has been passed [
15,
16], such as Law 1/2018, of 6 March, referring to urgent measures to mitigate the effects generated by drought in certain river basins [
17].
Therefore, it is necessary to carry out an assessment of the repercussions that drought has had on the agricultural sector of the Segura River Basin and whether the application of extraordinary measures has had a dampening effect.
In principle, a reduction in the available resources, primarily natural resources (that represent approximately 40% of total resources), would generate a reduction in the amounts applied to the crops or a reduction in the irrigated area, mostly in horticultural crops. This situation would be reflected in a decrease in the production value and net margin.
On the other hand, the application of extraordinary resources that permit an increase in available water, mobilising unallocated resources from underground sources [
18], increasing the production of desalinated water, together with other resources mobilised form the basin itself and assignment agreements with irrigators of other basins (according to RD on drought [
10]), could mitigate the decrease in resources and enable the cultivated area to remain under normal conditions, at least in the most productive areas [
19,
20,
21].
Finally, it should be remembered that one of the principal resources applied in the Segura River Basin comes from the Tajo-Segura transfer and that the annual amount of this transfer is lower than the values originally established (average transfer for irrigation of 205 hm³/year with respect to the maximum of 400 hm³/year). This “permanent” situation may reflect the degree to which the demand defined in the Segura River Basin Hydrological Plan (SBHP) is met and the opportunity cost generated by not being able to apply 100% of the resources demanded.
Therefore, the principal hypothesis proposed is that the decrease in available resources due to the drought, partly mitigated by the mobilisation of extraordinary resources, generates a reduction in the production value and net margin with respect to the average values (considering average transfer).
3. Materials and Methods
The Segura River Basin is in the Southeast region of Spanish territory covering an area of about 19,025 km2.
The average annual rainfall is 375 mm, according to the historical series (1940–2016), with a pattern of rainfall characterized by being space-temporally very irregular and a clear contrast between the headwater areas and the intermediate and lower parts of the basin (the rich fertile plains—or vegas—and coastal areas) [
22].
Topographically, the Segura River Basin is a territory of a great orographic variety, distinguishing between the headwaters, with mountains with maximum heights above 2,000 m, and the areas near the coast with extensive plains [
22].
Hydro-geologically, this complexity gives rise to the existence of numerous aquifers of medium and small extension, frequently with complex geologic structures, contributing considerably to the maintenance of the natural flows in the watercourses of the basin [
22].
The drainage network located of the Segura River Basin is made up of the Segura river, as the only main river, and its tributaries. The rest of the channels are ephemeral flows that run direct to the sea with a very irregular hydrological response conditioned by the downpours on their basins [
22].
According to the Geographic Information System for Agricultural Parcels (SIGPAC, 2010), the main land uses in the Segura River Basin are forestry and pastures, with 51% of the total land, followed by agriculture taking up a 41% of the total land of the basin. Urbanized land accounts for 5% of the total, watercourse and water surfaces represent 2% of the land, and finally, unproductive land accounts for 2% of the total land in the basin [
22].
With respect to the agricultural sector, the demands belonging to the same use that share the origin of supply, the returns of which are reincorporated in the same area or sub-area, are grouped into wider territorial units called units of demand. These units will be defined in the hydrological plan [
23].
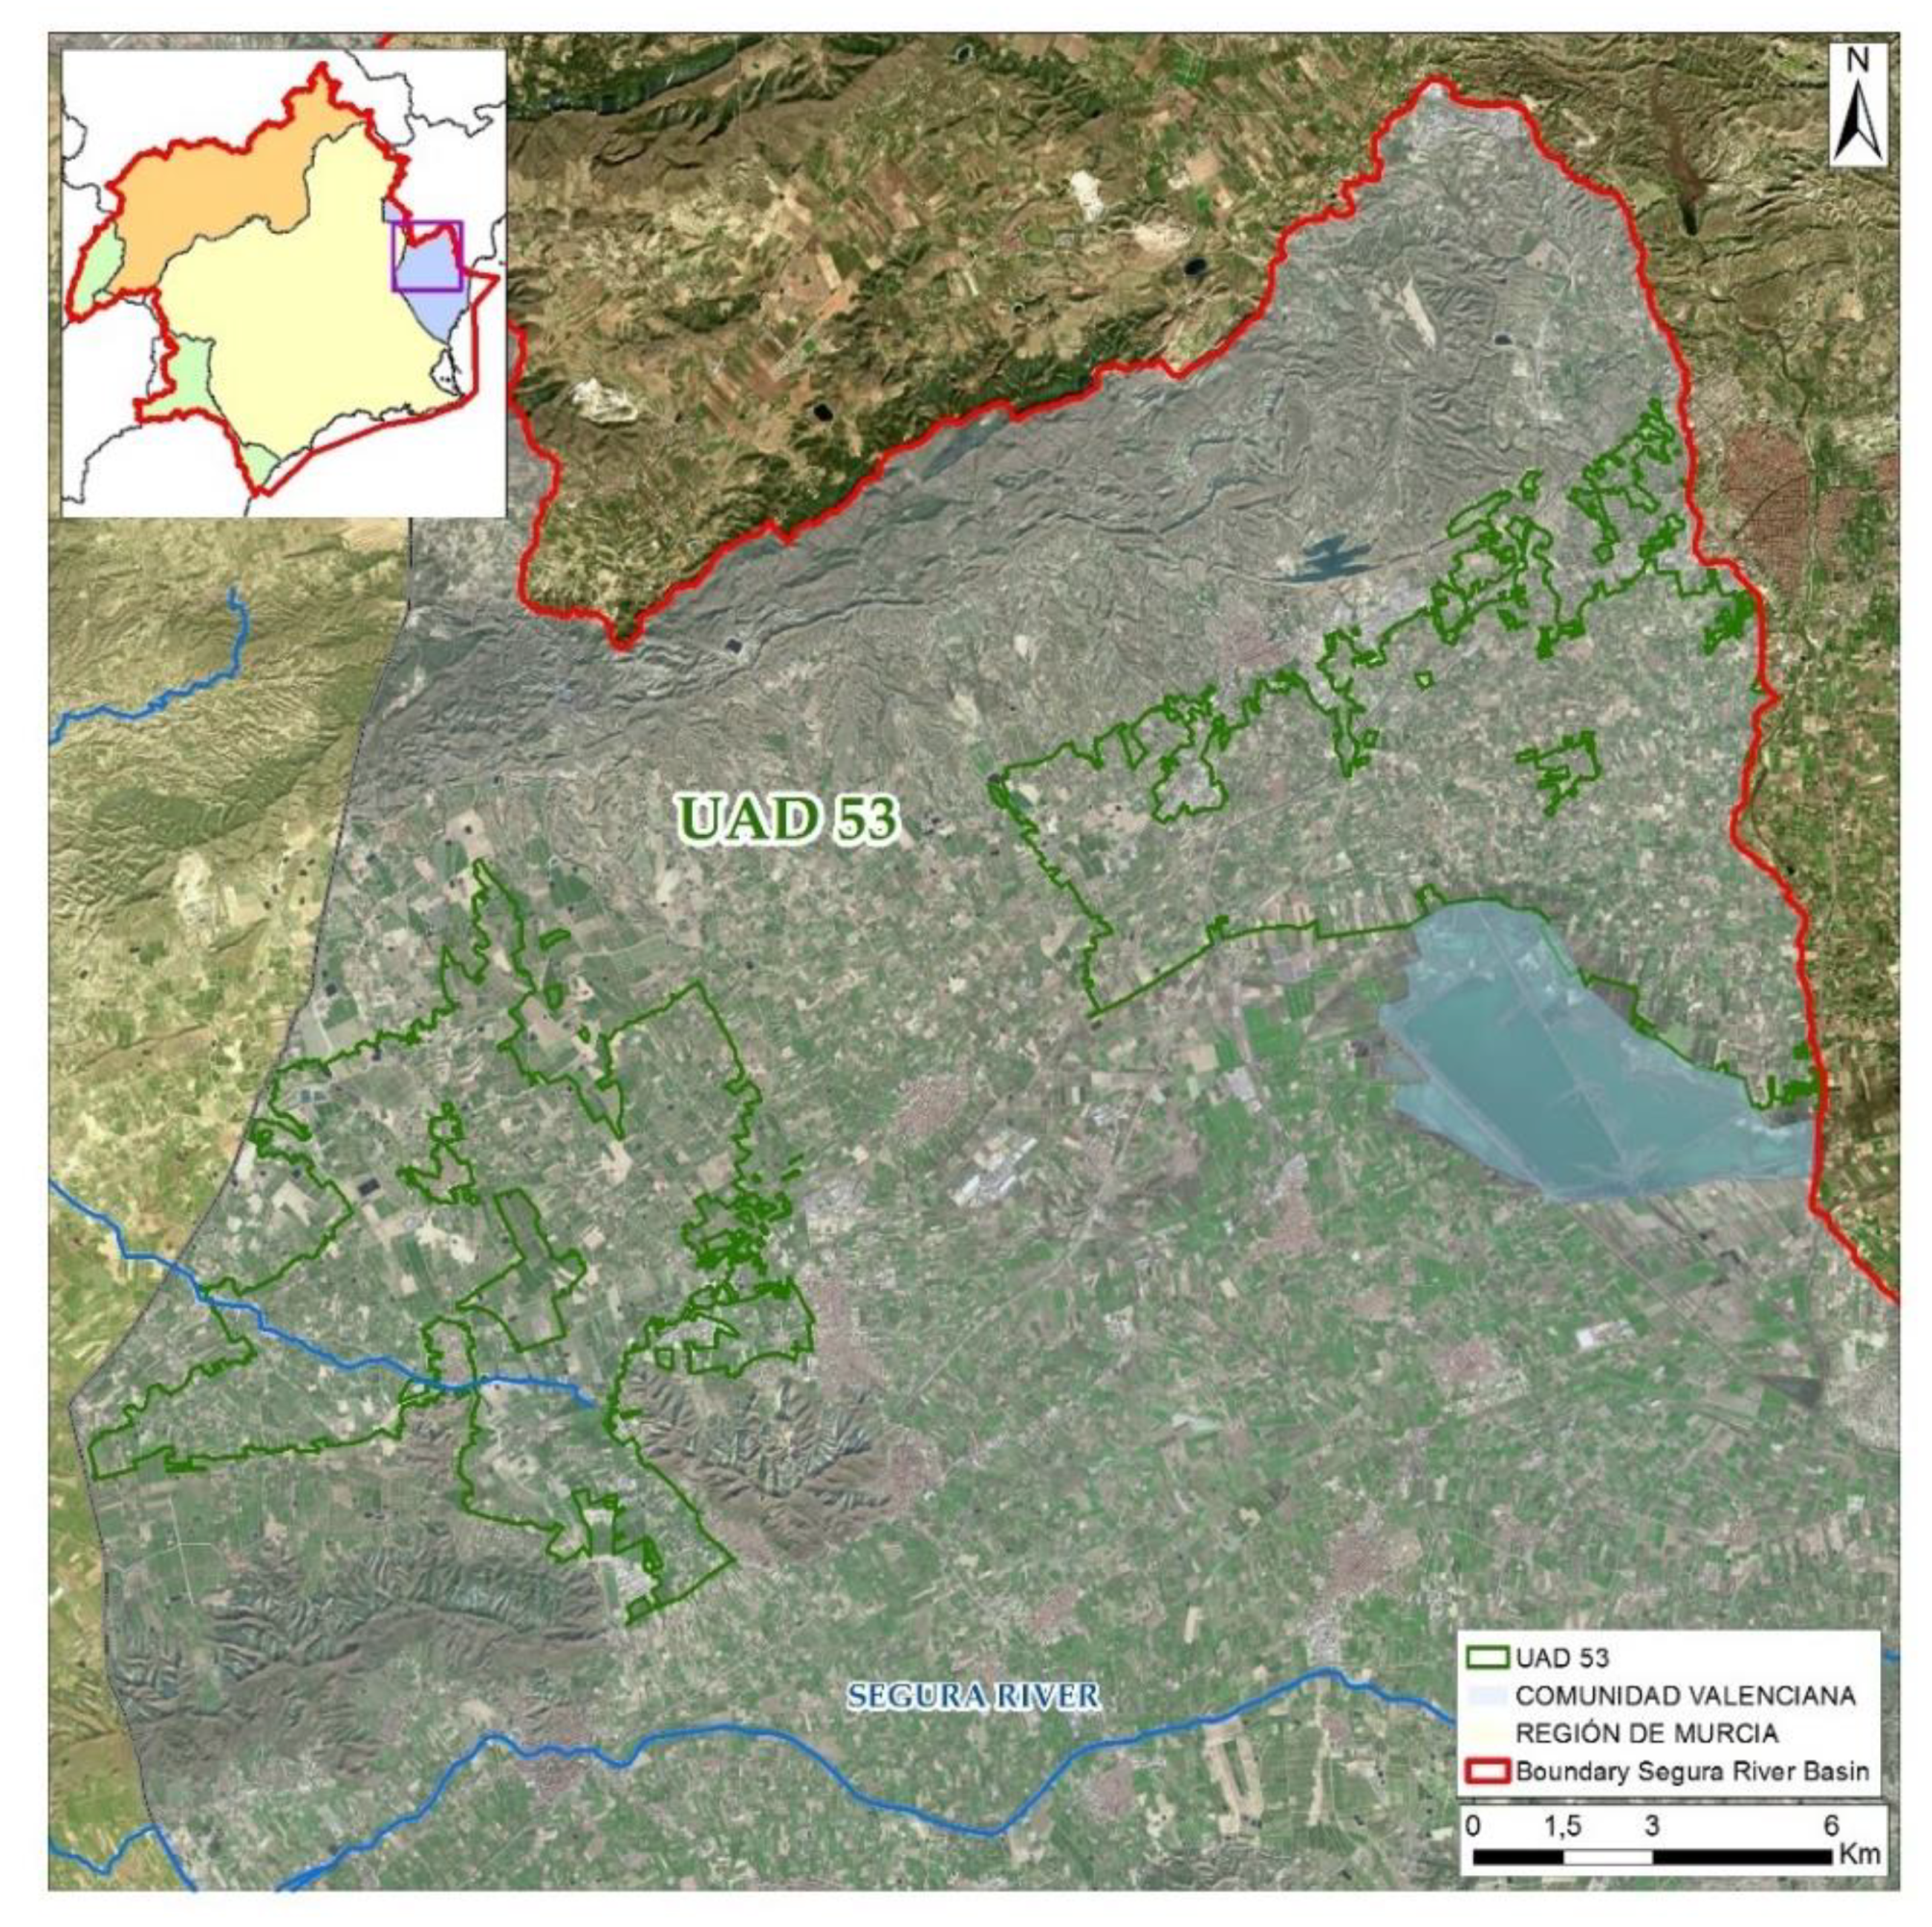
As established in the SBHP 2015/21, the Segura River Basin has a total of 64 units of agricultural demand (UAD) irrigated with resources managed from the basin itself with a gross surface area amounting to 490,318 ha. However, there are 2 UADs (one in the province of Alicante and another in the province of Almería) that are located outside of the limits of the basin, so their net areas are not estimated in the SBHP 2015/21. Therefore, the net irrigation area associated with the 62 UADs within the basin is 262,393 ha [
22].
Figure 2 represents the UAD 53 as an example:
The UADs can be defined as irrigated areas that share common characteristics according to the fundamental criterion of constituting a distinguishable management unit in terms of the origin of their resources, their administrative conditions, type of irrigation, hydrological similarity or strictly territorial considerations [
2].
In order to analyse the effect that drought has had on irrigated crops, the remote sensing studies developed in recent years by the Hydrological Planning Office of the Segura Hydrographic Confederation (HPO of the SHC) have been taken into account: “Estudios de Cuantificación de la Superficie Regada mediante Teledetección y SIG en la Cuenca del Segura” (calendar years 2015, 2016, 2017, 2018 and 2019) [
24].
The methodology followed has been previously applied in the Segura River Basin in order to determine the distribution and evolution of the irrigated area. It proved to be a valid and robust procedure for the monitoring of agricultural demands. The maps of irrigated crops have been generated based on the digital processing of satellite images (numeric matrices that store data related to the reflectivity of the different elements of the territory and can be digitally processed, such as the plant canopy, photosynthetic activity and the humidity of the vegetative structures) and their integration with spatial and cartographic data. For the specific case in hand, high resolutions images have been used supplied by the Landsat 8 satellite. These images are validated and complemented with aerial orthophotography supplied by the National Plan for Aerial Orthophotography (PNOA) [
24].
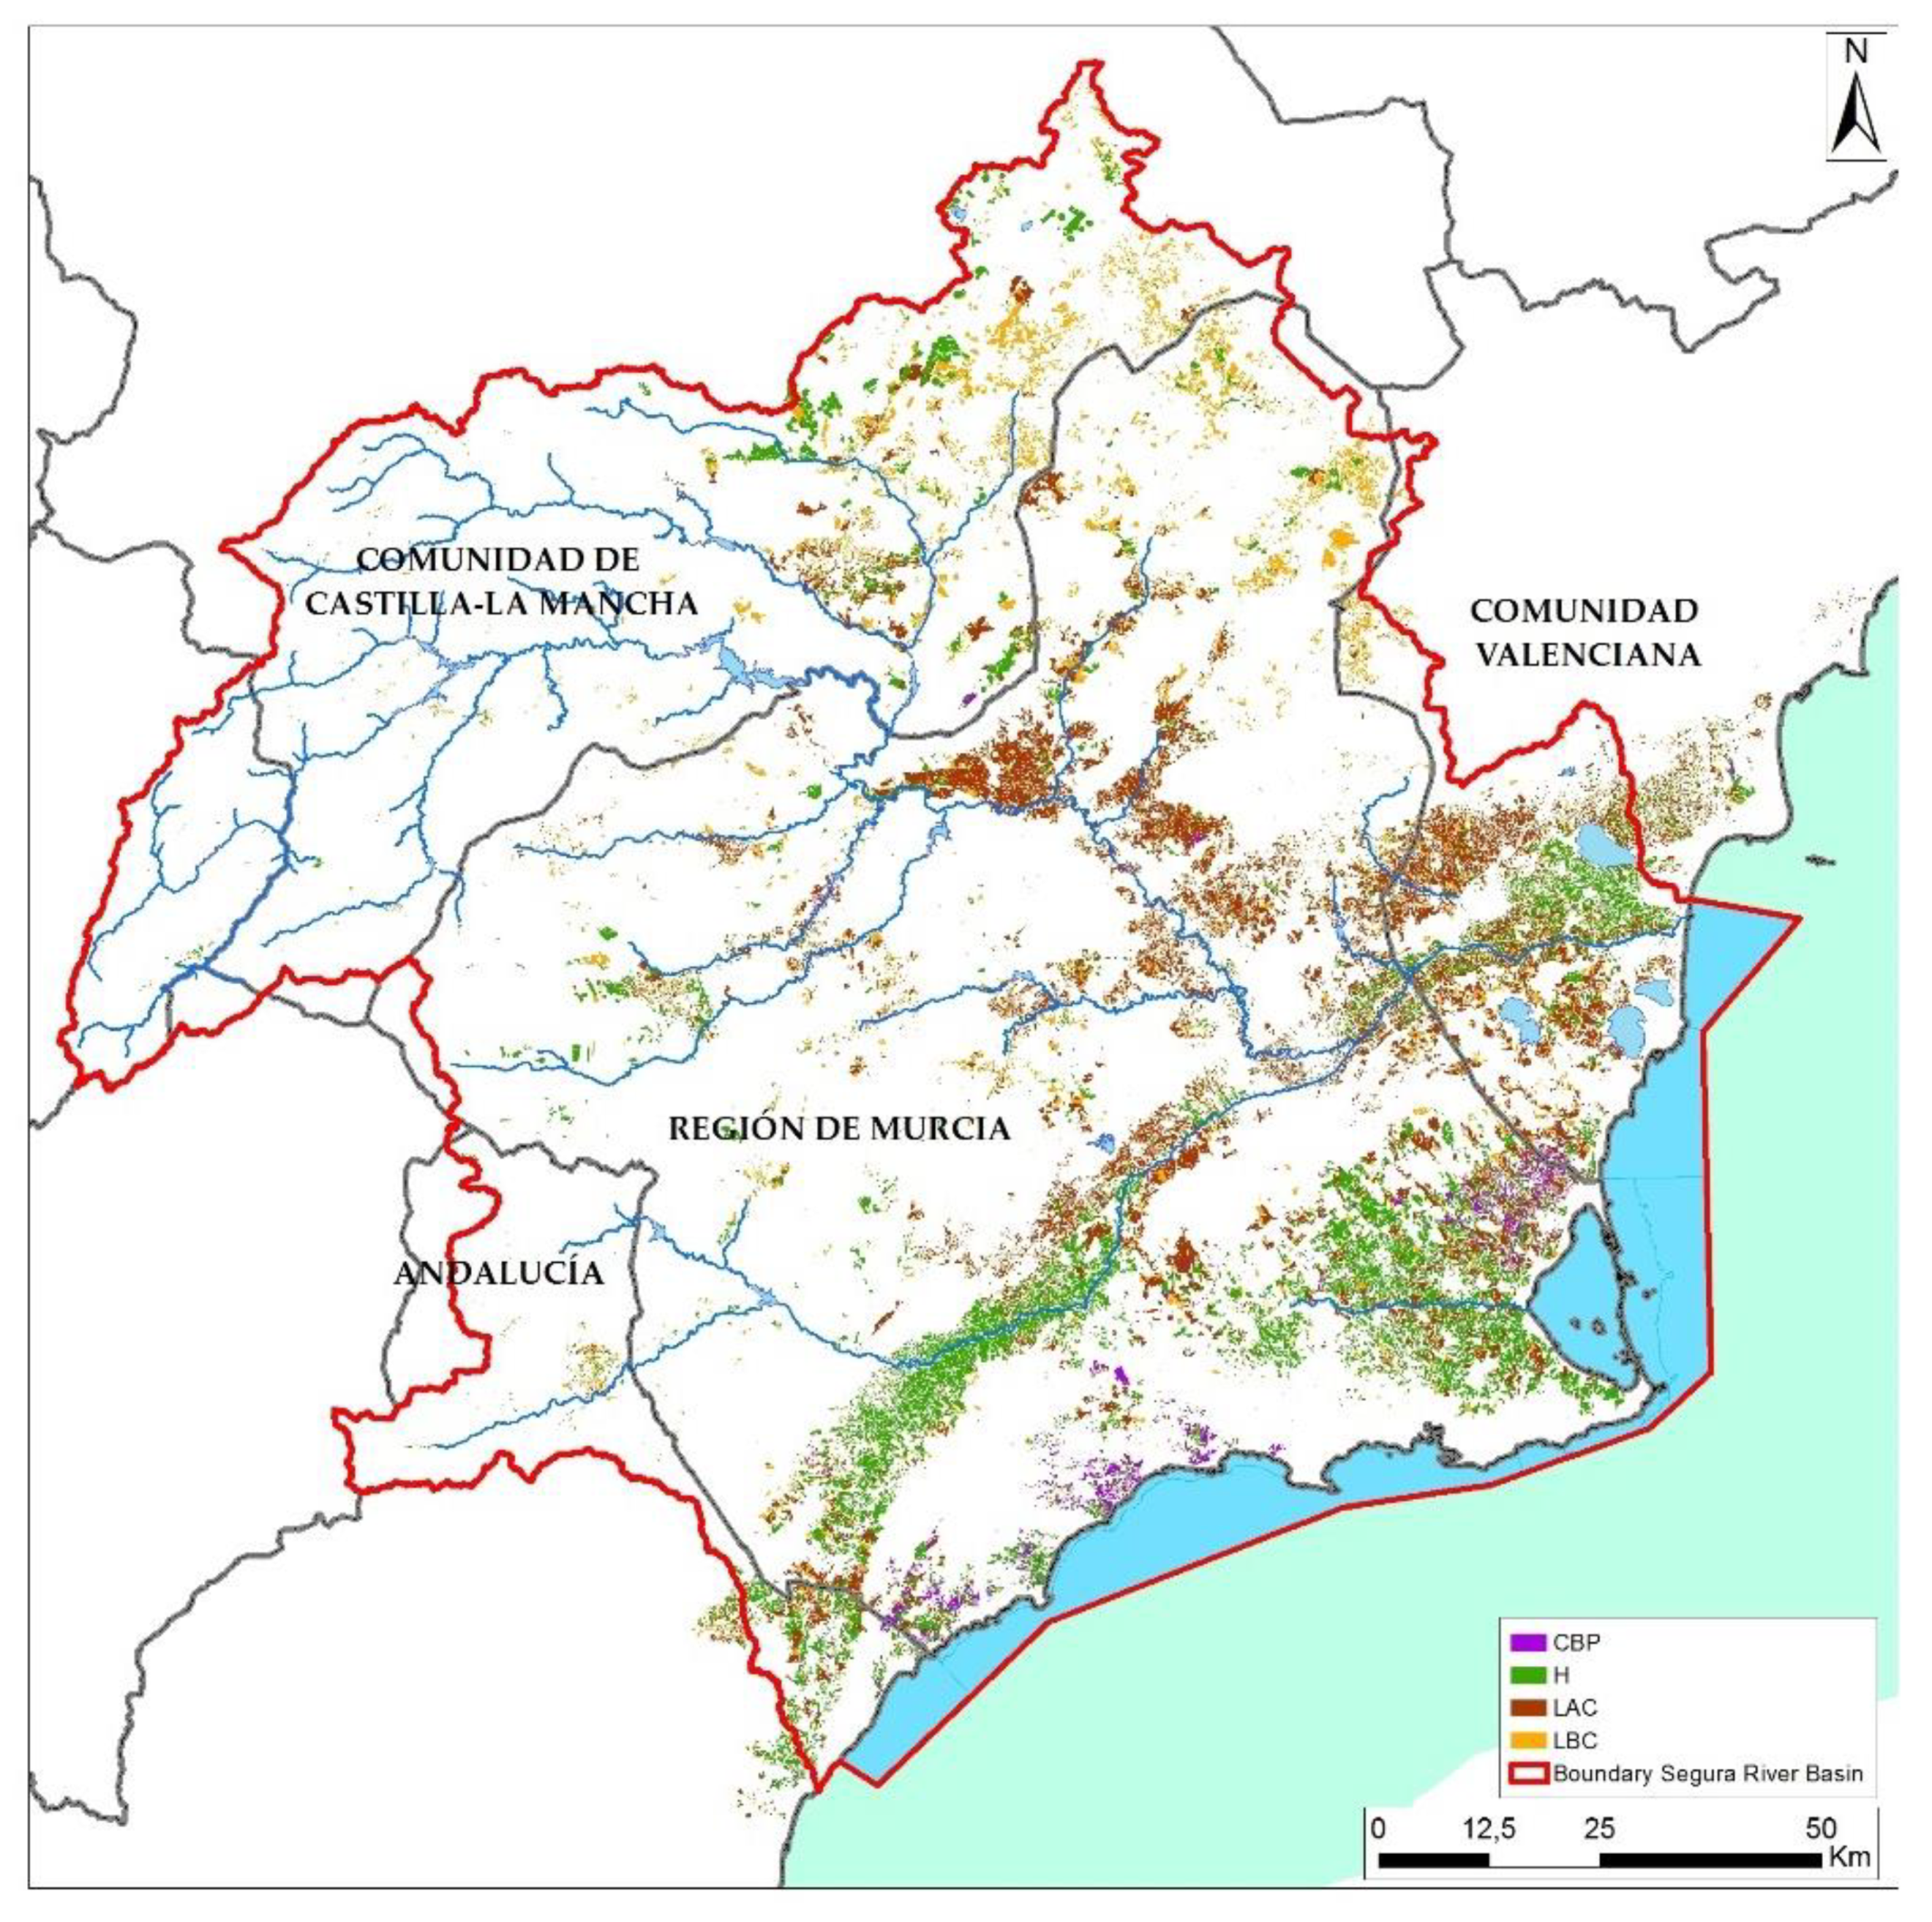
The crops have been classified into the following types [
24], represented in
Figure 3:
Woody crops with a high vegetative cover (WHC) and woody crops with a low vegetative cover (WLC): the group of woody crops with a high vegetative cover includes citrus trees as the principal crop and other high consumption crops such as deciduous fruit trees, vines for table grapes or olive bushes. The woody crops with a low vegetative cover include tree crops with a much lower planting density and canopy area, such as almond trees, olive trees, vines or young plantations of high-yielding crops.
The identification of these types of crop is based on the integration of photo interpretation and remote sensing techniques and the maps of wood crops generated in previous campaigns in order to take advantage of the semi-permanent nature of these types of plantations.
Crops in greenhouses and under fixed plastic structures (CBP): a specific unsupervised classification algorithm has been applied which has been complemented with the calculation of an index that seeks the response of plastic instead of vegetation.
Horticultural crops (H): determined by taking into account the moment of irrigation and differentiating between spring, summer, autumn and winter irrigation. This division contemplates the fact that the phenology of each crop determines the moment of maximum evapotranspiration and, therefore, it is directly related to the irrigation allocation.
These studies have enabled the quantification of the irrigated area (maps of irrigated crops) within and outside each UAD in the Segura River Basin, differentiating between the types of crop indicated. Taking as a base the data referring to the areas of crop distribution and the irrigation allocations stipulated in the SBHP 2015/21, we can calculate the water applied in each UAD, taking into account the following considerations:
Woody (WHC and WLC): allocations defined in the SBHP 2015/21 for the 62 UADs, applying a reduction of 10%, due to a decrease in the frequency of irrigation in the drought period [
25]. This study evaluates the reduction of the allocation for citrus trees by 8% ± 5.94. The same document also indicates that there are studies [
26] that show that deficit irrigation in citrus crops, if conducted correctly, can achieve acceptable levels of production, together with a significant saving of water.
Under plastic (CUP): allocations defined in the SBHP 2015/21 for the 62 UADs, without considering any type of reduction.
Horticultural crops (H): the remote-sensing rotations observed in each calendar year have been considered, assigning each of them with an unrestricted allocation (if these types of crops do not have resources, in many cases, they are not grown).
Once the irrigated area and the water applied to each of the UADs has been determined, the production value and the net margin are then estimated for each of them. To do this, the base used is the economic characterisation of the use of irrigation carried out by the HPO in collaboration with the Department of Business Economics of the Technical University of Cartagena (UPCT), for creating the SBHP 2009/12 [
27] and updating it for its review SBHP 2015/21 [
2].
This study analyses the economic repercussion of the use of the water resource and its variations in agricultural production through the use of functions (non-linear mathematical programming method) related to each UAD and according to the availability of water (applied water) and its corresponding rates (rate of upstream flows for harvesting, storage, impoundment and transport of surface water to the intake of the Irrigation Communities), the production value and the net margin. These functions have been defined for each UAD because, as their name indicates, they share common management characteristics due to the origin of their resources, their administrative conditions, their type of irrigation, hydrological similarity or strictly territorial considerations [
2].
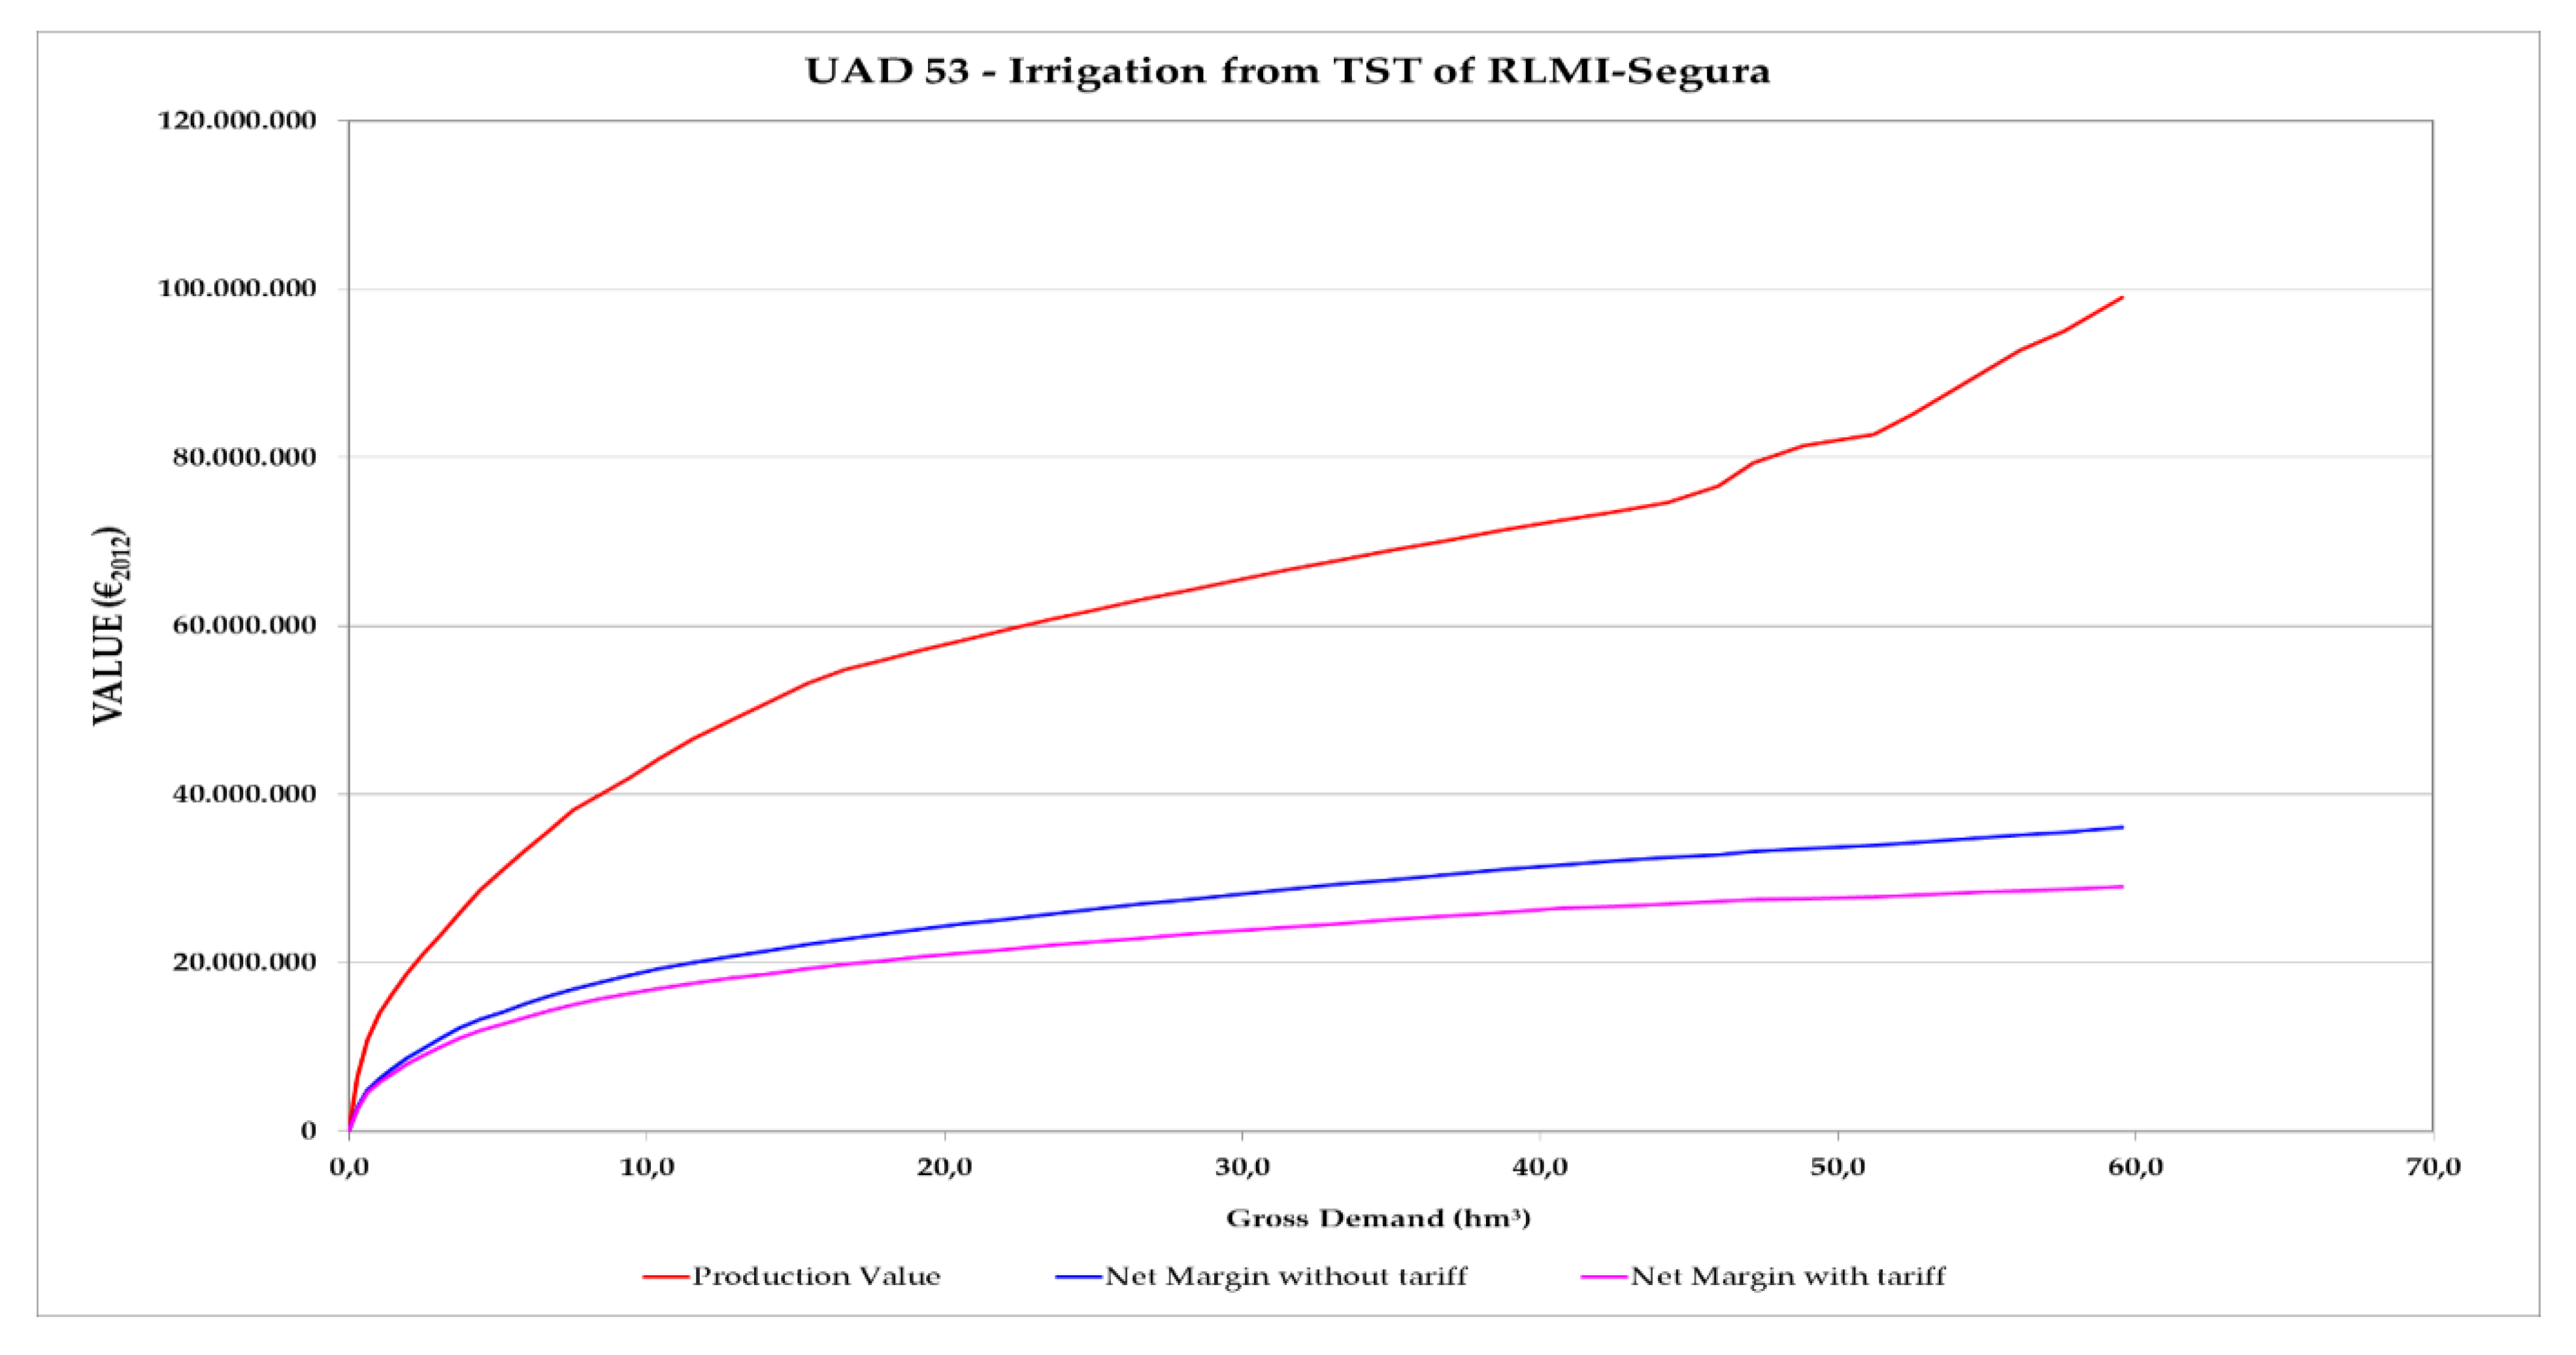
In the curves defined for each UAD, the water and the area are assigned first to the most profitable crops. Therefore, as the total availability of water increases, the production value and the net margin also increase, but the pace of this growth becomes slower. From a certain level of allocation, the curves stop growing as there is a limit imposed by the maximum net area of each area, so that, even though there is more water available, it would not be used as the maximum net area established in the SBHP 2015/21 has been reached.
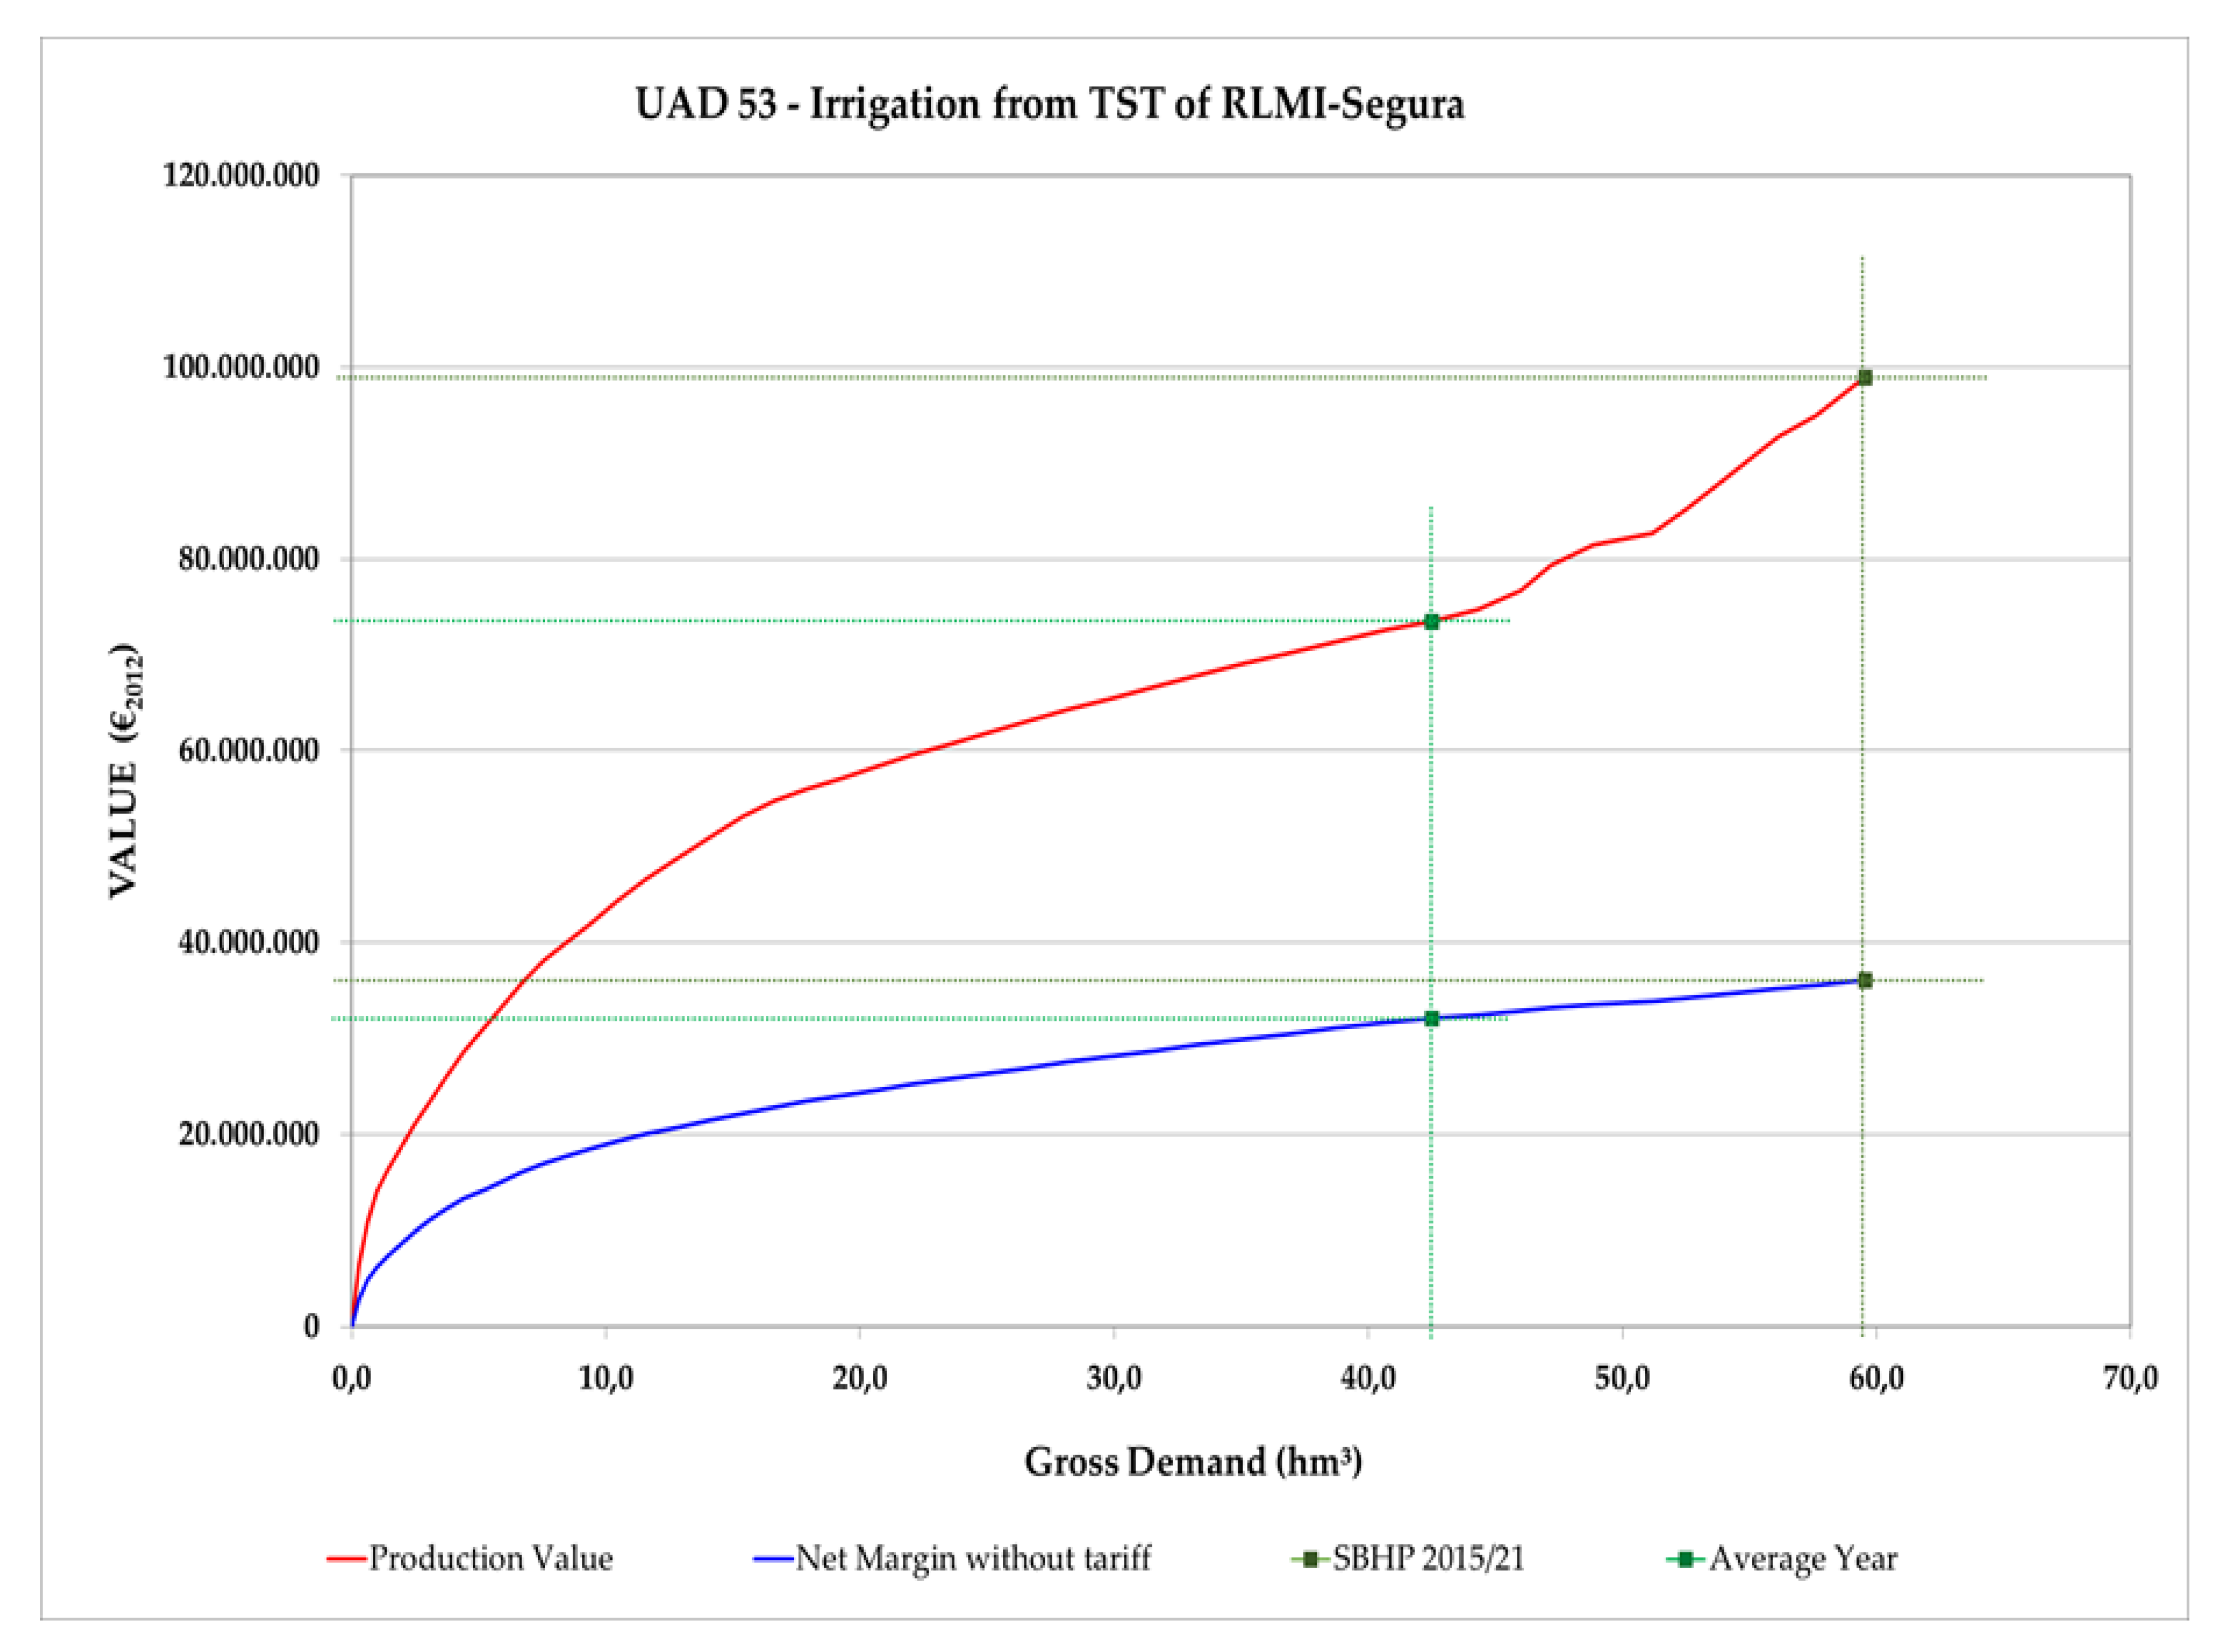
Figure 4 shows the ratio obtained between the net margin, with and without a tariff, and the production value according to the gross demand of the UAD.
Annex III of Attachment 3, Uses and Demands of the SBHP 2015/21 [
28], includes, for each UAD, its curve of the production value and net margin (€
2012), with or without a tariff, according to the net irrigated area that is cultivated, which, in turn, depends on the gross water resources available to the UAD and it also includes its curve of the production value and net margin, with and without a tariff, in accordance with gross demand.
Based on these curves, and by substituting the calculated water applied in each year of the drought (2015, 2016, 2017, 2018 and 2019) for each UAD, we seek to obtain the production value and net margin and in this way quantify the impact of the drought in economic terms.
4. Results
4.1. Economic Characterisation of Irrigation (Segura River Basin Hydrological Plan (SBHP) 2015/21)
In the SBHP 2015/21 and specifically in Attachment 3 Uses and Demands [
2], the UADs are defined as “irrigated areas that share common characteristics according to the fundamental criterion of constituting a distinguishable management unit, in terms of the origin of their resources, their administrative conditions, their type of irrigation, hydrological similarity or strictly territorial considerations”.
The estimation of the gross area of the UADs in the SBHP 2015/21 has been carried out as follows:
Comprehensive irrigated area obtained in the remote sensing studies (calendar years 2008, 2009, 2010, 2011, 2012 and 2013) developed by the HPO.
Area of the water rights recorded in the Water Registry and digitalised in April 2015.
To estimate the net area of each UAD, the representative value has been considered as the maximum value of the irrigated area detected through remote sensing in the years 2011, 2012 and 2013, except in the UADs of the irrigated areas of the transfer (IAT). As previously mentioned, only the net area of the UADs located within the territory of the Segura River Basin has been calculated (62 UADs).
In the SBHP 2015/21, after estimating the net area and net allocations, according to the type of crop and for each UAD, the net demand of each UAD has been calculated as the product between the net area of each type of crop and the net allocation to each. After calculating the net demand for each UAD, finally, the gross demand for each UAD has been calculated, obtained as the quotient of net demand and the coefficients of efficiency (application, piping and distribution): To sum up, the global figures according to the four territorial units defined in the SDP 2018 [
3] are shown in
Table 1:
Law 52/1980, of 16 October [
29] regulated the economic regime of its exploitation (calculation of tariffs, their liquidation and destination) and its Ninth Additional Provision introduced a fundamental change in the Tajo-Segura Transfer (TST). As previously mentioned, both the original project and Law 21/1971 contemplated 600 hm³/year of surpluses in the headwaters of the River Tajo [
30], of which 400 hm³/year were established as the maximum transferable amount for irrigation in 61 irrigation communities, including all of those in the 18 UADs of the IAT sub-system.
However, historically, the volume transferred has been, on average, 205 hm³/year (series of 1980/81–2011/12), which has generated a problem of under-resourcing in these UADs. Therefore, the real net area for one year with the average transfer for irrigation (205 hm³/year) will be reduced by a quantity corresponding to the volume actually applied on average. The volume applied in the 18 UADs of the TST in an average year of transfer is 435 hm³/year (SBHP 2015/21), with 205 hm³/year corresponding to the TST and 230 hm³/year to other resources, while gross demand amounts to 617 hm³/year, generating an application deficit of 182 hm³/year [
31].
In order to be able to equate this deficit with an area in the IATs, an analysis has been conducted of the irrigated area in the years 2008–2013 (studies used in the SBHP 2015/21 for the characterisation of the UADs) [
24], obtaining the maximum value of the irrigated area for the 16 UADs. The reduction experienced (12,200 ha) by the IAT sub-system is reflected in
Table 2, where the areas of the rest of the territorial units are maintained.
This difference between the maximum net area and the real net area (assimilated to the remote sensing studies of the six years used) resides in the capacity that the 18 UADs of the IATs would have to absorb the maximum transfer (400 hm³/year).
The gross demand associated with the 62 UADs included in the Segura River Basin amount to 1487 hm³/year, as established in the SBHP 2015/21. In turn, this Plan also includes an estimate of the average water applied, reaching 1302 hm³/year, with a difference of 185 hm³/year (under-resourcing due to the lack of a guarantee of transferred resources) [
31].
Table 3 displays the values of areas and the applied water in order to show the ratio between the two.
With respect to the economic characterisation of irrigation, the values obtained for each UAD are included in Annex III of Attachment 3 Uses and Demands of the SBHP 2015/21 (update of tariffs 2016 [
32]), and give an overall production value of 3003 M€
2016/year, for a net area of 262,393 ha (11,445 €
2016/ha) and a gross demand of 1487 hm³/year (2.02 €
2016/m³); while the net margin (without tariff) amounts to 1373 M€
2016/year (5233 €
2016/ha y 0.92 €
2016/m³) [
28].
Given that the calculations carried out to estimate the value of production and the net margin are based on the net area and gross demand of the SBHP 2015/21, they do not reflect the average situation in the basin and a new estimate is required, adapting to the average net area (250,193 ha) and the 1302 hm³/year applied on average. In order to do this, based on the demand curves established for each UAD in the SBHP 2015/21, the average volumes of applied water have been substituted, thereby obtaining the associated value of production and net margin.
Figure 5 shows, as an example, UAD 53 and the reduction of the production value and net margin experienced with the application of 60 hm³/year (gross demand SBHP 2015/21) and with the average application of 43 hm³/year (calculated applied water):
The following
Table 4 and
Table 5 include the results obtained (production value and net margin) both from the SBHP 2015/21) (fully meeting demands) and those considered for the average year where we can see the opportunity cost generated by not being able to apply the maximum volume that Law 52/1980 allows to be transferred from the Tajo:
As we can see in the previous table, the production value of the 62 UADs increases from 3003 M€2016/year to 2857 M€2016/year, which represents a reduction of 146 M€2016 per year. This is primarily due to the resources not transferred from the Tajo, leading to a reduction of 131 M€2016/year in the IAT sub-system.
The case of the net margin is similar. A total of 1373 M€2016/year is reached when demand is fully satisfied, however, with the average application of resources this figure falls to 1326 M€2016/year, that is, a reduction of 47 M€2016/year, mainly concentrated in the IAT sub-system (41 M€2016/year).
4.2. Economic Characterisation of Irrigation in Drought of 2015–2019
The information analysed for characterising the drought of 2015–2019 has been obtained from the remote sensing studies developed by the HPO of the SHC in recent years (2015, 2016, 2017, 2018 and 2019), which has enabled us to obtain the irrigated area and the estimate of applied water [
24].
The
Table 6 shows the results obtained of the maps of irrigated crops or each of the years analysed. They reveal the reduction experienced in the years of drought, from an average irrigated area of 250,000 ha to 233,000 ha in 2017; a decrease of 17,000 ha. This reduction is even greater within the UADs (27,000 ha), as the area detected outside of them (10,000 ha) compensates this decrease. Subsequently, we can observe the increase occurring until 2019. Although the average area of 250,000 ha is not reached, the values of the year 2015 are recovered, exceeding 242,000 ha, corroborating the normal state (drought indices) reached in 2019. It is important to indicate the increase of the irrigated area outside of the UADs, which reached a maximum of 12,000 ha in 2019.
With respect to applied water, as previously described, this is calculated in accordance with the irrigated area and type of crop. With the results obtained and applying the gross irrigation allocations established in the SBHP 2015/21 by type of crop and UAD, the resources used have been obtained [
2]. The criteria used have been previously described and the general formula applied is the following:
The
Table 7 shows the amount of applied water calculated for each of the years of drought analysed and the gross demand and applied water considered in the SBHP 2015/21:
Applied water would have suffered a considerable decrease in the years analysed. The SBHP 2015/21 establishes a gross demand for the 62 UADs of 1487 hm³/year and an average of 1302 hm³/year has been applied (consequence of an average transfer of 205 hm³ as opposed to 400 hm³). However, in the years of the drought, the applied water decreased below the average, falling to a minimum level of 1193 hm³ in 2017, which is a decrease of 110 hm³ with respect to the average applied. It is worth pointing out that this amount includes the application of resources outside of the UAD, accounting for 40 hm³/year.
In the same way as the irrigated area, from 2017 there was an upturn in applied water, caused by an increase in natural resources together with the maintenance of extraordinary resources. As a result, in the year 2019 the application of resources exceeded the average estimated in the SBHP 2015/21, reaching 1338 hm³/year together with more than 50 hm³ applied outside of the UADs.
By types of crop, the horticultural crops suffered the greatest impact, as their cultivated area and volume of applied water reduced between 2015 and 2017 as did their subsequent growth until 2019. On the contrary, permanent and woody crops and those grown under plastic conserved a stable application of resources in the drought period, with the allocations decreasing by 10% in the case of the woody crops.
The follow-up reports of the SBHP 2015/21 analyse the origin of the resources applied. Six blocks have been classified in order to facilitate the analysis:
Natural resources: from the river and renewable underground extractions.
Reuse: direct and indirect reuse and reuse through channels.
External transfers: including resources transferred from the Tajo and Negratín.
Over-exploitation: including non-renewable underground extractions.
Desalination: including desalinated volumes for agricultural use.
Extraordinary: during the current drought period and pursuant to the Royal Decree on Drought it has been possible to transfer extraordinary resources, mitigating the reduction in applied resources. The resources calculated correspond to extraordinary desalination, groundwater extractions (strategic battery drilling) [
18], contracts for assigning water rights [
19,
33] and other resources.
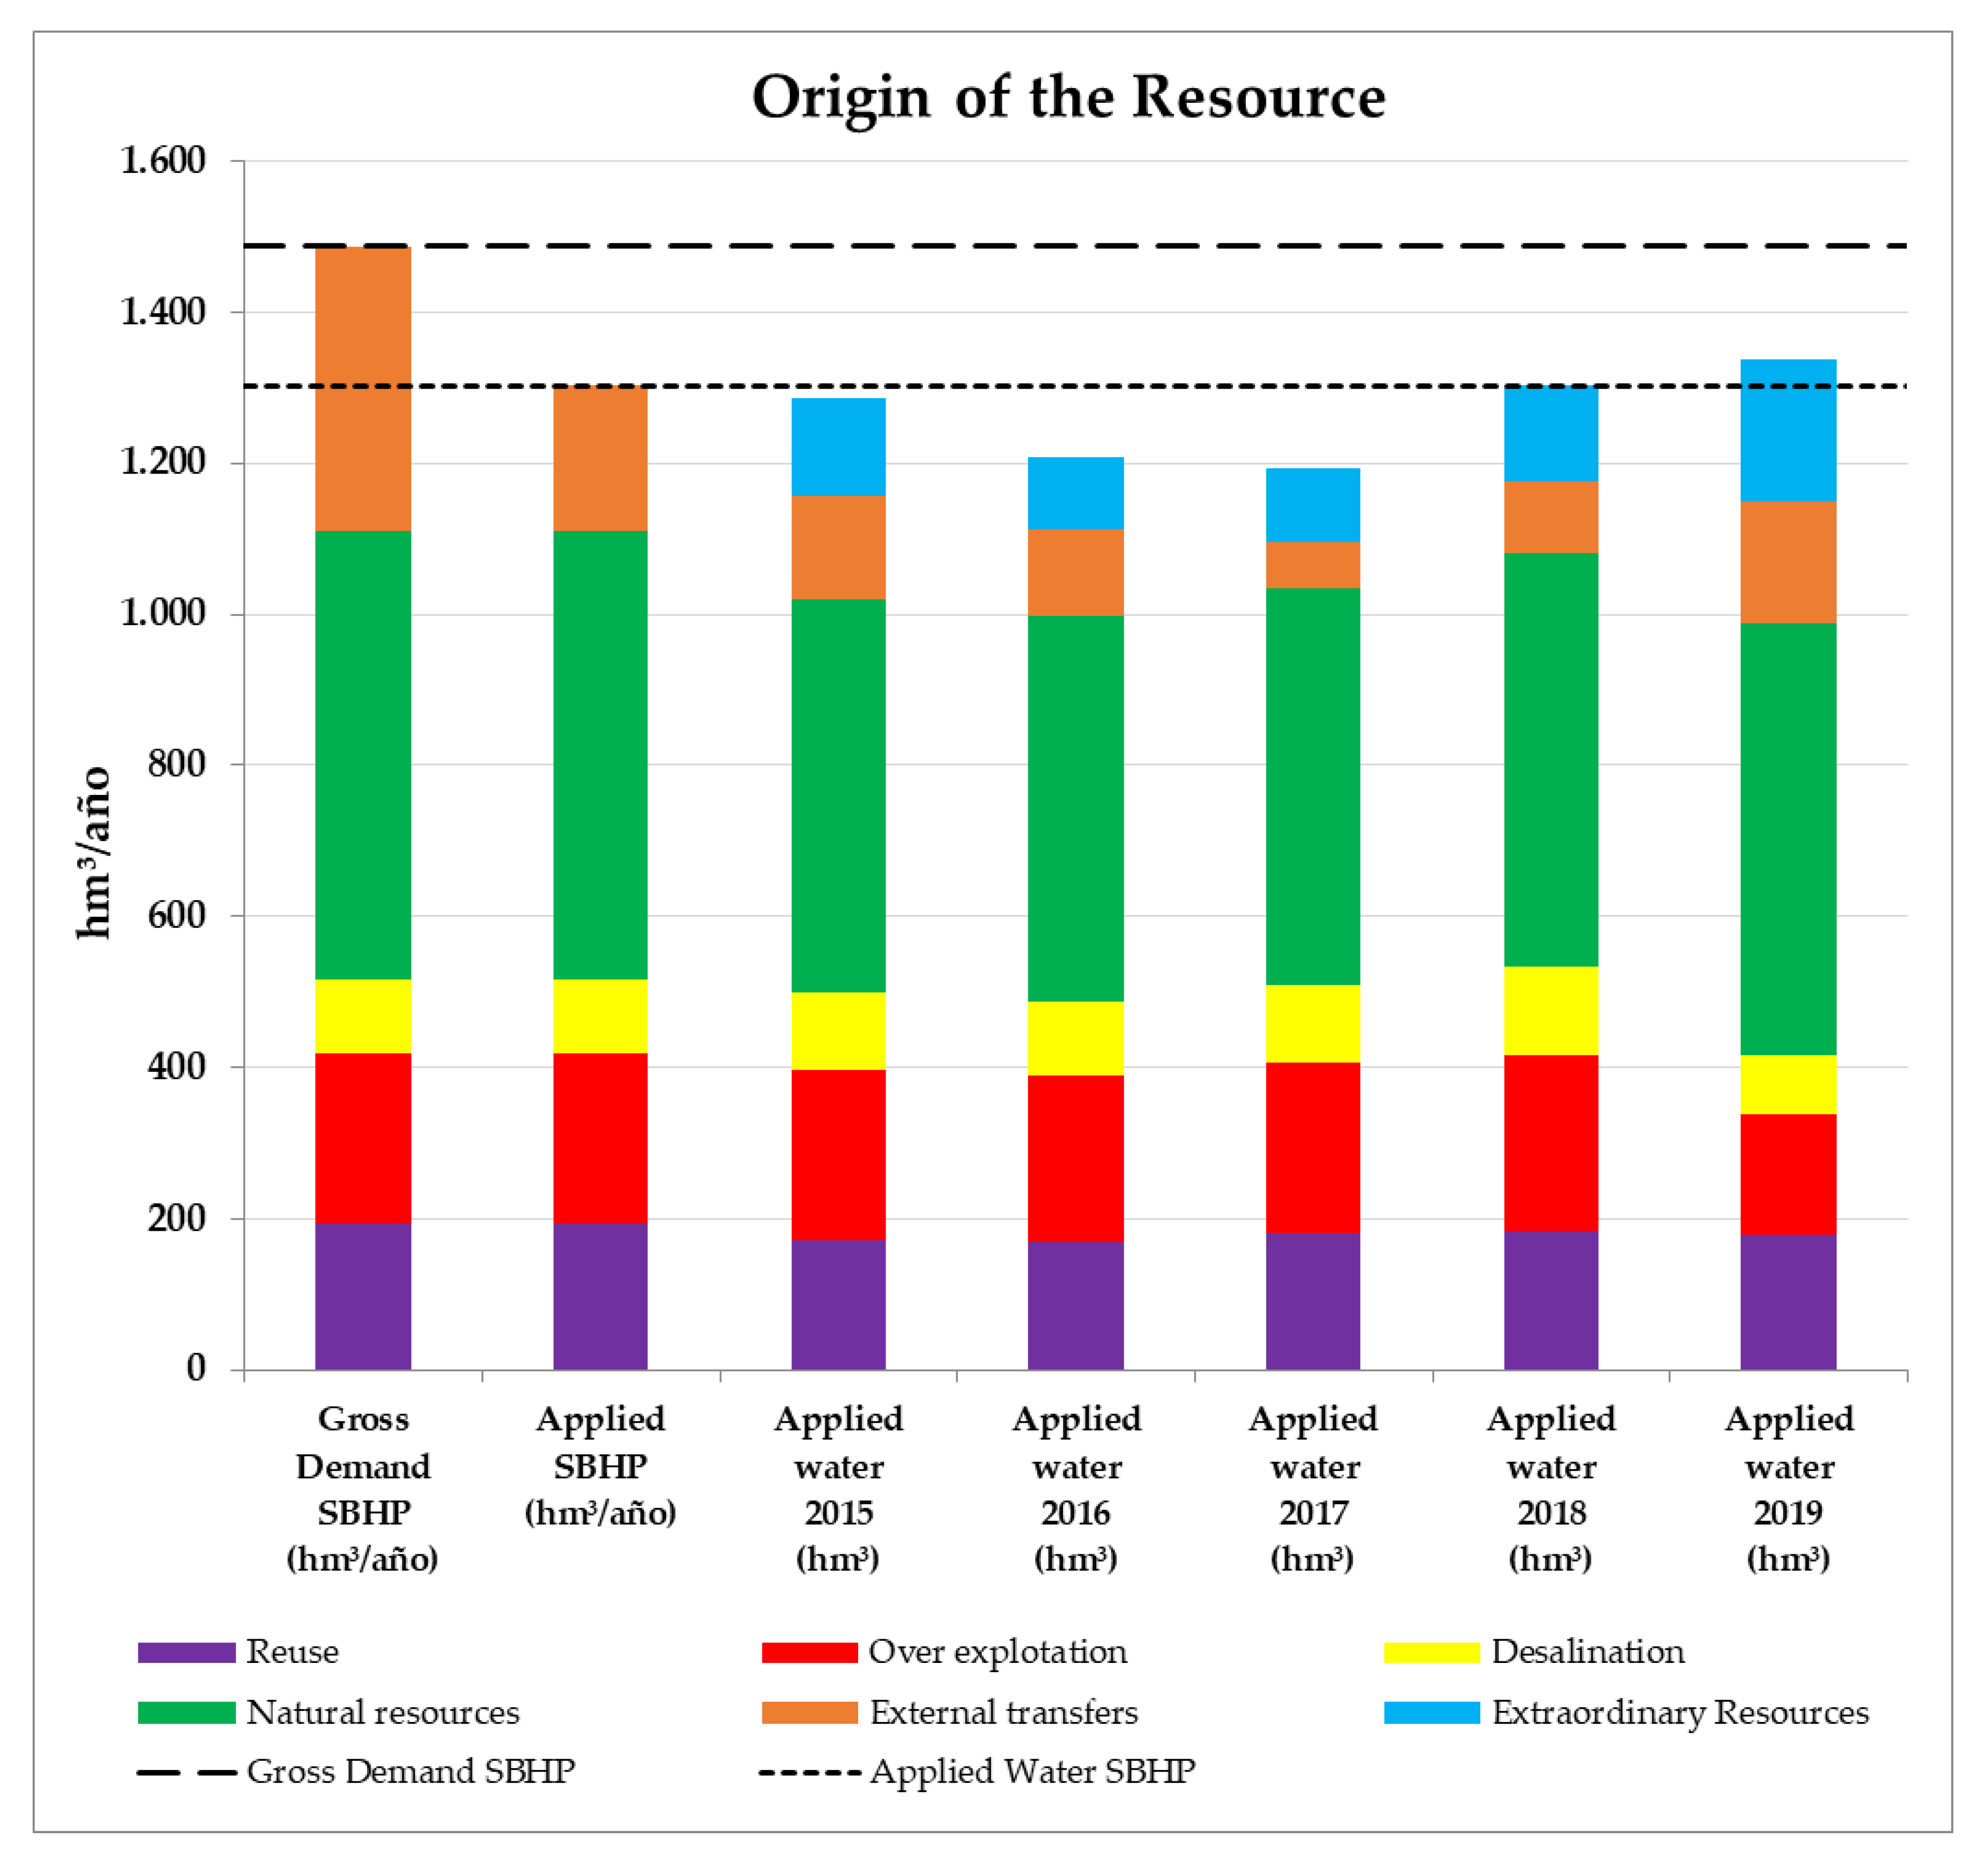
The
Table 8 shows the origin of the resources applied on average and in the years of drought analysed (represented in
Figure 6). Particularly striking is the reduction in transferred resources and natural resources until 2017 and their subsequent recovery until 2019, when there was a clear upturn in natural and transferred resources, together with the maintenance of a significant volume of extraordinary resources.
The variation in the resources transferred from the Tajo, as previously indicated is reflected in the external transfers. The agricultural demands met by these transfers in the SBHP amounted to 378 hm³/year (with 18 hm³ transferred from the Negratín and 371 hm³ from the Tajo), but on average only 193 hm³/year were applied, as the average transfer from the Tajo was 176 hm³/year (16 UADs of the IATs within the Segura River Basin). In the years analysed, the resources from the Tajo were lower than the average, as previously indicated, with a volume of 115 hm³ in 2015, 94 hm³ in 2016 and 40 hm³ in 2017, as after May 2017 no transfers were approved between the two basins (level 4) until April 2018 (level 3).
This situation of not transferring resources was the result of the application of the rules of exploitation of the Tajo-Segura transfer included in the fifth additional provision of Law 21/2015, of 20 July [
34], which establish levels depending on the joint stocks of the Entrepeñas and Buendía reservoirs (Tajo basin), according to which the maximum volumes to transfer are established. Therefore, level 4 (stocks below 400 hm³) does not permit the transfer of water, level 3 (stocks over 400 hm³ but below those established in the Tajo Hydrological Plan for each month, on average 625 hm³) allows a maximum transfer of 20 hm³/month (discretionary act, subject to the approval of the minister, prior report of the Central Operating Commission), level 2 (stocks above level 3 but below 1300 hm³) allows a transfer of 38 hm³/month (automatic, regulated act), and finally level 1 (stocks above 1300 hm³) allows a transfer of 60 hm³/month (regulated act) up to the maximum annual volume allowed [
29].
After analysing the irrigated area and the applied water, the production value and net margin associated with each UAD are analysed, taking as a base the economic characterisation of the use of irrigation carried out in the SBHP 2015/21, through the use of functions relating to each UAD and depending on the availability of water (applied water), the production value and net margin.
For the years of drought the procedure previously indicated has been followed, substituting the values of applied water of each year in the individual curves of each UAD.
Table 9 and
Table 10 show the values obtained:
Both the production value and the net margin decreased until 2017 in the 62 UADs of the basin. In the case of the production value there was an increase from 2857 M€ with the average applied water of the SBHP to 2761 M€ in the year 2017, which is a decrease of 96 M€. And for the case of the net margin, there was a reduction from 1326 M€ to 1282 M€ in 2017 (decrease of 44 M€). This situation within the UADs reversed from the year 2017, giving rise to an increase until 2019 when a production value of 2854 M€ was reached and a net margin of 1320 M€, both values are very close to those estimated with the average resource application.
However, as previously analysed, a cultivated area outside of the UADs has been identified, implying an application of resources that is not contemplated in the SBHP and therefore leading to an increase in the production value and net margin. In order to estimate the production value and net margin outside of the UADs, the product of the applied water outside of the UADS and the average values in €/m³ of the basin for each year has been calculated.
Considering this increase, the values obtained within the UAD in the years 2015, 2016, 2017, 2018 and 2019 are compensated, even exceeding the values obtain on average in the SBHP, as is the case of the years 2015 and 2018 (years of considerable movement of extraordinary resources) and in 2019 even reaching values similar to the maximum values considered in the SBHP 2015/21 with the full satisfaction of demand.
This circumstance highlights the distribution of water carried out during the drought period. Although the entire volume demanded by the UADs was not reached, in terms of production value and net margin very similar values were reached, reflecting a distribution of water to the UADs with higher crop yields, in detriment to others with lower yields.
In order to analyse this circumstance it is necessary to study certain UADs in order to determine the application of resources and its repercussion in economic terms.
5. Discussion
In the years of drought analysed, there was an overall decrease in the irrigated area and the application of resources (within the UAD), but as previously shown, this has not translated into an overall reduction in the production value and net margin with respect to the average value estimated.
With respect to the production value, within the UADs it fell from a yearly average of 2857 M€ to 2830 M€ in 2015, with a decrease of only 27 M€ to which we must add the production value of the crops outside of the UAD (95 M€) giving a final amount of 2926 M€. In the years 2016 and 2017, values of 2862 M€ and 2761 M€ were reached respectively within the UADs, but when adding the part outside of them (90 M€ and 98 M€), production values of 2852 M€ and 2859 M€ are obtained, practically the same average value established in the SBHP. Finally, in the years 2018 and 2019, there was a clear increase within the UADs to 2838 M€ and 2854 M€, respectively, increasing to 2942 M€ and 2969 M€ when the production outside of the UADs is considered (104 M€ and 115 M€), placing these values very close to the production value with the full satisfaction of demand (3003 M€). The
Table 11 provides a detailed analysis by territorial unit and year:
In the headwater system, the reductions in irrigated areas and applied water are approximately 40%, while the reduction in the production value is around 15%. This is also the case of the right bank tributaries, where the reduction of areas and applied water are approximately 30% and the values of production have only decreased by 15%. Finally, the same situation prevails in the other sub-system with greater reduction, the plains of the Segura; reductions in applied water and the irrigated area of close to 20% and, on the contrary the production values decreased by only 5% on average. However, as we can see in the table above, in the IAT sub-system there is an increase in the production value that reaches 4% in 2019.
With respect to the net margin, the conclusions are similar to those obtained for the production value. Within the UADs there are decreases in the years 2015, 2016 and 2017, with the lowest value being obtained in the latter (1282 M€) which is only compensated with the value for the area outside the UADs (46 M€), placing the net margin at the average level of resource application (1327 M€). In the years 2018 and 2019, the decrease within the UAD was very small and when the net margin corresponding to the area outside of the UADs is considered, values similar to that off full demand satisfaction are obtained (1373 M€).
The analysis per territorial unit reflects how the headwater system suffers greater reductions (17%) followed by the right bank tributaries (12%) and to a lesser degree the plains sub-system (5%) and the left bank tributaries (5%). In the same way as with the production value, the IAT sub-system exceeds the average net margin by 2%. The
Table 12 displays these results by territorial unit and year:
As indicated in the methodology section, in the demand curves defined for each UAD, the water and area are first assigned to the highest yielding crops. As the total availability of water increases, the net margin and production value also increase although the pace of their growth becomes increasingly slower. Therefore, if we reduce the applied water, first that assigned to the lower yielding crops is reduced, generating a smaller decrease in the production value and net margin [
28].
In the drought period analysed (2015, 2016, 2017, 2018 and 2019), in practically the whole of the UAD there was a reduction in applied water, the production value and the net margin with respect to the average values of the SBHP, but the mobilisation of extraordinary resources (130 hm³ in 2015 and 97 hm³/year in the years 2016 and 2017, 128 hm³ in 2018 and 190 hm³ in 2019) (
Table 8) enabled a greater application of resources than the average contemplated in the SBHP in the most profitable UADs. In addition to the mobilisation of extraordinary resources, the application of resources from the Tajo-Segura transfer may not have been conducted according to the rules established in the SBHP [
31] and the most profitable areas were prioritised over the less profitable areas (as we shall see in the case of Alicante).
As we can see in
Table 4, the average production value lost in the basin amounts to 146 M€/year, mainly concentrated in the IATs (16 UDA) with a loss of 131 M€/year.
In the drought period the volumes transferred were reduced to zero from May 2017 which would have generated even greater losses without the application of extraordinary resources. As we have seen in this study, these extraordinary resources have been very high, which has enabled the decrease in the transferred resources to be mitigated. However, the distribution of these resources has not been homogeneous throughout the basin, but mainly concentrated in the IATs.
Table 13 provides a summary of the UADs that have increased their production value in the years of drought with respect to the estimated production value, considering the average water applied (SBHP) and almost all of them are located in the IAT sub-system. Some of them, such as UAD 58 of the Campo de Cartagena, experienced an increase of 17% (35 M€) with respect to the average established in the SBHP.
With respect to the net margin, the situation is similar.
Table 14 provides a summary of the UADs that have increased their net margin in the years of drought with respect to the estimated production value considering the average water applied (SBHP) and almost all of them are located in the IAT sub-system.
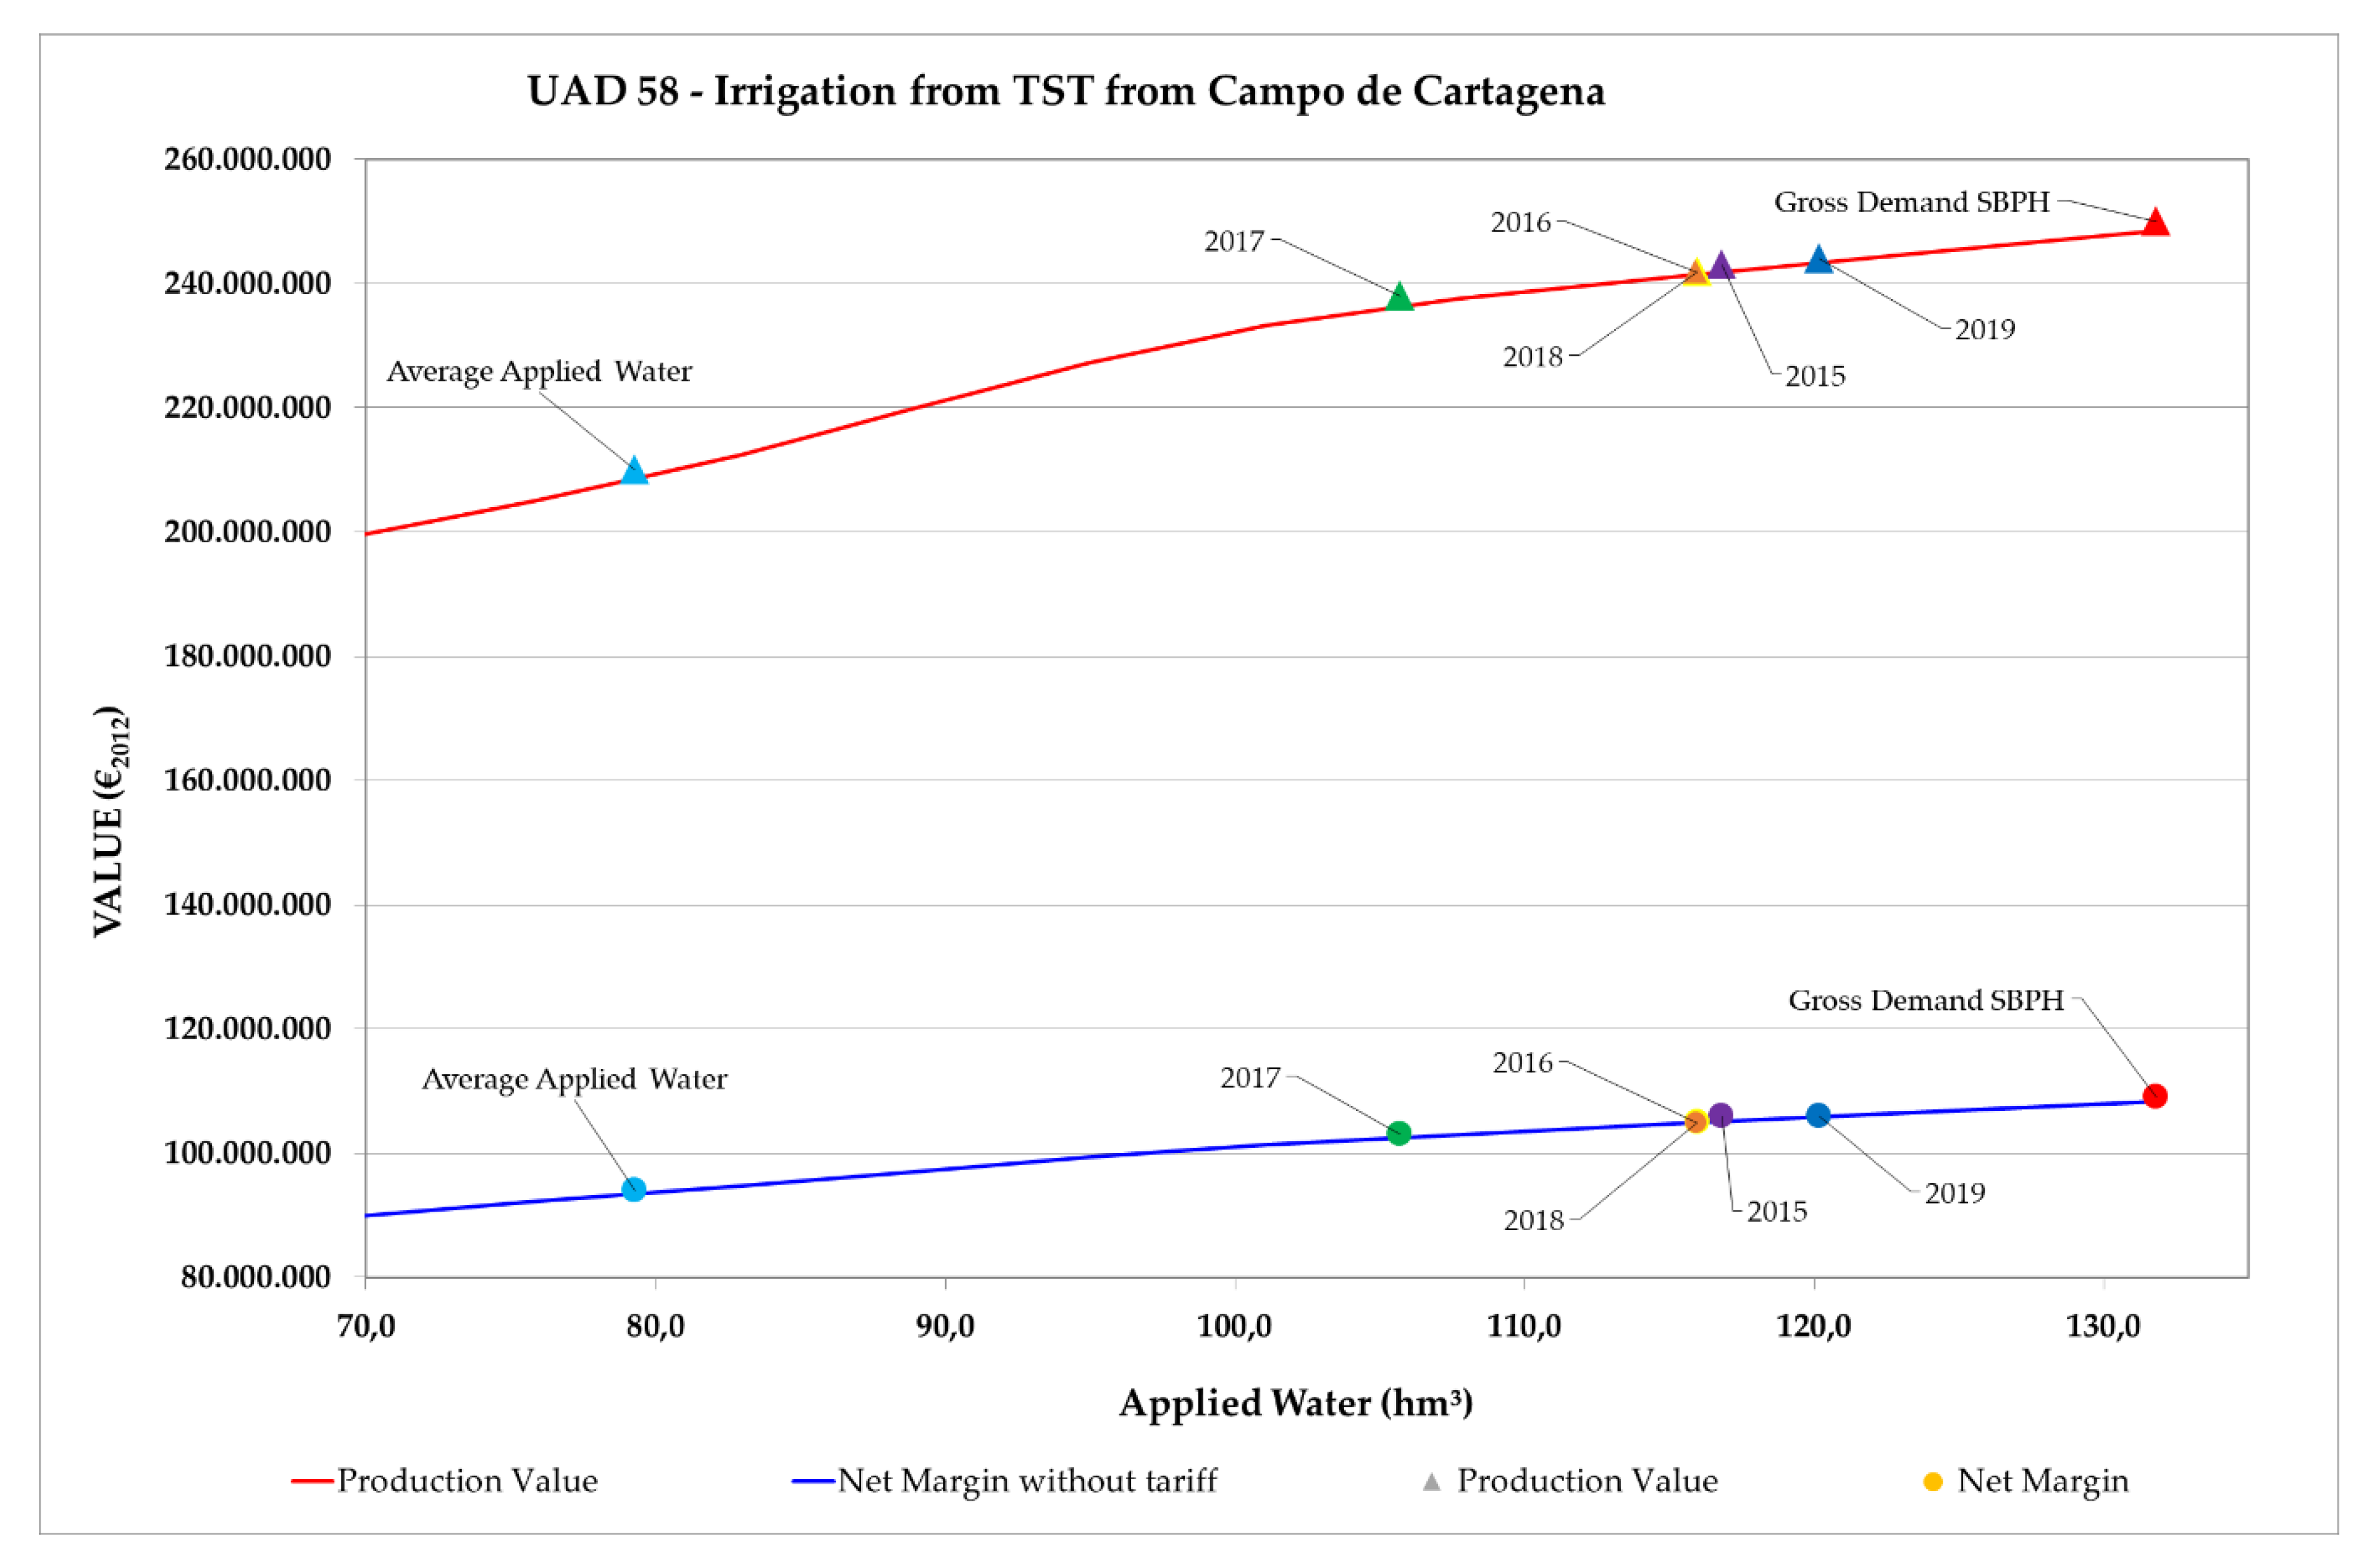
Below, UAD 58 is analysed in depth. It is irrigated land receiving water from the TST Campo de Cartagena and belongs to the AIT sub-system of the I Principal territorial unit, where there was a clear increase in the production value and net margin in the drought period analysed.
UAD 58 is located in Campo de Cartagena in the Region of Murcia. In the SBHP 2015/21 it is recorded as having a gross area of 33,079 ha and a net area of 19,259 ha (11,170 ha of outdoor horticultural crops, 6355 ha of woody crops, mainly citrus fruits and 1733 ha of crops grown under plastic). The demand associated with this UAD is 131.8 hm³/year, but with the average application of resources considered in the SBHP (proportional to the exploitation rules) only 79.3 hm³/year (62.5 hm³ considered of the TST) are applied, generating an application deficit of 52.3 hm³/year [
35].
The three main irrigation communities in the UAD are the Campo de Cartagena Irrigation Community, the S.A.T. (agrarian transformation company ) nº 5724 Los Meroños and the S.A.T. nº 557 Isidoro García Ráez, where 100% of the irrigation systems are located [
35].
In order to fully meet demand (131.8 hm³/year) the SBHP establishes a production value of 250 M€
2016/year (1.89 €
2016/m³) and a net margin of 109 M€
2016/year (0.82 €
2016/m³) [
28]. However, as estimated in this study with the average application considered in the SBHP (79.3 hm³/year), the production value would decrease to 210 M€
2016/year (40 M€ less per year), giving rise to a higher profitability (2.64 €/m³), and the net margin would decrease to 94 M€
2016/year (15 M€ less per year), also increasing profitability to 1.18 €
2016/m³. This justifies reducing the applied water in the less profitable crops first [
28].
As we can observe in the graph above (
Figure 7), in the years of drought (2015-2019), the applied water was lower than demand (131.8 hm³), higher than the average applied water considered in the SBHP (79.3 hm³), falling to a minimum of 105.7 hm³ in 2017 and rising to a maximum of 120.2 hm³ in 2019. Substituting these values in the demand curve, we obtain a minimum production value of 238 M€
2016 (2.25 €/m³) in the year 2017 and a maximum value of 244 M€
2016 (2.04 €/m³) in 2019; and a minimum net margin of 103 M€
2016 (0.97 €/m³) in the year 2017 and a maximum of 106 M€
2016 (0.89 €/m³) in 2019, which represents a slight decrease with respect to the full satisfaction of demand but a considerable increase with respect to the average applied water considered in the SBHP (34 M€ in terms of the production value of 2019 and 12 M€ in terms of the net margin of the same year). However, the yields fall when less water is applied, which justifies our previous comment as the most profitable crops are the first to be irrigated.
After presenting the cases of some UADs that have increased their production value and net margin with respect to the average established in the SBHP, now we will consider the opposite case, where, despite the mobilisation of extraordinary resources, these UADs have not received sufficient water to be able to palliate the effects of the drought.
Table 15 provides a summary of the UADs that have experienced reductions in their production value in the years of drought with respect to the estimated production value considering the average water applied (SBHP). Only those UADs with production values that decreased by more than 10% (during the period analysed) have been included, with respect to the production value estimated for an average application of resources.
Some of them, such as UAD 53 of the Riegos de Levante Margen Izquierda-Segura, experienced a decrease of 13% (10 M€) with respect to the average of the SBHP in 2017, which would increase to 35 M€ with respect to the production value with the full satisfaction of demand. Although it is not the UAD with the highest losses, due to its strategic importance in the province of Alicante and its connection with the TST, it should be analysed in depth.
The situation is similar in the case of the net margin. The
Table 16 provides a summary of the UADs that have experienced a decrease in their net margin in the years of drought with respect to the estimated net margin considering the average water applied (SBHP).
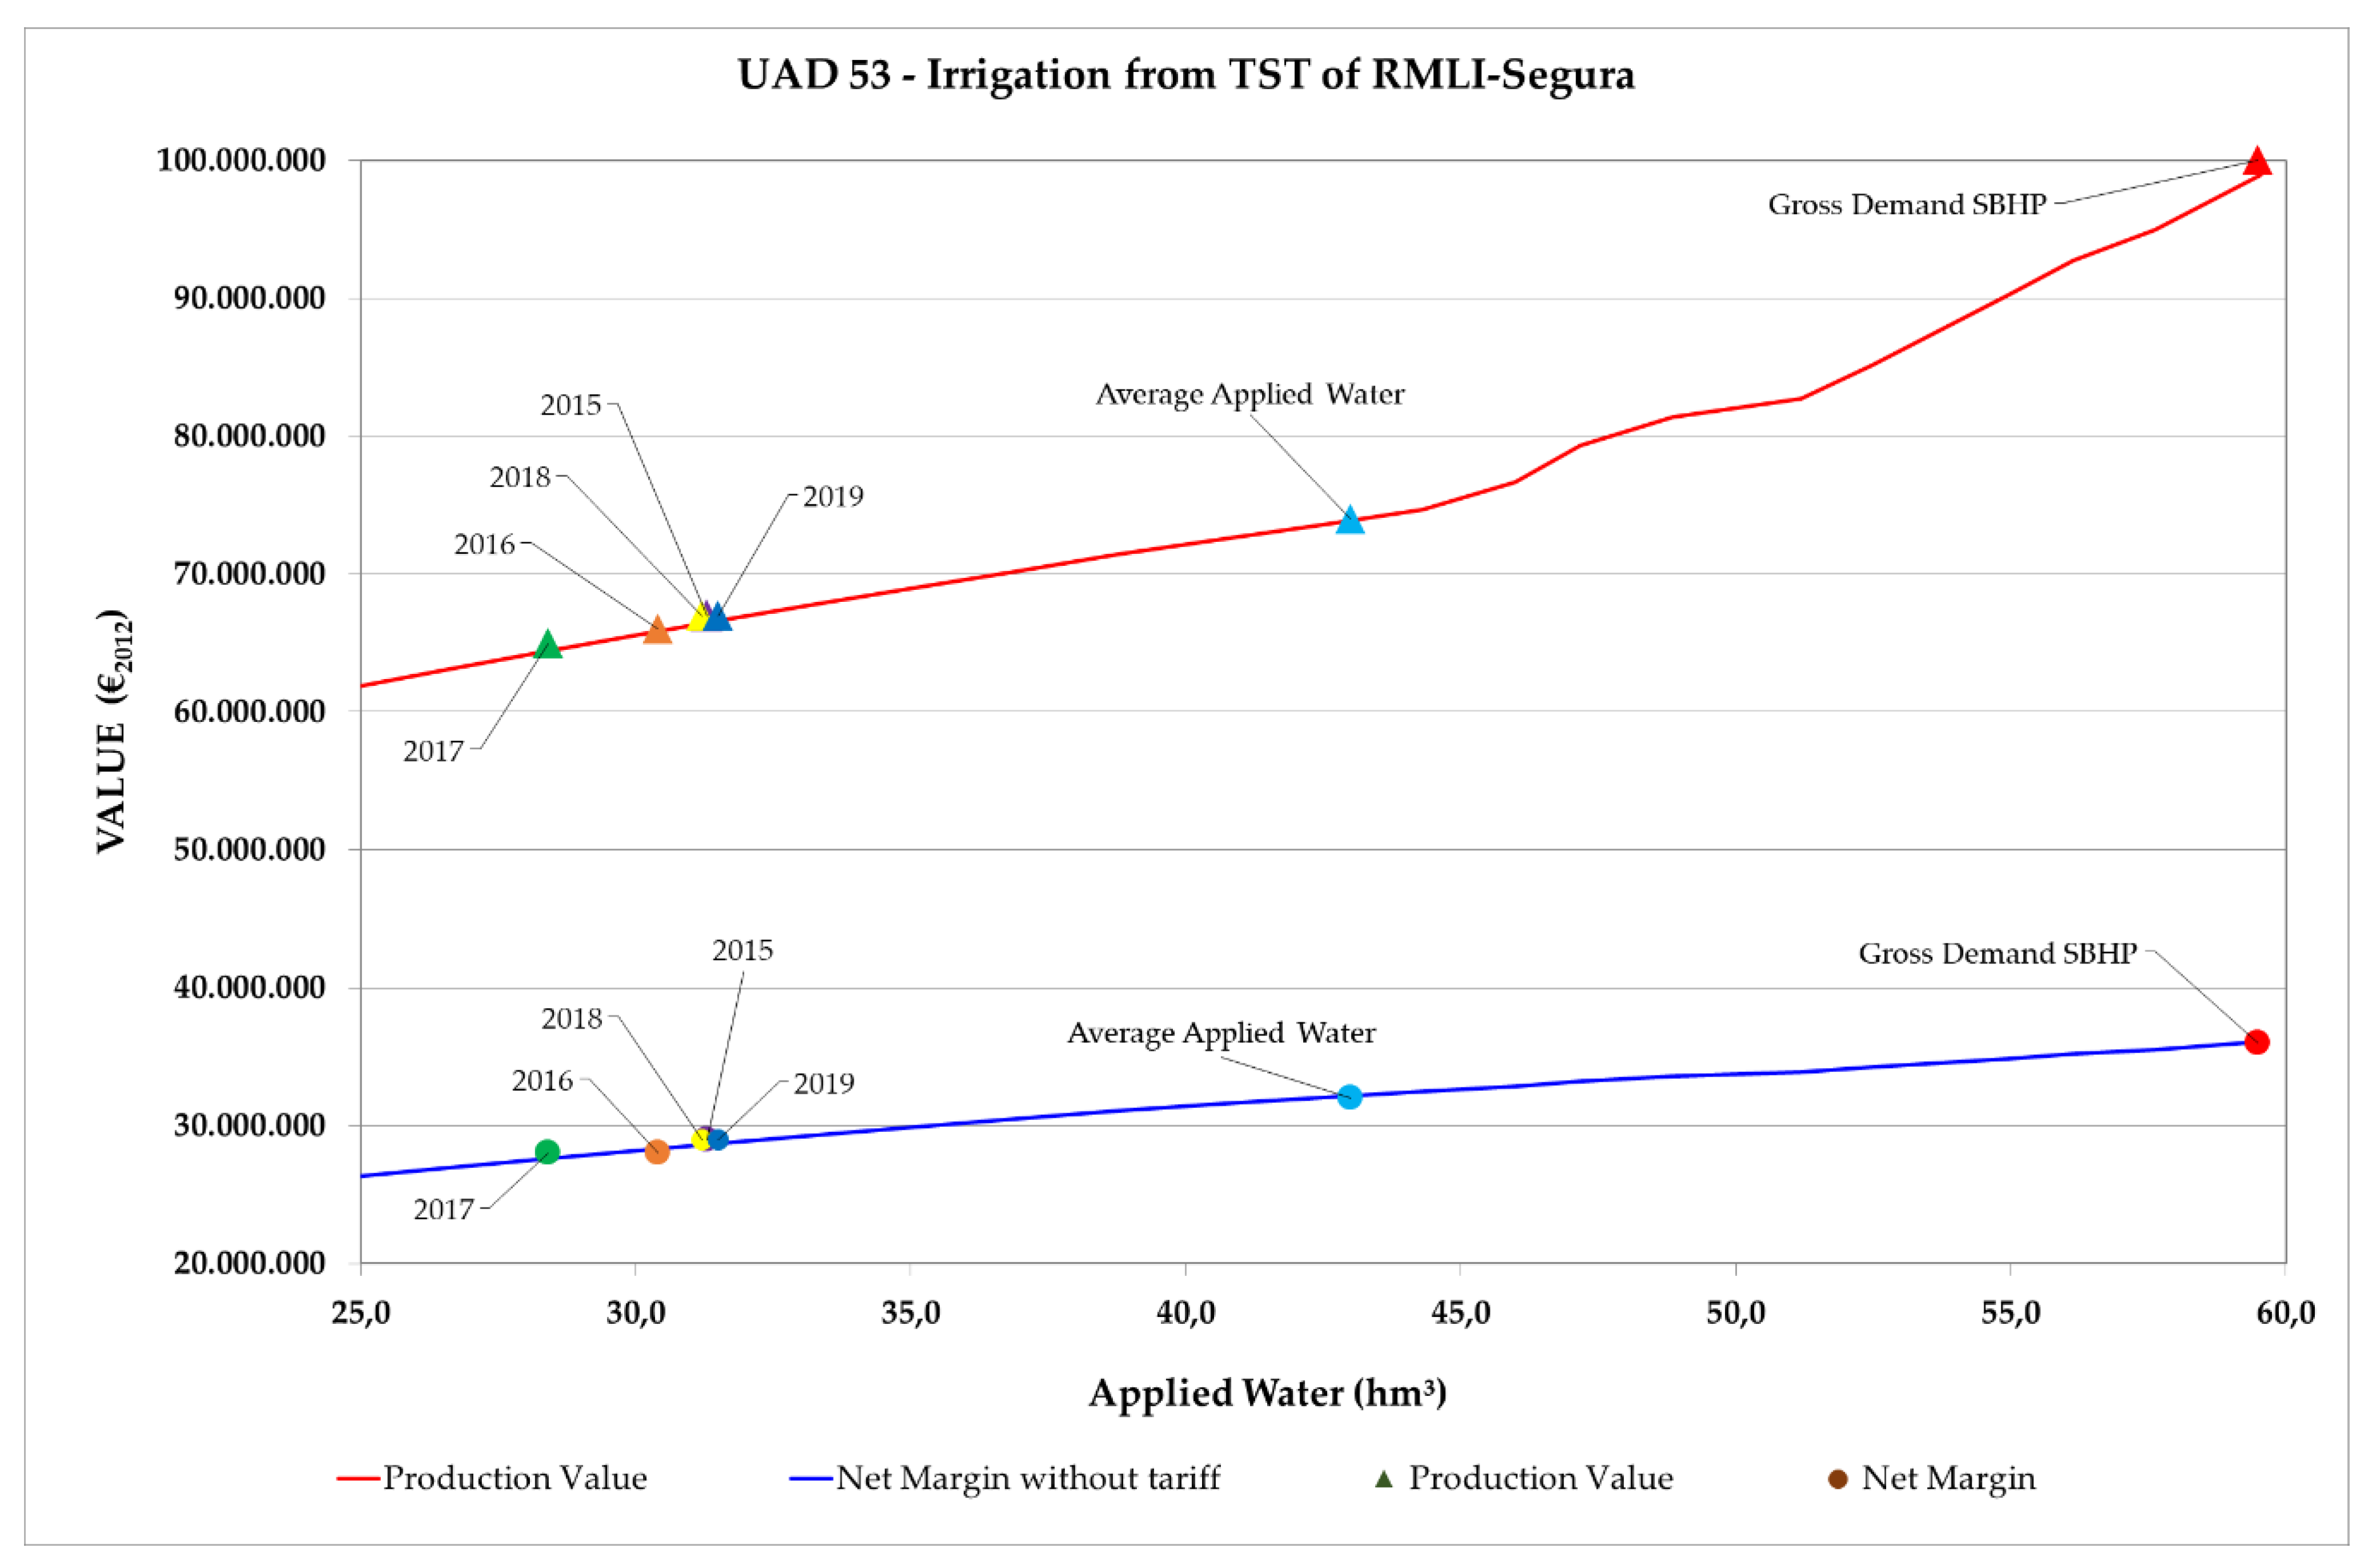
Below, UAD 53 is analysed in depth, Riegos de Levante Margen Izquierda-Segura belonging to the AIT sub-system of the I Principal territorial unit, where there was a clear decrease in the production value and net margin in the drought period analysed.
UAD 53 is located in the province of Alicante. In the SBHP 2015/21 it is recorded as having a gross area of 12,028 ha and a net area of 9500 ha (1150 ha of outdoor horticultural crops, 8303 ha of woody crops, mainly citrus fruits and to a lesser extent stone fruit and 48 ha of crops grown under plastic). The demand associated with this UAD is 59.5 hm³/year, but with the average application of resources considered in the SBHP (proportional to the exploitation rules) only 33.8 hm³/year (17.2 hm³ considered from the TST, 11 hm³ from the River Segura and 8.5 hm³ from the reuse of channels) are applied, generating an application deficit of 11.9 hm³/year [
35].
The three principal irrigation communities in the UAD are the Riegos de Levante Margen Izquierda Irrigation Community (the part located in the Segura River Basin), the San Miguel de Redován Irrigation Community and the S.L.C. (Limited Cooperative Society) Pozo Inmaculada Concepción, where 54% of its the irrigation systems are located, 44% through gravity and 2% through sprinkling [
35].
In order to fully meet demand (59.5 hm³/year), the SBHP establishes a production value of 100 M€
2016/year (1.67 €
2016/m³) and a net margin of 36 M€
2016/year (0.61 €
2016/m³) [
28]. However, as estimated in this study with the average application considered in the SBHP (43 hm³/year) the production value would decrease to 74 M€
2016/year (26 M€ less per year), giving rise to a higher profitability (1.73 €/m³), and the net margin would decrease to 32 M€
2016/year (4 M€ less per year), also increasing its profitability to 0.75 €
2016/m³ [
28].
As we can observe in the graph below (
Figure 8), in the years of drought analysed, the applied water was lower than demand (59.5 hm³) and also the average applied water considered in the SBHP (43 hm³), falling to a minimum level in 2017 (28.4 hm³) and rising to a maximum in 2019 (31.5 hm³), values that indicate a very constant application of resources. Substituting these values in the demand curve, we obtain a minimum production value of 65 M€
2016 (2.28 €/m³) in the year 2017 and a maximum value of 67 M€
2016 (2.13 €/m³) in 2019; and a minimum net margin of 28 M€
2016 (0.98 €/m³) in the year 2017 and a maximum of 29 M€
2016 (0.92 €/m³) in 2019, which represents a slight decrease with respect to the full satisfaction of demand but a considerable increase with respect to the average applied water considered in the SBHP (7 M€ in terms of production value of 2019 and 3 M€ in terms of the net margin of the same year).
Therefore, in the UAD analysed, although the volumes of the TST and natural resources of the River Segura decreased, it did not receive the additional application of extraordinary resources, maybe due to the lower profitability of its crops.
Therefore, and despite the losses generated in the less profitable systems and UADs, thanks to the mobilisation of extraordinary resources and their application in the more profitable UADs, the losses within the UAD with respect to the average application of resources, were 96 M€ in 2017 (the year with the highest losses) and 4 M€ in 2019 (the year with the lowest losses), with respect to the production value (
Table 13), and 45 M€ in 2017 (the year with the lowest losses) and 7 M€ in 2019 (the year with the lowest losses), with respect to the net margin (
Table 14). To these figures we must also add the 146 M€/year of the production value (
Table 9) and 47 M€/year of the net margin (
Table 10) which are annually lost when the demand is not fully met (difference between the full satisfaction of demand and the average application of resources).


