Article

Influence of Warmer and Drier Environmental Conditions on Species-Specific Stem Circumference Dynamics and Water Status of Conifers in Submontane Zone of Central Slovakia

by
Adriana Leštianska
1,*,
Peter Fleischer, Jr.
1,2,
Katarína Merganičová
3,4,
Peter Fleischer
1 and
Katarína Střelcová
1
1
Faculty of Forestry, Technical University in Zvolen, T.G. Masaryka 24, 96001 Zvolen, Slovakia
2
Department of Plant Ecophysiology, Institute of Forest Ecology, Slovak Academy of Sciences, Štúrova 2, 96053 Zvolen, Slovakia
3
Faculty of Forestry and Wood Sciences, Czech University of Life Sciences Prague, Kamýcká 129, 16500 Praha 6—Suchdol, Czech Republic
4
Department of Biodiversity of Ecosystems and Landscape, Slovak Academy of Sciences, Štefánikova 3, P.O.Box 25, 81499 Bratislava, Slovakia
*
Author to whom correspondence should be addressed.
Water 2020, 12(10), 2945; https://doi.org/10.3390/w12102945
Submission received: 14 September 2020 / Revised: 16 October 2020 / Accepted: 18 October 2020 / Published: 21 October 2020

Abstract

:
The frequency and intensity of droughts and heatwaves in Europe with notable impact on forest growth are expected to increase due to climate change. Coniferous stands planted outside the natural habitats of species belong to the most threatened forests. In this study, we assess stem circumference response of coniferous species (Larix decidua and Abies alba) to environmental conditions during the years 2015–2019. The study was performed in Arboretum in Zvolen (ca. 300 m a.s.l., Central Slovakia) characterised by a warmer and drier climate when compared to their natural habitats (located above 900 m a.s.l.), where they originated from. Seasonal radial variation, tree water deficit (ΔW), and maximum daily shrinkage (MDS) were derived from the records obtained from band dendrometers installed on five mature trees per species. Monitored species exhibited remarkably different growth patterns under highly above normal temperatures and uneven precipitation distribution. The magnitudes of reversible circumference changes (ΔW, MDS) were species-specific and strongly correlated with environmental factors. The wavelet analysis identified species-specific vulnerability to drought indicated by pronounced diurnal stem variation periodicity in rainless periods. L. decidua exhibited more strained stem water status and higher sensitivity to environmental conditions than A. alba. Tree water deficit and maximum daily shrinkage were found appropriate characteristics to compare water status of different tree species.

1. Introduction

Climate projections in the near future indicate rising temperatures and increase in the frequency and severity of climatic extremes [1,2]. Changes in temperature and precipitation patterns may (dis) favour a given species [3] and modify forest composition. In the light of ongoing and predicted climate change, the growth performance of economically important tree species under climatic extremes, especially extreme drought events, has been frequently discussed [4,5]. In the context of climate change, it is critical to understand whether climatic conditions are becoming more or less favourable for tree growth. The strong need to adapt forests to future climate conditions through changes in tree species composition is frequently in stark contrast to the dearth of information about the suitability of individual species and their provenances for these future conditions [6]. The increase in frequency of extremely dry years, as predicted consequences of climate change [7], may shift the dynamics of growth more or less abruptly in favour of less drought-sensitive tree species [8]. A substantial reduction in growth and increased mortality has been observed for some tree species growing outside their natural habitats—e.g., Norway spruce (Picea abies L. Karst) and European larch (Larix decidua Mill) [9,10]. European larch is typical for mountainous regions of the Carpathians and the Alps [11]. At lower altitudes, it is considered a non-native species. Owing to its deciduous character, larch has a shorter growing season to reach similar above-ground production rates as adjacent evergreen conifers. To this end, its photosynthetic rates are greater [12]. Silver fir (Abies alba Mill.) is a European coniferous species occurring in the Alps and the Carpathians. Although fir was frequently regarded as a species that prefers cold and moist climate [13], recent findings suggest that higher temperatures and more frequent drought events do not seem to have significant negative effects on the growth of this species [6,14,15]. Moreover, recent growth of Silver fir (Abies alba) has been accelerated [16] since its recovery from the severe growth decline due to air pollution in 1970s and 1980s [17].
Due to the ongoing climate change, more emphasis has been recently laid upon the monitoring of the changes in spatial and temporal distribution of precipitation, and temperature regime [2]. Expected climate changes, such as rising temperatures, or more frequent drought events [1,2], will have an impact on a wide range of physiological functions and biochemical reactions [18,19], which control tree growth [20,21] and tree water status [22,23]. Daily stem variations are products of irreversible stem size changes due to cambial cell division and cell enlargement processes, and reversible changes caused by contraction and expansion of water storage tissues [24]. A substantial amount of internally stored tree water can be used by a plant [25] for transpiration to balance the differences in water content of roots and shoots [26]. Water in namely elastic tissues of the bark (i.e., cambium, phloem, and parenchyma) and mesophyll of needles [27] is partly depleted and replenished on a daily basis due to changing water potential gradients within the plant [28]. Stem radius variations detrended for growth were named tree water deficit (ΔW) by [27], and this parameter was found to be proportional to water content in the living tissues of the bark [29]. Another stem water indicator derived from stem variation is maximum daily shrinkage (MDS)—e.g., [30,31,32]. The amplitude of daily shrinkage is a function of water loss through the leaves and water uptake by roots. Hence, daily shrinkage often correlates with evaporative demand [33]. Trees attain their maximum circumference just before dawn—i.e., before they open their stomata and start losing water to the atmosphere more rapidly than they can take up from the soil [34]. Changes in xylem water tension [35] and water storage in the bark and phloem [36] cause tree stems to shrink, reaching minimum circumference in the afternoon, after which stems begin to swell until they reach their maximum before the next dawn. According to mentioned authors, both water status indicators (ΔW and MDS) are closely related to tree drought stress and are mainly determined by a combination of atmospheric and soil conditions.
High temporal resolution measurements of stem diameter variation can provide valuable information on the radial growth process as well as the tree water status [37,38,39]. Stem radius variation can be continuously monitored with automatic dendrometers from periods of minutes to hours [40,41]. It is an appropriate method to study tree water relations and radial growth over a whole year [42,43]. Therefore, dendrometers are widely used in climate-growth relation studies—e.g., [6,44,45].
Analysis of the climate–growth relationship makes it possible to identify and assess the influence of climatic factors on tree growth. The assessment of species-specific stem size response to climate is challenging because it requires homogeneous site and stand conditions to determine the influence of climate solely. In our study, we compared stem circumference variations of two coniferous species, namely Abies alba and Larix decidua, growing at the same site located in warmer and drier conditions than in their natural habitats situated at higher elevations (Figure 1, Table 1). The conditions at the current site can represent the likely future climate the species will have to face also in their natural habitats, since the temperature of the current site exceeded the one in their natural habitats by 2 °C or more, and the annual precipitation total was by approximately 100 mm less than in their original habitats (Figure 1).
We hypothesise that species-specific ecophysiological traits—e.g., photosynthetic and transpiration rates—lead to significant differences in climate–growth relationships of the two investigated species. Based on band dendrometer records (BDR), we aim to (i) identify species-specific reversible changes in stem circumference under warmer and drier environmental conditions than in their natural environment; (ii) identify periodicity in stem size changes and their relation to environmental conditions; and (iii) derive a set of variables describing tree water status. We expected that drought would limit their stem growth and stimulate diurnal reversible changes. At low elevation, the combination of low precipitation and high temperatures could lead to water deficit and respective stomata closure and sap flow reduction during dry periods. We also hypothesised that differences in water regime patterns are more pronounced between species than between trees of the same species.

2. Material and Methods
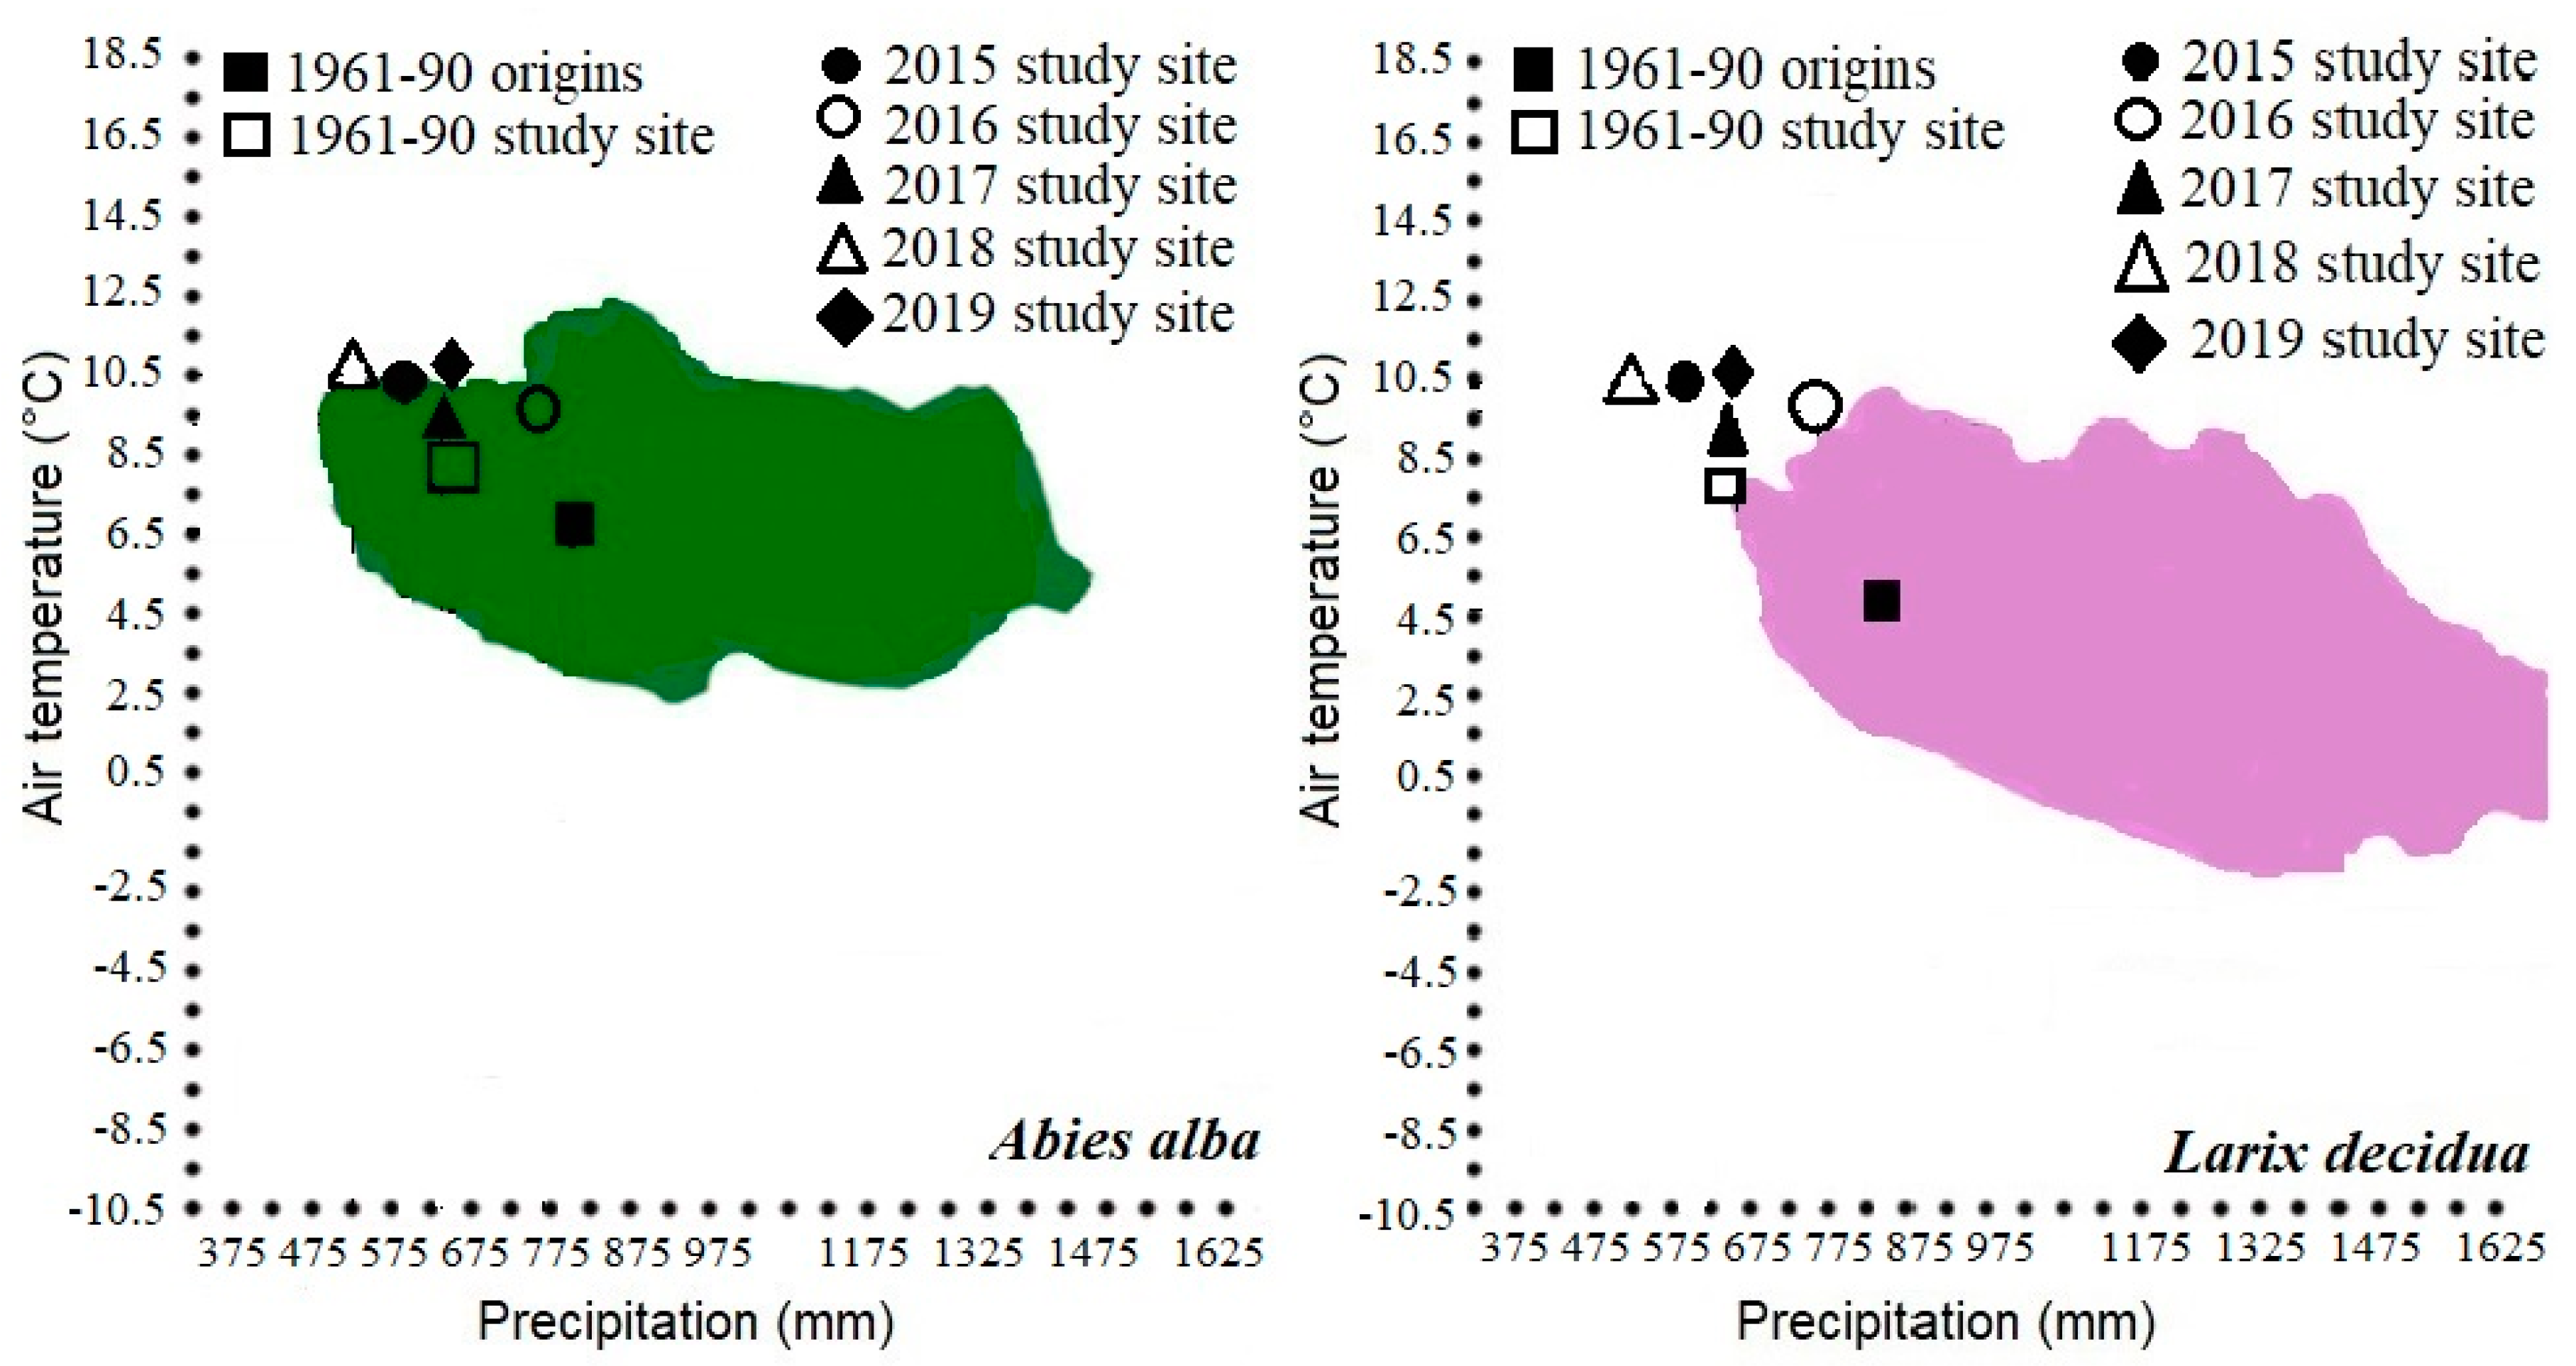
2.1. Study Area

The study site is located in Arboretum of Technical University in Zvolen, Central Slovakia (48°35′ N, 19°07′ E, altitude from 290 m a.s.l. to 377 m a.s.l.). The facility serves for preserving a gene pool of the Carpathian dendroflora ex situ [46]. The site represents common upland forest communities in Central Slovakia. Mean annual air temperature is 8.2 °C, and annual precipitation total is 651 mm. During a growing season (April–September), a long-term average temperature is 14.7 °C and precipitation total is 377 mm (calculated from long-term data from a nearby meteorological station of Sliač, 313 m a.s.l. provided by the Slovak Hydrometeorological Institute, representing a period of 1961–1990). Cambisol is a dominant soil type and Querceto-Fagetum community represents potential forest vegetation (https://geo.enviroportal.sk/atlassr).
Two research plots, each representing single species (Larix decidua and Abies alba), were selected at sites with similar environmental conditions, which are generally warmer and drier than their original natural habitats (Figure 1). In the case of L. decidua, the long-term (1961–1990) values of temperature and precipitation as well as their values representing individual monitored years of the study site occurred outside the current species range (Figure 1). For A. alba, the two last monitored years 2018 and 2019 did not occur inside the current species range (Figure 1). Basic site characteristics of the original location of the selected tree species provenances are in Table 1.
At each plot, five adult trees with similar age and size were selected for the purpose of this study. Tree diameters at breast height and tree heights were measured in the years 2015 and 2016, respectively. The monitored trees of L. decidua had an average diameter at breast height (d1.3) of 30.9 ± 3.9 cm, height of 27.5. ± 1.1 m, and tree age of 51 years. The monitored trees of A. alba had an average diameter at breast height of 31.7 ± 4.7 cm, height of 21.4. ± 1.5 m, and tree age of 46 years.

2.2. Environmental Data

During the study period, meteorological data were recorded with an automatic meteorological station (EMS Brno, CZ) installed at an open area near study plots (at a distance 80–150 m). The meteorological station recorded global radiation (GR, W.m−2), air temperature (AT, °C), relative air humidity (RH, %), and precipitation (P, mm) with automatic sensors every 10 min. From these values, daily mean air temperature, daily mean relative air humidity, daily precipitation totals and daily global radiation sums were calculated. Daily mean vapour pressure deficit in the air (VPD, kPa) was calculated from the daily means of air temperature and relative air humidity. Soil water potential (SWP, bar) in 15, 30, and 50 cm soil depths was measured under forest canopy within the study plots (gypsum blocks and MicroLog SP3, EMS Brno, CZ). Measuring intervals were set to 20 min, and mean daily SWP values per plot calculated from all depths were used for further analyses.

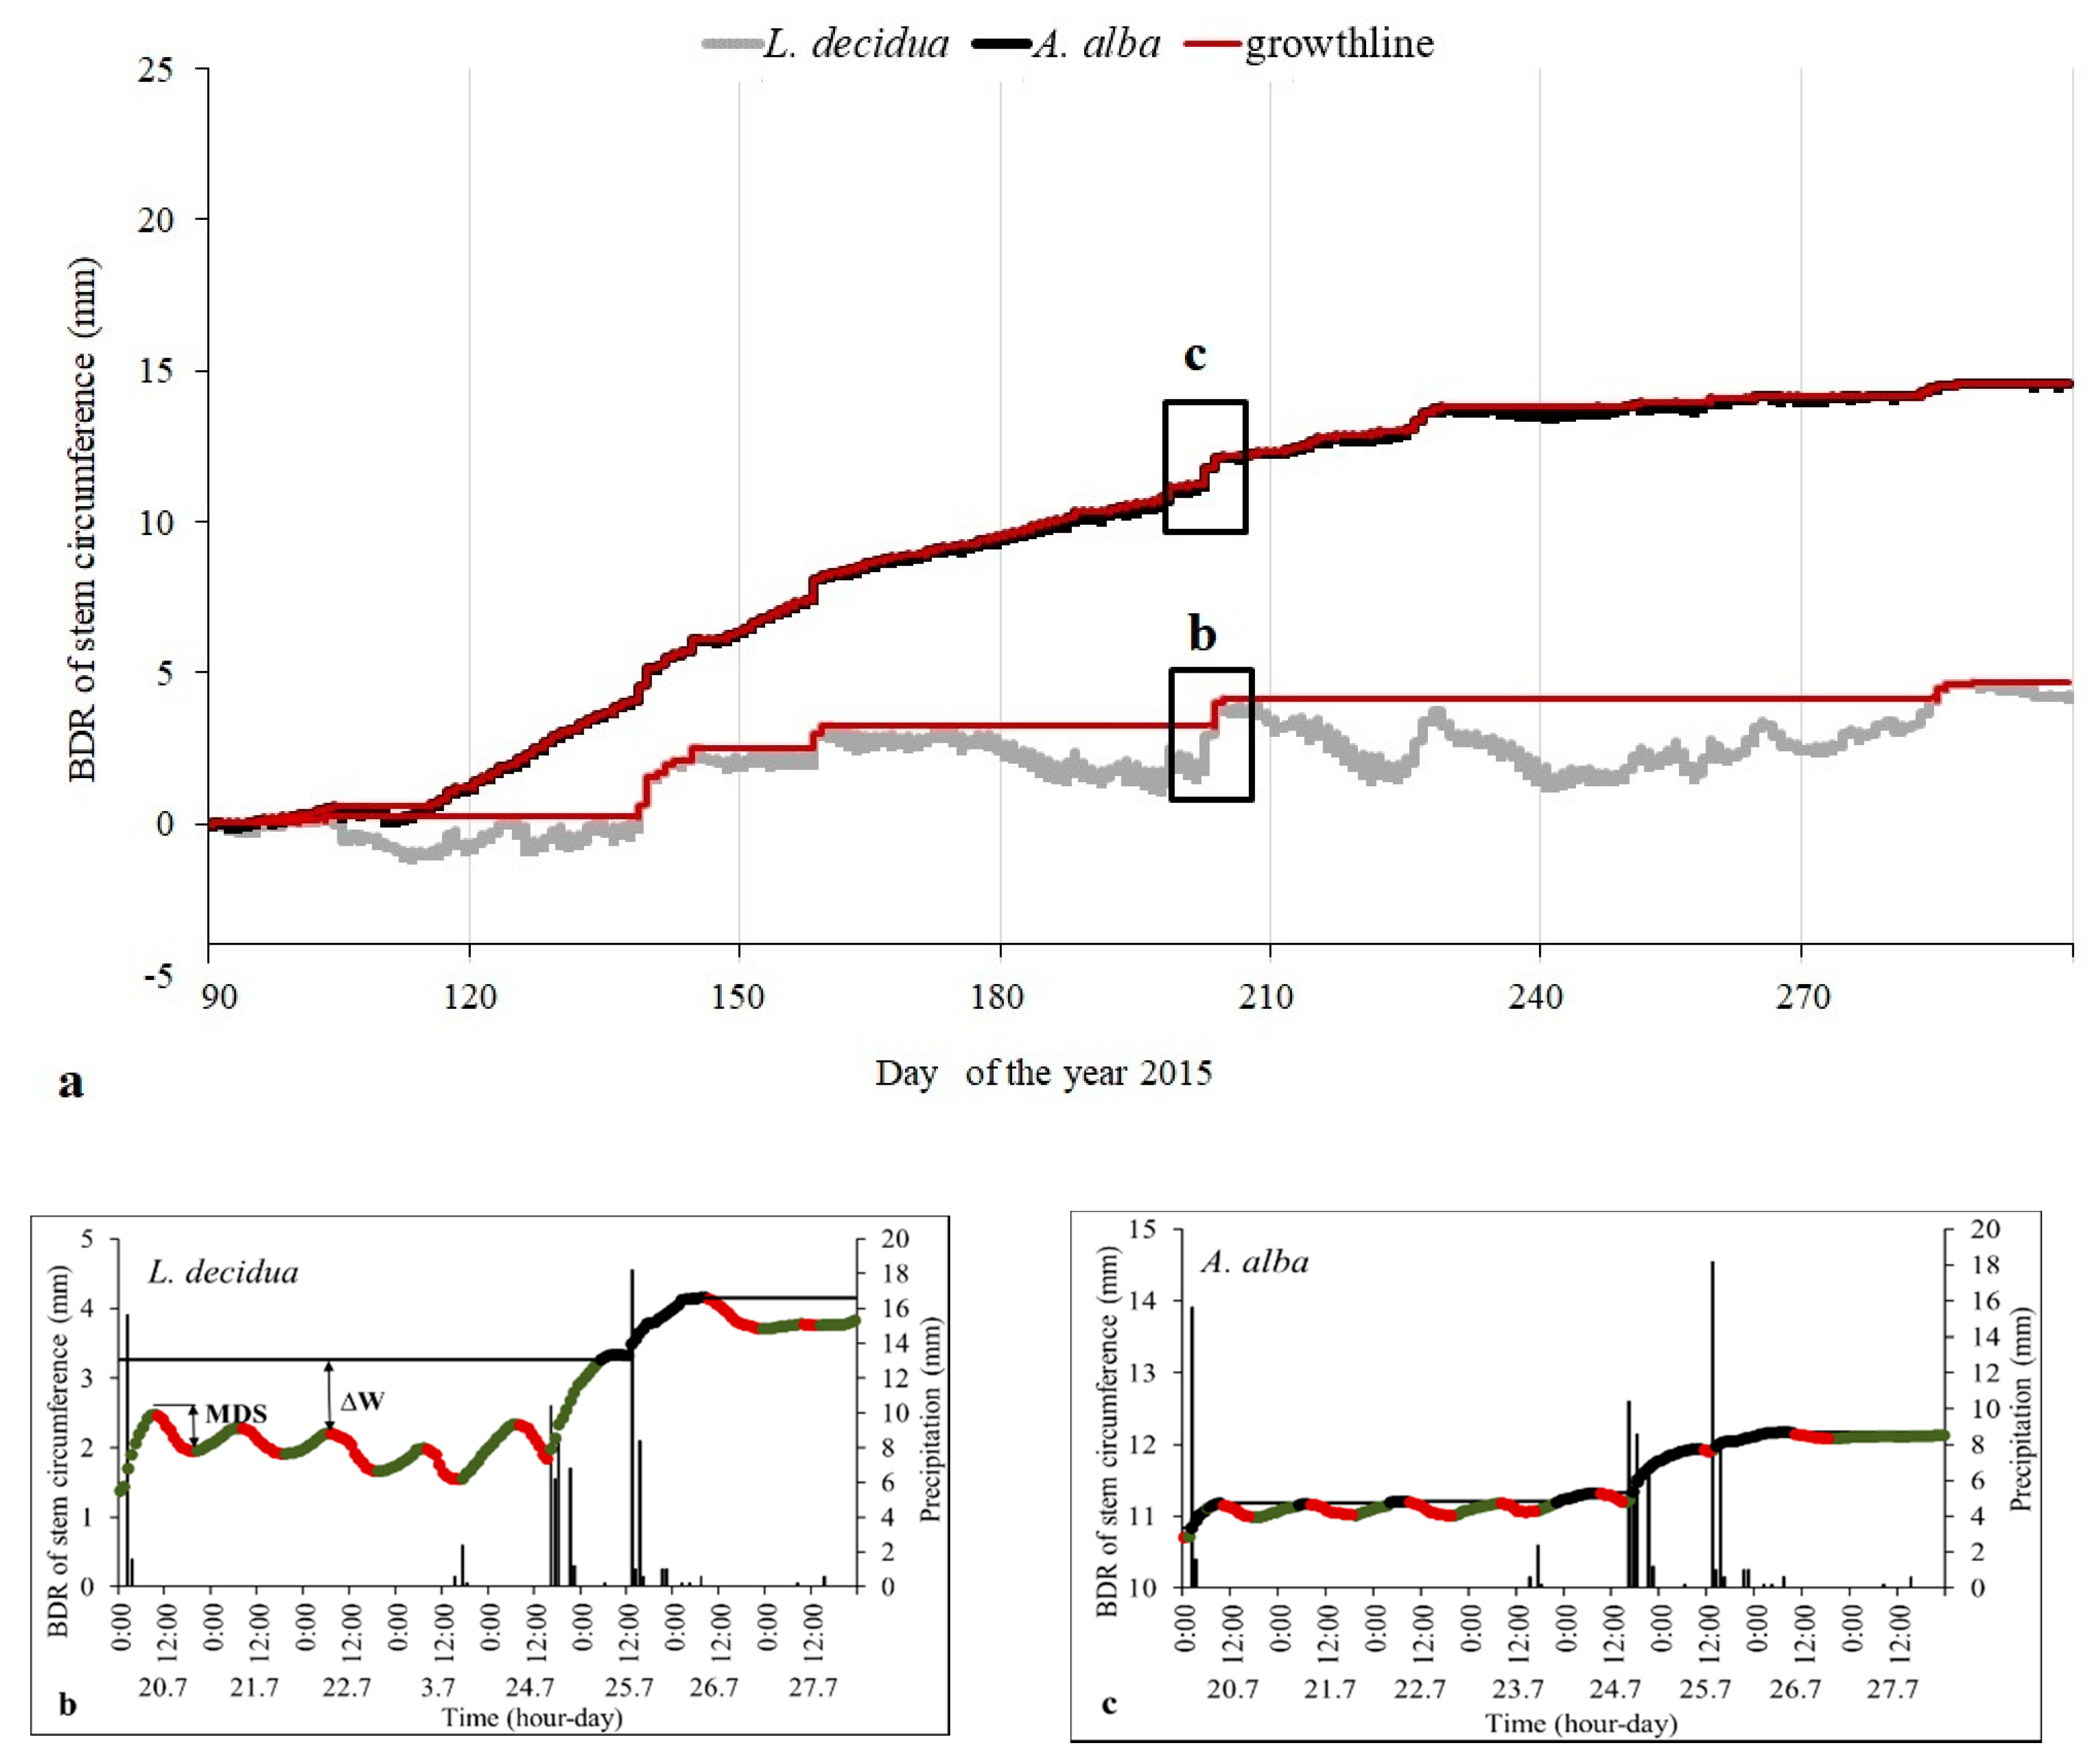
2.3. Band Dendrometer Records (BDR)

Stem circumference variation of 10 sample trees (five trees per species) was recorded with high temporal resolution automatic band dendrometers (model DRL 26, EMS Brno, CZ, accuracy ±1 µm). To ensure a close contact of dendrometer bands with tree stems and to reduce the influence of hygroscopic swelling and shrinkage of the bark, the outermost part of the bark (periderm) was carefully removed before the installation of dendrometers. Circumference measurements were recorded in 20-min intervals.
BDR were processed by applying two distinguished methods: (i) a daily cycle and (ii) a stem cycle approach. Both daily and stem cycles consist of three distinguished phases based on stem dynamics: stem contraction phase (con), expansion phase (exp), and stem circumference increment phase (inc) [37,42] (Figure 2). The daily approach operates at a daily scale (from 0:00 to 0:00). The stem cycle describes stem dynamics regardless of calendar days—i.e., at a scale that can differ from 24 h. With the daily approach we derived the daily mean, maximum, and amplitude of BDR. A contraction phase is a period between BDR maximum and minimum. An expansion phase is a period from BDR minimum to the following maximum value. An increment phase is a part of the expansion phase from the time when the stem size exceeds the previous maximum until it reaches the subsequent maximum (Figure 2). The duration (h, hours) of each phase was derived from the dendrometer records. Seasonal radial stem increment (cum_inc) was calculated as a sum of increments during the whole season.

2.4. Tree Water Status

We applied two indicators to quantify tree water status. The first one is tree water deficit (∆W in mm) that defines the actual tree state in comparison to a fully hydrated state [30,31]. At first, the growth line was derived from BDR using a moving maximum of the current and previous dendrometer readings. Afterwards, tree water deficit was calculated as a difference between the actual BDR value and the respective growth line value of stem size, which represents a tree state under fully hydrated conditions (i.e., when ΔW = 0) [48] (Figure 2). Hence, increasingly negative values of ΔW indicate increasing tree drought stress.
The second characteristic is maximum daily shrinkage (MDS in mm) defined as the difference between daily maximum and minimum stem size (BDR). This indicator quantifies the daily cycle of water uptake at night and water loss from elastic cambial and phloem tissues during a day [43] (Figure 2).
Stem cycles in BDR, duration of each phase, water deficit (∆W), and maximum daily shrinkage (MDS) were determined from BDR with “DendrometeR” R package [49].

2.5. BDR and Environmental Variables

The relationships of daily environmental variables (precipitation, relative air humidity (RH), vapour pressure deficit (VPD), minimum, maximum and mean air temperature (ATmin, ATmax, ATmean), soil water potential (SWP)) with daily parameters extracted from BDR (inc, ΔW, MDS) within the analysed period of the year (April–October) were quantified with the Spearman rank-correlation coefficients. Correlations were tested with the Statgraphics Centurion XIV Version 6.1.11 software.

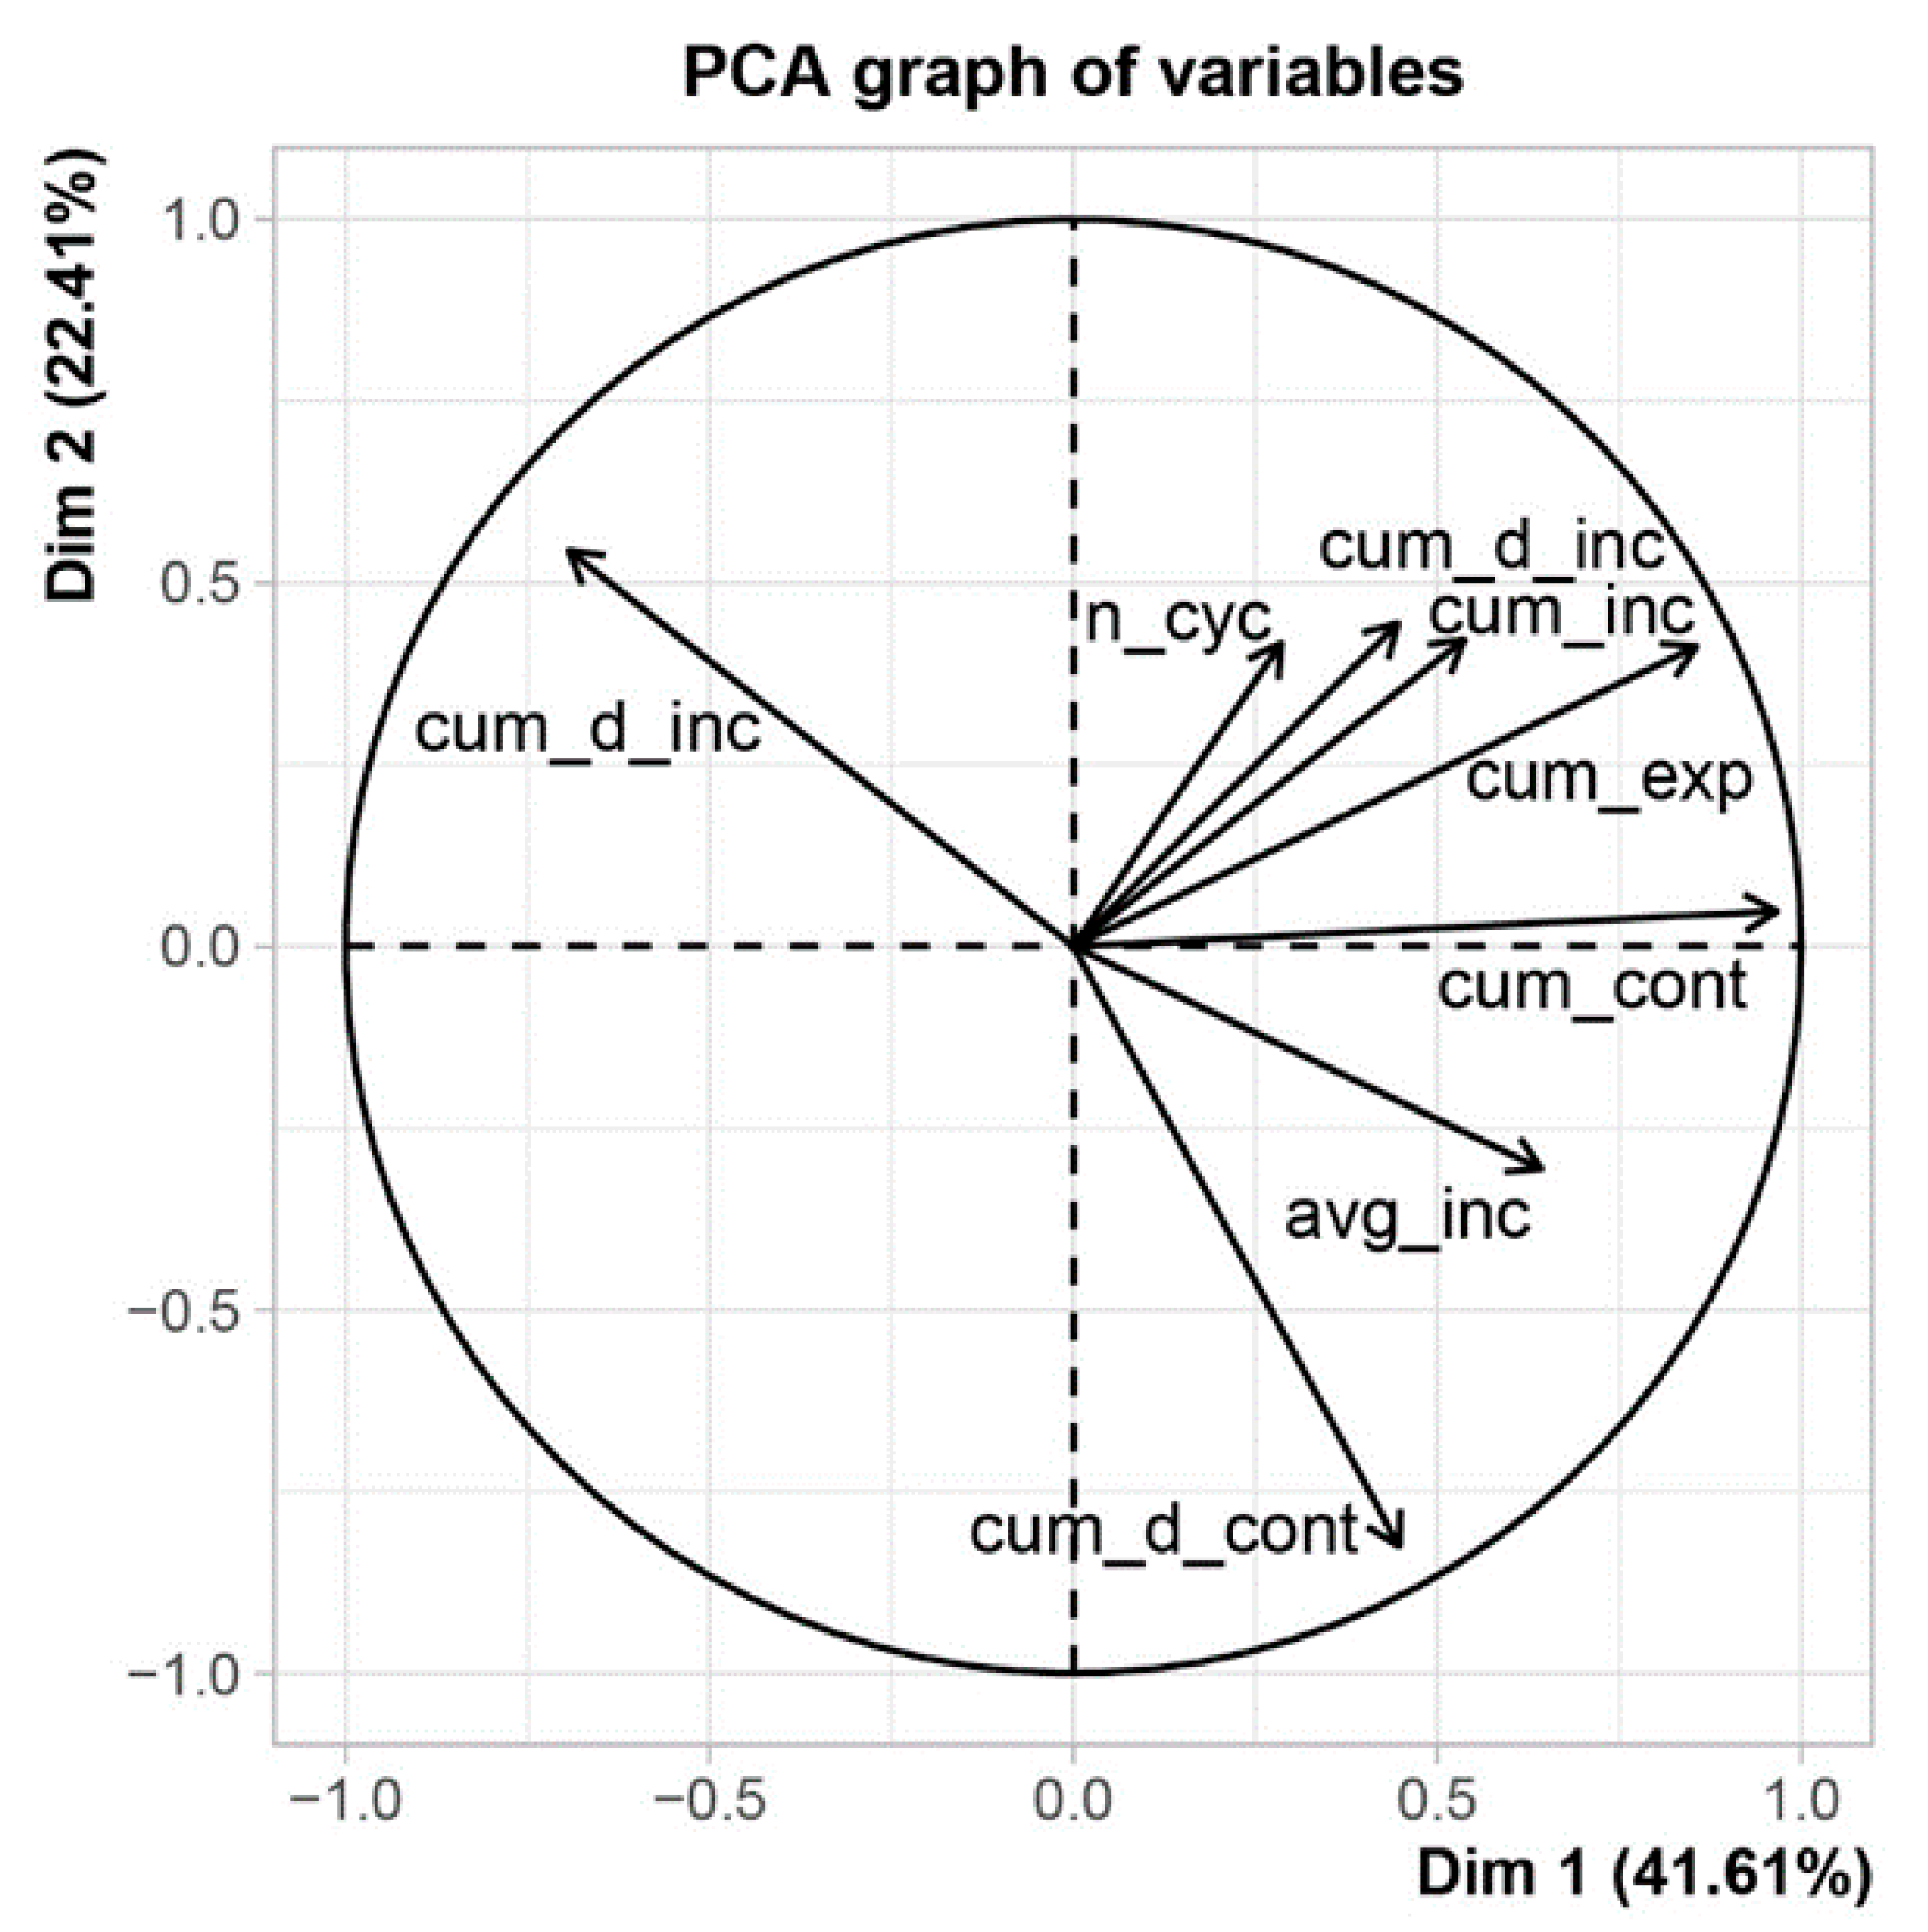
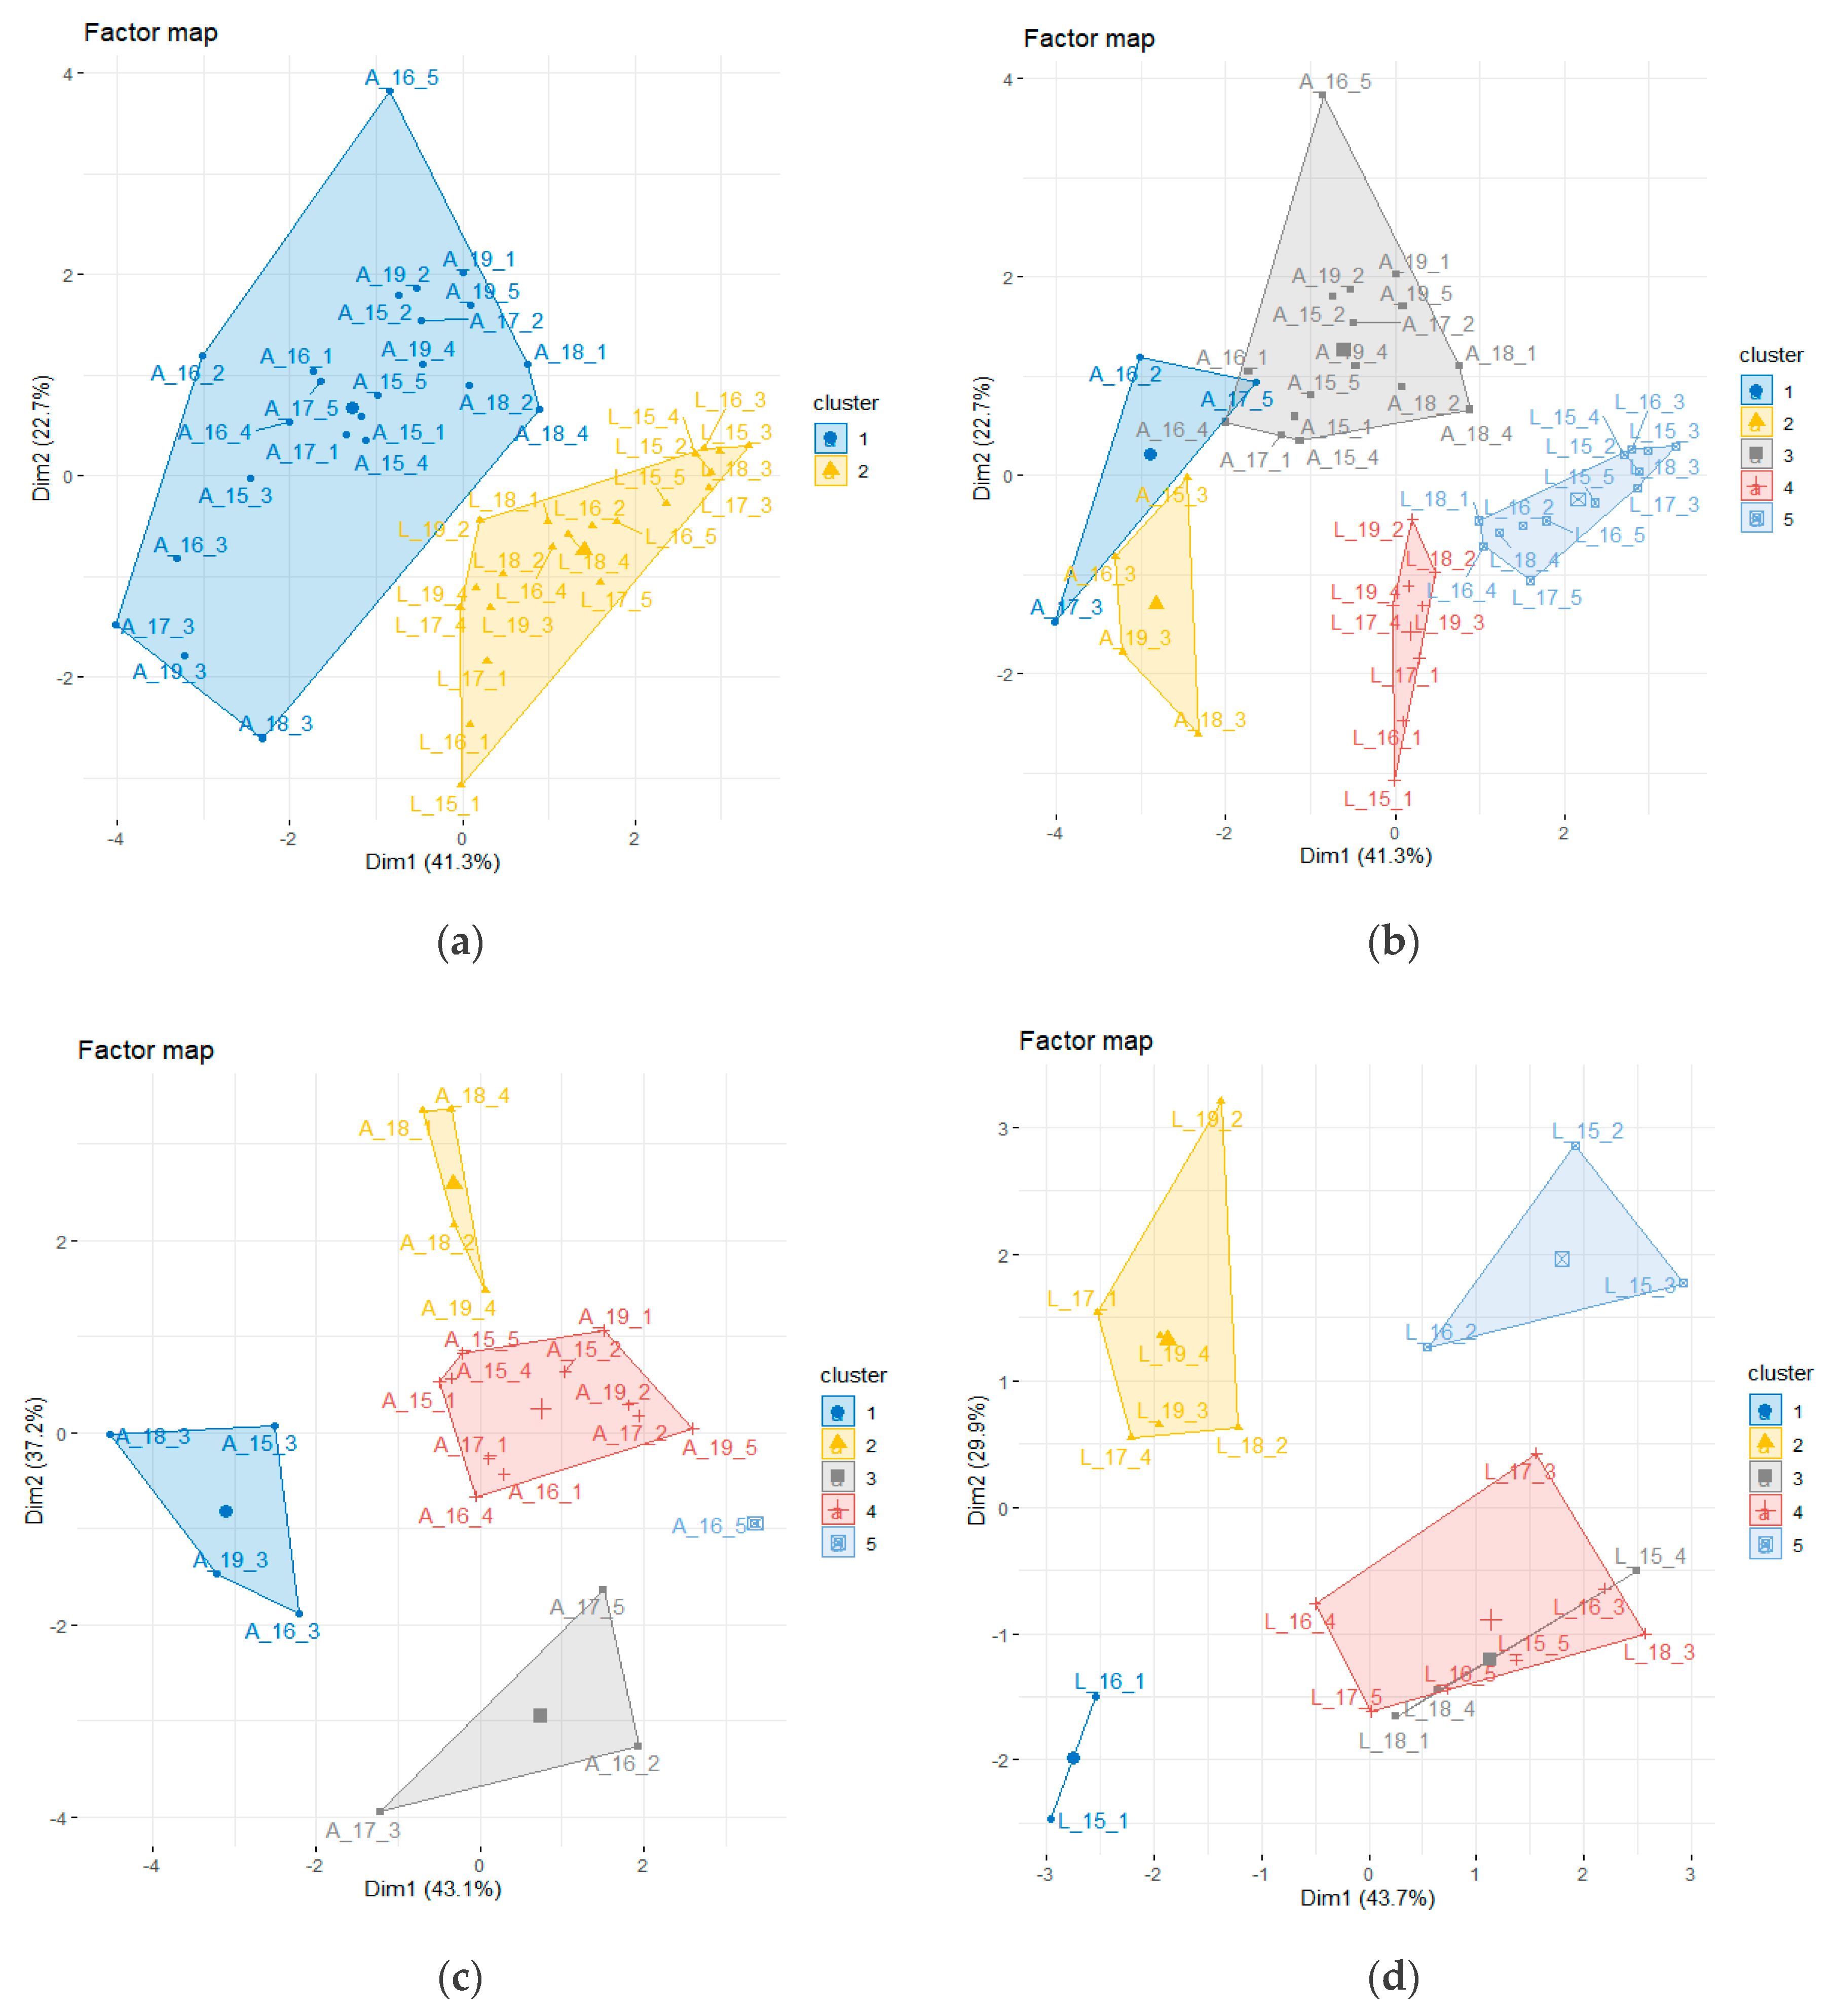
2.6. Species-Specific BDR Variability

Besides the mentioned indicators (inc, ΔW, MDS), another 13 variables were derived from BDR. We used the “daily.stats” and “cycle.stats” methods in dendrometerR package to process the data. Daily values were calculated with “daily.stats”, while “cycle.stats” were used to identify magnitude of three distinct phases (contraction, expansion and increment, Figure 2) The derived variables are as follows:
  • Number of cycles (n_cyc) (number) in the season—based on the stem cycle approach one cycle always comprises contraction and expansion phases, while the increment phase is optional;
  • Cumulative duration of contraction (cum_d_cont) (hour)—seasonal sum of all contraction time lengths;
  • Average duration of contraction (avg_d_cont) (hour)—cumulative duration of contraction divided by number of stem cycles;
  • Cumulative amplitude of contraction (cum_cont) (mm)—seasonal sum of all contractions;
  • Average amplitude of contraction (avg_cont) (mm)—seasonal sum of contractions divided by number of stem cycles;
  • Cumulative duration of expansion (cum_d_exp) (hour)—seasonal sum of all expansion time lengths;
  • Average duration of expansion (avg_d_exp) (hour)—cumulative duration of expansion divided by number of stem cycles;
  • Cumulative amplitude of expansion (cum_exp) (mm)—seasonal sum of all expansions;
  • Average amplitude of expansion (avg_exp) (mm)—cumulative amplitude of expansion divided by number of stem cycles;
  • Cumulative duration of increment (cum_d_inc) (hour)—seasonal sum of all increment time lengths;
  • Average duration of increment (avg_d_inc) (hour)—cumulative duration of increment divided by number of stem cycles;
  • Cumulative increment (cum_inc) (mm)—seasonal sum of all daily increments;
  • Average daily increment (avg_inc) (mm)—cumulative increment divided by number of stem cycles.
PCA (principal components analysis) was performed in R using the “factoextra” package. The highly correlated variables were removed based on the correlation circle, and hierarchical clustering was performed with 8 variables (Figure 3) to assess differences and similarities between studied trees in the monitored years. To identify groups of trees with similar values of water status indicators, we used hierarchical clustering with principal components. The individual trees and years were clustered in a hierarchical tree using Ward’s criterion. The generated clusters were mapped in genuine PCA axes, and K-means clustering was applied to individual trees and years based on the nearest distance between cluster means and individuals. Hierarchical clustering with principal components was performed in R using the “FactoMiner”, and data were visualised using “ggplot2”. The number of desired clusters was set prior to the analysis.

2.7. Periodicity of BDR

We performed a wavelet analysis [50] to examine significant periodicities in BDR ranging from hours to weeks. Specifically, we analysed residuals of BDR time series of individual years to respective fitted Weibull functions that were transformed using the Morlet transformation to distinguish random fluctuations from periodic events [50]. Wavelet analysis was performed using WaveletComp R package [51]. The lower period was set to 20 min intervals, while the upper one to 1024 20-min intervals (covering 16 days).

3. Results

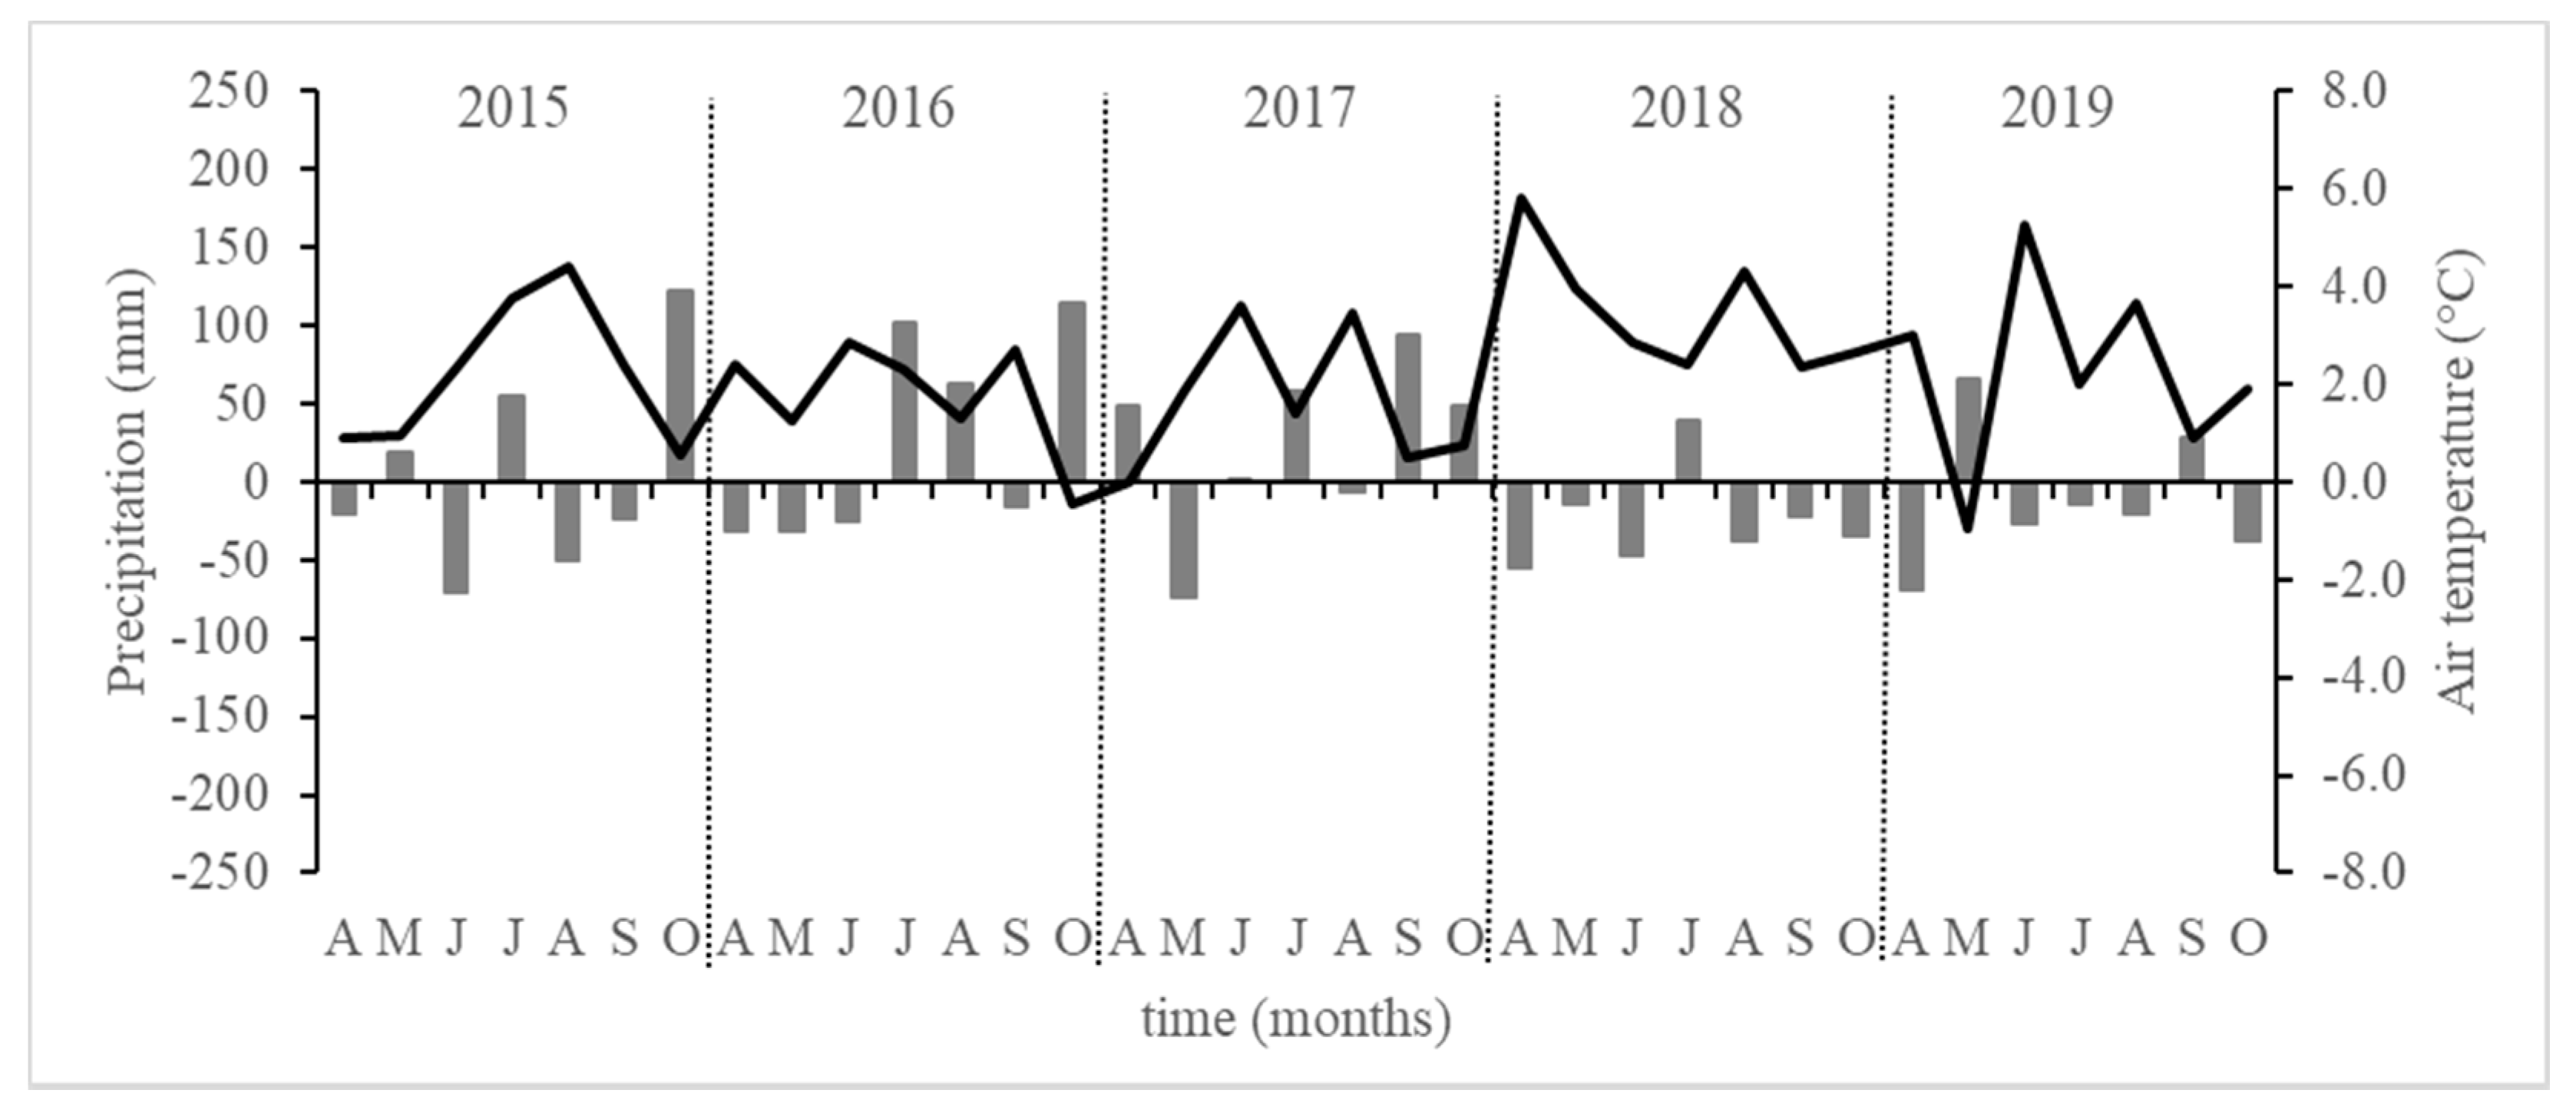
3.1. Environmental Conditions During the Studied Periods 2015–2019

The measured meteorological data representing the years 2015–2019 were compared with the long-term normal (1961–1990) calculated from the nearest meteorological station (Sliač, 300 m a.s.l., 3.5 km from the study area of Borová hora) (Table 2). All mean temperatures representing observed periods (April–October) of the years 2015–2019 were more than 1.5 °C higher in comparison to the 30-year-long average (1961–1990) at the Sliač station (Table 2). Monthly average air temperatures were above their respective long-term values in almost all examined months of the studied years (Figure 4). Below-average temperatures were only observed in October 2016 and in May 2019 (Figure 4). The temporal precipitation distribution varied during the study periods. The observed period of the year 2018 was the warmest and driest from all periods between 2015 and 2019, and it was characterised by low monthly precipitation totals during the whole period (Table 2, Figure 4. Below-average precipitation total was also observed in the 2019 period) (Table 2). Precipitation total in the 2015 period was by 5% greater than the long-term average (Table 2) but mainly because of high precipitation in October 2015 (Figure 4). Precipitation totals in 2016 and 2017 exceeded the long-term average due to several rainy months (July, August, and October 2016 and July, September, and October 2017; Figure 4; Table 2). The lowest seasonal mean of VPD was observed in 2016, while the highest value was reached in 2018 (Table 2). Higher air temperature and lower precipitation total in 2018 resulted in higher values of vapour pressure deficit in comparison with other years (Table 2).

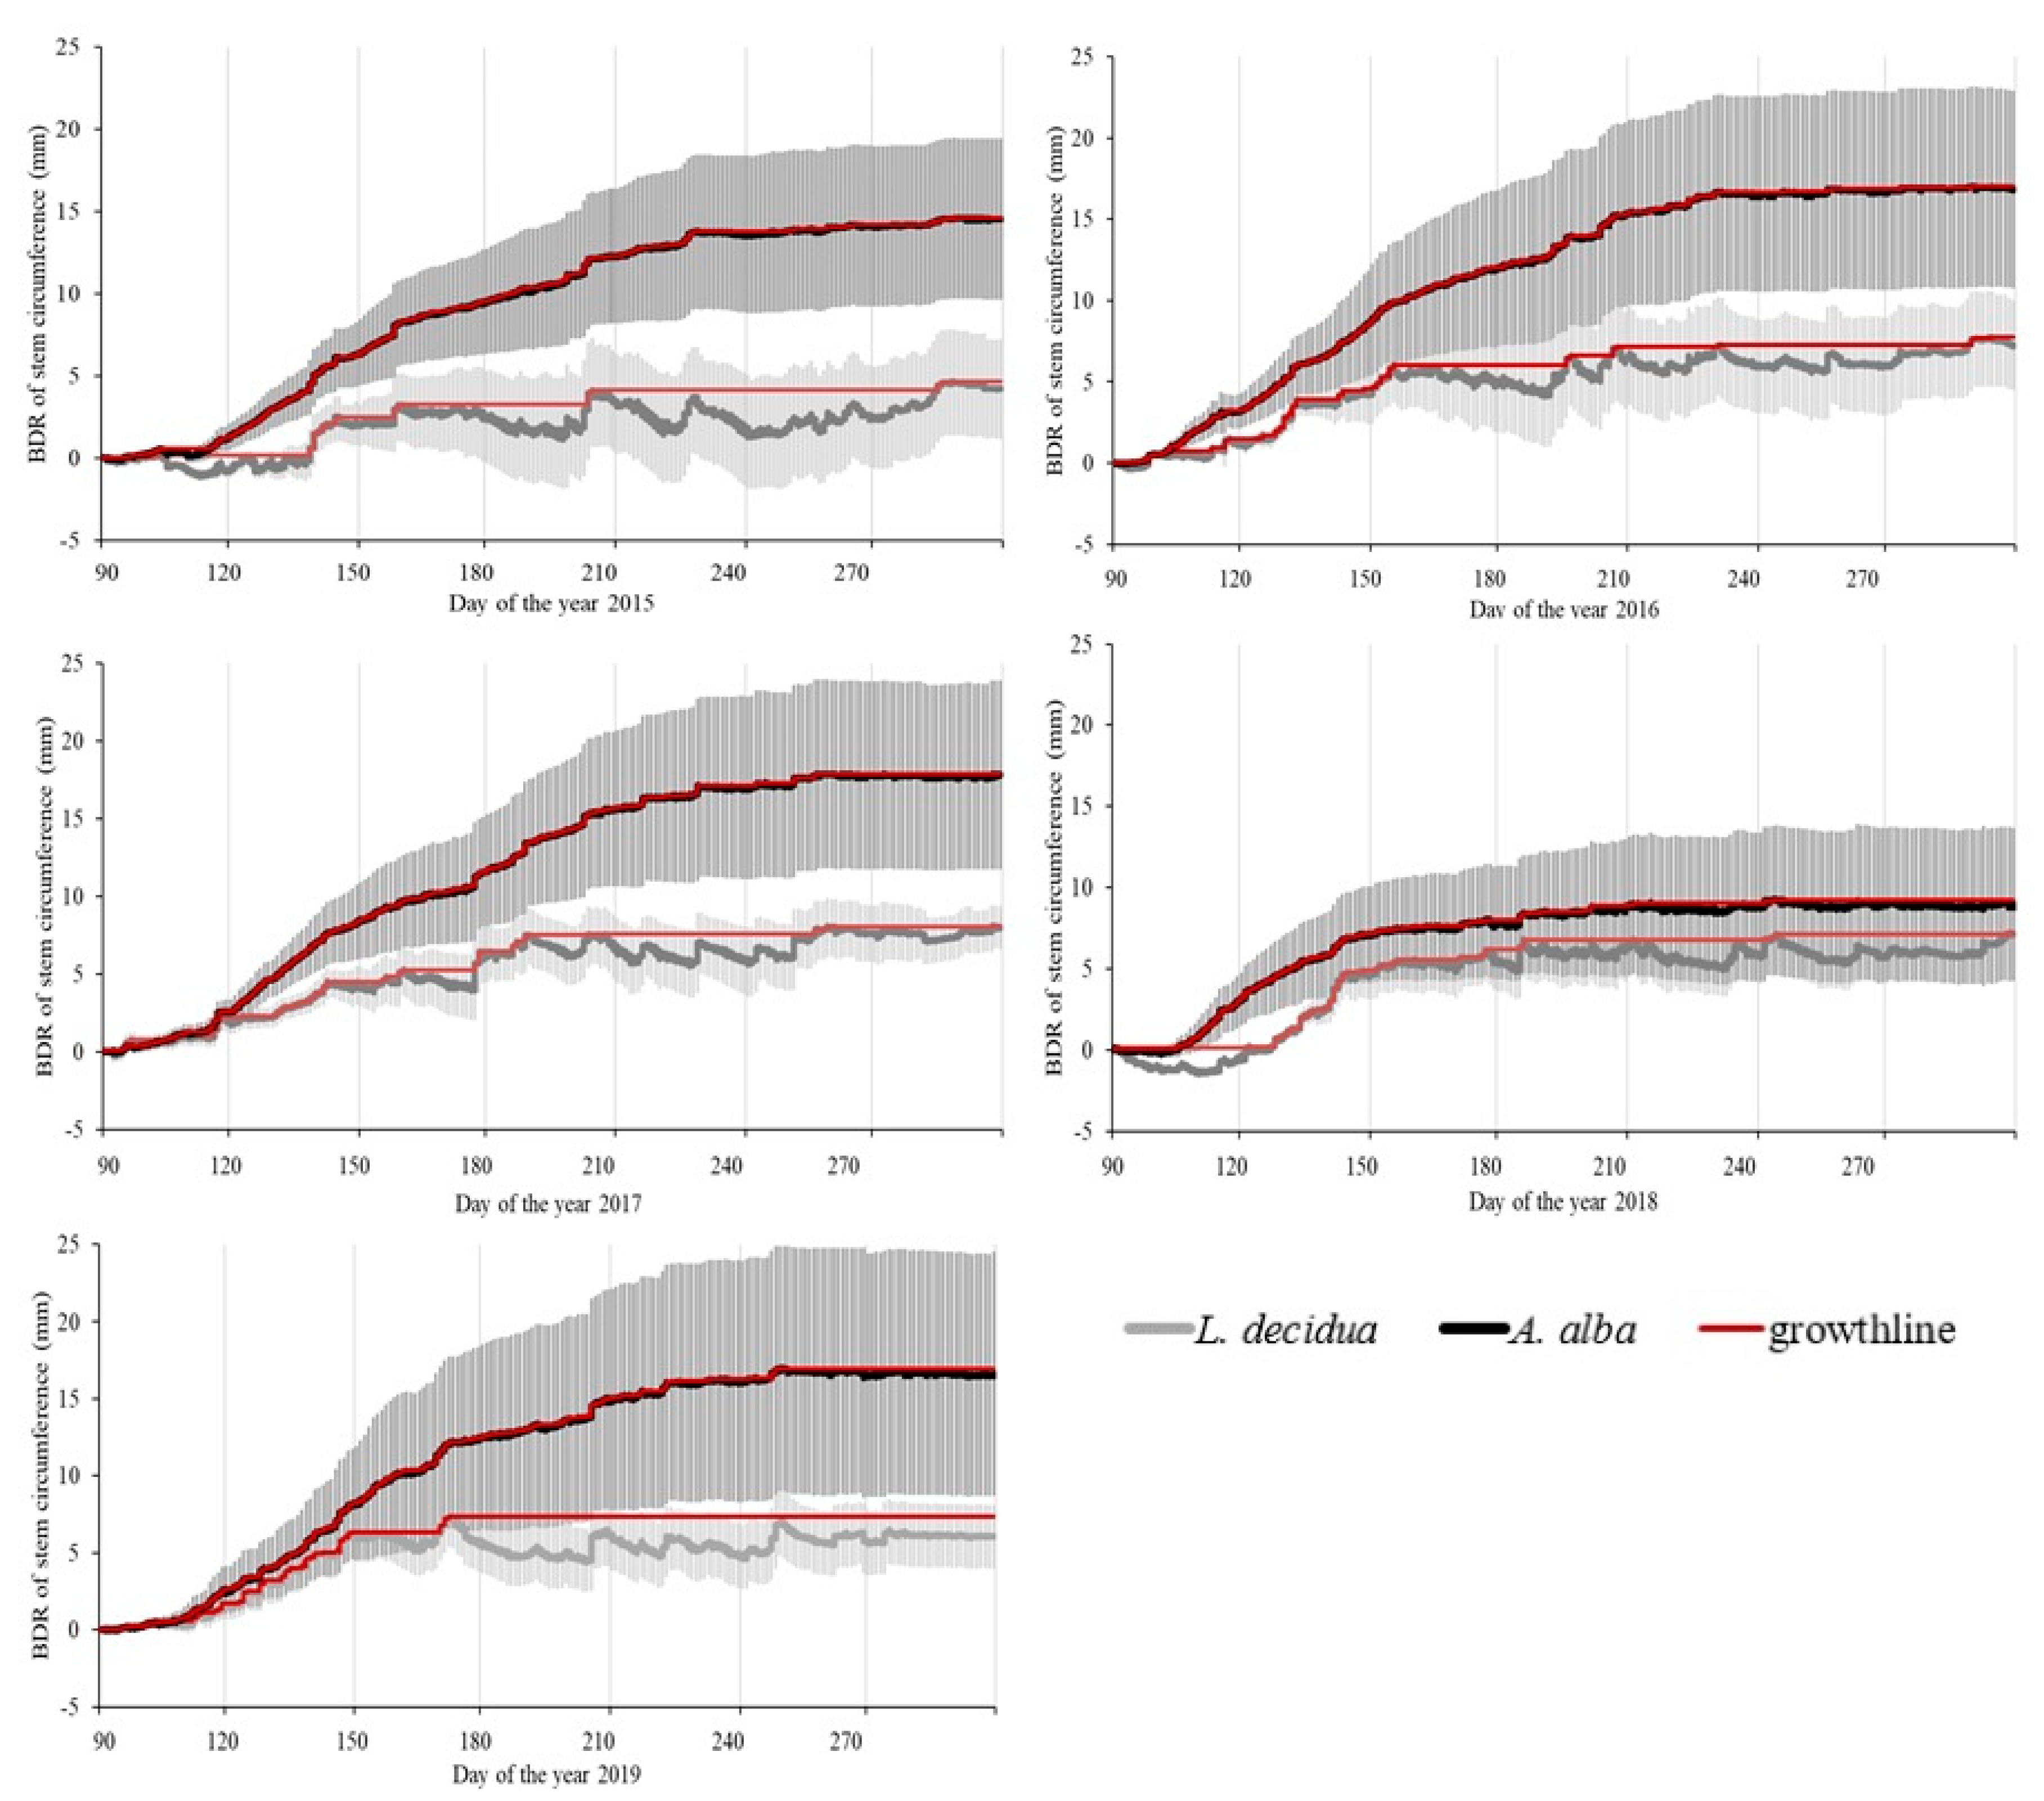
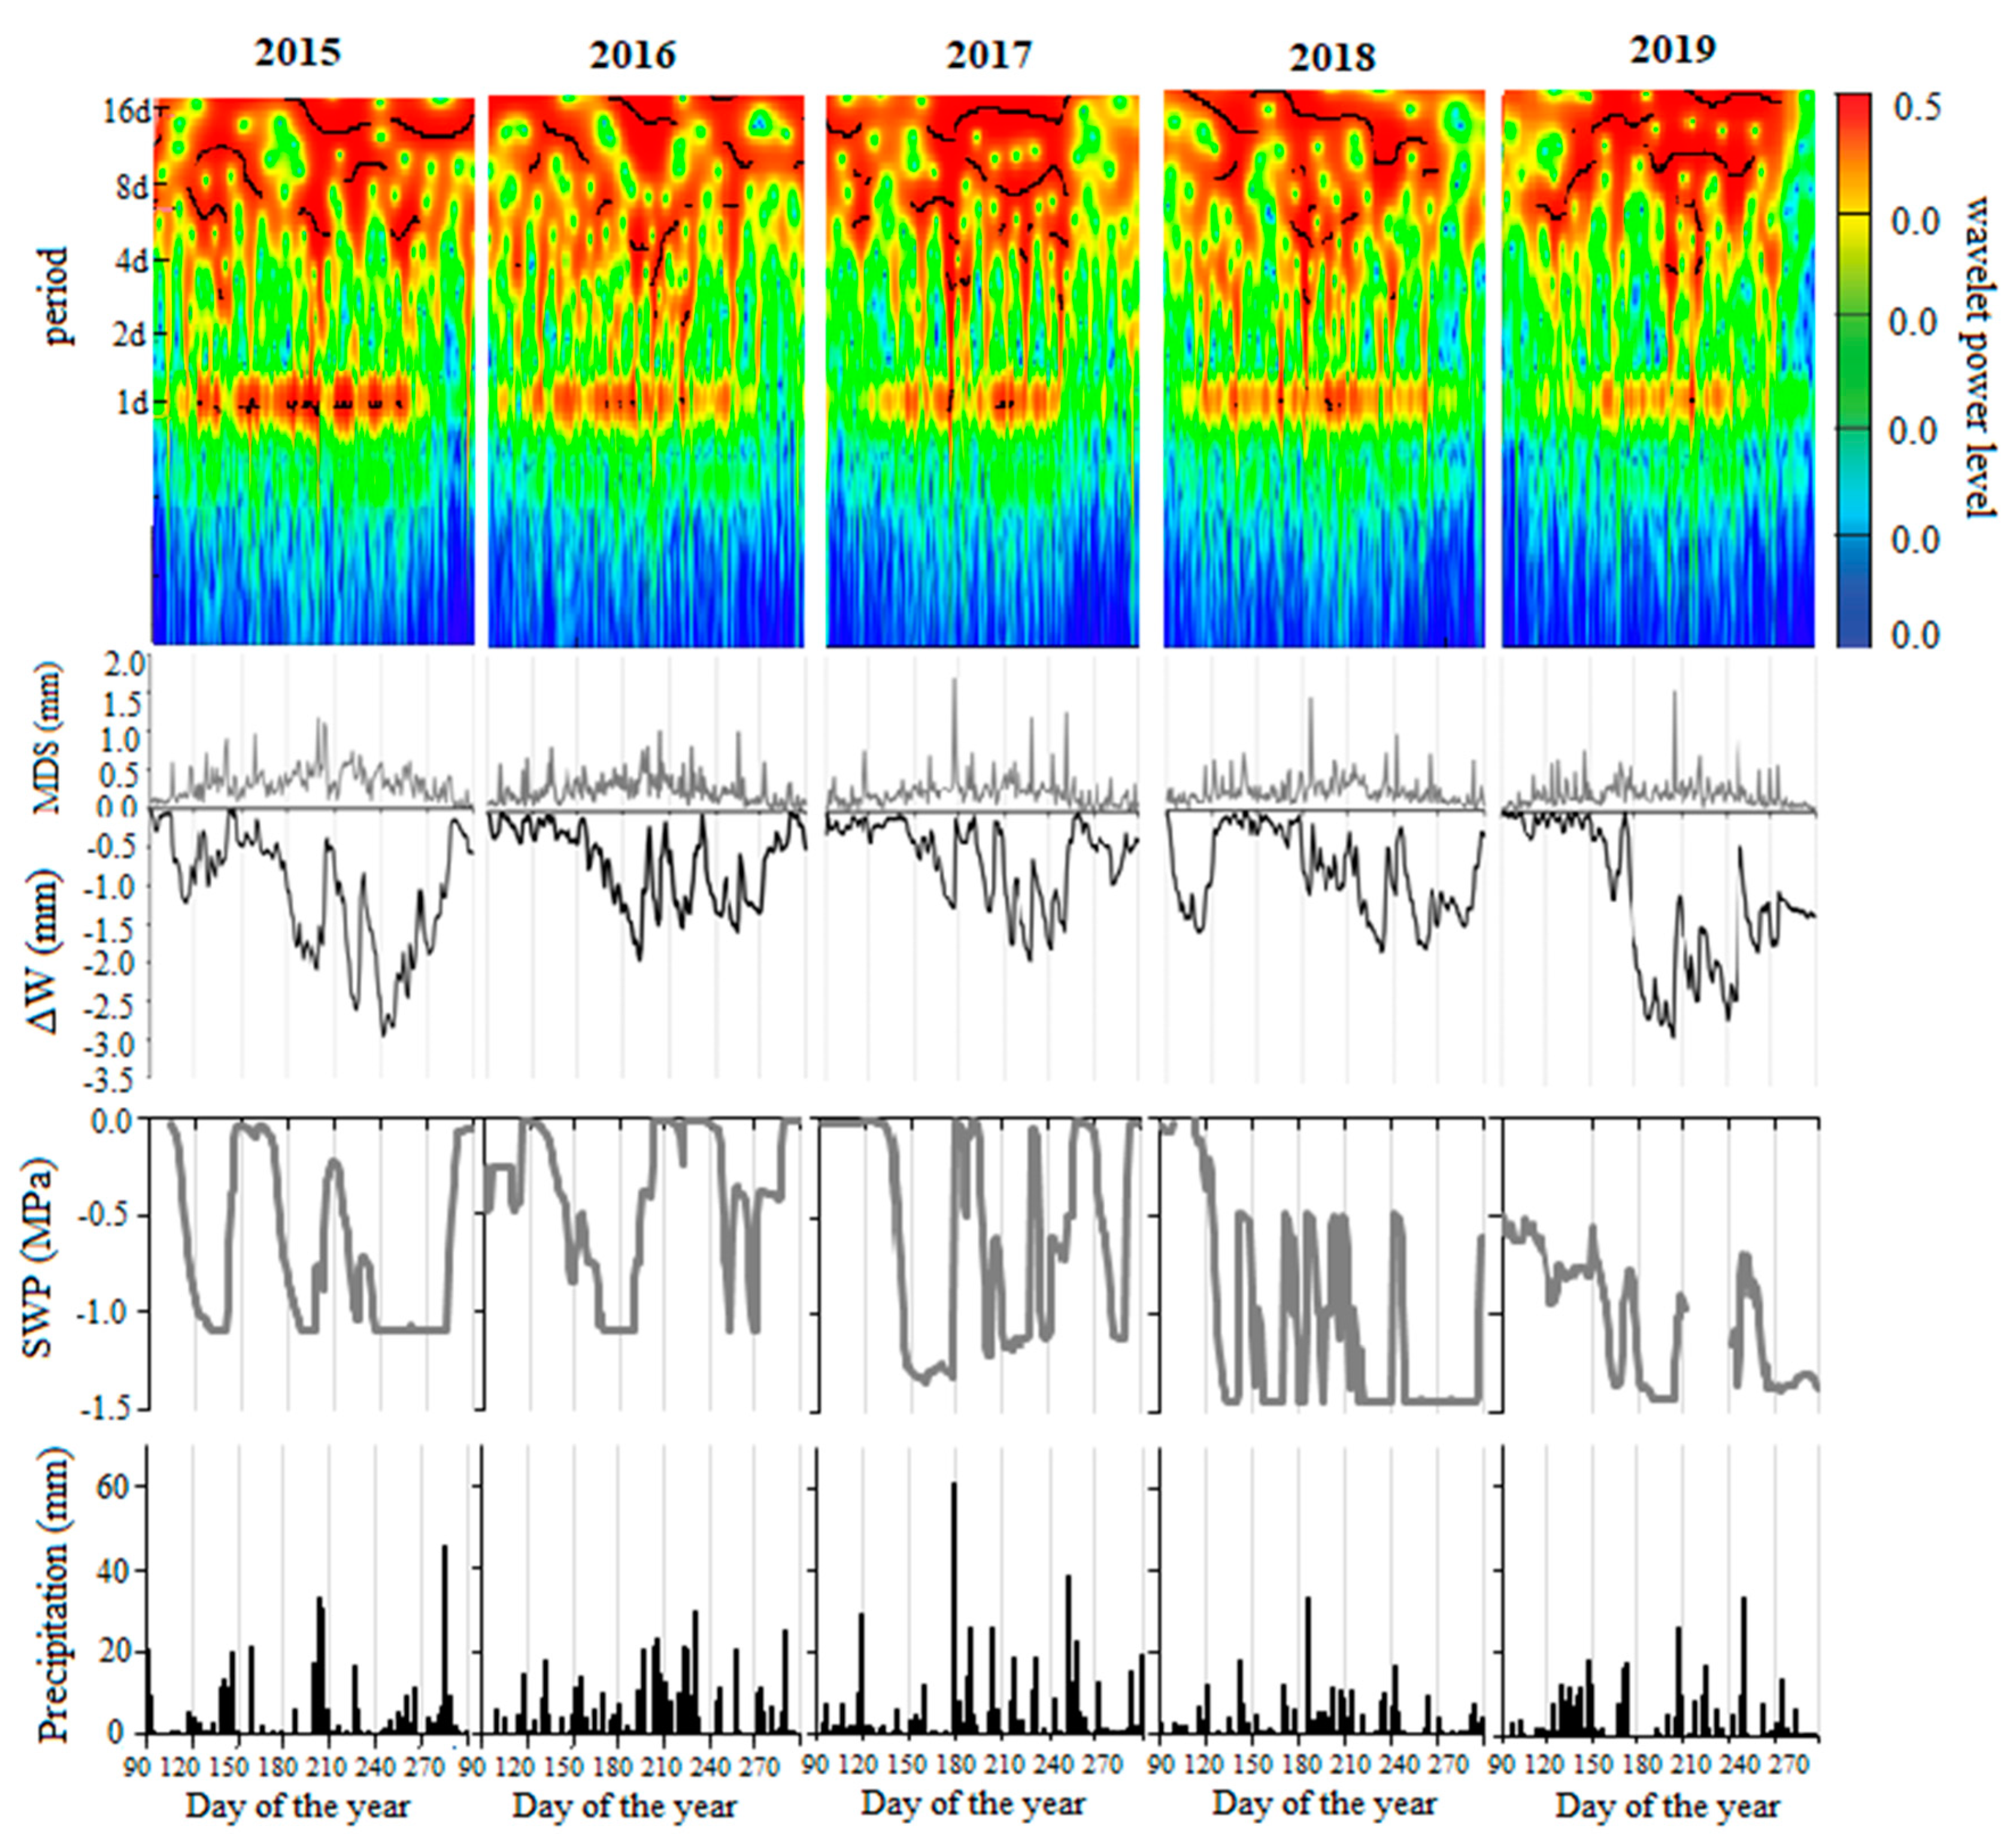
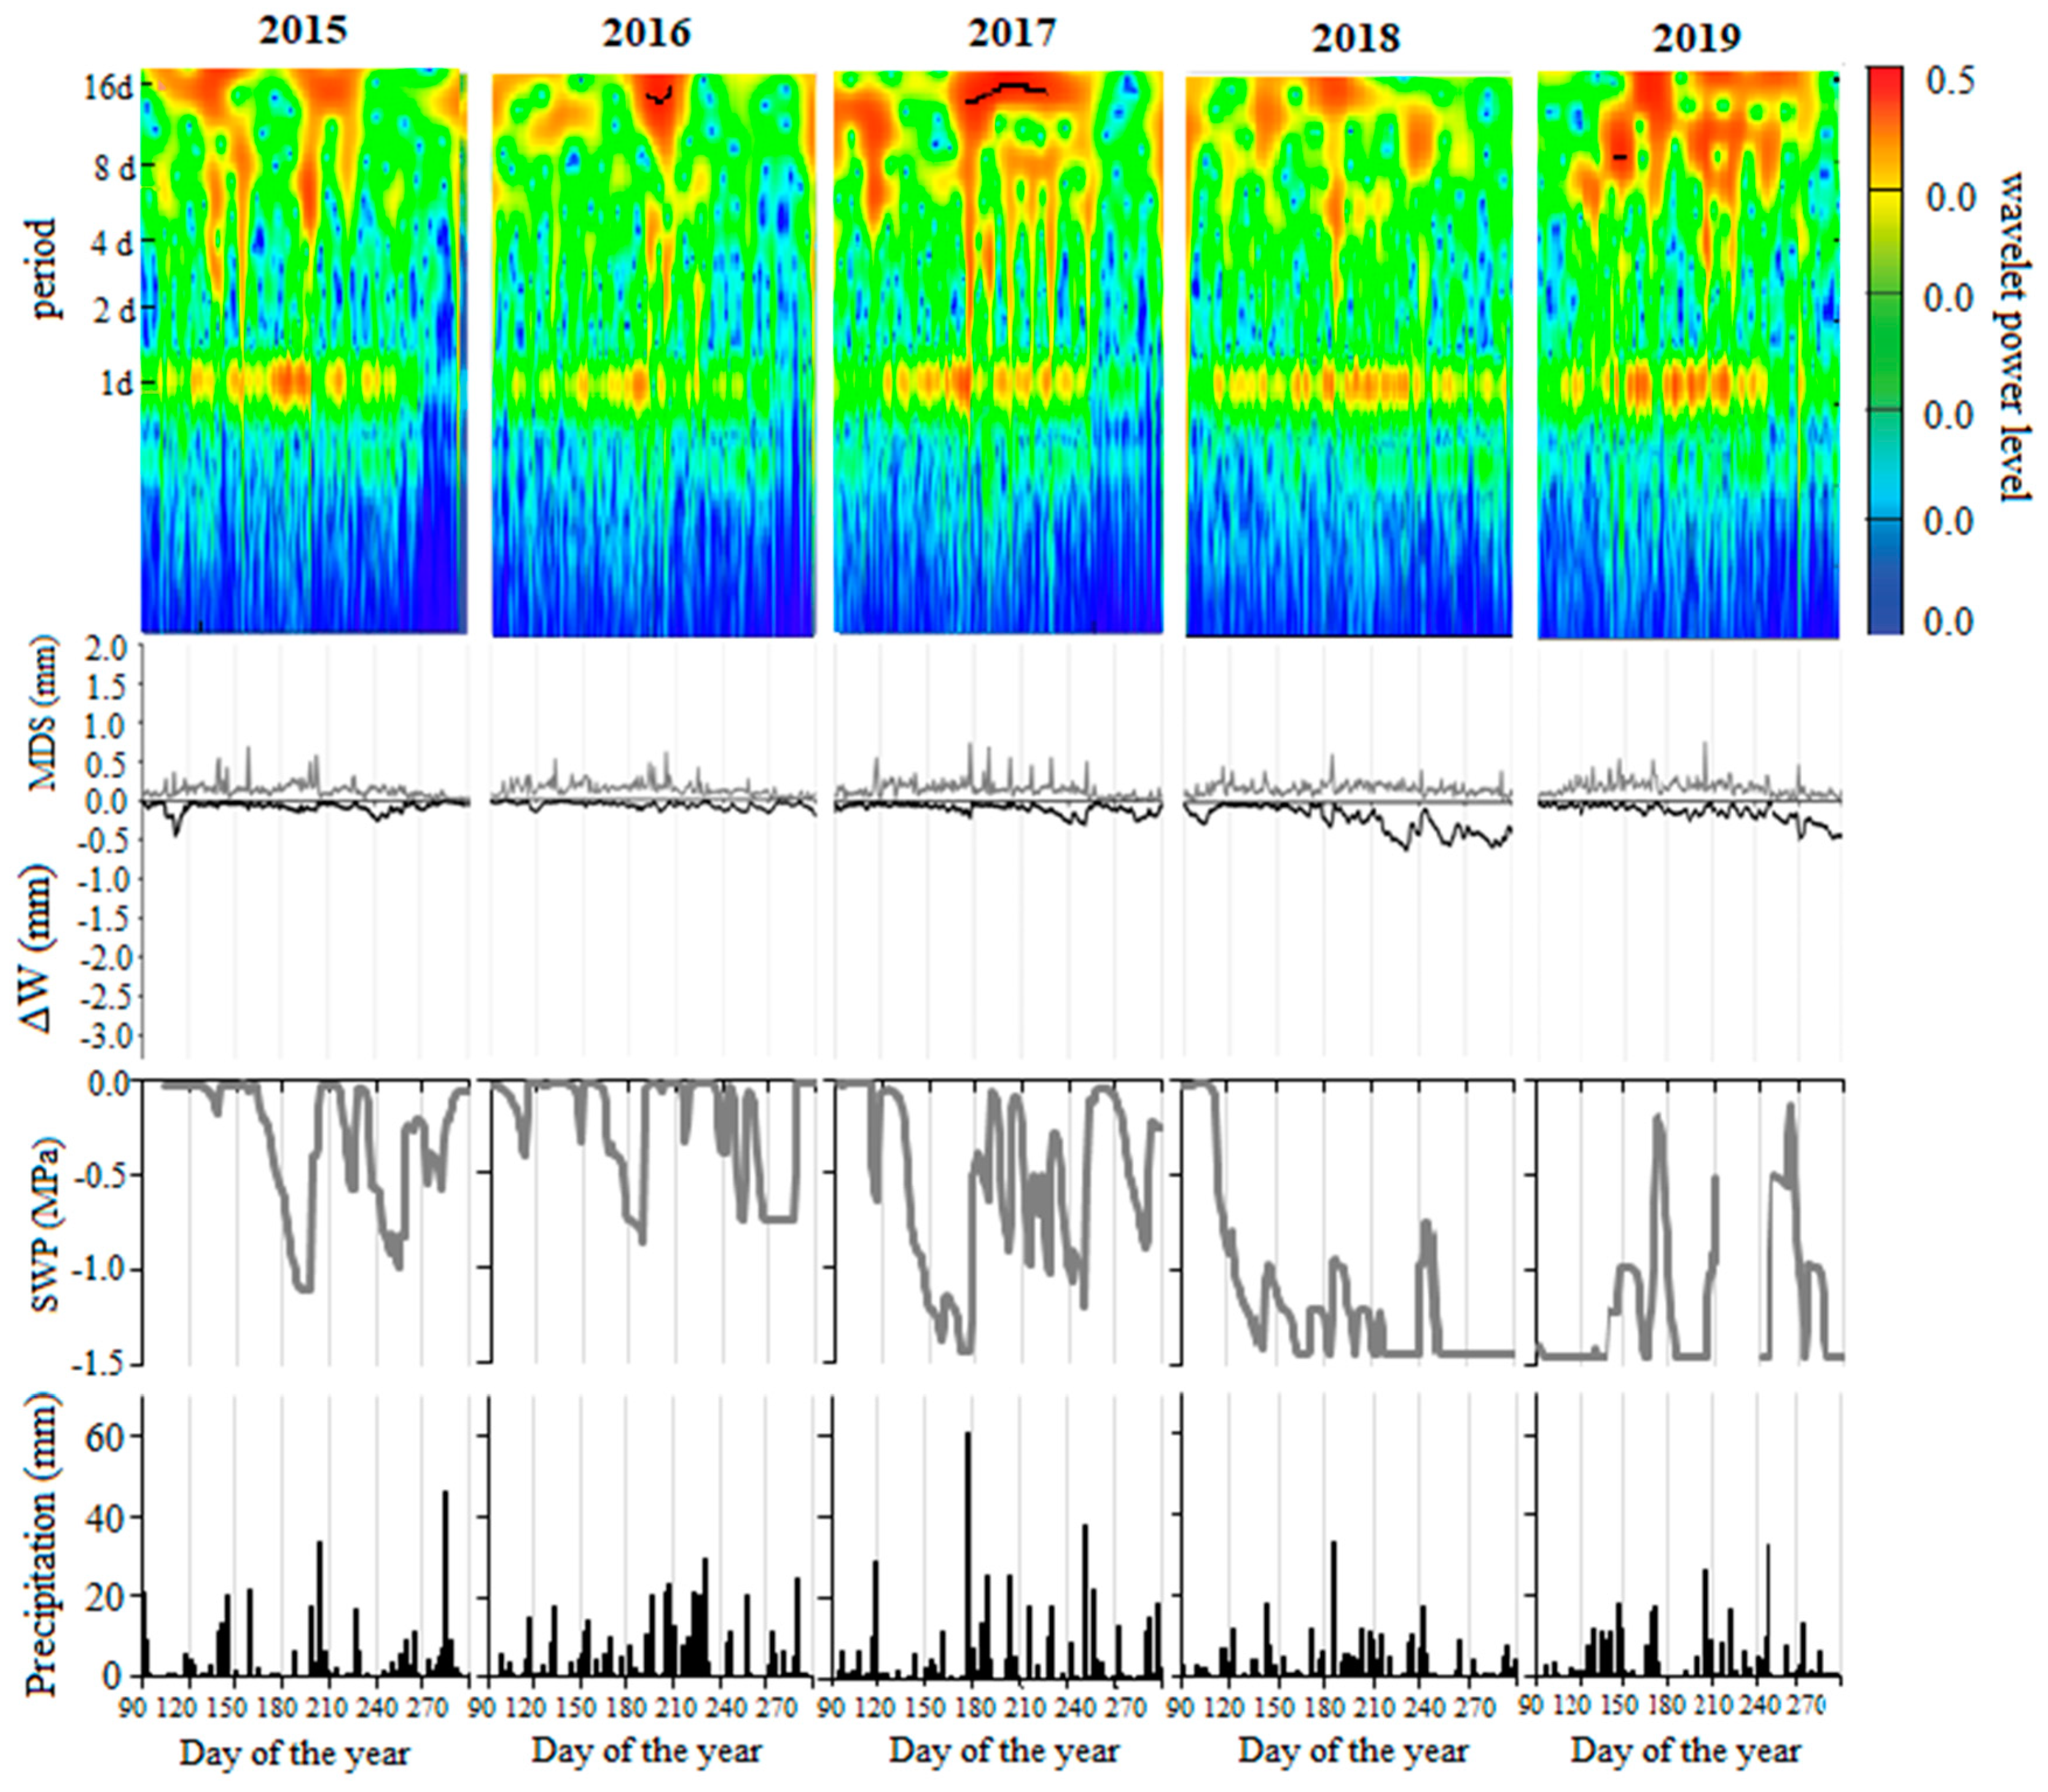
3.2. Stem Growth and Tree Water Status Derived from BDR

Stem circumference records and tree species-specific seasonal stem circumference increment characteristics derived from BDR showed pronounced differences between species (Figure 5). More intensive radial growth was found for A. alba with low fluctuations over the season, while L. decidua showed pronounced seasonal fluctuations in stem increment (Figure 2 and Figure 5). In all investigated years, greater seasonal radial increments were recorded for A. alba (Table 3). Dendrometer records showed the greatest annual radial growth of both species in 2017 (Table 3, Figure 5). In 2018, the annual stem circumference increment of A. alba was only a half of 2017 (Table 3). For L. decidua, the lowest value of radial increment was observed in 2015.
The greatest proportion of larch radial increment was usually created at the beginning of the periods (especially in May) except for the year 2015. In that year, continuous radial growth of larch occurred only within a short period in May (Figure 5). In subsequent months, larch radial circumference increased in a stepwise manner, usually after rain events (Figure 5). Unlike larch, fir continuously grew during the whole period of all years except for the year 2018, when we observed stagnation of fir stem circumference already at the beginning of June (Figure 5).
Significant differences in cumulative MDS between species were revealed for all years (Table 4), while species-specific seasonal cumulative maximum daily shrinkage was significantly higher for L. decidua than for A. alba (Table 3). We also observed differences in cumulative MDS between years, although these were not always significant. Greater differences in cumulative MDS between individual years were found for L. decidua. The two species differed in the years with the greatest and lowest cumulative MDS, since e.g., larch obtained the greatest MDS in 2015, while A. alba in 2019 (Table 4).
Extracted stem water deficit values indicated limited water storage relative to fully hydrated stem conditions. Increasingly negative values mean more pronounced lack of water in storage tissues. Over the examined periods, stem water deficit gradually decreased in species with different magnitudes (Figure 5, Figure 6 and Figure 7). This trend was occasionally disrupted by precipitation events, after which stem water deficit reached values close to zero (Figure 5, Figure 6 and Figure 7). Cumulative ΔW of A. alba reached the highest value in 2016 and the lowest value in 2018. Cumulative ΔW of L. decidua reached the highest value in 2017 and the lowest value in 2019 (Table 4). The cumulative values of stem water deficit in larch were in most cases ten times greater than in fir.

3.3. Tree Water Status and Environmental Conditions

We analysed the relationships between environmental factors and the daily changes of stem water status during the growing periods (1 April–30 October) of the years 2015–2019 using Spearman correlation coefficients. All but one correlation of A. alba stem water deficit to global radiation were significant (Table 5). The results showed that stem water deficit of both species was negatively correlated to daily mean and maximum air temperatures and VPD, while L. decidua was found to be more sensitive to them than A. alba. Moreover, L. decidua was also negatively correlated to daily minimum air temperature (Table 5). The highest positive correlation was revealed between ∆W and soil water potential for both species. The close positive correlation of stem water deficit and precipitation was detected, too (Table 5).
Maximum daily shrinkage of both species was positively correlated with mean, minimum and maximum air temperature, precipitation, and VPD, and negatively correlated with relative air humidity and soil water potential (Table 5).
Morlet wavelet analysis revealed significant daily cycles in BDR (p < 0.05) of both tree species, which were notably more pronounced during the rainless periods (not shown here). The wavelet analysis confirmed more distinct diurnal stem variations in L. decidua compared to A. alba. Revealed daily periodicities correspond with MDS variation, which was greater in L. decidua (Figure 6, Table 4). Although MDS values of A. alba were small, Morlet analysis still revealed daily periodicities (Figure 7). Even small changes in BDR can indicate periodic events. Rainy events or SWP increase caused disturbances in daily periodicities. While periodicities shorter than one day were not significant in either of tree species (Figure 6 and Figure 7), significant periodicities of several days up to 2 weeks occurred in wavelet spectra of both species. In the case of L. decidua, longer periodicities (from 8 days up to 16 days) occurred almost continuously over the studied periods (Figure 6). In the case of fir, longer periodicities were less frequent due to more continuous increase in BDR over time (Figure 5). Abrupt changes of ΔW after rainy events resulted in the co-occurrence of both daily and longer periodicities (Figure 6).
The differences in growth responses and water status parameters between trees, species, and years were further analysed by cluster analysis (Figure 8). The two variables derived by principal component analysis describing growth patterns and water status in detail (Figure 3) were used as inputs for cluster analysis. From Figure 8a, we see that in the case of two clusters, the analysis clearly distinguished clusters of individual species. If we pre-defined five clusters for the whole dataset, the specified clusters still grouped trees of the same species, which indicates that the differences between species prevailed over the differences between the years (Figure 8b). Similarly, in the case of 10 clusters, these were still determined within individual tree species, but grouped different trees and different years together (not shown here). This suggests that the impact of genetics and climate on tree water status was mixed, and one did not prevail the other. The same result was revealed by cluster analysis performed for individual species (Figure 8c,d), for which we predefined five clusters to examine if the individual trees or years could be separated. In most cases, different trees and different years were combined into clusters, which indicates that each tree has its own sensitivity to environmental conditions, and its unique response to their various combinations. We interpret the occurrence of the particular tree in different clusters as its ability to react to different environmental conditions in a different way—i.e., its plasticity. Hence, the plasticity of Abies tree No. 3 was the lowest, as 4 out of 5 examined years occurred within one cluster of the given tree (Figure 8c).

4. Discussion

In recent decades, various authors have analysed high temporal resolution stem growth data of a variety of tree species to better understand their growth responses—e.g., [45,52,53]. Tree growth is controlled by a vast array of conditions, out of which climate is considered as one of the most important. Climate envelope models visualise plant species distribution under contemporary climate [47]. Despite some limitations in their prediction capacity, which include their lack of ability to account for biotic interactions and evolutionary changes [54], this approach has a potential to estimate future spatial species distribution and their sensitivity under changing climate [55]. Our study was performed under conditions projected in coming decades [1,2] as the mean air temperature in the analysed growing seasons exceeded the long-term values of the current site (Table 2), as well as the values of their original natural habitats (Figure 1). Higher annual mean air temperature was observed at the study site also in the preceding years (2014: +2.8 °C; 2013: +1.5 °C; 2012: +1.7 °C). The observed reaction of stem radial growth and water status to environmental conditions in 2015–2019 reflected the species-specific distance from their current distribution described by main climate characteristics (Figure 1)—i.e., higher sensitivity was found for L. decidua—for which the long-term (1961–1990) and all monitored years climate conditions of the study site occurred outside the current species range (Figure 1). Weaker responses were revealed for A. alba, for which both the long-term (1961–1990) and the years 2015, 2016, and 2017 climate conditions occurred inside the current species range (Figure 1).
Seasonal differences in tree circumference growth result from species-specific temperature and/or photoperiod thresholds of cambial activity [56,57]. The increase in stem circumference of both species was mainly favoured by higher precipitation events. In particular, L. decidua grew in cascades separated by plateaus representing stagnation periods. The remarkable plateaus in BDR of L. decidua (Figure 5) observed during June and July in all years correspond with the prevalence of the contraction phase. The growth of A. alba seemed to be less limited by the prevailing dry conditions than L. decidua as the persistence of larger increments indicates (Figure 5), which might be due to its more effective stomatal control mechanism. We assume that limited growth of L. decidua at the studied site is a consequence of conditions that are beyond the climatic distribution of the species causing its higher stress and stimulating strong individual tree responses. Transpiration drives daily cycles in BDR [58,59], which are strictly dependent on soil water content and microclimatic conditions, and can quickly change according to weather conditions. The stem shrinkage corresponded to the periods when ΔW presented a clear decreasing trend, which can be associated with the exhaustion of the internal water storage. In the summer, soil water content diminishes and day length increases, which decreases recovery. Due to this, transpiration demands cannot be fulfilled, and the stem water deficit gradually increases [60]. Transpiration is controlled by stomatal responses to water availability and atmospheric conditions [59]. The physiological consequences of stomata closure are carbon starvation and secondary growth decline due to the allocation of carbon to higher ranking physiological processes such as root growth [59,61]. As a result, trees reduce their metabolism and enter in quiescence [62,63]. During the summer, trees could not compensate for daily water losses, presenting the most negative ΔW values. If a tree can no longer replenish the water lost by transpiration, then contraction would have to be restrained, which would result in a higher dependence between duration and amplitude.
The differences in drought responses between the species may be explained by their intrinsic differences in morphology and physiology. Silver fir has a longer wood formation period than larch (Figure 5). Similarly to our results, the beginning of fir growth in Slovenian forests was observed in early April and the end in late October [64,65]. In larch, we observed maximum radial increase at the beginning of the study periods, usually in May, after which stem circumference increased only sporadically (Figure 5). Early cessation of radial growth as a result of limited water availability has also been observed by Oberhuber et al. [45]. The functional significance of water storage in individual tree species depends on their water status regulation strategy, hydraulic architecture, and wood density [66]. Although L. decidua has been shown to develop a specific drought avoidance strategy by osmotic adjustment resulting from the accumulation of solutes [67], if growing at dry and low elevation sites, this species was found to be sensitive to water stress [68], especially during the summer months, which was also confirmed by our results (Figure 5). Weak adjustability of L. decidua to drought is possibly related to its deciduous habit [69] and/or anisohydric strategy [67], when high transpiration rates are maintained under drought finally causing impairment of tree water status [8]. MDS and ΔW of both tree species showed similar responses to all monitored environmental variables (Table 5). The positive correlation found between MDS and air temperature (mean, minimum, and maximum) suggests that elevated transpiration caused water loss and stem contraction [25,40]. During periods when temperatures are high and soil water content is lower, stomatal control on transpiration rates increases [59], and stem contraction is reduced. Coupling of ΔW to atmospheric conditions indicates that increasing temperature due to climate warming can negatively affect plant growth [70] as well as its water status through its effects on VPD, which increases exponentially with increasing temperature [71]. High sensitivity of stem water status to VPD and soil moisture was reported in several experimental studies [1,39,72]. High VPD reduces cell turgor pressure, which subsequently inhibits cell enlargement and growth [30,73]. High temperatures stimulate evaporation rates causing constraints in water availability, which is characterised by low soil water potential. SWP decline during rainless periods explains “plateaus” in seasonal courses of circumference variation (Figure 5). This is valid for L. decidua, but it is less pronounced for A. alba. The results showed that A. alba is a more resistant tree species to changing conditions defined by increased temperature and periodical drought than L. decidua. Due to this, fir is often considered as a prospective species under climate change [74], since fir productivity should not be adversely affected by increasing temperature [3,75]. The results of climate-growth relationships reflect the growth of tree species in response to water stress. Positive correlations between stem water deficit and precipitation and negative correlations with temperature suggest that tree water status and tree growth is limited by moisture. Increasingly negative numbers of ΔW indicate increasing drought stress (Table 3, Figure 5, Figure 6 and Figure 7).
Diurnal pattern of stem circumference variation is also underlined by high power levels and regions of significant periodicities for both studied species. The most straightforward relationship is between SWP and precipitation (Figure 6 and Figure 7). Wavelet analysis confirmed more pronounced daily cycles in L. decidua BDR than in A. alba. Diurnal periodicities became more distinct when soil drought occurred and SWP values decreased (Figure 6 and Figure 7). This is coupled to MDS temporal course, since MDS represent short-term changes in stem water status. In rainless periods, the values of MDS increase due to water consumption and intensive transport of water from storage tissues to conductive tissues. MDS increases until it reaches a breaking point [76], which we, however, did not observe in our experiment. Wavelet analysis presents absolute values of periodic events, which can be linked to dry or wet periods. Due to this, the interpretation of its results is clearer if linked with ΔW. In the year 2018, fir radial growth was the lowest because the absolute values of ΔW were largest (Table 3), which was reflected in daily periodicity during the whole season (Figure 7). Tree water deficit reflects losses of water over a time longer than one day. Longer periodical cycles occurred either after rain events or as a result of drought, when ΔW gradually increased or decreased. The length of the period of ΔW changes in one direction specifies the periodicity interval. While longer periodicities in A. alba were influenced by rain events, periodicities in L. decidua were also affected by drought. In larch, we observed more frequent and greater power levels of longer periodicities than in fir, because ΔW of L. decidua changed more substantially over time (Figure 6 and Figure 7). This results from the anisotropic character of larch, due to which this species uses more water from its tissues for transpiration than fir.
Cluster analysis identified two groups representing individual investigated species, which confirms the differences between fir and larch in their tree water status (Figure 8). However, the differences between individual trees or years could not be detected, as the identified clusters comprised different years and trees (Figure 8). This indicates that the impact of genetics and environment was mixed and none of them prevailed. Although we assumed that the occurrence of a single tree within multiple clusters may indicate its ability to react to specific environmental conditions, according to Carpenter and Brock [77], increasing variance in respective system processes serves as a decisive symptom of approaching a critical threshold. Hence, more evidence is needed before making a final conclusion.

5. Conclusions

Knowledge on the relationships between climate and growth is essential for assessing future performance of tree species under a warmer and drier climate. Species and communities might strongly differ in their responses to extreme climatic events. Understanding tree growth responses to climatic stresses is an essential element of climate change research because species-specific drought resistance will affect the development of forest ecosystems under changed climate by changing species composition and inducing shifts in forest distribution. Better understanding of species-specific effects of weather conditions on tree growth could help foresters to direct future forest management.
The results of our study confirmed our hypothesis that species-specific ecophysiological and morphological traits of A. alba and L. decidua led to significant differences in climate-growth relationships. Monitored species exhibited remarkably different growth patterns over the growing seasons characterised by highly above normal temperature and uneven precipitation distribution. More pronounced daily dehydration/rehydration changes were observed for L. decidua. Although A. alba had greater seasonal radial increments, and lower values of stem water status characteristics, in the year 2018 with extremely above normal temperature and below normal precipitation this species significantly reduced its increment and increased its stem water deficit because of the lowest SWP in that year. In the case of L. decidua, the impact of limited moisture conditions was not so straightforward, because the lowest increment was observed in the year 2015, while the worst soil water conditions characterised by the greatest stem water deficit were observed in the year 2019. We assume that this could be caused by longer rainless periods that occurred in these two years, while in the year 2018, rain events were more regular although of lower intensity. More long-term research and information needs to be collected to understand the response of individual tree species to changing conditions thoroughly.
Cluster analysis revealed significant differences between A. alba and L. decidua, but not between individual trees and years suggesting that the impact of genetics and environment on tree response was mixed and could not be separated.
Both species were able to cope with changing environmental conditions, and continued to grow under the conditions of above average air temperature and limited soil water. Long-term increase in air temperature, more frequent heat waves coupled with more intense and longer drought periods could affect the ability of species to respond to environmental changes. Therefore, further research is needed to contribute to elucidating individual responses of forest trees and individual coniferous species to external factors outside their natural habitat of environmental and climatic conditions.

Author Contributions

Conceptualization, A.L., P.F.J. and K.M.; methodology, A.L., P.F.J. and K.M.; validation, A.L. and P.F.J.; formal analysis, A.L. and P.F.J.; investigation, A.L.; data curation, A.L.; writing—original draft preparation, A.L.; writing—review and editing, A.L., P.F.J., P.F. and K.M.; supervision, K.S.; project administration, K.S.; funding acquisition, K.S. All authors have read and agreed to the published version of the manuscript.

Funding

The study was supported by research grants of the Slovak Research and Development Agency APVV-16-0306, APVV-18-0390, APVV-18-0347, APVV-16-0325, Slovak Grant Agency for Science no. VEGA 2/0049/18, the grant “EVA4.0”, No. CZ.02.1.01/0.0/0.0/16_019/0000803 financed by OP RDE, and the project: Scientific support of climate change adaptation in agriculture and mitigation of soil degradation (ITMS2014+ 313011W580) supported by the Integrated Infrastructure Operational Programme funded by the ERDF.

Conflicts of Interest

The authors declare no conflict of interest.

References

  1. Will, R.E.; Wilson, S.M.; Zou, C.B.; Hennessey, T.C. Increased vapour pressure deficit due to higher temperature leads to greater transpiration and faster mortality during drought for tree seedlings common to the forest-grassland ecotone. New Phytol. 2013, 200, 366–374. [Google Scholar] [CrossRef] [PubMed]
  2. IPCC. Climate Change 2013. The Physical Science Basis. Contribution of Working Group I to the Fifth Assessment Report of the Intergovernmental Panel on Climate Change; Stocker, T.F., Qin, D., Plattner, G.-K., Tignor, M., Allen, S.K., Boschung, J., Nauels, A., Xia, Y., Bex, V., Midgley, P.M., Eds.; Cambridge University Press: Cambridge, UK, 2013. [Google Scholar]
  3. Usoltsev, V.; Merganičová, K.; Konôpka, B.; Osmirko, A.A.; Tsepordey, I.S.; Chasovskikh, V.P. Fir (Abies spp.) stand biomass additive model for Eurasia sensitive to winter temperature and annual precipitation. Cent. Eur. For. J. 2019, 65, 166–172. [Google Scholar] [CrossRef]
  4. Albert, M.; Hansen, J.; Nagel, J.; Schmidt, M.; Spellmann, H. Assessing risks and uncertainties in forest dynamics under different management scenarios and climate change. For. Ecosyst. 2015, 2, 14. [Google Scholar] [CrossRef] [Green Version]
  5. IPCC. Climate Change 2014: Impacts, Adaptation, and Vulnerability. Part A: Global and Sectoral Aspects. Contribution of Working Group II to the Fifth Assessment Report of the Intergovernmental Panel on Climate Change; Cambridge University Press: Cambridge, UK; New York, NY, USA, 2014. [Google Scholar]
  6. Vitali, V.; Büntgen, U.; Bauhus, J. Silver fir and Douglas fir are more tolerant to extreme droughts than Norway spruce in south-western Germany. Glob. Chang. Biol. 2017, 23, 5108–5119. [Google Scholar] [CrossRef] [PubMed]
  7. Chauvin, F.; Denvil, S. Changes in severe indices as simulated by two French coupled global climate models. Global Planet. Chang. 2007, 57, 96–117. [Google Scholar] [CrossRef] [Green Version]
  8. Bréda, N.; Huc, R.; Granier, A.; Dreyer, E. Temperate forest trees and stands under severe drought: A review of ecophysiological responses, adaptation processes and long-term consequences. Ann. For. Sci. 2006, 63, 625–644. [Google Scholar] [CrossRef] [Green Version]
  9. Lebourgeois, F. Climatic signal in annual growth variation of silver fir (Abies alba Mill.) and spruce (Picea abies Karst.) from the French Permanent Plot Network (RENECOFOR). Ann. For. Sci. 2007, 64, 333–343. [Google Scholar] [CrossRef] [Green Version]
  10. Lévesque, M.; Saurer, M.; Siegwolf, R.; Eilmann, B.; Brang, P.; Bugmann, H.; Rigling, A. Drought response of five conifer species under contrasting water availability suggests high vulnerability of Norway spruce and European larch. Glob. Chang. Biol. 2013, 19, 3184–3199. [Google Scholar] [CrossRef]
  11. Danek, M.; Chuchro, M.; Walanus, A. Variability in Larch (Larix Decidua Mill.) Tree-ring growth response to climate in the polish Carpathian Mountains. Forests 2017, 8, 354. [Google Scholar] [CrossRef] [Green Version]
  12. Schulze, E.D.; Čermák, J.; Matyssek, R.; Penka, M.; Zimmermann, R.; Vasícek, F.; Gries, W.; Kučera, J. Canopy transpiration and water fluxes in the xylem of the trunk of Larix and Picea trees—A comparison of xylem flow, porometer and cuvette measurements. Oecologia 1985, 66, 475–483. [Google Scholar] [CrossRef]
  13. Ellenberg, H. Vegetation Ecology of Central Europe, 4th ed.; Cambridge University Press: Cambridge, UK, 2009. [Google Scholar]
  14. van der Maaten-Theunissen, M.; Kahle, H.-P.; van der Maaten, E. Drought sensitivity of Norway spruce is higher than that of silver fir along an altitudinal gradient in southwestern Germany. Ann. For. Sci. 2013, 70, 185–193. [Google Scholar] [CrossRef] [Green Version]
  15. Ruosch, M.; Spahni, R.; Joos, F.; Henne, P.D.; van der Knaap, W.O.; Tinner, W. Past and future evolution of Abies alba forests in Europe-comparison of a dynamic vegetation model with palaeo data and observations. Glob. Chang. Biol. 2016, 22, 727–740. [Google Scholar] [CrossRef]
  16. Bošela, M.; Petráš, R.; Sitková, Z.; Priwitzer, T.; Pajtík, J.; Hlavatá, H.; Sedmák, R.; Tobin, B. Possible causes of the recent rapid increase in the radial increment of silver fir in the Western Carpathians. Environ. Pollut. 2014, 184, 211–221. [Google Scholar] [CrossRef]
  17. Büntgen, U.; Tegel, W.; Kaplan, J.O.; Schaub, M.; Hagedorn, F.; Bürgi, M.; Brázdil, R.; Helle, G.; Carrer, M.; Heussner, K.U.; et al. Placing unprecedented recent fir growth in a European-wide and Holocene-long context. Front. Ecol. Environ. 2014, 12, 100–106. [Google Scholar] [CrossRef]
  18. Hartmann, H.; Moura, C.F.; Anderegg, W.R.L.; Ruehr, N.K.; Salmon, Y.; Allen, C.D.; Arndt, S.K.; Breshears, D.D.; Davi, H.; Galbraith, D.; et al. Research frontier for improving our understanding of drought-induced tree and forest mortality. New Phytol. 2018, 218, 15–28. [Google Scholar] [CrossRef] [Green Version]
  19. Liu, Y.Y.; Wang, A.Y.; An, Y.N.; Lian, P.Y.; Wu, D.D.; Zhu, J.J.; Meinzer, F.C.; Hao, G.Y. Hydraulics play an important role in causing low growth rate and dieback of aging Pinus sylvestris var. mongolica trees in plantations of Northeast China. Plant Cell Environ. 2018, 41, 1500–1511. [Google Scholar] [CrossRef] [PubMed]
  20. Kaiser, W.M. Effects of water deficit on photosynthetic capacity. Physiol. Plant. 1987, 71, 142–149. [Google Scholar] [CrossRef]
  21. Chaves, M.M.; Maroco, J.P.; Pereira, J.S. Understanding plant responses to drought—From genes to the whole plant. Funct. Plant Biol. 2003, 30, 239–264. [Google Scholar] [CrossRef] [PubMed]
  22. Kramer, P.J. Water Relation of Plants; Academic Press: New York, NY, USA, 1983. [Google Scholar]
  23. Peramaki, M.; Nikinmaa, E.; Sevanto, S.; Ilvesniemi, H.; Siivola, E.; Hari, P.; Vesala, T. Tree stem diameter variations and transpiration in Scots pine: An analysis using a dynamic sap flow model. Tree Physiol. 2001, 21, 889–897. [Google Scholar] [CrossRef] [PubMed] [Green Version]
  24. Daudet, F.A.; Améglio, T.; Cochard, H.; Archilla, O.; Lacointe, A. Experimental analysis of the role of water and carbon in tree stem diameter variations. J. Exp. Bot. 2005, 56, 135–144. [Google Scholar] [CrossRef] [Green Version]
  25. Čermák, J.; Kučera, J.; Bauerle, W.L.; Phillips, N.; Hinckley, T.M. Tree water storage and its diurnal dynamics related to sap flow and changes in stem volume in old-growth Douglas-fir trees. Tree Physiol. 2007, 27, 181–198. [Google Scholar] [CrossRef] [PubMed]
  26. Peramaki, M.; Vesala, T.; Nikinmaa, E. Modeling the dynamics of pressure propagation and diameter variation in tree sapwood. Tree Physiol. 2005, 25, 1091–1099. [Google Scholar] [CrossRef] [PubMed] [Green Version]
  27. Hinckley, T.; Lassoie, J. Radial growth in conifers and deciduous trees: A comparison. Mitt.-Vienna Forstl. Bundesversuchsanstalt 1981, 142, 17–56. [Google Scholar]
  28. Whitehead, D.; Jarvis, P.G. Coniferous Forests and Plantations. In Water Deficits and Plant Growth; Kozlowski, T.T., Ed.; Academic Press: New York, NY, USA, 1981; Volume VI, pp. 49–152. [Google Scholar]
  29. Herzog, K.M.; Thum, R.; Häsler, R. Diurnal changes in the radius of a subalpine Norway spruce stem: Their relation to the sap flow and their use to estimate transpiration. Trees 1995, 10, 94–101. [Google Scholar] [CrossRef]
  30. Zweifel, R.; Zimmermann, L.; Newbery, D.M. Modeling tree water deficit from microclimate: An approach to quantifying drought stress. Tree Physiol. 2005, 25, 147–156. [Google Scholar] [CrossRef] [PubMed] [Green Version]
  31. Ehrenberger, W.; Rüger, S.; Fitzke, R.; Vollenweider, P.; Günthardt-Goerg, M.S.; Kuster, T.; Zimmermann, U.; Arend, M. Concomitant dendrometer and leaf patch pressure probe measurements reveal the effect of microclimate and soil moisture on diurnal stem water and leaf turgor variations in young oak trees. Funct. Plant. Biol. 2012, 39, 297–305. [Google Scholar] [CrossRef] [PubMed]
  32. Sánchez-Costa, E.; Poyatos, R.; Sabaté, S. Contrasting growth and water use strategies in four co-occurring Mediterranean tree species revealed by concurrent measurements of sap flow and stem diameter variations. Agric. For. Meteorol. 2015, 207, 24–37. [Google Scholar] [CrossRef] [Green Version]
  33. Sevanto, S.; Hölttä, T.; Markkanen, T.; Perämäki, M.; Nikinmaa, E.; Vesala, T. Relationships between diurnal xylem diameter variation and environmental factors in Scots pine. Boreal Environ. Res. 2005, 10, 447–458. [Google Scholar]
  34. Steppe, K.; Sterck, F.; Deslauriers, A. Diel growth dynamics in tree stems: Linking anatomy and ecophysiology. Trends Plant Sci. 2015, 20, 335–343. [Google Scholar] [CrossRef] [Green Version]
  35. Zweifel, R.; Drew, D.M.; Schweingruber, F.; Downes, G.M. Xylem as the main origin of stem radius changes in eucalyptus. Funct. Plant Biol. 2014, 41, 520–534. [Google Scholar] [CrossRef] [Green Version]
  36. Zweifel, R.; Item, H.; Häsler, R. Stem radius changes and their relation to stored water in stems of young Norway spruce trees. Trees Struct. Funct. 2000, 15, 50–57. [Google Scholar] [CrossRef] [Green Version]
  37. Deslauriers, A.; Morin, H.; Urbinati, C.; Carrer, M. Daily weather response of balsam fir (Abies balsamea (L.) Mill.) stem radius increment from dendrometer analysis in the boreal forests of Quebec (Canada). Trees 2003, 17, 477–484. [Google Scholar] [CrossRef]
  38. Turcotte, A.; Morin, H.; Krause, C.; Deslauriers, A.; Thibeault-Martel, M. The timing of spring rehydration and its relation with the onset of wood formation in black spruce. Agric. For. Meteorol. 2009, 149, 1403–1409. [Google Scholar] [CrossRef]
  39. Köcher, P.; Horna, V.; Leuschner, C. Environmental control of daily stem growth patterns in five temperate broad-leaved tree species. Tree Physiol. 2012, 32, 1021–1032. [Google Scholar] [CrossRef] [Green Version]
  40. Zweifel, R.; Item, H.; Häsler, R. Link between diurnal stem radius changes and tree water relations. Tree Physiol. 2001, 21, 869–877. [Google Scholar] [CrossRef] [Green Version]
  41. Drew, D.M.; Downes, G.M. The use precision dendrometers in research on daily stem size and wood property variation: A review. Dendrochronologia 2009, 27, 159–172. [Google Scholar] [CrossRef]
  42. Downes, G.; Beadle, C.; Worledge, D. Daily stem growth patterns in irrigated Eucalyptus globulus and E. nitens in relation to climate. Trees 1999, 14, 102–111. [Google Scholar] [CrossRef]
  43. Deslauriers, A.; Rossi, S.; Anfondillo, T. Dendrometer and intra-annual tree growth: What kind of information can be inferred? Dendrochronologia 2007, 25, 113–124. [Google Scholar] [CrossRef] [Green Version]
  44. Leštianska, A.; Merganičová, K.; Merganič, J.; Střelcová, K. Intra-annual patterns of weather and daily radial growth changes of Norway spruce and their relationship in the Western Carpathian mountain region over a period of 2008–2012. J. For. Sci. 2015, 61, 315–324. [Google Scholar] [CrossRef]
  45. Oberhuber, W.; Gruber, A.; Kofler, W.; Swidrak, I. Radial stem growth in response to microclimate and soil moisture in a drought-prone mixed coniferous forest at an inner Alpine site. Eur. J. For. Res. 2014, 133, 467–479. [Google Scholar] [CrossRef] [Green Version]
  46. Lukáčik, I. Arborétum Borová hora—História, súčasnosť a perspektívy. In Dendroflora of Central Europe—Utilization of Knowledge in Research, Education and Practice; Lukáčik, I., Sarvašová, I., Eds.; Vydavateľstvo TU vo Zvolene: Zvolen, Slovakia, 2015; pp. 9–19. [Google Scholar]
  47. Kölling, C. Klimahüllen für 27 Baumarten. AFZ-DerWald 2007, 62, 1242–1245. [Google Scholar]
  48. Oberhuber, W.; Hammerle, A.; Kofler, W. Tree water status and growth of saplings and mature Norway spruce (Picea abies) at a dry distribution limit. Front. Plant Sci. 2015, 6, 703. [Google Scholar] [CrossRef] [PubMed] [Green Version]
  49. van der Maaten, E.; van der Maaten-Theunissen, M.; Smiljanić, M.; Rossi, S.; Simard, S.; Wilmking, M.; Deslauriers, A.; Fonti, P.; von Arx, G.; Bouriaud, O. dendrometeR: Analyzing the pulse of tree in R. Dendrochronologia 2016, 40, 12–16. [Google Scholar] [CrossRef]
  50. Torrence, C.; Compo, G.P. A practical guide to wavelet analysis. Bull. Am. Meteorol. Soc. 1998, 79, 61–78. [Google Scholar] [CrossRef] [Green Version]
  51. Rösch, A.; Schmidbauer, H. WaveletComp1.1: A Guided Tour through the Rpackage. 2018. Available online: http://www.Hsstat.Com/Projects/WaveletComp/WaveletComp_guided_tour.Pdf (accessed on 12 September 2020).
  52. Eilmann, B.; Rigling, A. Tree-growth analyses to estimate tree species’ drought tolerance. Tree Physiol. 2012, 32, 178–187. [Google Scholar] [CrossRef] [Green Version]
  53. Vieira, J.; Rossi, S.; Campelo, F.; Freitas, H.; Nabais, C. Seasonal and daily cycles of stem radial variation of pinus pinaster in a drought-prone environment. Agric. For. Meteorol. 2013, 180, 173–181. [Google Scholar] [CrossRef] [Green Version]
  54. Ibáñez, I.; Clark, J.S.; Dietze, M.C.; Feeley, K.; Hersh, M.; LaDeau, S.; McBride, A.; Welch, N.E.; Wolosin, M.S. Predicting biodiversity change: Outside the climate envelope, beyond the species-area curve. Ecology 2006, 87, 1896–1906. [Google Scholar] [CrossRef]
  55. Walentowski, H.; Falk, W.; Mette, T.; Kunz, J.; Bräuning, A.; Melnardus, C.; Zang, C.; Sucliffe, L.; Leuschner, C. Assessing future suitability of tree species under climate change by multiple methods: A case study in southern Germany. Ann. For. Res 2017, 60, 101–126. [Google Scholar] [CrossRef] [Green Version]
  56. Begum, S.; Nakaba, S.; Yamagishi, Y.; Oribe, Y.; Funada, R. Regulation of cambial activity in relation to environmental conditions: Understanding the role of temperature in wood formation of trees. Physiol. Plant. 2013, 147, 46–54. [Google Scholar] [CrossRef] [PubMed]
  57. Körner, C.; Basler, D. Phenology under global warming. Science 2010, 327, 1461–1462. [Google Scholar] [CrossRef]
  58. Kozlowski, T.T. Water Deficits and Plant Growth. Vol III. Plant Responce and Control of Water Balance; Academic Press: New York, NY, USA, 1976; 368p. [Google Scholar]
  59. Zweifel, R.; Zimmermann, L.; Zeugin, F.; Newberry, D.M. Intra-annual radial growth and water relations of trees: Implications towards a growth mechanism. J. Exp. Bot. 2006, 57, 1445–1459. [Google Scholar] [CrossRef] [PubMed] [Green Version]
  60. Devine, W.D.; Harrington, C.A. Factors affecting diurnal stem contraction in young Douglas-fir. Agric. For. Meteorol. 2011, 151, 414–419. [Google Scholar] [CrossRef]
  61. Chaves, M.M.; Pereira, J.S.; Maroco, J.; Rodrigues, M.L.; Ricardo, C.P.P.; Osorio, M.L.; Carvalho, I.; Faria, T.; Pinheiro, C. How plants cope with water stress in the field? Photosynthesis and growth. Ann. Bot. 2002, 89, 907–916. [Google Scholar] [CrossRef] [PubMed] [Green Version]
  62. Cherubini, P.; Gartner, B.L.; Tognetti, R.; Bräker, O.U.; Schoch, W.; Innes, J.L. Identification, measurement and interpretation of tree rings in woody species from Mediterranean climates. Biol. Rev. 2003, 78, 119–148. [Google Scholar] [CrossRef] [PubMed] [Green Version]
  63. McDowell, N.; Pockman, W.T.; Allen, C.D.; Breshears, D.D.; Cobb, N.; Kolb, T.; Plaut, J.; Sperry, J.; West, A.; Williams, D.G.; et al. Mechanisms of plant survival and mortality during drought: Why do some plants survive while others succumb to drought? New Phytol. 2008, 178, 719–739. [Google Scholar] [CrossRef]
  64. Gričar, J.; Čufar, K. Seasonal dynamics of phloem and xylem formation in silver fir and Norway spruce as affected by drought. Russ. J. Plant Physiol. 2008, 55, 538–543. [Google Scholar] [CrossRef]
  65. Swidrak, I.; Gruber, A.; Oberhuber, W. Xylem and phloem phenology in co-occurring conifers exposed to drought. Trees 2014, 28, 1161–1171. [Google Scholar] [CrossRef] [Green Version]
  66. Köcher, P.; Horna, V.; Leuschner, C. Stem water storage in five coexisting temperate broad-leaved tree species: Significance, temporal dynamics and dependence on tree functional traits. Tree Physiol. 2013, 33, 817–832. [Google Scholar] [CrossRef]
  67. Anfodillo, T.; Rento, S.; Carraro, V.; Furlanetto, L.; Urbinati, C.; Carrer, M. Tree water relations and climatic variations at the alpine timberline: Seasonal changes of sap flux and xylem water potential in Larix decidua Miller, Picea abies (L.) Karst and Pinus cembra L. Ann. For. Sci. 1998, 55, 159–172. [Google Scholar] [CrossRef]
  68. Saulnier, M.; Corona, C.; Stoffel, M.; Guibal, F.; Edouard, J.-L. Climate-growth relationships in a Larix decidua Mill. Network in the French Alps. Sci. Total Environ. 2019, 664, 554–566. [Google Scholar] [CrossRef]
  69. Migliavacca, M.; Cremonese, E.; Colombo, R.; Busetto, L.; Galvagno, M.; Ganis, L.; Meroni, M.; Pari, E.; Rossini, M.; Siniscalco, C.; et al. European larch phenology in the Alps: Can we grasp the role of ecological factors by combining field observations and inverse modelling? Int. J. Biometeorol. 2008, 52, 587–605. [Google Scholar] [CrossRef] [PubMed]
  70. Battipaglia, G.; Saurer, M.; Cherubini, P.; Siegwolf, R.T.W.; Cotrufo, M.F. Tree rings indicate different drought resistance of a native (Abies alba Mill.) and a non-native (Picea abies (L.) Karst.) species co-occurring at a dry site in Southern Italy. For. Ecol. Manag. 2009, 257, 820–828. [Google Scholar] [CrossRef]
  71. Breshears, D.D.; Adams, H.D.; Eamus, D.; McDowell, N.; Law, D.J.; Will, R.E.; Williams, A.P.; Zou, C.B. The critical amplifying role of increasing atmospheric moisture demand on tree mortality and associated regional die-off. Front. Plant Sci. 2013, 4, 266. [Google Scholar] [CrossRef] [PubMed] [Green Version]
  72. Oberhuber, W.; Gruber, A. Climatic influences on intra-annual stem radial increment of Pinus sylvestris (L.) exposed to drought. Trees 2010, 24, 887–898. [Google Scholar] [CrossRef] [Green Version]
  73. Steppe, K.; De Pauw, D.J.W.; Lemeur, R.; Vanrolleghem, P.A. A mathematical model linking tree sap flow dynamics to daily stem diameter fluctuations and radial stem growth. Tree Physiol. 2006, 26, 257–273. [Google Scholar] [CrossRef] [Green Version]
  74. Lindner, M.; Garcia-Gonzalo, J.; Kolstrom, M.; Green, T.; Reguera, R.; Maroschek, M.; Seidl, R.; Lexer, M.J.; Netherer, S.; Schopf, A.; et al. Impacts of Climate Change on European Forests and Options for Adaptation; Report to the European Commission Directorate-General for Agriculture and Rural Development; European Forestry Institute: Joensuu, Finland, 2008; 173p. [Google Scholar]
  75. Bošeľa, M.; Lukáč, M.; Castagneri, D.; Sedmák, R.; Biber, P.; Carrer, P.; Konôpka, B.; Nola, P.; Thomas, A.; Nagel, T.A.; et al. Contrasting effects of environmental change on the radial growth of co-occurring beech and fir trees across Europe. Sci. Total Environ. 2018, 615, 1460–1469. [Google Scholar] [CrossRef]
  76. Moreno, F.; Conejero, W.; Martín-Palomo, M.J.; Girón, I.F.; Torrecillas, A. Maximum daily trunk shrinkage reference values for irrigation scheduling in olive trees. Agric. Water Manag. 2006, 84, 290–294. [Google Scholar] [CrossRef]
  77. Carpenter, S.R.; Brock, W.A. Rising variance: A leading indicator of ecological transition. Ecol. Lett. 2006, 9, 311–318. [Google Scholar] [CrossRef]
Figure 1. Species-specific distribution with regard to annual values of two main climate parameters (coloured areas) derived from Kölling [47] compared with local long-term values, local values representing the years 2015–2019, and values representing their original habitats.
Water 12 02945 g001
Figure 2. Growth lines (solid black lines) and band dendrometer records (BDR) of stem circumference of L. decidua and A. alba for the year 2015 (a). Detailed figures (b) and (c) depict rainless (20–23 July 2015) and rainy (24–26 July 2015) periods, respectively, showing distinct phases of a stem cycle: contraction (red), expansion (green), and increment (black points). Individual points represent hourly data. Maximum daily shrinkage (MDS) is a difference between daily maximum and minimum stem size. Stem water deficit (∆W) is a difference between the actual stem size and the growth line representing the stem size under fully hydrated conditions.
Water 12 02945 g002
Figure 3. Variables describing radial stem growth pattern and water status derived from band dendrometer records used in principal component analysis (cum_d_inc (h)—cumulative duration of increment, cum_d_cont (h)—cumulative duration of contraction, avg_inc (mm)—average daily increment, cum_cont (mm)—cumulative contraction, cum_exp (mm)—cumulative expansion, cum_inc (mm)—cumulative increment, cum_d_inc (h)—cumulative duration of increment, n_cyc—number of cycles).
Water 12 02945 g003
Figure 4. Anomalies of monthly precipitation totals (bars) and monthly mean air temperature values (lines) in the studied period April–October (A–O) of the years 2015–2019 in comparison to long-term mean climate conditions in the period 1961–1990. The 0 line represents the long-term monthly mean air temperature and long-term monthly precipitation total.
Water 12 02945 g004
Figure 5. Seasonal courses of band dendrometer records (BDR) of stem circumference of L. decidua (dark grey line) and A. alba (black line) and growth lines (red lines) in individual years. Each line represents an average from five trees of the same species. Bars (light grey lines for L. decidua and dark grey lines for A. alba) represent standard deviations of BDR (n = 5).
Water 12 02945 g005
Figure 6. Morlet wavelet spectra of 20-min measured records of stem circumference for L. decidua, maximum daily shrinkage (MDS), stem water deficit (ΔW), daily precipitation (bars), and soil water potential (SWP, grey line) in the studied period (April–October) of the years 2015–2019. Dark red and white colours are assigned to the highest wavelet power spectra, whereas the dark blue colour is assigned to the lowest values. Wavelet power levels were set from 0.0 to 1.10−1.
Water 12 02945 g006
Figure 7. Morlet wavelet spectra of 20-min measured records of stem circumference for A. alba, maximum daily shrinkage (MDS), stem water deficit (ΔW), daily precipitation (bars), and soil water potential (SWP, grey line) in the studied period (April–October) of the years 2015–2019. Dark red and white colours are assigned to the highest wavelet power spectra, whereas the dark blue colour is assigned to the lowest values. Wavelet power levels were set from 0.0 to 1.10−1.
Water 12 02945 g007
Figure 8. Species-specific responses of stem circumference to environmental conditions analysed by principal component analysis and cluster analysis with predefined two clusters for the whole dataset (a), five clusters for the whole dataset (b), five clusters for A. alba (c), and five clusters for L. decidua (d). Abbreviations in labels: A and L stand for A. alba and L. decidua, respectively; numbers 15–19 represent years (2015–2019); numbers 1–5 represent individuals of the respective tree species.
Water 12 02945 g008
Table 1. The characteristics of the original location. Air temperature (°C) is long-term annual air temperature representing a period of 1961–1990. Precipitation (mm) is the long-term mean annual precipitation total representing a period of 1961–1990.
SpeciesOriginal Location of Selected Species
Orographic UnitLocalityElevation Air Temperature Precipitation
(m a.s.l.)(°C)(mm)
L. deciduaSpišsko-gemerský krasVoniaca dolina9004.7835
A. albaKremnica mountainsFlochovský back9506.5786
Table 2. Climatic characteristics representing the period April–October (A–O) of the years 2015–2019, where N (%) is percentage of long-term normal (long-term average calculated from the years 1961–1990), Mean is seasonal mean air temperature of the respective period, Difference from Normal is difference between mean air temperature and long-term average for the years 1961–1990, vapour pressure deficit (VPD) is seasonal mean vapour pressure deficit.
MonthPrecipitation (mm)Air Temperature (°C)VPD
Precipitation TotalN Mean Difference from Normal
(mm)(%)(°C)(°C)(kPa)
(A-O) 2015412.210515.72.20.552
(A-O) 2016512.312515.31.80.455
(A-O) 2017501.012415.21.60.500
(A-O) 2018320.87517.03.50.557
(A-O) 2019387.29215.82.30.480
Table 3. Seasonal species-specific characteristics of growth and stem water status dynamics, where cum_inc is average cumulated increment (mm), ∆Wcum is average cumulated stem water deficit (mm), MDScum is average cumulated maximum shrinkage (mm), and SE is standard error of the respective characteristics.
A. AlbaL. Decidua
Cum_Inc ± SE∆Wcum ± SEMDScum ± SECum_Inc ± SE∆Wcum ± SEMDScum ± SE
201514.59 ± 2.18−17.34 ± 0.5429.35 ± 3.674.79 ± 1.33−234.78 ± 28.3368.11 ± 7.34
201617.04 ± 2.74−14.69 ± 1.7929.26 ± 4.497.74 ± 1.28−146.51 ± 11.9758.53 ± 4.63
201717.88 ± 2.71−19.17 ± 1.6132.52 ± 5.398.36 ± 0.72−122.32 ± 11.3553.29 ± 4.21
20189.34 ± 2.01−49.60 ± 6.7535.07 ± 6.327.41 ± 0.75−169.86 ± 13.2556.00 ± 3.60
201916.96 ± 3.55−29.76 ± 3.7137.31 ± 6.597.38 ± 0.82−241.92 ± 22.0348.12 ± 1.74
Table 4. Differences between species in growth and stem water status characteristics dynamics, where cum_inc is average cumulated increment (mm), ∆Wcum is average cumulated stem water deficit (mm), MDScum is average cumulated maximum shrinkage (mm), * significant difference between species at 95% confidence level, ** significant difference between species at 99% confidence level, *** significant difference between species at 99.9% confidence level.
p-values
Cum_Inc∆WcumMDScum
20150.005 **0.000 ***0.002 **
20160.015 *0.000 ***0.002 **
20170.009 **0.000 ***0.016 *
20180.4000.000 ***0.021 *
20190.030 *0.000 ***0.024 *
Table 5. Spearman rank-correlations between daily stem water deficit (∆W) and maximum daily shrinkage (MDS) of two investigated tree species with daily environmental variables (GR—global radiation; ATmean—daily mean air temperature; ATmin—daily minimum air temperature; ATmax—daily maximum air temperature; P—daily precipitation total; P–1—previous day precipitation; RAH—daily mean relative air humidity; VPD—daily mean vapour pressure deficit; SWP—daily mean soil water potential) of the whole period (from 1 April to 30 October). Significance levels: * 95% significance; ** 99% significance; *** 99.9% significance.
GRATmeanATminATmaxPP-1RAHVPDSWP
A. alba∆W−0.04−0.17 ***0.08 *−0.37 ***0.20 ***0.27 ***0.17 ***−0.24 ***0.41 ***
MDS0.40 ***0.48 ***0.42 ***0.44 ***0.12 ***−0.04−0.25 ***0.39 ***−0.24 ***
L. decidua∆W−0.08 **−0.37 ***−0.30 ***−0.38 ***0.15 ***0.28 ***0.14 ***−0.30 ***0.48 ***
MDS0.34 ***0.57 ***0.61 ***0.49 ***0.22 ***0.09 **−0.11 ***0.33 ***−0.09 **
Publisher’s Note: MDPI stays neutral with regard to jurisdictional claims in published maps and institutional affiliations.

