Producing Safe Drinking Water Using an Atmospheric Water Generator (AWG) in an Urban Environment


 ,
, 
Abstract
1. Introduction
1.1. Global Water Scarcity and Alternative Drinking Water Sources
1.2. Atmospheric Water
2. Materials and Methods
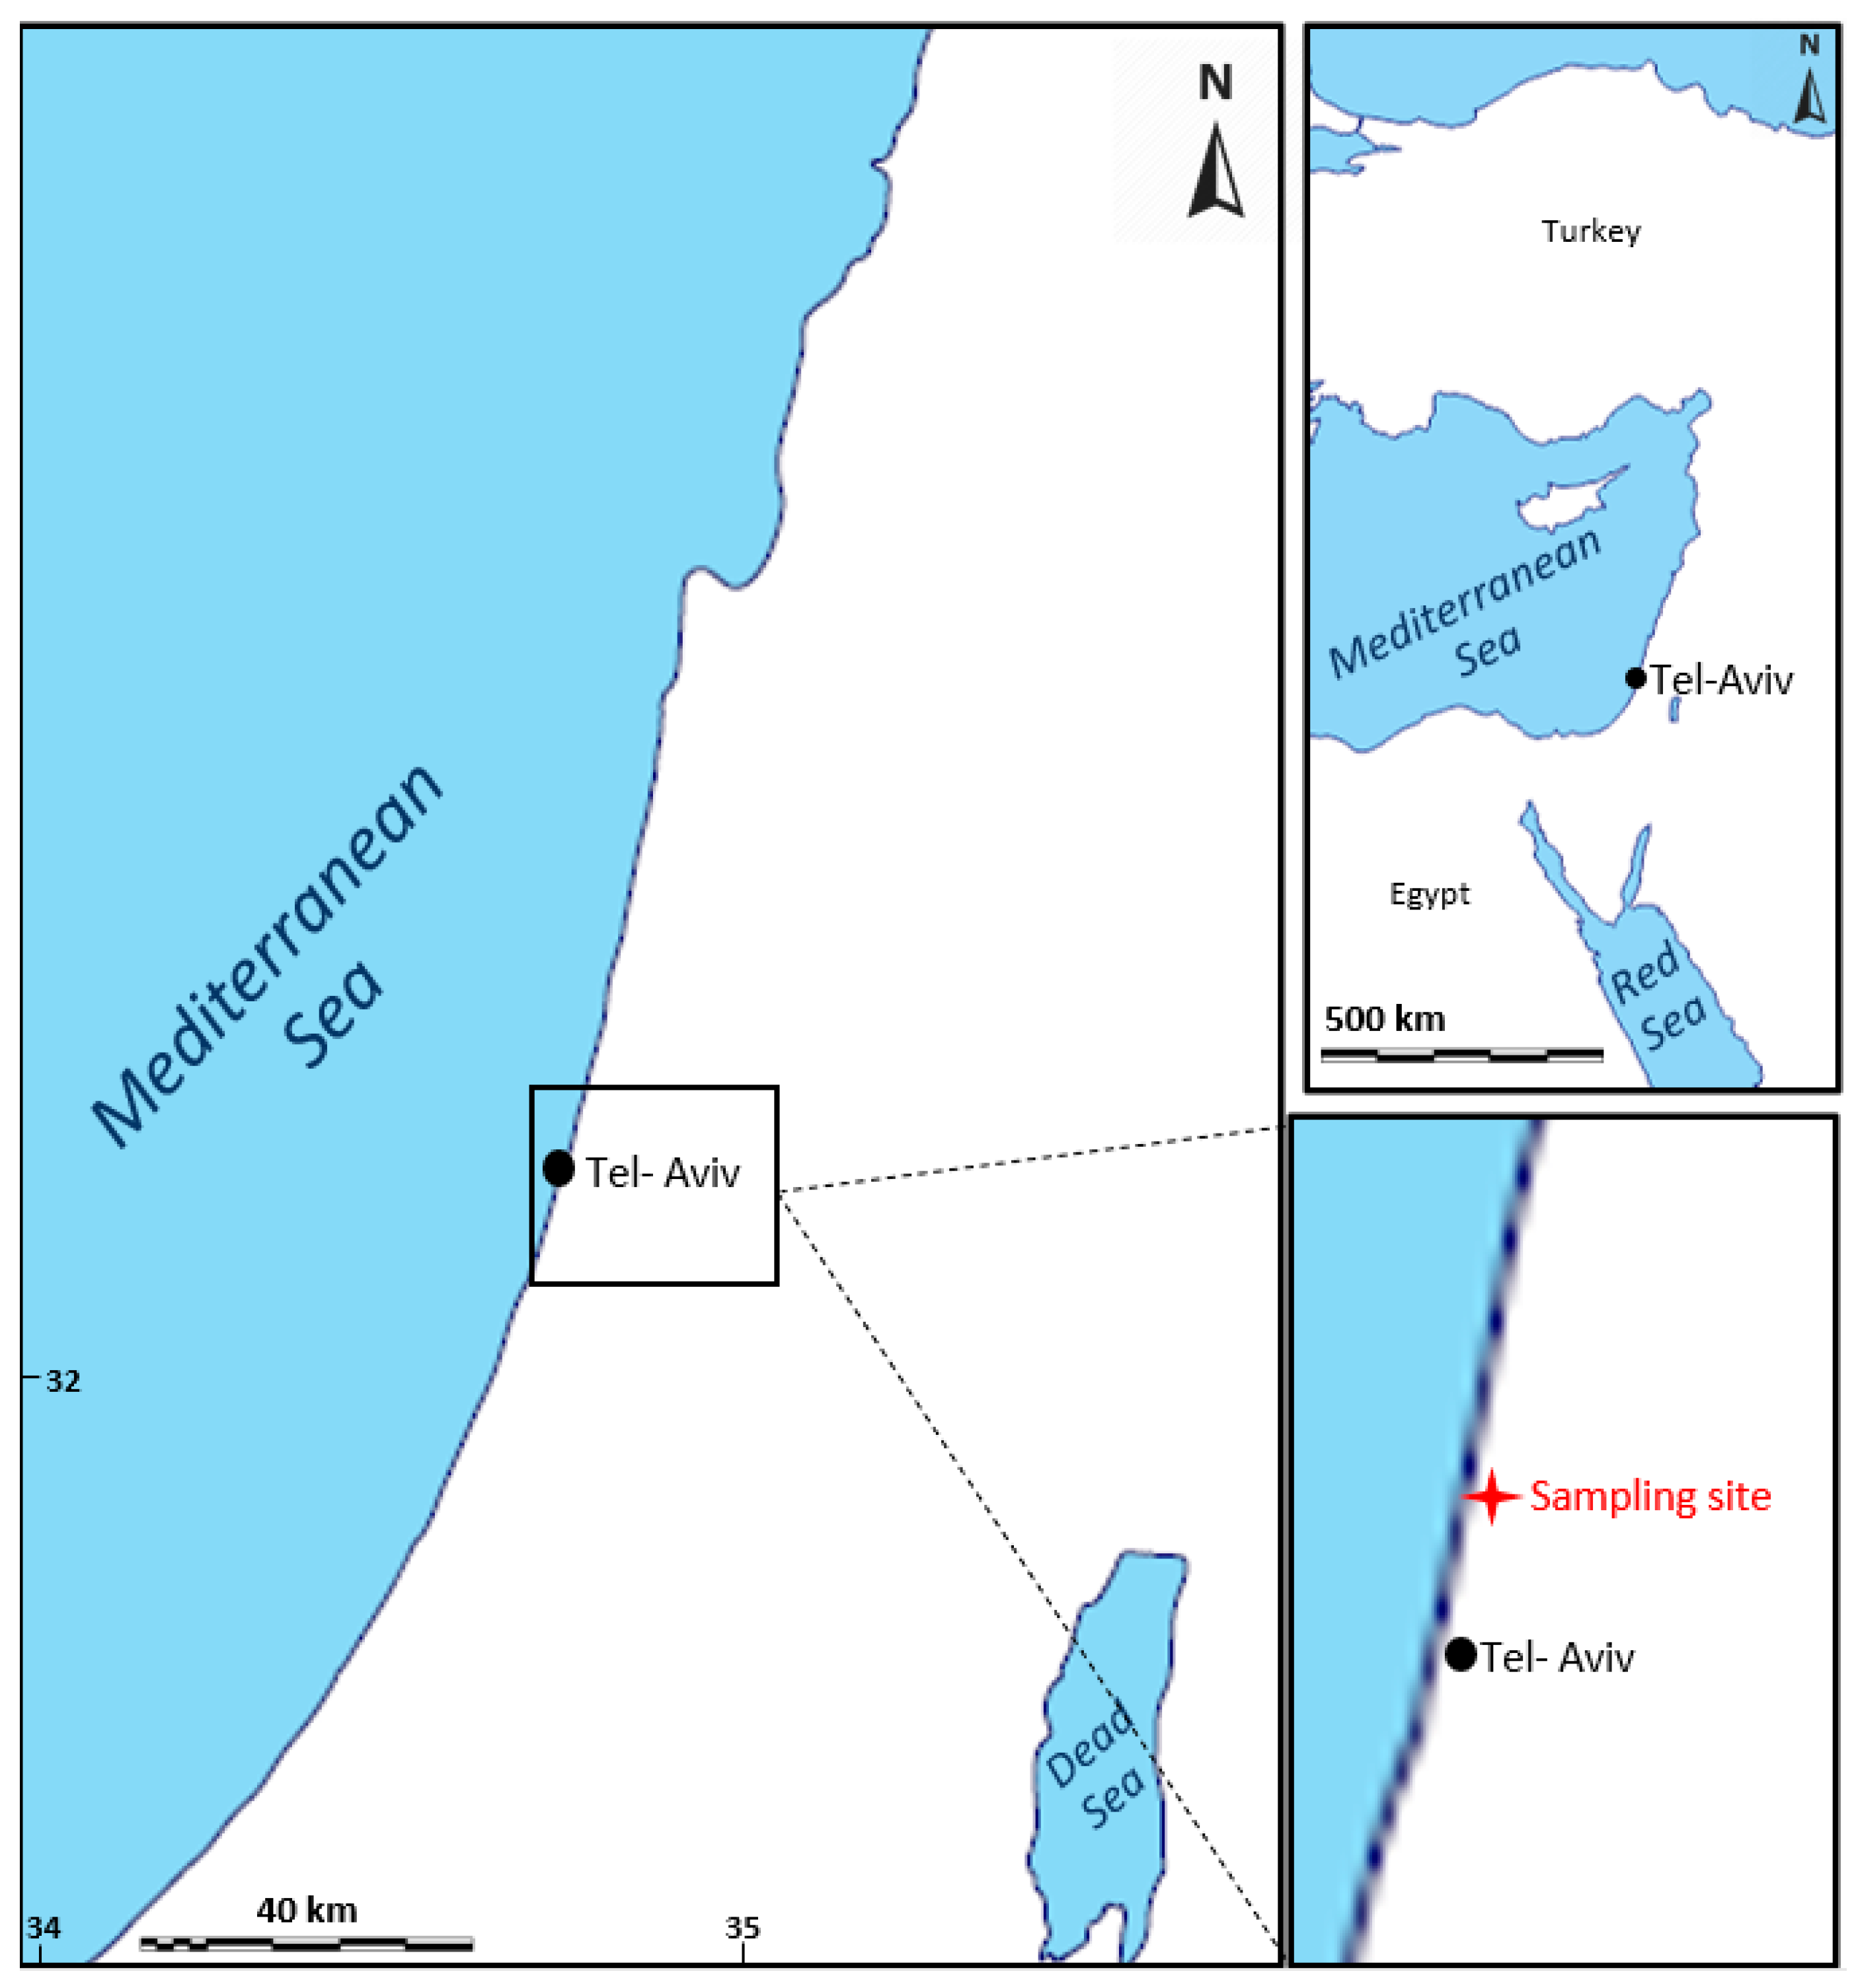
2.1. Study Area
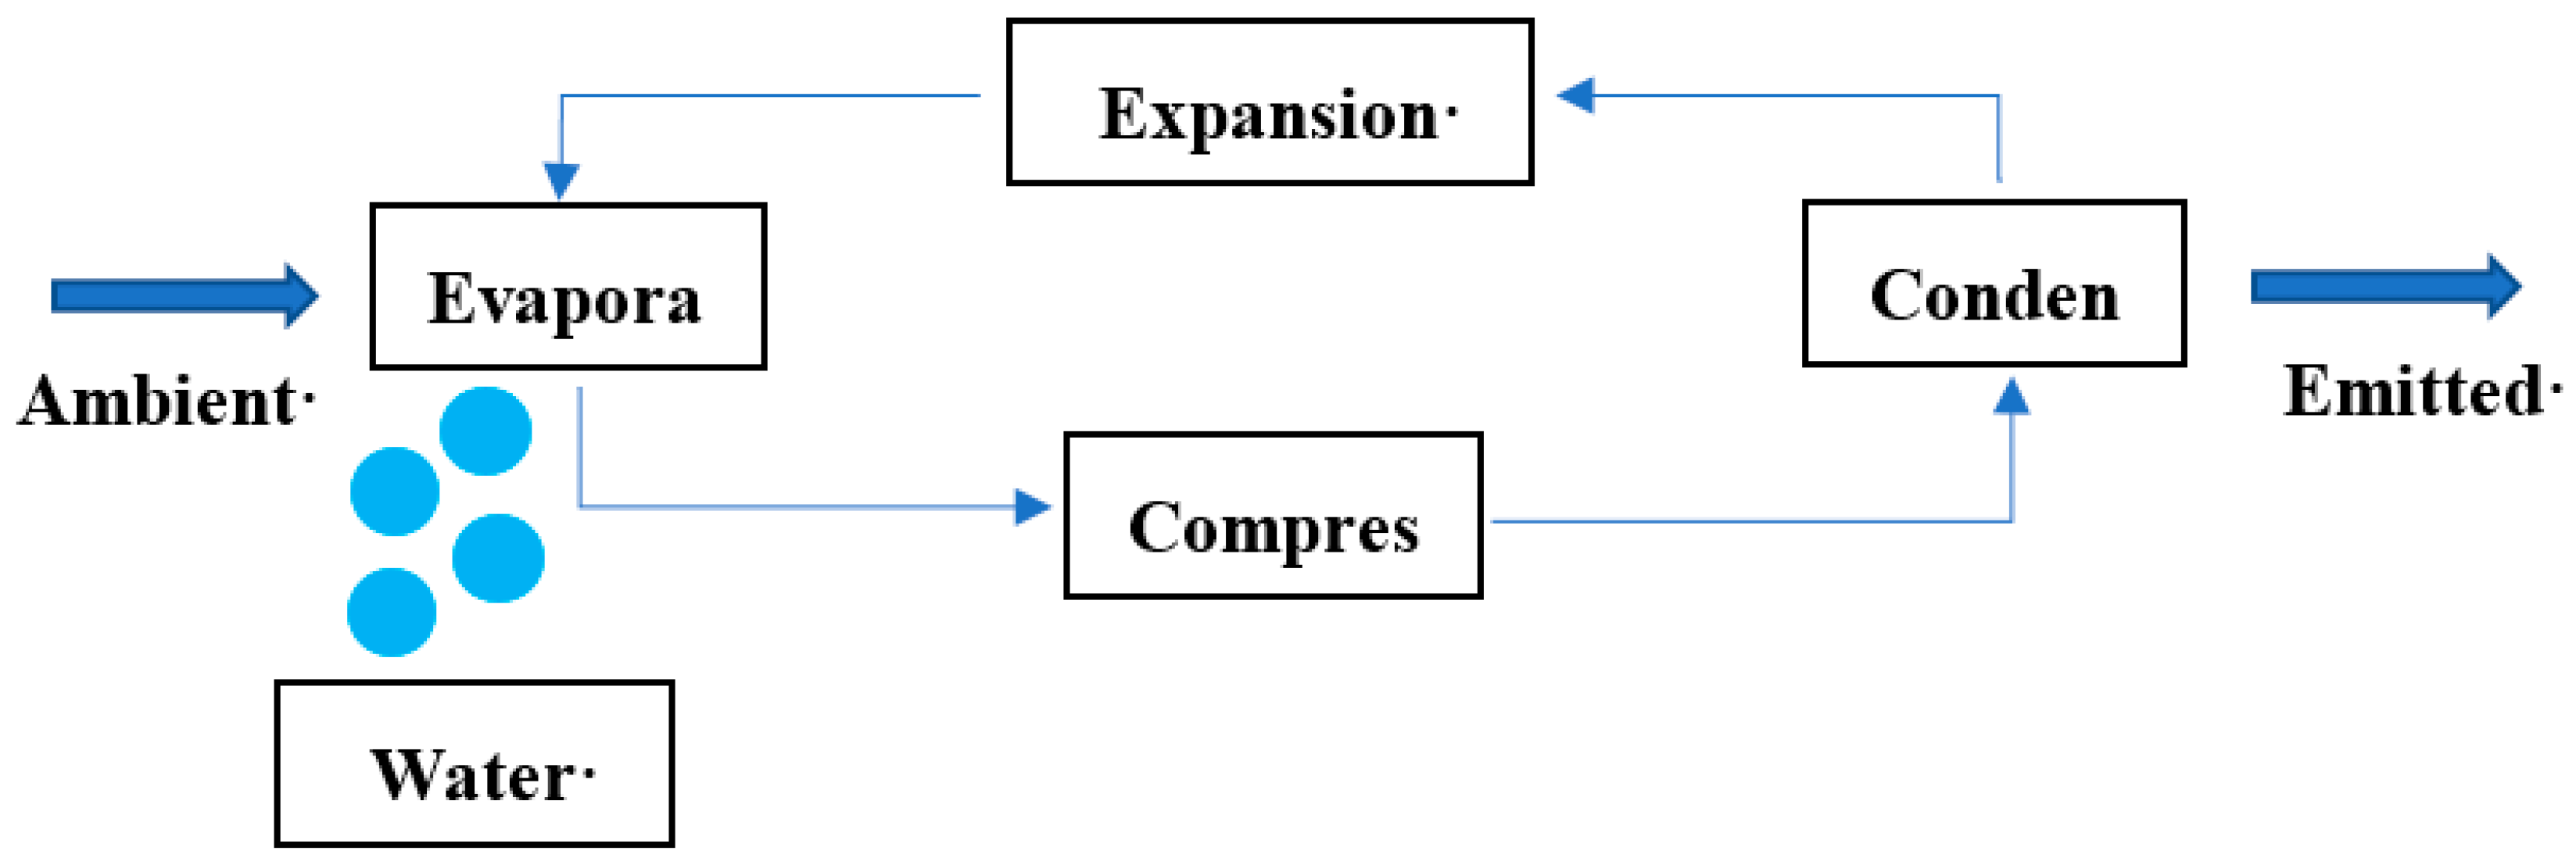
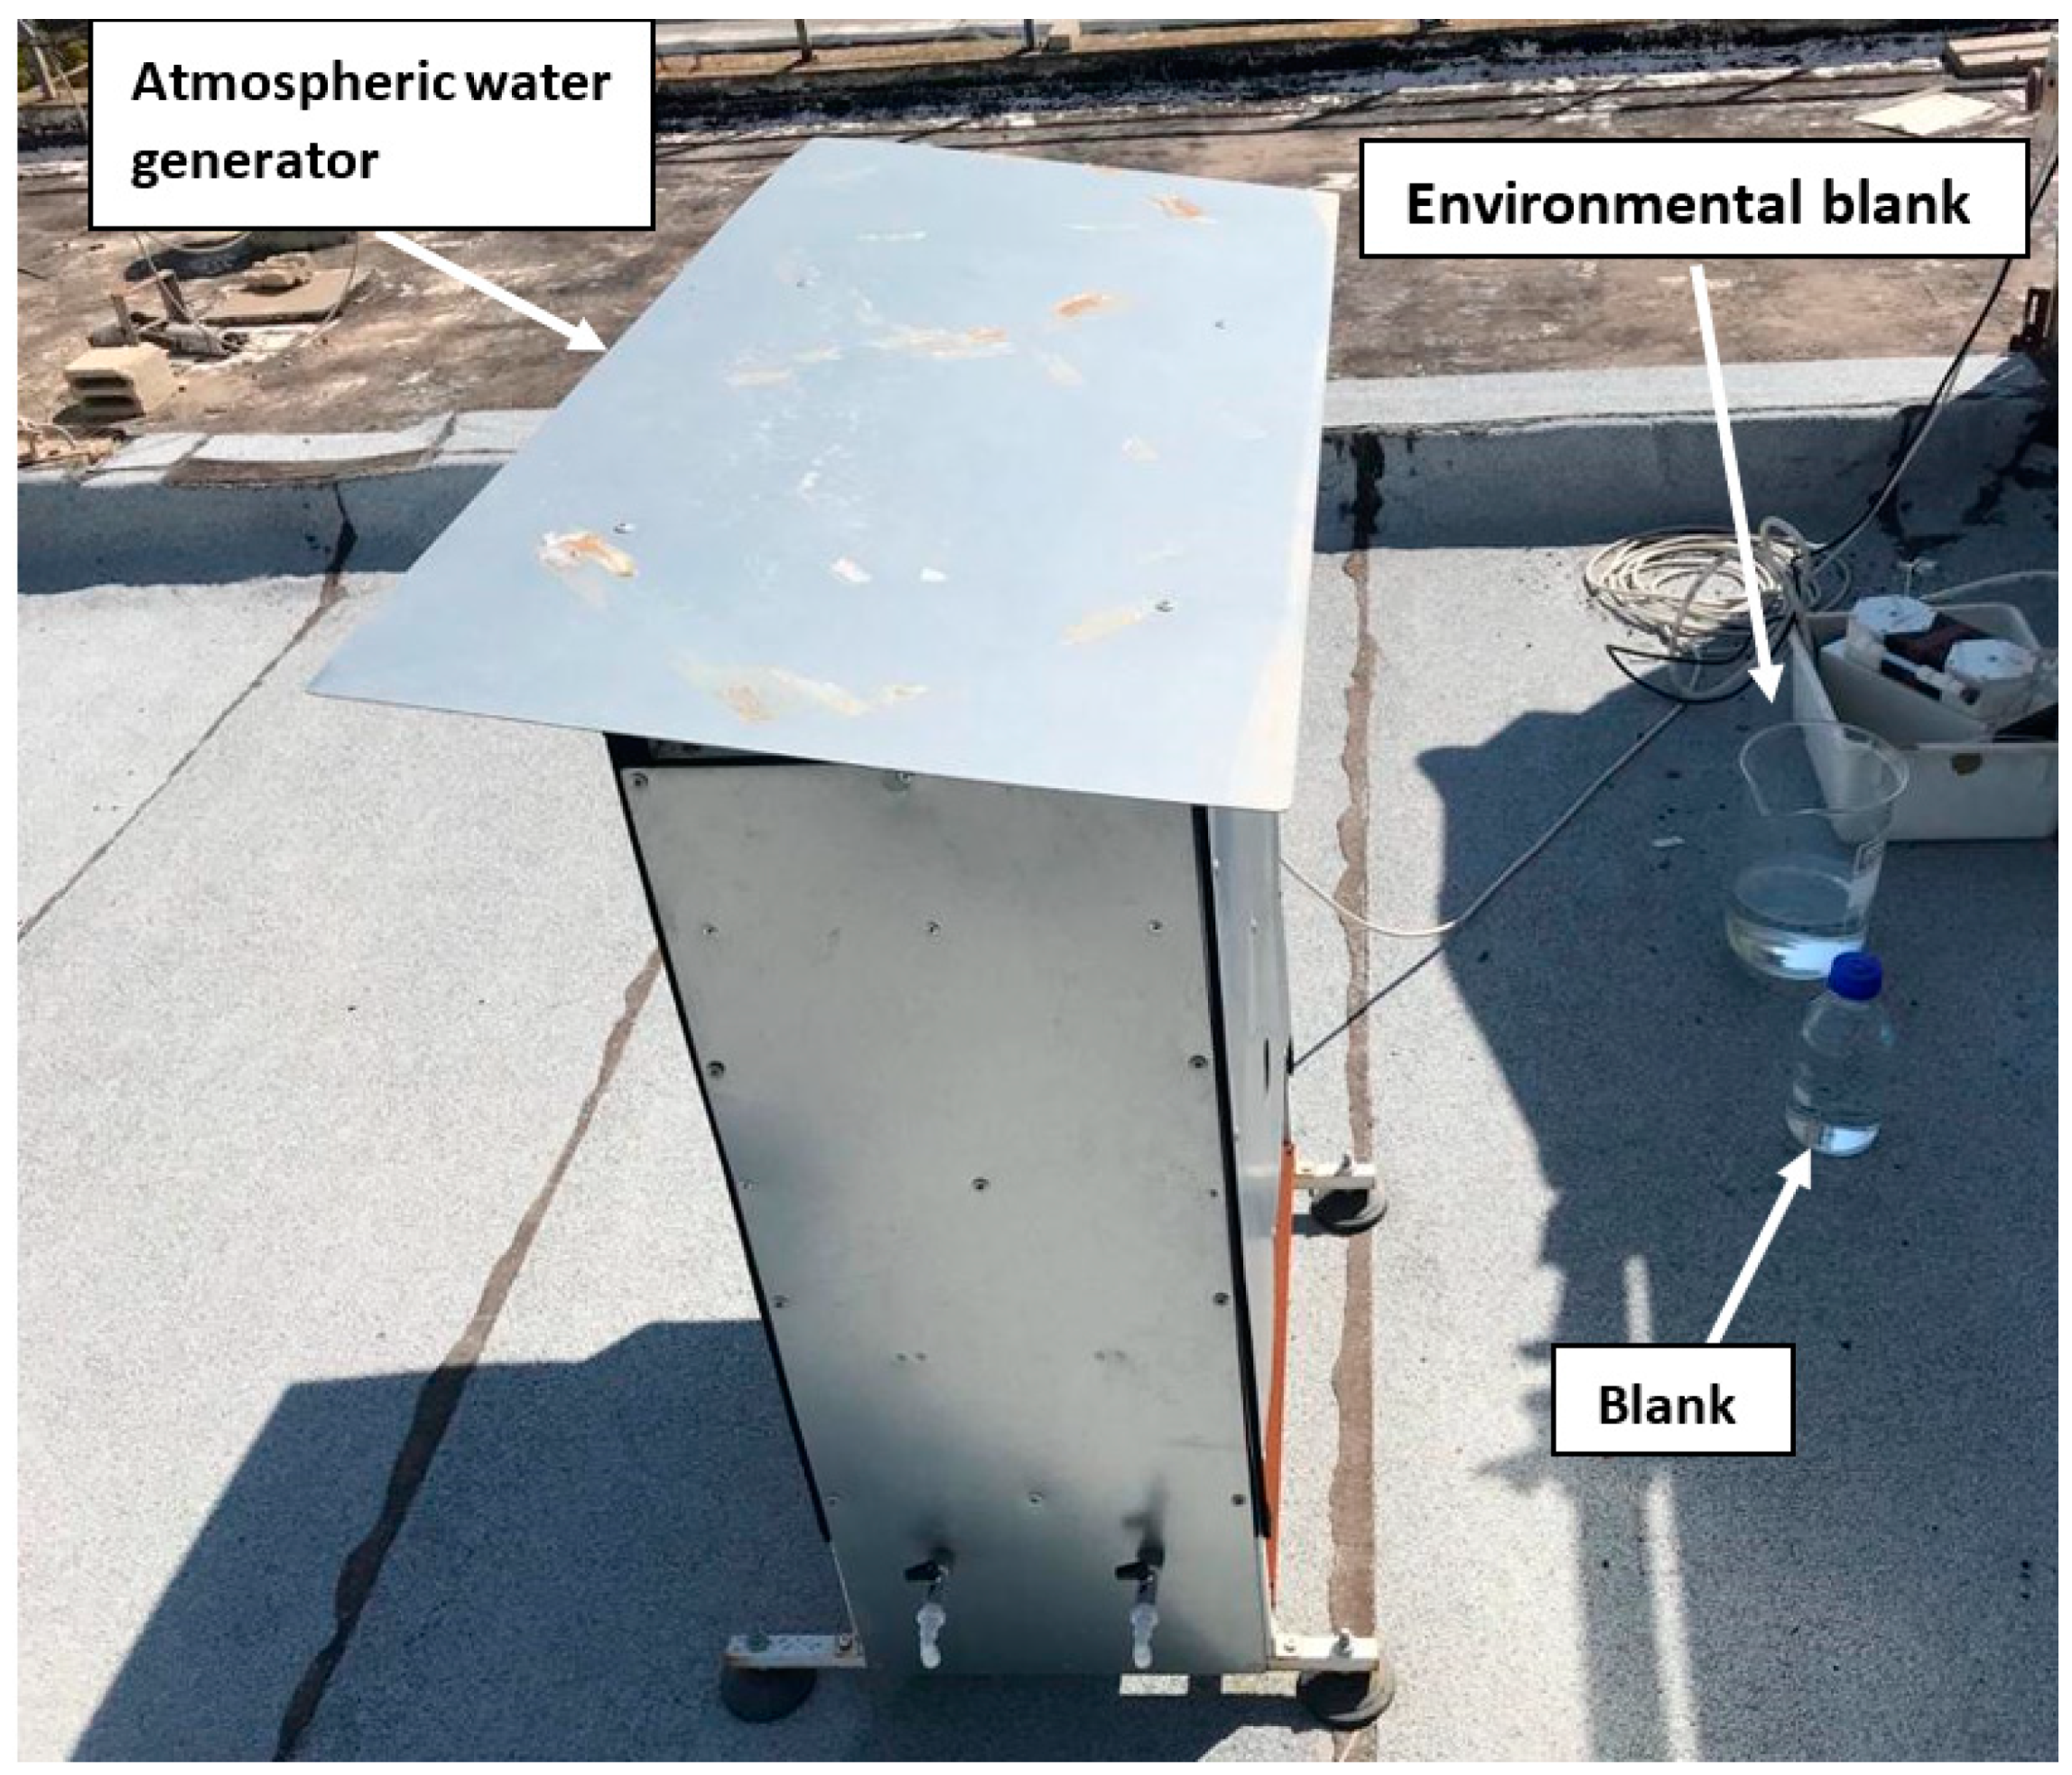
2.2. AWG Apparatus
2.3. Sampling Methods
2.4. Analytical Methods
3. Results and Discussion
3.1. Overall Dew Water Quality Meets Drinking Water Standards
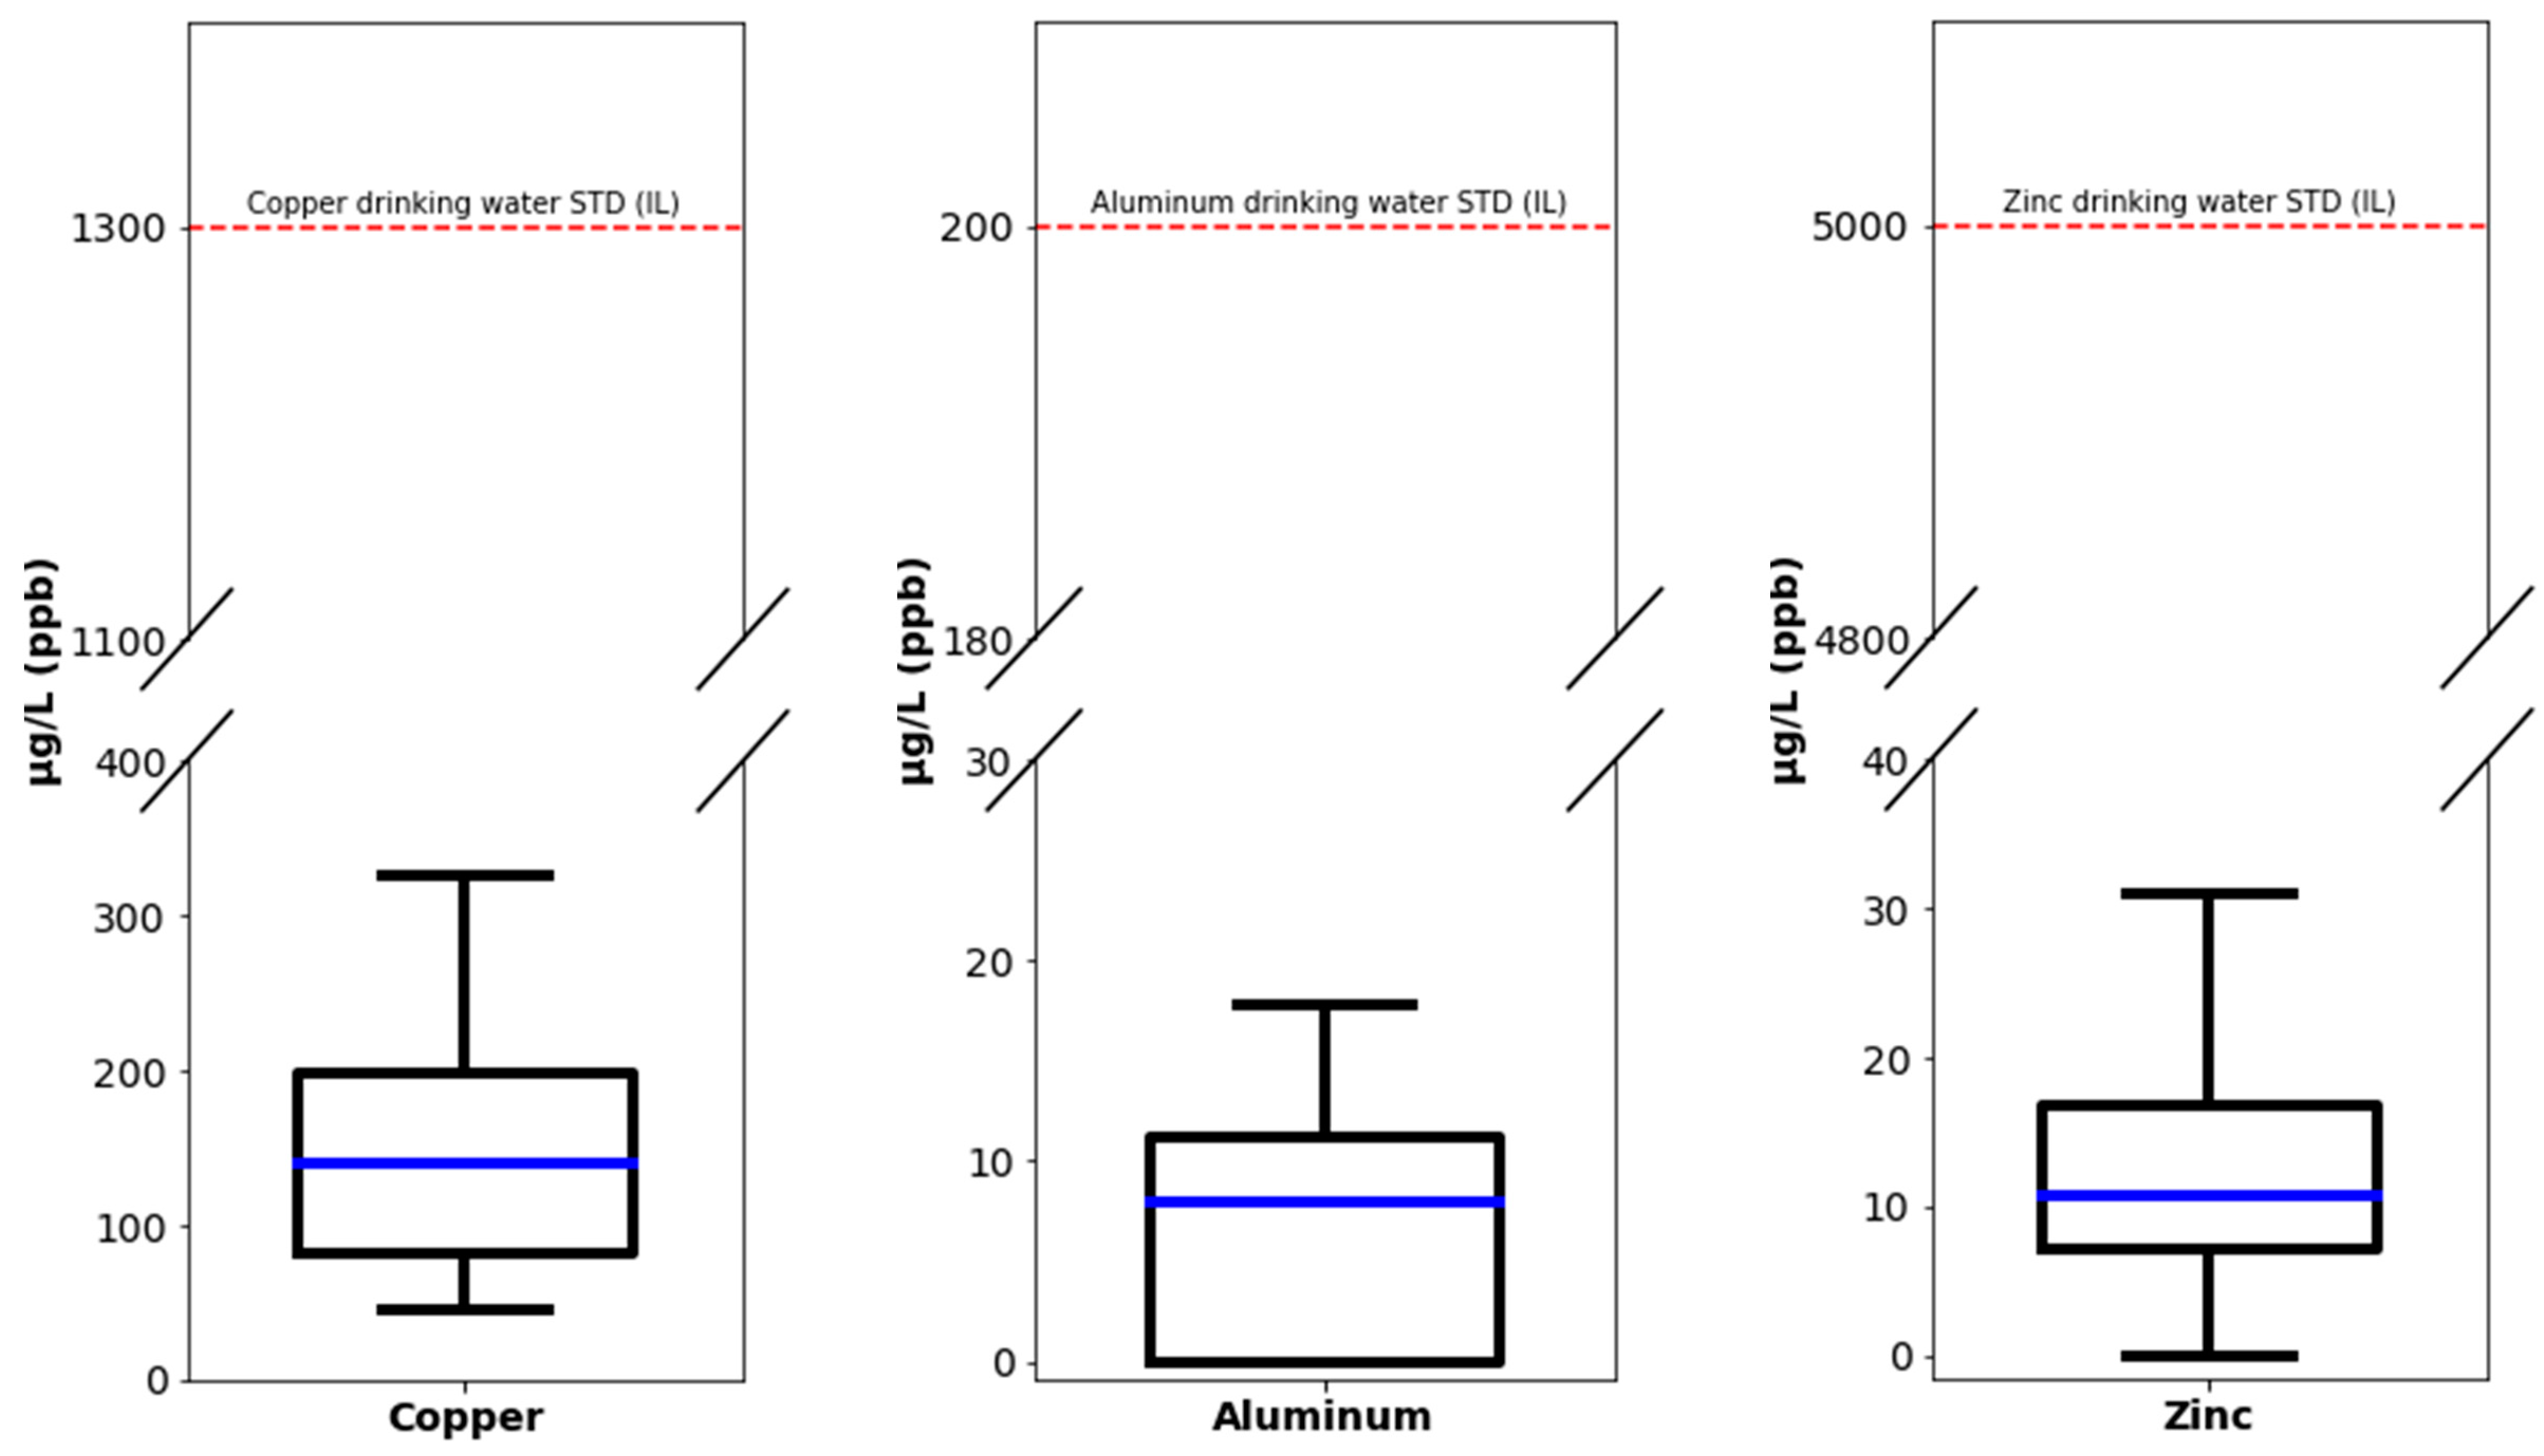
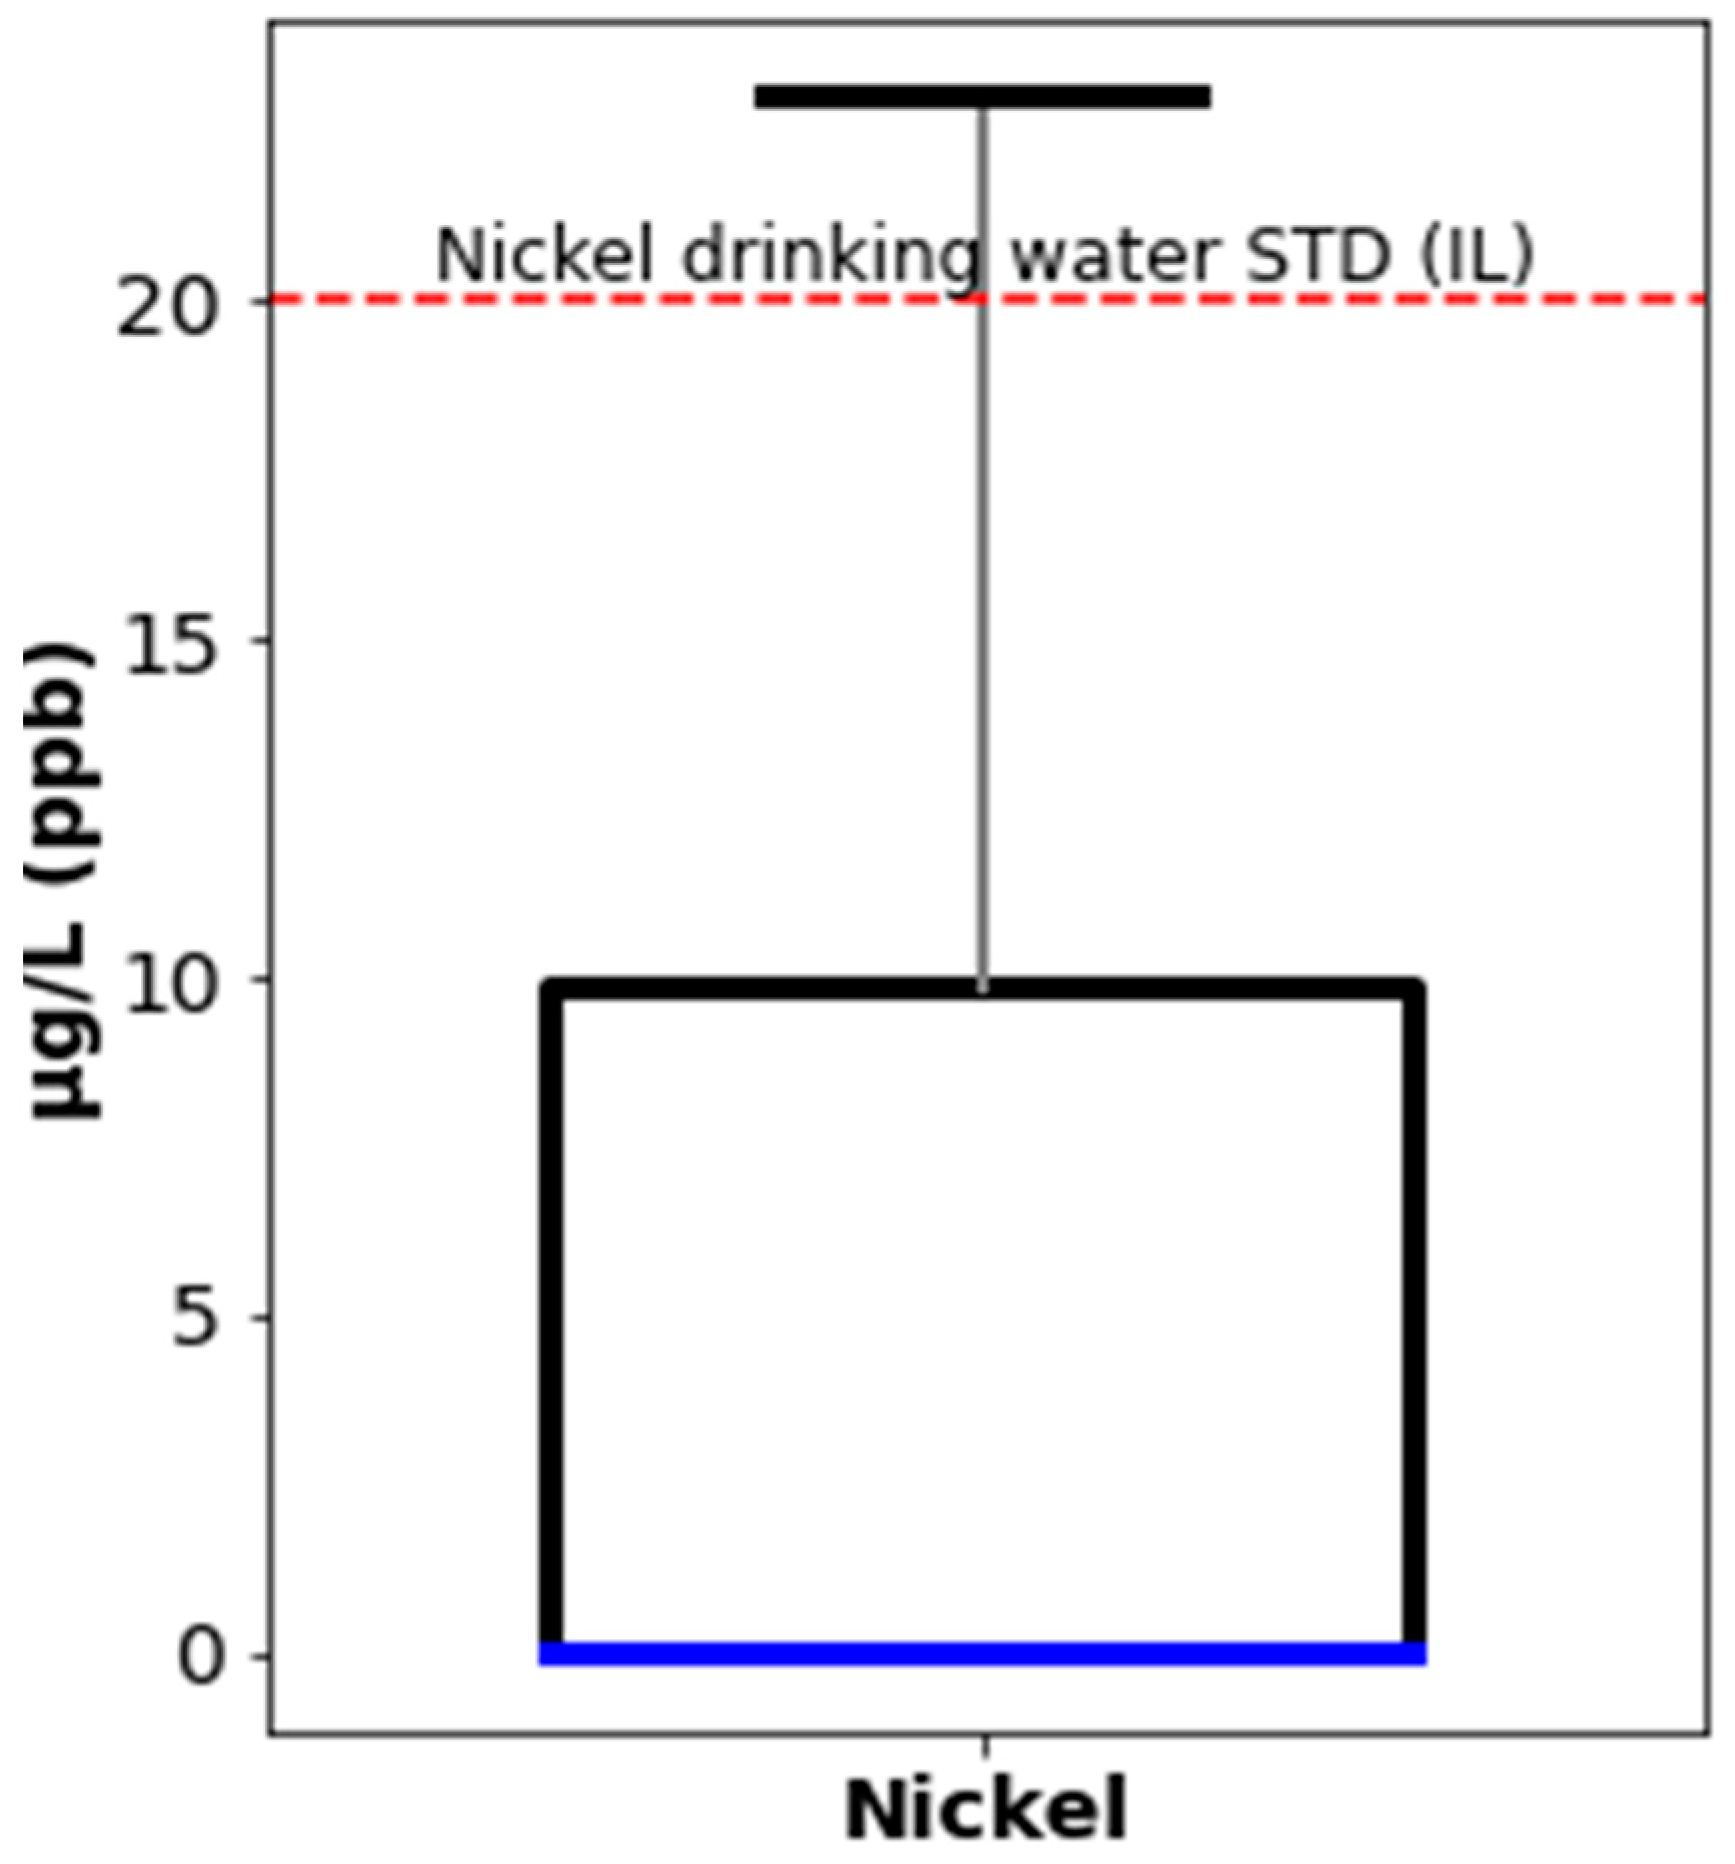
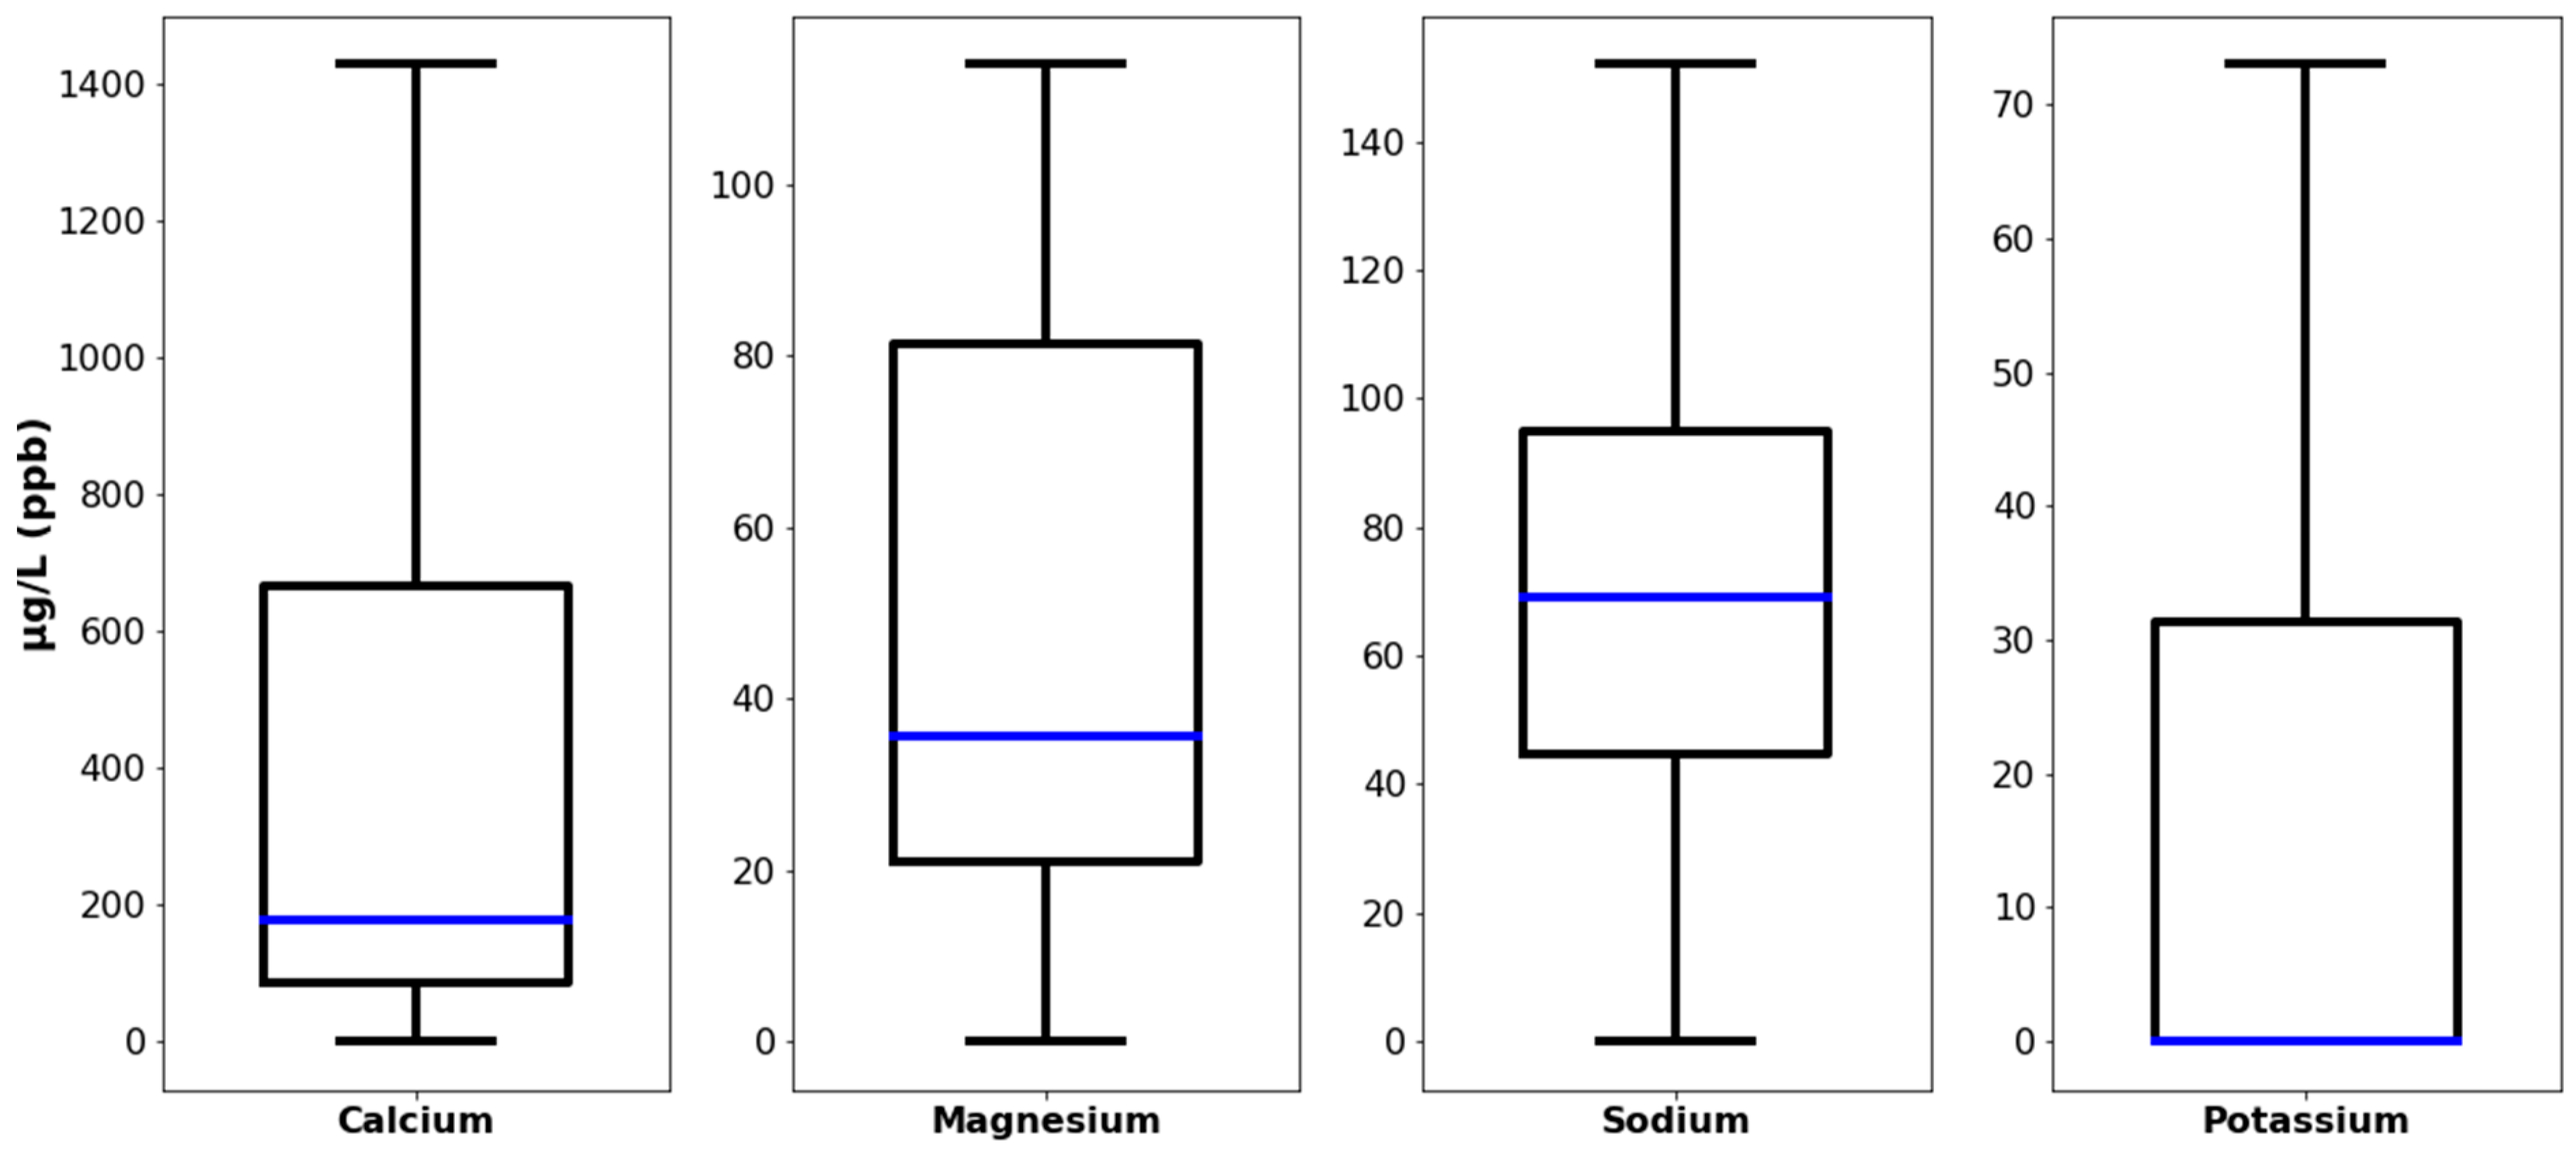
3.1.1. Metals
3.1.2. Inorganic Ions
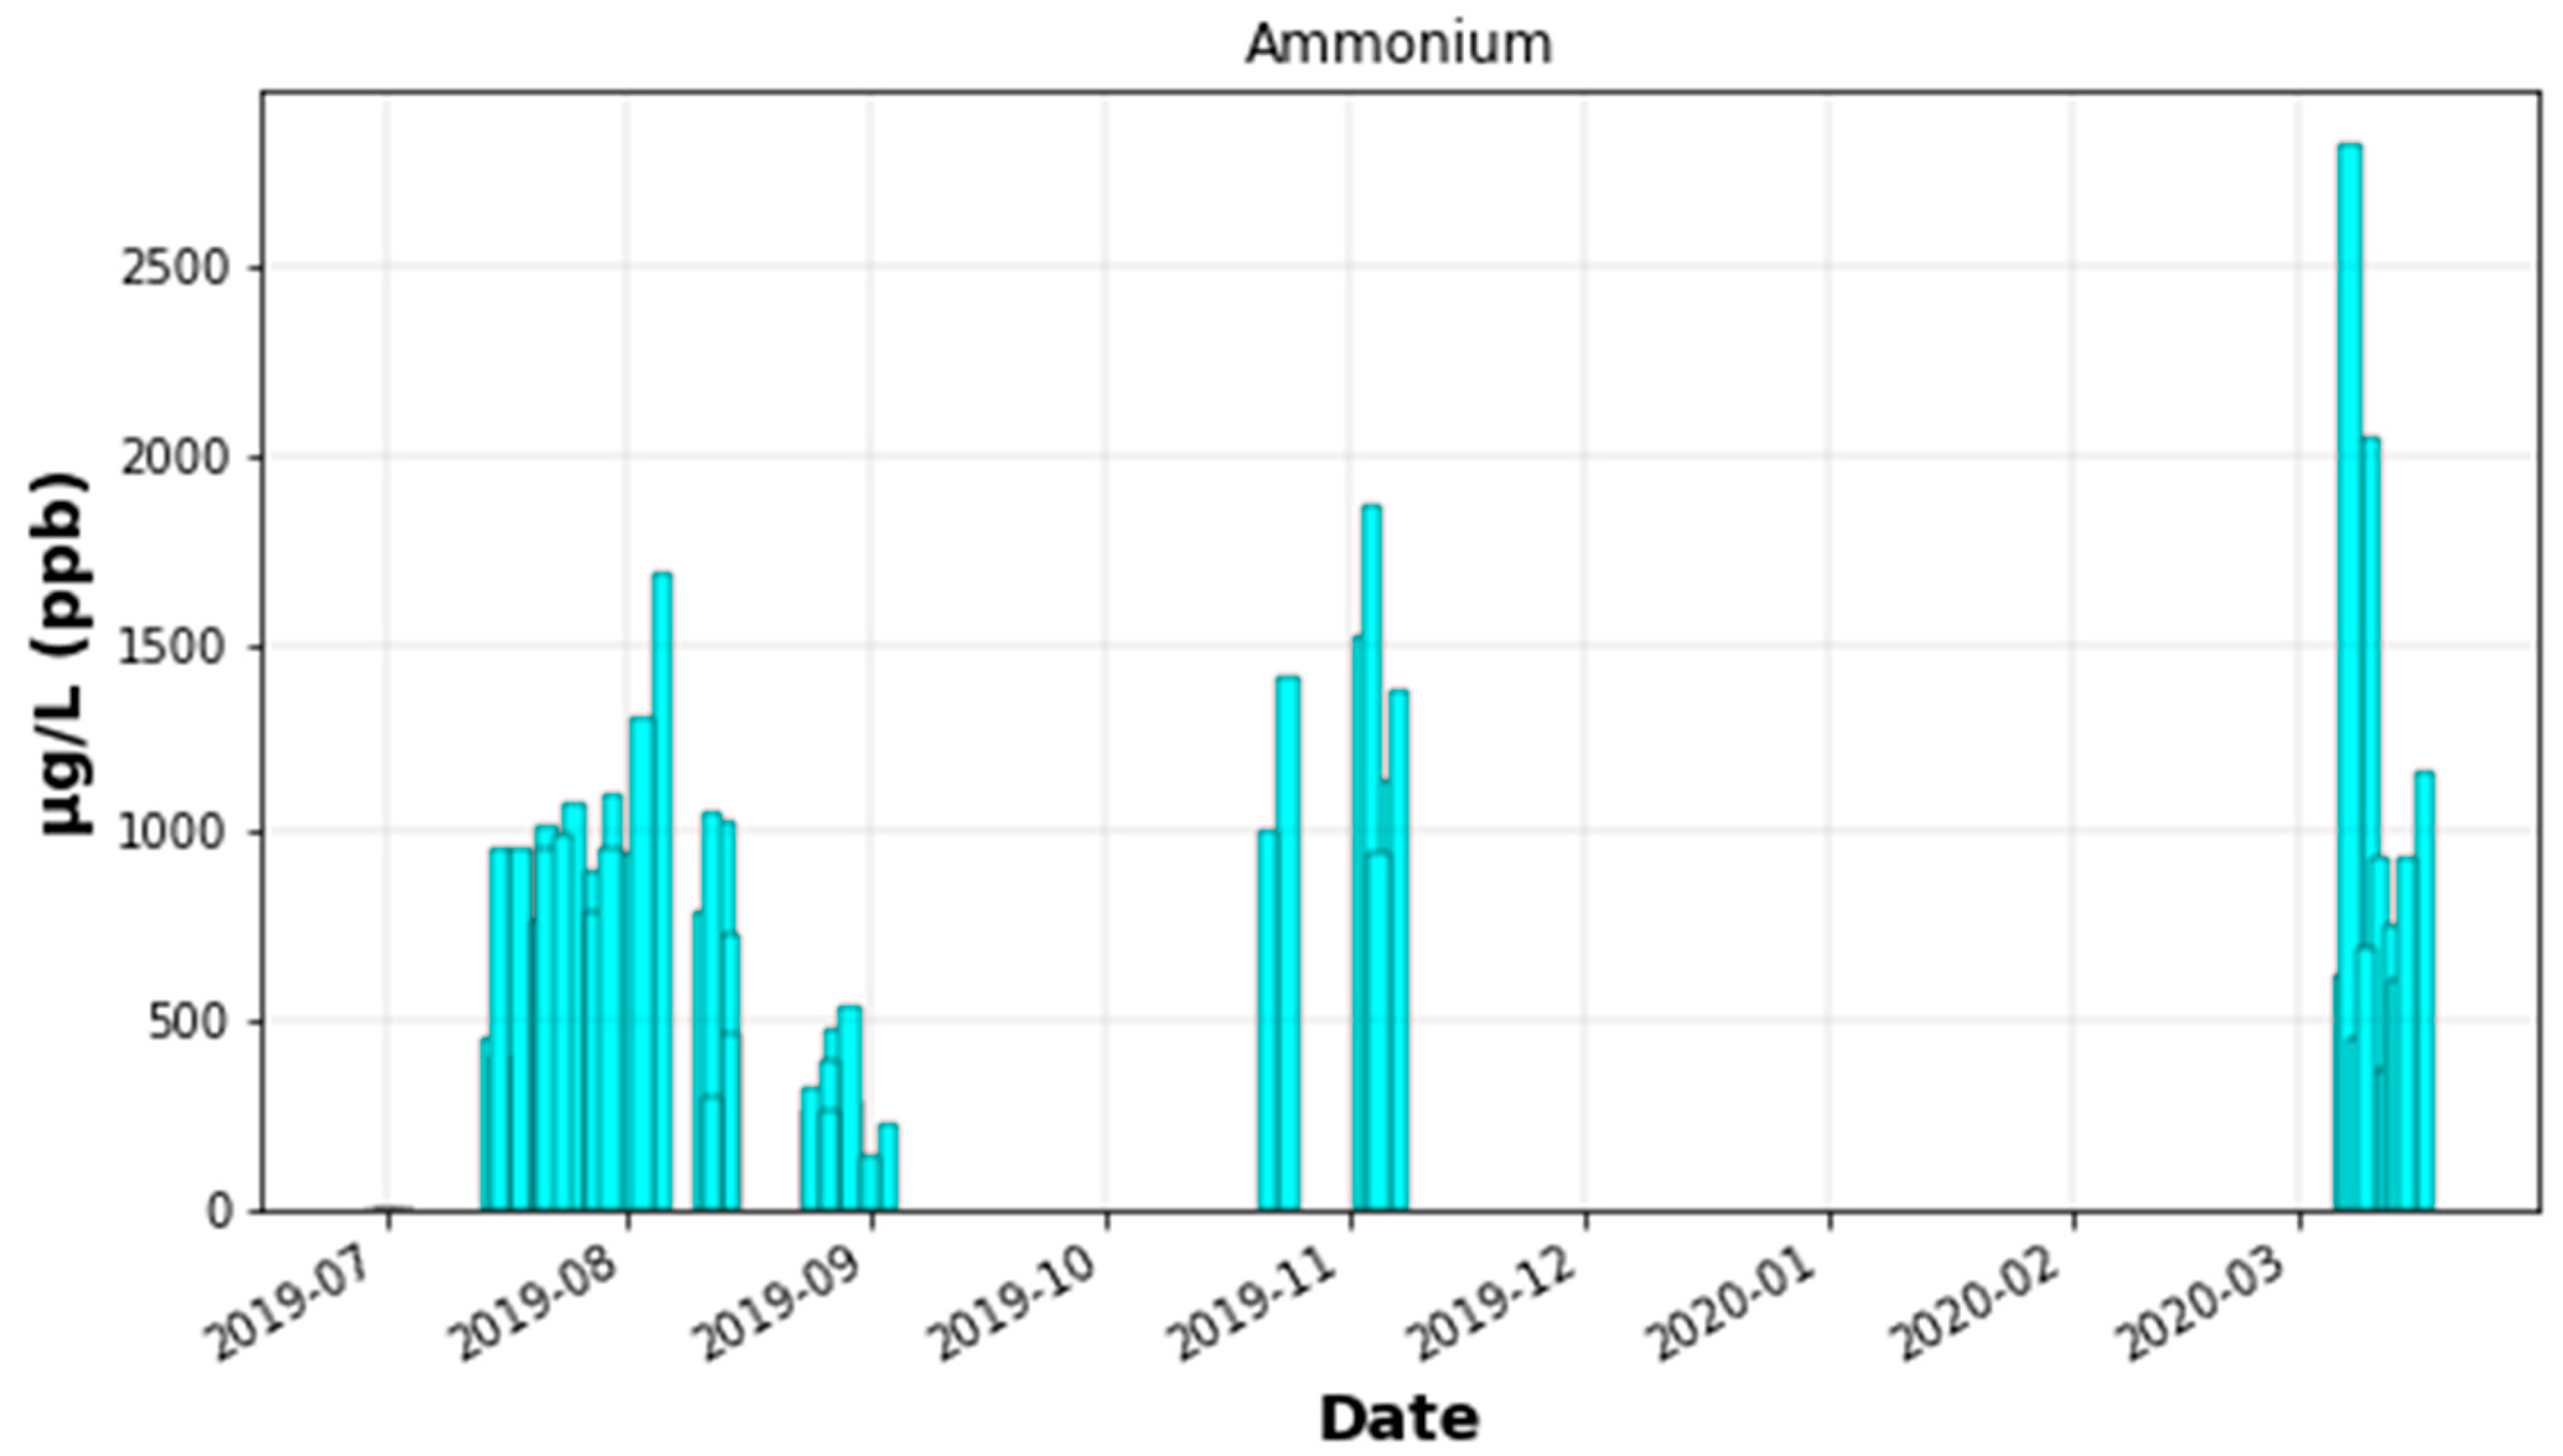
3.1.3. Ammonium
3.1.4. VOCs and SVOCs
3.1.5. pH and Neutralization Factor
3.2. Chemical Composition of Dew Water Produced during the Day and Night
4. Conclusions
Author Contributions
Funding
Acknowledgments
Conflicts of Interest
Appendix A. Analysis of Semi-Volatile Organic Compounds

| Description | CAS # | Retention Time (min) | SIM | Qualifier 1/ Qualifier 2 | LOQ (µg/L) | |
|---|---|---|---|---|---|---|
| 1,2,3-Trimethylbenzene | 526-73-8 | 5.81 | 105 | 120 | 119 | 0.01 |
| Naphthalene | 91-20-3 | 7.59 | 128 | 127 | 126 | 0.01 |
| 2-Methylnaphthalene | 91-57-6 | 8.67 | 142 | 141 | 139 | 0.01 |
| Acenaphthylene | 208-96-8 | 10.09 | 152 | 151 | 150 | 0.01 |
| Fluorene | 86-73-7 | 11.19 | 166 | 165 | 163 | 0.01 |
| Phenanthrene | 85-01-8 | 12.72 | 178 | 177 | 176 | 0.025 |
| Anthracene | 120-12-7 | 12.8 | 178 | 177 | 176 | 0.01 |
| Fluoranthene | 206-44-0 | 14.63 | 202 | 200 | 201 | 0.01 |
| Pyrene | 129-00-0 | 14.98 | 202 | 200 | 201 | 0.01 |
| Benz[a]anthracene | 56-55-3 | 16.91 | 228 | 226 | 227 | 0.01 |
| Chrysene | 218-01-9 | 16.96 | 228 | 226 | 227 | 0.01 |
| Benzo[b]fluoranthene | 205-99-2 | 18.79 | 252 | 250 | 251 | 0.01 |
| Benzo[k]fluoranthene | 207-08-9 | 18.84 | 252 | 250 | 251 | 0.01 |
| Benzo[a]pyrene | 50-32-8 | 19.33 | 252 | 250 | 251 | 0.01 |
| Indeno [1,2,3-cd]pyrene | 193-39-5 | 21.0 | 276 | 274 | 0.025 | |
| Dibenz[a,h]anthracene | 53-70-3 | 21.04 | 278 | 139 | 0.025 | |
| Benzo[g,h,i]perylene | 191-24-2 | 21.38 | 276 | 274 | 0.025 | |
| Description | CAS # | Retention Time (min) | SIM | Qualifier 1/ Qualifier 2 | LOQ (µg/L) | |
|---|---|---|---|---|---|---|
| 2-Chlorobiphenyl (PCB 1) | 2051-60-7 | 10.456 | 188.0 | 190.1 | 152 | 0.01 |
| 4-Chlorobiphenyl (PCB 3) | 2051-62-9 | 11.133 | 188.0 | 190.1 | 152 | 0.01 |
| 2,4′-Dichlorobiphenyl (PCB 8) | 34883-43-7 | 12.055 | 222.1 | 224 | 152 | 0.01 |
| 2,2′,5-Trichlorobiphenyl (PCB 18) | 37680-65-2 | 12.647 | 255.9 | 257.9 | 186 | 0.01 |
| 2,4,4′-Trichlorobiphenyl (PCB 28) | 7012-37-5 | 13.315 | 255.9 | 257.9 | 186 | 0.01 |
| 2,2′,5,5′-Tetrachlorobiphenyl (PCB 52) | 35693-99-3 | 13.768 | 291.9 | 289.9 | 219.9 | 0.01 |
| 2,2′,3,5′-Tetrachlorobiphenyl (PCB 44) | 41464-39-5 | 14.028 | 291.9 | 289.9 | 219.9 | 0.01 |
| 2,3′,4′,5-Tetrachlorobiphenyl (PCB 70) | 32598-11-1 | 14.563 | 291.9 | 289.9 | 219.9 | 0.01 |
| 2,3,3′,4′,6-Pentachlorobiphenyl (PCB 110) | 38380-03-9 | 15.341 | 325.9 | 323.9 | 327.9 | 0.01 |
| 2,2′,3,4′,5′,6-Hexachlorobiphenyl (PCB 149) | 38380-04-0 | 15.633 | 359.9 | 361.8 | 357.8 | 0.01 |
| 2,3′,4,4′,5-Pentachlorobiphenyl (PCB 118) | 31508-00-6 | 15.685 | 325.9 | 323.9 | 327.9 | 0.01 |
| 2,2′,4,4’,5,5’-Hexachlorobiphenyl (PCB 153) | 35065-27-1 | 15.947 | 359.9 | 361.8 | 357.8 | 0.01 |
| 2,2’,3,4,4’,5’-Hexachlorobiphenyl (PCB 138) | 35065-28-2 | 16.28 | 359.9 | 361.8 | 357.8 | 0.01 |
| 2,2’,3,4,4’,5,5’- Heptachlorobiphenyl (PCB 180) | 35065-29-3 | 17.093 | 395.8 | 393.8 | 397.8 | 0.01 |
| Description | CAS # | Retention Time (min) | SIM |
|---|---|---|---|
| Acenaphthene-d10 | 15067-26-2 | 10.31 | 164.2 |
| Phenanthrene-d10 | 1517-22-2 | 12.68 | 188.2 |
| Chrysene-d12 | 1719-03-5 | 16.92 | 240.2 |
Appendix B. Analysis of Volatile Organic Compounds
| Description | CAS # | Retention Time (min) | SIM | Qualifier 1/ Qualifier 2 | LOQ (µg/L) | |
|---|---|---|---|---|---|---|
| 1,2-Dichloroethane | 107-06-2 | 6.80 | 96 | 98 | 61 | 0.2 |
| Methylene chloride (dichloromethane) | 75-09-2 | 7.64 | 84 | 86 | 49 | 0.2 |
| cis-1,2-Dichloroethene | 156-59-2 | 8.03 | 96 | 98 | 61 | 0.2 |
| trans-1,2-Dichloroethene | 156-60-5 | 9.53 | 96 | 98 | 61 | 0.2 |
| Chloroform | 67-66-3 | 10.00 | 83 | 85 | 87 | 0.1 |
| 1,1,1-Trichloroethane | 71-55-6 | 10.25 | 97 | 99 | 117 | 0.2 |
| Carbon tetrachloride | 56-23-5 | 10.47 | 117 | 119 | 121 | 0.2 |
| Benzene | 71-43-2 | 10.77 | 78 | 77 | 52 | 0.2 |
| 1,1-Dichloroethene | 75-35-4 | 10.86 | 62 | 64 | 98 | 0.2 |
| Fluorobenzene (internal standard) | 462-06-6 | 11.18 | 96 | 70 | 0.2 | |
| Trichloroethene | 79-01-6 | 11.69 | 130 | 132 | 95 | 0.2 |
| 1,2-Dichloropropane | 78-87-5 | 12.14 | 63 | 62 | 0.2 | |
| Bromodichloromethane | 75-27-4 | 12.50 | 83 | 85 | 129 | 0.1 |
| Toluene | 108-88-3 | 13.68 | 91 | 92 | 0.2 | |
| 1,1,2-Trichloroethane | 79-00-5 | 14.33 | 97 | 99 | 83 | 0.2 |
| Tetrachloroethene | 127-18-4 | 14.52 | 166 | 164 | 168 | 0.2 |
| Dibromochloromethane | 124-48-1 | 14.99 | 129 | 127 | 131 | 0.2 |
| Chlorobenzene | 108-90-7 | 16.04 | 112 | 114 | 77 | 0.1 |
| Ethylbenzene | 100-41-4 | 16.16 | 106 | 91 | 0.1 | |
| m-Xylene | 108-38-3 | 16.37 | 91 | 106 | 105 | 0.2 |
| p-Xylene | 106-42-3 | 16.37 | 91 | 106 | 105 | 0.2 |
| o-Xylene | 95-47-6 | 17.07 | 91 | 106 | 105 | 0.2 |
| Styrene | 100-42-5 | 17.10 | 104 | 105 | 78 | 0.1 |
| Bromoform | 75-25-2 | 17.46 | 173 | 171 | 175 | 0.2 |
| 1,4-Dichlorobenzene | 106-46-7 | 20.23 | 146 | 148 | 111 | 0.1 |
| 1,2-Dichlorobenzene | 95-50-1 | 20.91 | 146 | 148 | 111 | 0.1 |
| 1,2,4-Trichlorobenzene | 120-82-1 | 23.92 | 180 | 182 | 184 | 0.1 |
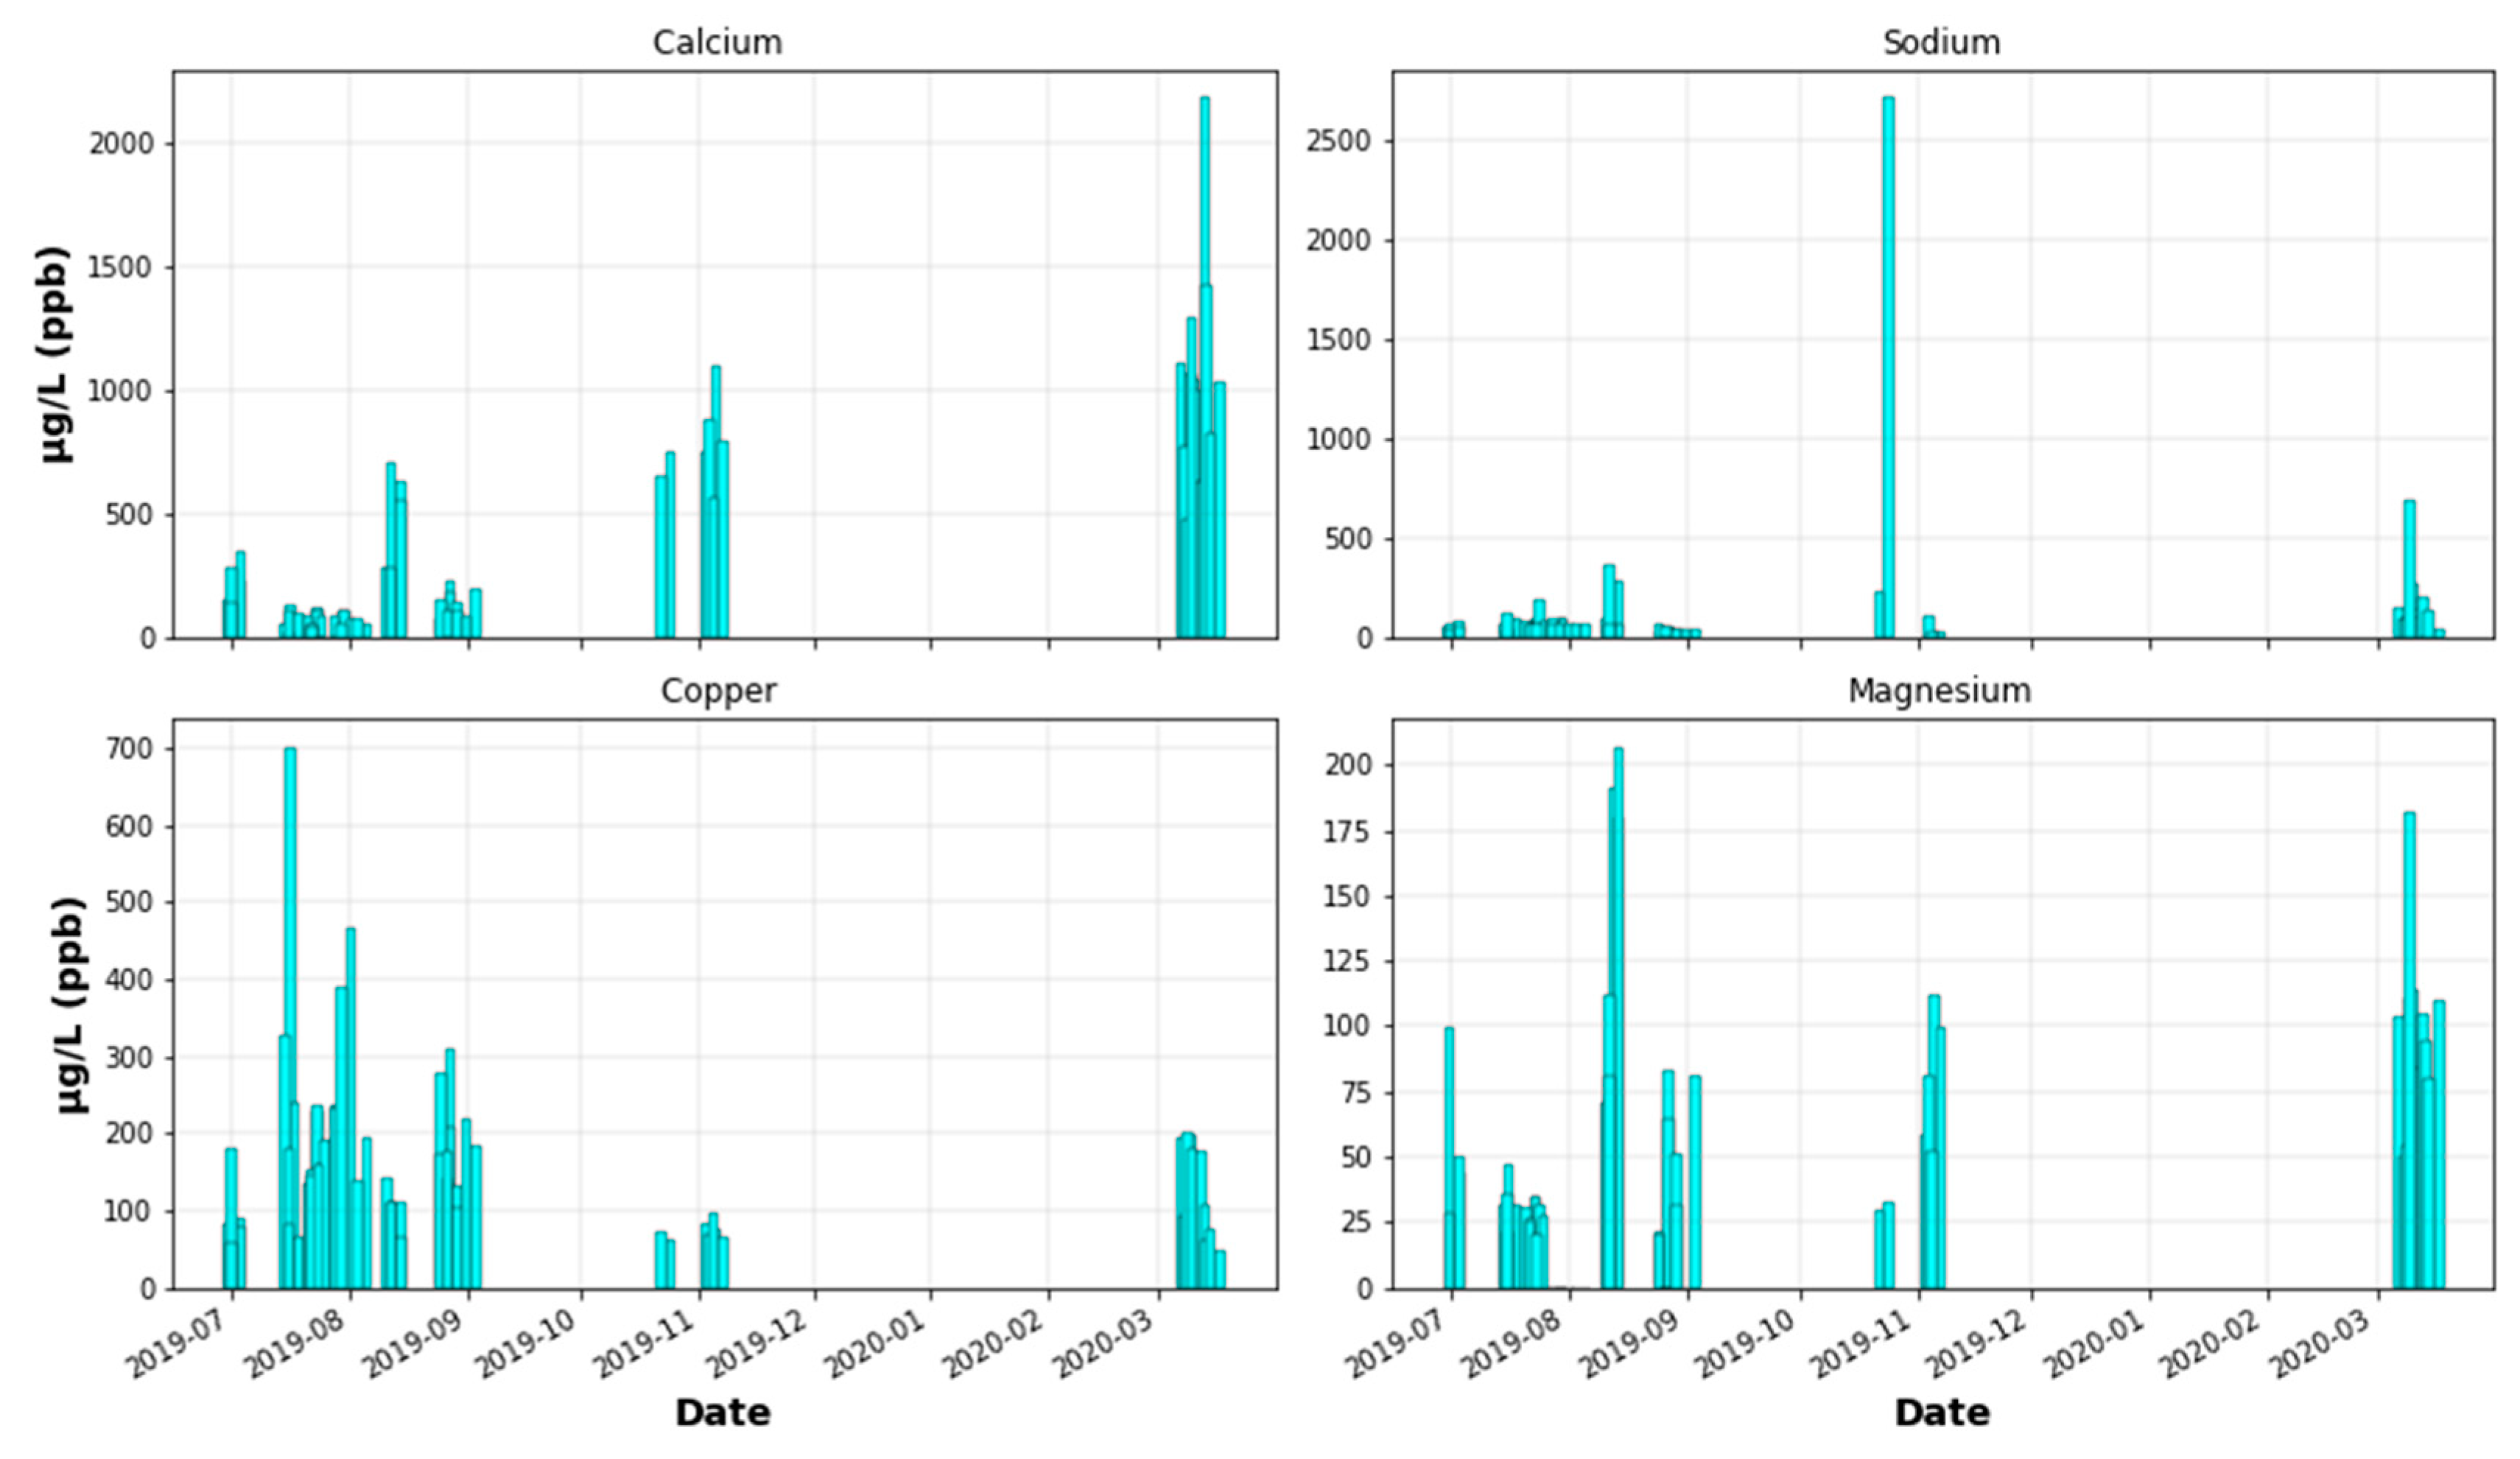
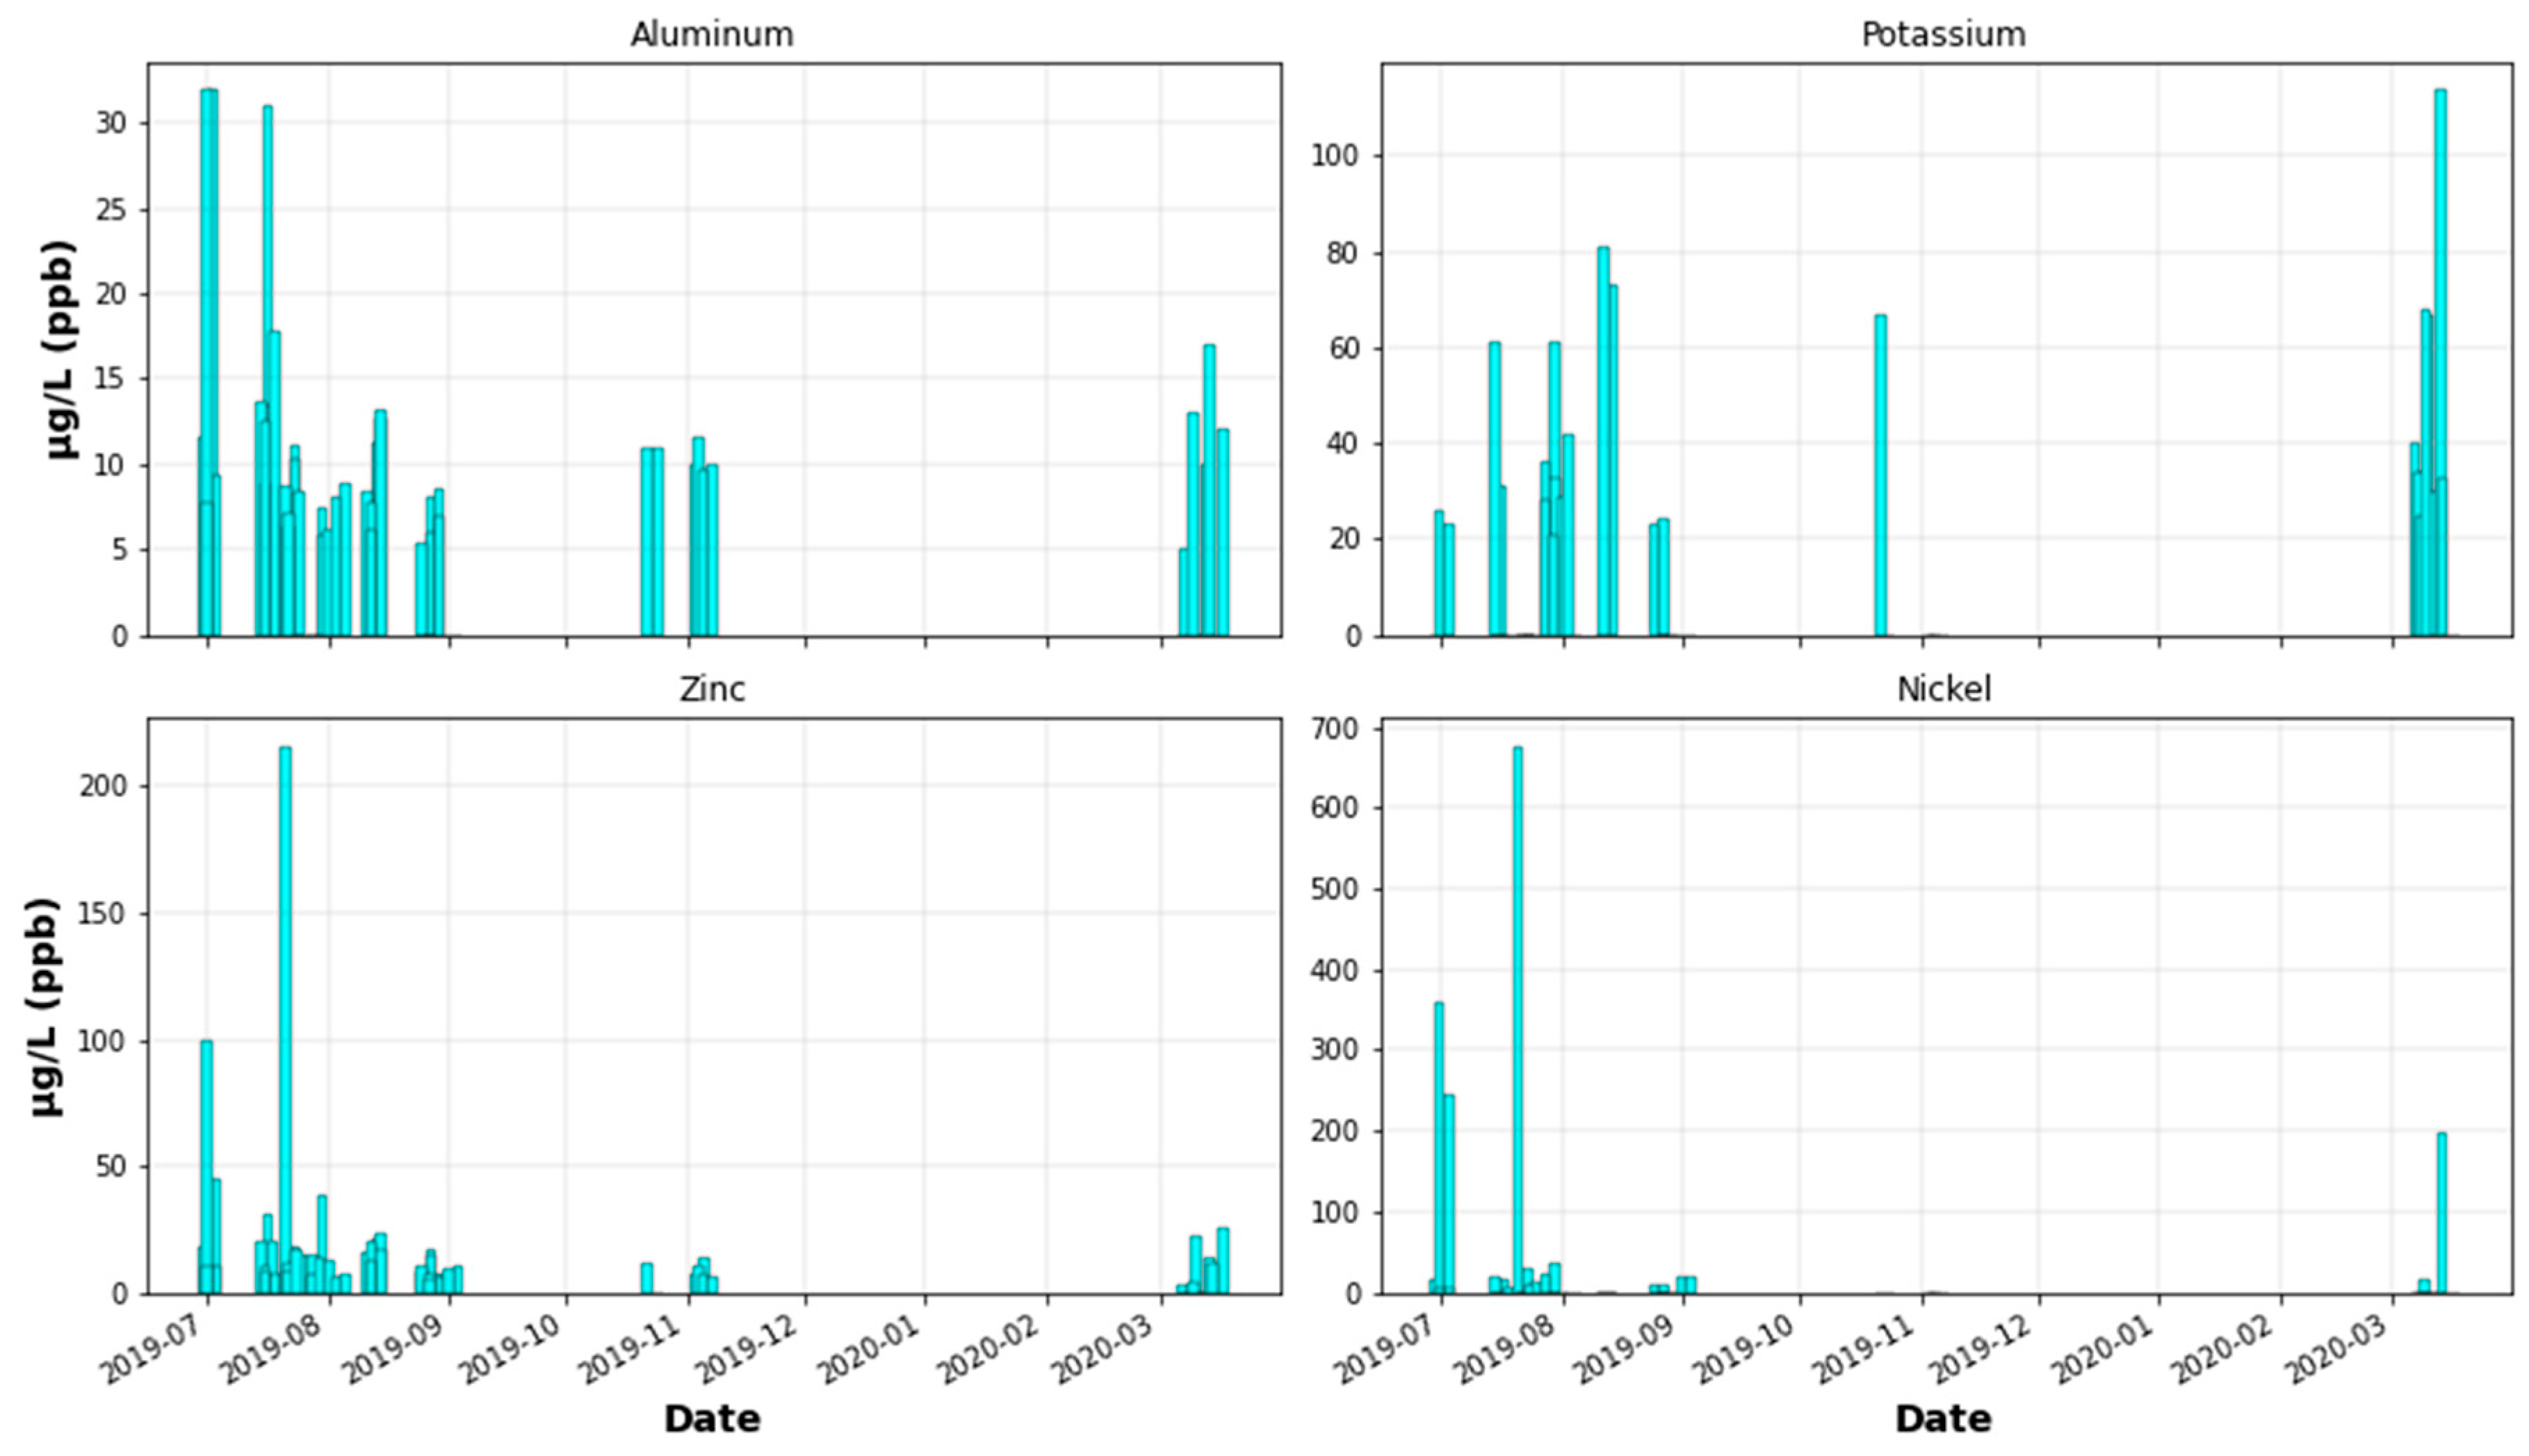
Appendix C. Elements in Dew Water over Time
Appendix C.1. Metals

Appendix C.2. Ions

Appendix C.3. Ammonium

References
- Mekonnen, M.M.; Hoekstra, A.Y. Four billion people facing severe water scarcity. Sci. Adv. 2016, 2, e1500323. [Google Scholar] [CrossRef] [PubMed]
- World Economic Forum. The Global Risks Report; World Economic Forum: Geneva, Switzerland, 2019. [Google Scholar]
- UNESCO. Leaving No One Behind; UNSECO: Paris, France, 2019. [Google Scholar]
- Semiat, R. Energy issues in desalination processes. Environ. Sci. Technol. 2008, 42, 8193–8201. [Google Scholar] [CrossRef] [PubMed]
- Li, R.; Shi, Y.; Alsaedi, M.; Wu, M.; Shi, L.; Wang, P. Hybrid Hydrogel with High Water Vapor Harvesting Capacity for Deployable Solar-Driven Atmospheric Water Generator. Environ. Sci. Technol. 2018, 52, 11367–11377. [Google Scholar] [CrossRef] [PubMed]
- Tomaszkiewicz, M.; Abou Najm, M.; Beysens, D.; Alameddine, I.; El-Fadel, M. Dew as a sustainable non-conventional water resource: A critical review. Environ. Rev. 2015, 23, 425–442. [Google Scholar] [CrossRef]
- Khalil, B.; Adamowski, J.; Shabbir, A.; Jang, C.; Rojas, M.; Reilly, K.; Ozga-Zielinski, B. A review: Dew water collection from radiative passive collectors to recent developments of active collectors. Sustain. Water Resour. Manag. 2016, 2, 71–86. [Google Scholar] [CrossRef]
- Dong, M.; Zhang, Z.; Shi, Y.; Zhao, X.; Fan, S.; Chen, Z. Fundamental Limits of the Dew-Harvesting Technology. Nanoscale Microscale Thermophys. Eng. 2020, 24, 43–52. [Google Scholar] [CrossRef]
- Tripathi, A.; Tushar, S.; Pal, S.; Lodh, S.; Tiwari, S.; Desai, R.S. Atmospheric Water Generator. Int. J. Enhanced Res. Sci. 2016, 5, 69–72. [Google Scholar]
- Peters, G.M.; Blackburn, N.J.; Armedion, M. Environmental assessment of air to water machines—Triangulation to manage scope uncertainty. Int. J. Life Cycle Assess. 2013, 18, 1149–1157. [Google Scholar] [CrossRef]
- GEN-L—Watergen. Available online: https://www.watergen.com/product/gen-l/ (accessed on 7 June 2020).
- EcoloBlue. Available online: http://www.ecoloblueblog.com/ (accessed on 27 May 2020).
- Skywater. Available online: https://www.skywater.com/ (accessed on 4 June 2020).
- Watergen. Available online: https://www.watergen.com/ (accessed on 7 June 2020).
- Gido, B.; Friedler, E.; Broday, D.M. Liquid-Desiccant Vapor Separation Reduces the Energy Requirements of Atmospheric Moisture Harvesting. Environ. Sci. Technol. 2016. [Google Scholar] [CrossRef]
- Beysens, D. Dew Water; River Publishers: Gistrup, Denmark, 2018; ISBN 9788793609471. [Google Scholar]
- Singh, S.P.; Khare, P.; Kumari, K.M.; Srivastava, S.S. Chemical characterization of dew at a regional representative site of North-Central India. Atmos. Res. 2006, 80, 239–249. [Google Scholar] [CrossRef]
- Blaś, M.; Sobik, M.; Polkowska, Z.; Cichala-Kamrowska, K.; Namieśnik, J. Water and chemical properties of hydrometeors over Central European mountains. Pure Appl. Geophys. 2012, 169, 1067–1081. [Google Scholar] [CrossRef]
- Lekouch, I.; Muselli, M.; Kabbachi, B.; Ouazzani, J.; Melnytchouk-Milimouk, I.; Beysens, D. Dew, fog, and rain as supplementary sources of water in south-western Morocco. Energy 2011, 36, 2257–2265. [Google Scholar] [CrossRef]
- Acker, K.; Beysens, D.; Möller, D. Nitrite in dew, fog, cloud and rain water: An indicator for heterogeneous processes on surfaces. Atmos. Res. 2008, 87, 200–212. [Google Scholar] [CrossRef]
- Muskała, P.; Sobik, M.; Błaś, M.; Polkowska, Ż.; Bokwa, A. Pollutant deposition via dew in urban and rural environment, Cracow, Poland. Atmos. Res. 2015, 151, 110–119. [Google Scholar] [CrossRef]
- Beysens, D.; Milimouk, I.; Nikolayev, V.; Muselli, M.; Marcillat, J. Using radiative cooling to condense atmospheric vapor: A study to improve water yield. J. Hydrol. 2003, 276, 1–11. [Google Scholar] [CrossRef]
- Xu, Y.; Zhu, H.; Tang, J.; Lin, Y. Chemical Compositions of Dew and Scavenging of Particles in Changchun, China. Adv. Meteorol. 2015, 1–11. [Google Scholar] [CrossRef]
- WHO. A Global Overview of National Regulations and Standards for Drinking-Water Quality; WHO: Geneva, Switzerland, 2018. [Google Scholar]
- Israeli Ministry of Health Public Health Regulations. The Sanitary Quality of Drinking Water and Drinking Water Facilities (in Hebrew). Available online: https://www.health.gov.il/LegislationLibrary/Briut47.pdf (accessed on 8 June 2020).
- Heo, J.; Wu, B.; Abdeen, Z.; Qasrawi, R.; Sarnat, J.A.; Sharf, G.; Shpund, K.; Schauer, J.J. Source apportionments of ambient fine particulate matter in Israeli, Jordanian, and Palestinian cities. Environ. Pollut. 2017, 225, 1–11. [Google Scholar] [CrossRef]
- Mamane, Y.; Perrino, C.; Yossef, O.; Catrambone, M. Source characterization of fine and coarse particles at the East Mediterranean coast. Atmos. Environ. 2008, 42, 6114–6130. [Google Scholar] [CrossRef]
- Taiwo, A.M.; Harrison, R.M.; Shi, Z. A review of receptor modelling of industrially emitted particulate matter. Atmos. Environ. 2014, 97, 109–120. [Google Scholar] [CrossRef]
- Das, R.; Khezri, B.; Srivastava, B.; Datta, S.; Sikdar, P.K.; Webster, R.D.; Wang, X. Trace element composition of PM2.5 and PM10 from kolkata–a heavily polluted indian metropolis. Atmos. Pollut. Res. 2015, 6, 742–750. [Google Scholar] [CrossRef]
- Beysens, D.; Mongruel, A.; Acker, K. Urban dew and rain in Paris, France: Occurrence and physico-chemical characteristics. Atmos. Res. 2017, 189, 152–161. [Google Scholar] [CrossRef]
- Carvajal, D.; Minonzio, J.G.; Casanga, E.; Muñoz, J.; Aracena, A.; Montecinos, S.; Beysens, D. Roof-integrated dew water harvesting in Combarbalá, Chile. J. Water Supply Res. Technol. AQUA 2018, 67, 357–374. [Google Scholar] [CrossRef]
- Rosborg, I.; Kozisek, F.; Precautions, S. Drinking Water Minerals and Mineral Balance; Springer International Publishing: Cham, Switzerland, 2019; ISBN 9783030180331. [Google Scholar]
- Wright, J.; Colling, A. THE SEAWATER SOLUTION. In Seawater: Its Composition, Properties and Behaviour; Elsevier: Amsterdam, The Netherlands, 1995; pp. 85–127. [Google Scholar]
- WHO. Calcium and Magnesium in Drinking-Water; WHO: Geneva, Switzerland, 2009; ISBN 9789241563550. [Google Scholar]
- Gianelle, V.; Colombi, C.; Caserini, S.; Ozgen, S.; Galante, S.; Marongiu, A.; Lanzani, G. Benzo(a)pyrene air concentrations and emission inventory in Lombardy region, Italy. Atmos. Pollut. Res. 2013, 4, 257–266. [Google Scholar] [CrossRef]
- Zheng, M.; Fang, M. Particle-associated polycyclic aromatic hydrocarbons in the atmosphere of Hong Kong. Water. Air. Soil Pollut. 2000, 117, 175–189. [Google Scholar] [CrossRef]
- Iris. Toxicological Review of Benzo[a]pyrene; U.S Environmental Protection Agency: Washington, DC, USA, 2017.
- Cappelletti, M.; Frascari, D.; Zannoni, D.; Fedi, S. Microbial degradation of chloroform. Appl. Microbiol. Biotechnol. 2012, 96, 1395–1409. [Google Scholar] [CrossRef]
- Kidron, G.J.; Starinsky, A. Chemical composition of dew and rain in an extreme desert (Negev): Cobbles serve as sink for nutrients. J. Hydrol. 2012, 420–421, 284–291. [Google Scholar] [CrossRef]
- Das, R.; Das, S.N.; Misra, V.N. Chemical composition of rainwater and dustfall at Bhubaneswar in the east coast of India. Atmos. Environ. 2005, 39, 5908–5916. [Google Scholar] [CrossRef]
- Hong, L.; Zhu, B.; Yu, X.; Shi, S.; Chen, K.; Xia, L. Chemical composition of dew water at a suburban site in Nanjing, China, during the 2016–2017 winter. Atmos. Environ. 2019, 226–233. [Google Scholar] [CrossRef]
- Szep, R.; Matyas, L.; Keresztes, R.; Ghimpusan, M. Tropospheric Ozone Concentrations-Seasonal and Daily Analysis and its Association with NO and NO2 as a Function of NO x in Ciuc Depression-Romania; Revista De Chimie: Bucharest, Romania, 2016; Volume 67. [Google Scholar]
- Roberts–Semple, D.; Song, F.; Gao, Y. Seasonal characteristics of ambient nitrogen oxides and ground–level ozone in metropolitan northeastern New Jersey. Atmos. Pollut. Res. 2012, 3, 247–257. [Google Scholar] [CrossRef]
- McKnight, P.E.; Najab, J. Mann-Whitney U Test. In The Corsini Encyclopedia of Psychology; John Wiley & Sons Inc.: Hoboken, NJ, USA, 2010. [Google Scholar]


| Description | LOQ (µg/L) | Median (µg/L) | Standard Deviation (SD) | WHO Guidelines (µg/L) | Israeli Guidelines (µg/L) |
|---|---|---|---|---|---|
| Metals | |||||
| Silver (Ag) | 5 | <LOQ | - | - | 100 |
| Aluminum (Al) | 5 | 8 | 7.32 | - | 200 |
| Arsenic (As) | 2 | <LOQ | - | 10 | 10 |
| Barium (Ba) | 1 | 1.4 | 1.39 | 700 | 1000 |
| Beryllium (Be) | 1 | <LOQ | - | - | 4 |
| Calcium (Ca) | 20 | 176 | 446 | - | - |
| Cobalt (Co) | 2 | <LOQ | - | - | - |
| Cadmium (Cd) | 1 | <LOQ | - | 3 | 5 |
| Chromium (Cr) | 1 | <LOQ | - | 50 | 50 |
| Copper (Cu) | 5 | 140.5 | 110.02 | 2000 | 1400 |
| Iron (Fe) | 5 | <LOQ | 1.17 | 300 | 1000 |
| Potassium (K) | 20 | <LOQ | 26.06 | - | - |
| Nickel (Ni) | 5 | <LOQ | 101 | 70 | 20 |
| Lead (Pb) | 1 | <LOQ | 0.87 | 10 | 10 |
| Antimony (Sb) | 2 | <LOQ | 3.65 | 20 | 6 |
| Thallium (Tl) | 1 | <LOQ | - | - | 2 |
| Vanadium (V) | 10 | <LOQ | - | - | - |
| Selenium (Se) | 10 | <LOQ | - | 40 | 10 |
| Zinc (Zn) | 2 | 10.7 | 28.88 | - | 5000 |
| Mercury (Hg) | 1 | <LOQ | - | 6 | 1 |
| Manganese (Mn) | 20 | <LOQ | - | - | 200 |
| Molybdenum (Mo) | 2 | <LOQ | - | 70 | 70 |
| Sodium (Na) | 20 | 69 | 344.37 | - | - |
| Magnesium (Mg) | 20 | 35.5 | 50.6 | - | - |
| Ions | |||||
| Bromide (Br−) | 100 | <LOQ | 17.5 | - | - |
| Chloride (Cl−) | 100 | 120 | 214.1 | - | 400,000 |
| Fluoride (F−) | 20 | <LOQ | 15.8 | 1500 | 1700 |
| Nitrate (NO3−) | 100 | 180 | 286.1 | 50,000 | 70,000 |
| Nitrite (NO2−) | 100 | <LOQ | 200.8 | 3000 | 3000 |
| Phosphate (PO4−) | 200 | <LOQ | 218.4 | - | - |
| Sulfate (SO4−) | 100 | 240 | 374.5 | - | 250,000 |
| Parameter | Day Median (µg/L ± SD) | Night Median (µg/L ± SD) | Mann–Whitney U Test |
|---|---|---|---|
| Metals | |||
| Copper | 139.0 ± 72.7 | 146.0 ± 145.5 | U = 457.0 P = 0.284 |
| Aluminum | 8.4 ± 7.7 | 7.1 ± 6.8 | U = 472.5 P = 0.357 |
| Zinc | 9.4 ± 37.4 | 11.0 ± 8.3 | U = 388.0 P = 0.065 |
| Nickel | <LOQ ± 126.4 | <LOQ ± 46.5 | U = 417.0 P = 0.097 |
| Calcium | 279.0 ± 501.4 | 111.0 ± 287.6 | U = 307.0 P = 0.004 |
| Magnesium | 52.0 ± 50.2 | 32.0 ± 51.5 | U = 434.5 P = 0.189 |
| Sodium | 75.0 ± 447.7 | 69.0 ± 72.4 | U = 476.5 P = 0.379 |
| Potassium | <LOQ ± 27.8 | <LOQ ± 23.7 | U = 470.0 P = 0.328 |
| Ions | |||
| Nitrate | 200.0 ± 321.3 | 232.0 ± 170.0 | U = 442.5 P = 0.220 |
| Nitrite | <LOQ ± 236.8 | <LOQ ± 129.9 | U = 435.5 P = 0.168 |
| Sulfate | 270.0 ± 391.9 | 220.0 ± 349.4 | U = 427.0 P = 0.163 |
| Chloride | 120.0 ± 257.7 | 120.0 ± 129.4 | U = 466.0 P = 0.324 |
| Other | |||
| Ammonium | 780.0 (n = 32) ± 602 | 590.0 (n = 25) ± 431.1 | U = 456.5 P = 0.281 |
Publisher’s Note: MDPI stays neutral with regard to jurisdictional claims in published maps and institutional affiliations. |
© 2020 by the authors. Licensee MDPI, Basel, Switzerland. This article is an open access article distributed under the terms and conditions of the Creative Commons Attribution (CC BY) license (http://creativecommons.org/licenses/by/4.0/).
Share and Cite
Inbar, O.; Gozlan, I.; Ratner, S.; Aviv, Y.; Sirota, R.; Avisar, D. Producing Safe Drinking Water Using an Atmospheric Water Generator (AWG) in an Urban Environment. Water 2020, 12, 2940. https://doi.org/10.3390/w12102940
Inbar O, Gozlan I, Ratner S, Aviv Y, Sirota R, Avisar D. Producing Safe Drinking Water Using an Atmospheric Water Generator (AWG) in an Urban Environment. Water. 2020; 12(10):2940. https://doi.org/10.3390/w12102940
Chicago/Turabian StyleInbar, Offir, Igal Gozlan, Stanislav Ratner, Yaron Aviv, Roman Sirota, and Dror Avisar. 2020. "Producing Safe Drinking Water Using an Atmospheric Water Generator (AWG) in an Urban Environment" Water 12, no. 10: 2940. https://doi.org/10.3390/w12102940
APA StyleInbar, O., Gozlan, I., Ratner, S., Aviv, Y., Sirota, R., & Avisar, D. (2020). Producing Safe Drinking Water Using an Atmospheric Water Generator (AWG) in an Urban Environment. Water, 12(10), 2940. https://doi.org/10.3390/w12102940