Decoupling Urban Water Use and Growth in Response to Water Scarcity
by
 ,
,
Brian D. Richter
1,* ,
,
Kendall Benoit
2, 
Jesse Dugan
3,
Gabriella Getacho
2,
Natalie LaRoe
4,
Bailey Moro
4,
Tyler Rynne
4,
Maria Tahamtani
4 and
Allen Townsend
5
1
Sustainable Waters LLC, Crozet, VA 22932, USA
2
Department of Environmental Sciences, University of Virginia, Charlottesville, VA 22904, USA
3
Department of Electrical and Computer Engineering, University of Virginia, Charlottesville, VA 22904, USA
4
Department of Urban and Environmental Planning, University of Virginia, Charlottesville, VA 22904, USA
5
Department of Engineering Systems and Environment, University of Virginia, Charlottesville, VA 22904, USA
*
Author to whom correspondence should be addressed.
Water 2020, 12(10), 2868; https://doi.org/10.3390/w12102868
Submission received: 25 August 2020
/
Revised: 18 September 2020
/
Accepted: 13 October 2020
/
Published: 15 October 2020
(This article belongs to the Special Issue Urban Environmental Policy and Planning: Land Use and Water)
Abstract
:Many cities in the western US face difficult challenges in trying to secure water supplies for rapidly growing urban populations in the context of intensifying water scarcity. We obtained annual data from urban water utilities across the western US to document trends in their water usage and service populations. We found that many cities have been able to accommodate population increases while simultaneously reducing their volume of water use, thereby decoupling growth from water use. This outcome is largely attributable to reductions in per-capita residential use. We identify additional untapped potential that can sustain and widen this decoupling for many cities.
1. Introduction
Access to additional water supplies has been a prerequisite for population and economic growth throughout human history. When early Roman towns outgrew their local water supplies, they engineered aqueducts to bring water from distant springs. Two thousand years later, the City of Los Angeles, California, built a 674-km aqueduct from the Sierra Nevada Mountains that unleashed a ten-fold population increase in the first half of the 20th Century. Other engineering advancements throughout the past century enabled the construction of massive storage reservoirs and wells tapping groundwater hundreds of meters deep, facilitating the growth of modern mega-cities, industries, and extensive irrigated farming regions.
It is therefore unsurprising that many urban planners and political leaders continue to assume that growing populations and economies will require ever-more water. Abraham and others [1] found that future demand projections by the ten largest water utilities in the State of California overestimated future demands 98% of the time, with projections that proved to be 23–26% too high even when the forecast length was only five years. The authors attributed these over-projections primarily to underestimation of the rate by which cities were reducing their per-capita usage.
Similarly, when the US Bureau of Reclamation in 2012 projected multi-decadal future water demands from the Colorado River of the western US, it assumed that the population-following trend of increasing water use over the past 90 years would largely continue throughout the next 50 years (Figure 1) [2]. Based on a suite of planning scenarios ranging from slow (+23%) to rapid (+93%) population growth, the Bureau projected increased water demands of 27%–49% by 2060. These projected increases in demands were based almost entirely on expected increases in municipal and industrial water needs due to population growth [2].
However, the Bureau’s projected water demands for 2015—based primarily on forecasts from each of the seven states sharing Colorado River water—proved to be ~20% too high, even though the forecast was published only three years earlier (Figure 1). Water consumption in the basin has not increased as projected, but has instead dropped by 16% from 2000−2015 (Figure 1) [3]. The Bureau’s water planners and their state-agency peers participating in the 2012 study inadequately recognized the strength of downward trends in per-capita municipal water use during recent decades. As reported later in this paper, the nine cities we surveyed that source water supplies from the Colorado River basin lowered their per-capita use by 19–48% during 2000–2015.
As discussed in greater detail below, we conducted a survey of water utility managers in 20 western US cities. In our discussions with water utility staff about their motivations for implementing water conservation strategies, water scarcity and the difficulty or expense of securing additional water supplies for their growing populations were universally expressed as leading motivations. As an example, Figure 1 illustrates the fact that during recent decades, consumptive water use in the Colorado River basin has exceeded total river flow in most years since the early 1990s, enabled by progressively depleting large storage reservoirs in the basin [3].
In recent years, various agencies have suggested that as water scarcity expands and intensifies globally, a decoupling of water use from growth will be essential in sustaining economic growth and well-being [4]. In 2016, the United Nations Environment Programme (UNEP) warned that “half the world faces severe water stress by 2030 unless water use is ‘decoupled’ from economic growth” [4]. At the global level, economic decoupling appears to be well underway, as the global economy grew at a rate five times that of global water consumption during the past century [4].
A similar trend of decoupling has been observed in the US. After reaching a zenith in 1980, total US water use had dropped by 27% by 2015, even while the country’s population grew by 42% and GDP expanded more than six-fold [5,6]. During 2000–2015, the period of focus in this paper, substantial reductions in water use were observed in each major water-use category: Irrigation (−55%), Public Water Supply (−45%), Industrial (−40%), and Thermoelectric Power (−30%).
However, as UNEP asserts [4], the need and potential for decoupling is most appropriately assessed at local or regional scales; such local assessment can reveal the benefit of decoupling strategies on stressed water sources. This is exemplified by research into water decoupling efforts in China. Of 31 provinces in China, over 60% displayed strong decoupling between water consumption and economic growth after 2011, the year that China began to place a deliberate urgency on environmental protection efforts [7]. The Yellow River—the country’s second largest river basin—has been identified as a water-risk hotspot by the World Resources Institute [8]. Within this basin, the Beijing–Tianjen–Heibei region exhibited strong decoupling between water consumption and economic growth from 2004–2017, which was attributed to improved water-use efficiencies and conservation awareness on an individual scale, as researchers documented a substantial decline in the annual per-capita water footprint over this period [9]. Similarly, in a comparative urban review of China’s three largest megacities for the period 2005–2015, Guangzhou was found to display the strongest decoupling between economic growth and water usage, followed by Shanghai and Beijing.
In this study, we sought to better understand the policy drivers and incentives that have enabled decoupling between urban growth (measured by both population size and by gross domestic product or GDP) and water demands, through an examination of recent trends in western US cities.
2. Methods
Our selection of western US cities for our survey was not geographically stratified. We began by screening county-level public water supply data published every five years by the US Geological Survey, for each county located in the 17 contiguous western US states [10]. Because city-level data are not collected by the US Geological Survey’s water census, we used the agency’s county-level data as a proxy for identifying counties that were most likely to encompass urban areas that are decoupling their water use from population or economic growth. We compared county-level public supply water use and population estimates for 2000 and 2015 to identify counties that met three criteria: (1) population estimates and water use data were reported for the county for both 2000 and 2015; (2) the population increased from 2000 to 2015; and (3) total water use declined over this period. Of the 97 western US counties with increasing populations, 63 (65%) reported volumetric declines in their use of public water supplies.
Because no federal accounting or reporting standards pertaining to urban water use data exist within the US, and not all western US states have standardized procedures [11], we had to rely on individual water utilities to provide data that would enable us to evaluate trends in a standardized fashion. We sought to document three trends over time: (1) changes in service population size; (2) changes in both residential and total water use; and (3) changes in GDP. We also wanted to gain an understanding of the strategies implemented to reduce water use and thereby achieve a decoupling from population or economic growth over time.
We obtained standardized GDP data for each city from the US Bureau of Economic Analysis [12]. To obtain data on water use and service population size, we used both telephone and email communications to contact individuals within the public water utilities serving the largest city in each of the 63 qualifying counties. If after five telephone or email attempts we were unsuccessful in securing the requisite information, the city/utility was removed from our list.
We were able to secure annual estimates of GDP, water use, and service population data from 20 cities (Figure 2), representing one-third of the counties meeting the three criteria listed above. Although we requested all available data on water use and population from each utility, our analysis was limited to the 2000–2015 period because data from this period were available from all 20 utilities, with the caveat noted in Table 1 for two of our cities.
From these data we were able to calculate trends in GDP and total and residential water use, and to calculate total and residential per-capita use in a standardized fashion. Our standardized estimation of per-capita use—expressed as both total liters per capita per day (TLPCD) and residential liters per capita per day (RLPCD)—was important because different utilities estimate their per-capita water use in different ways [11], making it impossible to compare cities. Additionally, it was important for us to obtain annual water use and service population as separate data series (rather than only as TLPCD or RLPCD) because we wanted to analyze the year-by-year decoupling between the two series. Although many publications have performed comparisons of per-capita water usage among different series (see for example, [13]), we sought to explicitly evaluate decoupling over time.
During our communications with utility staff, we also asked them to explain how their utility was able to accomplish the decoupling evidenced by their water and population data. We were unable to capture this information in a standardized manner, such as by using a survey instrument, for three reasons: (1) the implementation of water conservation strategies had not been adequately documented by the utility; (2) due to staff turnover, very few individuals had knowledge of strategy implementation over the 2000–2015 period; (3) in some cases, we were able to obtain the water use and population data only through an open records request and were unable to interview staff. However, we were able to gain detailed documentation and interpretation of that documentation from eight of our utilities. Based on that information, we compiled the list of policies, incentives, and programs summarized in our Discussion section.
3. Results
We have summarized our primary findings in Table 1. Because of some minor differences in the manner in which total or residential water deliveries are tabulated among our utilities, we have reported trends only as percentage changes, rather than presenting actual estimates of total or residential liters per capita per day (LPCD) in Table 1. We contend that as long as the utility used the same accounting approach over the 2000–2015 time period, the changes in per-capita usage provide a reasonably robust indicator of water-use trends and decoupling.
Among the 20 cities surveyed, population growth during 2000–2015 increased by an average of 21%, while total water use decreased by 19% on average. We found that an average of 65% (range: 54–76%) of total water use is for residential purposes, based on the 15 cities that provided residential water data in addition to total water use. We also found that 67% of the urban water use reductions documented in Table 1 can be directly attributed to improvements in per-capita residential water use.
4. Discussion
In addition to obtaining data on water use and service population, we also queried water utility staff, where possible, for their explanations of why their total water use had declined even while their service population increased. Below we discuss the drivers and incentives identified as being the most important in our surveyed cities.
4.1. Federal and State Policy Drivers
Several key pieces of federal legislation have proven instrumental in reducing urban water use since the early 1990s. The most important national policy driver for water conservation materialized with the passage of the National Energy Policy Act in 1992 (H.R.776, 102nd Congress). The architects of this energy bill recognized that drinking water and wastewater plants are often the largest energy consumers within municipalities, typically accounting for 30–40% of total energy consumed [14]. The Act thus set residential fixture and appliance standards that limit the volume of water used per flush or per minute for toilets, urinals, showerheads, and faucets. Most notably, it required that every toilet installed after 1994 use just 6 L of water per flush, a 54% reduction from the pre-legislation norm of 13 L per flush (Lpf) [15]. More recently, federal legislation has been used to tackle appliance water use in the American laundry room, mandating the use of high efficiency washing machines and lowering use from 150–170 L to just 53–95 L of water per load [16].
These federal laws have had a substantial influence on residential indoor water use in the US. The 1992 Act has been credited with saving an estimated seven billion gallons per day, equating to seven times the daily water use of New York City and 18% of total daily US public water-supply use as of 2015 [17]. On a per-capita basis, average daily indoor water use during 1999–2016 dropped from 261 to 223 L (−15%), which has been attributed to lowered water use in toilets, clothes washers, and showers [18].
In 2006, the U.S. Environmental Protection Agency (EPA) created the WaterSense Program [19]. This voluntary national program certifies products that use 20 percent less water than the federal standard without sacrificing performance. WaterSense certified fixtures include dual-flush toilets and 4.85 Lpf toilets, which are lower than the federal standard of 6.1 Lpf.
Several states have gone beyond the federal requirements by instituting more stringent standards. In 2009, Texas adopted a statue requiring all plumbing fixtures sold in the state to have the WaterSense label, as did Colorado in 2014. California became the first state in the nation in 2014 to mandate the installation of low-flow toilets, showerheads, and faucets for all homes and commercial buildings constructed since the National Energy Policy Act began its implementation (California Civil Code §1101.1–1101.9). While the federal Act ensured that all new construction would include high-efficiency fixtures, the California law was intended to address existing homes. Enforcement is triggered when homeowners apply for building permits for remodeling projects, or when selling their home.
4.2. Incentivizing Water Conservation with Plumbing Fixture Rebates
Although the passage of federal and state policies pertaining to high-efficiency plumbing fixtures have been very influential in reducing indoor water use in new homes, many cities have sought to motivate owners of older homes and businesses to replace their more water intensive fixtures as well by offering financial rebates. Many cities offer rebates for replacing indoor plumbing fixtures, particularly those fixtures that account for the greatest usage in single-family homes: toilets (24% of indoor water use), faucets (20% of use), showers (20% of use), and clothes washers (16% of use) [18].
The San Antonio Water System (Texas) was among the first large water utilities in 1994 to deploy rebates as a means for incentivizing plumbing fixture replacements. At the end of 2013, the agency announced that it was winding down its toilet rebate program known as “Kick the Can”; over a 20-year timespan, the agency had subsidized the replacement of ~200,000 residential toilets and ~100,000 commercial toilets, resulting in savings of an estimated 17 billion liters cumulatively [20]. As the program reached saturation in replacing toilets in homes and businesses, the agency decided to increase its emphasis on other water conservation programs, focusing particularly on outdoor water use.
4.3. Cutting Water Use Outdoors
Recent detailed studies of residential water use in the US estimate that outdoor irrigation accounts for half of all residential water use [18]. Not surprisingly, many US cities have promoted conservation programs focusing on reducing outdoor water use, particularly for lawn watering.
The Southern Nevada Water Authority, which primarily supplies water for Las Vegas, began implementing in 1999 a “Water Smart Landscaping Program”(also known as “Cash for Grass”) to reduce the 60% of its water deliveries that were going to outdoor use. In its initial years the program paid landowners $4.30 per square meter, but this incentive has risen to $32.28/square meter today. By 2018, the agency had subsidized the replacement of an estimated 17.3 million square meters of lawn turf with less water-intensive desert landscaping in more than 60,000 individual projects, resulting in cumulative savings of 39.4 billion liters [21]. The program has had the effect of lowering outdoor water use on participating parcels by one-third, and overall single-family residential water use by 21% [22]. Hence, the program has contributed substantially to the 37% reduction in total LPCD for Las Vegas noted in Table 1.
Many cities have additionally supported efforts to directly capture rainfall in storage tanks and cisterns for use in outdoor landscaping, thereby relieving pressure on potable public water supplies. With average annual precipitation of only 279 mm, the City of Tucson, Arizona, would seem an unlikely candidate for rainwater harvesting systems, but an array of rebate programs and incentives have helped reduce Tucson’s per-capita and total water use (Table 1). In 2011, Tucson Water implemented a program that gives rebates to residents based on their installation of passive rainwater harvesting systems—in which rainwater is channeled directly to landscape areas—or active systems involving storage infrastructure (Figure 3) [23].
For passive systems, half of the cost of building materials and installation is covered by the rebate program, but this is capped at $500 USD. Active systems receive greater subsidization because these systems are more complex and expensive. The rebate quantity depends on the capacity of the tank being installed; small tanks (189–3025 L) receive $0.07 USD/liter and large tanks (3026+ L) receive $0.26 USD/liter to build and install. Since 2011, an estimated 144 million liters of rainwater has been captured, including more than 11 million liters in 2018 alone [24].
4.4. Using Water Pricing to Drive Conservation
Water pricing in the United States has traditionally been based either on a fixed monthly rate that does not account for the volume of water used, or a fixed volumetric rate. Fixed monthly rates do little to control demand because there is no penalty for excessive consumption. A fixed volumetric rate, known as uniform block pricing, encourages some conservation because users pay for each unit of water they consume, but the cost of consuming an additional unit of water is the same for all levels of consumption. Conservation pricing, or prices that provide a stronger economic incentive for consumers to conserve, has been gaining popularity among utilities seeking to reduce water consumption [25,26].
Although many utilities report perceived success of their pricing structures on water demands, very little rigorous analysis has been undertaken [27]. Because the effect of a rate structure is dependent on the specific characteristics of both the original and new rate structures, isolating the effects of a rate structure on consumer behavior requires rigorous statistical analysis, which depends on data that are incomplete or unavailable for many utilities. It is also problematic that changes in rate structures are typically implemented simultaneously with many other conservation initiatives, thereby making it impossible to tease out price effects.
However, Baerenklau and others [27] conducted careful study of a new rate structure implemented by the Eastern Municipal Water District (EMWD), which serves domestic and agricultural water users in an area between Los Angeles and San Diego in southern California. Beginning in 2009, EMWD changed from flat-rate pricing to a household-specific inclining block water budget (as used here, increasing/inclining block pricing is a form of tiered pricing, where the volumetric cost of water increases with higher consumption; water budgets are a type of price structure that are designed for individual customers based on household-specific characteristics, environmental conditions, and a judgement by the utility on what is considered to be efficient usage). The indoor budget applied in EWMD is based on the number of residents in the household (each at 60 gallons or 0.23 cubic meters per day), and outdoor budgets are based on the amount of water required to maintain a property’s irrigated area, under the assumption that there is turf grass in that area. The study estimated that over more than three years of rate implementation, demand was at least 18% below the level it would have been under a comparable flat-rate price structure.
4.5. Industrial Water Use for Electricity Generation
When cities are supplying thermoelectric power plants with potable municipal water supplies, there may be a great opportunity for lowering the city’s use of public supplies. The thermoelectric power generating sector is the largest user of water in the US, accounting for 38% of freshwater withdrawals [5]. Power plants use water primarily for cooling purposes, but total water use depends on the plant type, fuel type, and cooling system. On average, nuclear plants use more water than coal-fired plants, which in turn use more water than natural gas power plants [28]. Photovoltaic (solar) generation has minimal water requirements (primarily associated with cleaning of panels), and natural gas turbine plants are mostly air-cooled; consequently, the recent US transition toward increased natural gas and solar generation is beginning to decouple the electric system from dependency on water [28,29].
Additionally, the use of alternative sources of water such as recycled water for thermoelectric plant cooling has enabled many cities to lessen their dependency on withdrawals from freshwater sources (rivers and aquifers) [30]. While our calculations of total water use and LPCD do not differentiate between freshwater and alternative water sources such as recycled water, we feel it important to mention the increasing use of recycled and other alternate water sources in averting water shortages. The City of Austin, Texas has used recycled water for city-owned applications such as golf course irrigation since the 1970s. As the city’s population has soared in recent decades (Table 1), increasing emphasis is being placed on using recycled water. In 2006, Austin Energy began switching from potable municipal water to treated wastewater at its Sand Hill Energy Center. By 2016, 98% of all water used at Sand Hill was recycled municipal wastewater, resulting in an annual reduction in freshwater withdrawals of 1.7 billion potable liters [31].
4.6. The Business of Water Stewardship
Many large corporations are highly dependent upon access to clean, adequate water supplies to support either their direct operations (such as textile or bottling plants), their supply chains (such as farms where their input ingredients are produced), or both. As water supplies have become more scarce or polluted, these corporations face not only the physical risk of not having enough clean water, but also regulatory or reputational risk if they are perceived as not being responsible users of water.
In every year since 2012, the World Economic Forum has identified “water crises” as one of the top five global risks in their annual Global Risks Report [32]. These water risks are already affecting companies and their supply chains. The global organization CDP, which runs an environmental disclosure program with corporate entities and investors, reported $38.5 billion USD in water-derived financial losses by 2114 responding companies in 2018 alone [33].
Increasing recognition of these water-related risks—and opportunities for competitive advantage through water conservation—has led to greatly increased interest in corporate water stewardship [34]. To aid companies with their water stewardship endeavors, the Alliance for Water Stewardship has developed a voluntary certification program that guides companies in focusing on water governance, water balance, water quality, critical water hotspots, and water sanitation and hygiene [35].
The Coca-Cola Company is an example of a corporate entity that has made large investments in improved water efficiency in their bottling plants. Between 2004 and 2015, Coca-Cola and its bottling partners invested over $300 million USD in water conservation [36]. In Coca-Cola’s El Paso facility, water use decreased over 8% from 2005 to 2018 even while production increased by 20%, and in its Phoenix-area facility water use decreased over 35% from 2005 to 2018 while production decreased by 16%.
4.7. Pulling It All Together
While the water conservation strategies discussed above illustrate the potency of specific actions, none of the cities we assessed could have achieved their water-use reductions over recent decades without a coordinated, multi-strategy approach. Two of the cities we reviewed illustrate the sophistication and impact of modern urban water conservation programs.
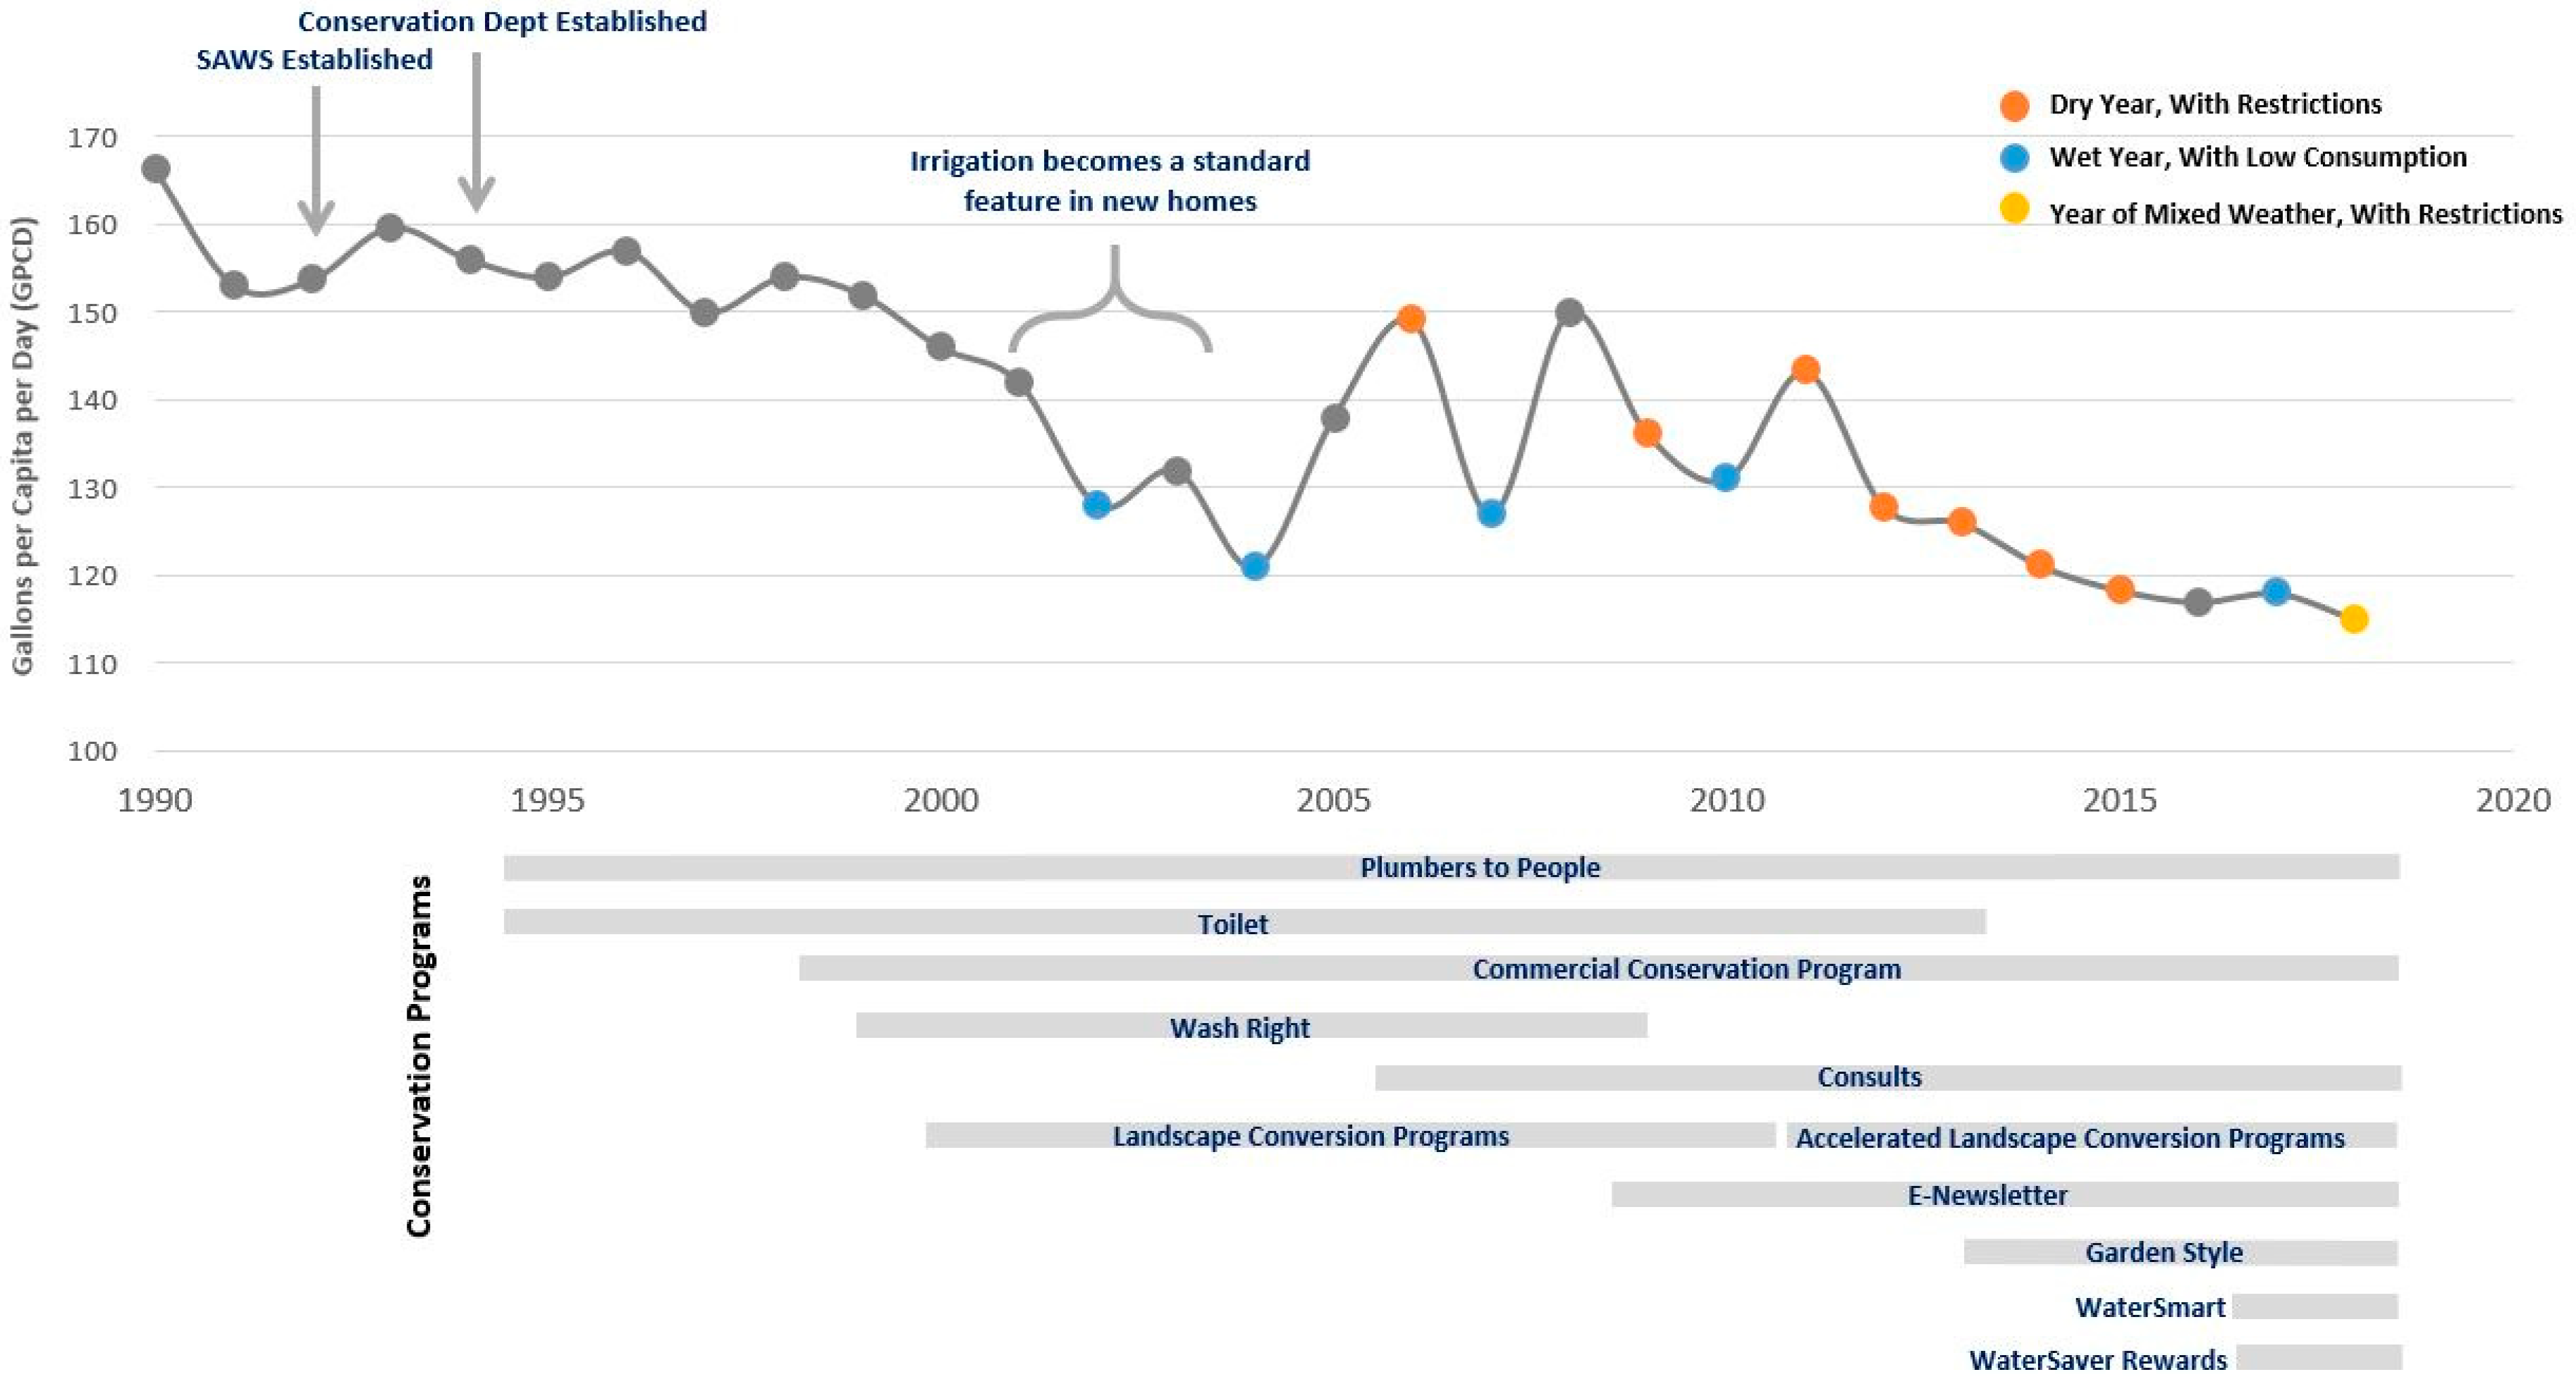
With a service population of 1.9 million and a dedicated water conservation staff of more than 20 individuals, the San Antonio Water System (SAWS) runs one of the most sophisticated urban conservation programs in the country (Figure 4). Between 1994—when SAWS established its Conservation Department—and 2018, total per-capita water use decreased 26%, while its service population increased by 85% [37] (see also Table 1). SAWS estimates that in 2018 alone they conserved over 4.9 billion liters of water due to conservation interventions. Conservation programs implemented during this time have included water leak repair services for low-income customers, replacing high-flow with low-flow toilets, providing rebates for water conserving practices and technologies (such as grass removal and converting irrigation systems), and public awareness and education (such as free one-hour conservation irrigation consultations and personalized home water reports) [37].
A dedicated water conservation fund has enabled SAWS to consistently fund their conservation staff and numerous conservation programs (more than 30 different strategies in 2018). A percentage of SAWS’s residential rate structure is specifically set aside for conservation. A similar dedicated funding mechanism also exists for commercial, industrial, and institutional (CII) customers. Today, approximately 30% of SAWS’s water sales by volume are to CII customers and the restricted funds support conservation education and incentive programs [37].
The City of Santa Cruz, California, has demonstrated that highly successful water conservation can be achieved even with a service population under 100,000. Between 1980 and 2015, the city’s population grew by two-thirds, and today the City of Santa Cruz Water Department serves 98,000 users [38]. In 2001 the city joined the California Urban Water Conservation Council (since recreated as the California Water Efficiency Partnership), committing themselves to implementing various best management practices for water conservation in the categories of Utility Operations, Educational Programs, Residential, Commercial/Industrial/Institutional, Landscape, and Water Shortage Management. The city is presently implementing 34 individual conservation measures, enabling reductions of 45% in total LPCD and 40% in total water use from 2000–2015 (Table 1). The city attributes much of its progress to conservation pricing. In 2004, a new five-tier increasing rate block structure replaced the previous three-tier structure, and in 2014 adopted a 10%/year rate increase for five years [38]. Water department staff attribute much of their 42-L decrease in LPCD from 2004–2006 and 106-L LPCD drop during 2013–2015 to these rate changes (Toby Goddard, personal communication).
5. Looking Forward
Great progress has been made in reducing urban water use in recent decades. The cities surveyed in our analysis document the fact that substantial increases in service populations can be accommodated without increasing total water use. Key to this decoupling has been their ability to push down per-capita water use at a rate greater than the demands associated with adding newcomers into their service populations.
There appears to be much room for continued improvement within cities that have not yet attained the high levels of performance we document here, as well as within cities that are already engaged in water conservation. DeOreo and others [18] project that residential indoor use in the US will drop by another 37% in coming years due to the fact that less than half of American homes have installed highly efficient toilets or clothes washers, two of the greatest uses of water indoors. By comparison, 86% of Australian homes now have high-efficiency toilets [39]. Leak reduction has the potential to save an additional 14% of water use in homes, on average [18]. This suggests that total indoor water use in American homes could potentially drop by at least another 50% in coming years.
DeOreo and others [18] also suggest that outdoor water use could be further reduced by 16% by eliminating excessive watering practices. We add that capturing rainwater for use outdoors holds great promise for alleviating pressure on freshwater supplies. Cahill and Lund [39] documented that more than 40% of Australian households are using rainwater storage tanks, whereas they are used by only a tiny fraction of American homeowners and businesses.
We also see great potential in the use of alternative water sources—wastewater reuse, large-scale stormwater capture, desalination, and even condensate capture from heating, ventilation, and air conditioning (HVAC) systems—as an important strategy for reducing freshwater extractions in water-stressed areas [40]. One bellwether is the City of Los Angeles’ commitment to recycle 100% of its wastewater by 2035, at which time recycled water will be providing 35% of the city’s supply as compared to only 2% today [41]. Another important factor will be the increased frequency and volume of voluntary, compensated transfers of water conserved on irrigated farms to meet urban needs, a very cost-effective strategy in regions with large acreage of irrigated farms [42,43,44].
We note that the challenge of holding the line on total water use appears more difficult for larger cities or utilities with very high rates of population increase, simply because per-capita use must drop by a greater extent to keep total volume constant. All but one of the cities in our survey were able to attain total volume reductions during 2000–2015 (the San Antonio Water System experienced an increase of 21% in its total water use over this period). This utility experienced extreme growth (56%) in its service population during this period, which resulted from both population growth and a merger with another water provider, and it had already substantially reduced its per-capita water use prior to 2000.
For cities across the US, water conservation and the use of alternative water sources will both continue to offer tremendous potential for accommodating population growth without placing further pressure on stressed freshwater supplies in the coming decades [42]. More than half of all US counties were already able to do this during 2000–2015 [10]. The challenge for urban water managers will be to fully harvest the potential for water savings that can help constrain their needs within the limits of available water supplies.
Author Contributions
Conceptualization, B.D.R.; methodology, B.D.R.; formal analysis, B.D.R., M.T., A.T.; investigation, B.D.R., K.B., J.D., G.G., N.L., B.M., T.R., M.T., A.T.; data curation, B.D.R.; writing—original draft preparation, B.D.R.; writing—review and editing, B.D.R., K.B., J.D., G.G., N.L., B.M., T.R., M.T., A.T; visualization, M.T.; supervision, B.D.R.; project administration, B.D.R. All authors have read and agreed to the published version of the manuscript.
Funding
This research received no external funding.
Acknowledgments
Gabriella Freckmann and Henry Green contributed to the data collection effort for this project. We wish to thank the following individuals for their assistance in providing water-use and population data for their respective utilities: Carlos Bustos (Albuquerque); Jose Salas (Denver-Lakewood); Tony Spencer (Fort Collins); Erin Young (Flagstaff); Corey Enus (Las Vegas); Jevon Lamb (Los Angeles); Jeanne Belding (San Rafael); Christian Delgado (Phoenix); Kelley Gage and Dan Denham (San Diego); Martha Wright and Karen Guz (San Antonio); Julie Ortiz (San Francisco); Toby Goddard (Santa Cruz); Colin Close (Santa Rosa); Bruce Flory and Terri Gregg (Seattle); David Kehn (Chico); and Joaquim Delgado (Tucson).
Conflicts of Interest
The authors declare no conflict of interest.
References
- Sonali, A.; Diringer, S.; Cooley, H. An Assessment of Water Demand Forecasts in California; Pacific Institute: Oakland, CA, USA, 2020; Available online: https://pacinst.org/publication/urban-water-demand-forecasts-california/ (accessed on 3 August 2020).
- US Bureau of Reclamation. Colorado River Basin Water Supply and Demand Study; Technical Report C—Water Demand Assessment; US Department of the Interior, Bureau of Reclamation: Denver, CO, USA, 2012. [Google Scholar]
- US Bureau of Reclamation, Boulder Canyon Operations Office—Programs and Activities, Water Accounting Reports. Available online: https://www.usbr.gov/lc/region/g4000/wtracct.html (accessed on 3 August 2020).
- United National Environment Programme, International Resource Panel. Options for Decoupling Economic Growth from Water Use and Pollution; UNEP: Paris, France, 2015. [Google Scholar]
- Dieter, C.A.; Maupin, M.A.; Caldwell, R.R.; Harris, M.A.; Ivahnenko, T.I.; Lovelace, J.K.; Barber, N.L.; Linsey, K.S. Estimated Use of Water in the United States in 2015: U.S. Geological Survey Circular 1441; US Geological Survey: Reston, VA, USA, 2018. [Google Scholar]
- World Bank, World Development Indicators (WDI)—People. Available online: http://datatopics.worldbank.org/world-development-indicators/themes/people.html (accessed on 3 August 2020).
- Wang, Q.; Wang, X. Moving to economic growth without water demand growth—A decomposition analysis of decoupling from economic growth and water use in 31 provinces of China. Sci. Total Environ. 2020, 726, 1–19. [Google Scholar] [CrossRef] [PubMed]
- Zabarenko, D. Water Use Rising Faster than World Population. Reuters Green Business News. 25 October 2011. Available online: https://www.reuters.com/article/us-population-water-idUSTRE79O3WO20111025 (accessed on 17 September 2020).
- Kong, Y.; He, W.; Yuan, L.; Shen, J.; An, M.; Degefu, D.M.; Gao, X.; Zhang, Z.; Sun, F.; Wan, Z. Decoupling analysis of water footprint and economic growth: A case study of Beijing–Tianjin–Hebei Region from 2004 to 2017. Int. J. Environ. Res. Public Health 2019, 16, 4873. Available online: https://www.ncbi.nlm.nih.gov/pmc/articles/PMC6926810/ (accessed on 17 September 2020). [CrossRef] [PubMed] [Green Version]
- US Geological Survey, Water-Use Data available from USGS. Available online: https://water.usgs.gov/watuse/data/ (accessed on 3 August 2020).
- Vogel, C.; Longworth, J. Apples to apples: A standardized measure for municipal water. Southwest Hydrol. 2009, 8, 24–25. [Google Scholar]
- U.S. Bureau of Economic Analysis, Total Gross Domestic Product. Available online: https://fred.stlouisfed.org/series/NGMP22380 (accessed on 20 August 2020).
- Water Resource Advocates. Arizona Water Meter: A Comparison of Water Conservation Programs in 15 Arizona Communities; Western Resource Advocates: Boulder, CO, USA, 2010. [Google Scholar]
- U.S. Environmental Protection Agency (USEPA), Energy Efficiency for Water Utilities. Available online: https://www.epa.gov/sustainable-water-infrastructure/energy-efficiency-water-utilities (accessed on 24 August 2020).
- Alliance for Water Efficiency, 20 Years of the Energy Policy Act: 18 Trillion Gallons Saved Through More Efficient Toilets. Available online: https://www.allianceforwaterefficiency.org/news/20-year-energy-policy-act-18-trillion-gallons-saved-through-more-efficient-toilets (accessed on 3 August 2020).
- U.S. Environmental Protection Agency (USEPA). Market Impact Analysis of Potential Changes to the ENERGY STAR® Criteria for Clothes Washers; USEPA: Washington, DC, USA, 2008. Available online: https://www.energystar.gov/sites/default/files/specs/CriteriaAnalysis_2008.pdf (accessed on 24 August 2020).
- Postel, S. Replenish: The Virtuous Cycle of Water and Prosperity; Island Press: Washington, DC, USA, 2017. [Google Scholar]
- DeOreo, W.B.; Mayer, P.; Dziegielewski, B.; Kiefer, J. Residential End Uses of Water, Version 2: Executive Report; Water Research Foundation: Denver, CO, USA, 2016; Available online: https://www.waterrf.org/research/projects/residential-end-uses-water-version-2 (accessed on 24 August 2020).
- US Environmental Protection Agency, About Water Sense. Available online: https://www.epa.gov/watersense/about-watersense (accessed on 24 August 2020).
- Joseph, D. SAWS Ending Toilet Program. San Antonio Express-News, 1 December 2013. [Google Scholar]
- Southern Nevada Water Authority (SNWA). Joint Water Conservation Plan; SNWA: Las Vegas, NV, USA, 2019; Available online: https://www.snwa.com/assets/pdf/reports-conservation-plan-2019.pdf (accessed on 24 August 2020).
- Baker, J.E. Subsidies for Succulents: Evaluating the Las Vegas Cash-for-Grass Rebate Program; Harvard Environmental Economics Program: Cambridge, MA, USA, 2017. [Google Scholar]
- Tucson Water. Harvesting Rainwater: Guide to Water-Efficient Landscaping; Tucson Water: Tucson, AZ, USA, 2013. Available online: https://www.tucsonaz.gov/files/water/docs/Rainwater_Harvesting_Guide.pdf (accessed on 17 September 2020).
- Tucson Water. Water Conservation Program; FY 2017-18 Annual Report; Tucson Water: Tucson, AZ, USA, 2018. Available online: www.tucsonaz.gov/files/water/docs/FY17-18_TW_Conservation_Report_FINAL.pdf (accessed on 3 August 2020).
- Zerrenner, K.; Rambarran, J. Examining Conservation-Oriented Water Pricing and Programs through an Energy Lens: An Analysis of the Energy Savings Associated with Water Demand Reductions; Environmental Defense Fund: New York, NY, USA, 2017; Available online: http://blogs.edf.org/energyexchange/files/2017/12/conservation-rates-white-paper-Final.pdf (accessed on 3 August 2020).
- Zetland, D. The End of Abundance: Economic Solutions to Water Scarcity; Aguanomics Press, Internet Archive: San Francisco, CA, USA, 2011. [Google Scholar]
- Baerenklau, K.A.; Schwabe, K.A.; Dinar, A. Do Increasing Block Water Budgets Reduce Residential Water Demand? A Case Study in Southern California; Water Science Policy Center, University of California at Riverside: Riverside, CA, USA, 2013; Available online: https://www.financingsustainablewater.org/sites/www.financingsustainablewater.org/files/resource_pdfs/WSPC-%282013%29-Do-Increasing-Block-Rate-Water-Budgets-Reduce-Water-Use.pdf (accessed on 3 August 2020).
- Peer, R.A.M.; Sanders, K.T. The water consequences of a transitioning US power sector. Appl. Energy 2018, 210, 613–622. [Google Scholar] [CrossRef]
- Voisin, N.; Tidwell, V.; Kintner-Meyer, M.; Boltz, F. Planning for sustained water-electricity resilience over the U.S.: Persistence of current water-electricity operations and long-term transformative plans. Water Secur. 2019, 7. [Google Scholar] [CrossRef]
- Cherchi, C.; Kesaano, M.; Badruzzaman, M.; Schwab, K.; Jacangelo, J.G. Municipal reclaimed water for multi-purpose applications in the power sector: A review. J. Environ. Manag. 2019, 236, 561–570. [Google Scholar] [CrossRef]
- Austin Energy. Austin Energy Annual Performance Report; Austin, TX, USA, 2016. Available online: https://austinenergy.com/wcm/connect/c2482473-945f-4d7d-81a2-0574df12f1cd/2016AnnualPerformanceReport.pdf?MOD=AJPERES&CVID=mNOMqLC (accessed on 3 August 2020).
- World Economic Forum. The Global Risks Report 2019; World Economic Forum: Geneva, Switzerland, 2019; Available online: https://www.weforum.org/reports/the-global-risks-report-2019 (accessed on 3 August 2020).
- CDP. Treading Water: Corporate Responses to Rising Water Challenges; CDP: London, UK, 2018; Available online: https://6fefcbb86e61af1b2fc4-c70d8ead6ced550b4d987d7c03fcdd1d.ssl.cf3.rackcdn.com/cms/reports/documents/000/004/232/original/CDP_Global_Water_Report_2018.pdf?1554392583 (accessed on 3 August 2020).
- Engen, J. Water: Its values and risks. Global Finance. 9 December 2019. Available online: https://www.gfmag.com/magazine/december-2019/water-its-value-and-risks (accessed on 3 August 2020).
- Alliance for Water Stewardship (AWS). International Water Stewardship Standard; Version 2.0; AWS: North Berwick, Scotland, 2019; Available online: https://a4ws.org/the-aws-standard-2-0/ (accessed on 3 August 2020).
- Hardcastle, J.L. Coca-Cola CEO: Reducing Water Use Inside Our Operations Isn’t Enough. Environment + Energy Leader. 31 August 2016. Available online: https://www.environmentalleader.com/2016/08/coca-cola-ceo-reducing-water-use-inside-our-operations-isnt-enough/ (accessed on 3 August 2020).
- San Antonio Water System. 5-Year Water Conservation Plan; SAWS: San Antonio, TX, USA, 2019; Available online: https://www.saws.org/conservation/conservation-conservation-plan/ (accessed on 3 August 2020).
- City of Santa Cruz. Water Conservation Master Plan; City of Santa Cruz: Santa Cruz, CA, USA, 2017; Available online: http://www.cityofsantacruz.com/home/showdocument?id=58962 (accessed on 3 August 2020).
- Cahill, R.; Lund, J. Residential water conservation in Australia and California. J. Water Resour. Plan. Manag. 2013, 139, 117–121. [Google Scholar] [CrossRef] [Green Version]
- Richter, B. A water plan for the 21st Century. Sustainable Waters: Crozet, VA, USA, 2019. Available online: https://www.sustainablewaters.org/a-water-plan-for-the-22nd-century/ (accessed on 3 August 2020).
- Garcetti, E. Mayor Garcetti: Los Angeles Will Recycle 100% of City’s Wastewater by 2035; Office of Los Angeles Mayor Eric Garcetti: Los Angeles, CA, USA, 2019; Available online: https://www.lamayor.org/mayor-garcetti-los-angeles-will-recycle-100-city’s-wastewater-2035 (accessed on 3 August 2020).
- Richter, B. Chasing Water: A Guide for Moving from Scarcity to Sustainability; Island Press: Washington, DC, USA, 2014. [Google Scholar]
- Richter, B.D.; Brown, J.D.; DiBenedetto, R.; Gorsky, A.; Keenan, E.; Madray, C.; Morris, M.; Rowell, D.; Ryu, S. Opportunities for saving and reallocating agricultural water to alleviate scarcity. Water Policy 2017. Available online: https://www.researchgate.net/publication/315956185_Opportunities_for_saving_and_reallocating_agricultural_water_to_alleviate_water_scarcity (accessed on 24 August 2020). [CrossRef] [Green Version]
- Debaere, P.; Richter, B.D.; Davis, K.F.; Duvall, M.S.; Gephart, J.A.; O’Bannon, C.E.; Pelnik, C.; Powell, E.M.; Smith, T.W. Water markets as a response to scarcity. Water Policy 2014, 16, 625–649. [Google Scholar]
Figure 1.
Historical traces of available water and actual use shown here refer to the natural supply of surface water from the Colorado River and the consumptive use of that water over time. The Colorado River Basin Water Supply and Demand Study conducted by the US Bureau of Reclamation in 2012 included water demand forecasts through 2060, based upon scenarios ranging from slow to rapid population growth [2]. It is now evident that this demand forecasting did not adequately account for recent downward trends in water consumption (historical estimates of available water and total consumptive use from US Bureau of Reclamation [3]).
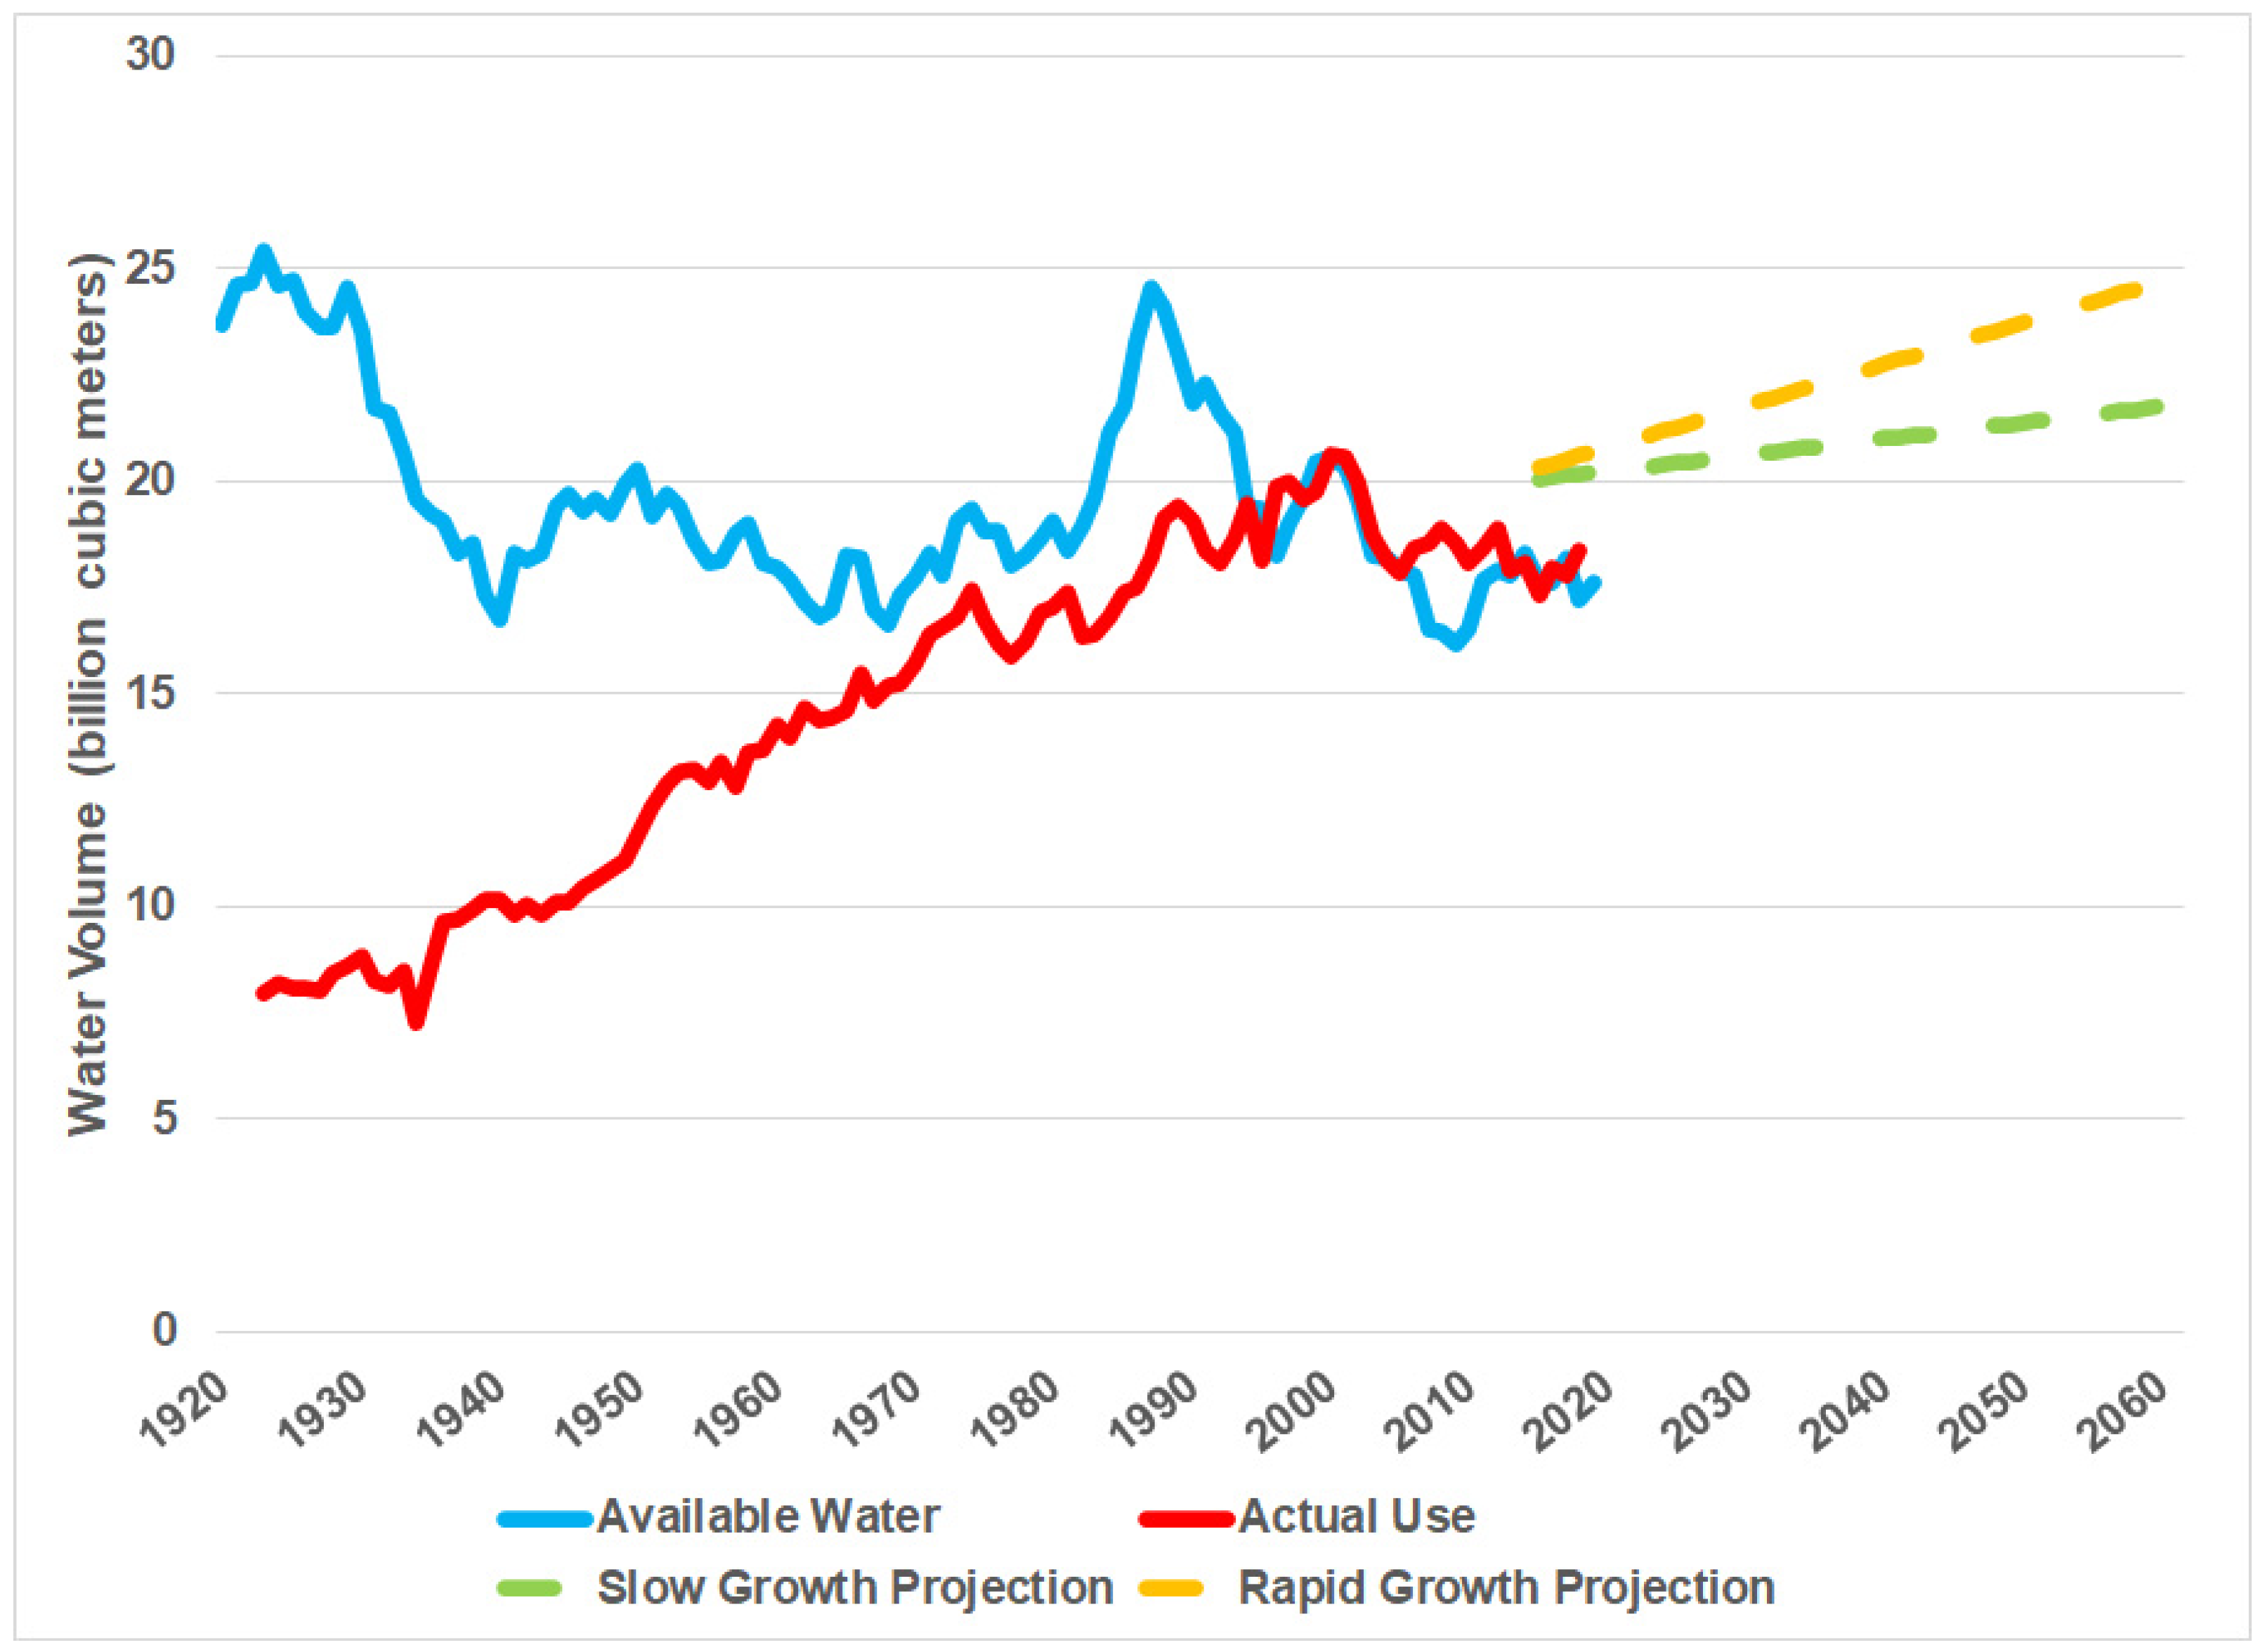
Figure 2.
Twenty urban water utilities in the western US were surveyed in this study. Cities served with water from the Colorado River basin are indicated by blue dots. All cities are identified by name and state in Table 1.
Figure 2.
Twenty urban water utilities in the western US were surveyed in this study. Cities served with water from the Colorado River basin are indicated by blue dots. All cities are identified by name and state in Table 1.
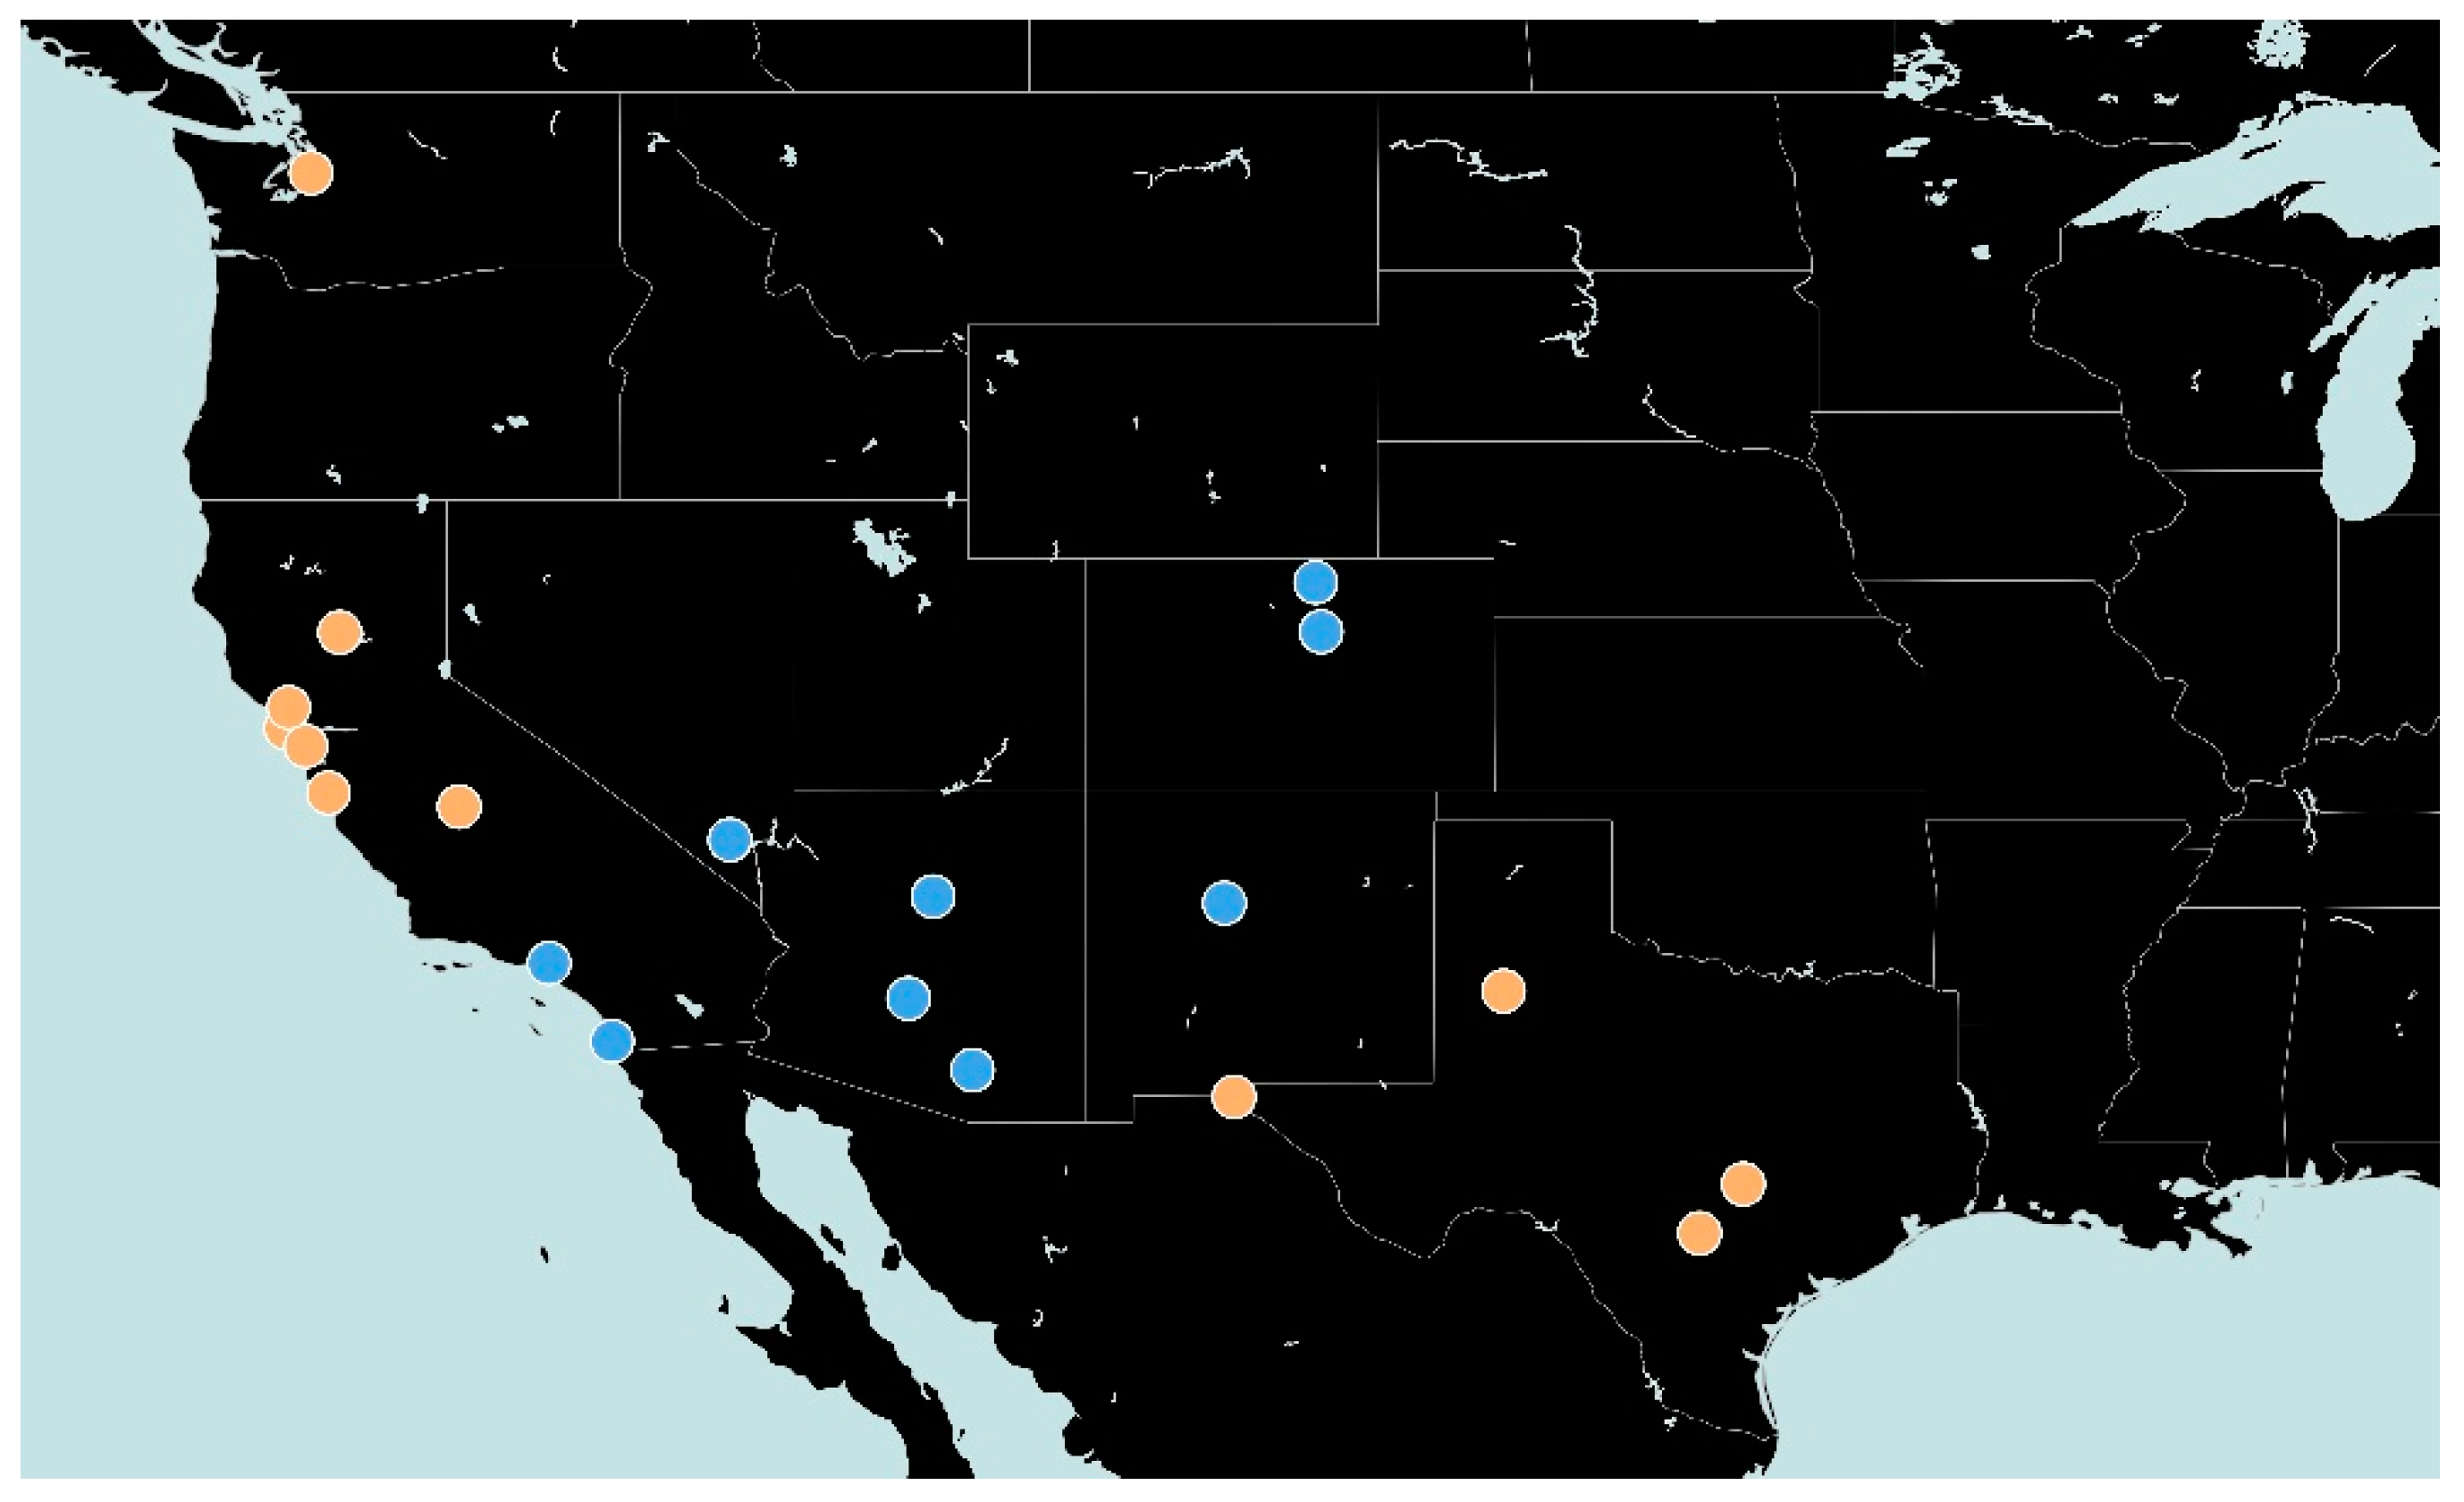
Figure 3.
An illustration of ‘passive’ rainwater harvesting (left), in which rainwater is directly channeled to landscape areas, and ‘active’ systems (right) involving storage infrastructure such as a tank or cistern (adapted from [23]; reprinted with permission).
Figure 3.
An illustration of ‘passive’ rainwater harvesting (left), in which rainwater is directly channeled to landscape areas, and ‘active’ systems (right) involving storage infrastructure such as a tank or cistern (adapted from [23]; reprinted with permission).

Figure 4.
The San Antonio Water System has implemented more than 30 different conservation strategies over the past 25 years, enabling the utility to reduce total per-capita water use by 26% [37]. This chart illustrates inter-annual progress made in reducing total per-capita water use and the years during which some of their most important strategies were implemented (illustration provided by San Antonio Water System).

Table 1.
Summary of survey results.
| City | Service Population 2015 | Population Increase 2000–2015 1 | Change in Gross Domestic Product (GDP) 2001–2015 | Change in Total LPCD 2000–2015 1 | Change in Residential LPCD 2000–2015 1,2 | Total Water Use 2000–2015 1 | Period of Record Obtained |
|---|---|---|---|---|---|---|---|
| Albuquerque, New Mexico | 658,238 | +38% | +51% | −48% | −47% | −28% | 2000–2018 |
| Austin, Texas | 977,491 | +32% | +121% | −37% | −17% | 1995–2017 | |
| Chico, California | 102,155 | +20% | +75% | −44% | −44% | −32% | 2000–2018 |
| Denver, Colorado | 1,210,000 | +17% | +69% | −38% | −44% | −28% | 1997–2016 |
| El Paso, Texas | 224,656 | +36% | +88% | −30% | −32% | −6% | 2000–2019 |
| Flagstaff, Arizona | 70,000 | +13% | +79% | −31% | −27% | −22% | 1980–2019 |
| Fort Collins, Colorado | 131,600 | +6% | +82% | −19% | −25% | −14% | 2002–2018 |
| Fresno, California | 525,575 | +18% | +92% | −40% | −29% | 1990–2015 | |
| Las Vegas, Nevada | 2,079,946 | +52% | +85% | −37% | −4% | 1994–2017 | |
| Los Angeles, California | 4,011,023 | +8% | +74% | −29% | −23% | 1970–2018 | |
| Lubbock, Texas | 237,712 | +21% | +80% | −34% | −20% | 1930–2017 | |
| Phoenix, Arizona | 1,547,331 | +16% | +75% | −27% | −28% | −15% | 1990–2017 |
| San Antonio, Texas | 1,743,559 | +56% | +100% | −23% | −24% | +21% | 2001–2018 |
| San Diego, California | 3,146,771 | +12% | +84% | −31% | −24% | −22% | 1990–2015 |
| San Francisco, California | 866,583 | +11 | +85% | −34% | −34% | −26% | 1984–2017 |
| Santa Cruz, California | 96,493 | +12% | +63% | −45% | −46% | −40% | 2000–2018 |
| San Rafael, California | 189,000 | +4% | +85% | −24% | −22% | −21% | 1998–2015 |
| Santa Rosa, California | 175,693 | +20% | +66% | −43% | −42% | −32% | 1990–2018 |
| Seattle, Washington | 1,399,468 | +15% | +100% | −24% | −30% | −12% | 1975–2016 |
| Tucson, Arizona | 718,898 | +13% | +53% | −28% | −28% | −18% | 2000–2017 |
1 Data were not available for the entirety of our 2000–2015 focal period in two of our cities listed above (Fort Collins and San Antonio); we therefore used whatever data were available within the focal period. 2 Residential water use was not obtained for all cities.
Publisher’s Note: MDPI stays neutral with regard to jurisdictional claims in published maps and institutional affiliations. |
© 2020 by the authors. Licensee MDPI, Basel, Switzerland. This article is an open access article distributed under the terms and conditions of the Creative Commons Attribution (CC BY) license (http://creativecommons.org/licenses/by/4.0/).
Share and Cite
MDPI and ACS Style
Richter, B.D.; Benoit, K.; Dugan, J.; Getacho, G.; LaRoe, N.; Moro, B.; Rynne, T.; Tahamtani, M.; Townsend, A. Decoupling Urban Water Use and Growth in Response to Water Scarcity. Water 2020, 12, 2868. https://doi.org/10.3390/w12102868
AMA Style
Richter BD, Benoit K, Dugan J, Getacho G, LaRoe N, Moro B, Rynne T, Tahamtani M, Townsend A. Decoupling Urban Water Use and Growth in Response to Water Scarcity. Water. 2020; 12(10):2868. https://doi.org/10.3390/w12102868
Chicago/Turabian StyleRichter, Brian D., Kendall Benoit, Jesse Dugan, Gabriella Getacho, Natalie LaRoe, Bailey Moro, Tyler Rynne, Maria Tahamtani, and Allen Townsend. 2020. "Decoupling Urban Water Use and Growth in Response to Water Scarcity" Water 12, no. 10: 2868. https://doi.org/10.3390/w12102868
Note that from the first issue of 2016, this journal uses article numbers instead of page numbers. See further details here.