Article

From Highs to Lows: Changes in Dissolved Organic Carbon in a Peatland Catchment and Lake Following Extreme Flow Events

1
Centre for Freshwater and Environmental Studies, Dundalk Institute of Technology, A91 K584 Dundalk, Ireland
2
Newport Research Facility, Fisheries & Ecosystem Advisory Services, Marine Institute, Newport, F28 PF65 Co. Mayo, Ireland
3
Centre for the Environment, Trinity College Dublin, Dublin 2, Ireland
4
Lakeland Instrumentation Ltd., Grange-Over-Sands LA11 7HA, UK
5
Department of Ecology and Genetics—Limnology, Uppsala University, 75236 Uppsala, Sweden
*
Author to whom correspondence should be addressed.
Water 2020, 12(10), 2843; https://doi.org/10.3390/w12102843
Submission received: 15 August 2020 / Revised: 22 September 2020 / Accepted: 8 October 2020 / Published: 13 October 2020
(This article belongs to the Special Issue Effect of Extreme Climate Events on Lake Ecosystems)

Abstract

:
The concentration of dissolved organic carbon (DOC) in freshwater catchments has implications for carbon availability in downstream lakes and for water supplies. The links between catchment hydrology and stream and lake DOC concentrations are, however, still not fully understood. Much of the literature has been from catchments with organo-mineral soils, with fewer studies from upland peat sites. We used high-frequency fluorescence data, a proxy for DOC, to investigate 1. the relationship between stream discharge and concentration in a blanket peat catchment during extreme high flows and 2. the relationship between inflow and in-lake estimated DOC concentrations. We found that for approximately two thirds of extreme events, there was a decrease in stream DOC concentration (i.e., a dilution) on the rising limb rather than an increase (i.e., a flushing out of DOC from terrestrial stores). Flushing events dominated only in summer when concentrations in the stream were also increasing. In comparison to the stream, concentrations in the downstream lake were less variable, and peaks and troughs were damped and lagged. Replicating these patterns and processes in DOC models would be critical in order to provide appropriate simulations in response to shorter- and longer-term changes in climate, and thus inform future catchment and lake management.

1. Introduction

The concentrations of dissolved organic matter (DOM) in surface waters have come under increased scrutiny in recent years due to reports of upward trends in many regions [1,2,3,4]. The DOM in surface waters arises predominantly from the decomposition of organic matter in catchment soils. It has been estimated that about 1500 Pg of carbon are stored in soil organic matter globally and that in warm moist temperate regions, soil organic carbon represents 68% of the total terrestrial organic carbon pool [5]. Changes in riverine and lake DOM concentrations, usually quantified as dissolved organic carbon (DOC), have implications both for carbon supply to downstream aquatic systems and global carbon cycling. There are also implications for the treatment of drinking water supplies, as DOM reacts with chlorine used as a disinfectant during water treatment to form a range of toxic by-products. Understanding the movement of carbon through freshwater systems is critical for the identification of uncertainties in global carbon budget estimations [6], while removal of DOM from water sources remains a major challenge in drinking water treatment [7]. Despite the increasing number of studies, however, the main factors that control DOC concentrations in surface waters have still not been fully resolved [8]. In particular, while much of the literature has emphasized a positive relationship between stream discharge rates and DOC concentrations i.e., where there is a flushing of DOC from the peat soil and a subsequent increase in stream concentrations [9,10,11,12], other studies have reported no increases at higher discharge rates, or even a decrease (i.e., a dilution) in stream DOC levels [13,14]. Greater insight into when dilution dominates over flushing in a given system, and when and why both dilution and flushing events occur, is fundamental for understanding the aquatic carbon cycle, and in particular the supply of carbon to downstream lakes.
As highlighted by Clark et al. [13], most of the studies that have reported flushing effects have been from catchments with organo-mineral or mixed soil types. Raymond and Saiers [10], for example, conducted a meta-analysis of data from 30 eastern United States watersheds and reported that there was a clear increase in DOC concentration during hydrologic events across the catchments. They estimated that 86% of DOC was exported during such events. Hinton et al. [9] reported that stream DOC concentrations increased during storms by as much as 100% and 410% in a study of seven small catchments in Canada, and that, in one catchment, a single storm accounted for 30% of the annual DOC export. More recently, Koenig et al. [12] also reported that DOC concentration had a positive response to increased flow in a study in a forested catchment in the eastern USA. In contrast in peat catchments, Clark et al. [14] noted that when soils are saturated, water associated with both high and low flows will generally travel through highly organic soil layers where DOC is produced. Stream water DOC concentration in such systems may, therefore, not show any increase/decrease during high discharge as there is no switch in flow paths between organic and mineral layers. Holden et al. [15] have also proposed that natural pipes in upland peat systems can also actually act as major point sources for the release of carbon. Point sources generally have relatively constant concentrations of dissolved ions during baseflow, with a typical pattern of decreases in concentrations during the highest flows. Natural pipes in peat are associated with very rapid and flashy flow in response to rainfall, allowing water to be carried rapidly through them with little interaction with the peat soil matrix.
In their own study of an upland peat catchment in the UK, Clark et al. [14] reported a negative relationship between streamflow and DOC concentration which they attributed to dilution of DOC-rich soil water from the peat by rainfall. Not all studies from upland peat catchments report such dilutions during high discharge, however. Austnes et al. [16] in a study in a catchment in Wales (UK) reported that DOC concentrations increased during three storm events by 16%, 44% and 89% relative to base flow and concluded that the flow pathways in their study system were not similar to those described by Clark et al. [14]. It is notable, however, that the dataset did not include a full annual cycle. Kohler et al. [17] reported seasonal differences in the relationship between stream discharge and DOC in a peat catchment in Ireland over one year, and found that concentration appeared to be independent of flow during colder months, with then either increases in concentration or no change during warmer months. Differences in the relationship between concentration and discharge have also been linked to proximity to the peat source [18], for example, DOC concentrations at a headwater site draining a small peatland site (an area of 0.65 ha) were found to not usually increase on the rising limb of the hydrograph, although in some events, a slight dilution was observed. In contrast, in the same study, increases on the rising limb of stream discharge were observed at a downstream site that had a lower percentage area of peat soil in the upstream catchment.
Exploring the relationships between catchment hydrology and DOC levels in rivers and downstream lakes, including during extreme floods and in periods of baseflow, requires monitoring at sub-daily intervals. Automated high-frequency monitoring (HFM) of rivers and lakes can be used to capture the required detailed data for such analysis [17,19]. The Burrishoole catchment in northwest Ireland has had an automated monitoring platform on its main lake (Lough Feeagh) since the late 1990s and an instrumented platform on one of the main inflows, the Glenamong River, since 2003. The instruments deployed include sensors measuring chromophoric dissolved organic matter (CDOM) fluorescence, a proxy for DOC. Previous studies using CDOM data [19] and water color data [20] from the catchment have highlighted the importance of soil temperature in driving a strong seasonal cycle in river water DOC concentrations. Ryder et al. [19] also identified a statistically significant step change in DOC concentration for the Glenamong site in 2010 in response to an early summer drought. While an overall significant relationship between DOC concentration and stream discharge was identified in both studies [19,20], it was non-linear and plateaued as discharge increased. Earlier analysis of high-frequency data from the same site had noted that high stream discharge resulted in increases in CDOM levels in autumn, but in decreases in the following February [4]. The authors suggested that these decreases indicated a depletion of DOC in the active flow pathways in the peat soil as the wetter winter period progressed. Such changes will have implications for carbon availability in downstream rivers and lakes.
Despite the increased availability of HFM data as a proxy of DOC concentration, many studies to date have described only selected storms [16], or selected seasons [21,22]. While a few have analyzed data from a complete annual cycle [18], none have compared data for all storm events over multiple years. These data can also inform more accurate and reliable models of DOC behavior in humic systems. Using estimated DOC concentration (based on CDOM data) for the Glenamong River, and downstream Lough Feeagh, we have explored the relationship between stream discharge and both inflow and in-lake DOC concentrations. Based on other studies [13,14,23], we hypothesized that flushing events would be the dominant driver of changes in stream DOC concentrations and export to the lake during summer and autumn, but that dilution events would begin to dominate in the early winter as soil DOC stores were depleted. We also expected that variation in DOC would be greater in the stream than in the downstream lake due to integration of the signal over time within the lake. Our specific aims were to 1. describe the relationship between DOC and discharge for the inflow stream; 2. identify any temporal pattern in the occurrence of dilution and concentration events and assess how such patterns differed in wetter and drier years; and 3. illustrate the relationship between inflow DOC concentrations and loading to the lake, and in-lake DOC concentrations. We also aimed to show the usefulness of HFM data for gaining insights into the processes that drive changes in DOC in surface waters and thus inform both lake and catchment management and model development.

2. Materials and Methods

2.1. Site Description

The Glenamong River is one of two main inflows into Lough Feeagh located in the Burrishoole catchment in the west of Ireland (53°56′50″ N, 9°34′30″ W) (Figure 1). The sub-catchment (total area 18.21 km2) is comprised of 77% upland peat, 23% plantation forestry with small pockets of transitional woodlands and scrub [20]. The main land use in the Glenamong sub-catchment is extensive sheep grazing on commonage. The steep slopes result in a hydrological system with a rapid reaction time to precipitation events. The area experiences a moderate climate due to its close proximity to the Atlantic Ocean. The air temperature rarely goes above 25 °C in the summer or below −5 °C in the winter, and snowfall is occasional and does not occur in every year. The annual precipitation in the Glenamong sub-catchment is relatively high, with an annual average for the study period (based on three rain gauges from that sub-catchment) of 2004–2011 of 2063 mm year−1. The river and downstream lake (Lough Feeagh) are characterized by high levels of water color, high DOC concentrations, and relatively low levels of nutrients and phytoplankton biomass [24]. Lough Feeagh has a surface area of 3.95 km2, a maximum depth of 46 m, a mean depth of 14.5 m, an estimated volume of 5.9 × 10⁷ m3, an average retention time of 172 days, and an area of 89.5 km2 [24]. The lake is oligotrophic and humic and drains into a coastal lagoon (Lough Furnace) that subsequently drains into the Atlantic Ocean.

2.2. In Situ Monitoring of CDOM Fluorescence

Estimates of in-stream DOC concentration were calculated using data from in situ high-frequency sensors measuring CDOM fluorescence. These were situated on a site on the Glenamong River at a location 150 m upstream of the inflow to Lough Feeagh as a component of an automatic river monitoring station (upstream catchment 17.60 km2). The monitoring point on Lough Feeagh was on an automatic water quality monitoring station deployed above the deepest point of the lake. A CDOM sensor was first installed at the Glenamong site in 2003, with a second, replacement sensor deployed in 2008. Data for the first sensor on the Glenamong (referred to as G1) were available from August 2003 to May 2008, with some gaps. Data were available from the second sensor (G2) from September 2008 to November 2011 at the same site, again with some gaps. The sensor on Lough Feeagh was first deployed in March 2010 (referred to as F1). Data from that sensor used in this study ran from 5 March 2010 to 26 December 2011. All three sensors were Seapoint CDOM UV fluorometers (http://www.seapoint.com/suvf.htm; Seapoint Sensors Inc., Exeter, NH, USA). The Glenamong sensors were deployed in the stream so that they were continuously submerged, while the sensor on the lake was deployed at a depth of 1 m. All measured CDOM fluorescence every two minutes (mV). Water temperature was measured at the stream site with a Hydrolab Quanta (Hydrolab Corporation, Austin, TX, USA). Water temperature in Lough Feeagh was measured with a Hydrolab Data Sonde 5X (www.ott.com, OTT Hydrometry Ltd., Sheffield, UK). All data were logged and stored by a Campbell Scientific CR1000 data logger (https://www.campbellsci.com) (Campbell Scientific Inc, Logan, UT, USA). The Seapoint CDOM fluorometers used UV light emitting diodes (LEDs) as the CDOM excitation source (Ex 370 nm CWL, 12 nm FWHM; Em 440 nm CWL, 40 nm FWHM, where CWL is the center wavelength and FWHM is the full width at half maximum wave height). The instrument gain was set to 1 for all measurements. Assessment of instrument performance was carried out at regular intervals using a quinine sulphate standard as recommended by the manufacturers (1 QSU = 1 μg quinine sulphate L−1). The river sensors were cleaned on a ca. weekly basis, and the lake sensor was cleaned at least every month. All data were quality controlled before further processing to remove any spurious data generated during routine maintenance. A drift correction was applied between cleaning events using OTT HYDRAS 3 (Version: V 4.00.0) software (www.ott.com; OTT HydroMet, Kempten, Germany). The full dataset for the stream from 2003 to 2011 had gaps where the system was damaged during high flows in this upland river site and needed repair or replacement. Data for the most complete years, 2004, 2006 and 2010–2011, were used in the current study.

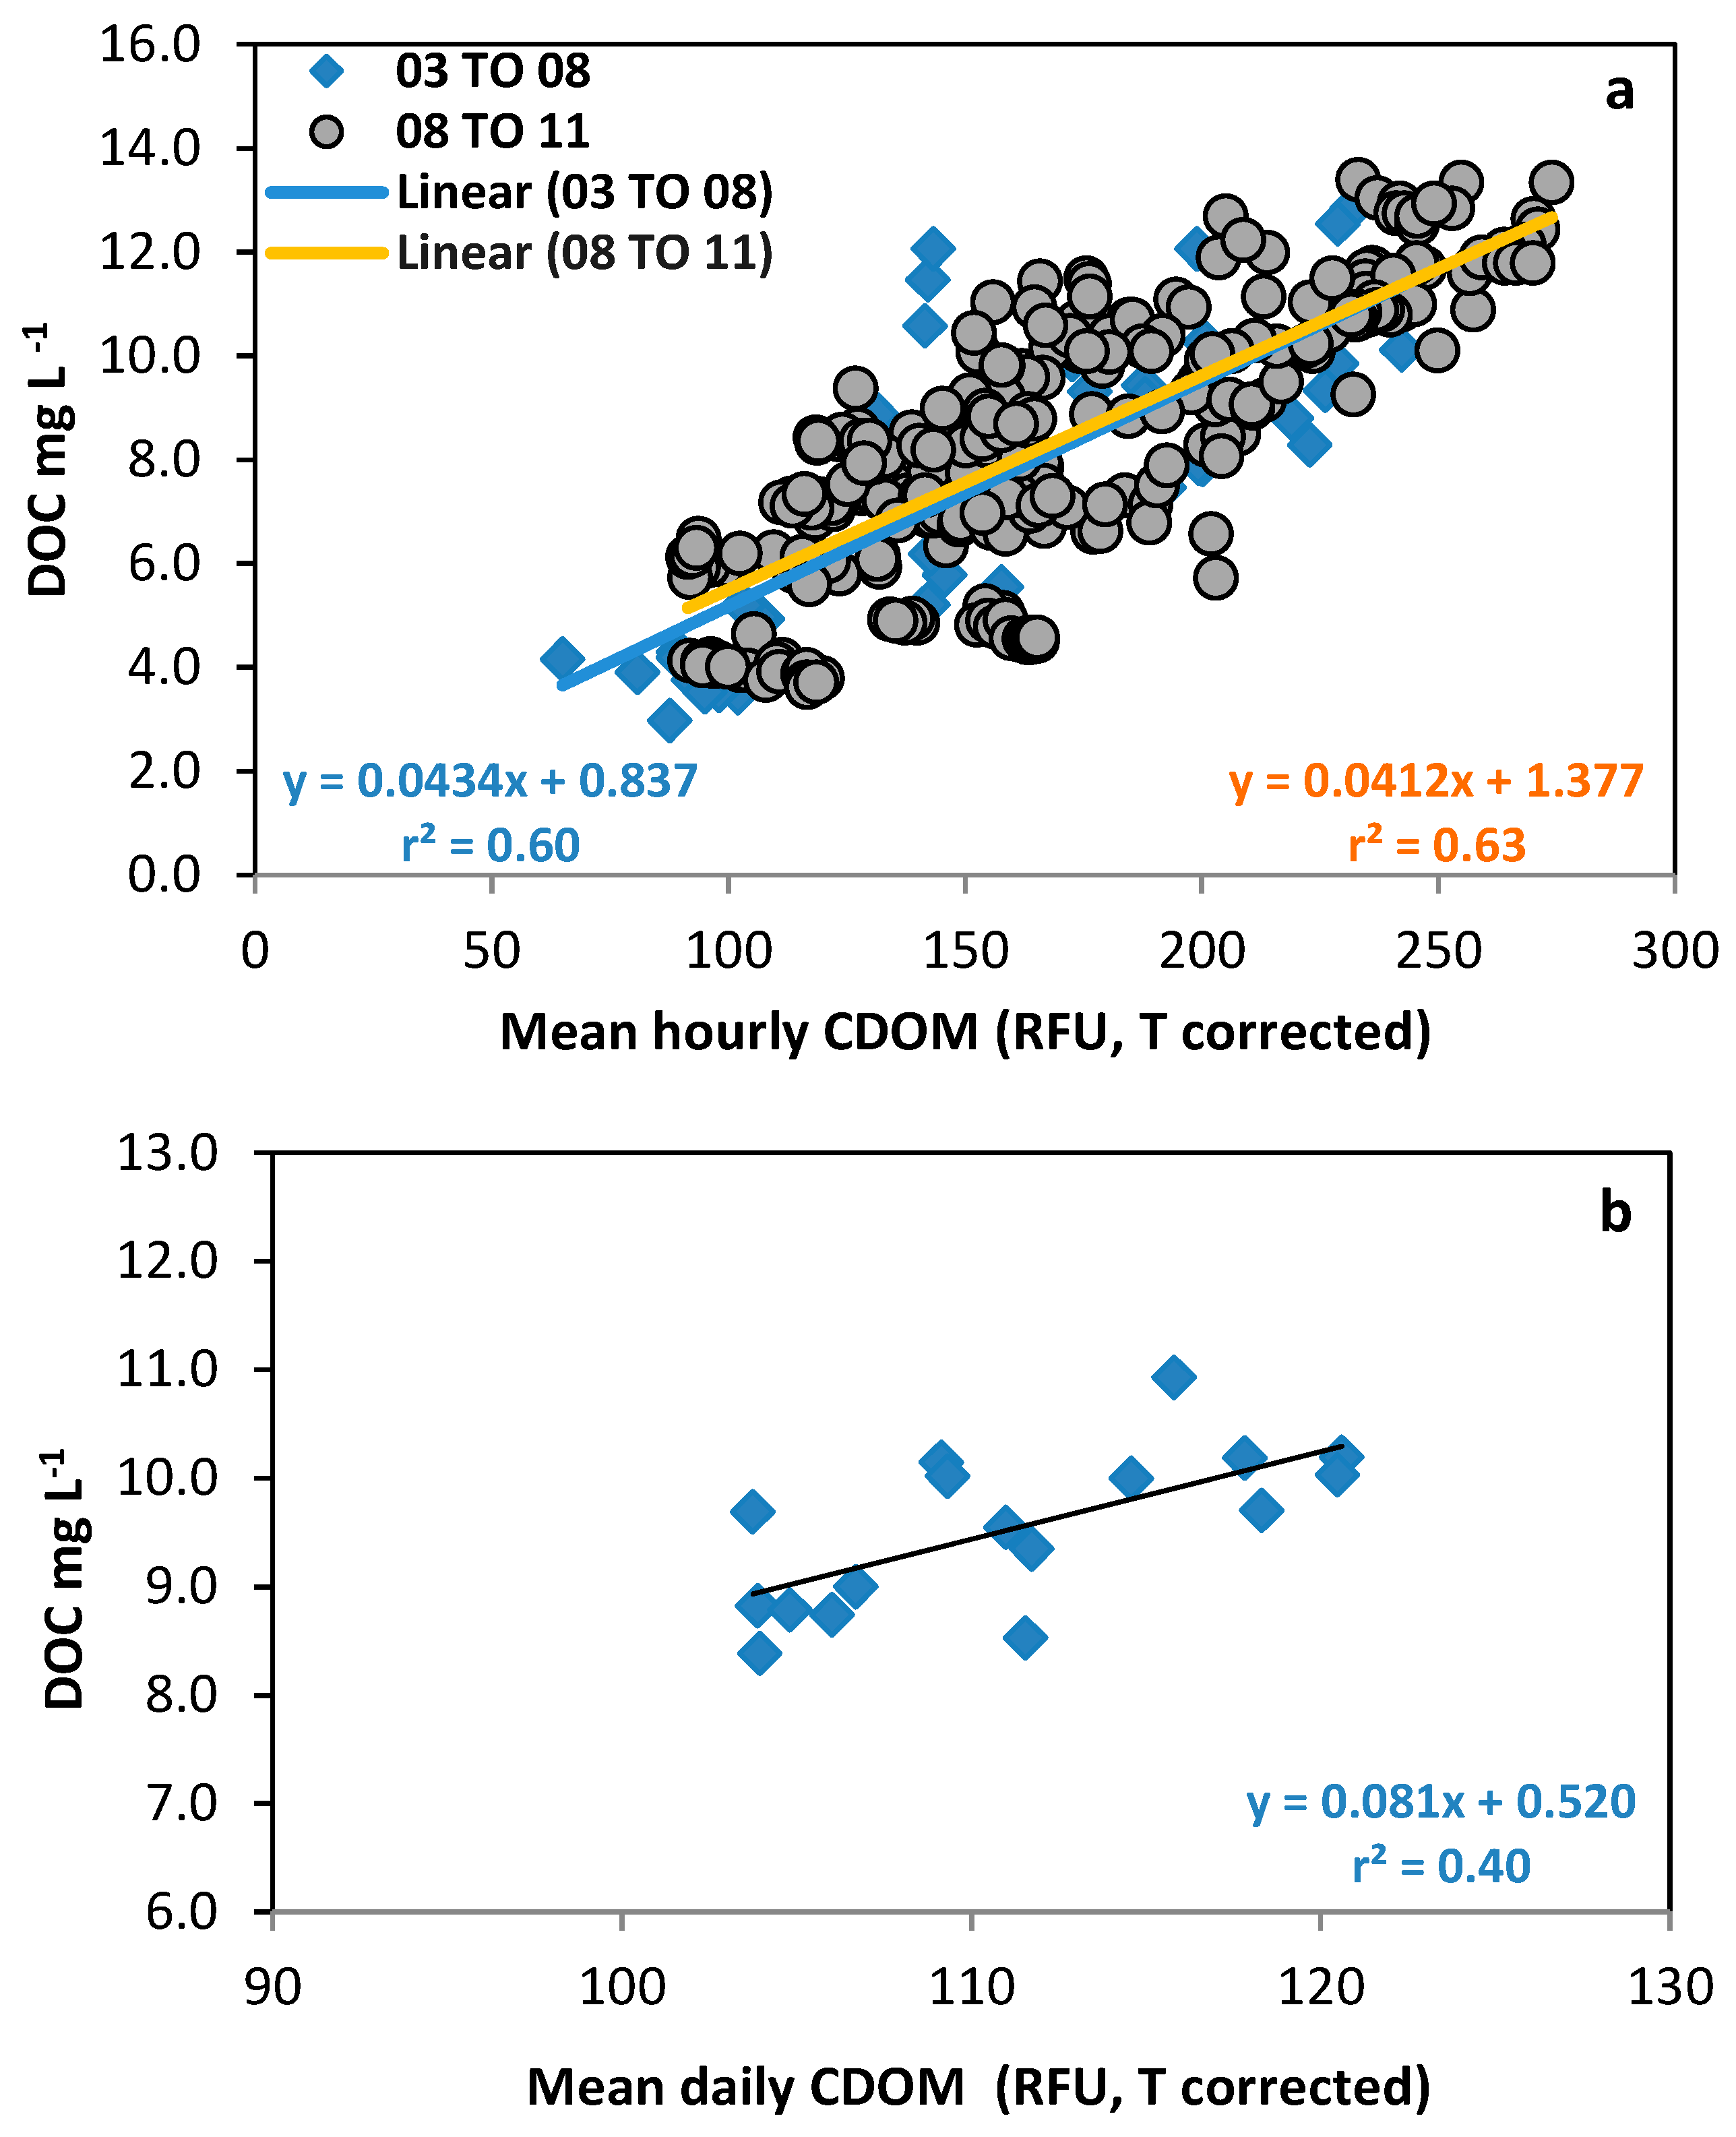
2.3. Data Processing Including Conversion of CDOM to Estimated DOC

The fluorometer output in mV was first corrected for the fluorescence reading of that sensor when deployed in distilled deionized water (31 mV for G1; 48 mV for G2, 18 mV for F1), referred to as a clear-water offset. The clear water-offset corrected mV reading was then corrected for the quenching effect of temperature [25,26]. Ryder et al. [26] reported monthly temperature correction coefficients for both the stream and the lake for 2010–2011 which varied between months. To incorporate this month-to-month variability into the corrections but avoiding jumps in the coefficient at the end of any month, an interpolated correction coefficient was calculated for each Julian Day using the monthly data slope and intercept values [26]. This calculation used generalized additive models with either slope or intercept as the dependent variable, and Julian Day as the independent variable, to predict daily values. The predicted slope and intercept values for each Julian Day were then used to calculate a daily correction coefficient, which was finally applied to all hourly values in that day.
Downing et al. [27] have previously reported a decline in fluorescence yield for CDOM fluorescence sensors during periods of high turbidity. To assess the potential effect of turbidity levels on CDOM fluorescence yield from the Seapoint sensors, we undertook a laboratory experiment using the CDOM fluorometer that was deployed in the Glenamong from 2008–2011 (G2). This was immersed in water samples spiked with serial dilutions of a HACH Formazin Turbidity standard (4000 NTU (Nephelometric Turbidity Units)). The results indicated a very low decline of 0.098% per NTU in the fluorescence yield. We then compiled data from a Chelsea Technologies Minitracka MkII nephelometers (www.chelsea.co.uk, Chelsea Technologies Group Ltd., West Molesey, UK), installed at the study sites for the period 2010–2011. Data were converted from mV to NTU using a rating curve based on serial dilutions of the same turbidity standard. While the maximum turbidity level recorded in the Glenamong was 56 NTU, 95% of daily mean values were less than 3 NTU and 99% of values were less than 20 NTU. Values in the lake in the same period were always <7 NTU. We therefore did not include a correction for turbidity to the data used in this study.
Hourly mean temperature corrected fluorescence data were converted to estimated DOC concentration (mg DOC L−1) based on separate calibration equations established using measured DOC data and corrected CDOM data from 2004 to 2005 (G1), from 2010 to 2011 (G2) and for the lake from 2010–2011 (F1) (Figure 2). The measured DOC data for equations 1 to 3 below were from water samples taken at the site which were analyzed in the laboratory within 48 h. All samples were taken using pre-rinsed amber glass bottles and were filtered on-site using Whatman GF/C filters before total organic carbon analysis. The DOC data for G1 (equation 1) were analyzed using a Shimadzu Total Organic Carbon (TOC) analyzer, while the DOC data for G2 (equation 2) and F1 (equation 3) were measured on a Sievers TOC Analyzer (model 5310) which had an operational range from 4 ppb to 50 ppm and accuracy of ±2% or 5% ppb. For both instruments, samples were first acidified to remove any dissolved inorganic carbon using the manufacturers’ protocols. The Sievers TOC Analyzer was calibrated using manufacturer standards. In both cases, blank (MilliQ water) and 10 mg C L−1 standards were included as instrument checks in each run.
Relationships were established using linear regression. Similar equations for the relationship between DOC concentration and temperature corrected CDOM levels were obtained for each calibration period for the two stream sensors, notwithstanding the difference in sensors, in carbon analyzers, and in the total number of samples (G1: n = 47 (August 2003 to September 2005); G2 n = 409 (December 2010 to September 2011) (Figure 2a). The data available for the Feeagh site were sparser (17 days between December 2010 to September 2011), and the range of concentrations was also much lower (Figure 2b). For all three sensors, there was a small offset indicating that the water contained some DOC that was not fluorescent:
DOC = 0.0434 × CDOM + 0.837 (n = 47; r2 = 0.60)
DOC = 0.0412 × CDOM + 1.377 (n = 409, r2 = 0.63)
DOC = 0.081 × CDOM + 0.5272 (n = 17, r2 = 0.44)

2.4. Stream Discharge and Meteorological Data

The water level at the same location where the CDOM was deployed on the stream was recorded every fifteen minutes using an Orpheus Mini water level logger (www.ott.com; OTT HydroMet, Kempten, Germany). These data were converted to discharge (m3 s−1) using a rating curve for the study site (r2 = 0.98, Marine Institute unpublished data). Precipitation was measured using Davis Raincollector II tipping buckets (www.davisnet.com, Davis Instruments Corp., Hayward, CA, USA) and Hobo event loggers (www.onsetcomp.com, Onset, Bourne, MA, USA) located within the Glenamong sub-catchment. There were stream discharge data available for all hourly timesteps for each of the three years. Hourly mean stream discharge data for the site were split into two datasets comprising: 1. baseflow dominated periods and 2. periods when there was a runoff component, using a baseflow separation equation [28]. These two derived time series were then used to categorize the hourly stream DOC concentration data as either baseflow-associated or runoff-associated. CDOM data, and therefore estimated DOC concentration, were missing for 16%, 3% and 11% of timesteps for 2004, 2006 and 2010 respectively. Dissolved organic carbon loads for each hourly timestep where data were available were calculated as the product of hourly discharge and estimated DOC concentration for both 1. runoff-associated and 2. baseflow-associated hourly time steps, and 3. for all time steps. These discharge and load data were used to estimate the percentage of time during which DOC export was related to discharge where either baseflow or to runoff dominated. For the estimation of the annual loads only, missing estimated DOC concentration data were filled by interpolation.

2.5. Change in DOC Concentration during Extreme Discharge Events

Extreme discharge events were defined as any event where hourly mean discharge was greater than the 90th percentile of discharge, commonly referred to as the Q10 [29] for at least one hour. The Q10 was based on the mean hourly discharge data for the Glenamong River for the period from 1 Jan 2004 to 31 Dec 2011 (1.90 m3 s−1). For each event, the start time was defined by an increase in discharge of more than 20% above preceding baseflow conditions. The end was defined by either a return to baseflow conditions or when discharge began to rise again if another storm occurred before the system had returned to baseflow [30]. The change in estimated DOC concentration (ΔC) during the rising limb was calculated as difference between the concentration at the peak of the storm hydrograph and the concentration just prior to the start of the event [31]. Negative ΔC values indicated a dilution of DOC concentrations (referred to as dilution events). Positive ΔC values indicated an increase in DOC concentrations (referred to as flushing events). The numbers of dilution and flushing events were summed for each month in each year to allow assessment of any annual pattern. The gaps in CDOM fluorescence data from the Glenamong in the study years resulted in no estimated DOC concentration being available for 15 of 88 events in 2004, and 3 of 63 events in 2010. No data were missing for the extreme events in 2006.

2.6. Statistical Analysis

Generalized additive mixed modelling (GAMM) with a cubic regression spline and cross-validation was used to identify any significant relationship between stream discharge and estimated DOC concentration for each year. Analysis was carried out using the mgcv package [32] in R version 3.3.4 [33]. The spreads of the residuals were homogenous, indicating that a Gaussian distribution was appropriate for the model [34]. A variance structure and a correlation structure were added to the model for the 2010 data, where the assumptions were violated for 1. equal variance and 2. independence, respectively [34].
The hypothesis that the probability densities for the estimated DOC concentration in runoff-dominated and baseflow periods (for hourly data) were not significantly different was tested using a bootstrap version of the univariate Kolmogorov–Smirnov (KS) test using the R package Matching [35] (KS test statistic = D). Ties are allowed with this test unlike the traditional KS test. The number of bootstraps to be completed was set to 1000.

3. Results

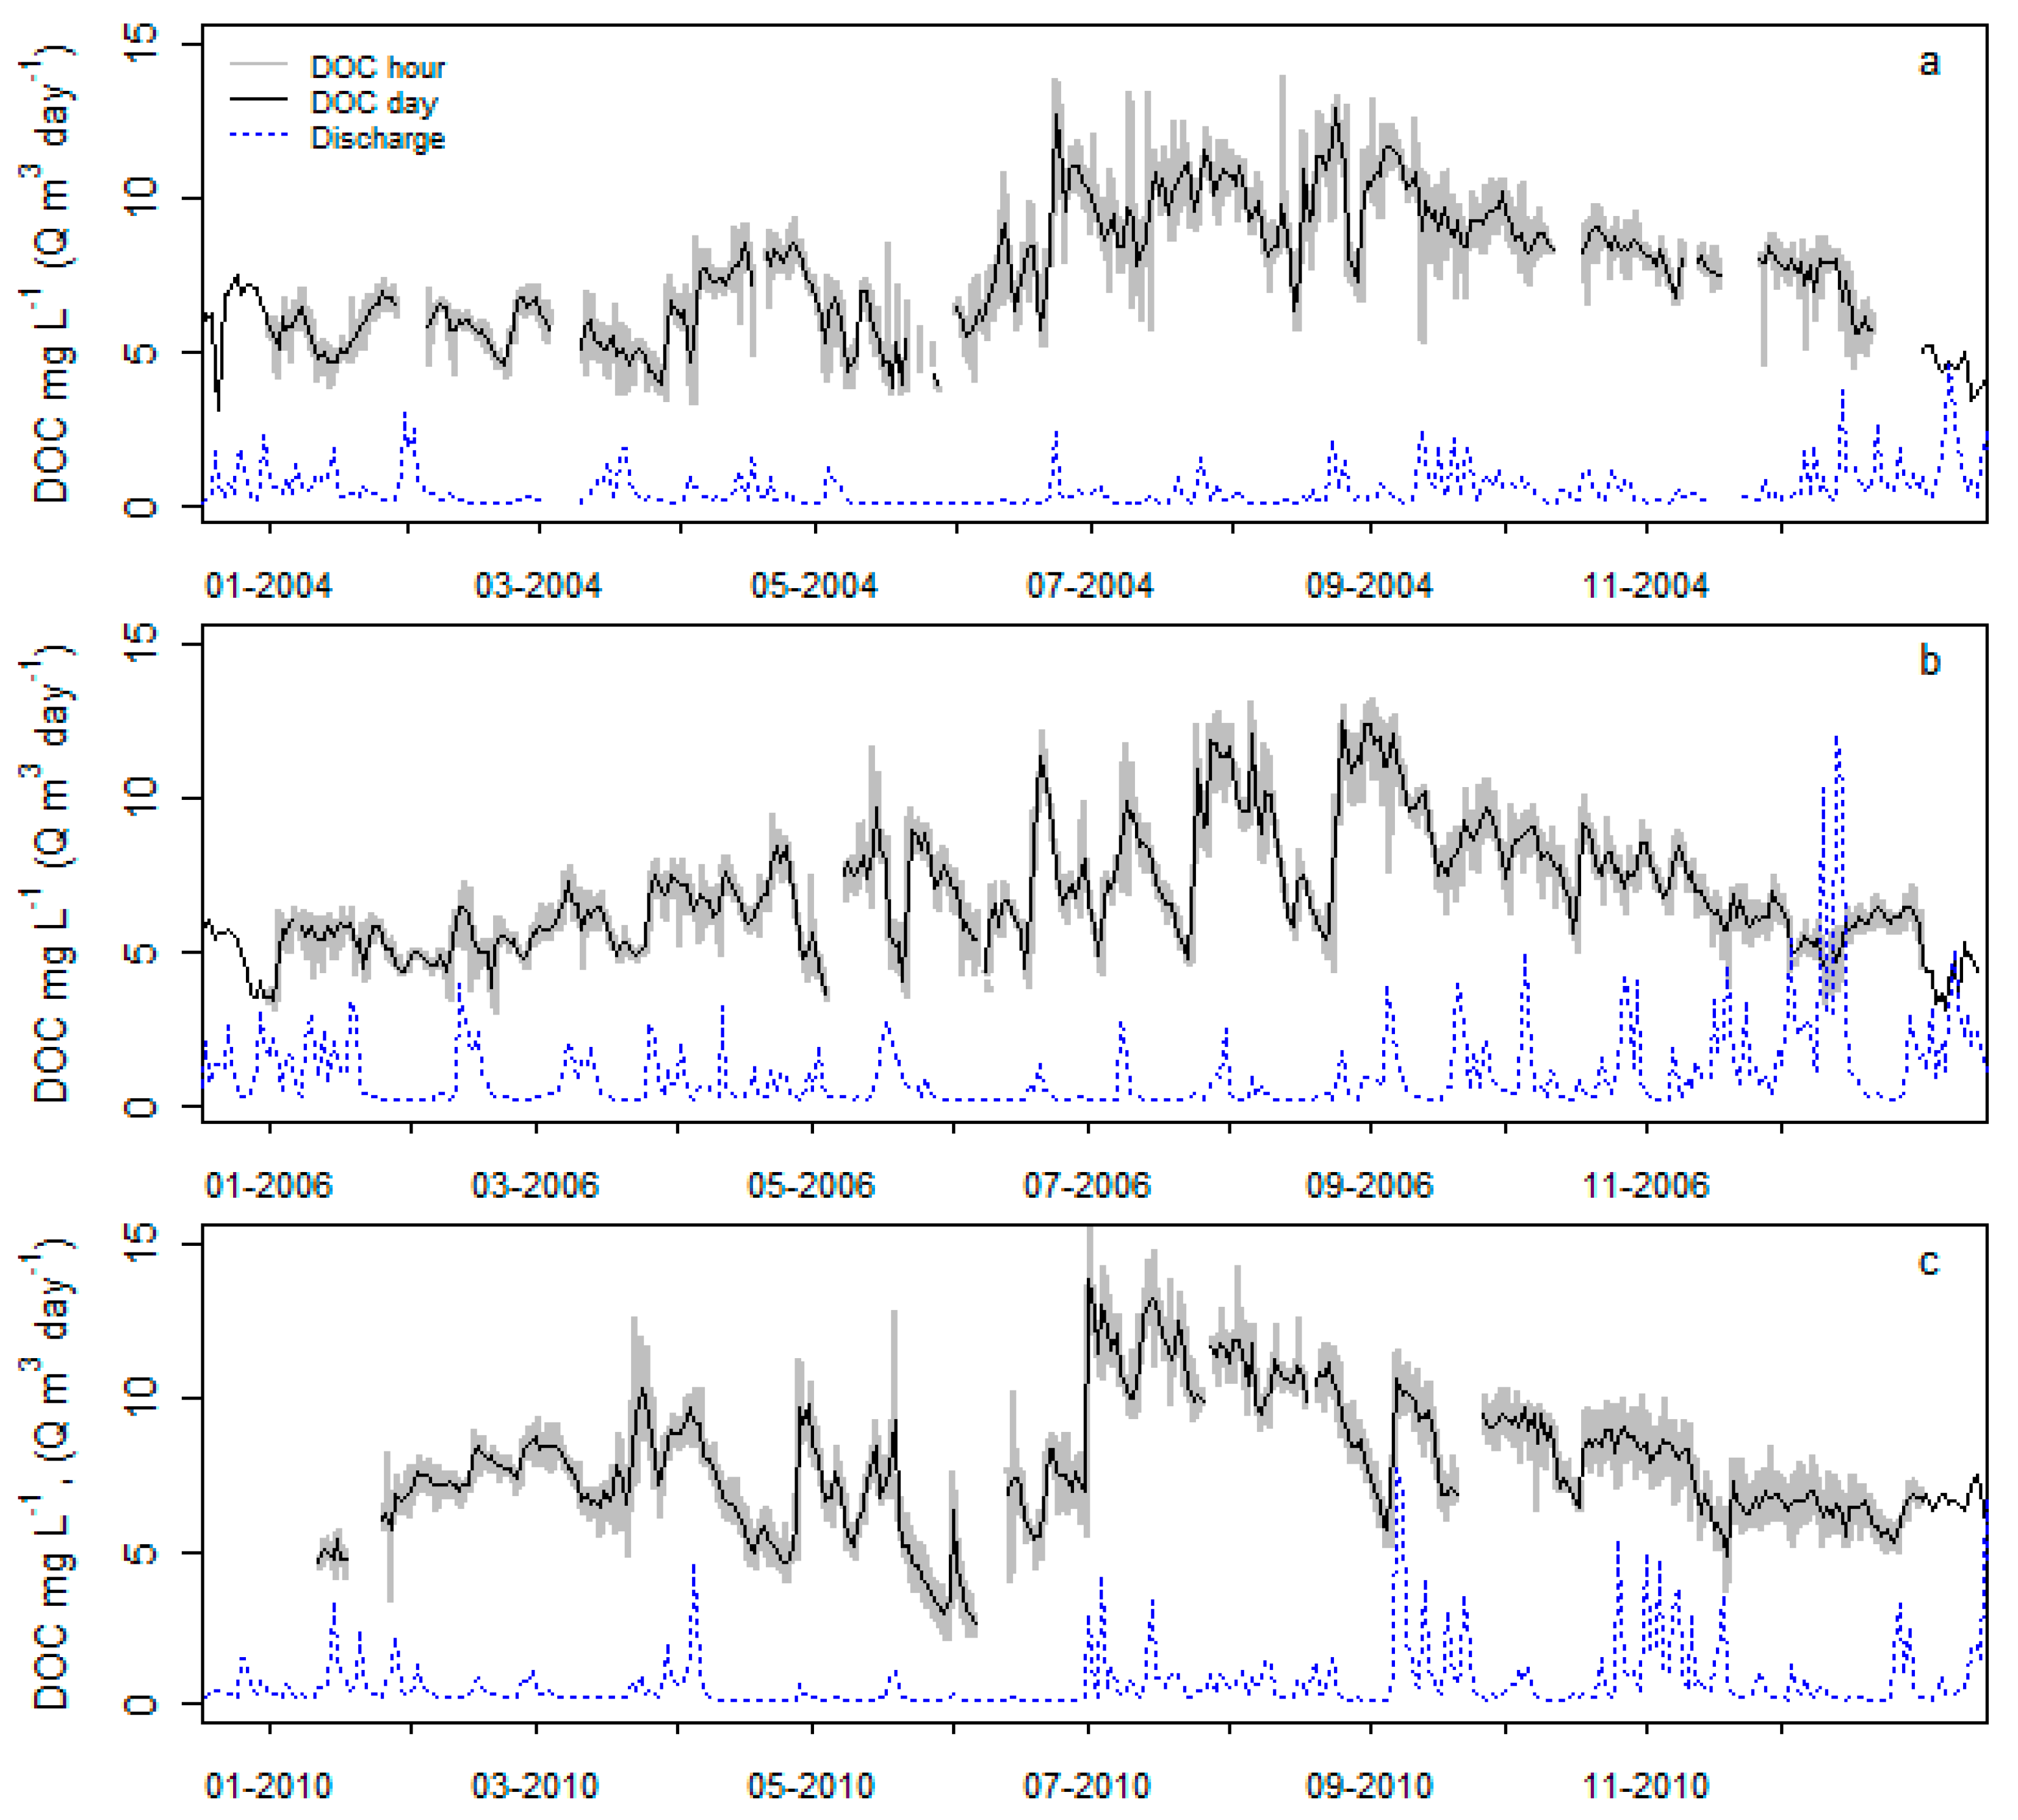
3.1. Meteorological and Hydrological Conditions

Total annual precipitation was relatively high in all three years for which stream data were assessed (Table 1). It was similar in both 2004 and 2006 at 2125 mm year−1 and 2108 mm year−1, respectively, but was lower in 2010 at 1599 mm year−1. Median stream discharge rates also differed in each of these three years at 0.40 m3 s−1 (2004), 0.34 m3 s−1 (2006) and 0.29 m3 s−1 (2010), reflecting these year-to-year differences. Despite the similarity in total annual precipitation, however, the discharge data for the Glenamong site differed between 2004 and 2006 in the percentage of hourly time steps where runoff was a component of discharge (42.3% (2004) and 35.4% (2006), respectively). The equivalent percentage for 2010 was lower at 32.7%.
Hourly estimated DOC concentrations for the Glenamong River showed a general seasonal cycle all three study years with highest estimated DOC concentrations generally occurring in the months from July to September, after which concentrations declined over the late autumn and early winter (Figure 3). The most extreme low concentrations generally occurred in early summer in each year. The months with highest DOC concentrations did not coincide with times with higher stream discharge for the Glenamong, which peaked between September and December. Discharge and precipitation showed a general increase from August each year to higher values in autumn and winter. The median estimated DOC concentrations for the three years (based on the hourly data) were similar at 7.7 mg DOC L−1 (2004), 6.7 mg DOC L−1 (2006) and 7.4 mg DOC L−1 (2010) (Table 1). Interestingly, the median concentration for time steps in which baseflow only was recorded was slightly but significantly greater than when runoff occurred for both 2004 (baseflow: 8.0 mg DOC L−1; runoff: 7.3 mg DOC L−1; D = 167; p < 0.0001) and 2006 (baseflow: 6.8 mg DOC L−1; runoff: 6.5 mg DOC L−1; D = 168; p < 0.0001) (Table 1). In 2010, in contrast, the median concentration was significantly higher for time steps when runoff was recorded (baseflow: 7.4 mg DOC L−1; runoff: 8.0 mg DOC L−1; D = 112; p < 0.0001). There were no significant relationships between the daily mean DOC concentration and discharge rates in either 2004 or 2006 (Figure 4a,b). Discharge explained 19% of deviance in DOC concentration (generalized additive model with estimated degrees of freedom = 7.12; p < 0.0001) in 2010 (Figure 4c,d), however, this relationship was strongly influenced by a small number of timesteps where higher concentrations co-occurred with higher flows.

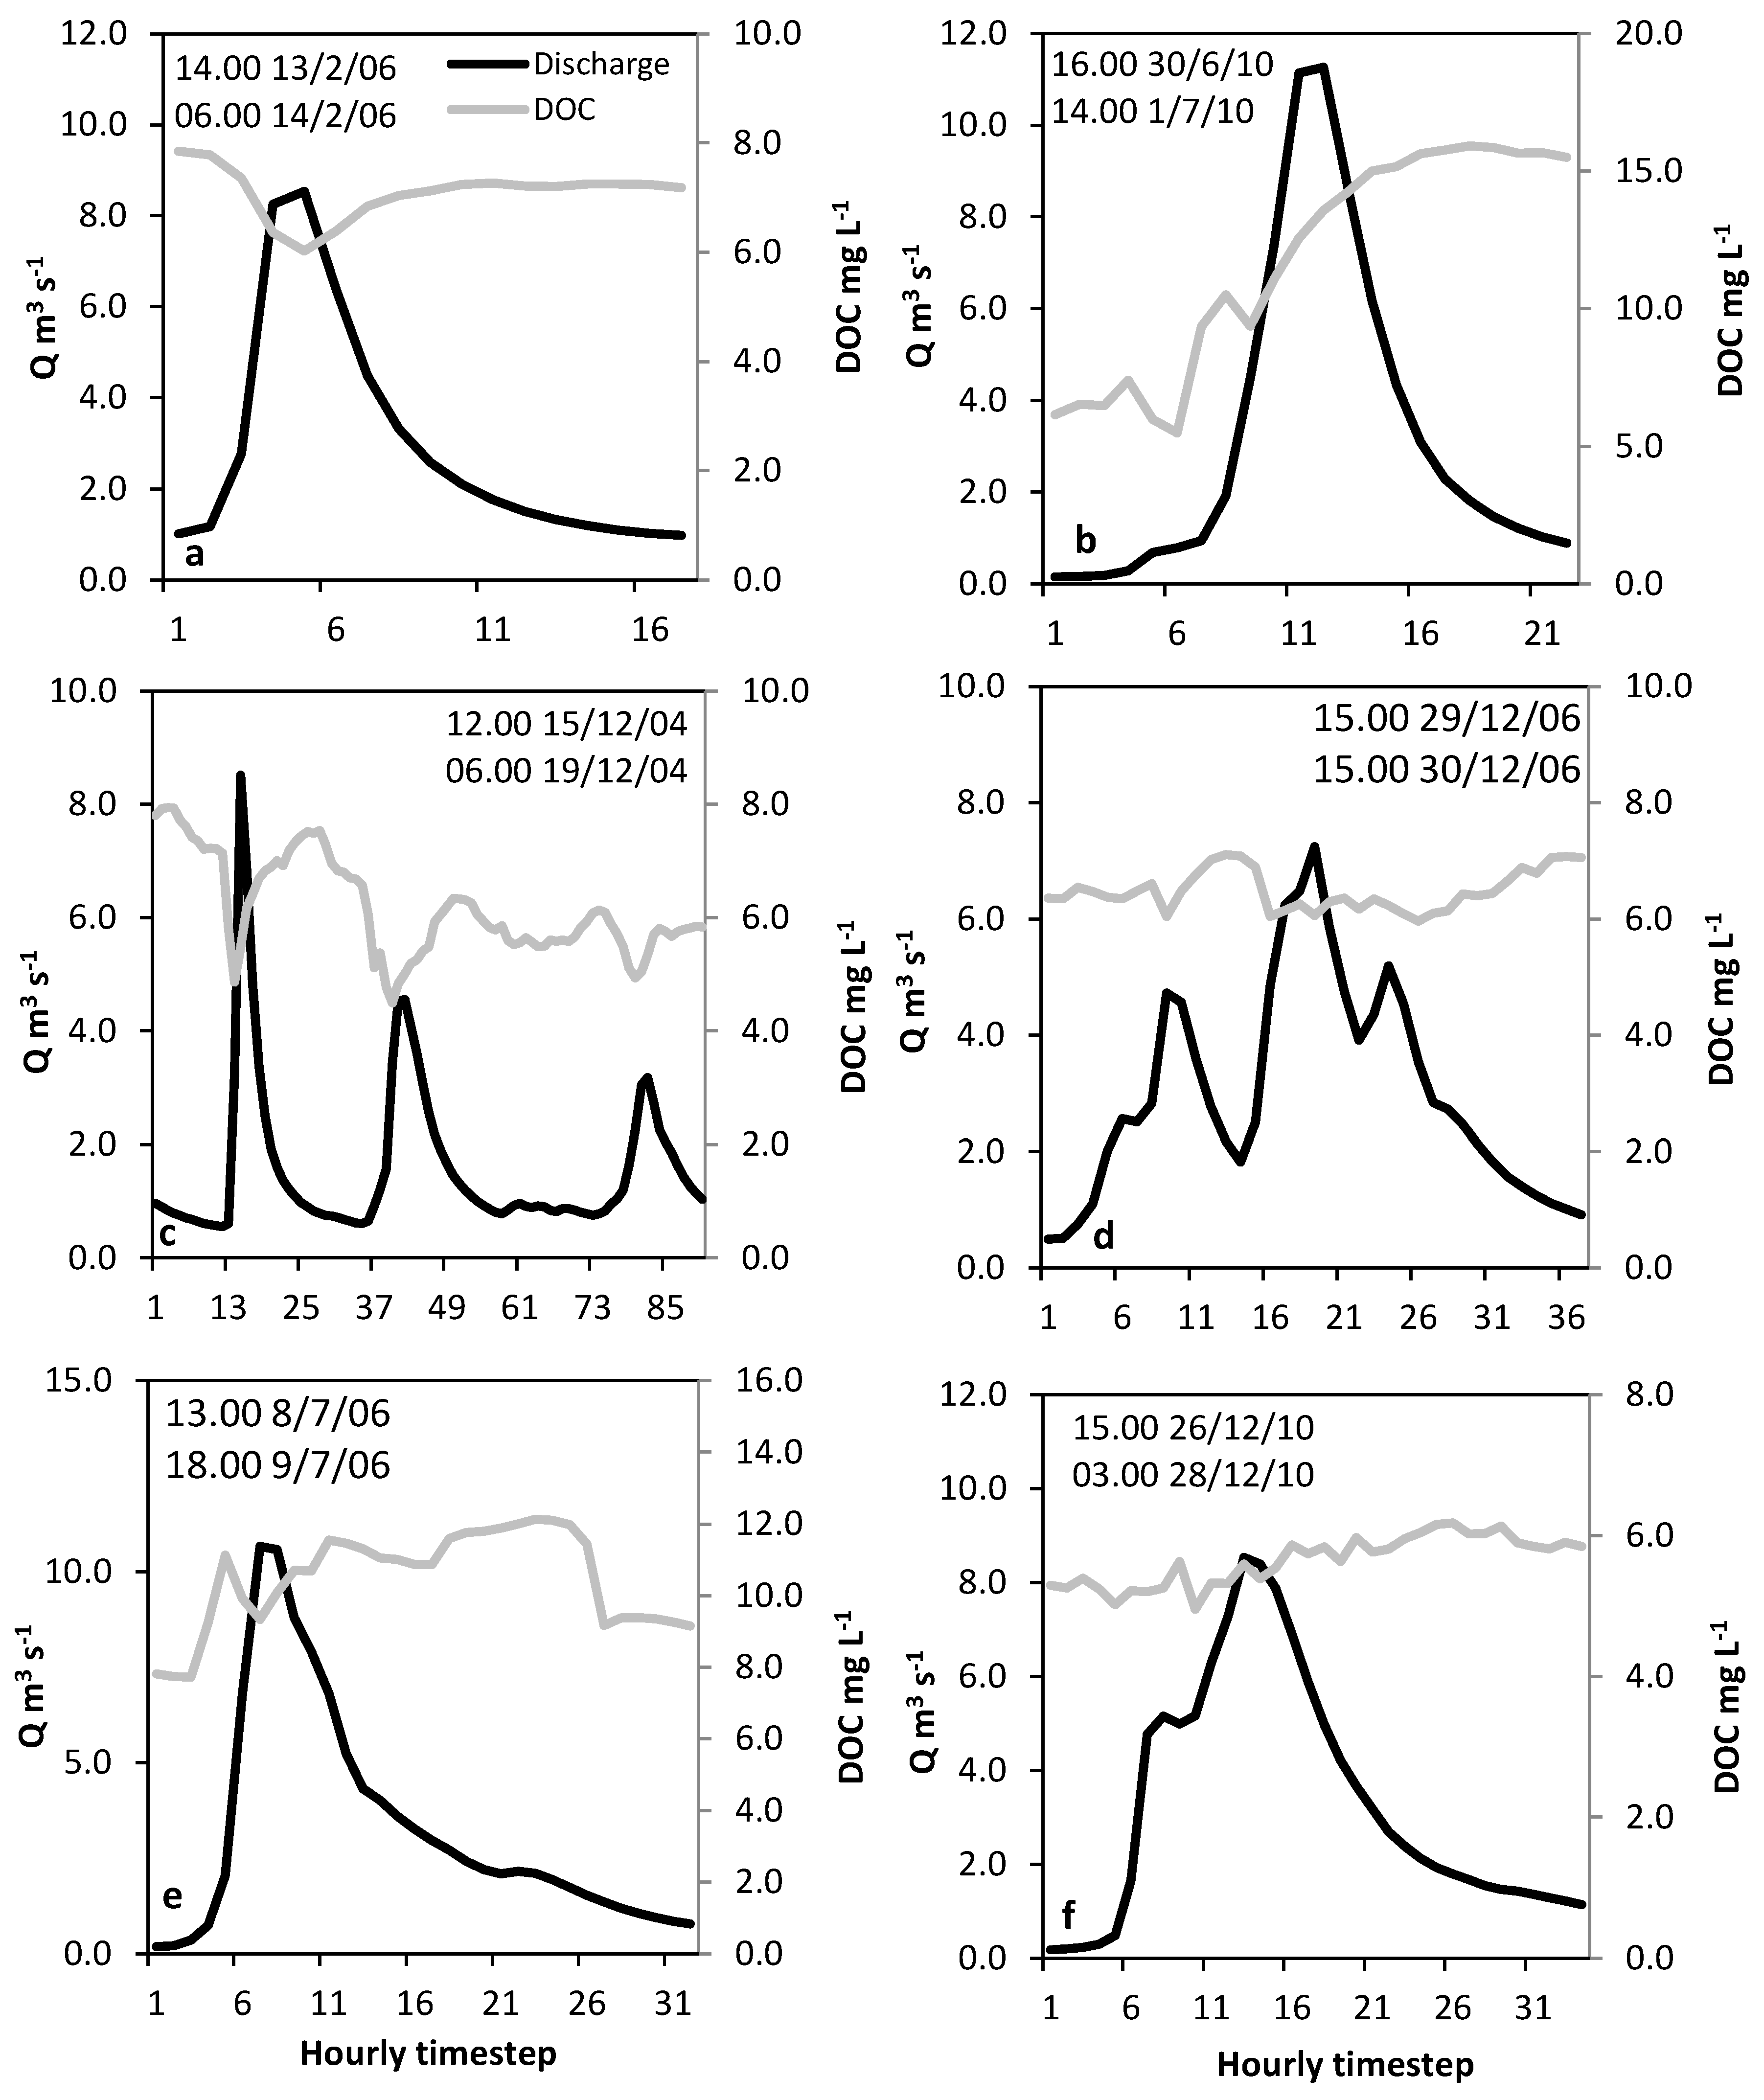
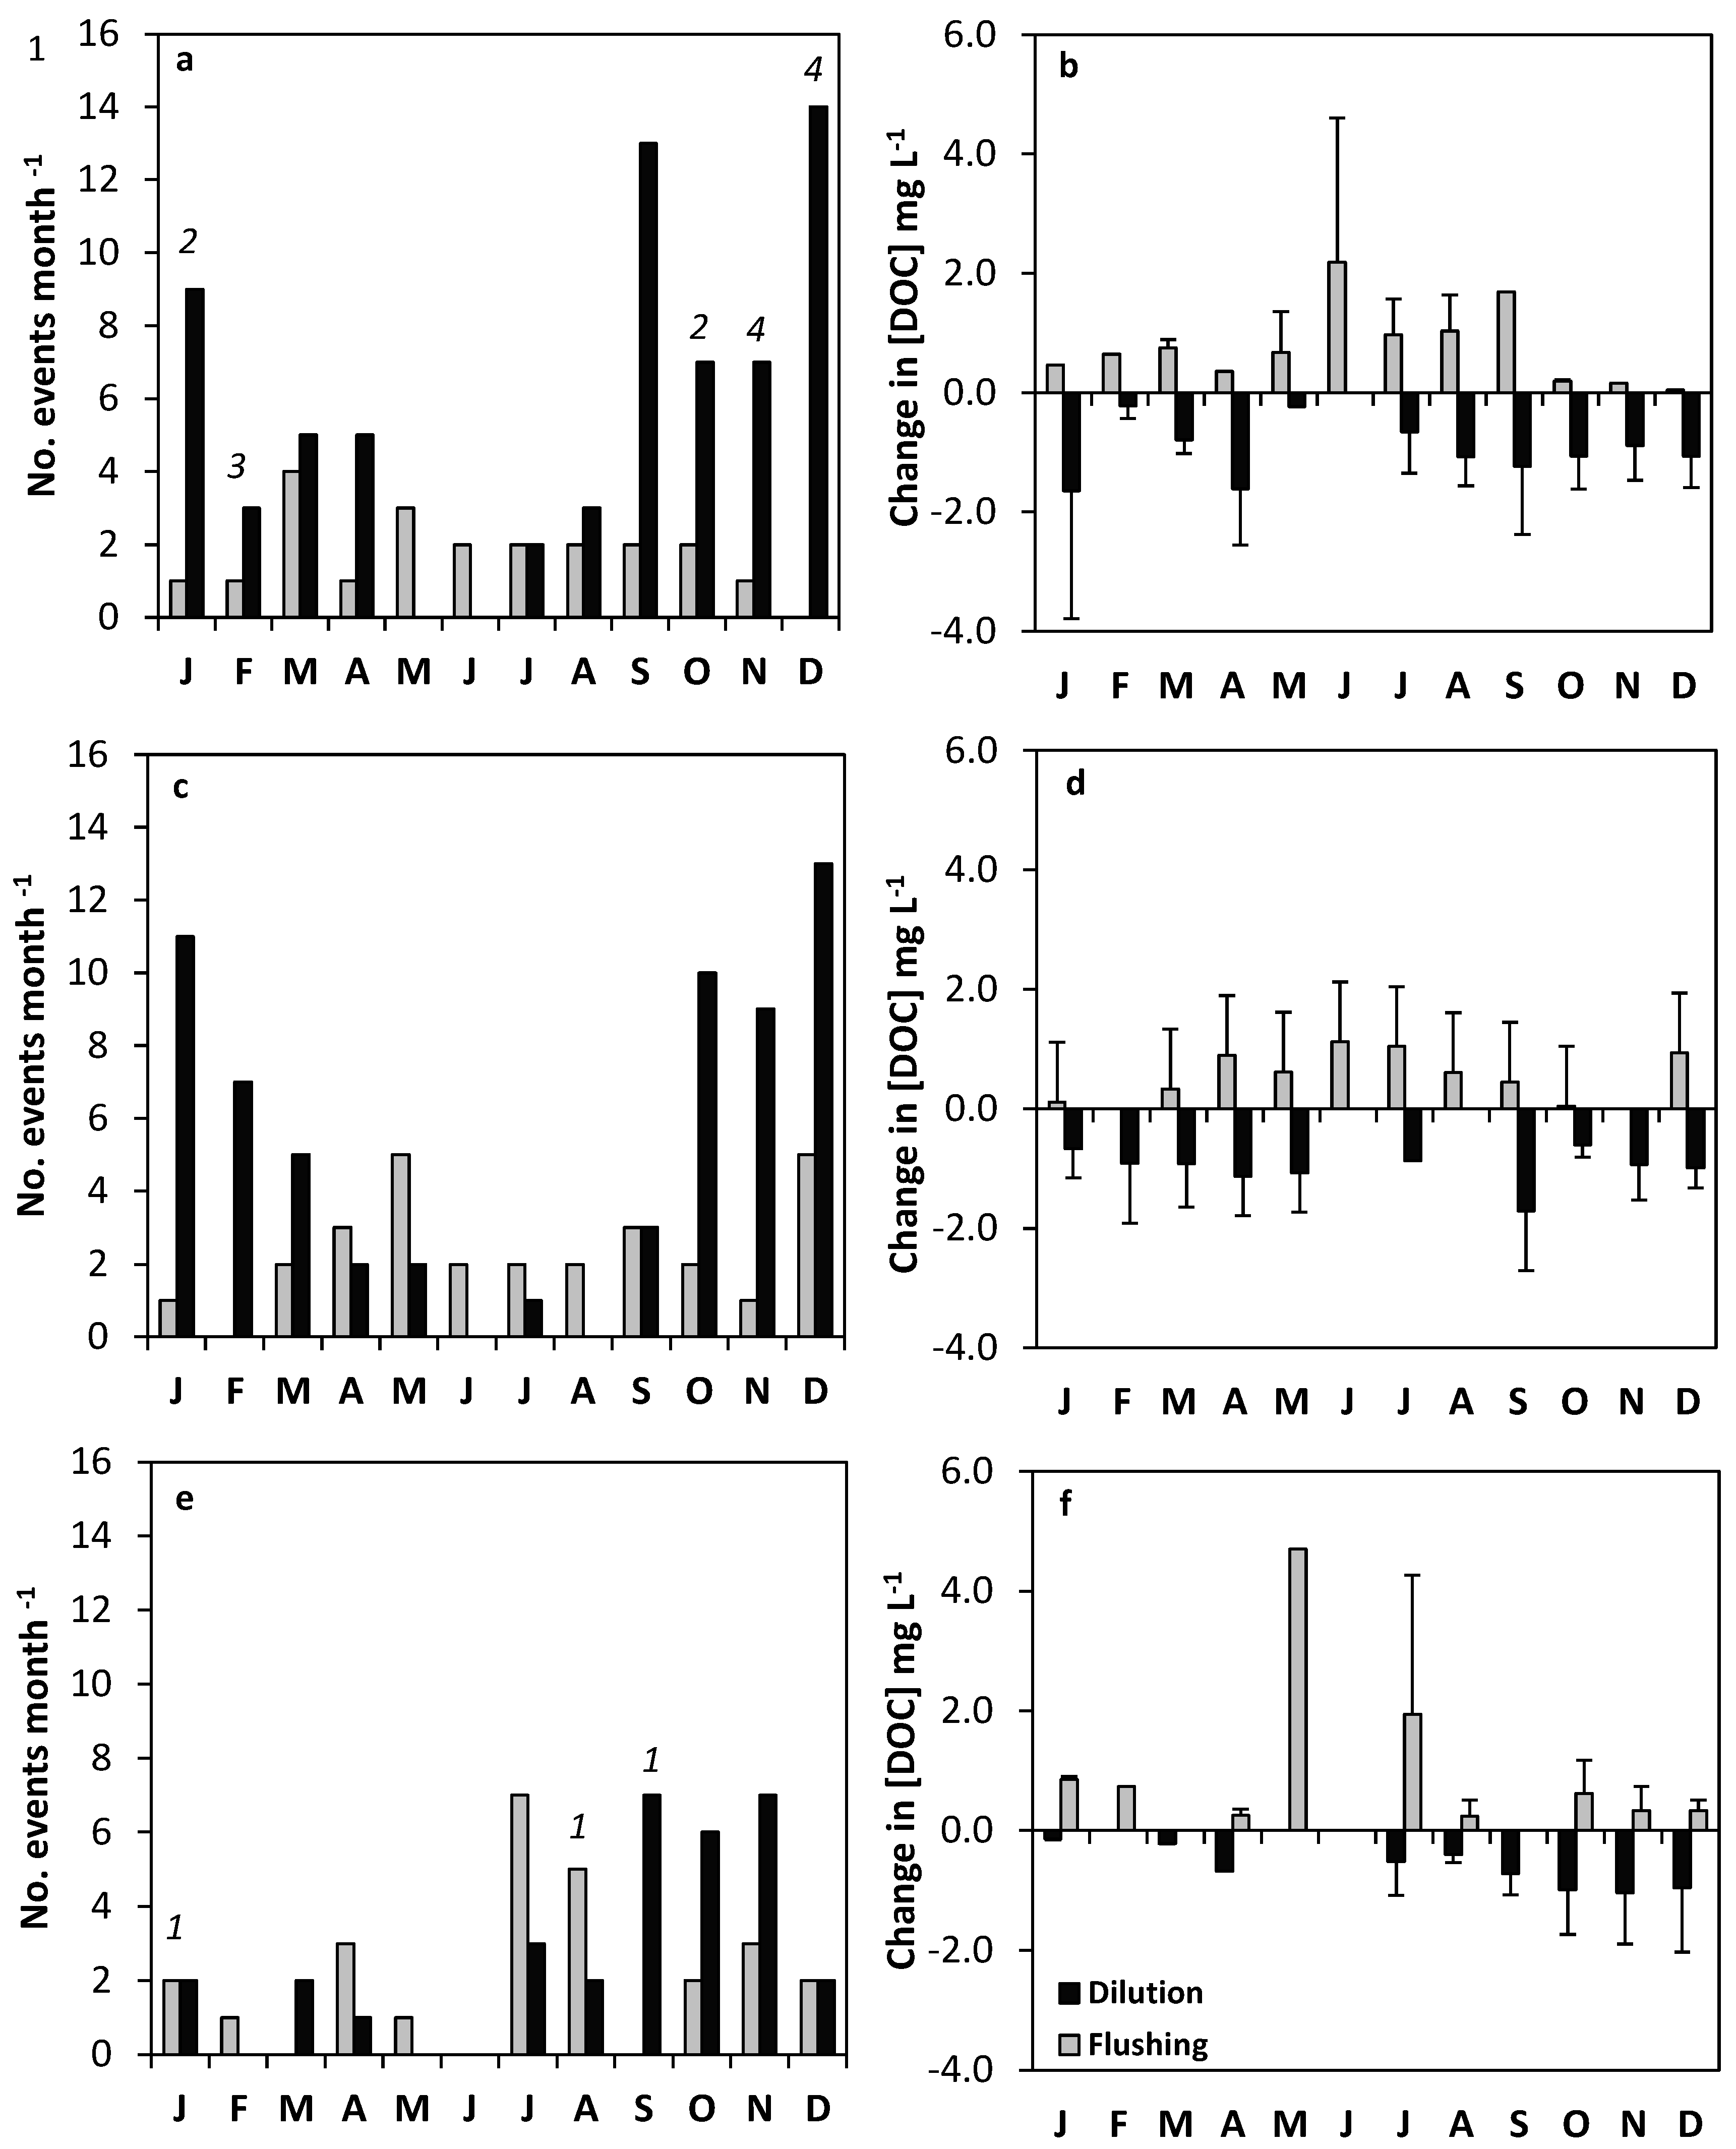
3.2. Change in DOC Concentration during Extreme Discharge Events

The number of extreme discharge events (events greater than the 90th percentile) in each year reflected the differences in total annual precipitation. There were a higher number in the two wetter years, 2004 and 2006 (88 and 91 extreme discharge events respectively), with only 63 in 2010 (Table 2). Notably, there were no discharge events classified as extreme in June 2010, and only one in May of that year, a period of unusually drier conditions at this site in that year. The pattern in the relationship between stream discharge and DOC concentration over the course of individual events was complex and variable (Figure 5). For many of the events, however, there was a clear direction of change in estimated concentration over the rising limb, allowing the classification of events as either dilution (Figure 5a), or flushing events (Figure 5b). We found that sequential dilution events were common, particularly in autumn and winter months (Figure 5c). However, there were also occasions when there were, for example, increases in estimated DOC concentration as discharge decreased (e.g., an event on 29–30 December 2006, Figure 5d). There were also some events that had more complex patterns, for example, events where concentration increased but where it declined at the peak of discharge (e.g., Figure 5e), or actually showed little change (Figure 5f).

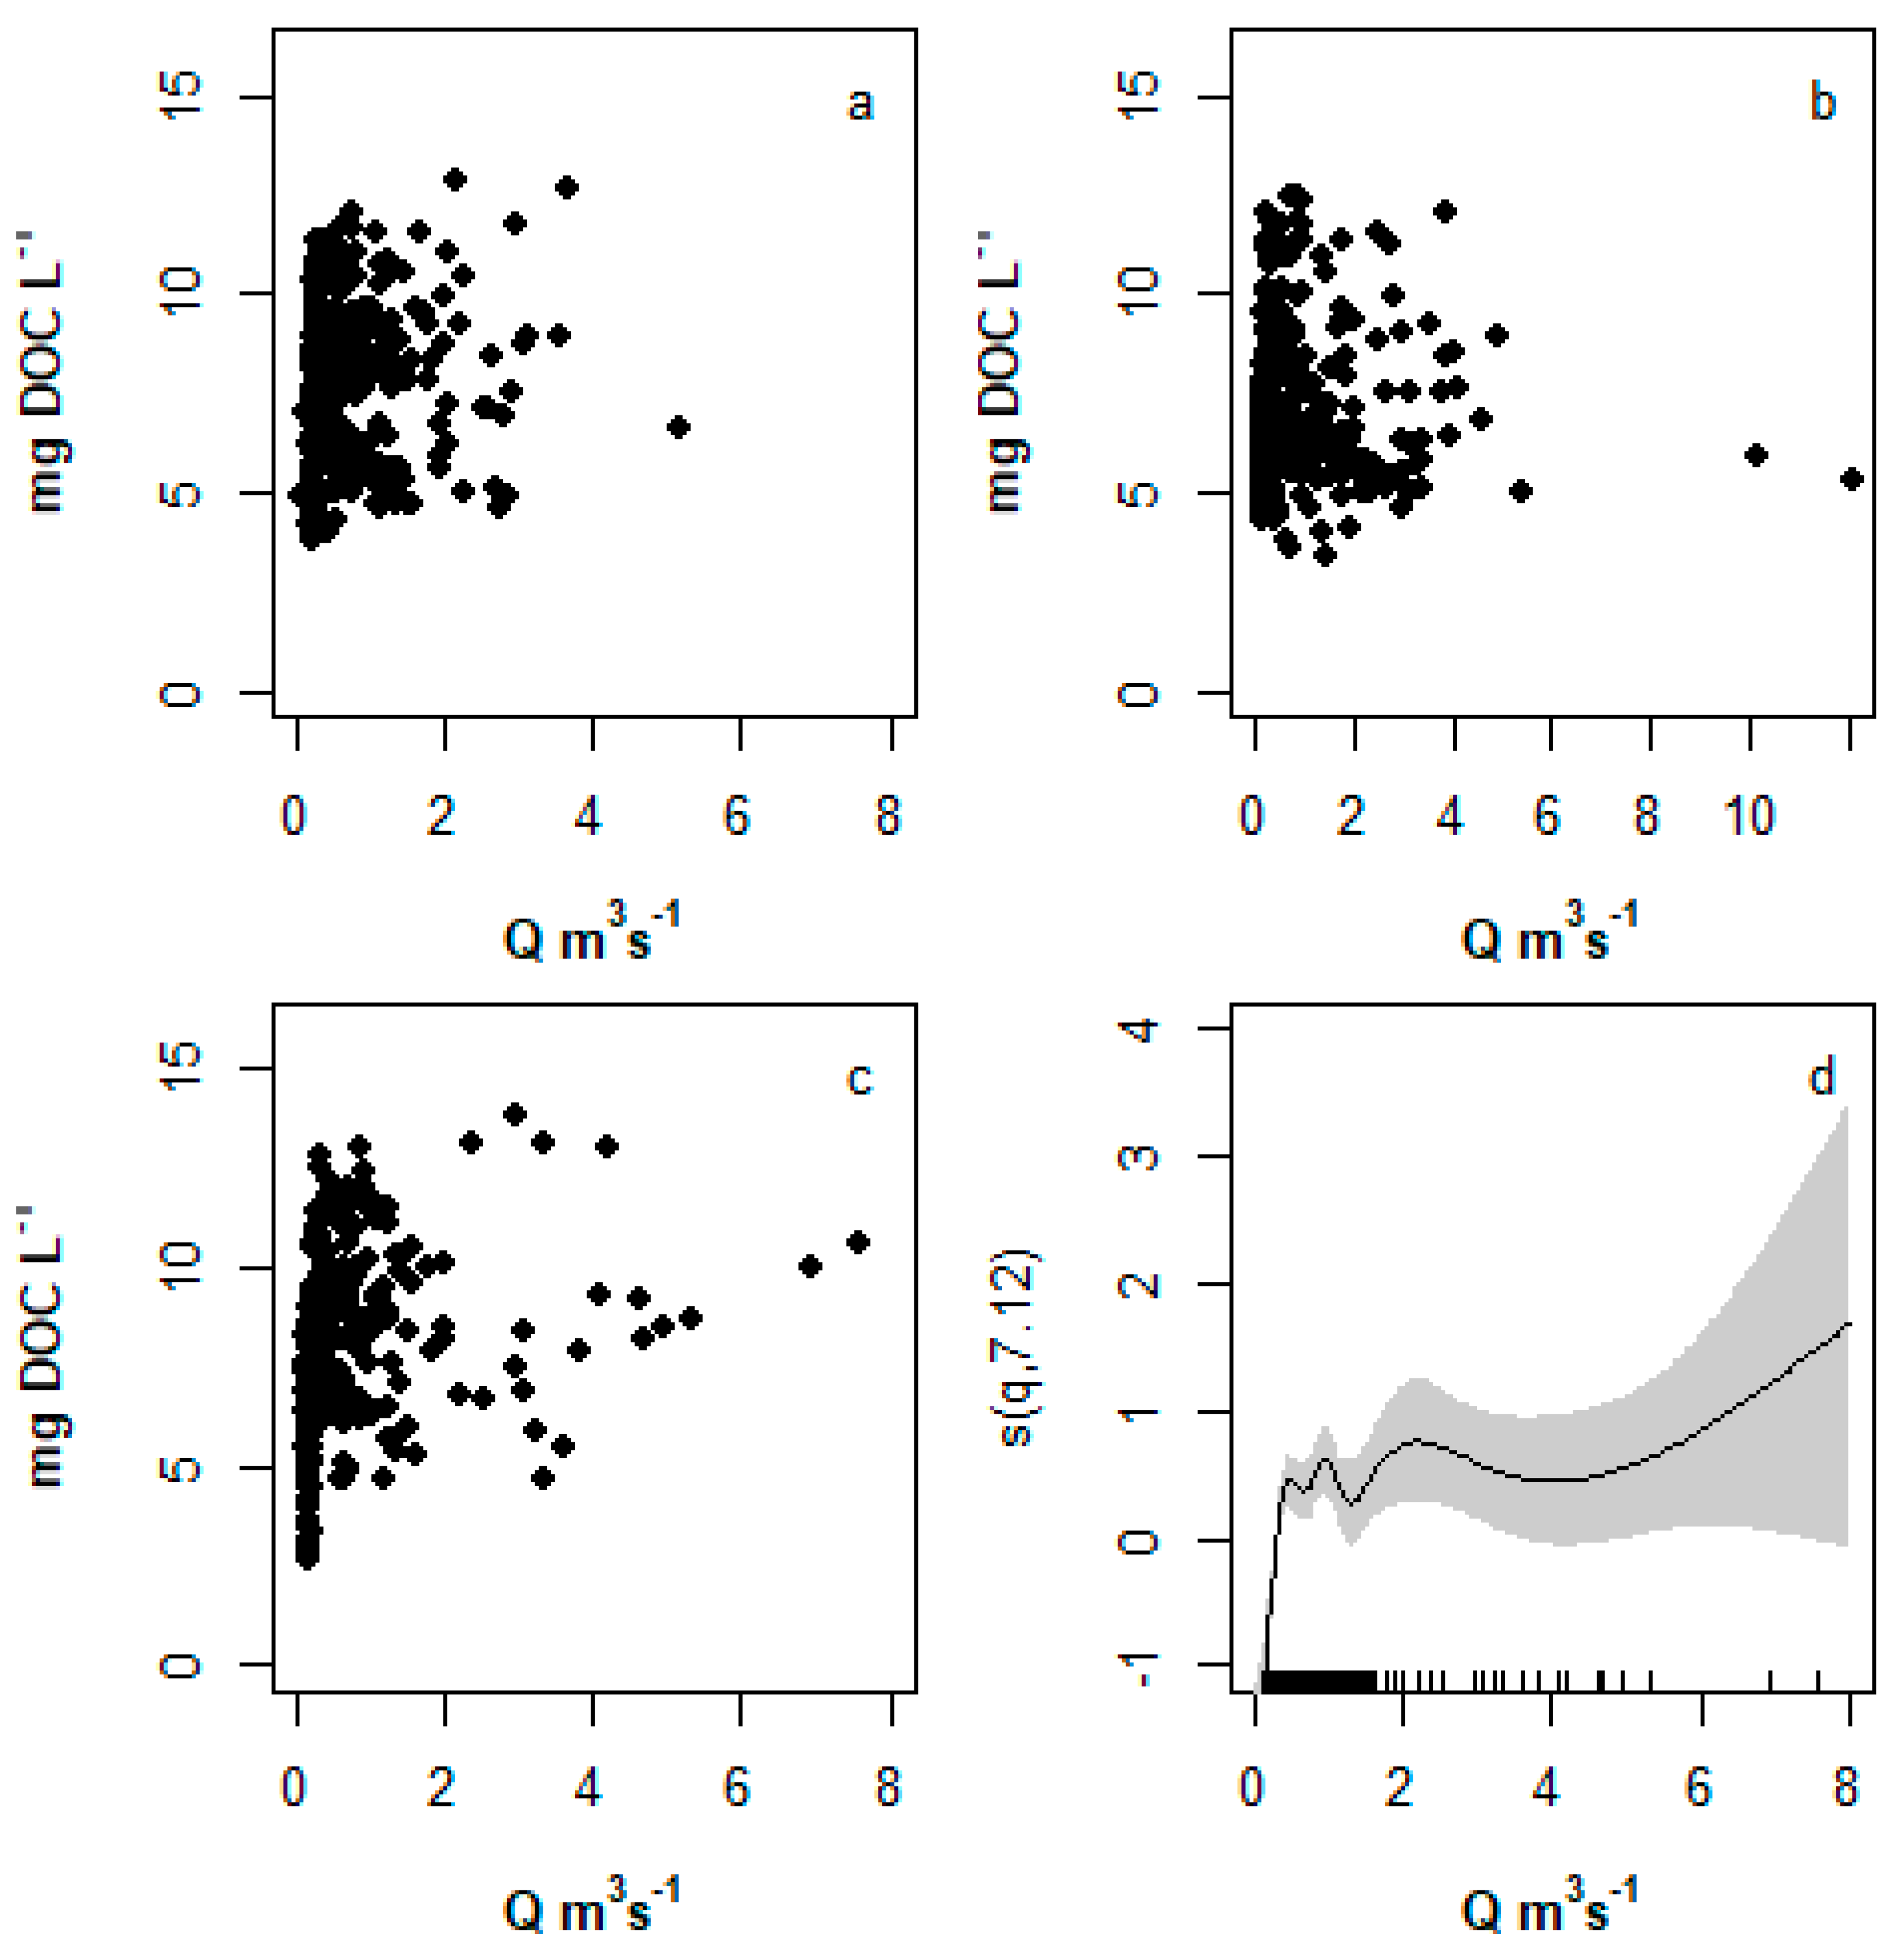
3.3. Distribution of Flushing Versus Dilution Events

While the total number of events classified as flushing events (i.e., events in which DOC concentration increased on the rising limb) were similar per year (19 in 2004, 28 in 2006, and 25 in 2010), it was notable that the number of dilution events greatly exceeded flushing events in all three years (54 in 2004, 63 in 2006 and 33 in 2010) (Table 2; Figure 6a,c,e respectively).
For 2004 for 15 events, data were available for all events between April and September. Interestingly, the months in each year when flushing events dominated were all during spring and summer. These were May and June in 2004 (Figure 6a), months from April to August in 2006 (Figure 6c), and months from April to August in 2010 (Figure 6e). With the exception of these time periods, however, dilution events dominated in each of the three years.
The average magnitude of the reduction or increase in estimated DOC concentration over the rising limb during these extreme events was calculated for each month and was generally similar in each year (Figure 6b,d,f). The absolute change in DOC concentration during dilution events ranged up to −6.60 mg DOC L−1 in 2004 (mean: −1.21 mg DOC L−1), up to −3.45 mg DOC L−1 in 2006 (mean: −0.89 mg DOC L−1), and up to −2.54 mg DOC L−1 in 2010 (mean: −0.84 mg DOC L−1). For concentration events, the increases in estimated DOC concentration ranged from up to +3.89 mg DOC L−1 in 2004 (mean: +0.54 mg DOC L−1), up to +2.69 mg DOC L−1 in 2006 (mean: +0.65 mg DOC L−1), and up to 5.98 mg DOC L−1 in 2010 (mean: +0.89 mg DOC L−1). The largest individual increase in concentration in any of the three study years was +5.89 mg DOC L−1 in July 2010, while the largest single decrease in concentrations was – 6.60 mg DOC L−1 in January 2004 (Figure 6b).

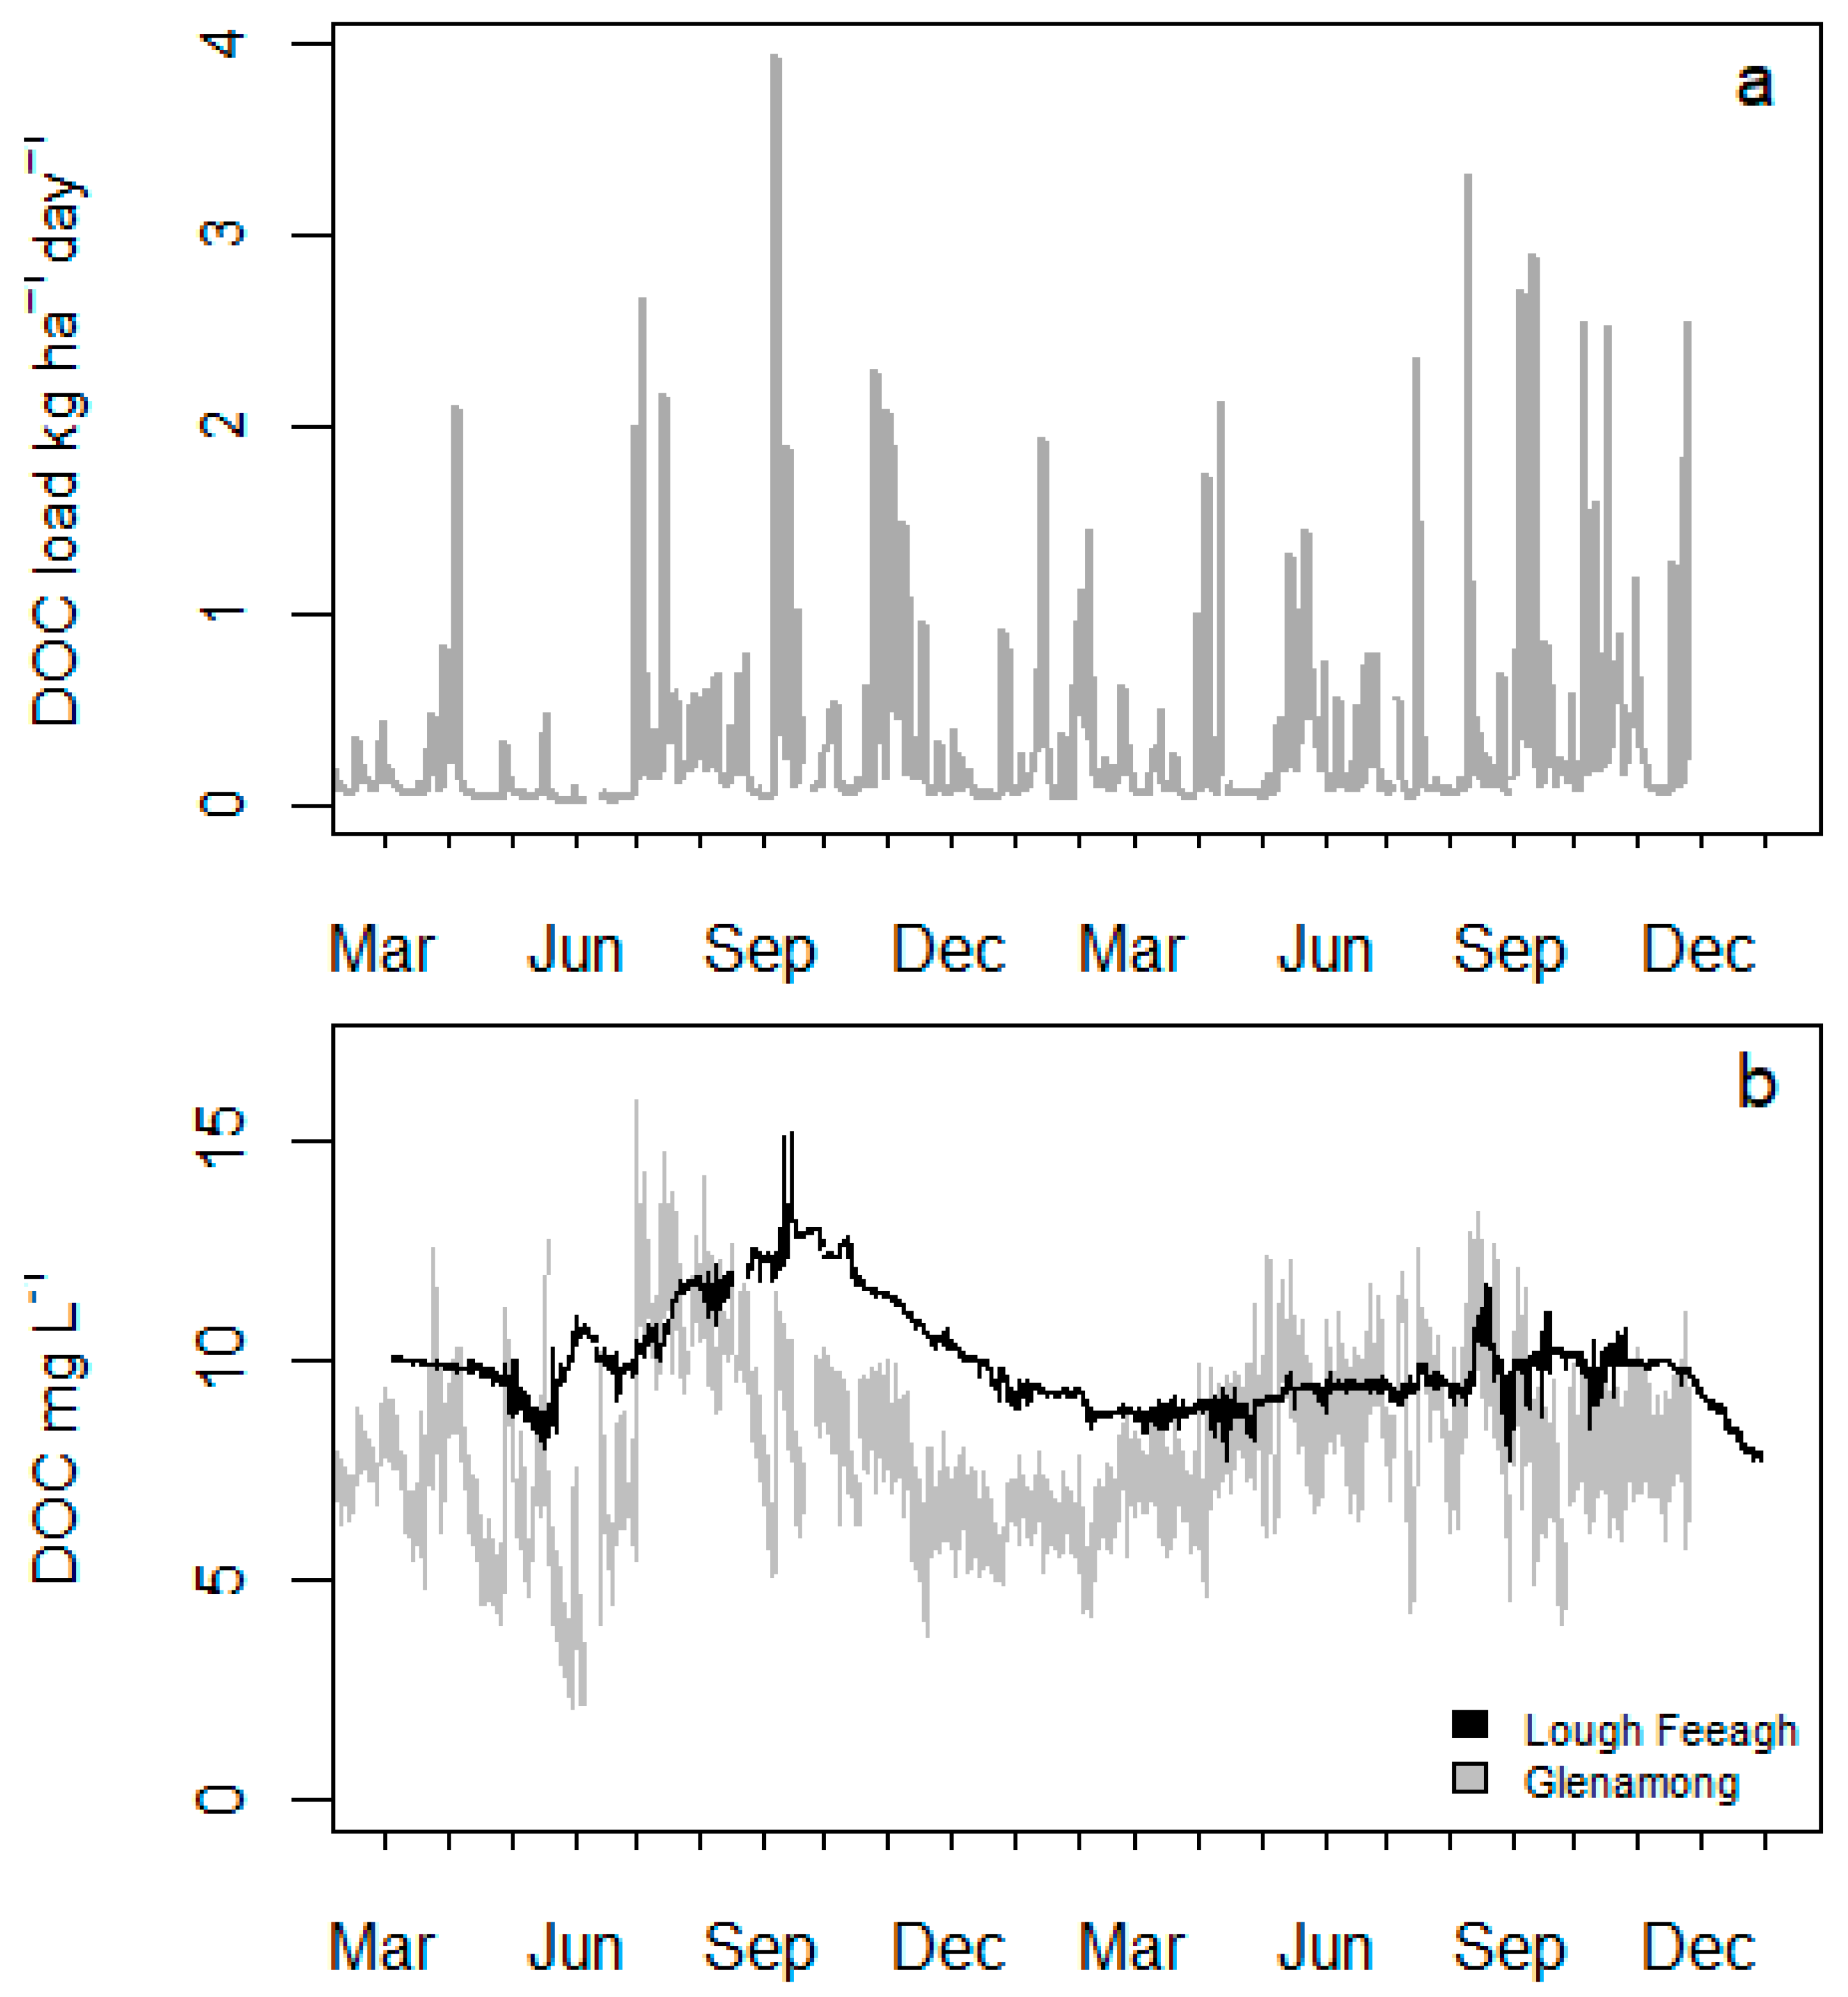
3.4. DOC Loading and DOC Concentration in Lough Feeagh

The daily load of DOC that was exported from the Glenamong to Lough Feeagh in the period March 2010 to September 2011 closely tracked stream discharge (Figure 7a). The influence of discharge meant that the highest daily loading (8 September 2010) did not coincide with the highest mean daily DOC concentration, which occurred on 9 June 2010. It was also of note that for all three years, a higher percentage of the DOC load exported to Lough Feeagh was associated with runoff time steps (62.3% in 2004, 61.0% in 2006, and 61.6% in 2010; Table 1) than baseflow time steps, a function of higher discharge volumes. The percentage of DOC estimated to be exported when discharge exceeded the 90th percentile, the most extreme discharge events, was lower at 43.4% (2004), 49.0% (2006) and 54.8% (2010), respectively. Despite these differences between years, the estimated total annal DOC export for each year was remarkably similar at 10.3 t DOC km−2 year−1 (2004), 10.9 t DOC km−2 year−1 (2006), and 10.0 t DOC km−2 year−1 (2010) (Table 1).
The hourly mean DOC concentration for the Glenamong River showed much greater variability that the equivalent hourly data for downstream Lough Feeagh for the period March 2010 to November 2011 (Figure 7b). The lake concentrations were also generally lagged and smoothed compared to those in the inflow. However, the large fluctuations in stream DOC concentration that coincided with the prolonged dry period in spring 2010, and the subsequent high rainfall and discharge on 9 June 2010, were reflected in delayed troughs and peaks in the lake concentrations between May and September in that year. The concentrations in the lake rose gradually from lows of ca. 8 mg DOC L−1 in late May to mean values >12 mg DOC L−1 for the months of September and October 2010, indicating an approximate three to four month lag between the peak concentrations in the stream and the peak in the lake. As well as this lagged effect, it was of note that peak hourly concentrations of >14 mg L−1 were recorded in the lake between 10–15 September 2010, just after the two days with the maximum DOC loading to the lake (7 and 8 September 2010), dates on which daily average discharge rates of 7.61 and 6.96 m3 s−1 were recorded. After this September peak, and in contrast to 2010, concentrations in the lake declined and were more stable in 2011 than in 2010.

4. Discussion

Interest in the factors controlling DOC concentrations in peatland systems has increased due to concerns about the loss of carbon from long-term stores, changes in the supply of carbon to downstream lakes, and the challenges of treating high DOC waters for human consumption. Our results highlight the variable relationship between stream discharge and DOC concentrations in blanket peatland catchments, and indeed the complex nature of the balance between catchment decomposition rates, biogeochemical processes, and the activation of pathways through the peat soil [13,14,19]. Most interestingly, higher stream discharge rates were actually found to be more likely to result in decreases rather than increases in DOC concentration for much of the annual cycle. This pattern contrasts with the often reported increases in concentration, and flushing of DOC from the catchment, described in many studies, especially for those sites where organo-mineral soils dominate [9,10]. Many of those studies have been undertaken in catchments where soils are typically dry throughout the summer, and where stream concentrations of DOC will normally peak in mid- to late-autumn when the first high rainfall of the season occurs [3]. Inamdar et al. [16], for example, in a study on DOC concentrations in forested watersheds in New York State (USA), reported the largest increase from pre-event conditions during two summer events, with lower but still always positive changes in concentration in March/April and October/November [36]. Our results show that such a build-up of DOC in soil stores and subsequent flushing in autumn is a rarer event in wetter peatland catchments such as the Burrishoole.
Most notably, the seasonal pattern in the occurrence of dilution and flushing events was generally consistent for the Glenamong River between our study years. Flushing events dominated in early summer, a time when stream DOC levels are at their highest in this catchment [19,20], a seasonal pattern consistent for streams draining peat bogs [14,18]. This cycle is driven by the effect of temperature on decomposition in peat soils, a controlling factor which has previously been identified for this site [19,20]. The likely mechanism explaining this dominance of concentration increases in the summer is that more DOM and, therefore, DOC that was being produced as the organic carbon stored in the peat was decomposed, and that this was then flushed from the surface peat layers as the water table in the catchment rose following rainfall. Soil temperature is always higher, and peat decomposition therefore greater, in the surface soil layers [13]. Moreover, soil moisture levels will be lowest during summer when evapotranspiration rates are high, thus increasing the availability of oxygen within the peat layers. This not only stimulates bacterial growth, but also increases phenol oxidase activity, the enzyme responsible for the breakdown of phenolic compounds, substances which inhibit decomposition and accumulate in anoxic peat soils [37]. The effect of drought on stream and river DOC concentrations has been highlighted in previous studies in the catchment [19,20]. The highest flushing events in our study were recorded in July 2010 and followed a particularly dry spring and early summer that led to a step change in DOC concentrations in the Glenamong, previously described by Ryder at al. [19]. Such step changes in DOC concentrations have been described at other peatland sites and have been linked to changes in the relative rates of aerobic and anaerobic decomposition in the peat, as well changes in DOC solubility coupled with a flushing effect from the first rainfall post-drought [38]. The 2010 event in the Glenamong contributed to the significant but non-linear relationship between mean daily stream discharge and estimated DOC concentration that we found for that year, which was not apparent in the two other years assessed.
Where positive discharge to concentration relationships have been reported, those have been in sites that tended to have more extreme wet and dry periods within the annual cycle than those in the peatland Glenamong catchment. For example, Guarch-Ribot and Butturini [39] monitored 72% of storms over 2.5 years in a headwater Mediterranean catchment at a site that experienced very dry summers, times when flow ceased entirely. A positive concentration–discharge relationship was found for that site especially in autumn as the soils rewetted, while no dilution events were observed. That study concluded that storm magnitude was the main driver of change in DOC concentration. For the Glenamong River, we had hypothesized that concentration events would dominate in the autumn, a time of year when stream DOC concentrations are usually still relatively high at this site. In fact, dilution events dominated from September through to March in our study years. The mechanism explaining dilution events most likely involves the transport of low DOC rainwater to the stream during periods of saturation excess runoff once the peat soils are again fully wetted after summer [14,21]. The small number of concentration events that occurred in this autumn–winter period when dilution dominated likely reflected the flushing of “old” DOC from alternative pathways in the soil. Worral et al. [21] used end-member analysis in a peat system in northern England to show that decreases in DOC during events there were more likely to be the result of exhaustion of reserves rather than changes in the flow paths. Peat soils have also been shown to have a “dual porosity” structure, which includes pockets of closed, dead-end pore spaces in their macropore structure [40]. Solute transport from these zones will be via diffusion only and will proceed slowly and any response would therefore be delayed. However, Rezanezad et al. [40] noted that there were to date few studies on dilute transport from such zones in peatlands. Similar to our study, Clark et al. [14] reported that DOC concentrations decreased during autumn storm events and showed a poor relationship with flow during other seasons for streams in an upland peat catchment in the UK.
While we also found slightly higher estimated DOC concentrations during baseflow periods than during times when runoff occurred in the two wetter years (2004 and 2006) and the opposite pattern in the drier 2010, it was notable that the differences were small at an annual scale (less than 0.7 mg DOC L−1 in all cases). These similarities likely reflected the common peat acrotelm source for water discharged during both flow types [13,14]. It was also notable that despite differences in total precipitation and total discharge in the three study years, they all had similar annual loads exported to the lake. This implies that a similar quantity of DOC was produced within the catchment in each year and highlights the importance of temperature controls on the rate of peat decomposition [19,20]. This similarity between our study years is likely coincidental, as annual loads ranging from 11.6 t C km2 year−1 to 18.5 t C km2 year−1 have been estimated for the Glenamong catchment for the period of 2011 to 2016 based on weekly water color data [18]. The loads exported to the lake are also within the range reported for other upland peat catchments [13,18,41]. Koehlar et al. [18], for example, reported an annual export of DOC of 14 t C km−2 year−1 from a catchment in southwestern Ireland. Worrall et al. [41] estimated that a similar 9.4 t C km−2 year−1 was exported from the Moor House catchment in Northern England, while annual export rates reported by Clark et al. [13], also in the UK, ranged up to 27 t C km−2 year−1. The percentage of the annual DOC load that was exported in 10% of the time during extreme discharge events in our study was 43% to 55%. This is lower than the values reported for eastern US catchments [10], but similar to other studies in catchment with peat soils [36].
While our estimated DOC concentration and loads were for the inflow from the smaller of the two sub-catchments of Lough Feeagh, Doyle et al. [20] found a high level of synchrony between the temporal pattern in water color, a proxy for DOC, in the Glenamong River and that in the larger sub-catchment of the Black River. The estimated DOC concentration at the Lough Feeagh monitoring station appears to be strongly influenced by the inflow concentrations. Our high-frequency estimated DOC data from the lake were, however, notably less variable than that from the inflow site. In addition, our data showed clearly that the impacts of large flushing and dilution events, such as those that occurred in the study catchment in 2010 [14], will be strongly damped in downstream lakes. The retention time of Lough Feeagh is 172 days, although it was estimated to be reduced to ~15 days following an extreme large inflow in July 2009 [24]. The stream discharge that coincided with the abrupt increase in our estimated DOC concentrations on 9 June 2010 was, however, much lower than that reported for a summer event in 2009 by de Eyto et al. [24], an event which followed extreme (once in 250 year) rainfall. It also is of note that separate to any response to catchment-controlled inflows, dissolved organic carbon concentrations in lakes will also be affected by in-lake processes such as carbon uptake by bacterioplankton [42], and degradation of DOC compounds by UV light [43]. Nevertheless, for lakes with retention times greater of c. 6 months and with catchment areas similar to the Burrishoole, our results suggest that catchment processes are the main drivers of in-lake DOC concentrations, with an integrating effect related to lake retention time.

5. Conclusions

Undertaking a similar analysis to ours to gain insight into any seasonal patterns in the discharge–concentration relationship for a specific site, either through HFM or through forecasts using an appropriate model, could inform on carbon budgets and guide catchment management decisions for both current and future climatic conditions. The results we have presented give insights into the close linkages between weather, catchment carbon cycling, and effects on downstream aquatic systems in general. We also have shown how these events can more frequently result in a dilution of stream DOC levels. However, the magnitude of any flushing and dilution of DOC, and the consequent implications for carbon availability and water treatment, will likely be more pronounced in rivers rather than lakes, as the effects in lakes or reservoirs will likely be damped depending on their retention time.

Author Contributions

Conceptualization, E.J. and E.d.E.; methodology, E.J., E.d.E., E.R., L.R., C.N.A., N.A., M.R. and M.D.; formal analysis, E.J.; writing—original draft preparation, E.J.; writing—review and editing, E.d.E., L.R., T.M., M.D., C.N.A., R.P.; project administration, E.J., D.C.P.; funding acquisition, D.C.P., E.J. and E.d.E. All authors have read and agreed to the published version of the manuscript.

Funding

The authors would like to thank the EU, FORMAS (Sweden), and the Environmental Protection Agency (Ireland) for funding, in the frame of the collaborative international Consortium PROGNOS financed under the ERA-NET WaterWorks 2014 Cofunded Call. This ERA-NET is an integral part of the 2015 Joint Activities developed by the Water Challenges for a Changing World Joint Programme Initiative (Water JPI). The work was also supported by the Marine Institute, grant number PBA/FS/16/02, through the BEYOND 2020 project. CNicA was funded from 2003–2005 by EU contract EVK1-CT-2002-00121 CLIME.

Acknowledgments

The authors acknowledge the field staff of the Marine Institute Newport Research Facility for their field and logistical support (Joseph Cooney, Pat Nixon, Pat Hughes, Michael Murphy and David Sweeney).

Conflicts of Interest

The authors declare no conflict of interest.

References

  1. Worrall, F.; Burt, T.P. Trends in DOC concentration in Great Britain. J. Hydrol. 2007, 346, 81–92. [Google Scholar] [CrossRef]
  2. Monteith, D.T.; Stoddard, J.L.; Evans, C.D.; De Wit, H.A.; Forsius, M.; Høgåsen, T.; Wilander, A.; Skjelkvåle, B.L.; Jeffries, D.S.; Vuorenmaa, J.; et al. Dissolved organic carbon trends resulting from changes in atmospheric deposition chemistry. Nature 2007, 450, 537. [Google Scholar] [CrossRef] [PubMed]
  3. Argerich, A.; Haggerty, R.; Johnson, S.L.; Wondzell, S.M.; Dosch, N.; Corson-Rikert, H.; Ashkenas, L.R.; Pennington, R.; Thomas, C.K. Comprehensive multiyear carbon budget of a temperate headwater stream. J. Geophys. Res. Biogeosci. 2016, 121, 1306–1315. [Google Scholar] [CrossRef]
  4. Jennings, E.; Allott, N.; Arvola, L.; Jarvinen, M.; Moore, K.; Naden, P.; Nic Aongusa, C.; Noges, T.; Weyhermeyer, G. Impacts of climate on the flux of dissolved organic carbon from catchments. In The Impact of Climate Change on European Lakes; George, D.G., Ed.; Springer: Dordrecht, The Netherlands, 2010. [Google Scholar]
  5. Scharlemann, J.P.; Tanner, E.V.; Hiederer, R.; Kapos, V. Global soil carbon: Understanding and managing the largest terrestrial carbon pool. Carbon Manag. 2014, 5, 81–91. [Google Scholar] [CrossRef]
  6. Ward, N.D.; Bianchi, T.S.; Medeiros, P.M.; Seidel, M.; Richey, J.E.; Keil, R.G.; Sawakuchi, H.O. Where carbon goes when water flows: Carbon cycling across the aquatic continuum. Front. Marine Sci. 2017, 4, 7. [Google Scholar] [CrossRef] [Green Version]
  7. Sillanpää, M.; Ncibi, M.C.; Matilainen, A.; Vepsäläinen, M. Removal of natural organic matter in drinking water treatment by coagulation: A comprehensive review. Chemosphere 2018, 190, 54–71. [Google Scholar] [CrossRef]
  8. Monteith, D.T.; Henrys, P.A.; Evans, C.D.; Malcolm, I.; Shilland, E.M.; Pereira, M.G. Spatial controls on dissolved organic carbon in upland waters inferred from a simple statistical model. Biogeochemistry 2015, 123, 363–377. [Google Scholar] [CrossRef] [Green Version]
  9. Hinton, M.J.; Schiff, S.L.; English, M.C. The significance of storms for the concentration and export of dissolved organic carbon from two Precambrian Shield catchments. Biogeochemistry 1997, 36, 67–88. [Google Scholar] [CrossRef]
  10. Raymond, P.A.; Saiers, J.E. Event controlled DOC export from forested watersheds. Biogeochemistry 2010, 100, 197–209. [Google Scholar] [CrossRef]
  11. Vaughan, M.C.; Bowden, W.B.; Shanley, J.B.; Vermilyea, A.; Sleeper, R.; Gold, A.J.; Pradhanang, S.M.; Inamdar, S.P.; Levia, D.F.; Andres, A.S.; et al. High-frequency dissolved organic carbon and nitrate measurements reveal differences in storm hysteresis and loading in relation to land cover and seasonality. Water Resour. Res. 2017, 53, 5345–5363. [Google Scholar] [CrossRef]
  12. Koenig, L.E.; Shattuck, M.D.; Snyder, L.E.; Potter, J.D.; McDowell, W.H. Deconstructing the Effects of Flow on DOC, Nitrate, and Major Ion Interactions Using a High-Frequency Aquatic Sensor Network. Water Resour. Res. 2017, 53, 10655–10673. [Google Scholar] [CrossRef]
  13. Clark, J.M.; Lane, S.N.; Chapman, P.J.; Adamson, J.K. Export of dissolved organic carbon from an upland peatland during storm events: Implications for flux estimates. J. Hydrol. 2007, 347, 438–447. [Google Scholar] [CrossRef]
  14. Clark, J.M.; Lane, S.N.; Chapman, P.J.; Adamson, J.K. Link between DOC in near surface peat and stream water in an upland catchment. Sci. Total Environ. 2008, 404, 308–315. [Google Scholar] [CrossRef] [PubMed]
  15. Holden, J.; Smart, R.P.; Dinsmore, K.J.; Baird, A.J.; Billett, M.F.; Chapman, P.J. Natural pipes in blanket peatlands: Major point sources for the release of carbon to the aquatic system. Glob. Chang. Biol. 2012, 18, 3568–3580. [Google Scholar] [CrossRef] [Green Version]
  16. Austnes, K.; Evans, C.D.; Eliot-Laize, C.; Naden, P.S.; Old, G.H. Effects of storm events on mobilisation and in-stream processing of dissolved organic matter (DOM) in a Welsh peatland catchment. Biogeochemistry 2010, 99, 157–173. [Google Scholar] [CrossRef] [Green Version]
  17. Tunaley, C.; Tetzlaff, D.; Soulsby, C. Scaling effects of riparian peatlands on stable isotopes in runoff and DOC mobilisation. J. Hydrol. 2017, 549, 220–235. [Google Scholar] [CrossRef] [Green Version]
  18. Koehler, A.K.; Murphy, K.; Kiely, G.; Sottocornola, M. Seasonal variation of DOC concentration and annual loss of DOC from an Atlantic blanket bog in South Western Ireland. Biogeochemistry 2009, 95, 231–242. [Google Scholar] [CrossRef]
  19. Ryder, E.; de Eyto, E.; Dillane, M.; Poole, R.; Jennings, E. Identifying the role of environmental drivers in organic carbon export from a forested peat catchment. Sci. Total Environ. 2014, 490, 28–36. [Google Scholar] [CrossRef]
  20. Doyle, B.C.; de Eyto, E.; Dillane, M.; Poole, R.; McCarthy, V.; Ryder, E.; Jennings, E. Synchrony in catchment stream colour levels is driven by both local and regional climate. Biogeosciences 2019, 16, 1053–1071. [Google Scholar] [CrossRef] [Green Version]
  21. Worrall, F.; Burt, T.P.; Jaeban, R.Y.; Warburton, J.; Shedden, R. Release of dissolved organic carbon from upland peat. Hydrol. Process. 2002, 16, 3487–3504. [Google Scholar] [CrossRef]
  22. Birkel, C.; Broder, T.; Biester, H. Nonlinear and threshold-dominated runoff generation controls DOC export in a small peat catchment. J. Geophys. Res. Biogeosci. 2017, 122, 498–513. [Google Scholar] [CrossRef] [Green Version]
  23. Knorr, K.H. DOC-dynamics in a small headwater catchment as driven by redox fluctuations and hydrological flow paths–Are DOC exports mediated by iron reduction/oxidation cycles? Biogeosciences 2013, 10, 891–904. [Google Scholar] [CrossRef] [Green Version]
  24. de Eyto, E.; Jennings, E.; Ryder, E.; Sparber, K.; Dillane, M.; Dalton, C.; Poole, R. Response of a humic lake ecosystem to an extreme precipitation event: Physical, chemical, and biological implications. Inland Waters 2016, 6, 483–498. [Google Scholar] [CrossRef] [Green Version]
  25. Watras, C.J.; Hanson, P.C.; Stacy, T.L.; Morrison, K.M.; Mather, J.; Hu, Y.H.; Milewski, P. A temperature compensation method for CDOM fluorescence sensors in freshwater. Limnol. Oceanogr. Methods 2011, 9, 296–301. [Google Scholar] [CrossRef] [Green Version]
  26. Ryder, E.; Jennings, E.; de Eyto, E.; Dillane, M.; NicAonghusa, C.; Pierson, D.C.; Moore, K.; Rouen, M.; Poole, R. Temperature quenching of CDOM fluorescence sensors: Temporal and spatial variability in the temperature response and a recommended temperature correction equation. Limnol. Oceanogr. Methods 2012, 10, 1004–1010. [Google Scholar] [CrossRef]
  27. Downing, B.D.; Pellerin, B.A.; Bergamaschi, B.A.; Saraceno, J.F.; Kraus, T.E. Seeing the light: The effects of particles, dissolved materials, and temperature on in situ measurements of DOM fluorescence in rivers and streams. Limnol. Oceanogr. Methods 2012, 10, 767–775. [Google Scholar] [CrossRef]
  28. Arnold, J.G.; Allen, P.M. Automated methods for estimating baseflow and ground water recharge from streamflow records 1. JAWRA J. Am. Water Resour. Assoc. 1998, 35, 411–424. [Google Scholar] [CrossRef]
  29. Gustard, A.; Bullock, A.; Dixon, J.M. Low Flow Estimation in the United Kingdom; (IH Report No.108); Institute of Hydrology: Wallingford, UK, 1992; p. 88. [Google Scholar]
  30. Lloyd, C.E.M.; Freer, J.E.; Johnes, P.J.; Collins, A.L. Using hysteresis analysis of high-resolution water quality monitoring data, including uncertainty, to infer controls on nutrient and sediment transfer in catchments. Sci. Total Environ. 2016, 543, 388–404. [Google Scholar] [CrossRef] [PubMed] [Green Version]
  31. Butturini, A.; Alvarez, M.; Bernal, S.; Vazquez, E.; Sabater, F. Diversity and temporal sequences of forms of DOC and NO3-discharge responses in an intermittent stream: Predictable or random succession? J. Geophys. Res. Biogeosci. 2008, 113, G01016. [Google Scholar] [CrossRef]
  32. Wood, S.N. Stable and efficient multiple smoothing parameter estimation for generalized additive models. J. Am. Stat. Assoc. 2004, 99, 673–686. [Google Scholar] [CrossRef] [Green Version]
  33. R Core Team. R: A Language and Environment for Statistical Computing; R Foundation for Statistical Computing: Vienna, Austria, 2017; Available online: https://www.R-project.org/ (accessed on 21 September 2019).
  34. Zuur, A.F.; Ieno, E.N.; Walker, N. Mixed Effects Models and Extensions in Ecology with R; Springer: New York, NY, USA, 2008. [Google Scholar]
  35. Sekhon, J.S. Multivariate and Propensity Score Matching Software with Automated Balance Optimization: The Matching package for R. J. Stat. Softw. 2011, 42, 1–52. [Google Scholar] [CrossRef] [Green Version]
  36. Inamdar, S.P.; O’Leary, N.; Mitchell, M.J.; Riley, J.T. The impact of storm events on solute exports from a glaciated forested watershed in western New York, USA. Hydrol. Process. An Int. J. 2006, 20, 3423–3439. [Google Scholar] [CrossRef]
  37. Fenner, N.; Freeman, C. Drought-induced carbon loss in peatlands. Nat. Geosci. 2011, 4, 895–900. [Google Scholar] [CrossRef]
  38. Ritson, J.P.; Brazier, R.E.; Graham, N.J.; Freeman, C.; Templeton, M.R.; Clark, J.M. The effect of drought on dissolved organic carbon (DOC) release from peatland soil and vegetation sources. Biogeosciences 2017, 14, 2891–2902. [Google Scholar] [CrossRef] [Green Version]
  39. Guarch-Ribot, A.; Butturini, A. Hydrological conditions regulate dissolved organic matter quality in an intermittent headwater stream. From drought to storm analysis. Sci. Total Environ. 2016, 571, 1358–1369. [Google Scholar] [CrossRef] [Green Version]
  40. Rezanezhad, F.; Price, J.S.; Quinton, W.L.; Lennartz, B.; Milojevic, T.; Van Cappellen, P. Structure of peat soils and implications for water storage, flow and solute transport: A review update for geochemists. Chem. Geol. 2016, 429, 75–84. [Google Scholar] [CrossRef]
  41. Worrall, F.; Reed, M.; Warburton, J.; Burt, T. Carbon budget for a British upland peat catchment. Sci. Total Environ. 2003, 312, 133–146. [Google Scholar] [CrossRef]
  42. Sparber, K.; Dalton, C.; de Eyto, E.; Jennings, E.; Cassina, F. Contrasting pelagic plankton of temperate Irish lakes: The relative contribution of hetero-, mixo- and autotrophic components. Inland Waters 2015, 5, 295–310. [Google Scholar] [CrossRef]
  43. Bertilsson, S.; Tranvik, L.J. Photochemical transformation of dissolved organic matter in lakes. Limnol. Oceanogr. 2000, 45, 753–762. [Google Scholar] [CrossRef]
Figure 1. The Burrishoole catchment in Ireland, showing the outlines of the catchment and of the Glenamong River sub-catchment, the locations of the chromophoric dissolved organic matter (CDOM) sensors on the Glenamong and on the lake (Feeagh) and locations of the three Glenamong sub-catchment rain gauges (stars). The areas of coniferous forestry are also indicated.
Water 12 02843 g001
Figure 2. (a) Relationships between dissolved organic carbon (DOC) concentration and mean hourly CDOM fluorescence for the Glenamong River which were used to convert hourly CDOM data to estimated DOC concentrations for G1 from 2003 to 2008 (blue) and for G2 data from 2008 to 2011 (orange); (b) relationship between DOC concentration and mean daily CDOM fluorescence used to convert hourly CDOM data to estimated DOC concentrations for Lough Feeagh (F1) for 2010–2011. Note the differences in scale between a. and b.
Water 12 02843 g002
Figure 3. Estimated mean hourly (grey) and daily (black) DOC concentrations (mg L−1) and stream discharge (Q) (m3 s−1) for the Glenamong River for (a) 2004, (b) 2006, and (c) 2010 for the Glenamong sub-catchment.
Water 12 02843 g003
Figure 4. The relationship between stream discharge (Q) and estimated DOC concentration at a daily time step for (a) 2004, (b) 2006, and (c) 2010; (d): the smoother for the relationship between discharge and estimated DOC concentrations for 2010 (the solid line is the smoother and the grey area is the 95% confidence band in this plot). The y axis is the centered smoother, showing the estimated degrees of freedom (7.12) for the model in brackets.
Water 12 02843 g004
Figure 5. Estimated DOC concentrations during extreme discharge events (where discharge exceeded the 90th percentile): (a) a typical dilution event (13–14 February 2006); (b) the largest flushing event in the time series (30 June–1 July 2010); (c) three sequential dilution events in December 2006; (d) two-day period with 1. a dilution event, 2. falling limb increase in concentration (29–30 December 2004); (e) a flushing event with a prolonged increase in DOC concentration (8–9 July 2006); (f) an event with a small increase on the rising limb (26–28 December 2010).
Water 12 02843 g005
Figure 6. The number of extreme discharge events (events > 90th percentile) classified as either DOC dilution (grey) or flushing (black) events per month for the calendar years (a) 2004, (c) 2006, and (e) 2010 for the Glenamong River; the average change (+ or − S.D.) in the concentration of DOC for dilution events (−, black), and flushing events (+, grey) (b) 2004, (d) 2006 and (f) 2010. Numbers in italics = number of events for which estimated DOC data were missing in that month.
Water 12 02843 g006
Figure 7. (a) Estimated daily DOC loading per hectare to Lough Feeagh based on the data for the Glenamong sub-catchment March 2010 to December 2011; (b) estimated hourly DOC concentration in the Glenamong River (grey) and in Lough Feeagh (black).
Water 12 02843 g007
Table 1. Summary data for the three study years for the Glenamong River.
Year200420062010
Annual precipitation mm yr−1212521081599
Median daily Q m3 s−10.400.340.29
Mean daily Q m3 s−10.770.910.67
% hours as runoff42.335.432.7
% hours as baseflow57.764.667.3
Median DOC mg L−1 all hours 17.76.77.4
Median DOC mg L−1 runoff hours 17.36.58.0
Median DOC mg L−1 baseflow hours 18.06.87.4
Total annual load t km−210.310.910.0
% load runoff hours62.360.961.6
% load baseflow hours37.739.138.4
% load h in 10% of time43.449.054.8
1 median for all timesteps for which data were available.
Table 2. Summary data for dilution and flushing events for the three selected study.
2004 2006 2010
No. dilution events54 63 33
No. flushing events19 28 25
No. with missing DOC data15 0 3
Total number of events88 91 62
1 Change in (DOC) mg L−1Dilut.Flush.Dilut.Flush.Dilut.Flush.
Max−6.603.89−3.452.96−2.545.89
Mean−1.120.83−0.890.65−0.840.89
Median−0.970.59−0.800.48−0.670.45
1 for timesteps for which estimated DOC data were available.

