Article

Evaluation of Permeable Brick Pavement on the Reduction of Stormwater Runoff Using a Coupled Hydrological Model

1
College of Architecture and Civil Engineering, Beijing University of Technology, Beijing 100124, China
2
State Key Laboratory of Simulation and Regulation of Water Cycle in River Basin, China Institute of Water Resources and Hydropower Research, Beijing 100038, China
3
School of Transportation and Civil Engineering and Architecture, Foshan University, Foshan 528000, China
*
Author to whom correspondence should be addressed.
Water 2020, 12(10), 2821; https://doi.org/10.3390/w12102821
Submission received: 12 August 2020 / Revised: 6 October 2020 / Accepted: 8 October 2020 / Published: 11 October 2020

Abstract

:
In several cities, permeable brick pavement (PBP) plays a key role in stormwater management. Although various hydrological models can be used to analyze the mitigation efficiency of PBP on rainfall runoff, the majority do not consider the effect of multi-layered pavement on infiltration in urban areas. Therefore, we developed a coupled model to evaluate the potential effect of PBP in reducing stormwater runoff at a watershed scale. Specifically, we compared the hydrological responses (outflow and overflow) of three different PBP scenarios. The potential effects of PBP on peak flow (PF), total volume (TV), and overflow volume (OV) were investigated for 20 design rainstorms with different return periods and durations. Our results indicate that an increase in PBP ratio reduces both PF (4.2–13.5%) and TV (4.2–10.5%) at the outfall as well as the OV (15.4–30.6%) across networks. The mitigation effect of PBP on OV is linearly correlated to storm return period and duration, but the effects on PF and TV are inversely correlated to storm duration. These results provide insight on the effects of infiltration-based infrastructure on urban flooding.

1. Introduction

Extensive impervious surfaces associated with rapid urbanization has greatly exacerbated the threat of flooding for several cities around the world [1]. In recent decades, both urban flooding and waterlogging have become common occurrences along the southeastern coast of China, specifically along watersheds due to the large volume of rainstorm runoff [2]. Within this context, the concept of a Sponge City (SPC) was proposed to support natural hydrological processes by reducing rainfall runoff through infiltration, detention, and retention [3]. Several municipalities have implemented these designs for improved urban permeability by increasing infiltration ability and reducing surface runoff [4]. Hence, several infrastructure designs are gradually including infiltration as an alternative to traditional drainage systems. Permeable pavement (PP), for example, is commonly used to reduce stormwater runoff, thereby increasing soil infiltration and water storage [5]. Accordingly, the effect of permeable brick pavement (PBP) on reducing rainfall runoff under various conditions associated with typical watersheds has received increased research interest [6].
Results from previous studies indicate PBP to be one of the most beneficial types of PP for urban units (e.g., parking lots and footpaths), due to reductions in runoff volume, peak flow, and the corresponding pressure on drainage systems [7,8]. A study has reported that the implementation of PP and other source-control solutions at small urban catchment scales can reduce the peak flows and the runoff volume by 14–45% and 9–23%, respectively [9]. Indeed, some works have shown that the reduction performance of stormwater runoff is influenced by the PP application area [10,11].
Although it is generally acknowledged that soil infiltration in PP areas has a positive impact on urban stormwater problems, the full potential of PP to reduce rainwater runoff as well as the related effects of various storm characteristics remain unclear [12]. Notably, the efficiency of PBP is significantly influenced by the total volume and duration of the rainfall. A study in Central Illinois, USA, discussed the variation of using conversion PP practices (25%, 50%, 75% and 100% levels) to mitigate the flood risk in urban watersheds [13]. Ren et al. reported that stable infiltration rates (SIR) and total infiltration (TI) of PBP can effectively mitigate urban flooding for small storms (of the 1-, 5-, 10- and 15-year return periods) [14]. Furthermore, the permeability values for large scale (>10 km2) urbanized watersheds are not only affected by PBP dimensions and surface types [15], but also by the specific filling material and soil thickness [16]. Therefore, to investigate the potential of PBP to reduce rainfall runoff requires the knowledge of the associated variables and tools.
Hydrological models such as storm water management models (SWMM) are widely used for investigating the mitigating effects of green infrastructure (GI) on surface runoff and drainage systems [17]. However, the overall effect on infiltration under different rainfall conditions and in combination with pavement types in urbanized catchment areas has not yet been fully investigated [18]. Although several models such as Soil Conservation Service (SCS) Curve Numbers, Green-Ampt, and Horton have been used to simulate the infiltration of porous areas during rainfall events [19,20,21], there is an increasing need for accurate and physically based descriptions of specific PP type and filling material for comprehensive urban hydrological modeling [22]. For example, although SWMM considers sewer systems in the simulation of rainfall runoff for complex land-use areas, it does not consider soil type and spatial distribution. Furthermore, the HYDRUS-1D model includes multiple types of paving and filling materials to site scale, but is limited in terms of land-use types due to the incorporation of sub-catchment runoff processes [23]. Thus, we suggest that a combination of the SWMM and HYDRUS-1D models is beneficial for analyzing the potential effects of PBP systems at a watershed scale.
In this study, the hydrological and mitigation effects of PBP on stormwater runoff are quantified using a coupled model (SWMM/HYDRUS-1D), with the coastal urban watershed of Xiamen, China as the study area. The main aim of this paper is to investigate and quantitatively evaluate the potential of PBP in reducing stormwater runoff at watershed scale. The specific objectives of the study are the following: (1) simulation of the infiltration process and runoff depth variation of PBP during rainstorms; (2) input of 20 design rainstorms representing various weather conditions in the study area; (3) quantification of the potential mitigation effect of three hypothetical PBP scenarios on outfall flow and overflow volume; and (4) comparison of various PBP dimensions under different rainstorm conditions to reduce urban flooding and waterlogging for sustainable stormwater management.

2. Materials and Methods
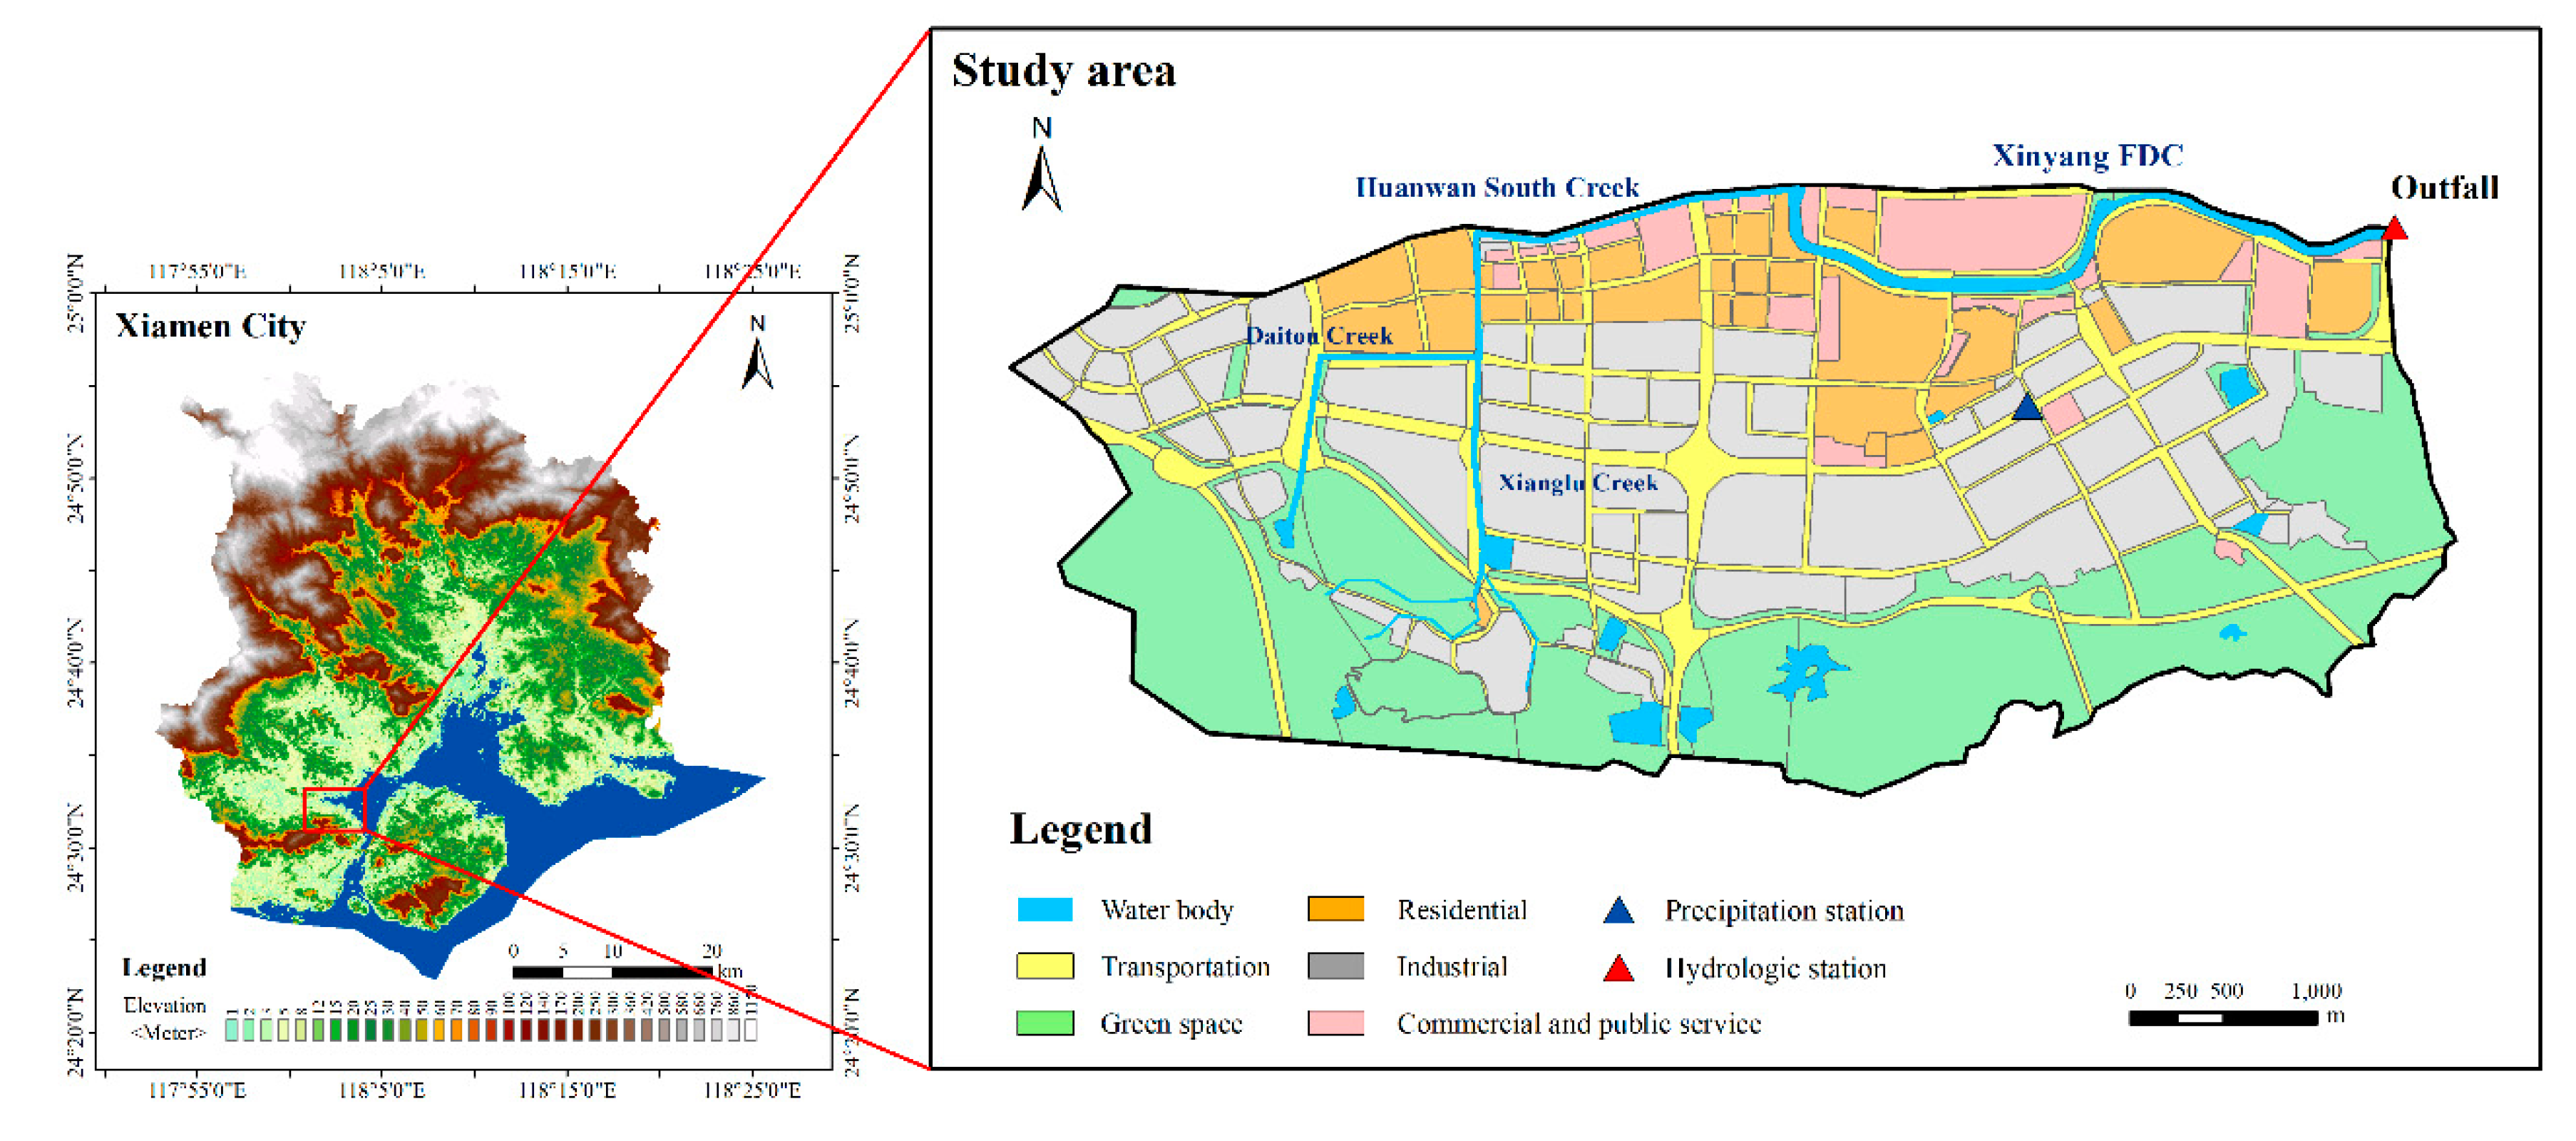
2.1. Study Area

The study area consists of the Xinyang flood drainage canal (FDC) watershed that belongs to the Maluan Bay (China) and lies in the proximity of Xiamen City on the Southeast coast of China (Figure 1). The study area has a sloping terrain, from the northwest to the southeast, with an average slope of 1.98‰. The watershed can be divided into six land-use types including residential, industrial, commercial and public services, transportation, green space, and water bodies, covering the total area of 33 km2, of which 52.3% is impervious. Currently, PBP covers 2.19 km2 of the catchment area with PP systems.
The soil underlying the Xinyang FDC watershed includes silty clay, sandy clay, silty sand, and artificial loam, with the groundwater level lying between 1.0–4.5 m. Urban drainage networks and river canals are 84.6 and 20 km long, respectively, and river and sewerage flow are gravity driven. Overall, conduits are designed considering rainstorms with return periods (RP) of 5 to 10 years, resulting in diameters between 0.4 and 2.1 m.

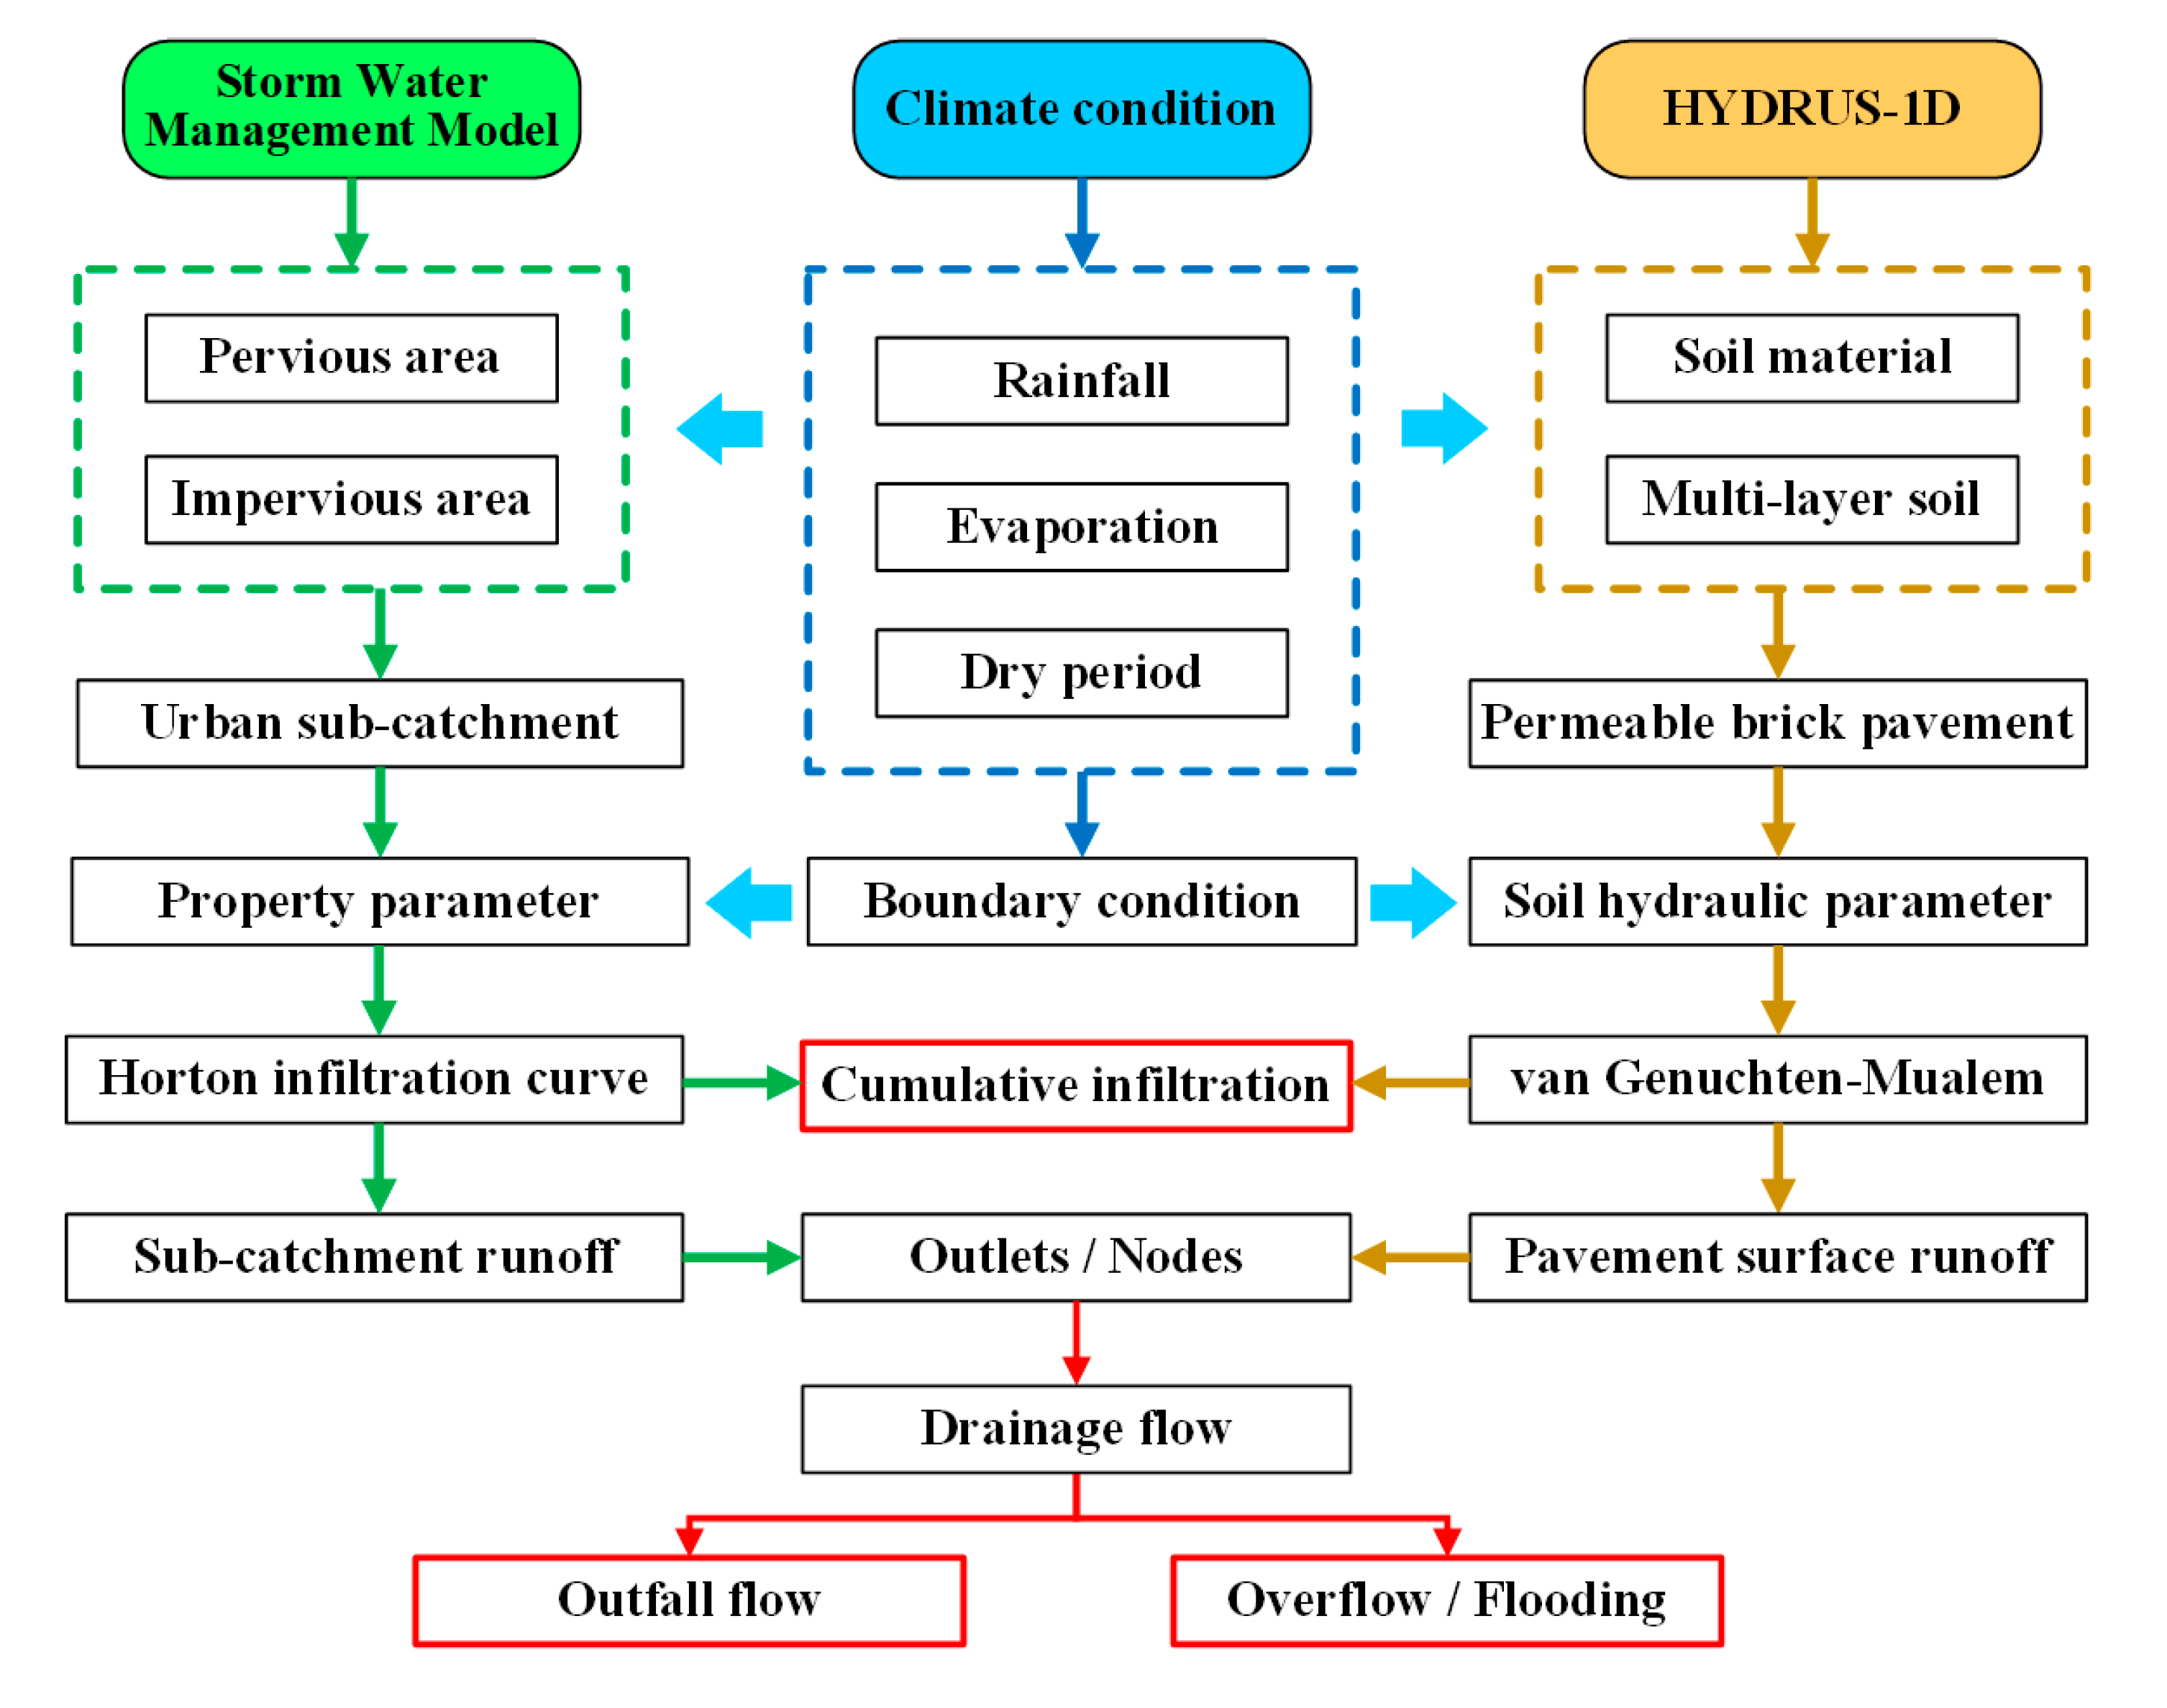
2.2. Coupled Model (SWMM/HYDRUS-1D)

The SWMM developed by the United States Environmental Protection Agency (USEPA) has been used globally in numerous studies for the simulation of urban flooding [14,24]. Together with the simulation of hydrological processes in sub-catchments, the model also describes grey infrastructure stormwater control strategies, such as pipes and storm drains. Using the SWMM, we divided the Xinyang FDC watershed into 420 sub-catchments, according to the spatial distribution of land-use types and municipal boundaries. The sub-catchment width was calculated using the formula method (Table 1) and geographic information systems (GIS). Parameters such as average ground slope as well as the roughness coefficients of sub-catchments and pipelines or open channels were set according to reference values obtained from the SWMM user manual [21]. The infiltration process was calculated using the Horton model [19], and initial infiltration parameters were set according to the spatial distribution of land-use types and existing case studies [25]. Table 1 lists the primary values of the physically based parameters for the SWMM.
The HYDRUS-1D model is considered an effective tool for solving the Richards’ equation in one-dimensional finite element models [26,27]. In this study, the rainfall runoff process for a five-layered PBP system was simulated using HYDRUS-1D. The impervious coefficient can directly influence the surface runoff quantity. The residual water content (θr), saturated water content (θs), hydraulic shape parameter (α), hydraulic parameter (n) and saturated hydraulic conductivity (Ks) of each soil layer were calculated from pedotransfer functions (Neural Network Prediction) which relate easily measured soil properties such as texture and bulk density with the hydraulic parameters [28]. The pedotransfer functions used in HYDRUS-1D are those developed by Schaap et al. as incorporated into their Rosetta module [29]. Based on the results of previous studies and technical standards for local PP construction in Xiamen [8,30], and then the corresponding values of soil hydraulic parameters were obtained. The PBP surface material and underground filling material had a total depth profile of 1000 mm, which corresponds to the parameters reported in Table 2.
The critical hydrological and hydrodynamic processes in the sub-catchments, drainage systems, and PBP systems were investigated using the SWMM/HYDRUS-1D-coupled model. This model was developed on a Python platform, linking SWMM and HYDRUS-1D by information exchange at connecting nodes (or outlets of sub-catchments). Figure 2 shows a schematic representation of the SWMM/HYDRUS-1D-coupled model framework.

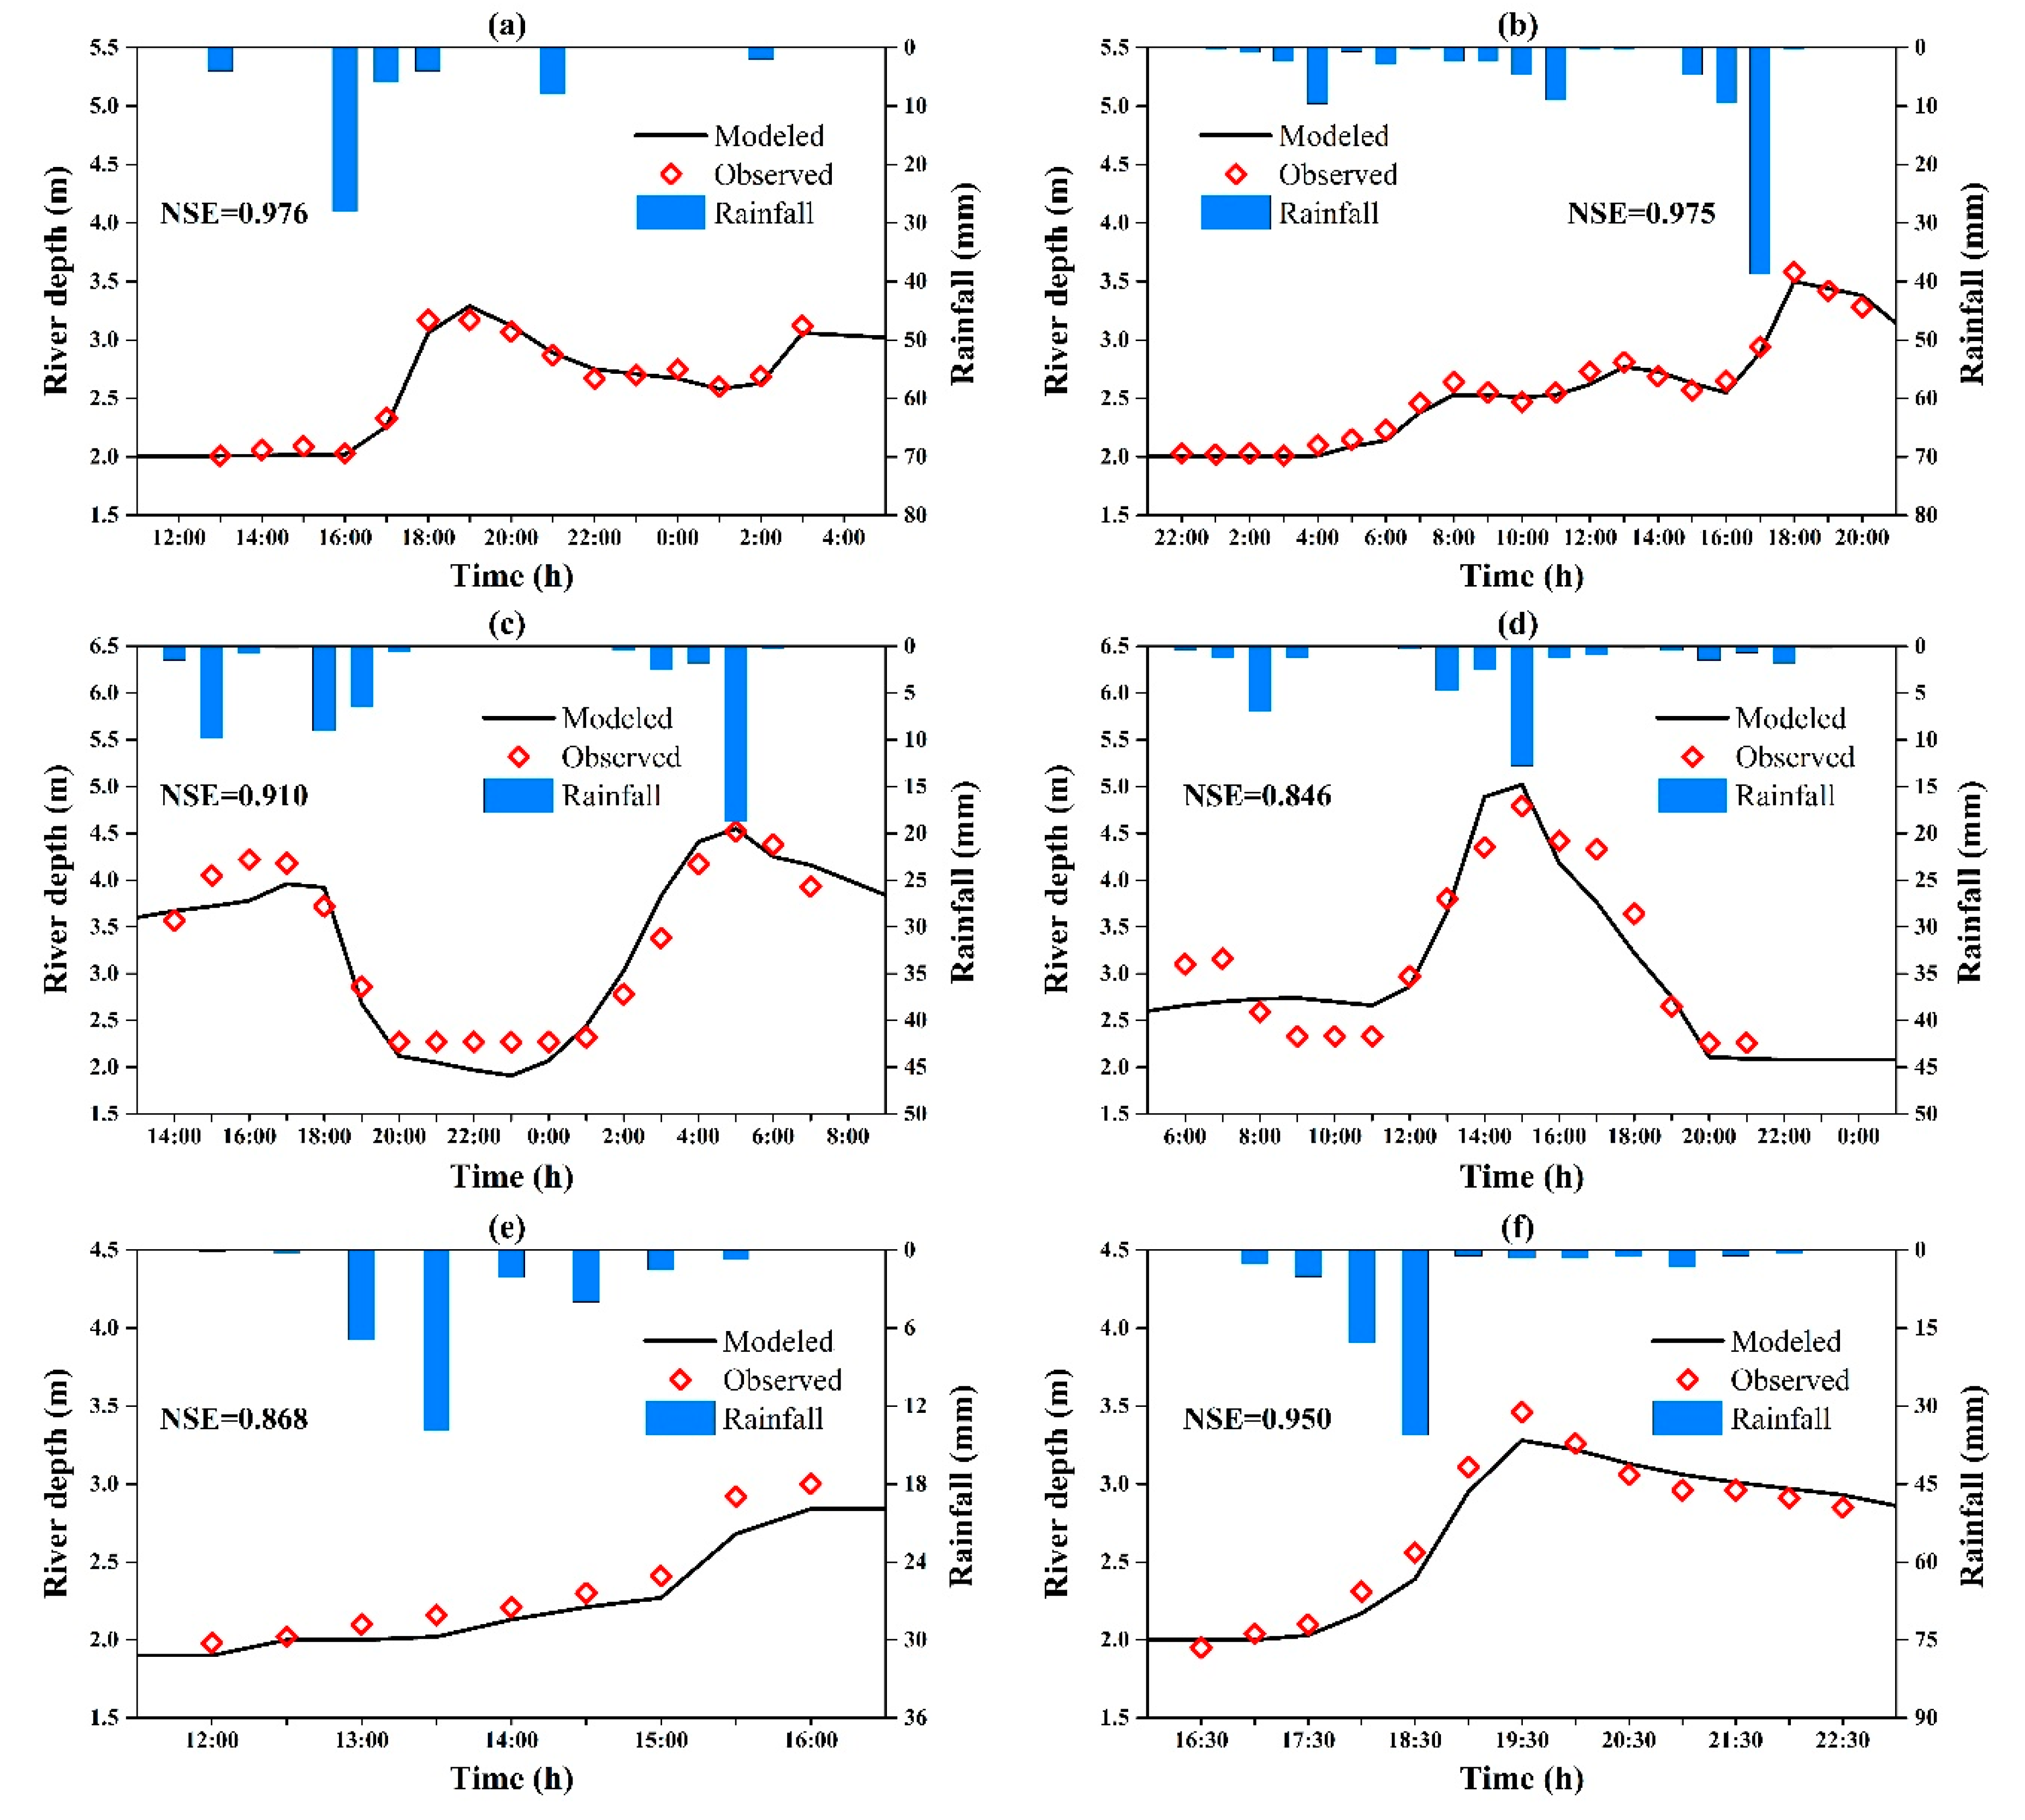
2.3. Calibration and Validation

The history rainfall data used in this study included six events, collected between May 2019 and August 2019 by the precipitation station at the Xinyang Street, with a resolution of 0.1 mm (Figure 1). To calibrate the hydrological and hydrodynamic parameters of the coupled model, simulated data were compared with observed water levels on 20 July 2019 and 24 August 2019. Furthermore, observed and modeled data for 26 May 2019, 24 June 2019, 22 July 2019 and 17 August 2019 rainfall events were used for validation (Table 3). River depth was measured every 30 min using a 0.01 m resolution water-level recorder with a large range of water level (0–20 m). The observed data of river depth were collected from Wengcuo Dam hydrologic station which located at the outfall of the Xinyang FDC watershed (Figure 1).
The Nash-Sutcliffe efficiency (NSE) is a common model performance indicator for evaluating the goodness-of-fit between simulated and observed values [31] and can be described using the following formula:
N S E = 1 i = 1 n ( S i O i ) 2 i = 1 n ( O i O ¯ ) 2
where Si is the simulated depth at the ith time step, Oi is the observed depth at the ith time step, and O ¯ is the mean value of the observed depth. If the NSE value > 0.5, the simulated data can be deemed acceptable. The closer the NSE value is to 1, the better the performance of the model.

2.4. Development of Different Scenarios

2.4.1. PBP Implementation Scenarios

Four scenarios were investigated using the developed SWMM/HYDRUS-1D-coupled model including the current scenario (S1) and three PBP scenarios (S2–S4). Scenario S1 represented present conditions of the study area with a PBP area of 2.19 km2 accounting for approximately 25% of the total areas allowing the construction of permeable facilities, whereas S2, S3, and S4 represented design scenarios with 50, 75, and 100% PBP percentages. S1 is assumed as the reference scenario in order to quantify the impact of the PBP application. Table 4 illustrates the PBP implementation scenarios and the corresponding paving size and percentage.

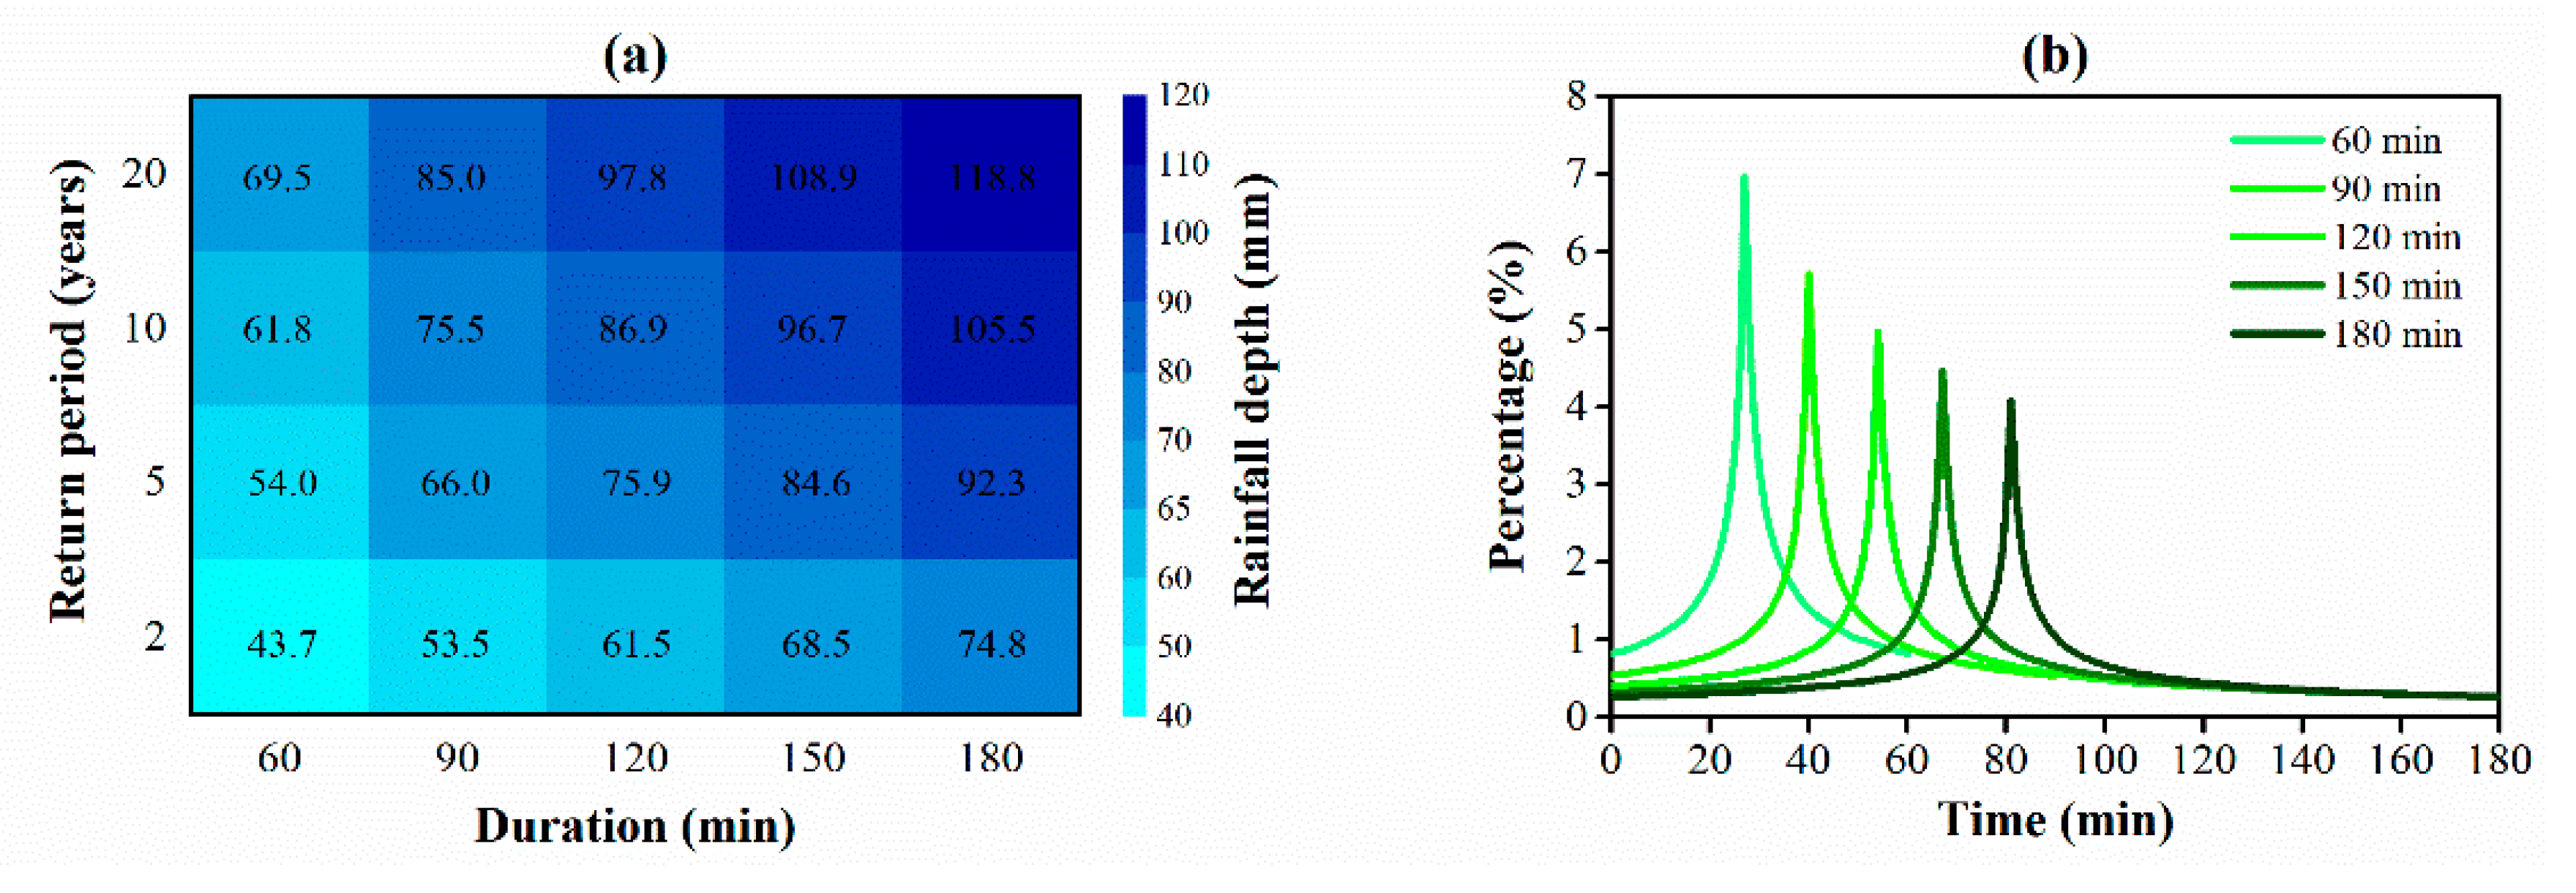
2.4.2. Design Rainstorm Events

Design rainstorms with different RPs under past and future conditions were calculated for Xiamen according to the following rainstorm intensity formula [2,32], which is widely used for Xiamen city:
q = 928.15 ( 1 + 0.716 lg P ) ( t + 4.4 ) 0.535
where q is rainstorm intensity [L/(s·hm2)], t is the design duration of rainfall (min), and P is RP (years). For the scope of application, 5 min ≤ t ≤ 180 min.
According to the standard of rainstorm runoff calculation for urban storm drainage system planning and design [32], five rainstorm durations (60, 90, 120, 150, and 180 min) and four RPs (2, 5, 10, and 20 years) were chosen for the design rainstorms used in this study. As the design rainstorms were calculated using the same formulas, the rainfall intensity distribution over the entire catchment was assumed to be uniform. The calculated rainfall and distribution for each rainfall duration and RP are shown in Figure 3.

3. Results and Discussion

3.1. Model Performance Evaluation

At present, history observed data in an urban area is very limited [2,33]. For instance, drainage networks flow and overflow depth are not in the contents of conventional hydrological observation, the observation equipment, and the historic observation datasets are very scarce. So in this case study, two rainfall events (20 July 2019 and 24 August 2019) and four rainfall events (26 May 2019, 24 June 2019, 22 July 2019 and 17 August 2019) were used for calibration and validation respectively. The modeled river depth of Xinyang FDC outfall was compared with the measured data in terms of NSE, which is defined in formula (1). The parameter ranges were determined by experimentation and an investigation of the literature [34,35], and the initial values were set by experience [21] by adjusting the key parameters in their ranges to perform numerical simulation experiments, and then the calibrated parameters for local rainfall runoff simulation are recommended in Table 1.
Overall, the variation in modeled depth was consistent with the observed depth (Figure 4), providing credibility for the simulation of rainfall runoff. Furthermore, the 20 July 2019 and 24 August 2019 events showed an NSE value of 0.976 and 0.975, respectively, in the calibration phase (Figure 4a,b), whereas the estimated parameters resulted in NSE values of 0.910, 0.846, 0.868 and 0.950 for the 26 May 2019, 24 June 2019, 22 July 2019 and 17 August 2019 events, respectively (Figure 4c–f). Therefore, the calibration and validation process demonstrated the reliability of the coupled model for rainfall runoff simulation [9,36]. The calibrated values of the primary parameters for the hydrological and hydrodynamic model are reported in Table 1.

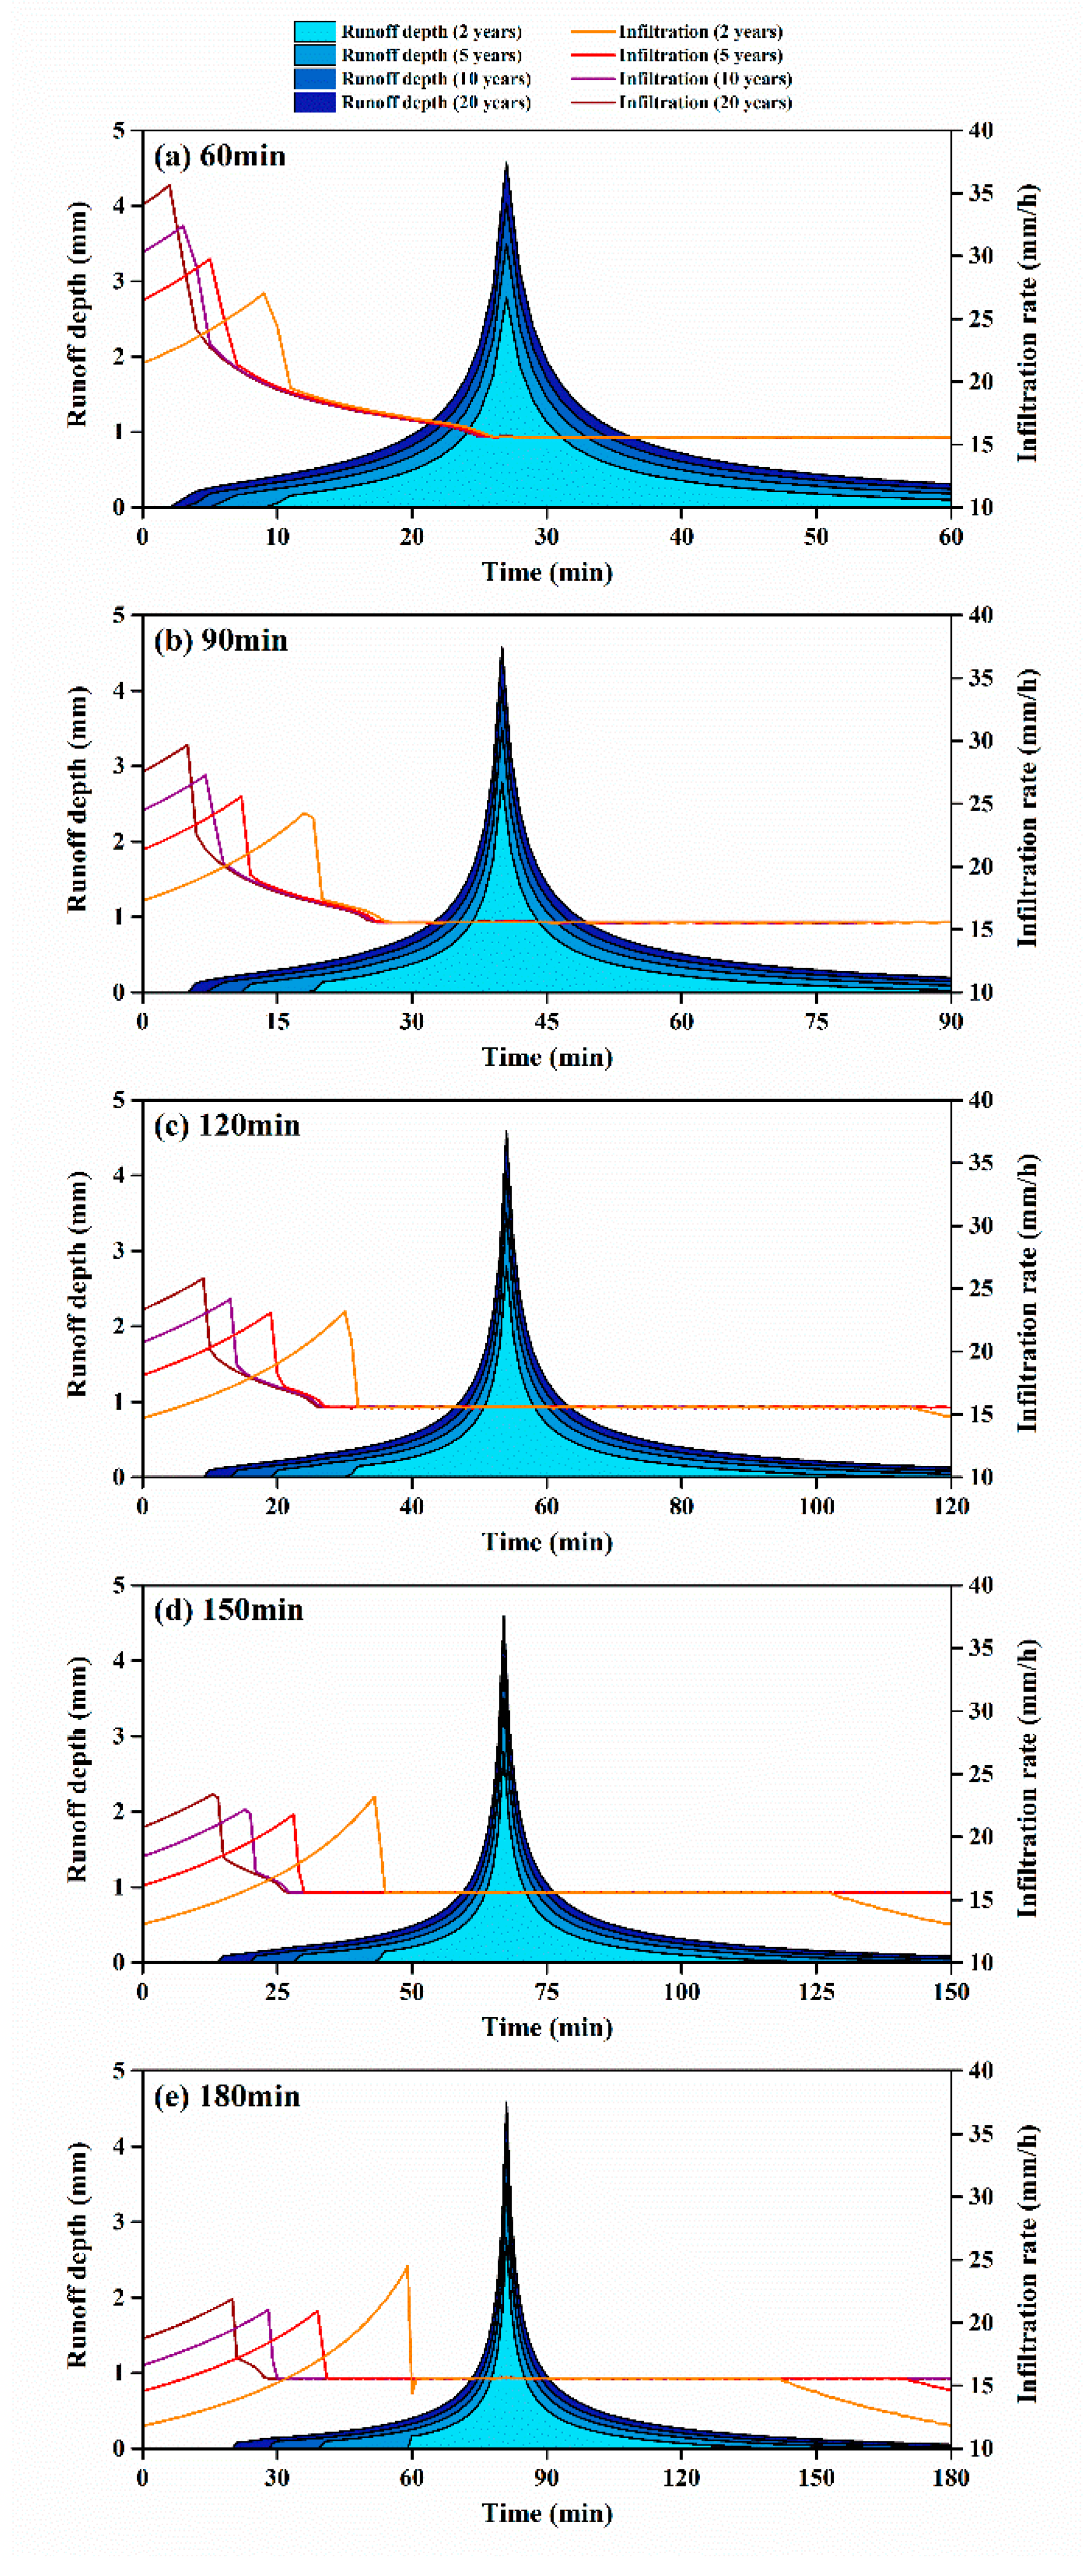
3.2. Rainstorm Runoff Depth and Infiltration Rate

To evaluate the relationship between rainfall runoff and infiltration for a multi-layered permeable pavement area, runoff depth (RD) and infiltration rate (IR) were analyzed using HYDRUS-1D (Figure 5). For the five-layered PBP, RD and IR were inversely proportional across all rainfall conditions. The IR increased from the initial value to the maximum value, and then gradually decreased with the accumulation of total infiltration (TI) until reaching a stable value (15.6 mm/h). No runoff appeared on the PBP surface prior to the maximum IR (MIR). The variation of RD was similar to that of the rainstorm patterns (Figure 4b), with RD continuously increasing with a decrease in RI, followed by a post-peak decrease. Furthermore, our results indicate that temporal changes in IR and TI related to multi-layered pavement play an important role in the generation of runoff during rainstorms [37,38], suggesting the need for further studies on infiltration-based solutions to urban flooding.
Figure 5a–e show that RD and IR changed according to RP and the duration of rainstorm conditions, despite the SIR remaining the same across all scenarios. Across all rainstorm durations, the larger the RD, the earlier the initiation of runoff and correspondingly, the earlier the MIR was reached. With the increase in RP from 2 to 20 years, the resulting SIR of the five-layered PBP under each condition appeared earlier. Results for rainstorms with more than 120 min duration time are shown in Figure 5c–e, indicating that at a rainfall intensity of less than the SIR (15.6 mm/h) of the PBP, IR will gradually decrease and RD will continue to decrease.
Furthermore, we compared runoff generation time, MIR, and SIR across different rainstorm durations. Overall, the longer the duration of the rainstorm, the longer the RD generation time as MIR is delayed with increasing duration due to the temporal distribution of rainstorms. Therefore, increasing the MIR and SIR of various permeable pavement materials may be significant for increasing cumulative infiltration and reducing rainwater runoff.

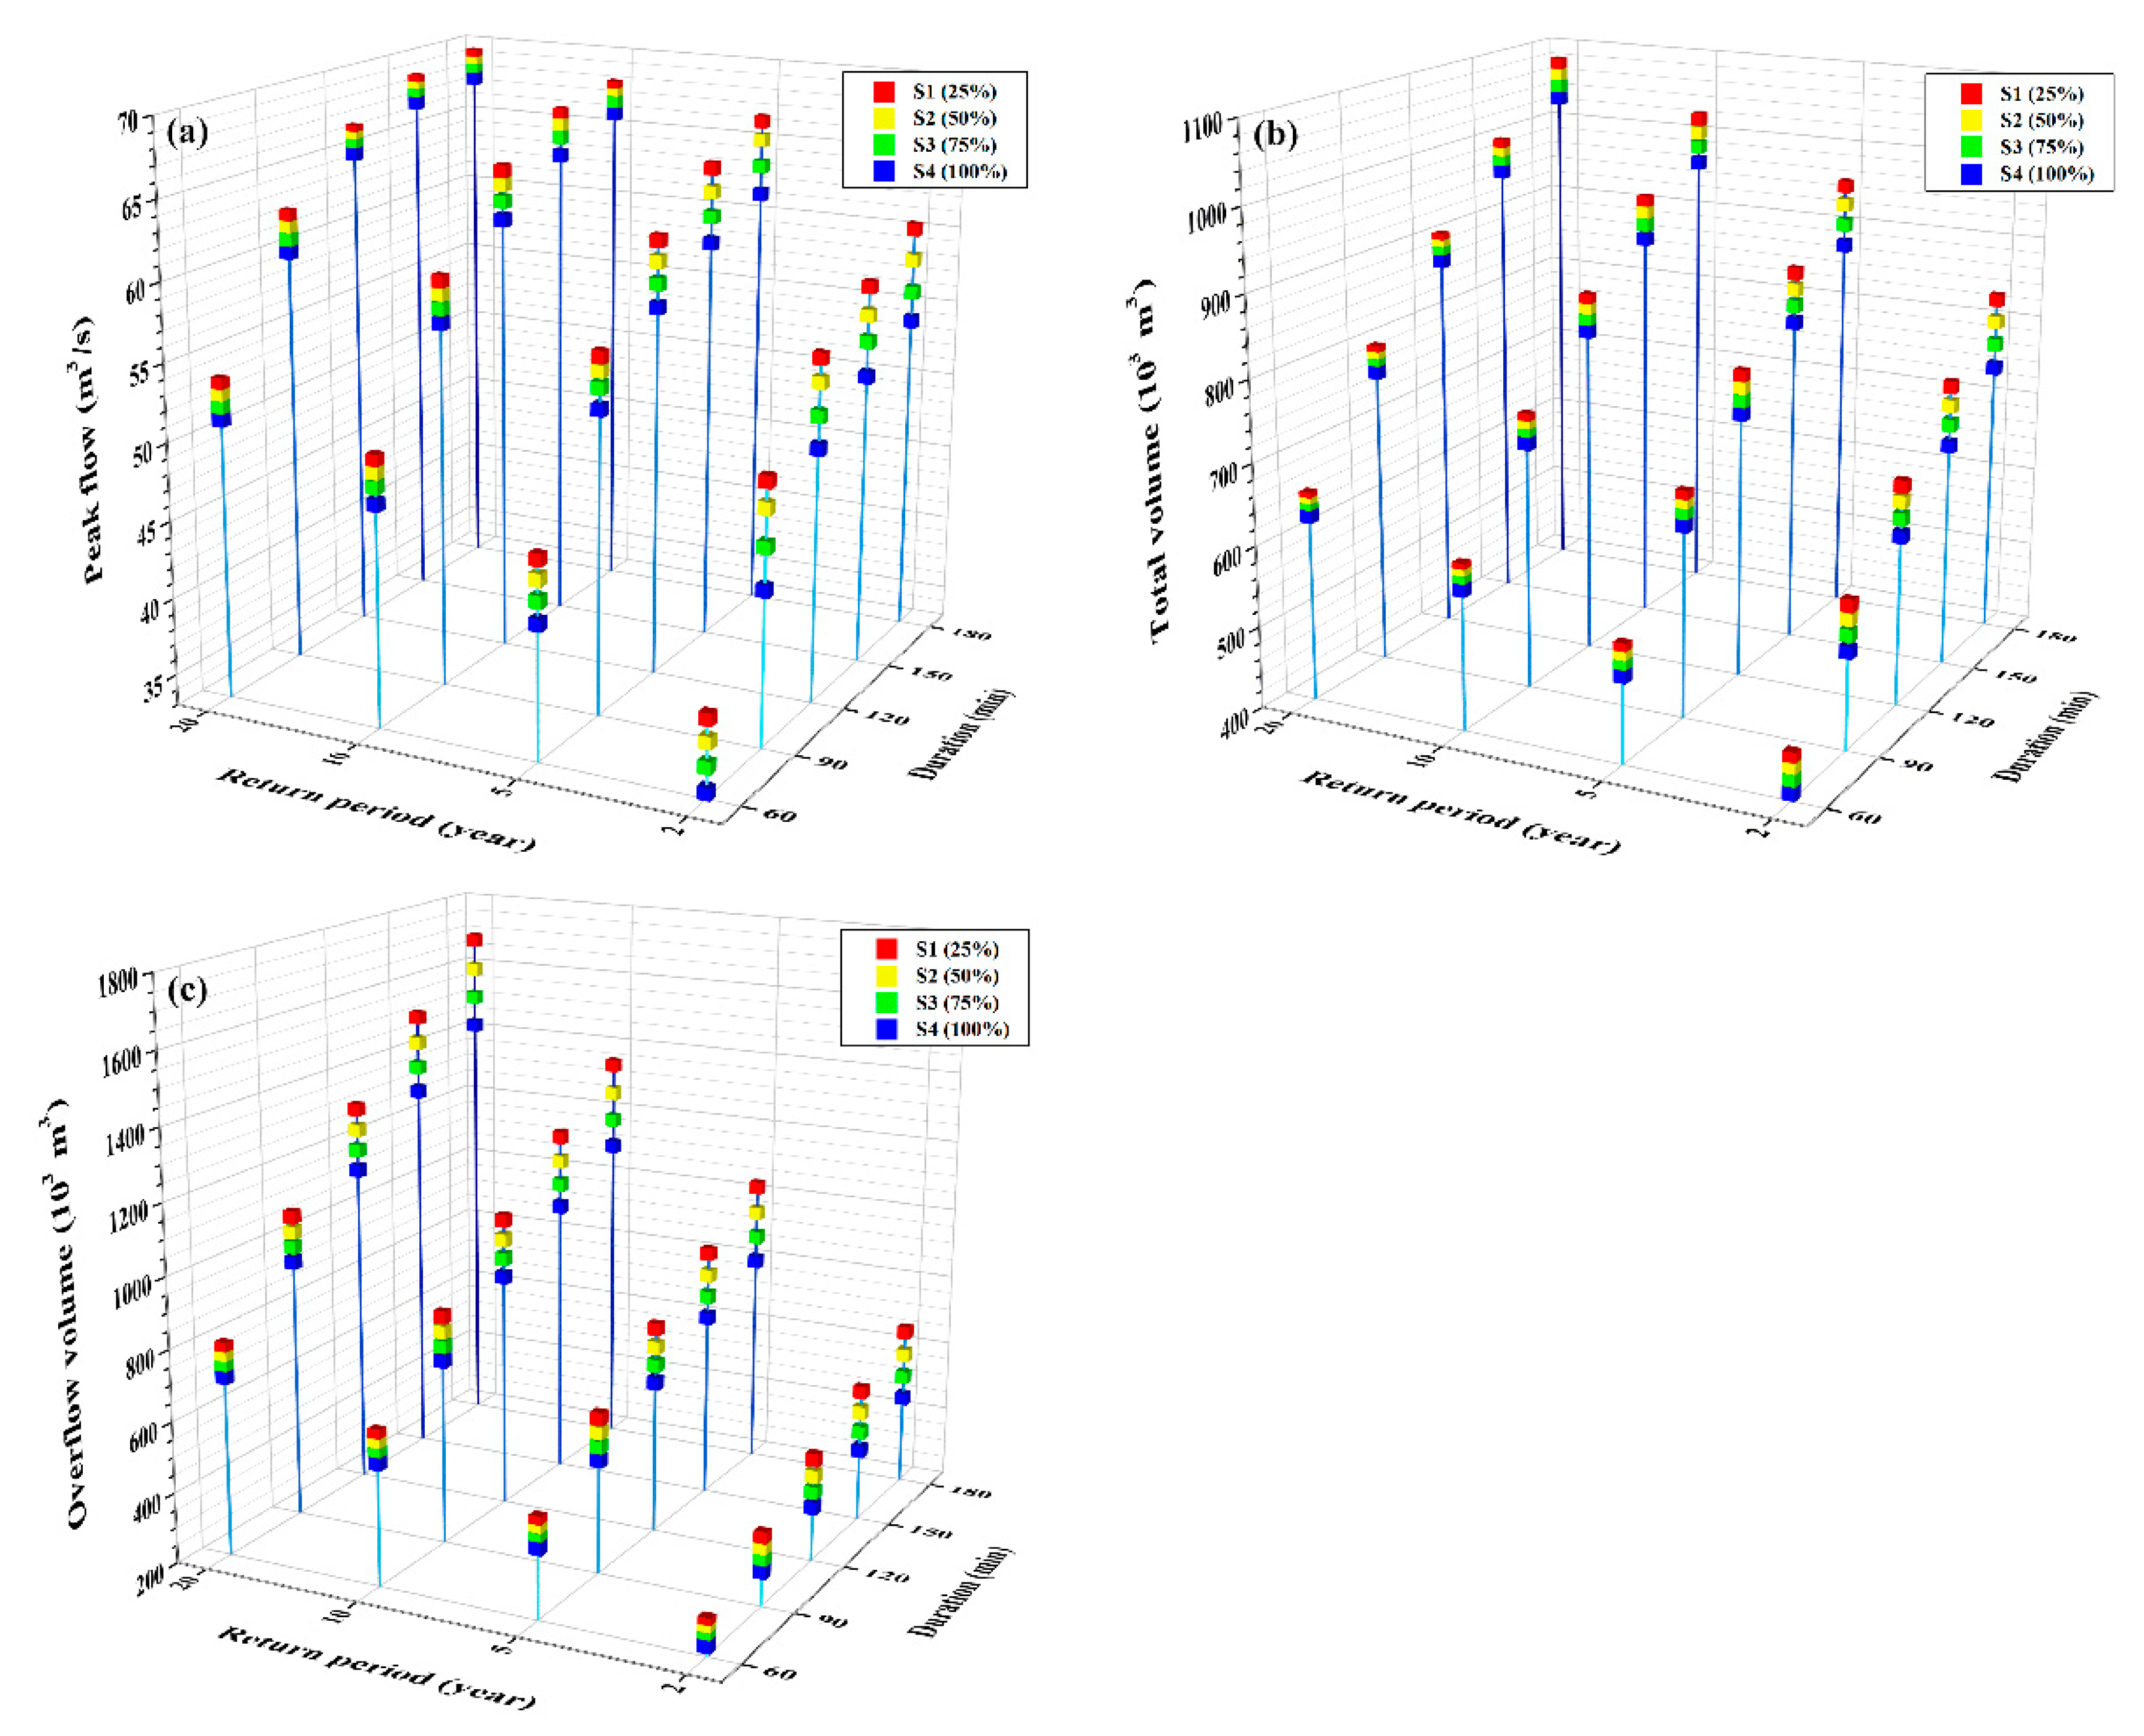
3.3. Effect of PBP on Outfall Flow and Drainage Overflow

Twenty design rainstorm events were used to analyze the effect of PBP on hydrological parameters at the outfall and canal/drainage networks across the following four PBP ratios: 25% (S1), 50% (S2), 75% (S3), and 100% (S4). Flow hydrographs and overflow processes were simulated for each rainstorm event for the four pavement scenarios using the integrated HYDRUS-SWMM model. Outfall PF and TV will indirectly bring the latent risk of river flooding and indirectly affect OV for watershed canal/drainage networks. Figure 6a–c represent the PF, TV, and OV values of the four PBP ratios for rainstorms with different RPs and durations. These results demonstrate that as storm RP (2–20 years) or duration time increase, PF and TV at the outfall, as well as OV at canal/drainage networks also increase, for all PBP ratios. Moreover, results from S1 indicate that the hydrological characteristic values of each rainstorm were continuously greater than those of S2–S4. Across all storm design scenarios, the larger the PBP ratio (50–100%), the smaller the corresponding PF, TV, and OV values. This implies that PBP infrastructure has the potential to greatly reduce stormwater runoff in the study area.
Figure 6a,b show the variation of PF and TV at the Xinyang FDC outfall for all PBP design scenarios (S1–S4) and across different storm RPs and duration times. Overall, PF and TV increased with an increase in rainstorm RP and duration, with both the highest PF and TV values corresponding to the 20-year and 180-min storms. This result is consistent with those of other studies on design rainstorm characteristics that show rainfall frequency and intensity to have a significant effect on surface runoff [25,39]. Furthermore, under current conditions (S1), the highest PF was 69.2 m3/s with a TV of 1.1 × 10⁶ m3. However, with an increase in PBP percentage, the mitigation effect with varying degrees of PF and TV can be detected in S2–S4. Under 100% PBP (S4), the lowest PF (33.5 m3/s) was simulated with a 2-year and 60-min storm, resulting in a TV of 4.1 × 10⁵ m3.
Within the 20 design rainstorms across all PBP scenarios (S1–S4), variation in OV of canal/drainage networks was similar to that of PF and TV (Figure 6c). Across all scenario results, the maximum and minimum OV occurred in the 20-year, 180-min, and 2-year, 60-min rainstorms, respectively. These results reveal a linear relationship between OV and RP, as well as between OV and storm duration. Compared with the other PBP scenarios, the OV of S4 indicated the 100% system to be the most effective design. Furthermore, these results demonstrate that the pavement ratio of PBP has an effect on overflow and flooding of drainage networks, with the degree of reduction influenced by specific rainstorm conditions [40].

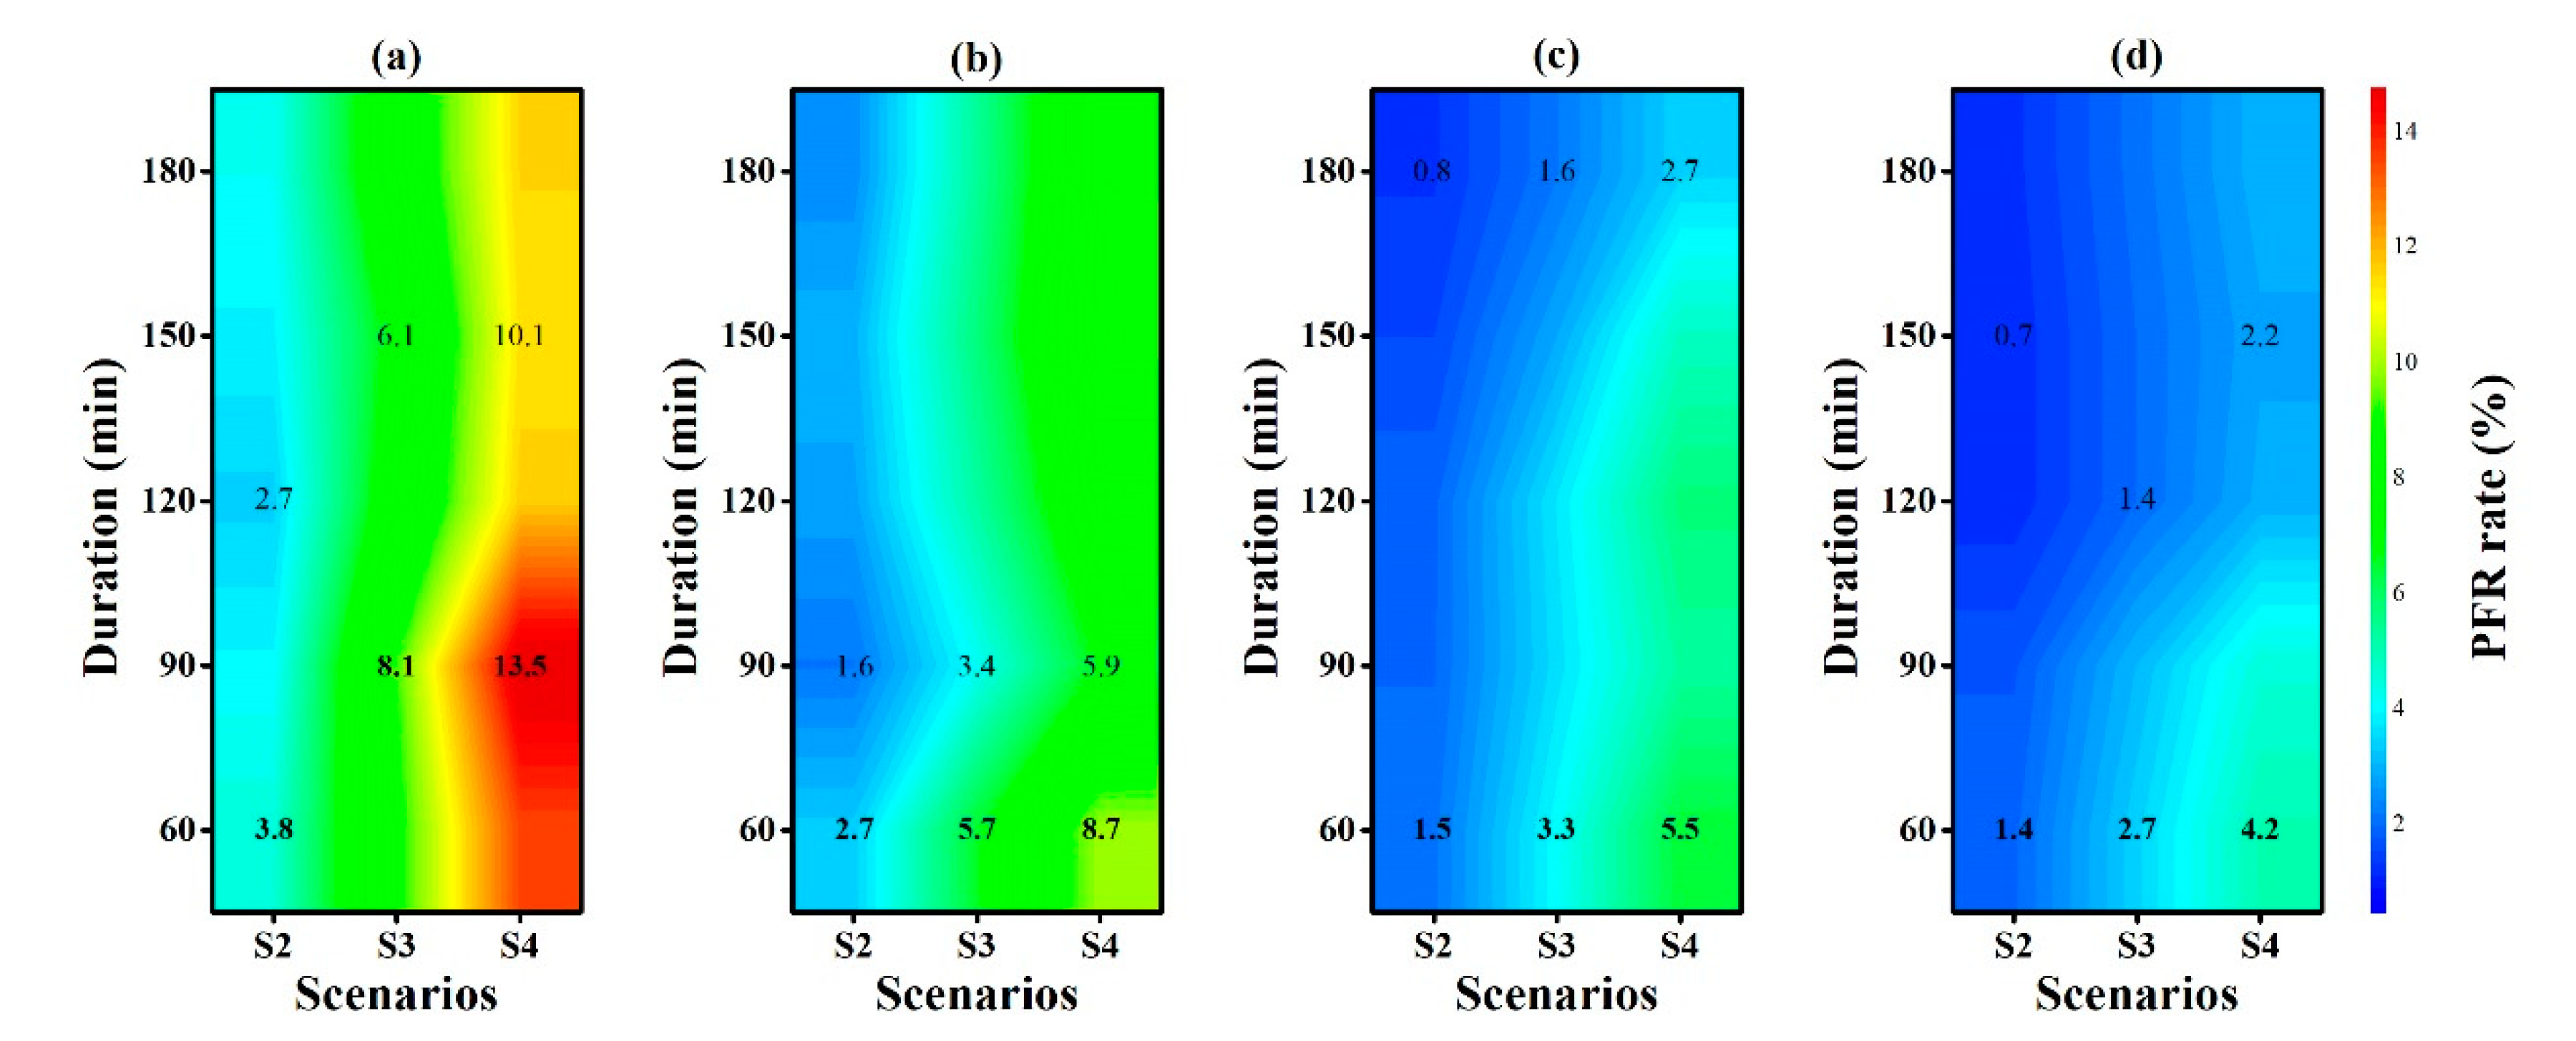
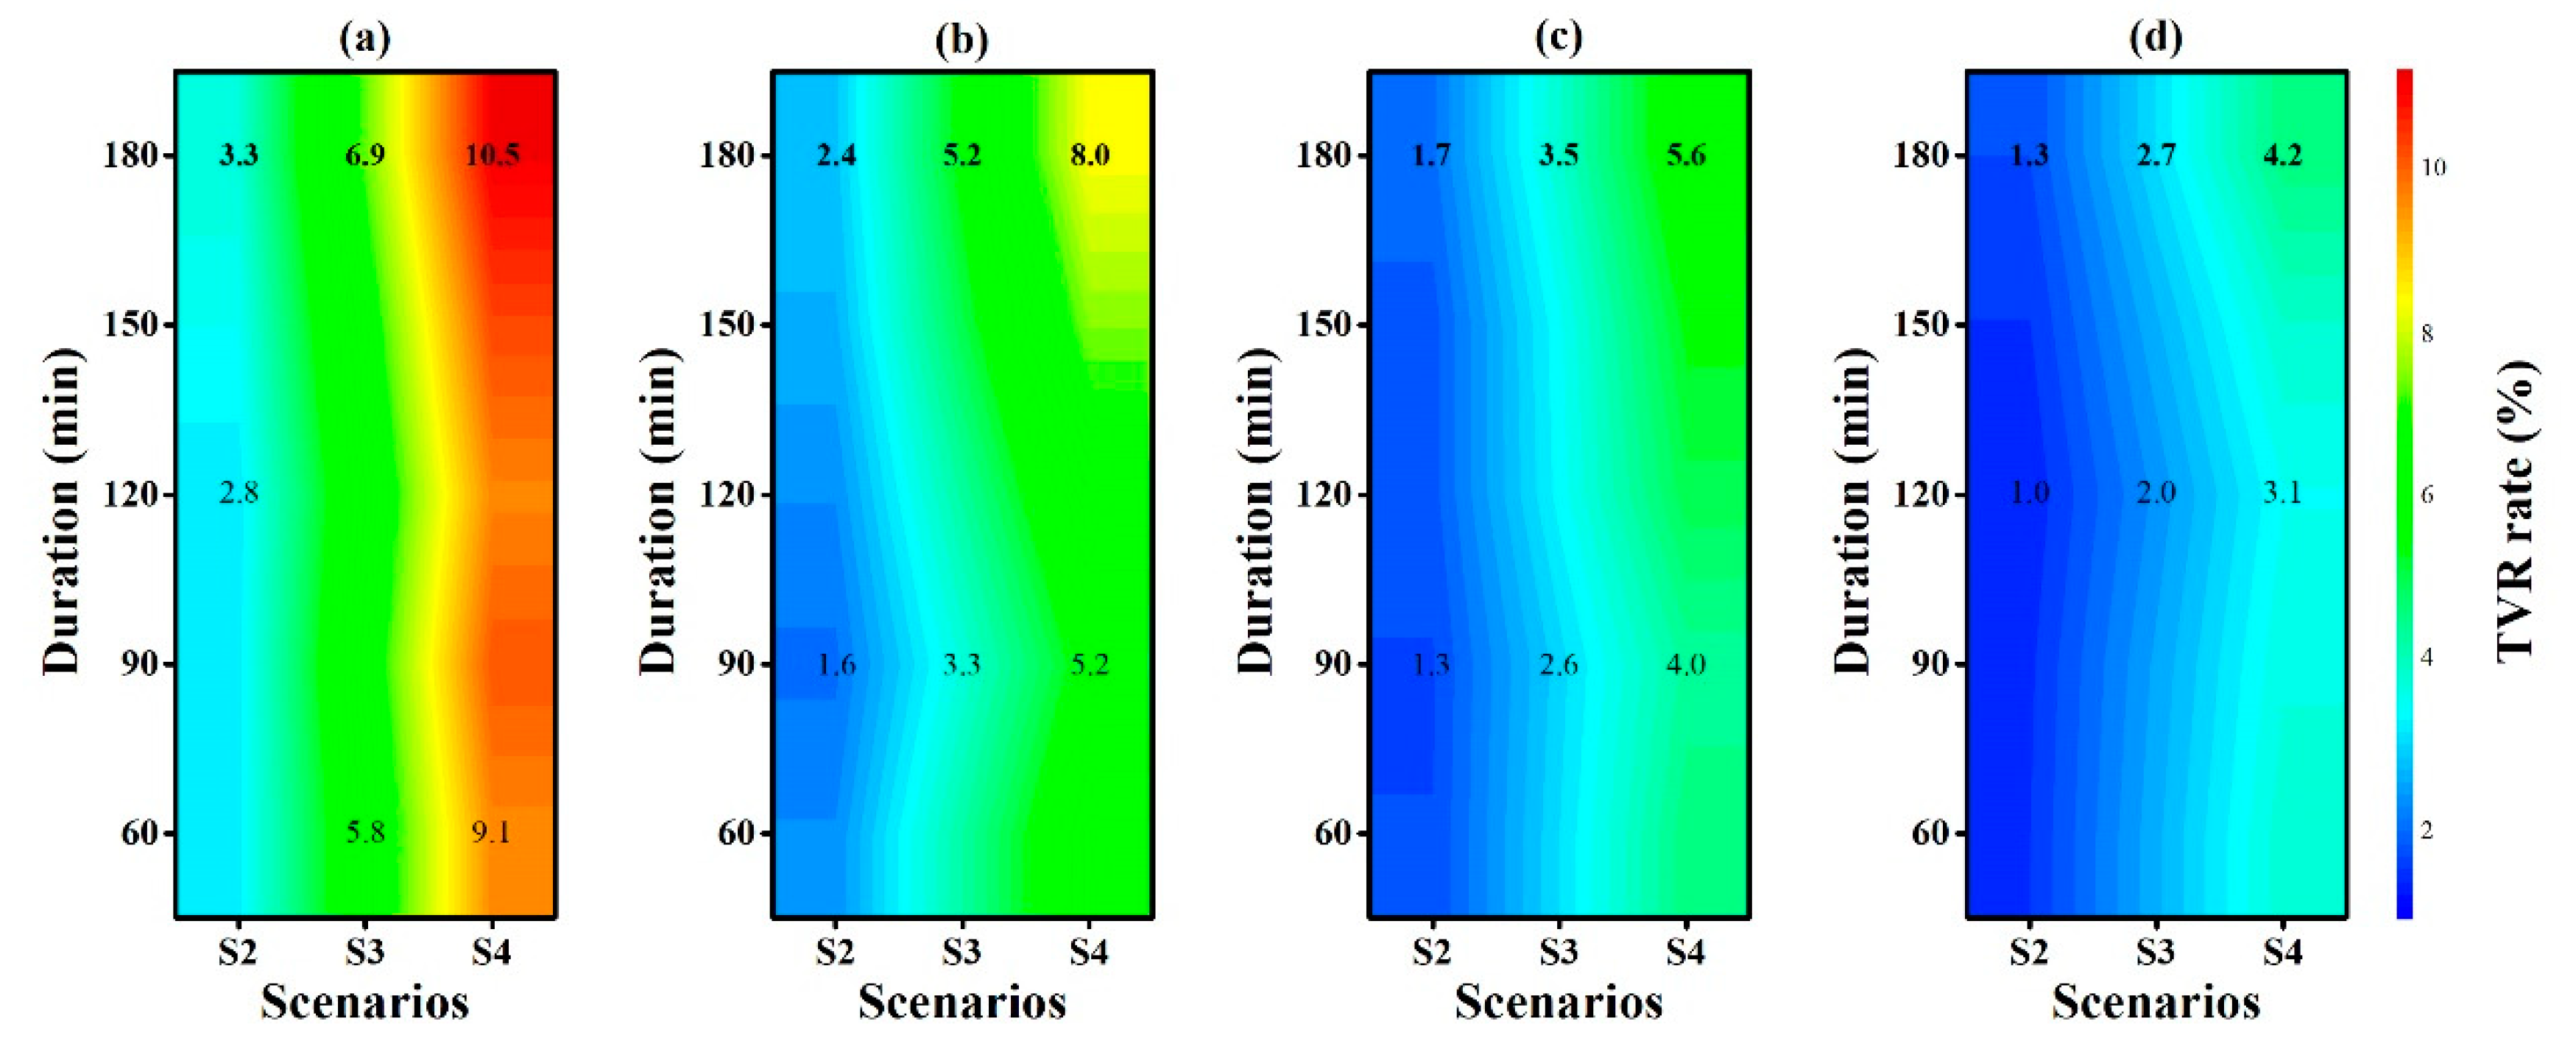
3.4. Comparison of Potential Runoff Reduction

Figure 7 shows the reduced PF rates for the designed scenarios (S2–S4) compared to the current scenario (S1) during (a) 2-, (b) 5-, (c) 10-, and (d) 20-year rainstorms with different durations. Across all scenarios, 100% PBP paving (S4) of the available area was most effective for reducing PF rate. Notably, a 4.2–13.5% reduction in PF occurred when PBP was fully constructed, especially for short duration rainfall events (<90 min). Overall, the effect of PBP decreased with an increase in rainstorm RP, with the largest mitigation rates corresponding to the 2-year and 90-min rainstorms.
Figure 8a–e depict the reduction in TV across the three PBP scenarios (S2–S4) and 20 design rainstorms, with a 2 to 20 year RP compared to current conditions (S1). In general, the results indicate that the reduction in TV was always higher in the 100% paving scenario (S4) than in the <75% scenarios, and was higher in rainstorms with shorter RPs and longer duration times than in rainstorms with RP > 2 years and less than 180 min duration time. This is consistent with the results from previous PBP evaluation studies that demonstrate PBP to be more effective in smaller rainfall events [41]. Moreover, the largest reduction in TV (10.5%) corresponded to the 2-year, 180-min rainstorm reflected in S4 (Figure 8a). When comparing the reduction in TV with that of PF under increasing RP (Figure 7), it becomes clear that PBP is not always more effective at decreasing TV than PF for 60–180 min storms. For 2–5 year RP storms, PF was reduced by 5.9–13.5% and TV by 5.2–10.5% for S4, whereas with a 10–20 year RP, PF was reduced by 2.2–5.5% and TV by 3.1–5.6%, also for S4. Similar variations in reduction rates also occurred in S2 and S3. The outfall flow results demonstrate that the potential reduction in runoff by PBP was not only affected by the PR but also varied with storm duration.
The OV mitigation rates at canal/drainage networks across the entire watershed are shown in Figure 9a–d. Among the three pavements scenarios, S4 with 100% PBP showed better mitigation effects on OV than S2 and S3 across all design rainstorms. The most effective scenario (S4) for reducing OV (15.4–30.6%) was recorded under the 180 min duration storm with 2–20-year RPs. In general, the impacts of PBP on the reduction of OV were similar to those on outfall flow. The retention efficiency results of OV in S2, S3, and S4 show that as RP (2–20 years) decreased or storm duration increased, the mitigation potential for OV increased. Our results also indicate that the reduction in OV was directly related to the different PBP percentages, as well as rainstorm RP and duration. Notably, the variation trend included some non-linearity with storm duration for the mitigation effects on PF and TV at the outfall. Overall, our results are in agreement with those of other PP studies [42].

3.5. Study Limitations and Future Designed Strategies

In this study, the potential effects of PBP on reducing outflow and overflow were evaluated for the Xinyang FDC watershed using an integrated model. Although the 100% PBP ratio (S4) showed the most potential for reducing outlet flow and drainage overflow, evaluating the integrated effects of the system remains a challenge, due to the synergistic connections and benefits of using two or multi-infrastructures at the design stage [39]. As for the evaluation results for numerical simulations, coverage ratio scenarios and associated parameters of coupled model are based on the current land-use layout on the one hand, and limited design rainstorms with short RP and duration as input conditions on the other. Although three artificial scenarios (S2–S4) were used in this study to analyze the impact of different PBP percentages on rainfall runoff at a watershed scale, the combination with other green and grey infrastructure and benefit–cost scenarios should be considered in further research [43]. Furthermore, several complex factors such as leakage from stormwater pipes, surface flow pathways, and secondary permeability of impervious areas were beyond the scope of this case study. Therefore, we suggest that future research focus on the effective optimization and applicability of multiple devices for stormwater control.
In this section, various PBP implementation scenarios (50–100%) indicated so many hydrological benefits on the watershed scale. However, the socioeconomic uncertainties of PBP practices area and material are indispensable in reality [44]. Therefore, an integrated assessments of source control strategies on potential runoff reduction and cost effectiveness should be proposed in the future urban stormwater management. Taking rainstorm with an RP of 2 years as an example, the reduction effects of PBP devices on outfall flow and drainage overflow were explored. For S2–S4 scenarios, the reduction or mitigation rate for PF, TV and OV of Xinyang FDC watershed could reach 3.8–13.5%, 3.3–10.5% and 10.4–30.6%, respectively. Moreover, the present value of benefit and the present value of cost could be applied to analyze PBP cost-effectiveness [45]. Integrated assessments should take into account both hydrological reduction effects and total cost control. The designed strategy is also suggested to evaluate the effects of PBP aging and clogging because the hydrological performance will decrease during its service lifetime.

4. Conclusions

Based on our evaluation of the potential effects of PBP in reducing outfall flow and drainage network overflow at a watershed scale, the following findings were made:
(1)
An SIR of 15.6 mm/h was identified for urban areas covered with a five-layer PBP in Xinyang FDC watershed. The temporal distribution of IR played an important role in surface runoff generation. In addition, the initial IR, MIR, and time to stability were affected by the duration and RP of rainstorms.
(2)
A PBP with a paving percentage of over 25% (S1–S4) showed a significant effect on reducing outfall runoff and drainage nodes overflow. Furthermore, PF, TV, and OV were reduced by increasing the PBP percentage of available areas as much as possible.
(3)
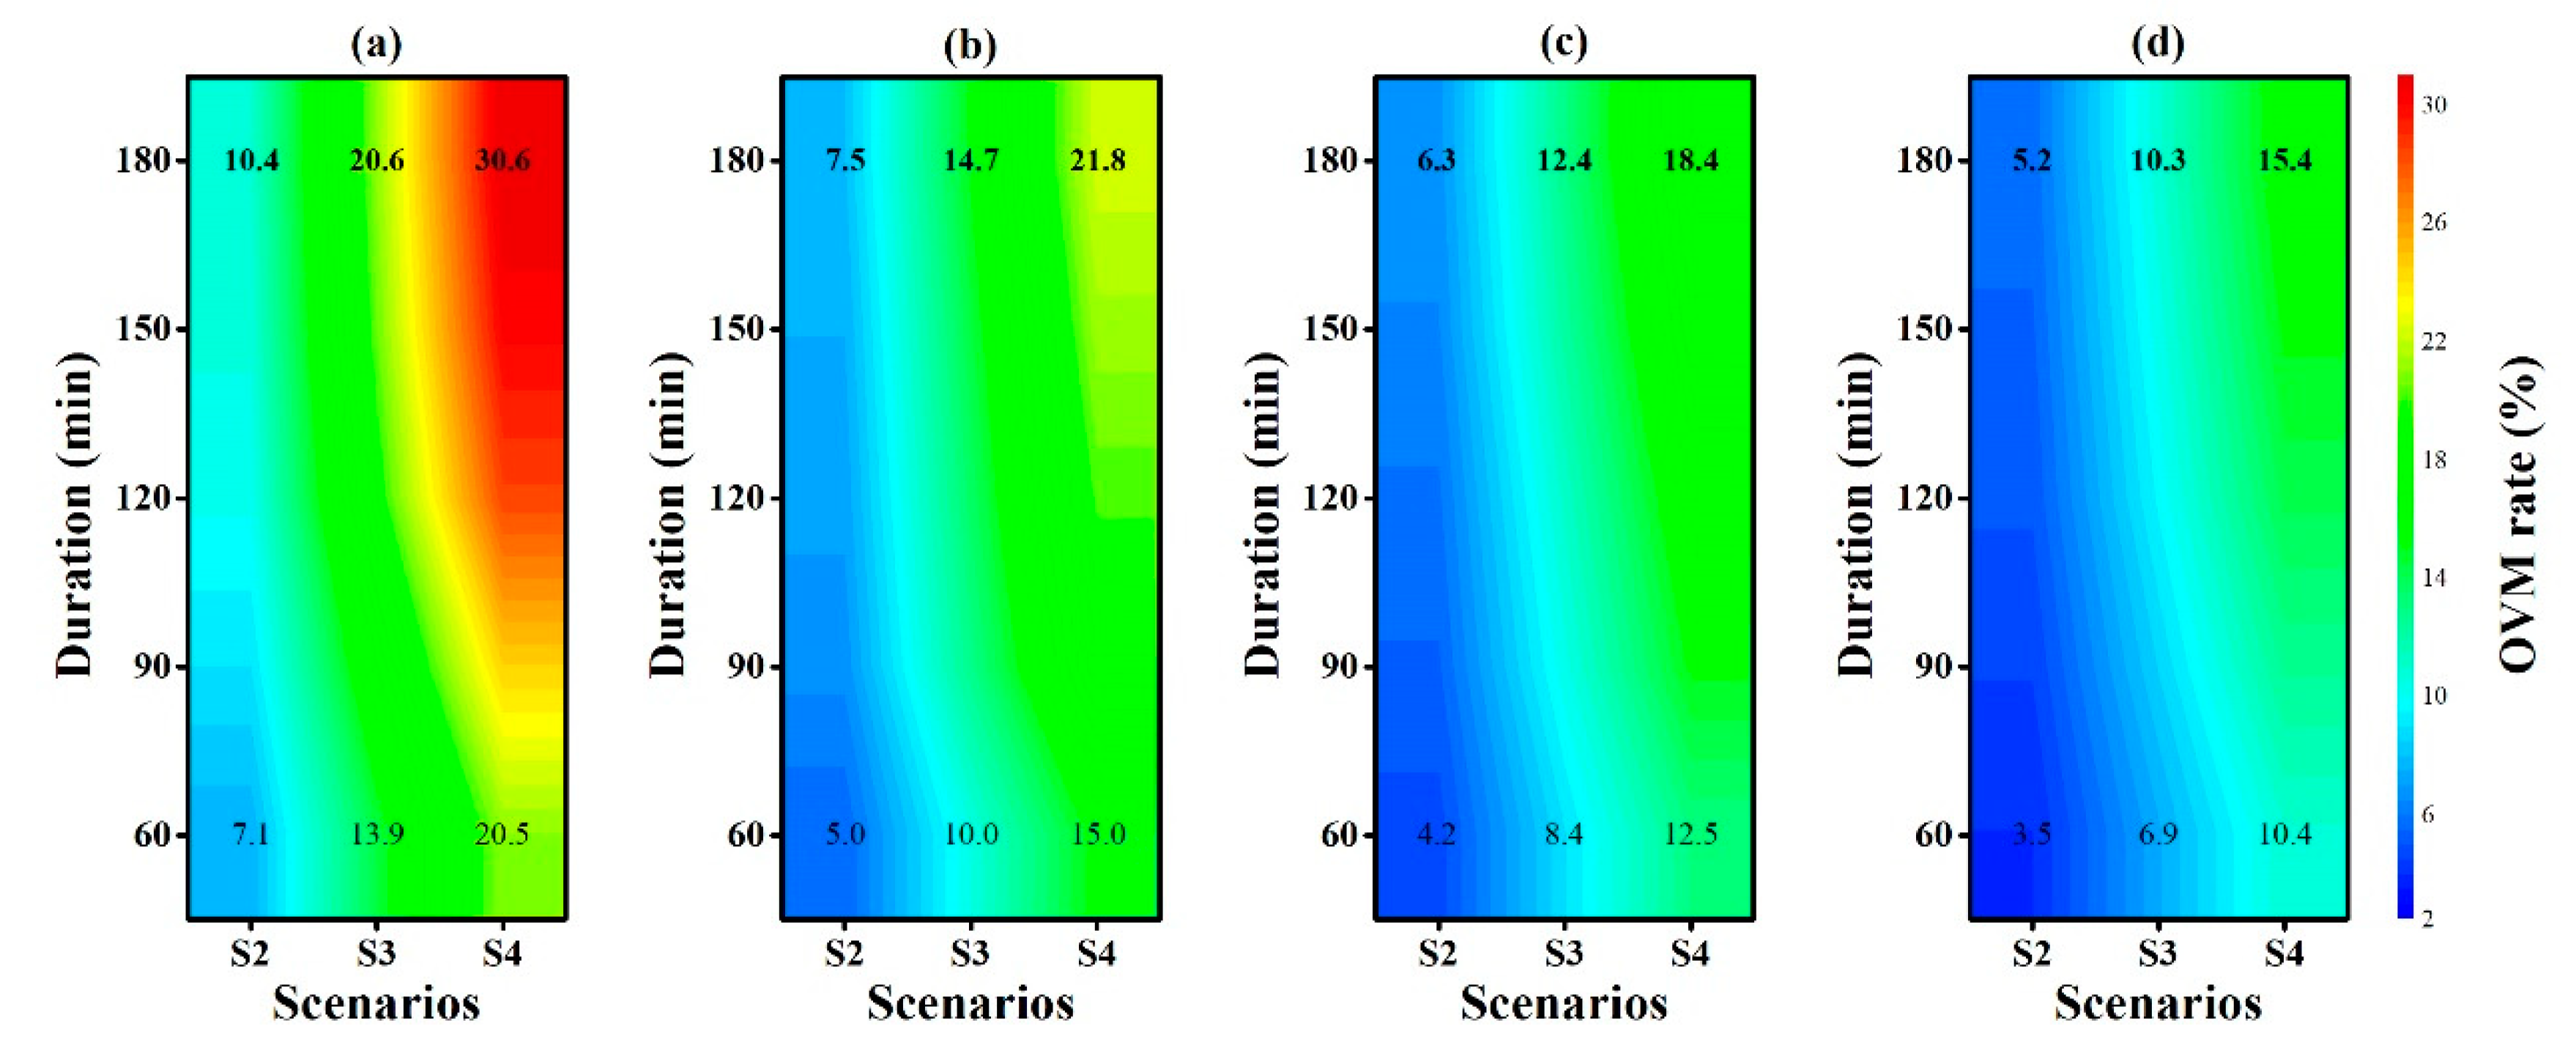
The greatest reduction occurred in scenario (S4) with 100% PBP. Furthermore, PF, TV, and OV decreased with rainstorm RP, and the mitigation effect of OV (15.4–30.6%) was mostly higher than that of PF (4.2–13.5%) and TV (4.2–10.5%).
(4)
Infiltration based infrastructure related to the SPC strategy could potentially have a positive impact on stormwater runoff. Results from our watershed-scale hydrological model indicate that the implementation of PBP can decrease stormwater runoff PF and volume, especially under small magnitude and short duration rainstorm conditions, thereby reducing the risk of urban flooding.
The change in surface infiltration conditions using multi-layered permeable brick paving directly affects not only the PF and TV of outfalls, but also the OV of drainage nodes across the entire watershed. The potential of PBP to reduce outfall and drainage flow is influenced by the size of the paved area as well as the duration and RP of rainstorms. Notably, our results indicate that the implementation of PBP has the potential to increase watershed resilience to rainstorms.
The effectiveness of potential rainfall runoff mitigation measures is strongly related to the infiltration process and design rainstorm characteristics at the watershed scale. We suggest future studies include a comprehensive investigation of the hydrological effects of green and grey infrastructure to improve infiltration and rainfall holding capacity of urban catchments. Within this context, PBP is a resilient infrastructure that can reduce surface runoff and flooding, thereby allowing for integrated stormwater management in China.

Author Contributions

Methodology, X.F. and J.L.; software and validation, X.F. and D.W.; investigation, resources, and data curation, W.S. and X.F.; writing—original draft preparation, X.F.; writing—review and editing, all authors; visualization, D.W. and W.Y.; supervision, J.L.; project administration and overall guidance, J.L. and C.M.; funding acquisition, J.L. All authors have read and agreed to the published version of the manuscript.

Funding

This study was supported by the Chinese National Natural Science Foundation (No. 51739011 & 51879274), National Key Research and Development Program of China (No. 2016YFC0401401 & 2018YFC1508203), and Research Fund of the State Key Laboratory of Simulation and Regulation of Water Cycle in River Basin (No. SKL2020ZY03).

Acknowledgments

We would like to express our sincere thanks to the reviewers and the journal editors for their constructive comments on this manuscript.

Conflicts of Interest

The authors declare no conflict of interest.

References

  1. Booth, D.B.; Jackson, C.R. Urbanization of aquatic systems: Degradation thresholds, stormwater detection, and the limits of mitigation. J. Am. Water Resour. Assoc. 1997, 33, 1077–1090. [Google Scholar] [CrossRef]
  2. Liu, J.; Shao, W.; Xiang, C.; Mei, C.; Li, Z. Uncertainties of urban flood modeling: Influence of parameters for different underlying surfaces. Environ. Res. 2020, 182, 1–8. [Google Scholar] [CrossRef]
  3. Wang, H.; Mei, C.; Liu, J.; Shao, W. A new strategy for integrated urban water management in China: Sponge city. Sci. China Technol. Sci. 2018, 61, 317–329. [Google Scholar] [CrossRef]
  4. Xia, J.; Zhang, Y.; Xiong, L.; He, S.; Wang, L.; Yu, Z. Opportunities and challenges of the Sponge City construction related to urban water issues in China. Sci. China Earth Sci. 2017, 60, 652–658. [Google Scholar] [CrossRef]
  5. Silva, C.D.M.; Barbosa, G. Cumulative effect of the disconnection of impervious areas within residential lots on runoff generation and temporal patterns in a small urban area. J. Environ. Manag. 2020, 253, 1–12. [Google Scholar] [CrossRef]
  6. Westra, S.; Fowler, H.J.; Evans, J.P.; Alexander, L.V.; Berg, P.; Johnson, F.; Kendon, E.J.; Lenderink, G.; Roberts, N.M. Future changes to the intensity and frequency of short-duration extreme rainfall. Water Resour. Res. 2014, 52, 522–555. [Google Scholar] [CrossRef]
  7. Brattebo, B.O.; Booth, D.B. Long-term stormwater quantity and quality performance of permeable pavement systems. Water Res. 2003, 37, 4369–4376. [Google Scholar] [CrossRef]
  8. Brunetti, G.; Šimůnek, J.; Piro, P. A comprehensive numerical analysis of the hydraulic behavior of a permeable pavement. J. Hydrol. 2016, 540, 1146–1161. [Google Scholar] [CrossRef] [Green Version]
  9. Palla, A.; Gnecco, I. Hydrologic modeling of low impact development systems at the urban catchment scale. J. Hydrol. 2015, 528, 361–368. [Google Scholar] [CrossRef]
  10. Her, Y.; Jeong, J.; Arnold, J.; Gosselink, L.; Glick, R.; Jaber, F. A new framework for modeling decentralized low impact developments using soil and water assessment tool. Environ. Model. Softw. 2017, 96, 305–322. [Google Scholar] [CrossRef]
  11. Palermo, S.A.; Talarico, V.C.; Turco, M. On the LID systems effectiveness for urban stormwater management: Case study in Southern Italy. IOP Conf. Ser. Earth Environ. Sci. 2020, 410. [Google Scholar] [CrossRef]
  12. Luo, P.; Zhou, M.; Deng, H.; Lyu, J.; Cao, W.; Takara, K.; Nover, D.; Schladow, S.G. Impact of forest maintenance on water shortages: Hydrologic modeling and effects of climate change. Sci. Total Environ. 2018, 615, 1355–1363. [Google Scholar] [CrossRef] [PubMed]
  13. Ahiablame, L.; Shakya, R. Modeling flood reduction effects of low impact development at a watershed scale. J. Environ. Manag. 2016, 171, 81–91. [Google Scholar] [CrossRef] [PubMed]
  14. Ren, X.; Hong, N.; Li, L.; Kang, J.; Jiejie, L. Effect of infiltration rate changes in urban soils on stormwater runoff process. Geoderma 2020, 363, 114158. [Google Scholar] [CrossRef]
  15. Brunetti, G.; Šimůnek, J.; Turco, M.; Piro, P. On the use of surrogate-based modeling for the numerical analysis of low impact development techniques. J. Hydrol. 2017, 548, 263–277. [Google Scholar] [CrossRef] [Green Version]
  16. Ebrahimian, A.; Sample-Lord, K.; Wadzuk, B.; Traver, R. Temporal and spatial variation of infiltration in urban green infrastructure. Hydrol. Process. 2020, 34, 1016–1034. [Google Scholar] [CrossRef]
  17. Luan, B.; Yin, R.; Xu, P.; Wang, X.; Yang, X.; Zhang, L.; Tang, X. Evaluating green stormwater infrastructure strategies efficiencies in a rapidly urbanizing catchment using SWMM-based TOPSIS. J. Clean. Prod. 2019, 223, 680–691. [Google Scholar] [CrossRef]
  18. Vogeler, I.; Carrick, S.; Cichota, R.; Lilburne, L. Estimation of soil subsurface hydraulic conductivity based on inverse modelling and soil morphology. J. Hydrol. 2019, 574, 373–382. [Google Scholar] [CrossRef]
  19. Horton, R.E. The Rôle of infiltration in the hydrologic cycle. EOS Trans. Am. Geophys. Union 1933, 14, 446–460. [Google Scholar] [CrossRef]
  20. Meng, H.; Green, T.R.; Salas, J.D.; Ahuja, L.R. Development and testing of a terrain-based hydrologic model for spatial hortonian infiltration and runoff/on. Environ. Model. Softw. 2008, 23, 794–812. [Google Scholar] [CrossRef]
  21. Rossman, L.A. Storm Water Management Model User’s Manual Version 5.1; United States Environmental Protection Agency: Westlake, OH, USA, 2015. [Google Scholar]
  22. Taufiqul, A.; Ahmed, M.; Kim, D.J.; Juan César, B.-C.; Javier, G. A comparison of three types of permeable pavements for urban runoff mitigation in the semi-arid south Texas, U.S.A. Water 2019, 11, 1–23. [Google Scholar]
  23. Hilten, R.N.; Lawrence, T.M.; Tollner, E.W. Modeling stormwater runoff from green roofs with HYDRUS-1D. J. Hydrol. 2008, 358, 288–293. [Google Scholar] [CrossRef]
  24. Chen, W.; Huang, G.; Zhang, H.; Wang, W. Urban inundation response to rainstorm patterns with a coupled hydrodynamic model: A case study in Haidian Island, China. J. Hydrol. 2018, 564, 1022–1035. [Google Scholar] [CrossRef]
  25. Baek, S.S.; Ligaray, M.; Pachepsky, Y.; Chun, J.A.; Yoon, K.S.; Park, Y.; Cho, K.H. Assessment of a green roof practice using the coupled SWMM and HYDRUS models. J. Environ. Manage. 2020, 261, 109920. [Google Scholar] [CrossRef] [PubMed]
  26. Van Genuchten, M.T. A closed-form equation for predicting the hydraulic conductivity of unsaturated soils. Soil Sci. Soc. Am. J. 1980, 44, 892–898. [Google Scholar] [CrossRef] [Green Version]
  27. Šimůnek, J.; van Genuchten, M.T. Modeling nonequilibrium flow and transport processes using HYDRUS. Vadose Zo. J. 2008, 7, 782–797. [Google Scholar] [CrossRef] [Green Version]
  28. Rassam, D.; Šimůnek, J.; Mallants, D.; van Genuchten, M.T. The HYDRUS-1D Software Package for Simulating the Movement of Water, Heat, and Multiple Solutes in Variably Saturated Media: Tutorial; Version 1; CSIRO Land and Water: San Mateo, CA, USA, 2018; ISBN 978-1-4863-1001-2. [Google Scholar]
  29. Schaap, M.G.; Leij, F.J.; van Genuchten, M.T. Rosetta: A computer program for estimating soil hydraulic parameters with hierarchical pedotransfer functions. J. Hydrol. 2001, 251, 163–176. [Google Scholar] [CrossRef]
  30. Cheviron, B.; Coquet, Y. Sensitivity analysis of transient-MIM HYDRUS-1D: Case study related to pesticide fate in soils. Vadose Zo. J. 2009, 8, 1064–1079. [Google Scholar] [CrossRef]
  31. Nash, J.E.; Sutcliffe, J. V River flow forecasting through conceptual models part I—A discussion of principles. J. Hydrol. 1970, 10, 282–290. [Google Scholar] [CrossRef]
  32. MOHURD. Code for Design of Outdoor Wastewater Engineering (GB 50014-2006). Available online: http://www.mohurd.gov.cn/wjfb/201607/t20160712_228080.html (accessed on 3 October 2020).
  33. Piro, P.; Carbone, M.; Morimanno, F.; Palermo, S.A. Simple flowmeter device for LID systems: From laboratory procedure to full-scale implementation. Flow Meas. Instrum. 2019, 65, 240–249. [Google Scholar] [CrossRef]
  34. Hamouz, V.; Muthanna, T.M. Hydrological modelling of green and grey roofs in cold climate with the SWMM model. J. Environ. Manag. 2019, 249, 1–18. [Google Scholar] [CrossRef] [PubMed]
  35. Luan, Q.; Fu, X.; Song, C.; Wang, H.; Liu, J.; Wang, Y. Runoff effect evaluation of LID through SWMM in typical mountainous, low-lying urban areas: A case study in China. Water 2017, 9, 439. [Google Scholar] [CrossRef] [Green Version]
  36. Yao, L.; Wei, W.; Chen, L. How does imperviousness impact the urban rainfall-runoff process under various storm cases? Ecol. Indic. 2016, 60, 893–905. [Google Scholar] [CrossRef]
  37. Yang, J.; Zhang, G. Water infiltration in urban soils and its effects on the quantity and quality of runoff. J. Soils Sediments 2011, 11, 751–761. [Google Scholar] [CrossRef]
  38. Rezaei, M.; Seuntjens, P.; Joris, I.; Boënne, W.; Van Hoey, S.; Campling, P.; Cornelis, W.M. Sensitivity of water stress in a two-layered sandy grassland soil to variations in groundwater depth and soil hydraulic parameters. Hydrol. Earth Syst. Sci. 2016, 20, 487–503. [Google Scholar] [CrossRef] [Green Version]
  39. Chu, L.; Fwa, T.F. Evaluation of surface infiltration performance of permeable pavements. J. Environ. Manag. 2019, 238, 136–143. [Google Scholar] [CrossRef]
  40. Collins, K.A.; Hunt, W.F.; Hathaway, J.M. Hydrologic comparison of four types of permeable pavement and standard asphalt in eastern North Carolina. J. Hydrol. Eng. 2008, 13, 1146–1157. [Google Scholar] [CrossRef]
  41. Mei, C.; Liu, J.; Wang, H.; Li, Z.; Yang, Z.; Shao, W. Urban flood inundation and damage assessment based on numerical simulations of design rainstorms with different characteristics. Sci. China Technol. Sci. 2020, 63. [Google Scholar] [CrossRef]
  42. Hou, J.; Zhang, Y.; Tong, Y.; Guo, K.; Qi, W.; Reinhard, H. Experimental study for effects of terrain features and rainfall intensity on infiltration rate of modelled permeable pavement. J. Environ. Manag. 2019, 243, 177–186. [Google Scholar] [CrossRef]
  43. Tavakol-Davani, H.E.; Tavakol-Davani, H.; Burian, S.J.; McPherson, B.J.; Barber, M.E. Green infrastructure optimization to achieve pre-development conditions of a semiarid urban catchment. Environ. Sci. Water Res. Technol. 2019, 5, 1157–1171. [Google Scholar] [CrossRef]
  44. Huang, C.L.; Hsu, N.S.; Liu, H.J.; Huang, Y.H. Optimization of low impact development layout designs for megacity flood mitigation. J. Hydrol. 2018, 564, 542–558. [Google Scholar] [CrossRef]
  45. Mei, C.; Liu, J.; Wang, H.; Yang, Z.; Ding, X.; Shao, W. Integrated assessments of green infrastructure for flood mitigation to support robust decision-making for sponge city construction in an urbanized watershed. Sci. Total Environ. 2018, 639, 1394–1407. [Google Scholar] [CrossRef] [PubMed]
Figure 1. Location of study area and schematic representation of the Xinyang flood drainage canal (FDC) watershed.
Water 12 02821 g001
Figure 2. Schematic representation of the coupled model framework.
Water 12 02821 g002
Figure 3. Representation of (a) total rainfall depth and (b) rainfall pattern distribution for the 20 design rainstorms used in the case study.
Water 12 02821 g003
Figure 4. Modeled (black line) and observed (red diamonds) hydrographs at the outfall site for six rainfall events (blue bars) during the monitoring period: (a) rainfall event on 20 July 2019; (b) rainfall event on 24 August 2019; (c) rainfall event on 26 May 2019; (d) rainfall event on 24 June 2019; (e) rainfall event on 22 July 2019; (f) rainfall event on 17 August 2019.
Water 12 02821 g004
Figure 5. Runoff depth (RD) and infiltration rates (IR) of a permeable pavement system during design rainstorms with durations of (a) 60 min; (b) 90 min; (c) 120 min; (d) 150 min, and (e) 180 min.
Water 12 02821 g005
Figure 6. Representations of (a) simulated peak flow; (b) total volume at outfall, and (c) overflow volume at drainage and river networks for all design scenarios.
Water 12 02821 g006
Figure 7. Peak flow reduction (PFR) across three design scenarios (S2, S3, and S4) compared to current conditions (S1) during (a) 2; (b) 5; (c) 10, and (d) 20 year rainstorm return periods (RP) of different durations.
Water 12 02821 g007
Figure 8. Total volume reduction (TVR) across three design scenarios (S2, S3, and S4) compared to current conditions (S1) during (a) 2-, (b) 5-, (c) 10-, and (d) 20-year rainstorm return periods (RP) of different durations.
Water 12 02821 g008
Figure 9. Overflow volume mitigation (OVM) across three design scenarios (S2, S3, and S4) compared to current conditions (S1) during (a) 2-, (b) 5-, (c) 10-, and (d) 20-year rainstorm return periods (RP) of different durations.
Water 12 02821 g009
Table 1. Values selected for coupled model parameters in Xinyang flood drainage canal (FDC) watershed.
Key ParametersDescriptionReferenceInitial ValueCalibrated Value
Width (k value)Flow width coefficient for sub-catchment0.2–5.02.02.5
N-ImpervMannings N for impervious area0.011–0.0240.0110.011
N-PervMannings N for pervious area0.02–0.800.050.06
Dstore-Imperv (mm)Depression storage depth for impervious area1.3–2.522
Dstore-Perv (mm)Depression storage depth for pervious area2.5–10.256
MaxRate (mm/h)Horton’s maximum infiltration rate50–2006575
MinRate (mm/h)Horton’s minimum infiltration rate0–202.01.5
Table 2. Layered structure and hydraulic parameters of the designed permeable brick pavement (PBP) from top to bottom layers.
Soil LayerThickness
(mm)
θr
(m3/m3)
θs
(m3/m3)
α
(1/mm)
nKs
(mm/min)
Permeable brick600.0490.2560.0034.113.94
Coarse sand300.0450.4300.0152.684.95
Permeable concrete1600.0400.3860.0042.392.22
Crushed stone1000.0530.3660.0034.6310.10
Plain fill6500.0780.430.0041.560.17
Table 3. Characteristics of the rainfall events simulated during the calibration and validation.
PeriodEvent DateTotal Rainfall (mm)Duration (h)Maximum Rainfall Intensity (mm/h)
Calibration20 July 201952.01428.0
24 August 201989.42038.7
Validation26 May 201952.41718.7
24 June 201937.31812.8
22 July 201929.4420.8
17 August 201971.6553.6
Table 4. Permeable brick pavement (PBP) implementation scenarios.
ItemScenarios
S1S2S3S4
% of Land–use AreaResidential6.513.019.526.0
Industrial5.410.816.321.7
Commercial and Public Services10.821.732.543.4
Transportation9.819.529.339.1
Green Space3.36.59.813.0
PBP Area (km2)2.194.386.578.75
% of Total Area6.613.319.926.5
% of Paving Area25.050.075.0100.0

