Article

Soil Salinity and Moisture Control the Processes of Soil Nitrification and Denitrification in a Riparian Wetlands in an Extremely Arid Regions in Northwestern China

1
Linze Inland River Basin Research Station, Chinese Ecosystem Research Network, Key Laboratory of Eco-hydrology of Inland River Basin, Northwest Institute of Eco-Environment and Resources, Chinese Academy of Sciences, Lanzhou 730000, China
2
University of Chinese Academy of Sciences, Beijing 100049, China
*
Author to whom correspondence should be addressed.
Water 2020, 12(10), 2815; https://doi.org/10.3390/w12102815
Submission received: 14 September 2020 / Revised: 6 October 2020 / Accepted: 8 October 2020 / Published: 10 October 2020
(This article belongs to the Section Water Quality and Contamination)

Abstract

:
Soil nitrification and denitrification are key nitrogen (N) removal processes in riparian wetlands in extremely arid regions, but the driving factors of the two N processes in these wetlands are still unclear. We measured soil nitrification and denitrification rates and related environmental properties in a typical riparian wetland in the middle reaches of the Heihe River, northwestern China. Our results showed that rates of soil nitrification and denitrification exhibited moderate variability, ranging from 52.77 to 221.18 μg kg−1 h−1 and 91.25 to 428.26 μg kg−1 h−1, respectively. Soil salinity was high, with mean electrical conductivity (EC) of 6.8 mS cm−1. Soil salinity and moisture were the key factors influencing nitrification and denitrification in this riparian wetland in an extremely arid region. Soil salinity exerted significant inhibitory impact on soil nitrification when EC was > 4.05 mS cm−1. Soil nitrification increased with an increase in soil moisture when soil water content < 27.03% and decreased with an increase in soil moisture when soil water content > 27.03%. Denitrification had a significantly negative relationship with soil salinity, and significantly positive relationship with soil moisture. The interaction of soil salinity and moisture played a central role in regulating soil denitrification. Based on these results, we propose that water consumption of riparian wetlands, and the planting of halophytes, should be increased to reduce soil salinity and increase soil moisture, which is essential for sustaining soil N removal function in riparian wetlands in extremely arid regions.

1. Introduction

Intensive agricultural practices in the arid northwestern regions of China led to N pollution of surface and groundwater [1]. Riparian wetlands are ecologically important transition zones between terrestrial and aquatic ecosystems in extremely arid regions, and they play a critical role in the removal of nitrogen (N) pollution from farmland and groundwater to maintain the health of river ecosystems [2,3]. Previous studies have reported that approximately 68% of N pollution can be removed or retained in global riparian wetlands [4,5,6]. Nitrification and denitrification are the two major processes of N removal in wetlands [7]. Denitrification occurs via anaerobic microbial reduction of nitrate (NO3-N) to nitrous oxide (N2O) or dinitrogen (N2), and the process is well-known for its ability to completely remove N from riparian zones [8,9]. Nitrification oxidizes ammonia (NH4+-N) to NO3-N via nitrite (NO2-N) in oxygenated conditions; this process can remove NH4+-N and provide substrate (NO3-N) for soil denitrification in wetlands [10]. Therefore, studies on soil nitrification and denitrification are essential for the understanding of N removal function in riparian wetlands in extremely arid regions.
Nitrification and denitrification in wetlands are regulated by multiple environmental factors, both biotic and abiotic, including soil microorganisms, moisture, salinity, texture, available carbon and N contents, and vegetation status [11,12,13,14]. Nitrification and denitrification are microbial N transformation processes mediated by nitrifiers and denitrifiers, respectively [7]. Environmental factors control microbial activities, indirectly resulting in changes in nitrification and denitrification [15]. However, environmental factors differ among riparian wetlands in different climatic regions, and the dominant environmental controls on nitrification and denitrification also differ [3,6,16]. Yan et al. [16] found that soil compaction was presumably the limiting factor in soil nitrification, whereas soil organic carbon (SOC) and N availability were the key factors affecting denitrification in tidal riparian zones in a freshwater river, Shanghai, China. Ma et al. [6] pointed out that the denitrification process was mainly regulated by soil moisture and N content in riverine wetlands along a N-rich river in subtropical China. Zimmerman and Benner [17] reported that temperature, SOC, and salinity were important factors in controlling estuarine denitrification in Galveston Bay (Texas, USA) sediments. Wang et al. [14] showed that temperature, salinity, sulfate, and NH4+-N contents were the controlling factors of soil denitrification in tidal wetlands in the Min River estuary, southeastern China. Previous studies mainly concentrated in humid regions [14,17]. However, mechanisms of nitrification and denitrification in riparian wetlands in extremely arid regions have yet to be elucidated.
Shallow groundwater migrates easily to the surface in riparian wetlands in extremely arid regions due to the strong evapotranspiration exceeding precipitation amounts and leading to salinization in these wetlands [18]. In addition, many of the riparian wetlands in extremely arid regions have disappeared during the past century, or have been degraded by climate change and human activity, causing exacerbated salinization [19]. Salinization negatively impacts ecological functions and stability of riparian wetlands ecosystems. Previous studies of wetland ecosystems have shown that soil salinity was a limiting factor affecting key N transformation processes by changing the activity and growth of microorganisms and plants, as well as certain soil physical and chemical properties [20,21,22]. Moreover, there is a close and significant relationship between soil salinity and moisture in riparian wetlands in extremely arid regions [18]. Soil moisture affects nitrification and denitrification differently, through influencing substrates diffusion and exerting strong controls over soil oxygen (O2) concentrations; soil O2 is fundamentally important because it determines whether nitrification and denitrification can take place [23,24]. Thus, it has become increasingly urgent to study the effects of soil salinity and moisture on nitrification and denitrification in the riparian wetlands in extremely arid regions. Further, providing theoretical basis will enable effective management of riparian wetlands to support wetland N removal function and allow sustainable development of arid ecosystems.
In this study, we selected a typical riparian wetland in the middle reaches of the Heihe River, northwestern China. In recent decades, farmland landscape expanded along the river toward the both sides of the river in the middle reaches of the Heihe River, which strongly induced the reduction and salinization of the riparian wetlands [25]. In these farmlands, high sandy content and low nutrient contents need more fertilizer quantity [26]. The irrigation mode of farmlands is mainly flood irrigation, which together determines the farmland to become a vulnerable area of N leaching and groundwater N pollution, and also has an negative impact on the water quality of river [1]. The active N removal function in riparian wetlands plays an important role in protecting river water quality. Therefore, it is essential to study the influencing mechanism of nitrification and denitrification for enhancing the N removal function of limited riparian wetlands in extremely arid regions. Thus, we analyzed soil nitrification and denitrification rates and quantified main soil physico-chemical properties and aboveground biomass in a typical riparian wetland in the middle reaches of the Heihe River. We hypothesized that soil salinity and moisture are the key environmental drivers of nitrification and denitrification in riparian wetlands in extremely arid regions. The objectives of this study were (1) to determine the effects of soil salinity and moisture on nitrification and denitrification in riparian wetlands in extremely arid regions, and (2) to assess the interactions between environmental factors on the two N-processes in riparian wetlands ecosystem. The results of this study will enable policy recommendations for the management of riparian wetlands in extremely arid regions.

2. Materials and Methods
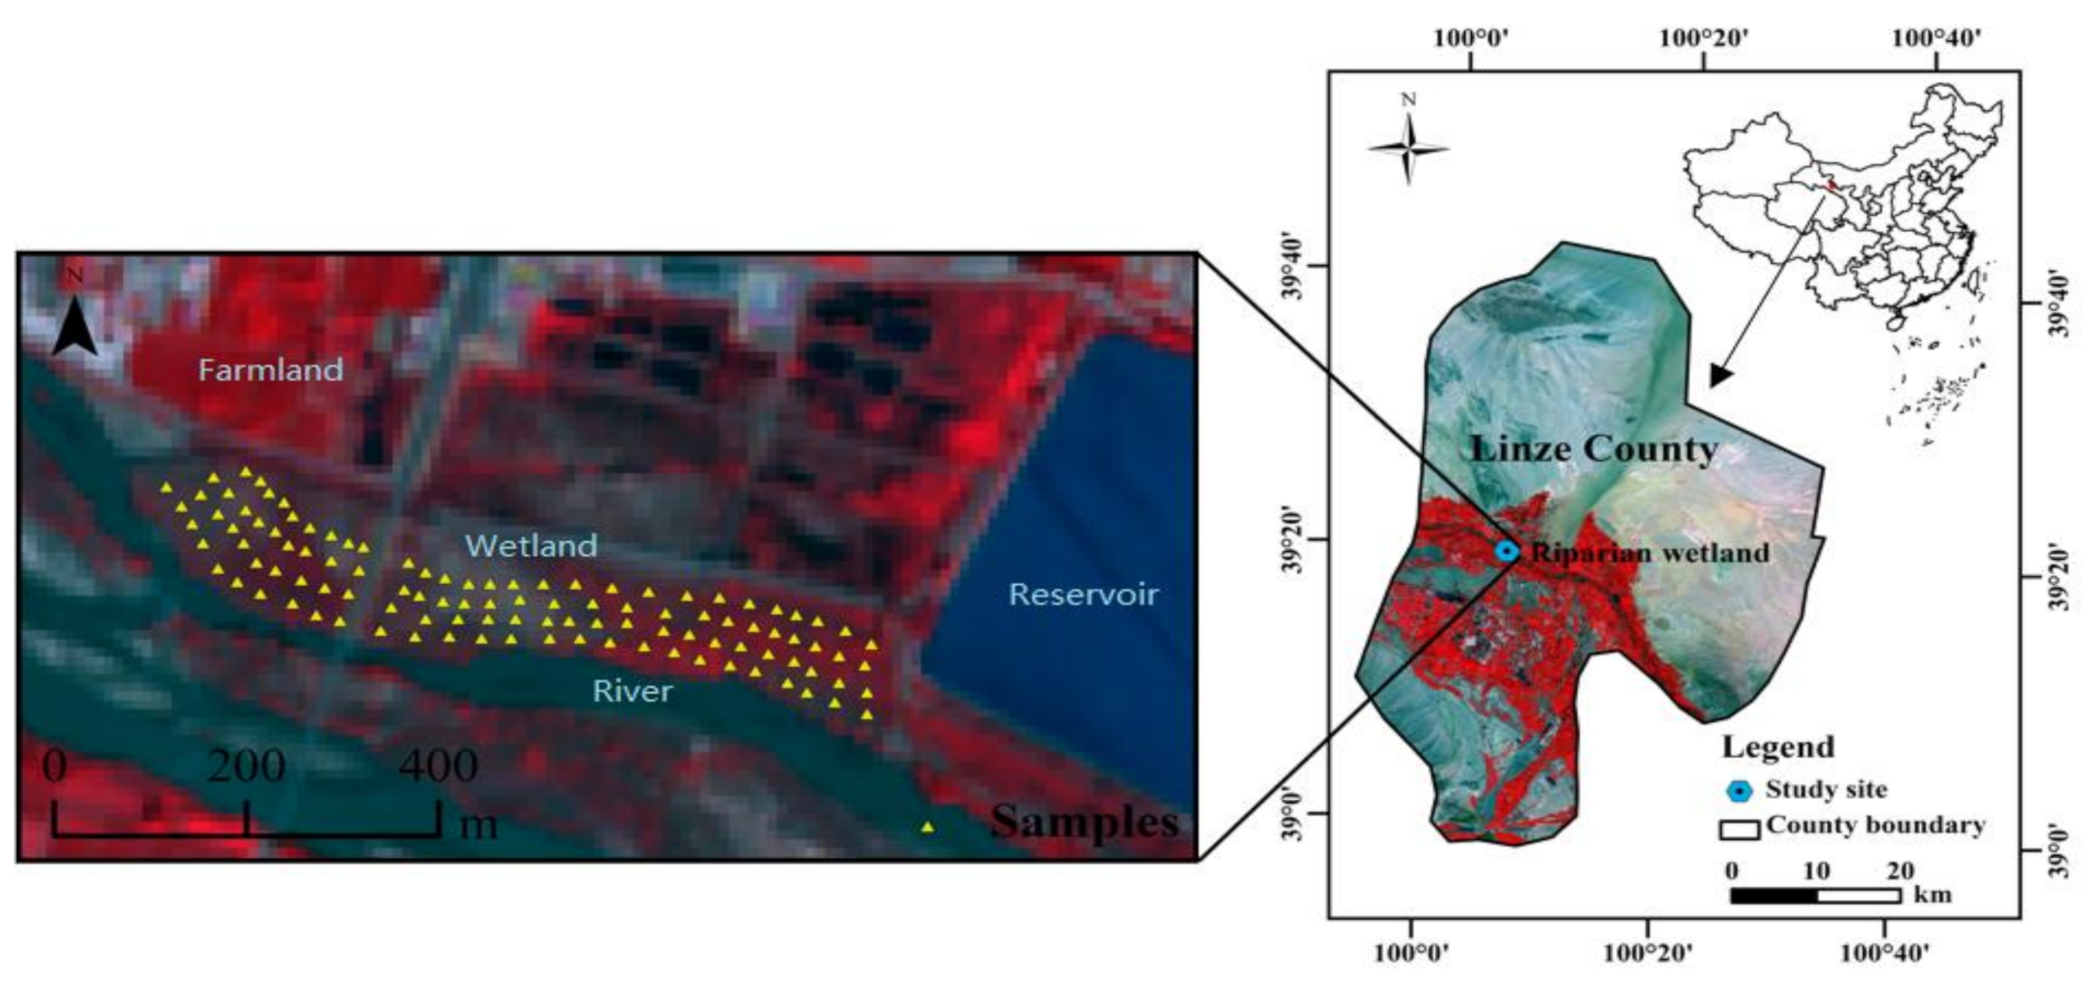
2.1. Study Site

The study was conducted in a riparian wetland in an extremely arid region near the Linze Inland River Basin Research Station of the Chinese Academy of Sciences (between 39°22′ N and 39°23′ N, and 100°07′ E and 100°08′ E), located in the middle reaches of the Heihe River, northwestern China. The study area belongs to temperate continental climate. It is hot in summer with little rain and cold and dry in winter. Mean annual temperature in the area is 8.0 °C, with the lowest temperature (−15.5 °C) in January and the highest (29.1 °C) in July. The temperature differences between day and night are large. Precipitation is rare and evaporation is strong. Average annual precipitation is 125.3 mm, of which 65% is distributed mainly between July and September with relatively low and variable intensity. Mean potential evapotranspiration is 2047 mm, and the average annual relative humidity is about 46%. The frost-free period is 153 days per year. The wind direction is mainly northwest wind, and the wind sand activity is strong, mainly concentrating in March to May. Average annual wind speed is 3.2 m s−1, and the maximum wind speed is 21 m s−1. High temperature, drought and windy are the main climatic characteristics of the region.
The riparian wetland site (between 39°19′45″ N and 39°20′01″ N, and 100°05′46″ E and 100°06′20″ E) is a long-term comprehensive observation site of wetland ecosystems at Linze Research Station. The total area is about 0.6 km2. This wetland has no surface water inflows or outflows, and is maintained by subsurface flows from the river, groundwater, and leakage from farmland irrigation. The structure and types of vegetation are relatively simple, and mainly saline alkali tolerant vegetation. Dominant plant species are herbs (Cynodon dactylon, Carex karoi, Leymus secalinus, Cirsium setosum, and Phragmites australis). The soil is formed by alluvial deposition, and the parent material is river flood deposit. Soil exhibits a sandy loam texture. The groundwater depth of the wetland is shallow (averaged −51.32 cm) and evaporation is strong. The salt in groundwater and soil is easy to migrate to the surface under the action of evaporation pull, resulting in soil salinization. The soil types are mainly salinized meadow soil and saline soil [18].

2.2. Experimental Design and Soil Sampling

In August 2019, we used the grid method to sample. We delineated a belt transect with dimensions of 120 m × 800 m along the riverbank of the Heihe River in the riparian wetland (Figure 1). Four line transects were established inside the belt transect from the riverbank to the land, at an interval of 30–40 m. Under considering these factors such as sampling difficulty, randomness, topography, and road barrier, etc., on each line transect, we established 27 quadrats by placing a pine frame (1 m × 1 m), with a total of 108 samples (Figure 1). The topography gradually decreases from the riverbank to the inland, which makes the groundwater depth gradually shallow and forms the natural soil moisture and salinity gradients. In each quadrat, soil samples were taken from the 0–10 cm layer in 5 evenly distributed sample points, mixed, and sealed in polyethylene bags. Additionally, soil electrical conductivity (EC) was measured with a 2265FS EC Meter (Spectrum Technologies Inc., USA). Then, in each quadrat, a 5 cm-deep soil sample was taken using a stainless steel cutting ring to determine soil bulk density (SBD). Aboveground biomass (AB) was determined by clipping at ground level all herbaceous plants in each quadrat.
In the laboratory, a portion of each fresh soil sample was stored at 4 °C for measurements of nitrification and denitrification rates, one part of each fresh soil sample was separated to measure soil moisture, ammonium-nitrogen (NH4+-N), and nitrate-nitrogen (NO3-N), and the remaining part was air-dried and sieved for further chemical and physical analyses. Aboveground structures of plants were oven-dried at 80 °C to a constant weight for the measurements of aboveground biomass.

2.3. Measurements of Soil Nitrification and Denitrification Rates

Soil nitrification rates were determined by incubating as described in Yan et al. [16]. In short, 10 g of fresh soil was placed in a 50 mL culture bottle with 10 mL of pH 7.2 incubation solution (volume ratio was 3:7:30 for 0.2 mol L−1 KH2PO4, 0.2 mol L−1 K2HPO4, and 0.05 mol L−1 (NH4)2SO4). Bottles were sealed and shaken at 25 °C for 24 h (200 rpm/min). The intensity of soil nitrification was calculated as the change in NO3-N concentration before and after incubation.
Soil denitrification rates were determined following the acetylene inhibition method [4]. Briefly, 10 g of fresh soil was placed in a 50 mL culture bottle with 20 mL of incubation solution (final concentrations: 0.1 g L−1 KNO3, 0.18 g L−1 glucose, and 1 g L−1 chloramphenicol). Bottles were sealed and purged with N2 gas to create anaerobic conditions, and final 10% of the bottle headspace was replaced with acetylene to block the conversion of N2O to N2 during denitrification. Then, bottles were incubated at 25 °C for 24 h in the dark. Concentrations of N2O before and after the reaction were measured using a gas chromatograph (Agilent, 7890A, Palo Alto, CA, USA) equipped with an electron capture detector.

2.4. Soil Analysis

Soil organic carbon (SOC) was measured based on the K2Cr2O7-H2SO4 oxidation method [27]. Total carbon (TC) and total nitrogen (TN) in soil samples were determined by means of a Vario MAX CN element analyzer (Elementar Analysensysteme GmbH, Hanau, Germany). NH4+-N and NO3-N of soil samples were determined using flow injection analysis (FIA) with a Skalar San++ (Skalar Analytical B·V, Breda, Netherlands). Soil texture was analyzed by laser diffraction using Mastersizer 2000 (Malvern Instruments, Malvern, England). Soil water content (SWC) was measured after oven drying at 105 °C for 24 hours. SBD was calculated as the ratio of the oven-dry mass of soil cores to the container volume.

2.5. Data Analysis

In this paper, descriptive statistics were calculated of soil nitrification and denitrification rates, soil physico-chemical properties, and aboveground biomass. All data were tested for normality and homogeneity of variance, and logarithmic transformations were conducted for normality, when necessary. The spatial distributions of soil nitrification and denitrification rates and environmental variables were shown. Pearson correlation analysis was performed to correlate soil nitrification and denitrification rates with environmental variables. Significance was accepted at alpha level of 0.05 for all statistical analyses, and high significance was accepted at alpha level of 0.01. Then, regression analysis was used to determine relationships between highly significantly correlated variables and soil nitrification and denitrification rates. To analyze the interaction effects between environmental factors on nitrification and denitrification in this riparian wetland in an extremely arid region, a structural equation model (SEM) was constructed based on the highly significantly related factors obtained from correlation analysis. Descriptive statistics, Kriging interpolation, Pearson correlation analysis, and regression analysis were conducted using Python tools, whereas the SEM was conducted using AMOS 17.0 [28].

3. Results

3.1. Soil Nitrification, Denitrification and Environmental Factors

Soil nitrification rates (NR) and denitrification rates (DR) ranged from 52.77 to 221.18 μg kg−1 h−1 and 91.25 to 428.26 μg kg−1 h−1, respectively (Table 1). The average value of DR (308.9 μg kg−1 h−1) was higher than the average value of NR (144.11 μg kg−1 h−1) in the studied riparian wetland in the extremely arid region, suggesting that the wetland had a strong ability to remove NO3-N. Moderate coefficient of variance (CV) values of NR (49%) and DR (84%) were observed, indicating moderate variability of NR and DR in the studied riparian wetland. The results of the K-S tests showed that both NR and DR followed normal distributions. As for soil and vegetation properties, soil sand, and silt contents, SBD, SOC, TN, NO3-N, and NH4+-N followed normal distributions, whereas other variables followed lognormal distributions. Except SWC (13%), AB (35%), and silt content (27%) coupled with moderate (weaker) CV values, the other soil variables exhibited low variabilities with the CV values lower than 8%. Moreover, the mean level of EC was 6.8 mS cm−1, reflecting severe salinity in the riparian wetland in this study.
NR and DR had similar trends in the spatial distribution (Figure 2). The pattern of the two key soil N processes followed noticeable opposite trends with EC, but obvious similarity with SWC. In addition, the change trends of NR and DR were certain similar to that of AB, SOC, TN, NO3-N, and NH4+-N, but opposite to SBD. EC and SBD gradually decreased from the bank to the inside, but other indicators gradually increased from the riverbank inward. This was mainly due to the gradual decline of terrain, which made the groundwater level shallower in the inside than that in the bank.

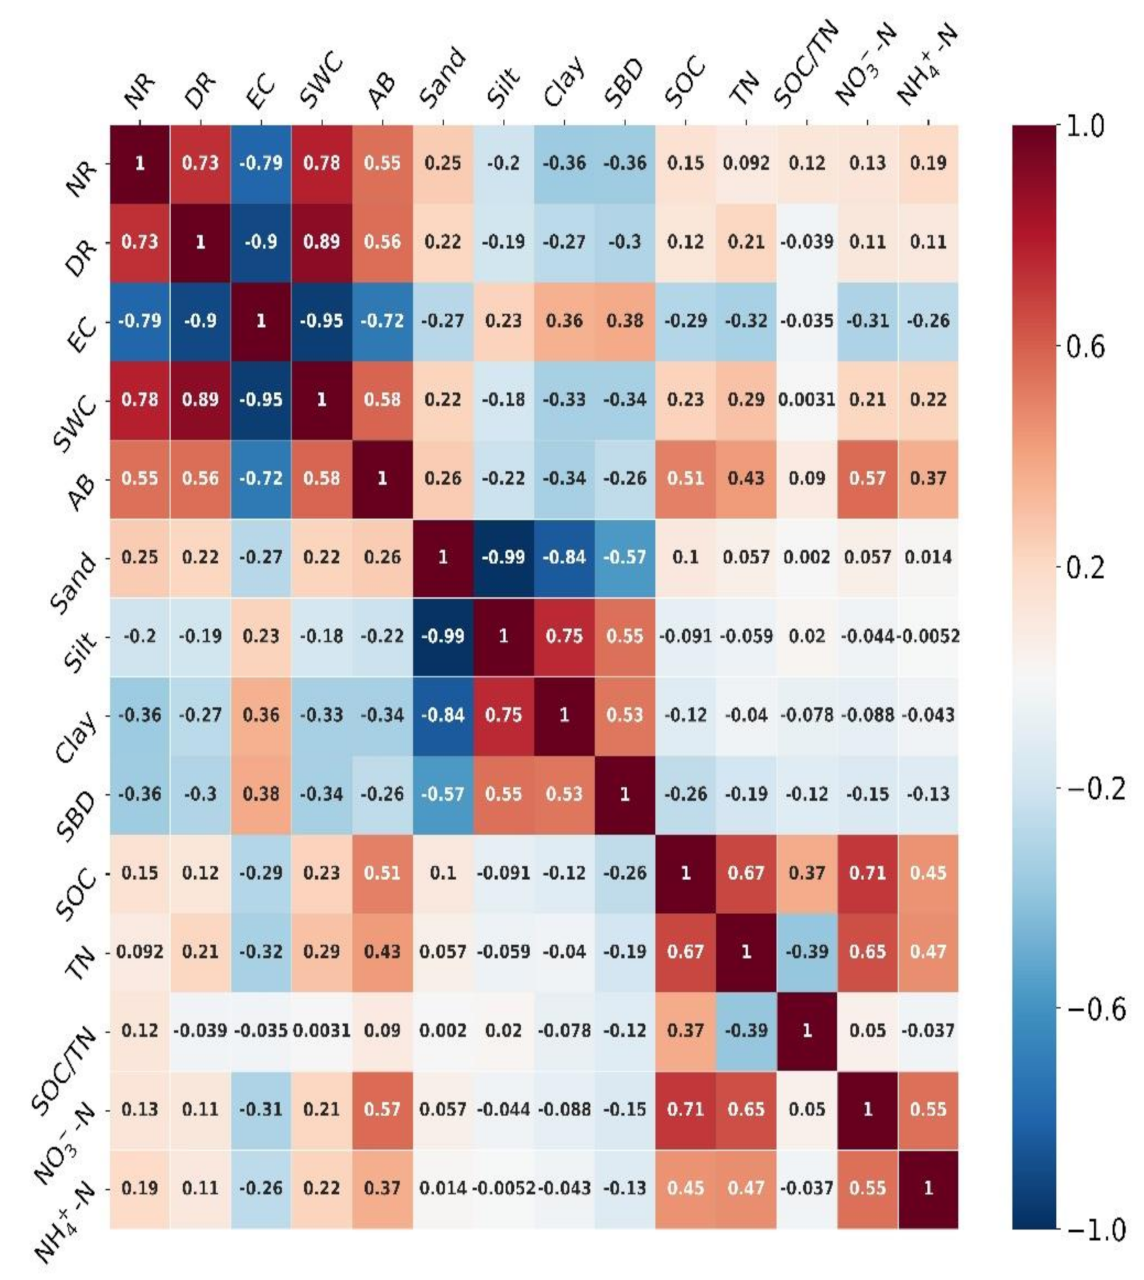
3.2. Correlations Between Soil Nitrification and Denitrification Rates and Environmental Variables

Both NR and DR exhibited the most significant negative correlations with EC (r = −0.79, P < 0.01 and r = −0.9, P < 0.01, respectively), and the most significant positive correlations with SWC (r = 0.78, P < 0.01 and r = 0.89, P < 0.01, respectively) (Figure 3). Moreover, NR and DR were also significantly positively related to AB (r = 0.55, P < 0.01 and r = 0.56, P < 0.01, respectively). EC exhibited significant negative correlations with SWC and AB (r = −0.95, P < 0.01 and r = −0.72, P < 0.01, respectively). Weak correlations (NR and Sand, NR and Silt, NR and Clay, NR and SBD, and NR and NH4+-N; DR and Sand, DR and Silt, DR and Clay, DR and SBD, and DR and TN) or insignificant relationships (NR and SOC, NR and TN, NR and SOC/TN, and NR and NO3-N; DR and SOC, DR and SOC/TN, DR and NO3-N, and DR and NH4+-N) were found between the two N processes and other environmental factors.

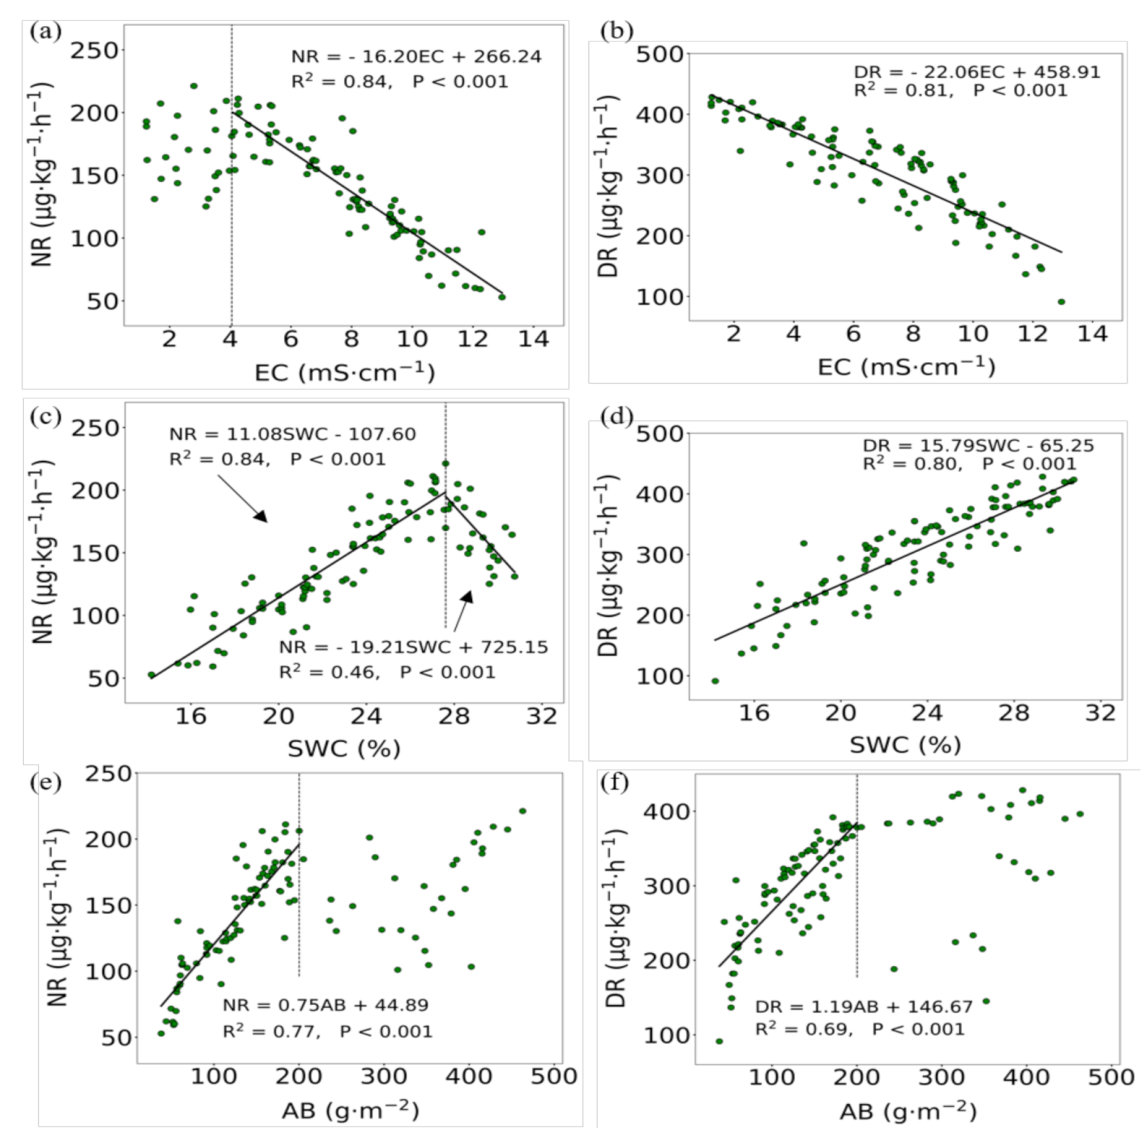
3.3. Relationships Between Soil Nitrification and Denitrification Rates, and Main Influencing Factors

Based on the correlation analysis, the most relevant variables, soil EC, SWC, and AB, were selected for regression analysis with soil nitrification and denitrification (Figure 4). When EC was > 4.05 mS·cm−1, linear function was fitted to the relationship between NR and EC (R2 = 0.84, P < 0.001; Figure 4a), and there was a negative correlation between them. However, when EC was < 4.05 mS cm−1, no significant relationship was found between NR and EC. In addition, When SWC was < 27.03% or > 27.03%, linear function was fitted to the relationships between NR and SWC, respectively (R2 = 0.84, P < 0.001; R2 = 0.46, P < 0.001; Figure 4c). However, they were opposite trends. When SWC was > 27.03%, there was a negative correlation between NR and SWC. Both relationships between DR and EC (R2 = 0.81, P < 0.001; Figure 4b) and between DR and SWC (R2 = 0.80, P < 0.001; Figure 4d) were characterized by linear functions, but with opposite trends. DR and EC, and DR and SWC had negative and positive correlation, respectively. When AB was < 200.32 g m−2, both NR and AB, and DR and AB were positively correlated (R2 = 0.77, P < 0.001, Figure 4e; R2 = 0.69, P < 0.001, Figure 4f). However, when AB was > 200.32 g m−2, they had no significant relationships.

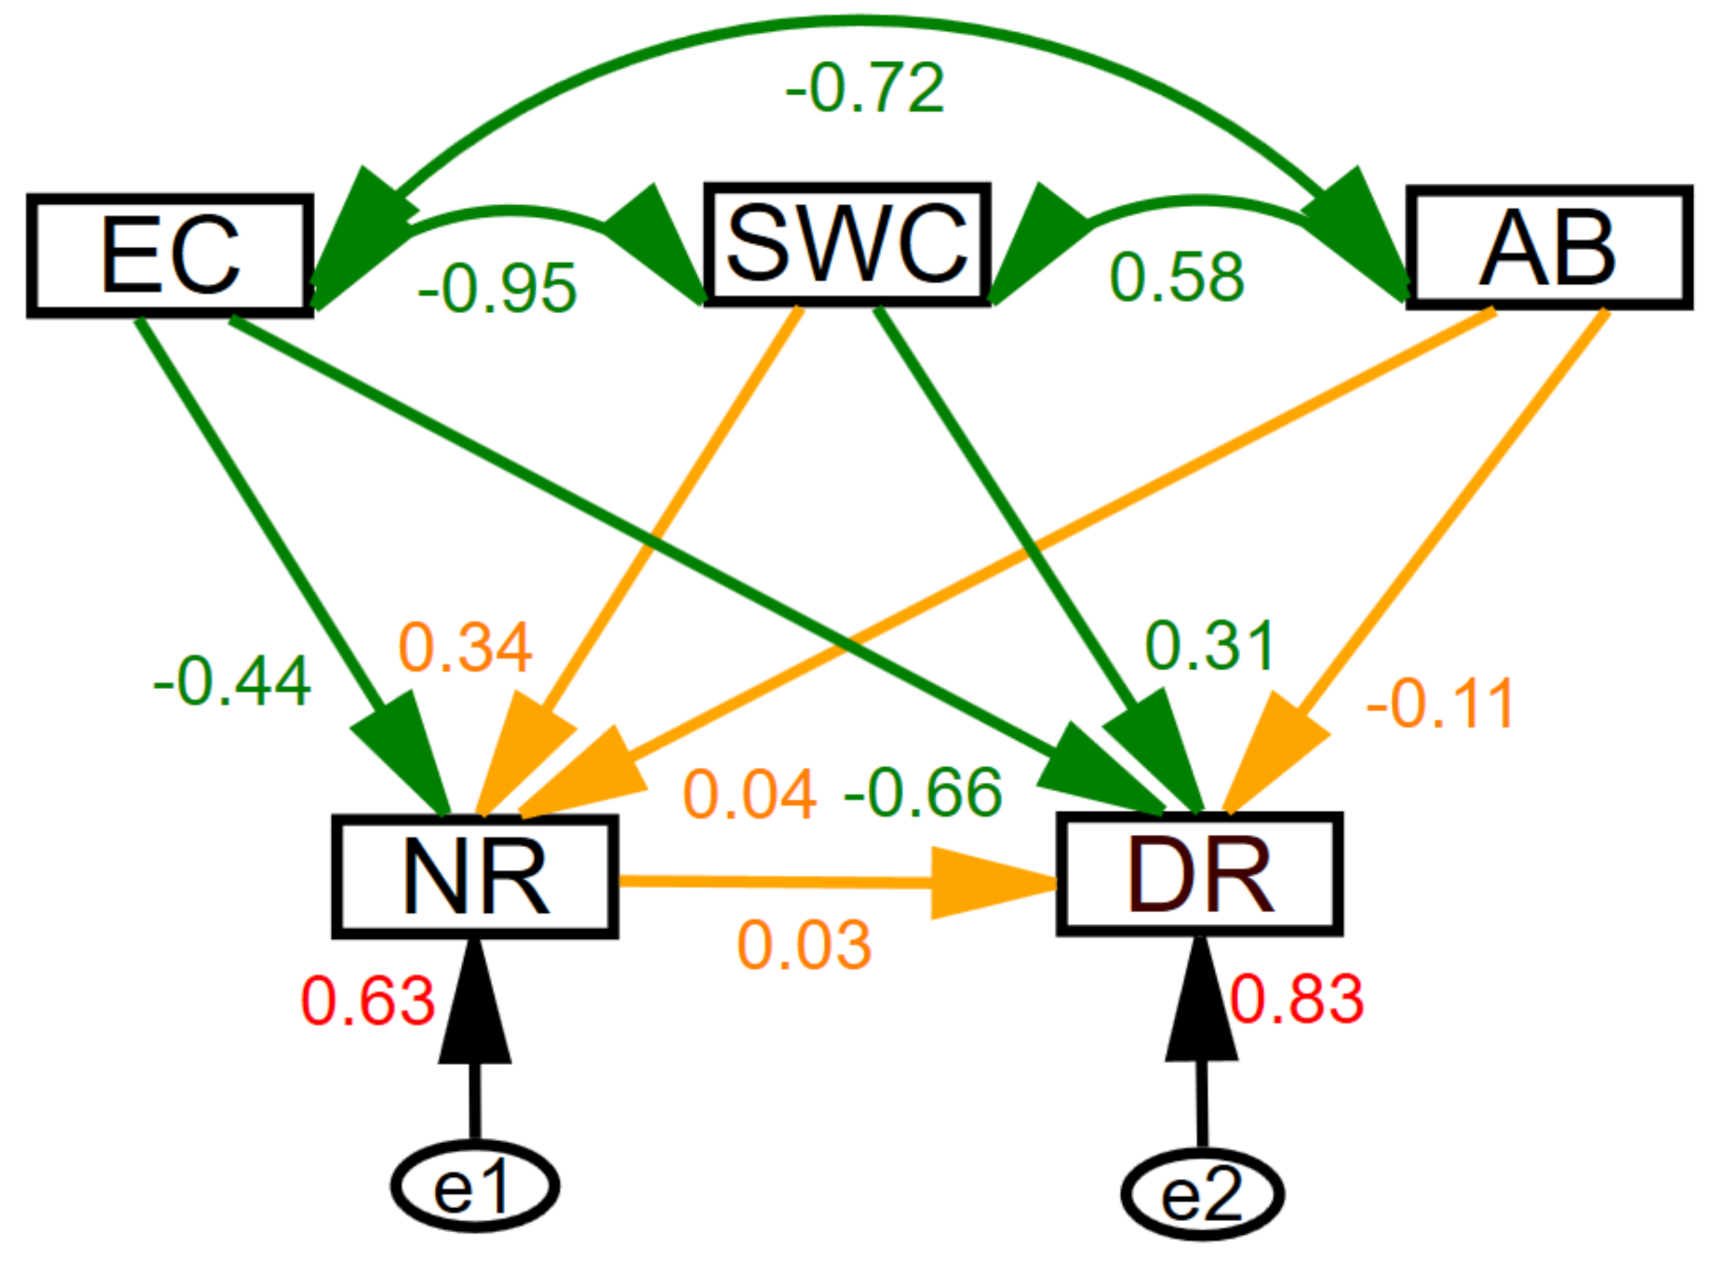
3.4. Interaction Among Main Influencing Factors of Soil Nitrification and Denitrification

We built the structural equation model (SEM) using factors that exhibited strong correlations with soil nitrification and denitrification (EC, SWC, and AB) (Figure 5). The SEM explained large portions of the variability, at 63% for nitrification and 83% for denitrification rates. NR exhibited significant negative relationships with EC (standardized coefficient = −0.44, P < 0.05), whereas no significant relationships were detected between NR and SWC as well as AB, indicating that soil salinity was the key factor influencing soil nitrification in riparian wetlands in extremely arid regions. Simultaneously, the SEM indicated that DR was not significantly related to AB, with standardized coefficients of 0.11. However, there were significant relationships between DR and EC and, DR and SWC, with standardized coefficients of −0.66 (P < 0.001) and 0.31 (P < 0.05), respectively; this suggested that soil denitrification rates in this wetland were mainly controlled by the soil salt and water content. Moreover, DR was not significantly related to NR.

4. Discussion

4.1. Soil Nitrification and Denitrification in a Riparian Wetland in an Extremely Arid Region

In our study, the average value of soil denitrification rates (308.9 μg kg−1 h−1) was higher than nitrification rates (144.11 μg kg−1 h−1), indicating that the function of removing NO3-N was strong in the riparian wetland in this extremely arid region. Similar results have been previously reported in other riparian wetlands from different climatic zones [29,30,31]. High denitrification rates are due mainly to the high soil water content in riparian wetlands resulting in the relatively low soil oxygen (O2) concentration, which is conducive to the anaerobic process of denitrification [11]. Therefore, many of the previous wetland studies focused on soil denitrification as the most important N removal process in riparian wetlands [2,32,33].
Due to the diversity of soil properties, vegetation, and climate, the dominant factors of soil nitrification and denitrification in different riparian wetlands have not been consistent [2,10]. Yan et al. [16] reported that soil compaction was the main constraint factor in soil nitrification, and SOC and N availability were the key factors affecting denitrification in tidal riparian zones in a freshwater river which undergo more frequent river–soil exchanges than normal riparian areas. Ma et al. [6] showed that soil moisture and N content were the limiting factors regulating denitrification process in riverine wetlands along a N-rich river in subtropical China. Zimmerman and Benner [17] found that estuarine denitrification was mainly regulated by temperature, SOC, and salinity. Wang et al. [14] pointed out that temperature, salinity, sulfate, and NH4+-N contents were the key factors of soil denitrification in tidal wetlands in the Min River estuary, southeastern China, where saltwater intrusion caused by sea-level rise exerted complex effects on the soil denitrification. In this study of a riparian wetland in an extremely arid region, soil salinity and moisture were found to be the key factors controlling nitrification and denitrification, which proved our hypothesis was correct. This was mainly due to the high salinity in the riparian wetland in this study. The mean level of soil EC was 6.8 mS cm−1, which was considerably higher than that in most riparian wetlands in humid regions [6,16]. Further, the results revealed that there was a significant negative correlation between EC and SWC. In arid wetlands of China, shallow groundwater migrates to the surface due to strong evapotranspiration, causing wetland soil salinization to varying degrees [18]. Low soil salinity corresponds to high soil moisture and shallower groundwater level, due to strong dilution of salt by groundwater.

4.2. Driving factors in Soil Nitrification and Denitrification in a Riparian Wetland in an Extremely Arid Region

Soil salinity in wetlands can decrease soil microbial biomass and inhibit soil nitrification [14,22,34]. In our study, soil salinity was the most important driver of soil nitrification in the riparian wetland. This finding revealed that when EC was higher than 3.31 mS cm−1, soil salinity exerted significant inhibitory influence on soil nitrification in the studied wetland. Furthermore, 85.19% of the sample points in this study had an EC value greater than 3.31 mS cm−1, indicating that a large area of this riparian wetland had an inhibitory effect on soil nitrification. On one hand, NH4+-N required by nitrifiers cannot be easily adsorbed in conditions of high salt content in a wetland soil to reduce the nitrification substrate; on the other hand, high salinity in the studied wetland may restrain permeability of soils, possibly resulting in an adverse habitat for nitrifiers, and indirectly reducing nitrification [20,21]. Soil moisture was another strong driver of nitrification in this study. In fact, soil moisture is inversely proportional to O2 content and aeration status in soils [35]. Previous studies have showed that soil nitrification was strongest when soil moisture was between 50% and 70% of water holding capacity (WHC), because the metabolism of nitrifiers obtain the most favourable water and O2 diffusion conditions [36,37]. Nevertheless, in our study, soil nitrification in the wetland in an arid region increased with an increase in soil moisture content to a maximum of 28.5%, corresponding to 84.01% WHC (33.91%) based on the average of the study zones, and decreased thereafter. The reason why nitrification continued increasing at WHC > 70% may be that O2 secretion ability of plants was strong, thus providing the required O2 for nitrification; or maybe that soil salinity was low at WHC > 70%, favoring the activity of nitrifiers.
Soil salinity influences denitrification mainly through changing the activity and quantity of microorganisms [38,39]. Additionally, salinity affects certain physical and chemical processes, and thereby exerts an indirect influence on denitrification [20,21]. Soil moisture affects denitrification by influencing substrate diffusion, exerting strong controls over soil O2 concentrations, and acting on microorganisms [23,24]. In general, soil denitrification decreased with an increase in soil salinity, but increased with an increase in soil moisture in riparian wetlands [2,30]. This is in agreement with our findings that denitrification rates showed a significantly negative relationship with EC in EC range of 1.24 to 12.96 mS cm−1, and a significantly positive relationship with soil water content between SWC range of 14.2 to 30.75%. SEM analysis also indicated that the interaction of soil salinity and moisture was the main driving mechanism of soil denitrification in the riparian wetland in the extremely arid region in this study. This was because the higher the soil moisture, the lower the soil salinity and soil O2, favoring the activity of denitrifying bacteria and promoting denitrification. This suggested that soil environments with high moisture and low salinity in riparian wetlands in extremely arid regions would contribute to denitrification.
In addition, Bastviken et al. [30] showed that wetland vegetation was an important supplier of soil organic matter fueling denitrification. In this study, the aboveground biomass (AB) of a large part of the sample points was less than 200 g m−2, and soil nitrification and denitrification increased with the increase of AB at aboveground biomass < 200 g m−2. This is probably because vegetation can supply soil nutrients, and root system can affect soil air composition and microbial activity, thereby influencing soil N transformation processes. Moreover, previous research indicated that NH4+-N, NO3-N, and SOC, etc., also were important factors influencing soil nitrification and denitrification [2,11]. NH4+-N and NO3-N are the substrates of nitrifiers and denitrifiers, respectively [40]. SOC serves as electron donor and energy source favoring soil nitrification and denitrification, and the decomposition of SOC by O2-consuming bacteria could create anaerobic conditions favorable for denitrifiers, but adverse for nitrifiers [12,14,41]. Interestingly, we observed in this study that the spatial heterogeneity of these environmental factors was weak, and soil nitrification and denitrification rates had weak or no significant relationships with these environmental factors. A possible reason may be that soil nutrient contents in the studied wetland were relatively enough for microorganisms. Furthermore, the limitation of soil nutrients on soil N transformation processes was relatively low compared to that of high soil salinity and moisture.
Based on the results of this study, we propose relevant management countermeasures and suggestions for the future maintenance of N removal function in riparian wetlands in extremely arid regions. Evapotranspiration in extremely arid regions is expected to increase with global warming, aggravating salinization in riparian wetlands. Therefore, the government can improve the ecological water consumption of wetlands and controlling the overuse of farmland water to increase soil moisture and reduce soil salinity and then enhance N removal function in riparian wetlands in extremely arid regions. The increase in the planting of halophytes to decrease soil salinity, which is essential in promoting soil nitrification and denitrification rates, thereby ensures N removal function of wetlands in extremely arid regions.

5. Conclusions

Our study showed that soil salinity and moisture were the key factors in exerting a highly significant impact on nitrification and denitrification in a riparian wetland in an extremely arid region. Soil salinity exerted significant inhibitory impact on soil nitrification when EC was higher than 4.05 mS cm−1. Soil nitrification increased with an increase in soil moisture when SWC < 27.03%, and it decreased with an increase in soil moisture when SWC > 27.03%. Denitrification had a significantly negative relationship with soil salinity, whereas it had significantly positive relationship with soil moisture, and denitrification was significantly influenced by the interaction of soil salinity and moisture.

Author Contributions

Conceptualization, Y.M. and Z.H.; methodology, Y.M., Z.H., and B.L.; formal analysis, Y.M.; investigation, Y.M. and L.C.; writing—original draft preparation, Y.M.; writing—review and editing, Y.M., P.L., and W.L.; funding acquisition, Z.H. All authors have read and agreed to the published version of the manuscript.

Funding

This study was supported by the National Key Research and Development Program of China (No. 2017YFC0504306), the Major Program of National Natural Science Foundation of China (No. 41630861), and the National Natural Science Foundation of China (No. 41771038; 41807150).

Acknowledgments

We thank all the participants in the Linze Inland River Basin Research Station, Northwest Institute of Eco-Environment and Resources, Chinese Academy of Sciences. We also gratefully acknowledge anonymous reviewers for their valuable comments on an earlier version of our manuscript.

Conflicts of Interest

The authors declare no conflict of interest.

References

  1. Li, J.; He, Z.; Du, J.; Zhao, L.; Chen, L.; Zhu, X.; Lin, P.; Fang, S.; Zhao, M.; Tian, Q. Regional variability of agriculturally-derived nitrate-nitrogen in shallow groundwater in China, 2004–2014. Sustainability 2018, 10, 1393. [Google Scholar] [CrossRef] [Green Version]
  2. Burgin, A.J.; Groffman, P.M.; Lewis, D.N. Factors regulating denitrification in a riparian wetland. Soil Sci. Soc. Am. J. 2010. [Google Scholar] [CrossRef]
  3. Rivas, A.; Singh, R.; Horne, D.; Roygard, J.; Matthews, A.; Hedley, M.J. Denitrification potential in the subsurface environment in the Manawatu River catchment, New Zealand: Indications from oxidation-reduction conditions, hydrogeological factors, and implications for nutrient management. J. Environ. Manag. 2017. [Google Scholar] [CrossRef] [PubMed]
  4. Liu, W.; Xiong, Z.; Liu, H.; Zhang, Q.; Liu, G. Catchment agriculture and local environment affecting the soil denitrification potential and nitrous oxide production of riparian zones in the Han River Basin, China. Agric. Ecosyst. Environ. 2016, 216, 147–154. [Google Scholar] [CrossRef]
  5. Mayer, P.M.; Reynolds, S.K.; McCutchen, M.D.; Canfield, T.J. Meta-analysis of nitrogen removal in riparian buffers. J. Environ. Qual. 2007. [Google Scholar] [CrossRef] [PubMed]
  6. Ma, L.; Xiong, Z.; Yao, L.; Liu, G.; Zhang, Q.; Liu, W. Soil properties alter plant and microbial communities to modulate denitrification rates in subtropical riparian wetlands. Land Degrad. Dev. 2020. [Google Scholar] [CrossRef]
  7. Yu, G.; Cheng, S.; Fang, H.; Tian, J.; Xu, M.; Yu, G.; He, S. European journal of soil biology responses of soil nitrous oxide fl ux to soil environmental factors in a subtropical coniferous plantation: A boundary line analysis. Eur. J. Soil Biol. 2018, 86, 16–25. [Google Scholar] [CrossRef]
  8. Philippot, L. Denitrifying genes in bacterial and Archaeal genomes. Biochim. Biophys. Acta Gene Struct. Expr. 2002. [Google Scholar] [CrossRef]
  9. Ranalli, A.J.; Macalady, D.L. The importance of the riparian zone and in-stream processes in nitrate attenuation in undisturbed and agricultural watersheds—a review of the scientific literature. J. Hydrol. 2010. [Google Scholar] [CrossRef]
  10. Ye, C.; Cheng, X.; Zhang, Y.; Wang, Z.; Zhang, Q. Soil nitrogen dynamics following short-term revegetation in the water level fluctuation zone of the Three Gorges Reservoir, China. Ecol. Eng. 2012. [Google Scholar] [CrossRef]
  11. Barnard, R.; Leadley, P.W.; Hungate, B.A. Global change, nitrification, and denitrification: A review. Glob. Biogeochem. Cycles 2005, 19. [Google Scholar] [CrossRef]
  12. Kjellin, J.; Hallin, S.; Wo, A. Spatial variations in denitrification activity in wetland sediments explained by hydrology and denitrifying community structure. Water Res. 2007, 41, 4710–4720. [Google Scholar] [CrossRef] [PubMed]
  13. Seitzinger, S.P. Linkages between organic matter mineralization denitrification in eight riparian wetlands. Biogeochemistry 1994, 25, 19–39. [Google Scholar] [CrossRef]
  14. Wang, X.; Hu, M.; Ren, H.; Li, J.; Tong, C.; Musenze, R.S. Seasonal variations of nitrous oxide fl uxes and soil denitri fi cation rates in subtropical freshwater and brackish tidal marshes of the Min River estuary. Sci. Total Environ. 2018, 616, 1404–1413. [Google Scholar] [CrossRef] [PubMed]
  15. Balser, T.C. Linking soil process and microbial ecology in freshwater wetland ecosystems. Plant Soil 2006, 289, 17–34. [Google Scholar] [CrossRef]
  16. Yan, L.; Xie, C.; Xu, X.; Che, S. Effects of revetment type on the spatial distribution of soil nitrification and denitrification in adjacent tidal urban riparian zones. Ecol. Eng. 2019. [Google Scholar] [CrossRef]
  17. Zimmerman, A.R.; Benner, R. Denitrification, nutrient regeneration and carbon mineralization in sediments of Galveston Bay, Texas, USA. Mar. Ecol. Prog. Ser. 1994, 114, 275. [Google Scholar] [CrossRef]
  18. Liu, B.; Zhao, W.; Wen, Z.; Yang, Y.; Chang, X.; Yang, Q.; Meng, Y.Y.; Liu, C. Mechanisms and feedbacks for evapotranspiration-induced salt accumulation and precipitation in an arid wetland of China. J. Hydrol. 2019, 568, 403–415. [Google Scholar] [CrossRef]
  19. Li, S.; Zhao, W. Landscape pattern changes of desert oasis wetlands in the middle reach of the heihe river, China. Arid Land Res. Manag. 2010. [Google Scholar] [CrossRef]
  20. Edmonds, J.W.; Weston, N.B.; Joye, S.B.; Mou, X.; Moran, M.A. Microbial community response to seawater amendment in low-salinity tidal sediments. Microb. Ecol. 2009, 58, 558–568. [Google Scholar] [CrossRef]
  21. Giblin, A.E.; Weston, N.B.; Banta, G.T.; Tucker, J.; Hopkinson, C.S. The effects of salinity on nitrogen losses from an oligohaline estuarine sediment. Estuaries Coasts 2010, 33, 1054–1068. [Google Scholar] [CrossRef]
  22. Hu, Y.; Wang, L.; Tang, Y.; Li, Y.; Chen, J.; Xi, X.; Zhang, Y.; Fu, X.; Wu, J.; Sun, Y. Variability in soil microbial community and activity between coastal and riparian wetlands in the Yangtze River estuary e Potential impacts on carbon sequestration. Soil Biol. Biochem. 2014, 70, 221–228. [Google Scholar] [CrossRef]
  23. Benckiser, G.; Schartel, T.; Weiske, A. Control of NO3—and N2O emissions in agroecosystems: A review. Agron. Sustain. Dev. 2015, 35, 1059–1074. [Google Scholar] [CrossRef]
  24. Curtin, D.; Beare, M.H.; Hernandez-Ramirez, G. Temperature and moisture effects on microbial biomass and soil organic matter mineralization. Soil Sci. Soc. Am. J. 2012. [Google Scholar] [CrossRef]
  25. Junk, W.J.; An, S.; Finlayson, C.M.; Gopal, B.; Květ, J.; Mitchell, S.A.; Mitsch, W.J.; Robarts, R.D. Current state of knowledge regarding the world’s wetlands and their future under global climate change: A synthesis. Aquat. Sci. 2013, 75, 151–167. [Google Scholar] [CrossRef] [Green Version]
  26. Su, Y.Z.; Zhao, W.Z.; Su, P.X.; Zhang, Z.H.; Wang, T.; Ram, R. Ecological effects of desertification control and desertified land reclamation in an oasis-desert ecotone in an arid region: A case study in Hexi Corridor, northwest China. Ecol. Eng. 2007. [Google Scholar] [CrossRef]
  27. Nelson, D.W.; Sommers, L.E. Total Carbon, Organic Carbon, and Organic Matter. In Methods of Soil Analysis: Part 2 Chemical and Microbiological Properties; American Society of Agronomy: Madison, WI, USA, 1983; Volume 9, pp. 539–579. ISBN 978-0891188117. [Google Scholar]
  28. Arbuckle, J. Amos 17.0 User’s Guide; SPSS Inc.: Crawfordville, FL, USA, 2008. [Google Scholar]
  29. Paeri, H.W. Seasonal patterns of nitrification and denitrification in a natural and a restored salt marsh. Estuaries 1995, 18, 399–408. [Google Scholar]
  30. Rysgaard, S.; Thastum, P.; Dalsgaard, T.; Christensen, P.B.; Sloth, N.P.; Rysgaard, S. Effects of salinity on nh 4 + adsorption capacity, nitrification, and denitrification in danish estuarine sediments. Estuaries 1999, 22, 21–30. [Google Scholar] [CrossRef]
  31. He, Z.B.; Chen, L.F.; Du, J.; Zhu, X.; Lin, P.F.; Li, J.; Xiang, Y.Z. Responses of soil organic carbon, soil respiration, and associated soil properties to long-term thinning in a semiarid spruce plantation in northwestern China. Land Degrad. Dev. 2018, 29, 4387–4396. [Google Scholar] [CrossRef]
  32. Bastviken, S.K.; Eriksson, P.G.; Premrov, A.; Tonderski, K. Potential denitrification in wetland sediments with different plant species detritus. Ecol. Eng. 2005. [Google Scholar] [CrossRef]
  33. Sirivedhin, T.; Gray, K.A. Factors affecting denitrification rates in experimental wetlands: Field and laboratory studies. Ecol. Eng. 2006, 26, 167–181. [Google Scholar] [CrossRef]
  34. Siddikee, M.A.; Tipayno, S.C.; Kim, K.; Chung, J.; Sa, T. Influence of varying degree of salinity-sodicity stress on enzyme activities and bacterial populations of coastal soils of yellow sea, South Korea. J. Microbiol. Biotechnol. 2011, 21, 341–346. [Google Scholar] [CrossRef] [PubMed]
  35. Barrena, I.; Menéndez, S.; Correa-galeote, D.; Vega-mas, I.; Bedmar, E.J.; González-murua, C.; Estavillo, J.M. Geoderma soil water content modulates the e ff ect of the nitri fi cation inhibitor 3, 4- dimethylpyrazole phosphate (DMPP) on nitrifying and denitrifying bacteria. Geoderma 2017, 303, 1–8. [Google Scholar] [CrossRef]
  36. Flowers, T.H.; Arnold, P.W. Immobilization and mineralization of nitrogen in soils incubated with pig slurry or ammonium sulphate. Soil Biol. Biochem. 1983. [Google Scholar] [CrossRef]
  37. Linn, D.M.; Doran, J.W. Effect of water-filled pore space on carbon dioxide and nitrous oxide production in tilled and nontilled soils1. Soil Sci. Soc. Am. J. 1984. [Google Scholar] [CrossRef] [Green Version]
  38. Tripathi, S.; Kumari, S.; Chakraborty, A.; Gupta, A.; Chakrabarti, K.; Bandyapadhyay, B.K. Microbial biomass and its activities in salt-affected coastal soils. Biol. Fertil. Soils 2006, 42, 273–277. [Google Scholar] [CrossRef]
  39. Tang, X.; Xie, G.; Shao, K.; Bayartu, S.; Chen, Y.; Gao, G. Influence of salinity on the bacterial community composition in Lake Bosten, a large oligosaline lake in arid Northwestern China. Appl. Environ. Microbiol. 2012, 78, 4748–4751. [Google Scholar] [CrossRef] [Green Version]
  40. Wang, Y.; Cheng, S.; Fang, H.; Yu, G.; Xu, M.; Dang, X.; Li, L.; Wang, L. Simulated nitrogen deposition reduces CH4 uptake and increases N2O emission from a subtropical plantation forest soil in Southern China. PLoS ONE 2014, 9, e93571. [Google Scholar] [CrossRef]
  41. Nielsen, L.P.; Christensen, P.B.; Revsbech, N.P.; Sørensen, J. Denitrification and oxygen respiration in biofilms studied with a microsensor for nitrous oxide and oxygen. Microb. Ecol. 1990. [Google Scholar] [CrossRef]
Figure 1. Map showing location of the study site, a typical riparian wetland in an arid zone in northwestern China. Triangles indicate sampling locations.
Water 12 02815 g001
Figure 2. The spatial distribution of (a) soil nitrification rates (NR), (b) soil denitrification rates (DR), (c) soil electrical conductivity (EC), (d) soil water content (SWC), (e) aboveground biomass (AB), (f) soil organic carbon (SOC), (g) nitrate-nitrogen (NO3-N), (h) ammonium-nitrogen (NH4+-N), (i) total nitrogen (TN), and (j) soil bulk density (SBD) in the studied riparian wetland.
Water 12 02815 g002
Figure 3. Correlation analysis between soil nitrification rates (NR) and soil denitrification rates (DR) and environmental variables (soil electrical conductivity (EC), soil water content (SWC), aboveground biomass (AB), soil sand content, soil silt content, soil clay content, soil bulk density (SBD), soil organic carbon (SOC), total nitrogen (TN), SOC/TN, nitrate-nitrogen (NO3-N), and ammonium-nitrogen (NH4+-N) ) in the studied riparian wetland.
Water 12 02815 g003
Figure 4. Relationships between soil nitrification rates (NR) and denitrification rates (DR) and the main controlling factors in the studied wetland (a) NR and soil electrical conductivity (EC), (b) DR and EC, (c) NR and soil water content (SWC), (d) DR and SWC, (e) NR and aboveground biomass (AB), and (f) DR and AB.
Water 12 02815 g004
Figure 5. Structural equation model (SEM) revealing influences of main environmental factors (soil electrical conductivity (EC), soil water content (SWC), aboveground biomass (AB)) on soil nitrification rates (NR) and denitrification rates (DR). Green arrows indicate significant (P < 0.05) and orange arrows indicate insignificant (P > 0.05) relationships. Numbers beside the arrows are standardized coefficients. The proportion of variation explained by the model is indicated by red numbers near textboxes.
Water 12 02815 g005
Table 1. Descriptive statistics of soil nitrification and denitrification rates, soil physico-chemical properties and aboveground biomass in the studied riparian wetland in an extremely arid region.
N Processes and Environmental FactorsNo.MinMaxMeanSDCVSkewKurtosisK-SDistribution
NR (μg kg−1 h−1)10852.77221.18144.11 40.11 0.49 −0.258−0.640.20Normal
DR (μg kg−1 h−1)10891.25428.26308.90 74.39 0.84 −0.549−0.310.12Normal
EC (mScm−1)1081.2412.966.80 3.03 0.01 −0.078−0.980.04Lognormal
SWC (%)10814.2030.7523.69 4.21 0.13 −0.214−0.920.03Lognormal
AB (g m−2)10838.15462.93182.90 112.65 0.35 0.923−0.230.00Lognormal
Sand (%)1081.7267.2631.21 11.79 0.02 −0.1370.220.20Normal
Silt (%)10829.4481.3561.73 9.58 0.27 −0.2800.280.20Normal
Clay (%)1083.3018.297.06 2.77 0.03 1.8153.840.00Lognormal
SBD (g cm−3)1081.031.621.42 0.11 0.08 −0.5180.290.07Normal
SOC (g Kg−1)1083.0313.517.78 2.88 0.03 0.197−0.850.20Normal
TN (g Kg−1)1080.331.920.95 0.37 0.00 0.546−0.180.20Normal
SOC/TN1083.0119.048.55 2.50 0.03 1.2433.380.00Lognormal
NO3-N (mg Kg−1)1085.2427.5616.47 5.92 0.05 0.158−0.840.07Normal
NH4+-N (mg Kg−1)1082.0512.737.18 2.79 0.02 0.079−0.840.20Normal
SD: standard deviation; CV: coefficient of variation; K-S: Kolmogorov–Smirnov test. NR: soil nitrification rates, DR: soil denitrification rates, EC: soil electrical conductivity; SWC: soil water content; AB: aboveground biomass; SBD: soil bulk density; SOC: soil organic carbon; TN: total nitrogen; NO3-N: nitrate-nitrogen; NH4+-N: ammonium-nitrogen.

