Climatic Influences on Agricultural Drought Risks Using Semiparametric Kernel Density Estimation


Abstract
1. Introduction
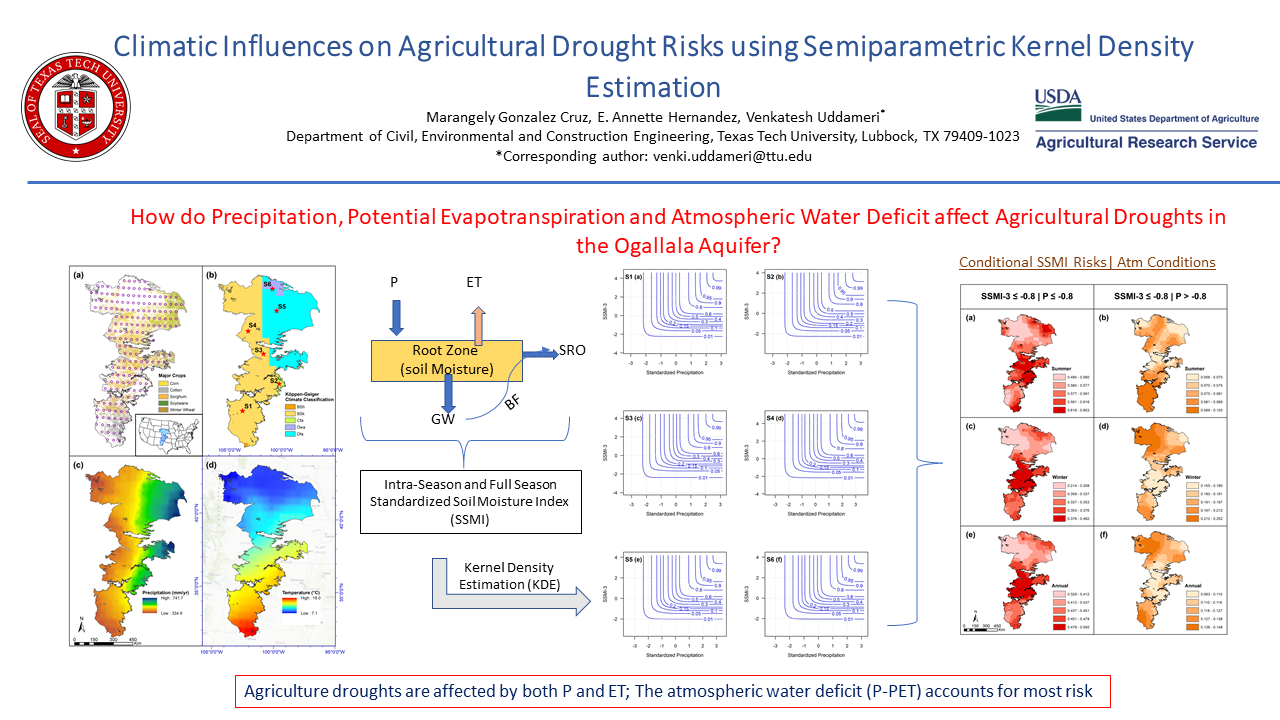
2. Methodology
2.1. Soil Moisture Modeling
2.1.1. Standardized Soil Moisture Index (SSMI)—An Agricultural Drought Indicator
2.1.2. Relationship Between the Agricultural Drought Indicator (SSMI) and Meteorological Fluxes
2.1.3. Estimation of Marginal and Joint Distribution Functions
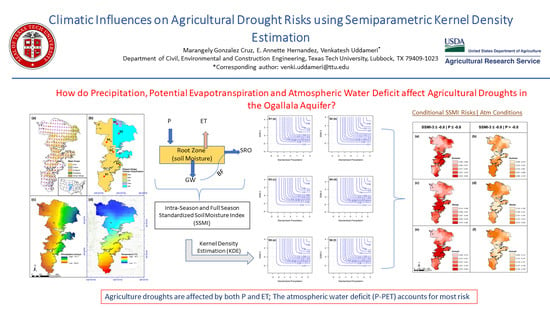
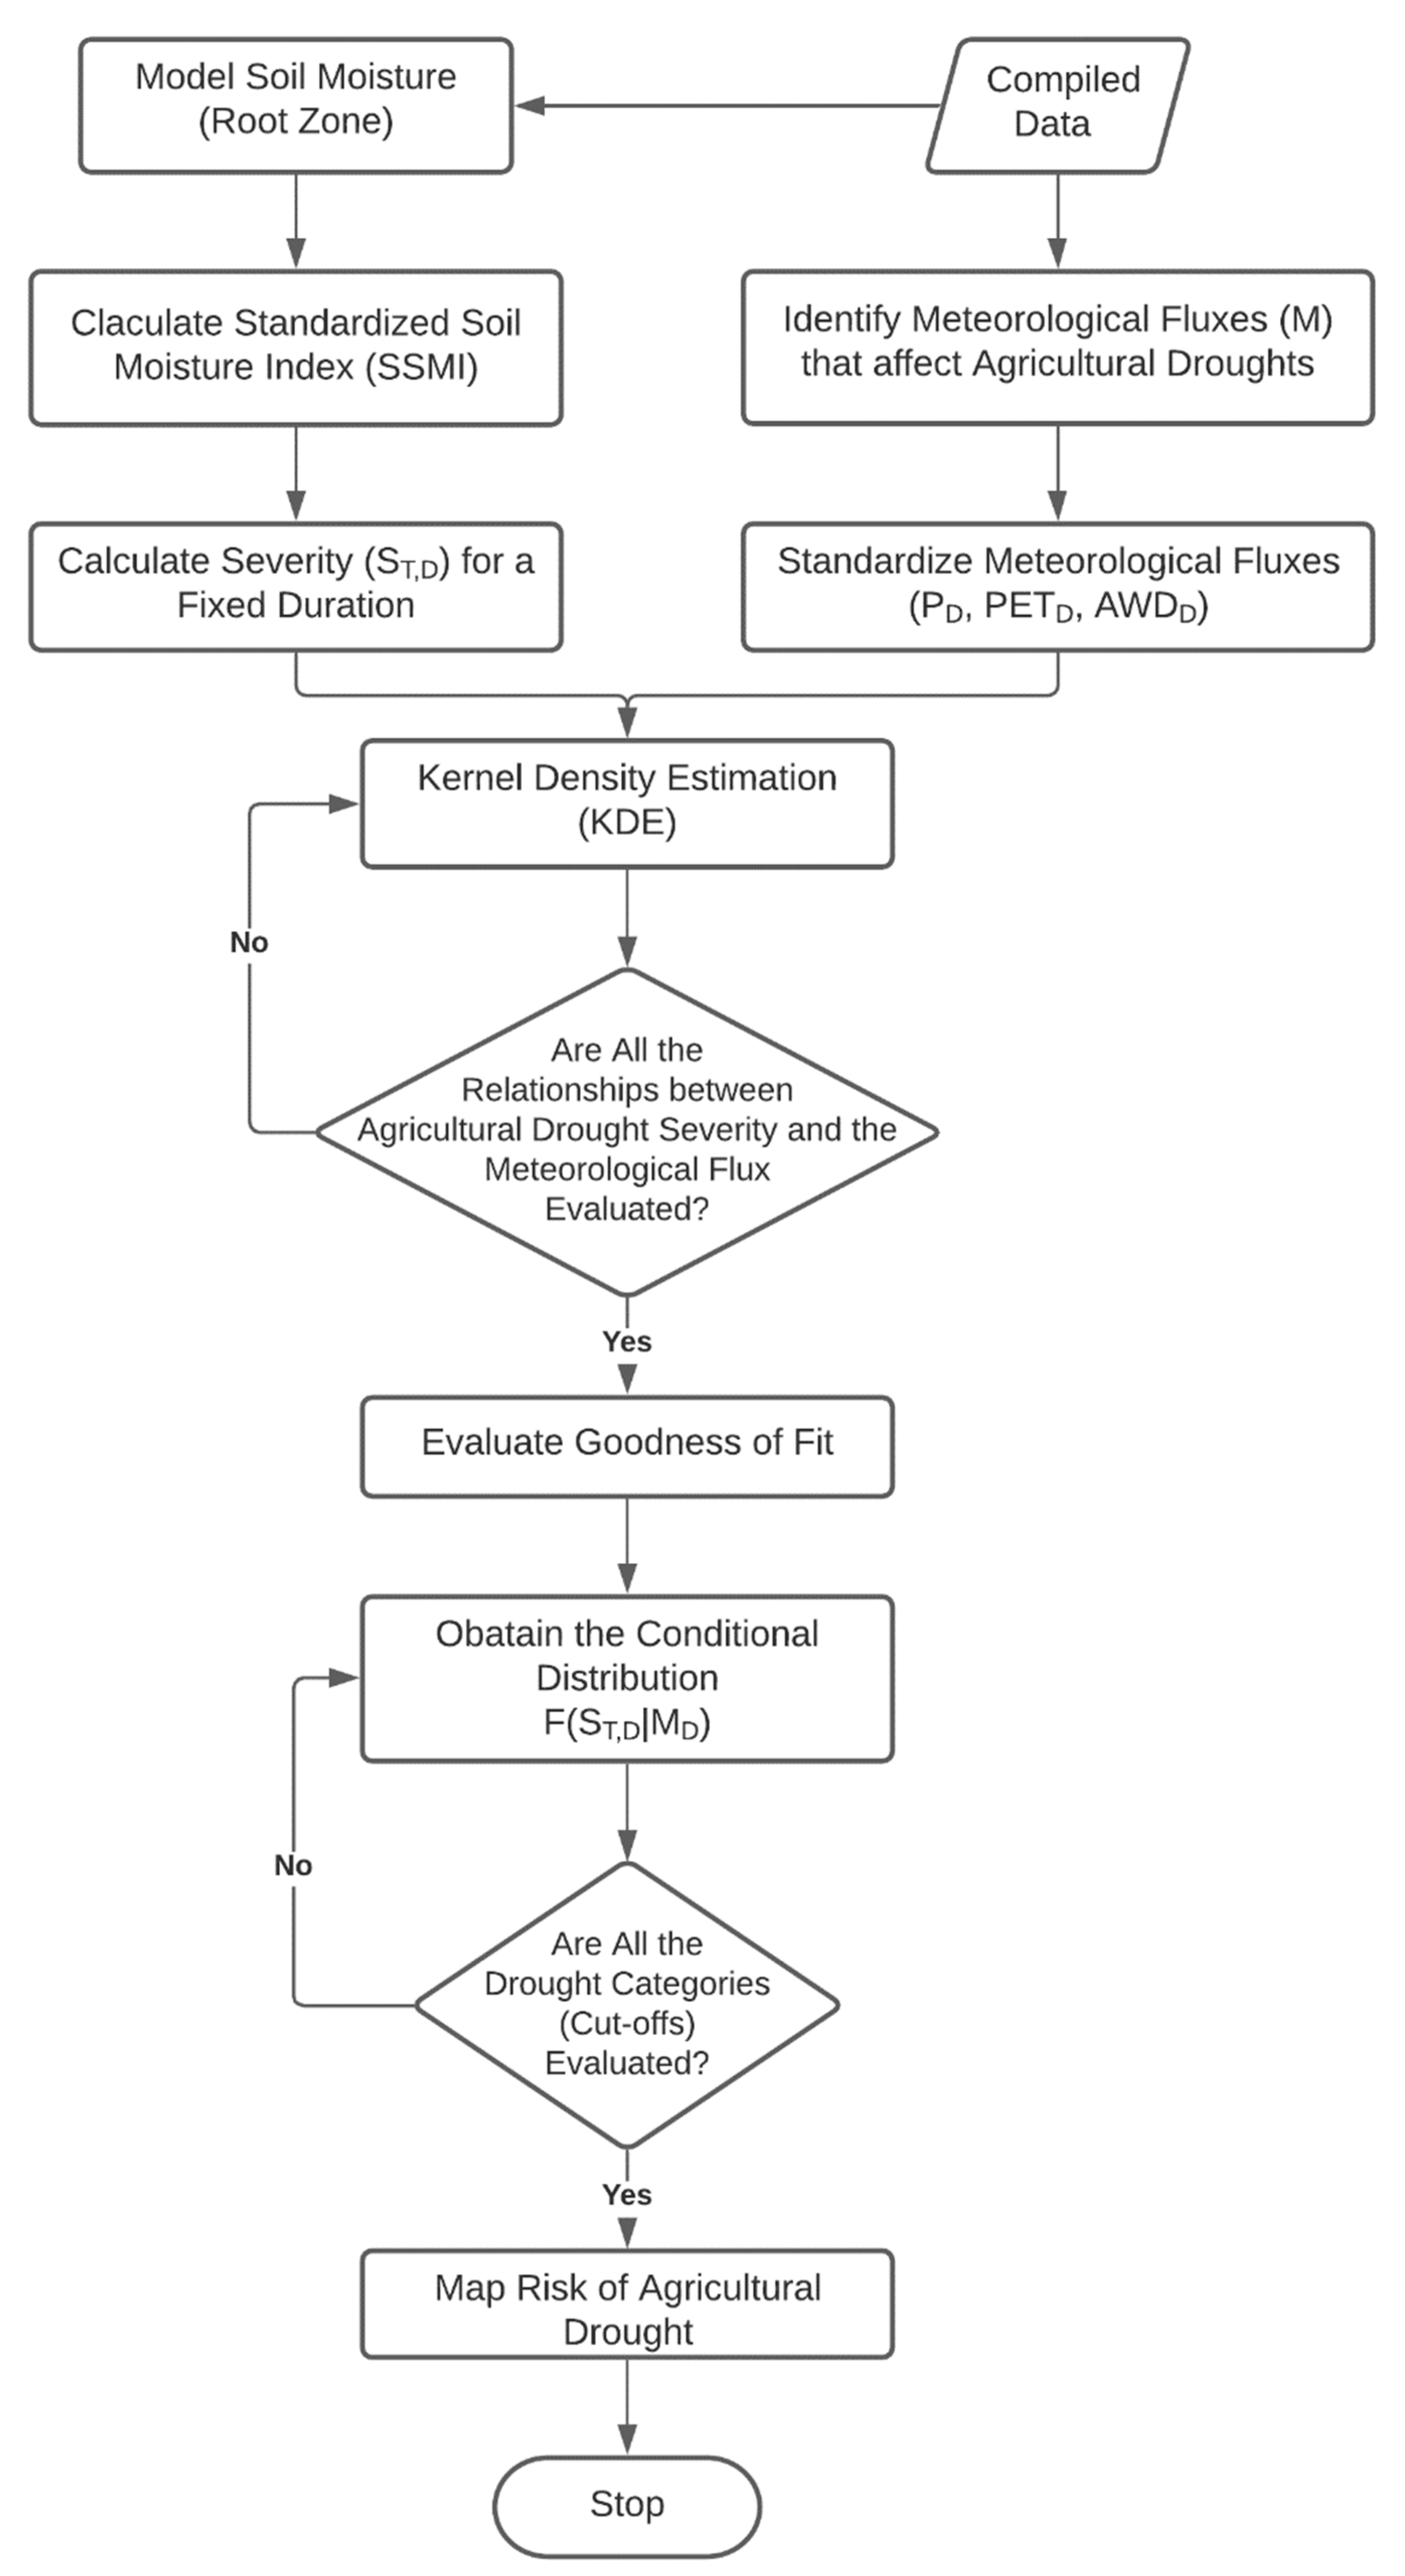
3. Illustrative Case Study
4. Results and Discussion
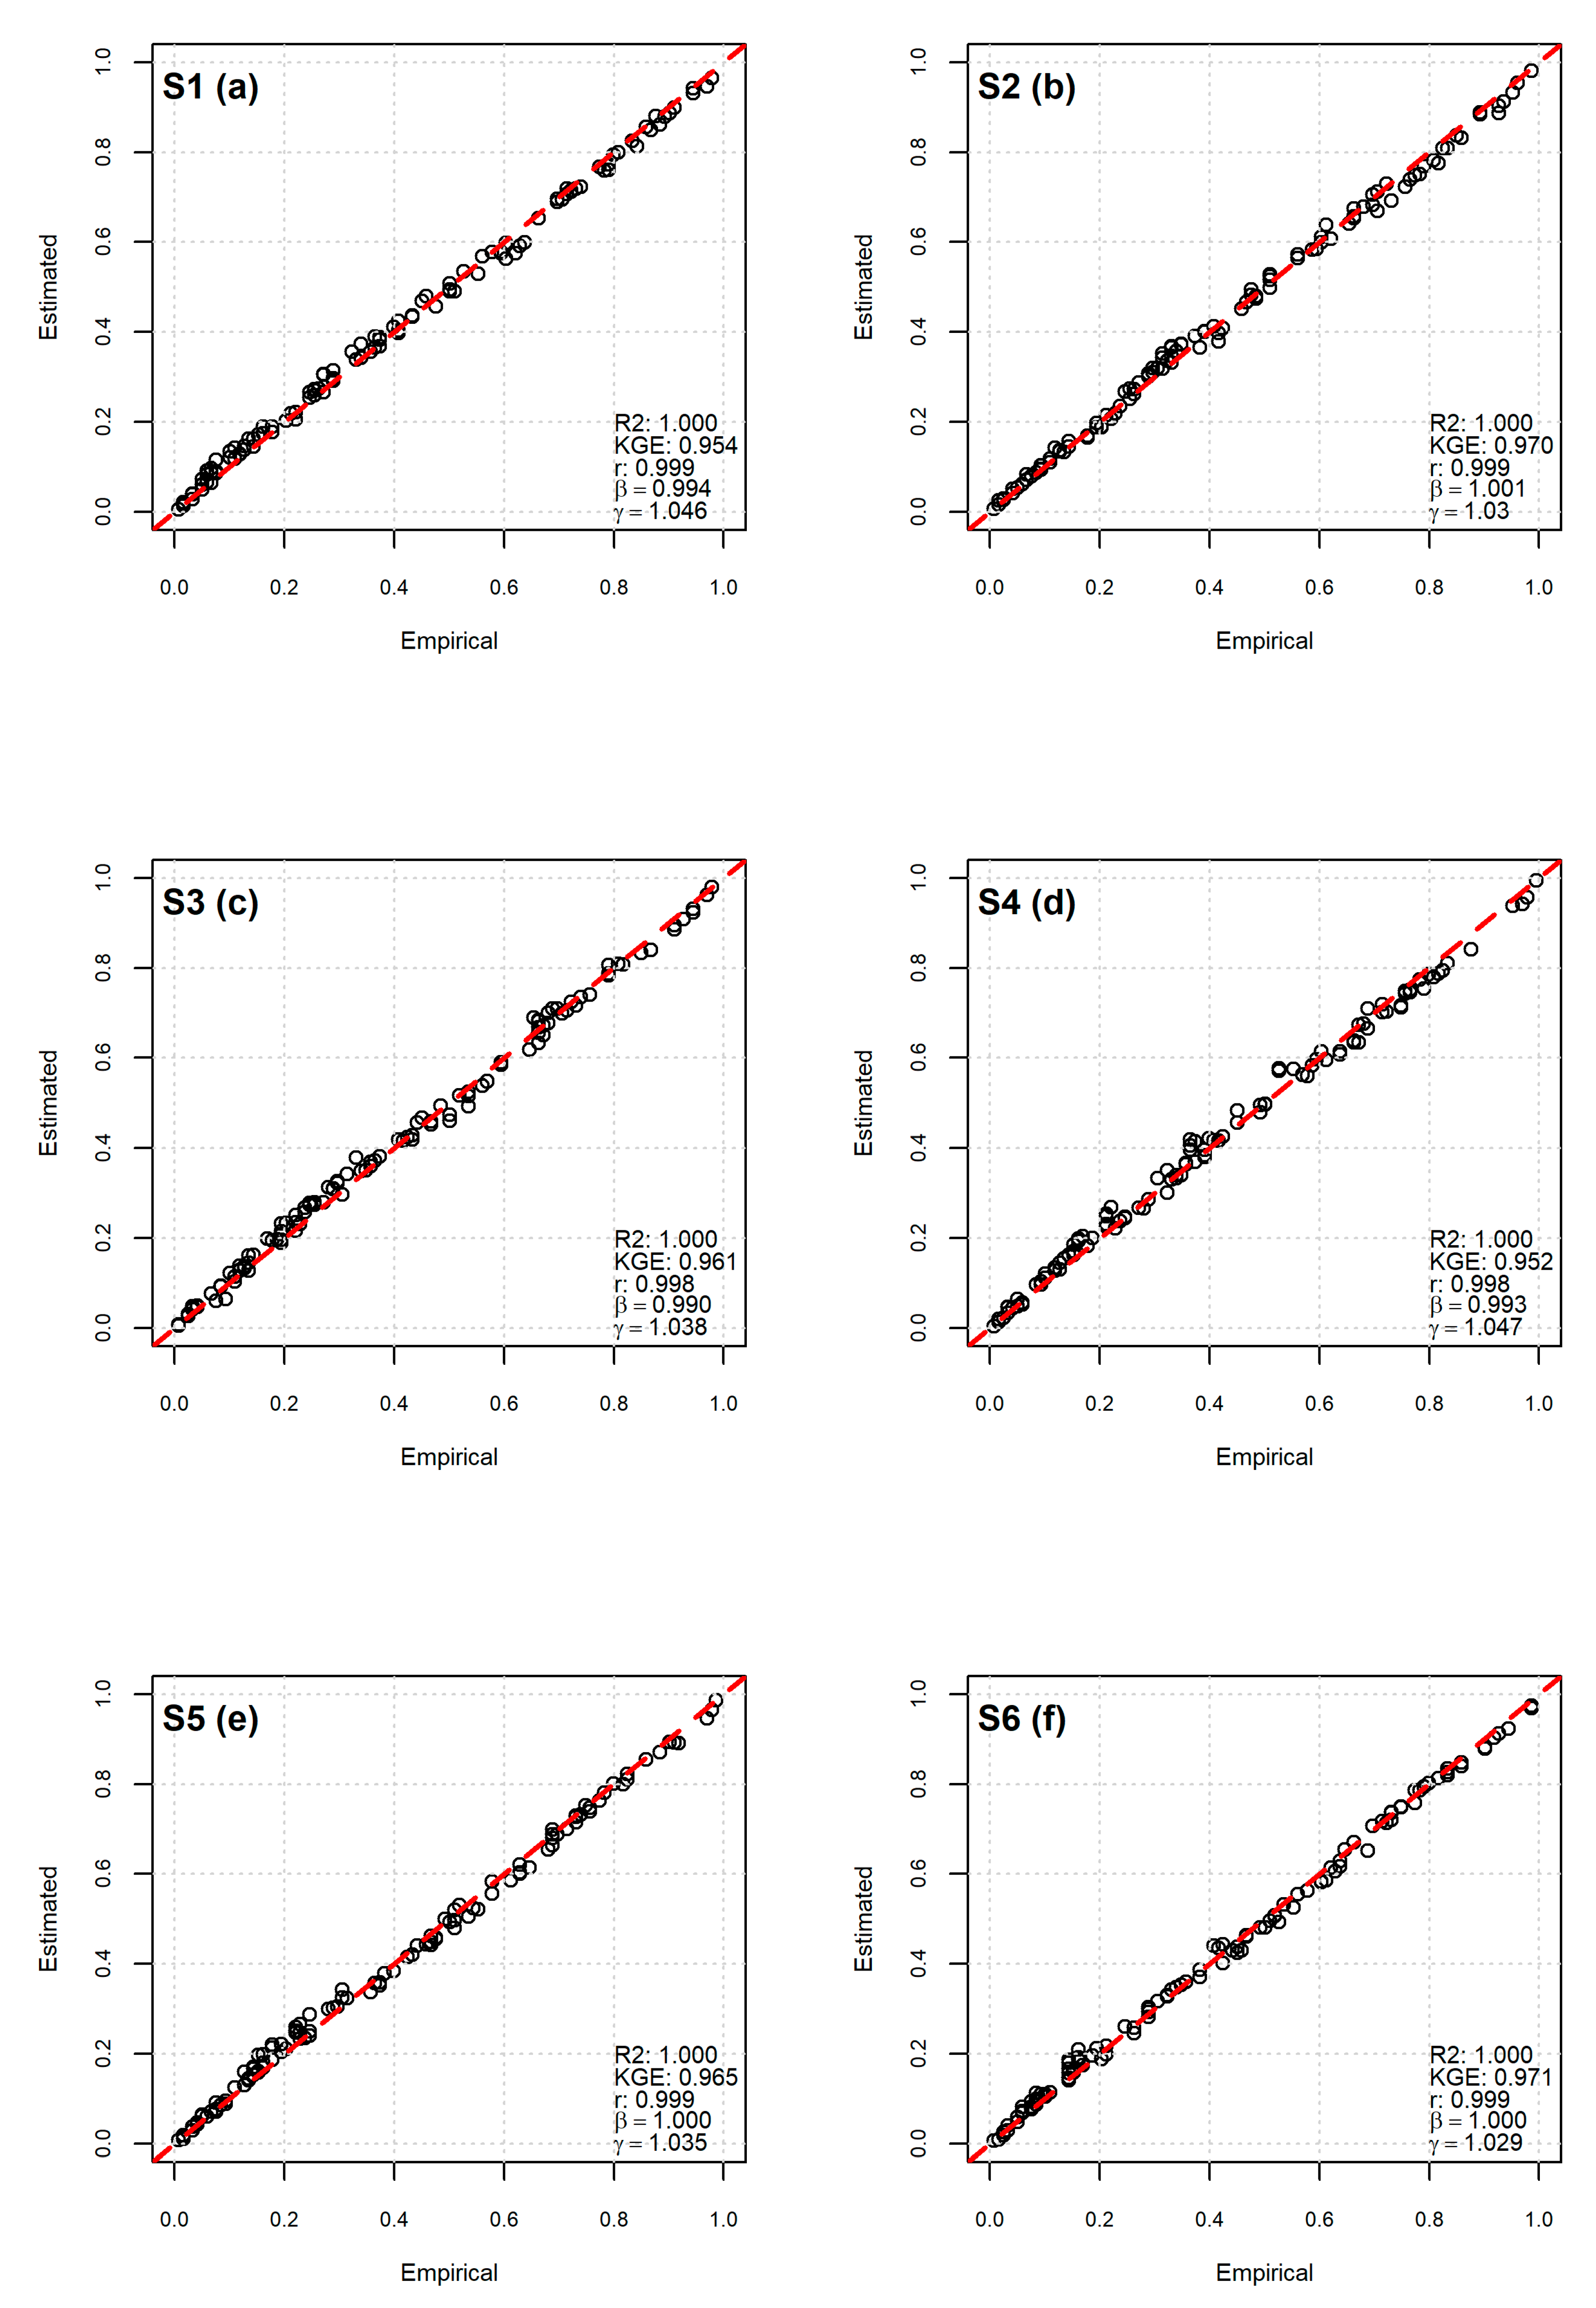
4.1. Evaluation of KDE for Fitting Joint and Marginal Distributions
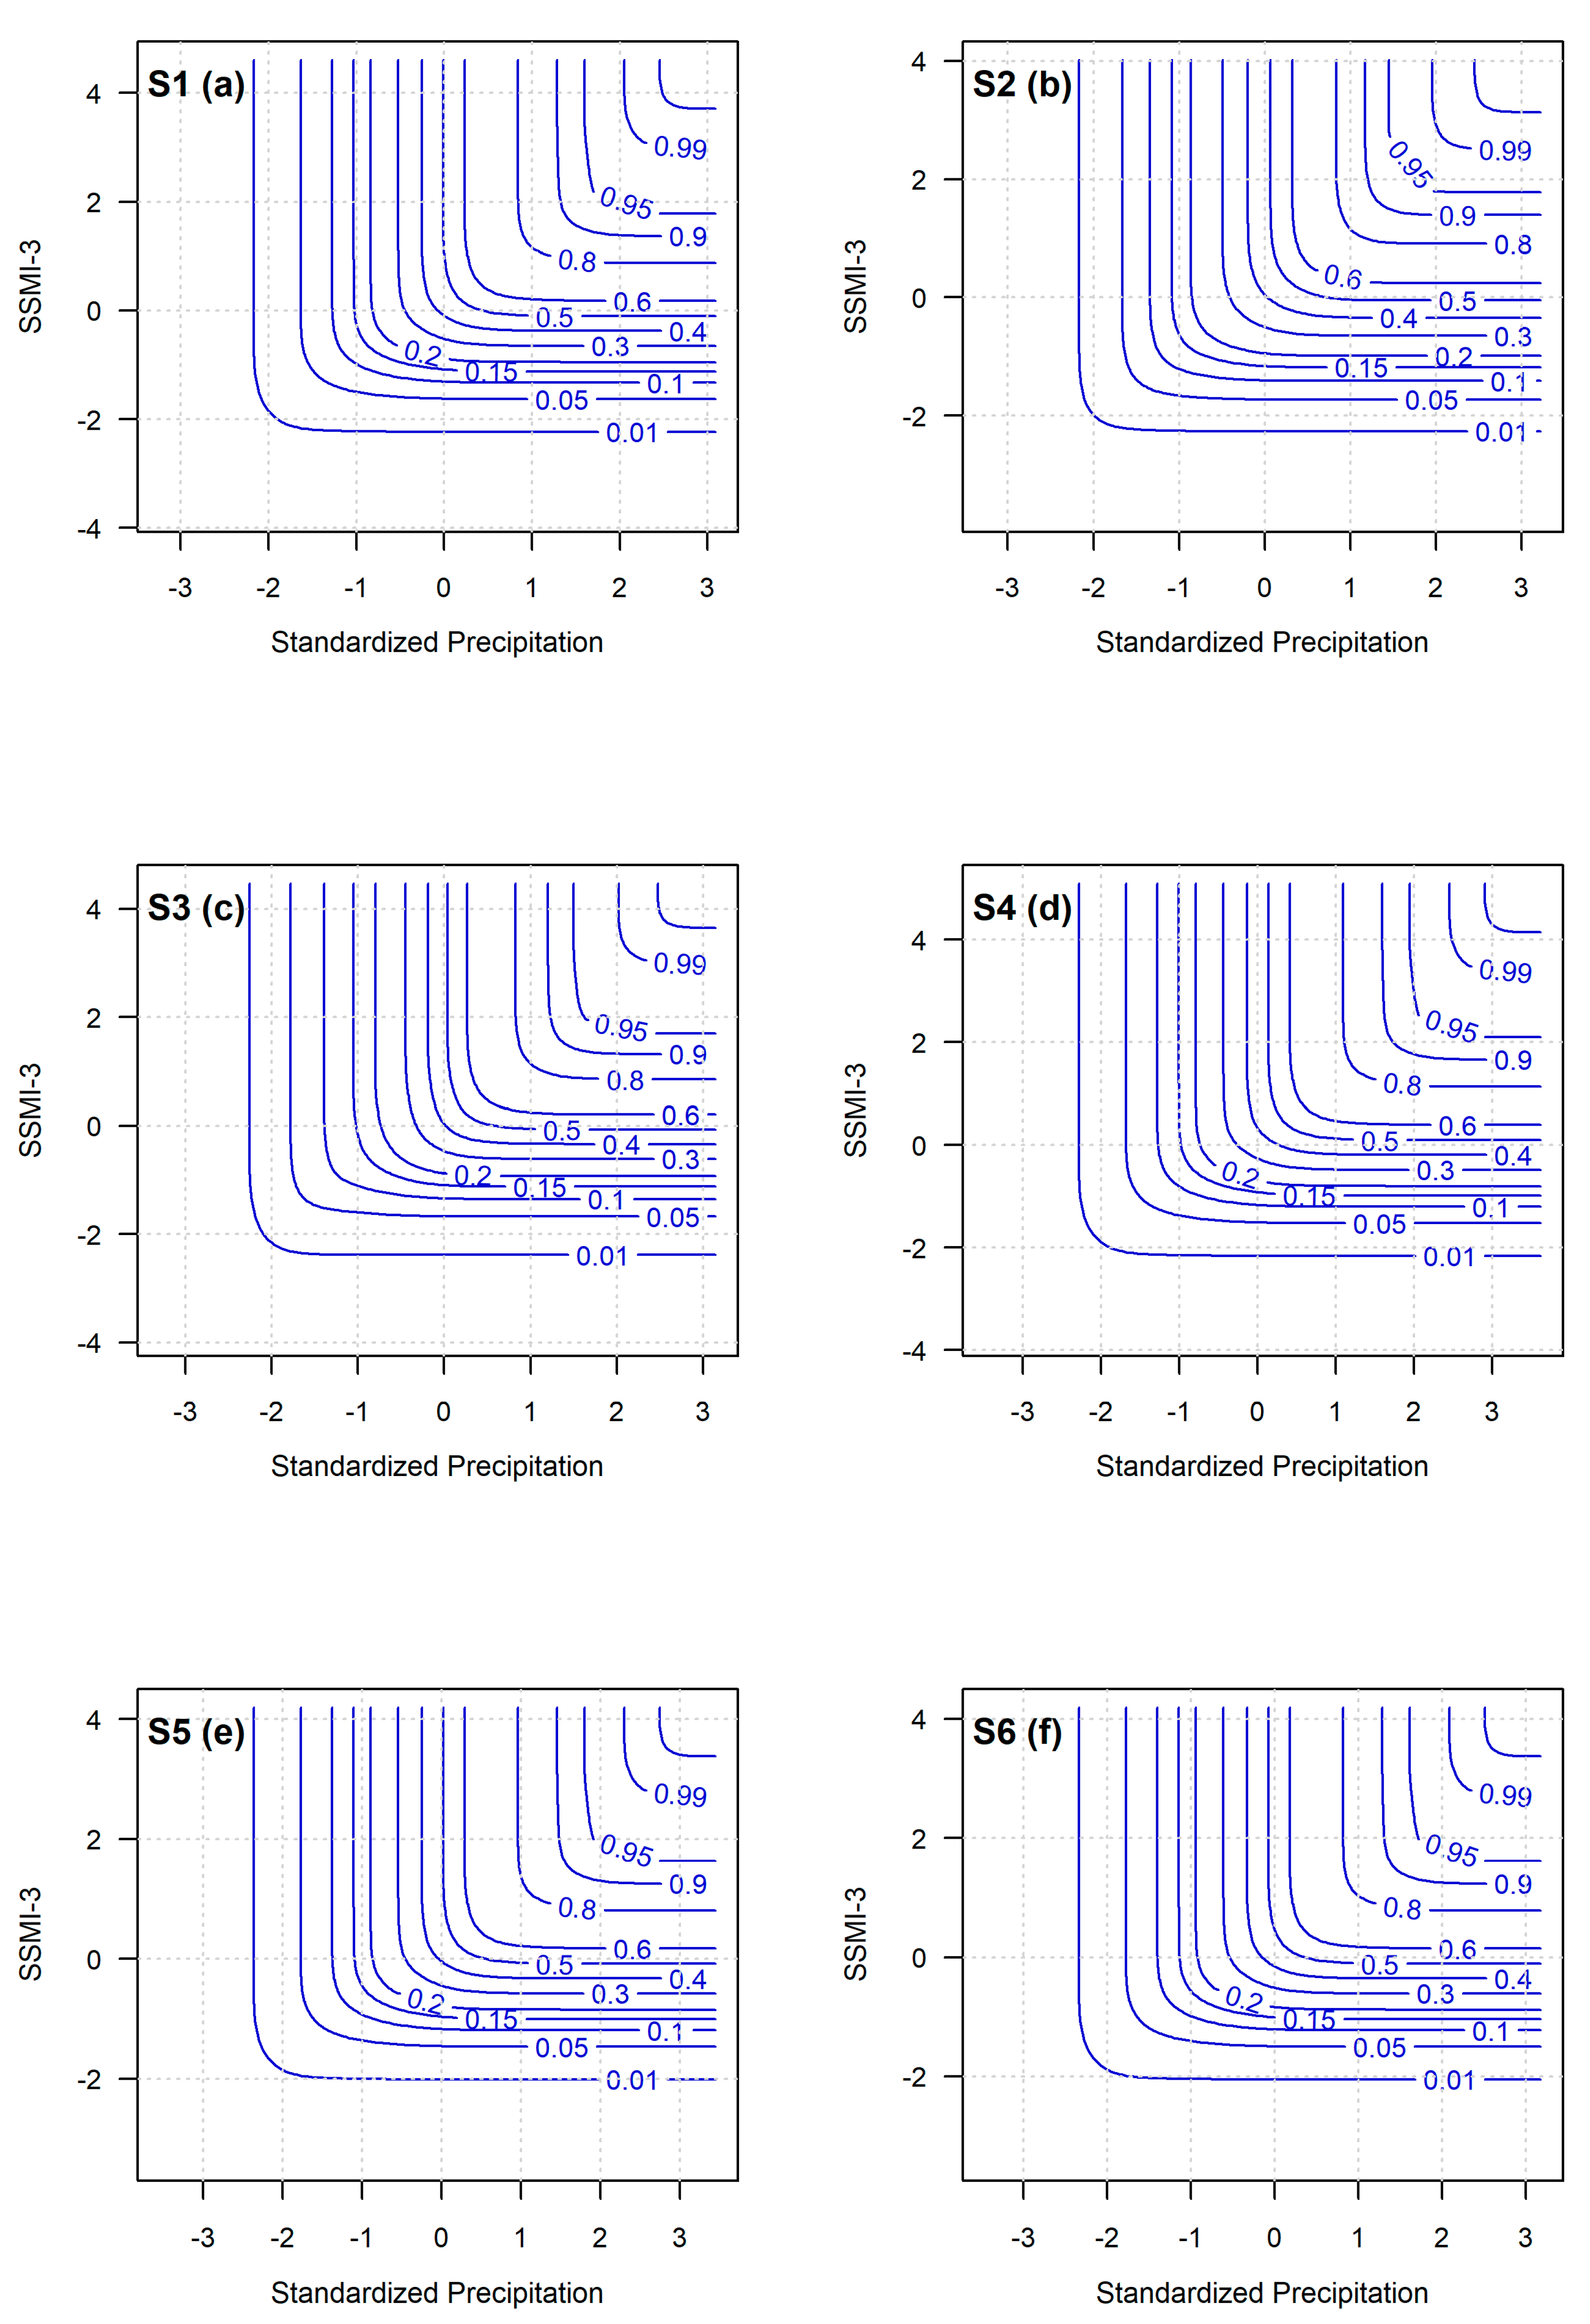
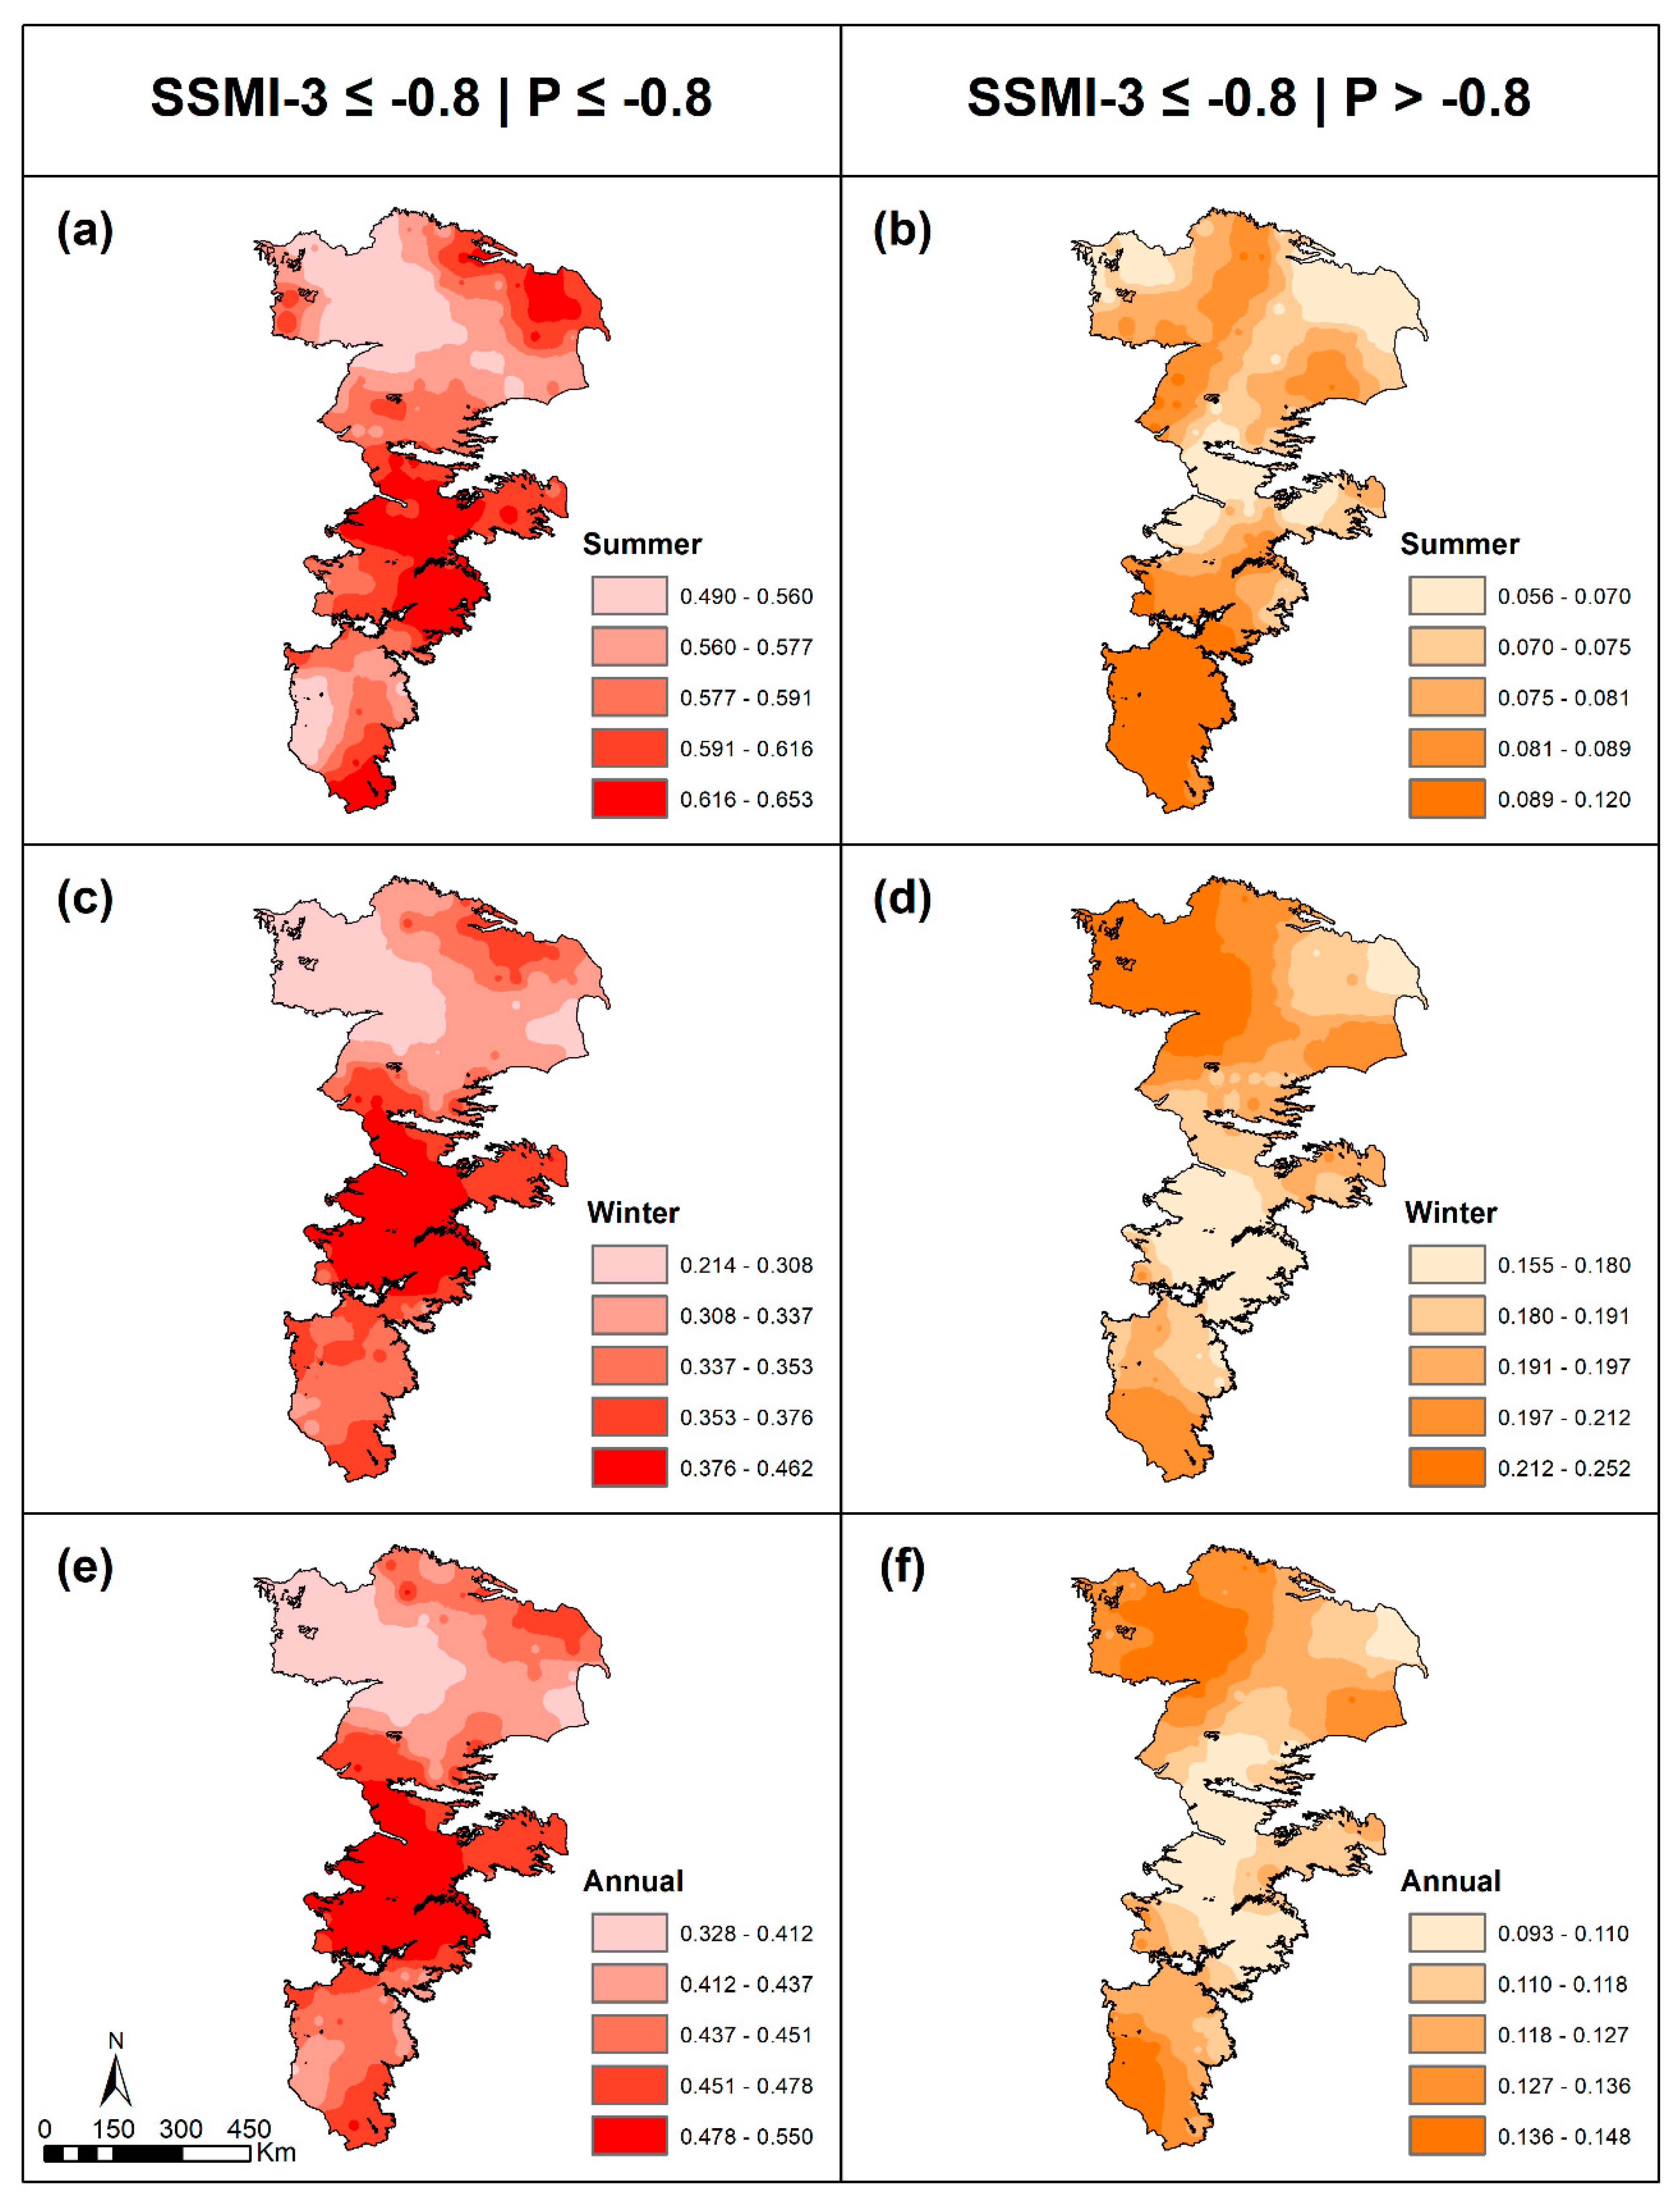
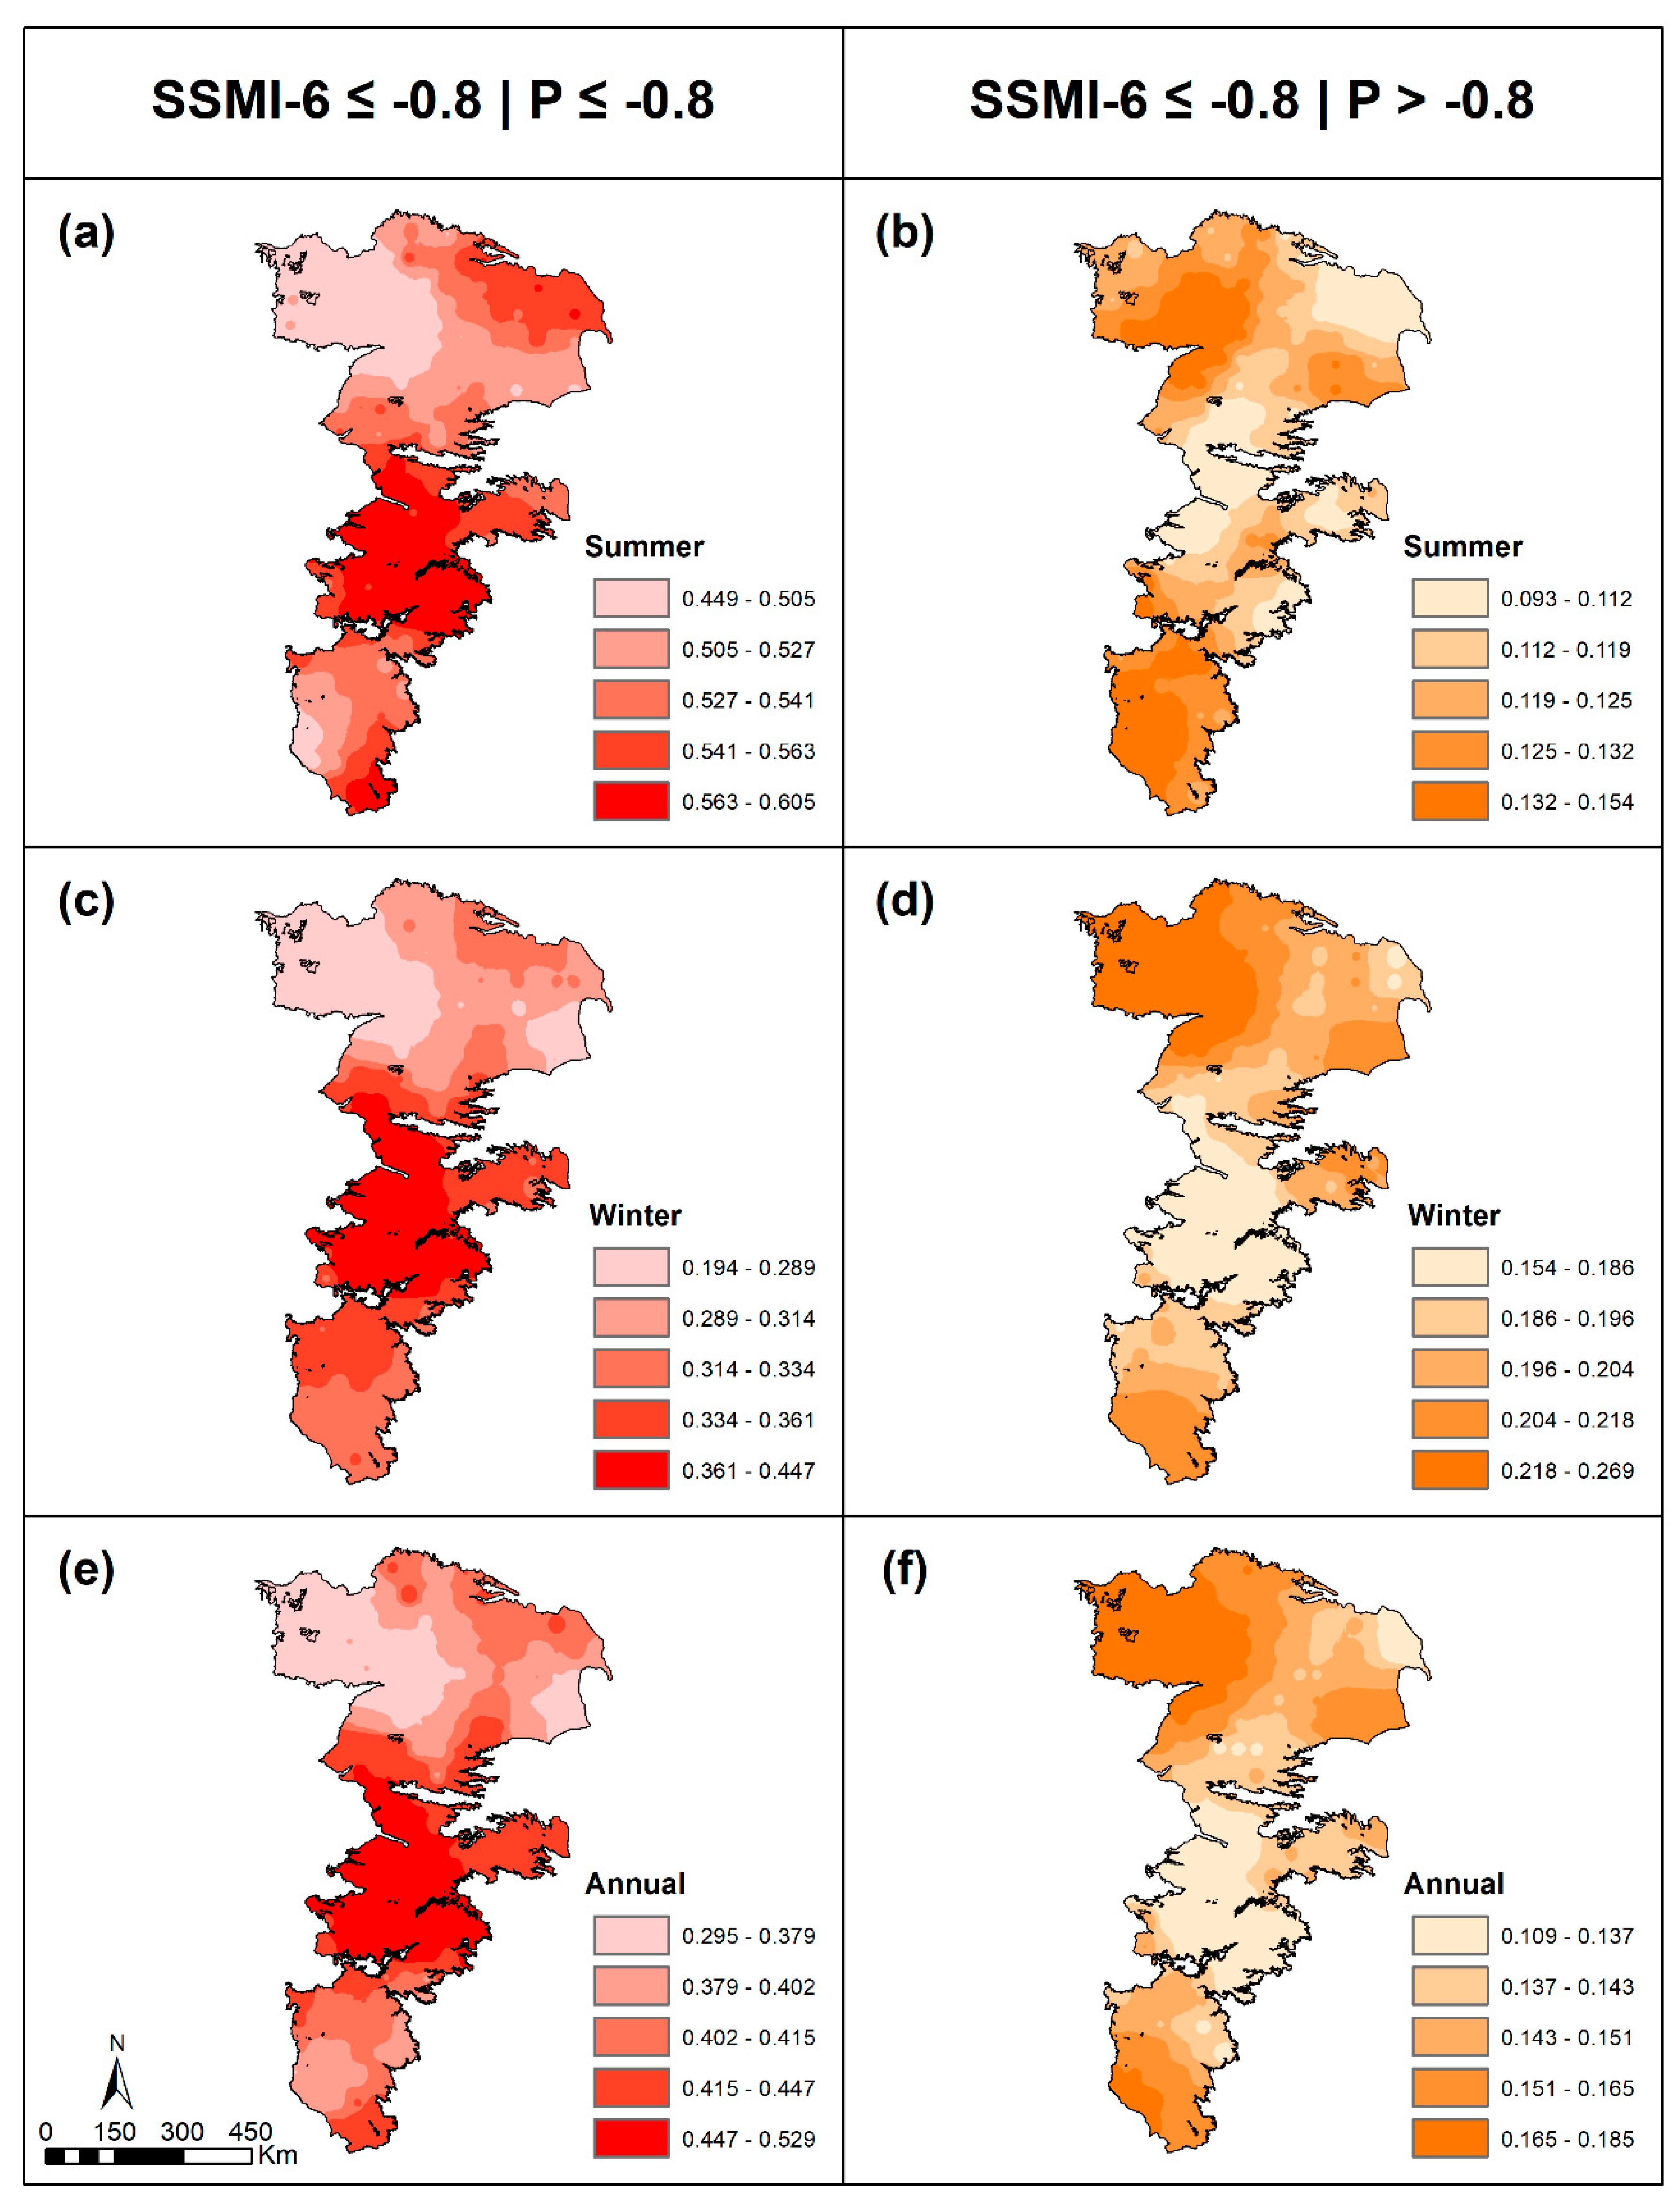
4.2. Variations of Agriculture Drought Risks with Precipitation
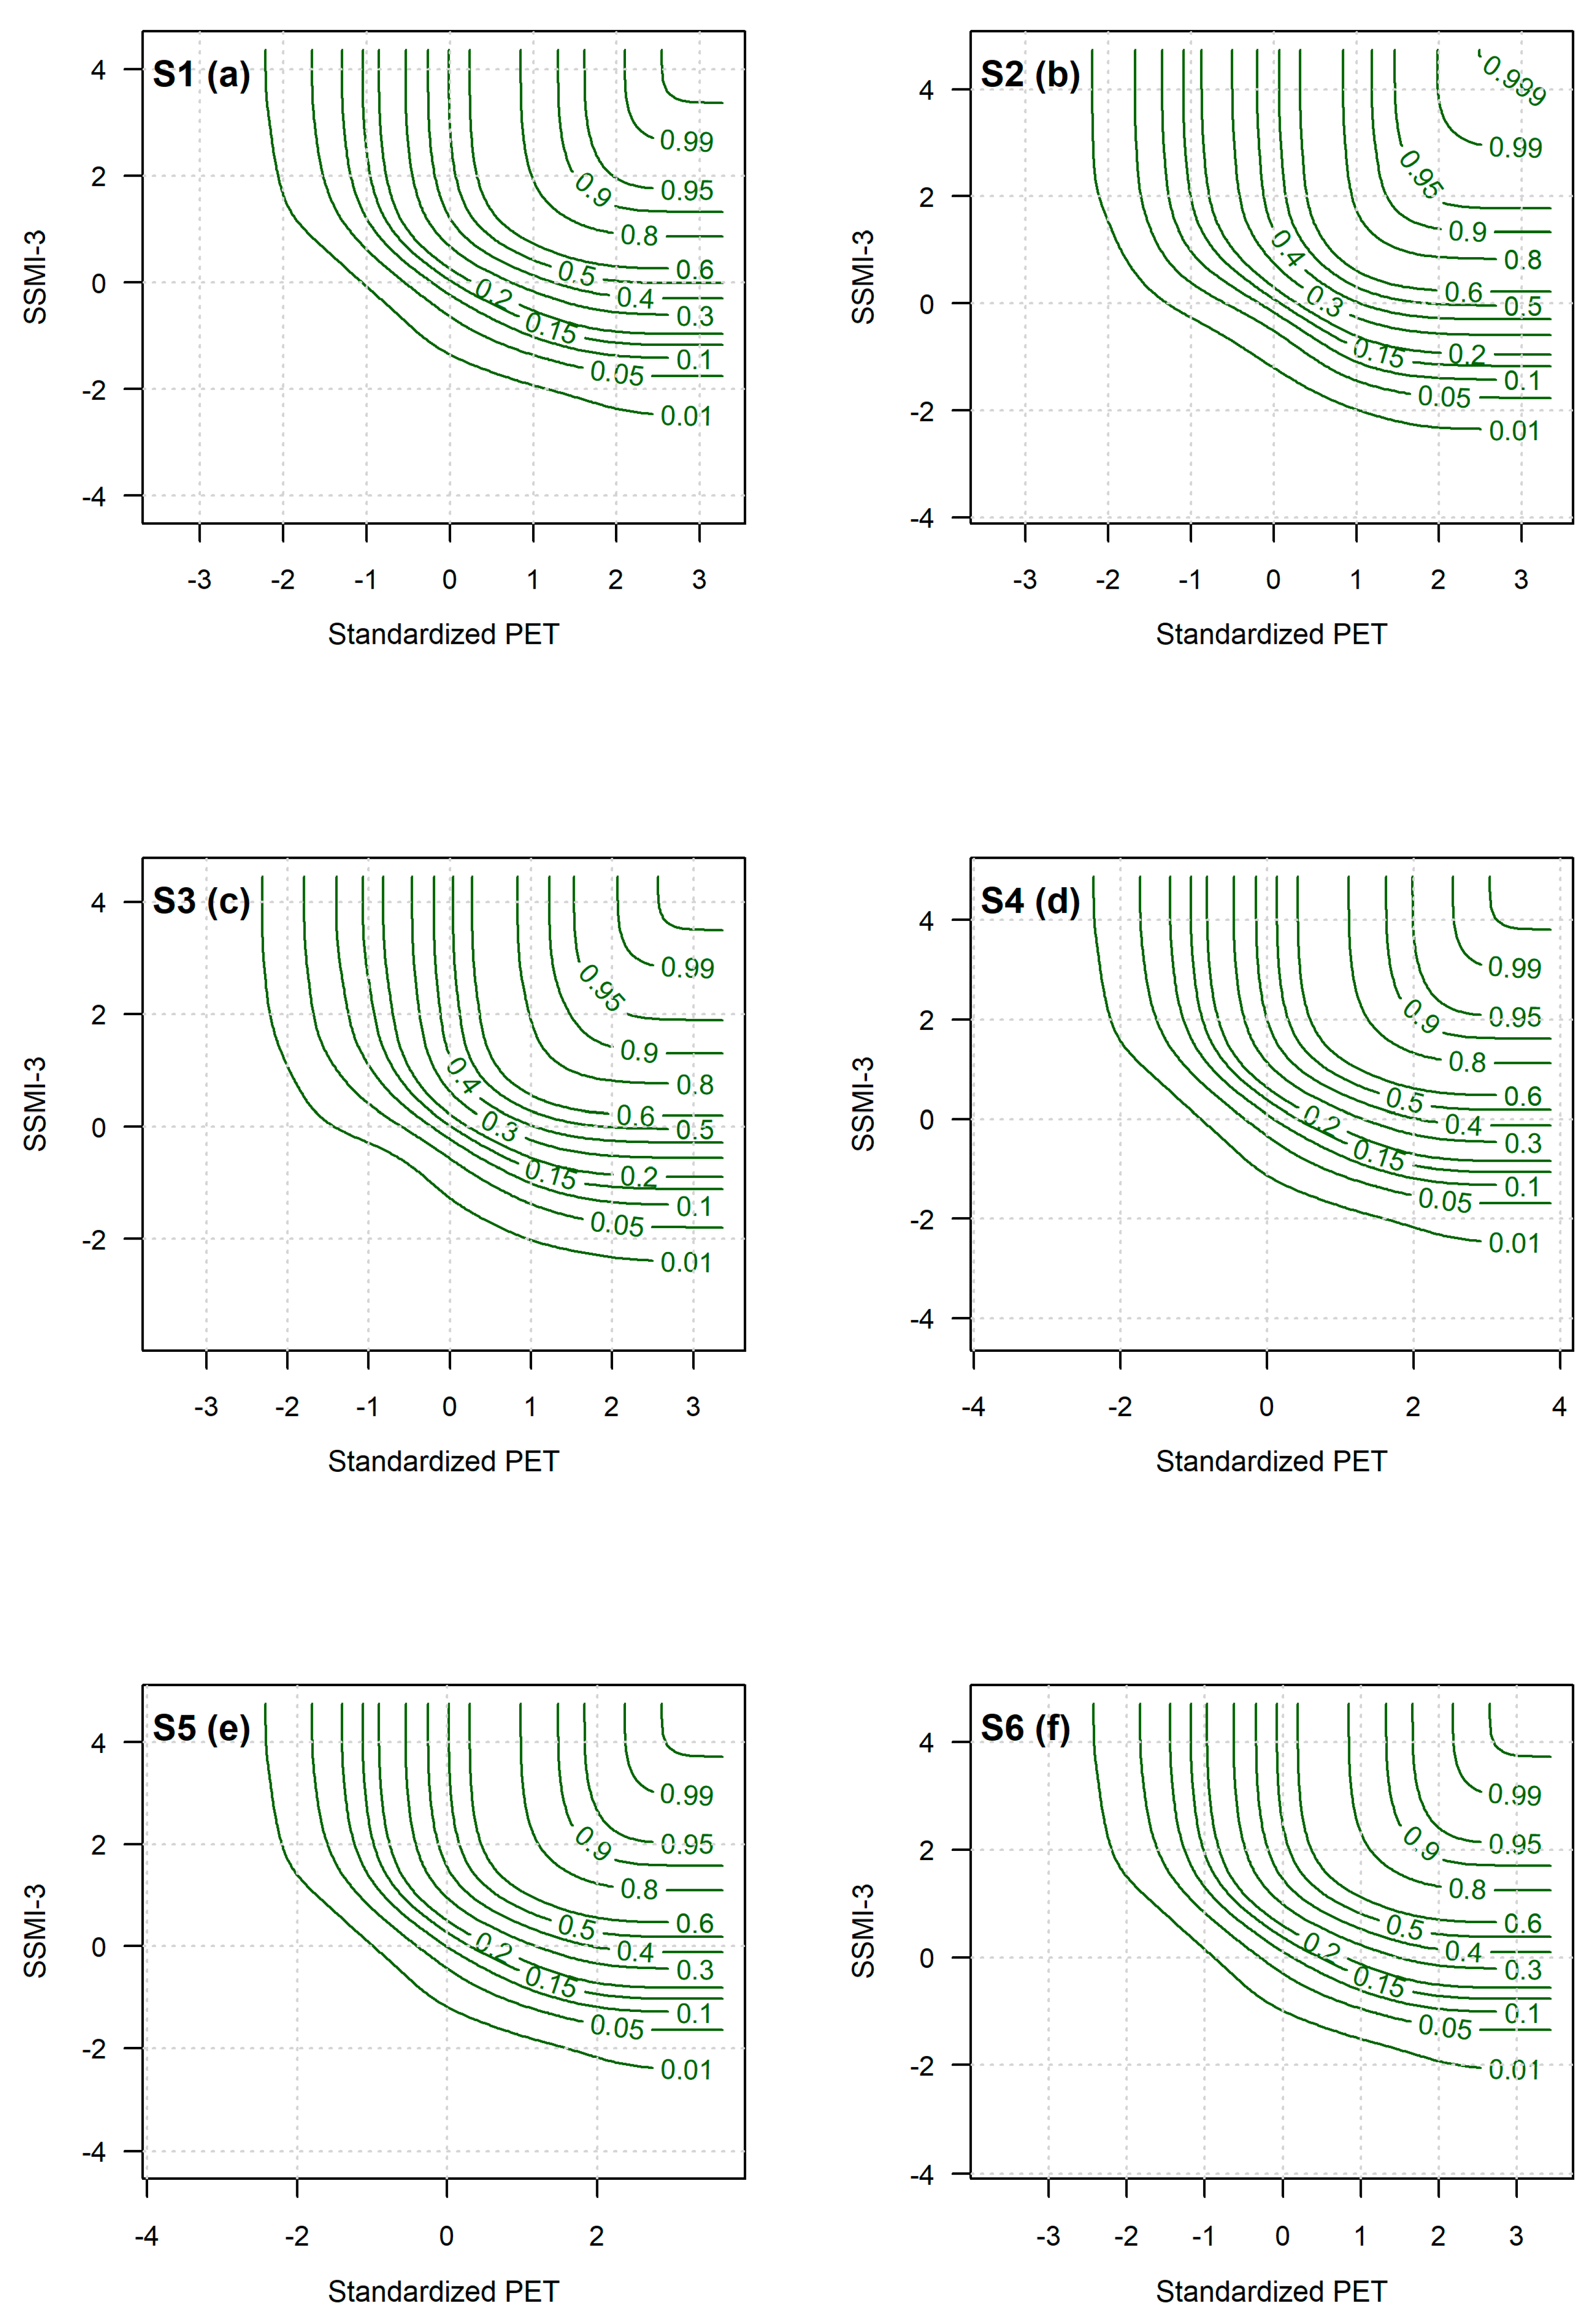
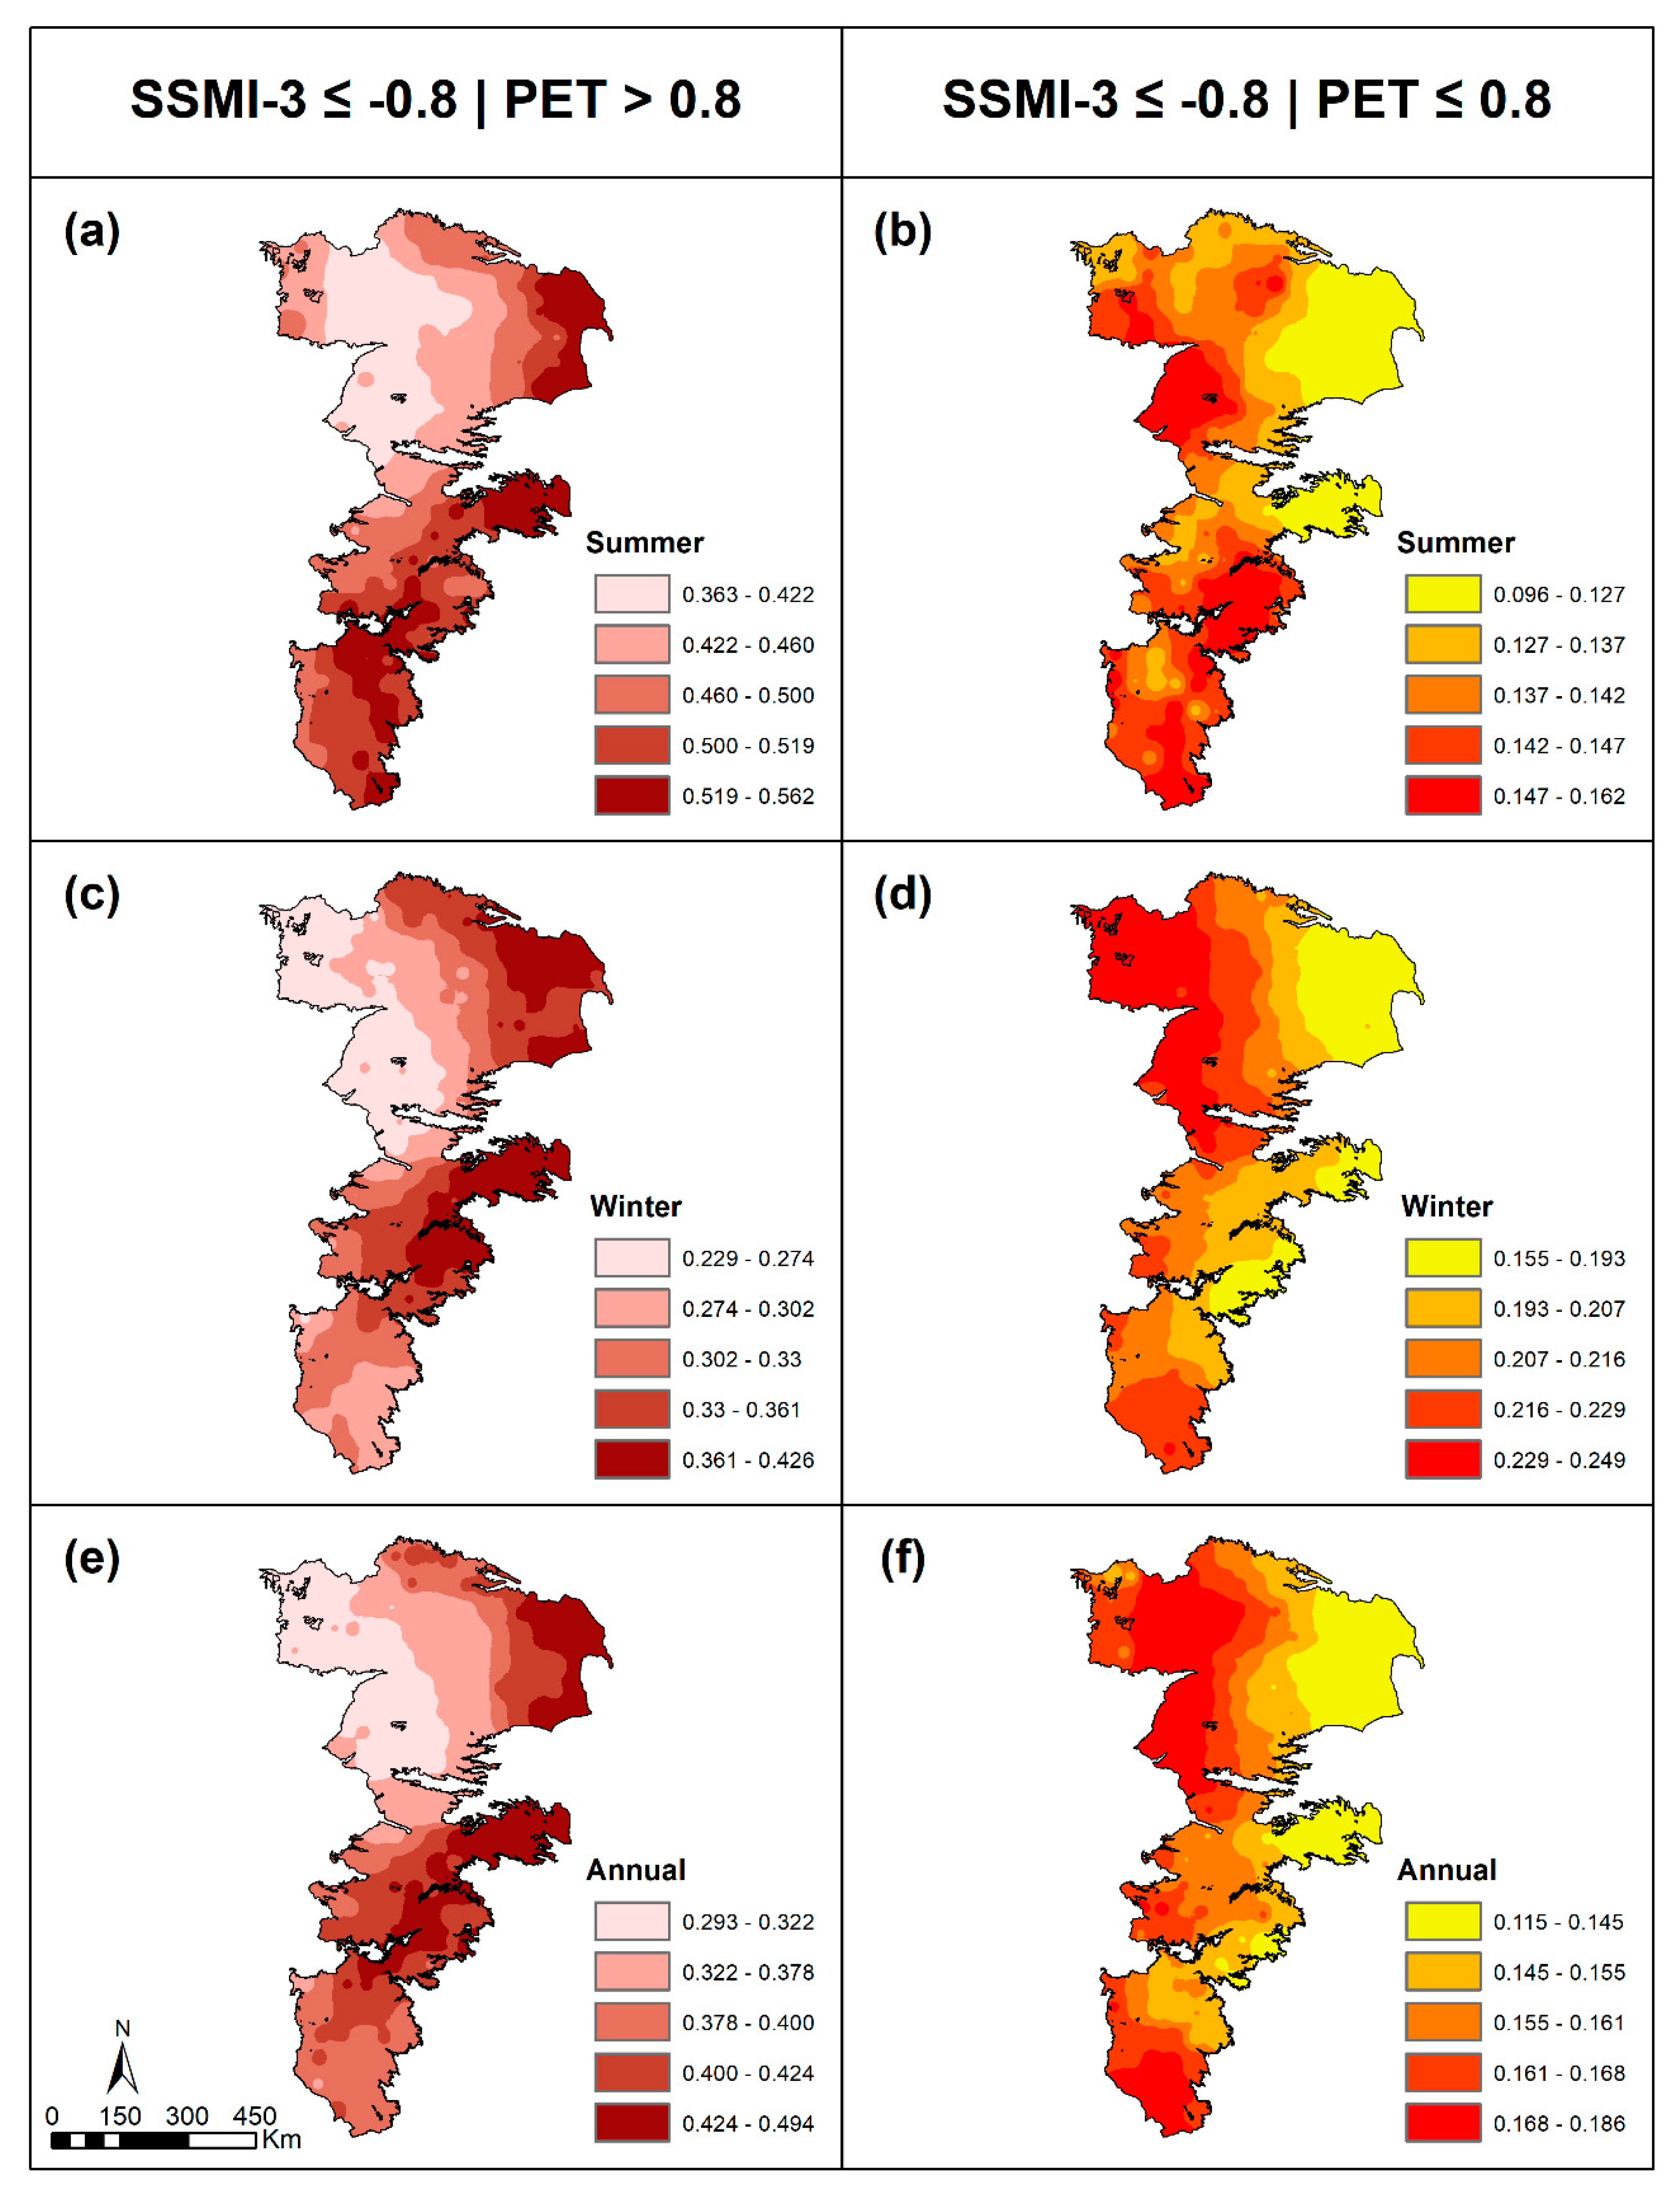
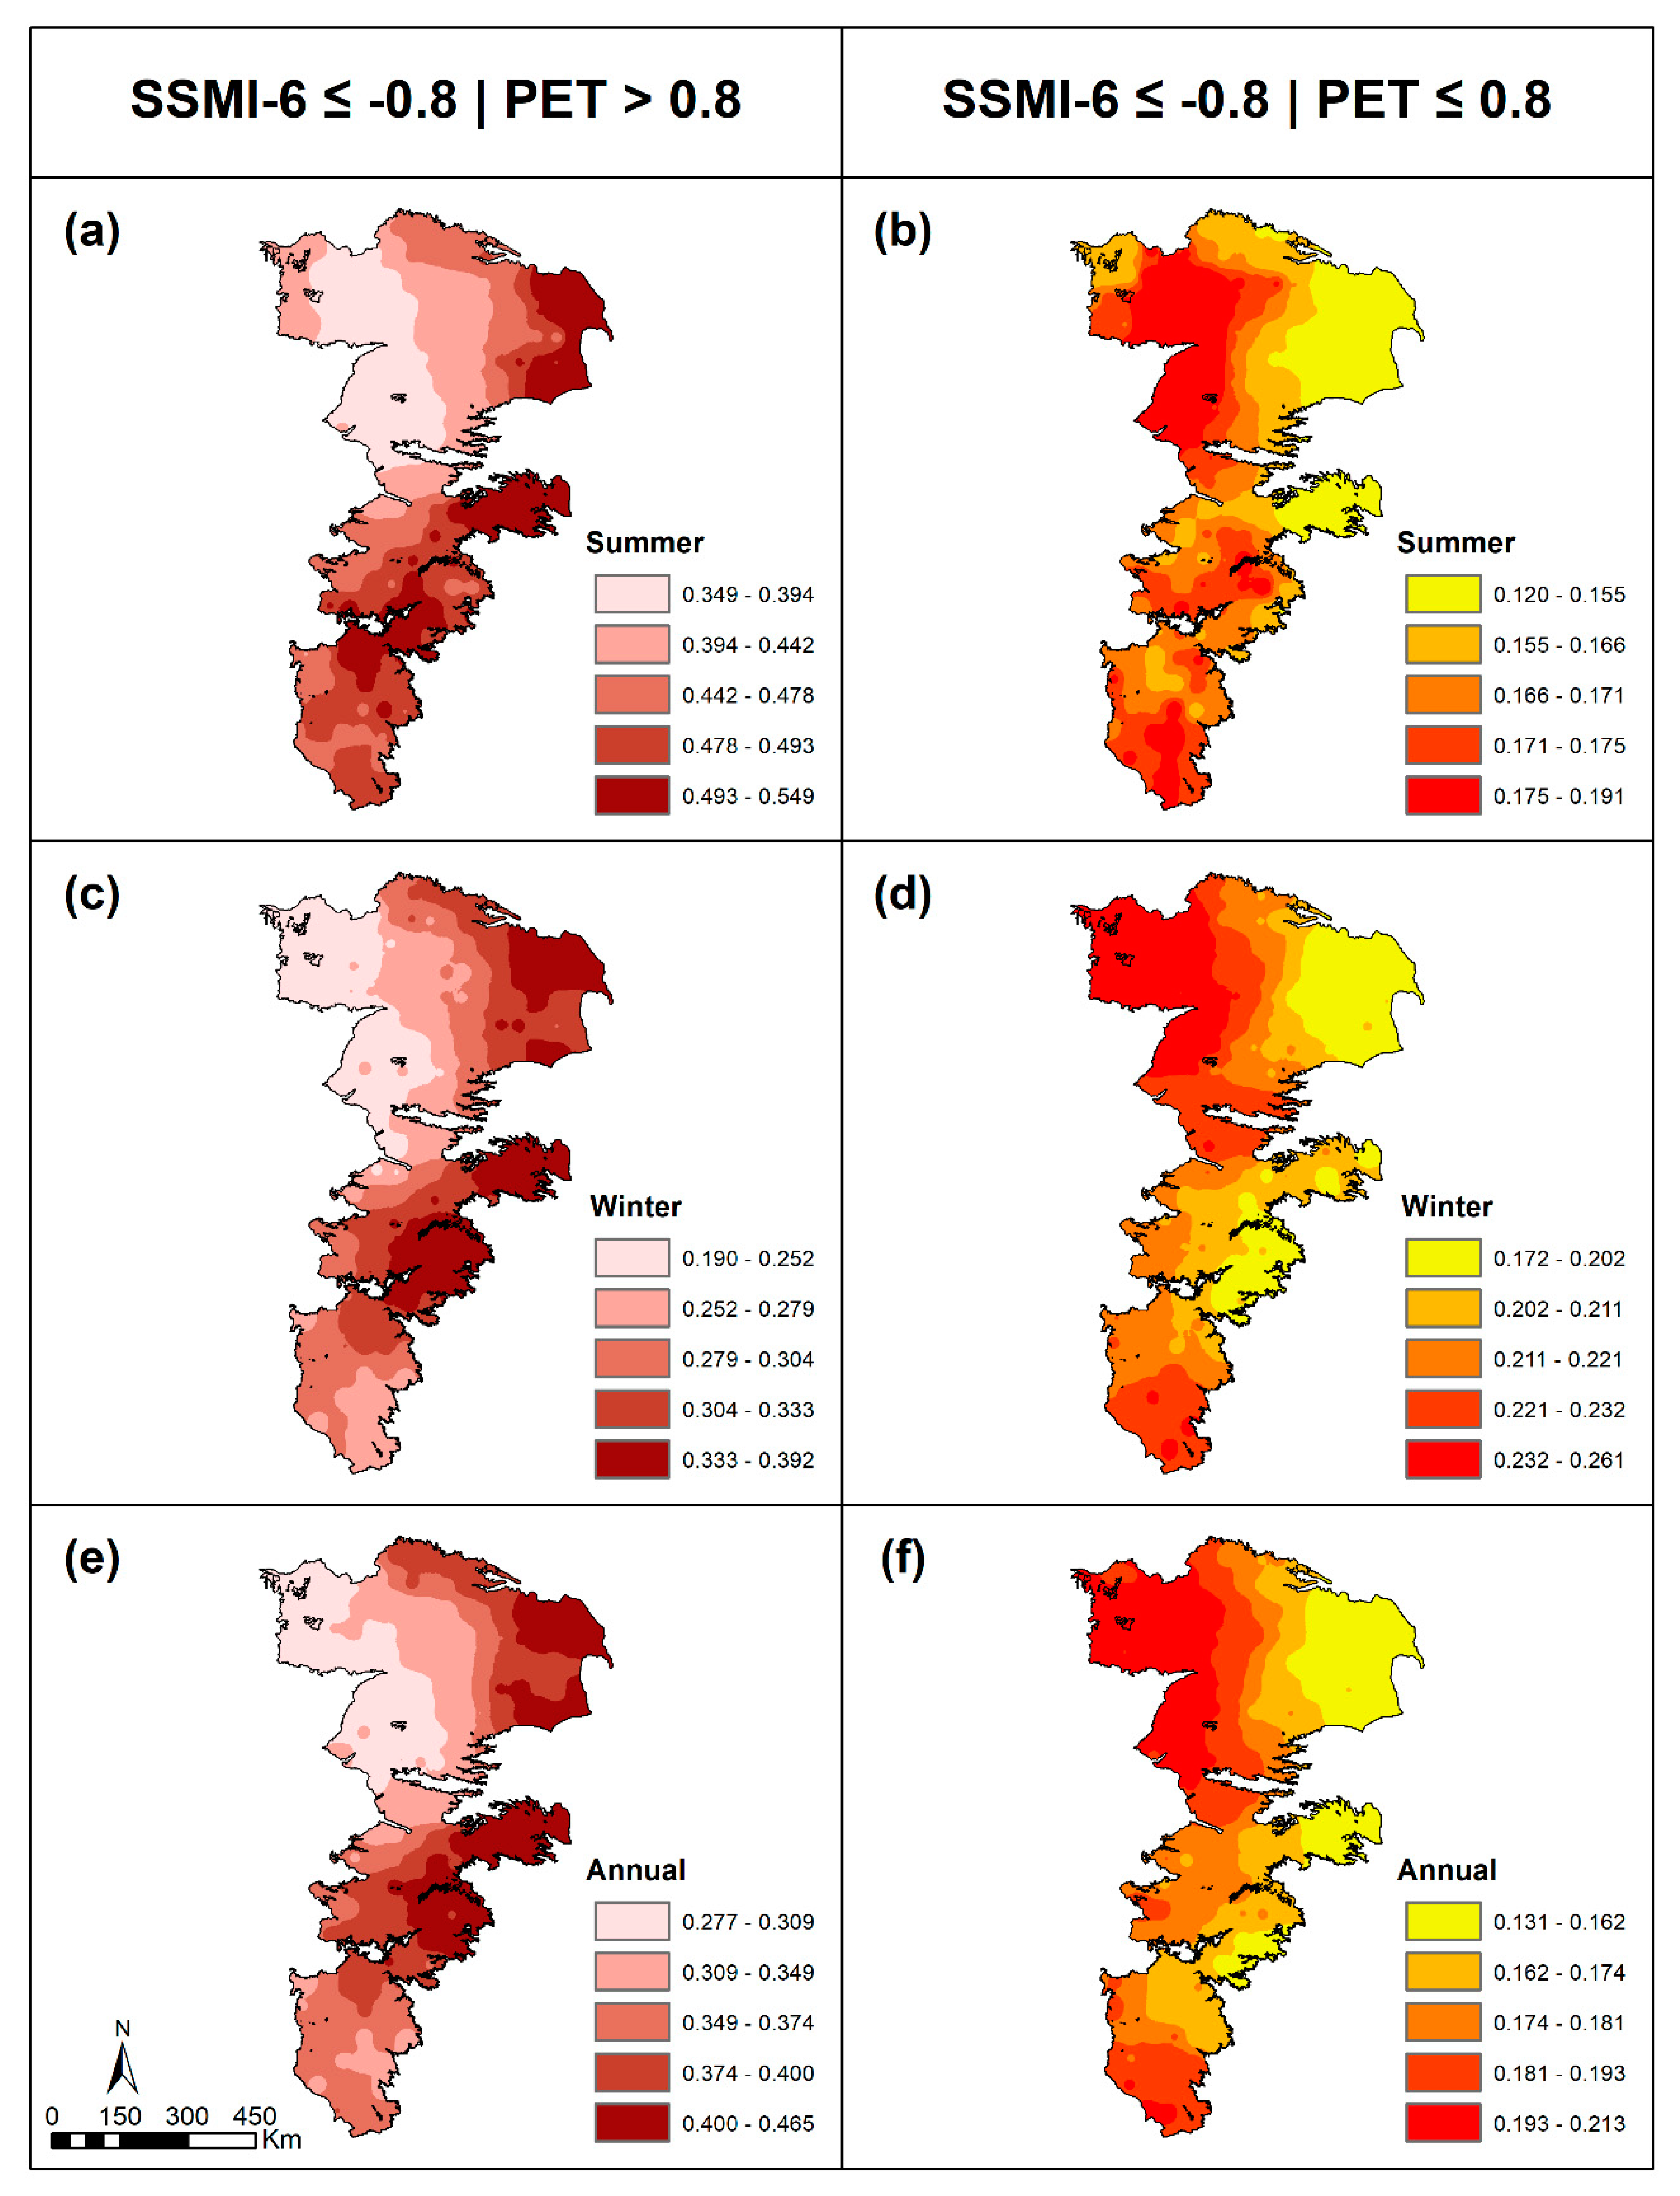
4.3. Variation of Agriculture Drought Risks with Potential Evapotranspiration
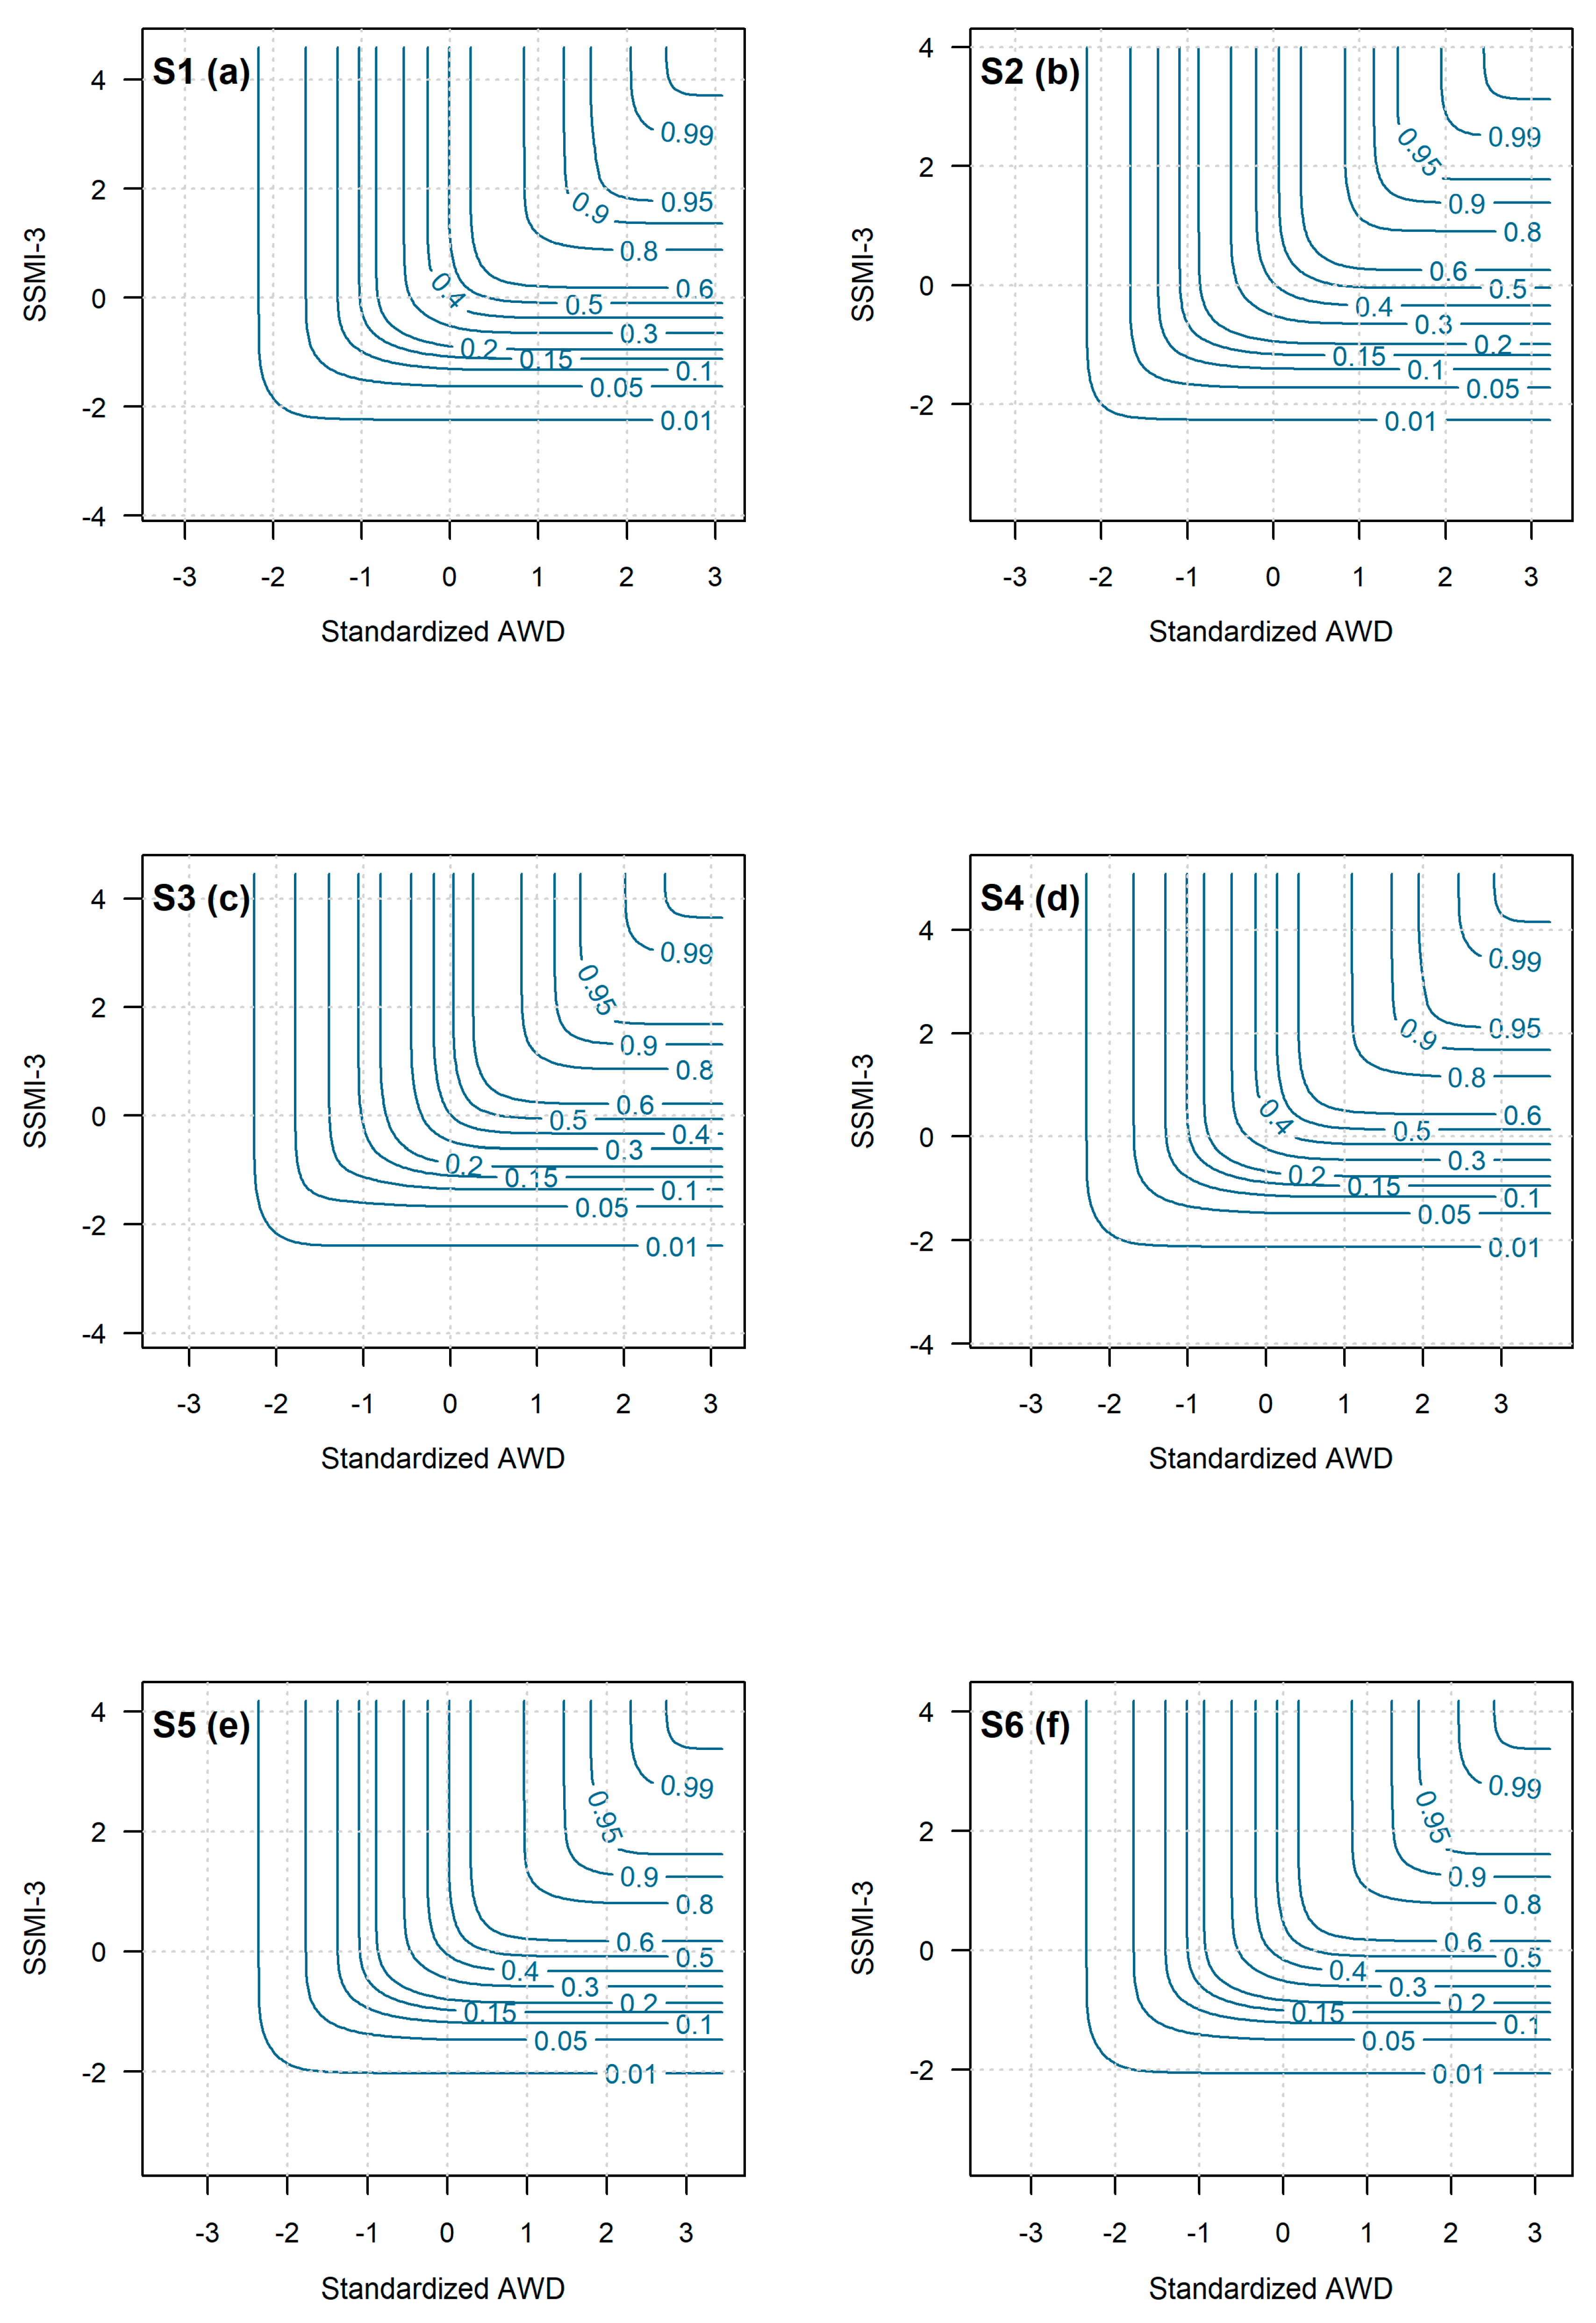
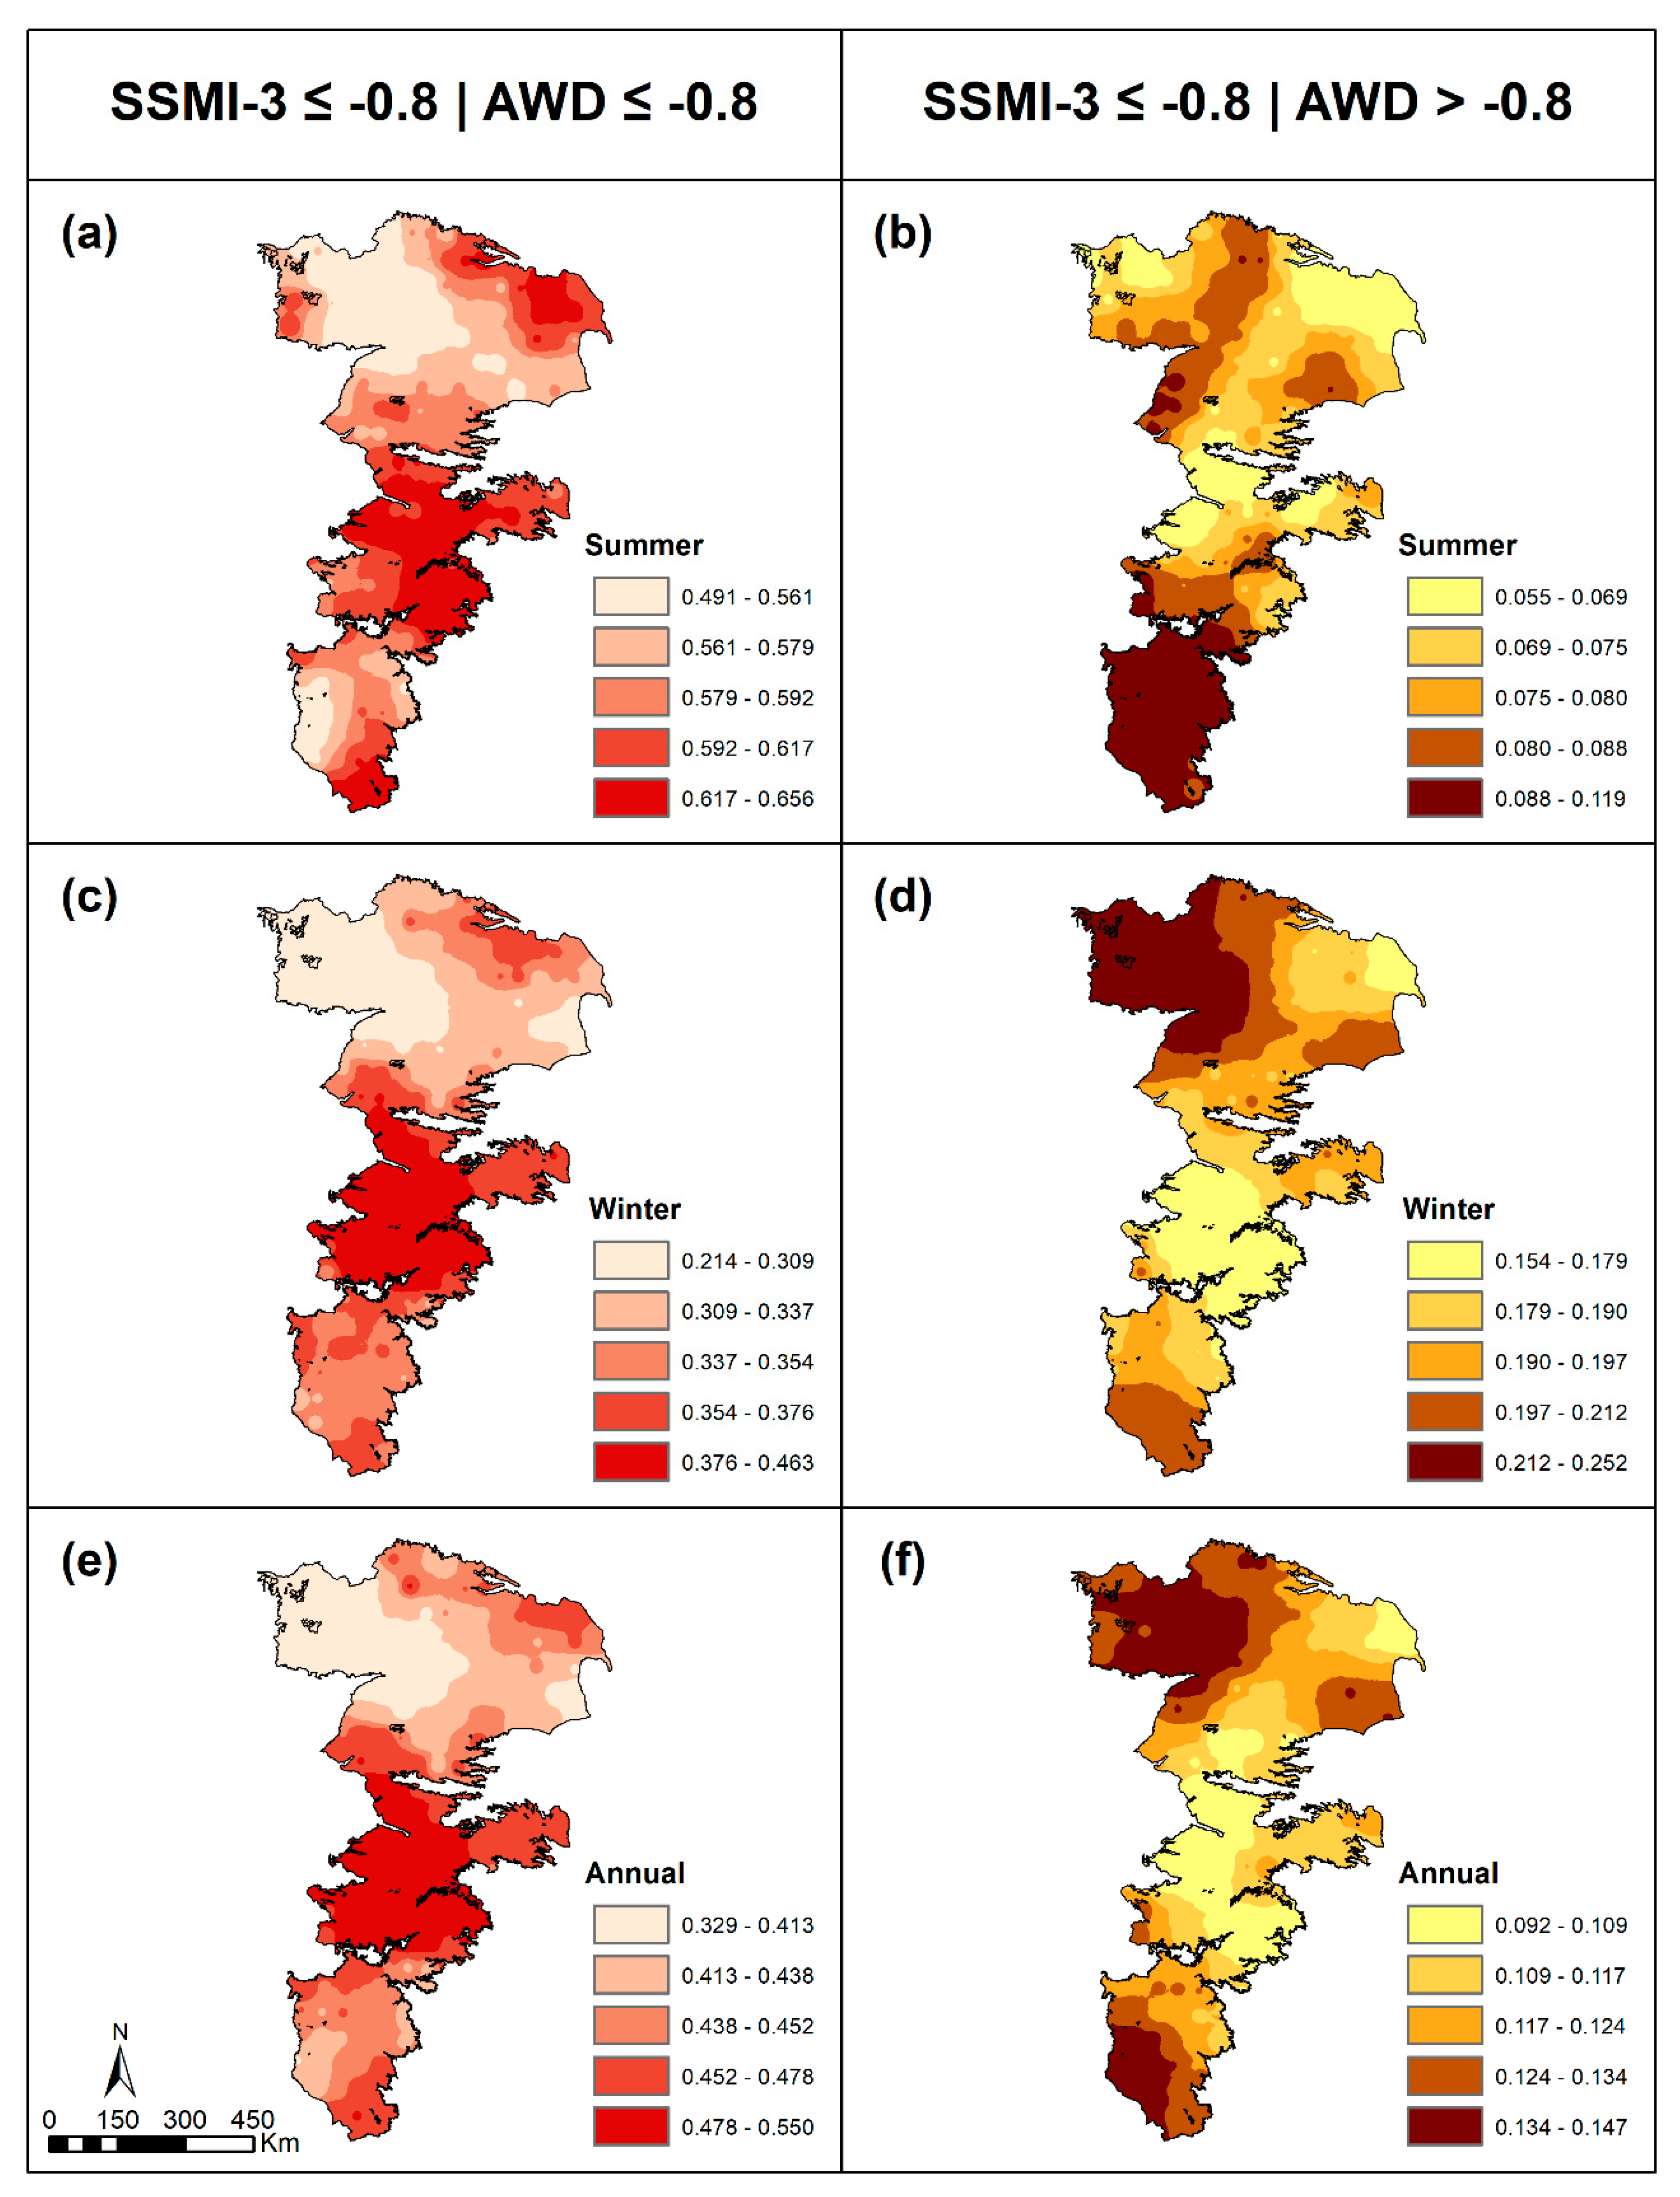
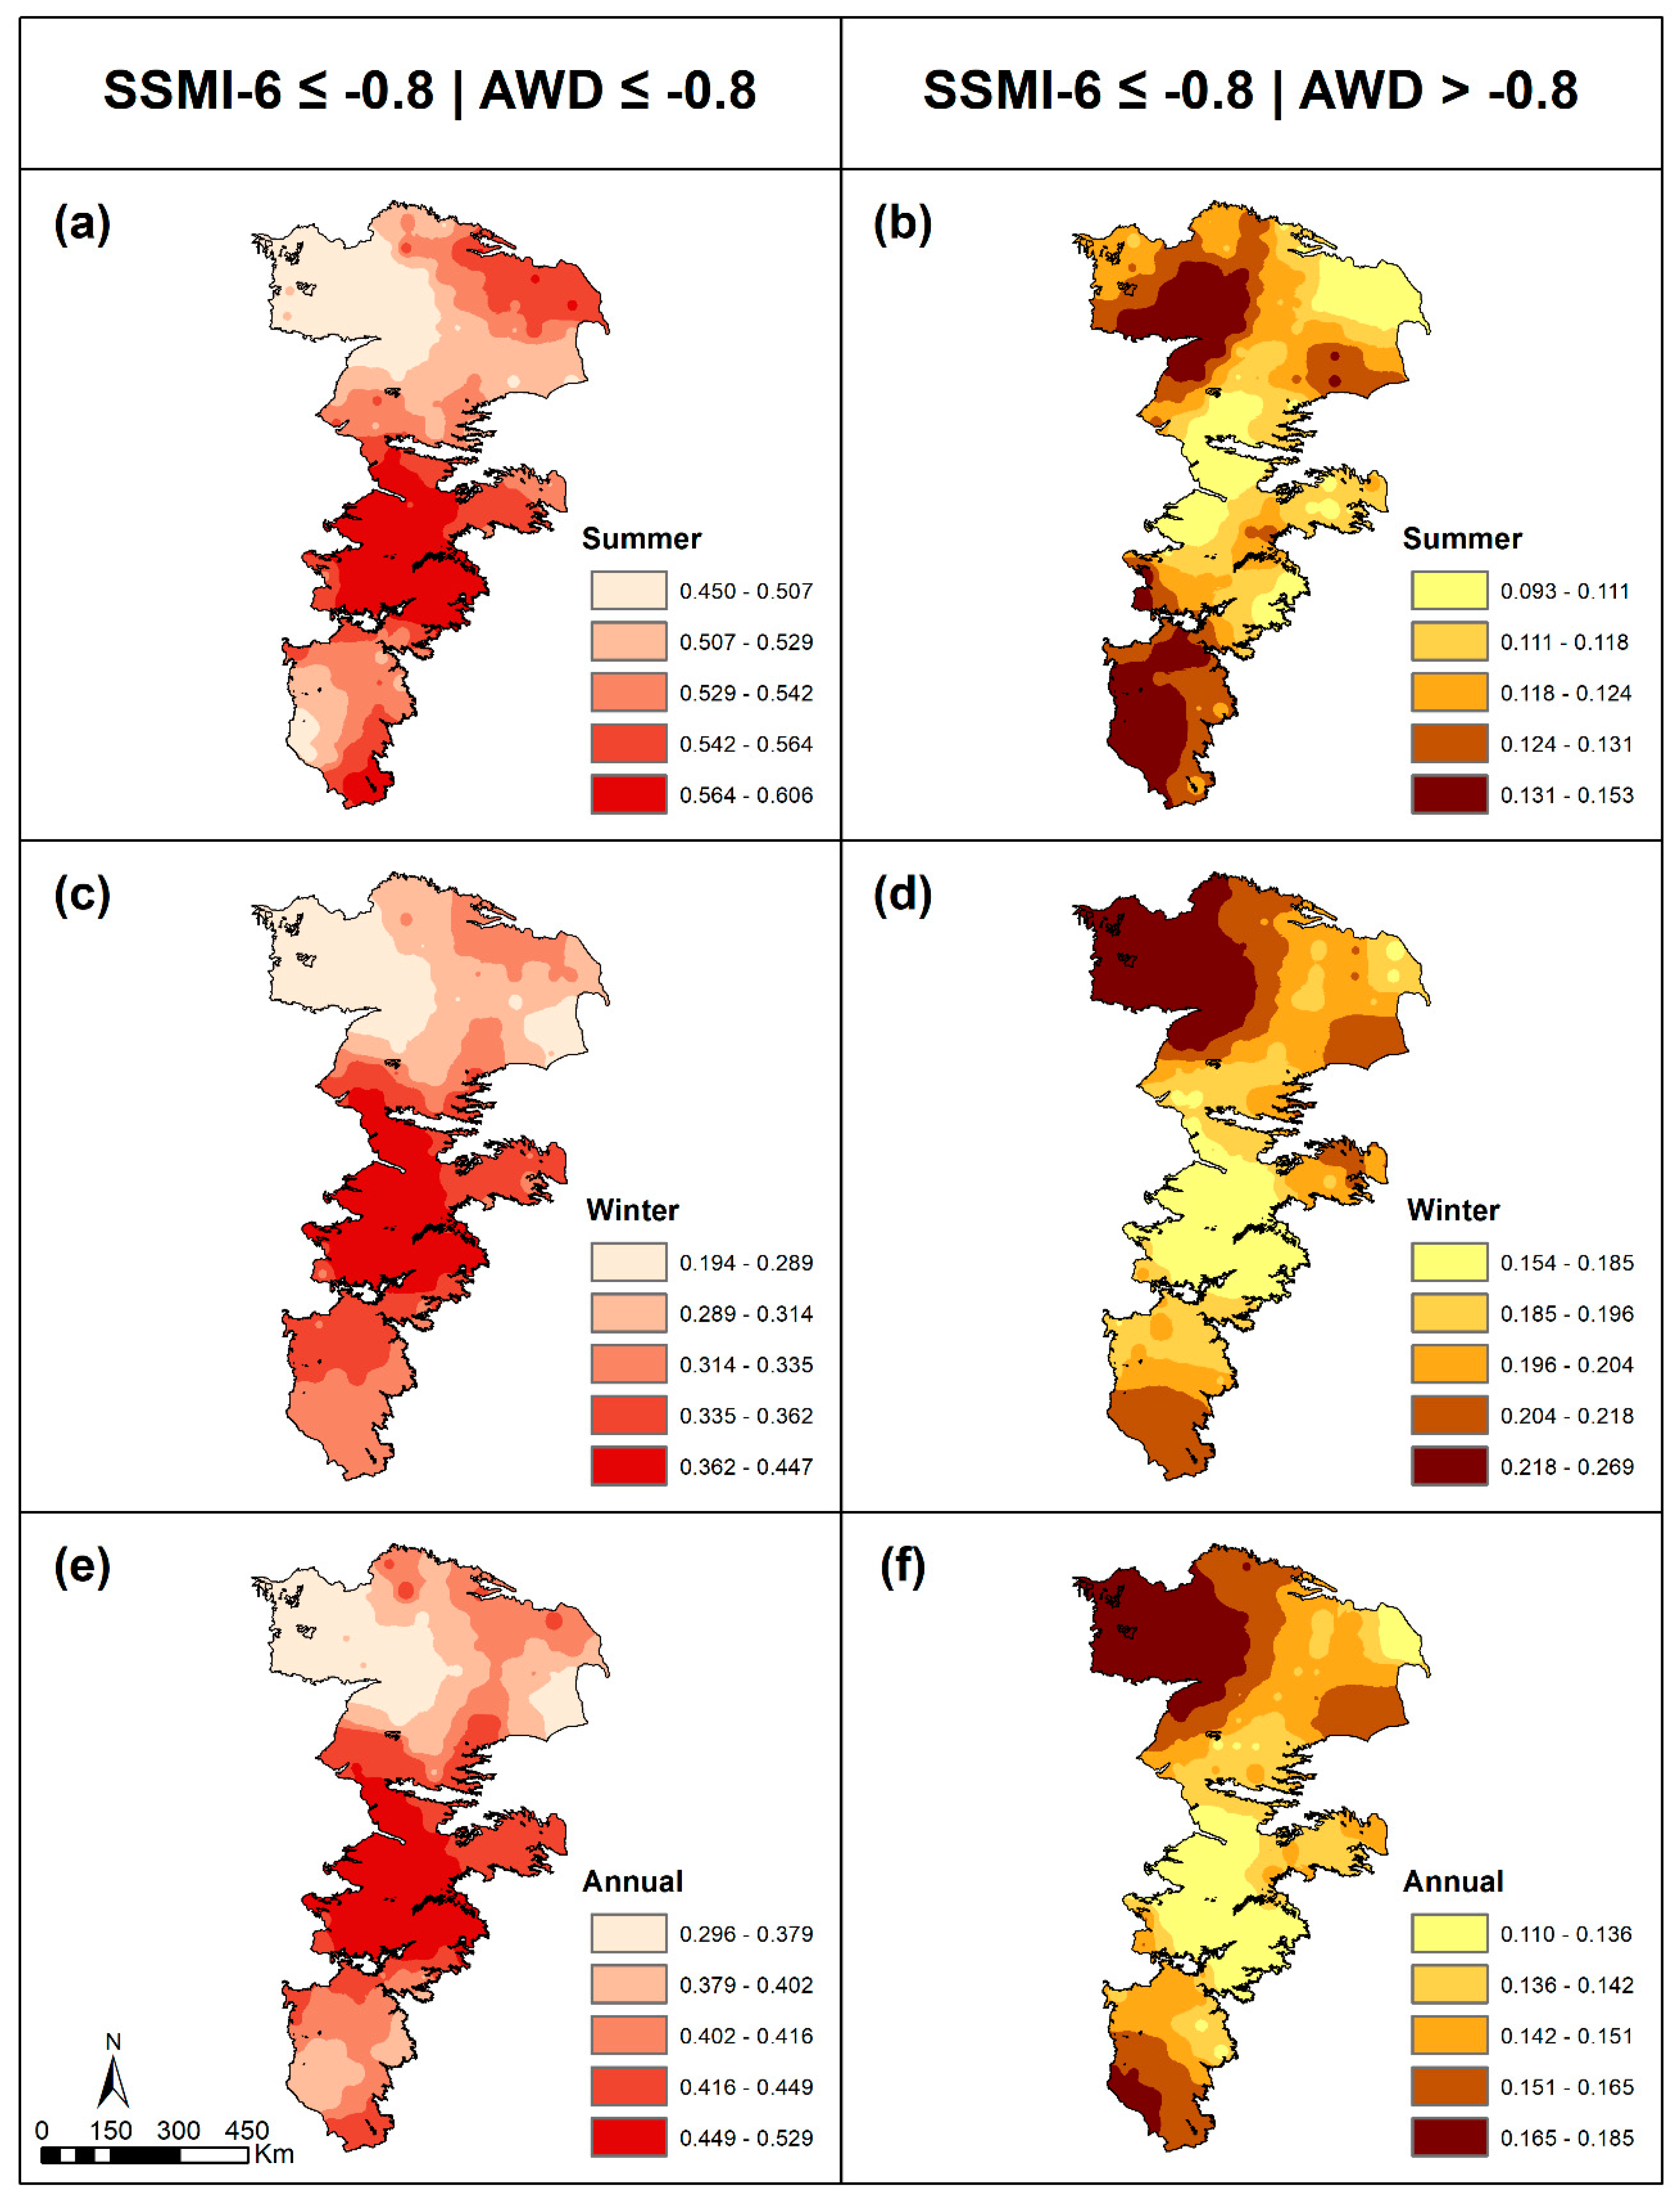
4.4. Variations of Agriculture Drought Risks with Atmospheric Water Deficit
5. Summary and Conclusions
Supplementary Materials
Author Contributions
Funding
Acknowledgments
Conflicts of Interest
References
- Mallya, G.; Zhao, L.; Song, X.; Niyogi, D.; Govindaraju, R. 2012 Midwest drought in the United States. J. Hydrol. Eng. 2013, 18, 737–745. [Google Scholar] [CrossRef]
- Grigg, N.S. The 2011–2012 drought in the United States: New lessons from a record event. Int. J. Water Resour. Dev. 2014, 30, 183–199. [Google Scholar] [CrossRef]
- Marston, L.; Konar, M.; Cai, X.; Troy, T.J. Virtual groundwater transfers from overexploited aquifers in the United States. Proc. Natl. Acad. Sci. USA 2015, 112, 8561–8566. [Google Scholar] [CrossRef] [PubMed]
- Emerson, R.; Hoover, A.; Ray, A.; Lacey, J.; Cortez, M.; Payne, C.; Karlen, D.; Birrell, S.; Laird, D.; Kallenbach, R. Drought effects on composition and yield for corn stover, mixed grasses, and Miscanthus as bioenergy feedstocks. Biofuels 2014, 5, 275–291. [Google Scholar] [CrossRef]
- Manfreda, S.; Scanlon, T.M.; Caylor, K.K. On the importance of accurate depiction of infiltration processes on modelled soil moisture and vegetation water stress. Ecohydrol. Ecosyst. Land Water Process Interact. Ecohydrogeomorphol. 2010, 3, 155–165. [Google Scholar] [CrossRef]
- Davis, R.; Earl, H.; Timper, P. Effect of simultaneous water deficit stress and Meloidogyne incognita infection on cotton yield and fiber quality. J. Nematol. 2014, 46, 108–118. [Google Scholar] [PubMed]
- Lesk, C.; Rowhani, P.; Ramankutty, N. Influence of extreme weather disasters on global crop production. Nature 2016, 529, 84–87. [Google Scholar] [CrossRef] [PubMed]
- Muimba-Kankolongo, A. Food Crop Production by Smallholder Farmers in Southern Africa: Challenges and Opportunities for Improvement; Academic Press: Cambridge, MA, USA, 2018. [Google Scholar]
- Hao, Z.; AghaKouchak, A. A nonparametric multivariate multi-index drought monitoring framework. J. Hydrometeorol. 2014, 15, 89–101. [Google Scholar] [CrossRef]
- Teweldebirhan Tsige, D.; Uddameri, V.; Forghanparast, F.; Hernandez, E.A.; Ekwaro-Osire, S. Comparison of meteorological-and agriculture-related drought indicators across ethiopia. Water 2019, 11, 2218. [Google Scholar] [CrossRef]
- Shin, Y.; Jung, Y. Development of irrigation water management model for reducing drought severity using remotely sensed soil moisture footprints. J. Irrig. Drain. Eng. 2014, 140, 4014021. [Google Scholar] [CrossRef]
- Gonzalez Cruz, M.; Hernandez, E.A.; Uddameri, V. Regional-scale vulnerability assessment of agricultural production systems to drought stresses using robustness measures. Sci. Rep. 2020. under review. [Google Scholar]
- Palmer, W.C. Meteorological Drought, Research Paper No. 45; US Weather Bureau: Washington, DC, USA, 1965; Volume 58.
- Karl, T.R. The sensitivity of the palmer drought severity index and palmer’s z-index to their calibration coefficients including potential evapotranspiration. J. Clim. Appl. Meteorol. 1986, 25, 77–86. [Google Scholar] [CrossRef]
- Huang, J.; van den Dool, H.M.; Georgarakos, K.P. Analysis of model-calculated soil moisture over the United States (1931–1993) and applications to long-range temperature forecasts. J. Clim. 1996, 9, 1350–1362. [Google Scholar] [CrossRef]
- Wells, N.; Goddard, S.; Hayes, M.J. A self-calibrating Palmer drought severity index. J. Clim. 2004, 17, 2335–2351. [Google Scholar] [CrossRef]
- Yu, H.; Zhang, Q.; Xu, C.-Y.; Du, J.; Sun, P.; Hu, P. Modified palmer drought severity index: Model improvement and application. Environ. Int. 2019, 130, 104951. [Google Scholar] [CrossRef] [PubMed]
- Uddameri, V.; Kuchanur, M. Simulation-optimization approach to assess groundwater availability in Refugio County, TX. Environ. Geol. 2007, 51, 921–929. [Google Scholar] [CrossRef]
- Vereecken, H.; Huisman, J.-A.; Hendricks Franssen, H.-J.; Brüggemann, N.; Bogena, H.R.; Kollet, S.; Javaux, M.; van der Kruk, J.; Vanderborght, J. Soil hydrology: Recent methodological advances, challenges, and perspectives. Water Resour. Res. 2015, 51, 2616–2633. [Google Scholar] [CrossRef]
- Greifeneder, F.; Notarnicola, C.; Bertoldi, G.; Niedrist, G.; Wagner, W. From point to pixel scale: An upscaling approach for in situ soil moisture measurements. Vadose Zone J. 2016, 15. [Google Scholar] [CrossRef]
- McKee, T.B.; Doesken, N.J.; Kleist, J. The relationship of drought frequency and duration to time scales. In Proceedings of the 8th Conference on Applied Climatology, Anaheim, CA, USA, 17–22 January 1993; pp. 179–183. [Google Scholar]
- Van den Dool, H.; Huang, J.; Fan, Y. Performance and analysis of the constructed analogue method applied to US soil moisture over 1981–2001. J. Geophys. Res. Atmos. 2003, 108. [Google Scholar] [CrossRef]
- USDM. Drought Classification. Available online: https://droughtmonitor.unl.edu/About/AbouttheData/DroughtClassification.aspx (accessed on 22 August 2020).
- Uddameri, V.; Ghaseminejad, A.; Hernandez, E.A. A tiered stochastic framework for assessing crop yield loss risks due to water scarcity under different uncertainty levels. Agric. Water Manag. 2020, 238, 106226. [Google Scholar] [CrossRef]
- Hernandez, E.A.; Uddameri, V. Standardized precipitation evaporation index (SPEI)-based drought assessment in semi-arid south Texas. Environ. Earth Sci. 2014, 71, 2491–2501. [Google Scholar] [CrossRef]
- Coelho, C.A.; de Oliveira, C.P.; Ambrizzi, T.; Reboita, M.S.; Carpenedo, C.B.; Campos, J.L.P.S.; Tomaziello, A.C.N.; Pampuch, L.A.; de Souza Custódio, M.; Dutra, L.M.M. The 2014 southeast Brazil austral summer drought: Regional scale mechanisms and teleconnections. Clim. Dyn. 2016, 46, 3737–3752. [Google Scholar] [CrossRef]
- Hobbins, M.T.; Wood, A.; McEvoy, D.J.; Huntington, J.L.; Morton, C.; Anderson, M.; Hain, C. The evaporative demand drought index. Part I: Linking drought evolution to variations in evaporative demand. J. Hydrometeorol. 2016, 17, 1745–1761. [Google Scholar] [CrossRef]
- Dong, J.; Crow, W.T. L-band remote-sensing increases sampled levels of global soil moisture-air temperature coupling strength. Remote Sens. Environ. 2019, 220, 51–58. [Google Scholar] [CrossRef]
- Lall, U. Recent advances in nonparametric function estimation: Hydrologic applications. Rev. Geophys. 1995, 33, 1093–1102. [Google Scholar] [CrossRef]
- Santhosh, D.; Srinivas, V. Bivariate frequency analysis of floods using a diffusion based kernel density estimator. Water Resour. Res. 2013, 49, 8328–8343. [Google Scholar] [CrossRef]
- Kao, S.-C.; Govindaraju, R.S. A copula-based joint deficit index for droughts. J. Hydrol. 2010, 380, 121–134. [Google Scholar] [CrossRef]
- Swain, S.; Hayhoe, K. CMIP5 projected changes in spring and summer drought and wet conditions over North America. Clim. Dyn. 2015, 44, 2737–2750. [Google Scholar] [CrossRef]
- Vicente-Serrano, S.M.; Beguería, S.; López-Moreno, J.I. A multiscalar drought index sensitive to global warming: The standardized precipitation evapotranspiration index. J. Clim. 2010, 23, 1696–1718. [Google Scholar] [CrossRef]
- Yue, S. A bivariate extreme value distribution applied to flood frequency analysis. Hydrol. Res. 2001, 32, 49–64. [Google Scholar] [CrossRef]
- Shiau, J. Fitting drought duration and severity with two-dimensional copulas. Water Resour. Manag. 2006, 20, 795–815. [Google Scholar] [CrossRef]
- Lall, U.; Devineni, N.; Kaheil, Y. An empirical, nonparametric simulator for multivariate random variables with differing marginal densities and nonlinear dependence with hydroclimatic applications. Risk Anal. 2016, 36, 57–73. [Google Scholar] [CrossRef] [PubMed]
- Duong, T. Feature: An R Package for Feature Significance for Multivariate Kernel Density Estimation. 2015. Available online: http://132.180.15.2/math/statlib/R/CRAN/doc/vignettes/feature/feature.pdf (accessed on 20 June 2020).
- Silverman, B.W. Density Estimation for Statistics and Data Analysis; CRC Press: Boca Raton, Fl, USA, 1986; Volume 26. [Google Scholar]
- Nadaraya, E.A. On estimating regression. Theory Probab. Its Appl. 1964, 9, 141–142. [Google Scholar] [CrossRef]
- Azzalini, A. A note on the estimation of a distribution function and quantiles by a kernel method. Biometrika 1981, 68, 326–328. [Google Scholar] [CrossRef]
- Duong, T. Ks: Kernel density estimation and kernel discriminant analysis for multivariate data in R. J. Stat. Softw. 2007, 21, 1–16. [Google Scholar] [CrossRef]
- Wand, M.P.; Jones, M.C. Kernel Smoothing; CRC Press: Boca Raton, Fl, USA, 1994. [Google Scholar]
- Akima, H.; Gebhardt, A. Akima: Interpolation of Irregularly and Regularly Spaced Data. R package version 0.6-2-1: 2020. Available online: https://CRAN.R-project.org/package=akima (accessed on 1 June 2020).
- Duong, T. Ks: Kernel Smoothing. R Package Version 1.11.7. 2020. Available online: ftp://mirrors.ucr.ac.cr/CRAN/web/packages/ks/ks.pdf (accessed on 29 April 2020).
- Core Team, R. R: A Language and Environment for Statistical Computing. Available online: https://www.R-project.org (accessed on 29 April 2020).
- Yue, S. Applying bivariate normal distribution to flood frequency analysis. Water Int. 1999, 24, 248–254. [Google Scholar] [CrossRef]
- Kling, H.; Fuchs, M.; Paulin, M. Runoff conditions in the upper danube basin under an ensemble of climate change scenarios. J. Hydrol. 2012, 424, 264–277. [Google Scholar] [CrossRef]
- USDA-NASS. 2019 Cultivated Layer. Available online: https://nassgeodata.gmu.edu/CropScape/ (accessed on 29 April 2020).
- McGuire, V.L. Water-Level and Recoverable Water in Storage Changes, High Plains Aquifer, Predevelopment to 2015 and 2013–15; 2328-0328; US Geological Survey: Reston, VA, USA, 2017.
- Hornbeck, R.; Keskin, P. The historically evolving impact of the ogallala aquifer: Agricultural adaptation to groundwater and drought. Am. Econ. J. Appl. Econ. 2014, 6, 190–219. [Google Scholar] [CrossRef]
- Ward, F.A. Economic impacts on irrigated agriculture of water conservation programs in drought. J. Hydrol. 2014, 508, 114–127. [Google Scholar] [CrossRef]
- Harris, I.; Osborn, T.J.; Jones, P.; Lister, D. Version 4 of the CRU TS monthly high-resolution gridded multivariate climate dataset. Sci. Data 2020, 7, 1–18. [Google Scholar] [CrossRef]
- Gringorten, I.I. A plotting rule for extreme probability paper. J. Geophys. Res. 1963, 68, 813–814. [Google Scholar] [CrossRef]


| Marginal | |||
| Marginal |
| Station | SSMI-3 | SSMI-6 | ||||||
|---|---|---|---|---|---|---|---|---|
| KGE | KGE | |||||||
| Overall | Correlation | Bias | Variability | Overall | Correlation | Bias | Variability | |
| Summer | ||||||||
| S1 | 0.949 | 0.999 | 1.016 | 0.952 | 0.940 | 0.999 | 1.009 | 0.941 |
| S2 | 0.934 | 0.998 | 1.027 | 0.940 | 0.938 | 0.998 | 1.013 | 0.940 |
| S3 | 0.944 | 0.998 | 1.013 | 0.945 | 0.931 | 0.998 | 1.020 | 0.934 |
| S4 | 0.944 | 0.998 | 1.019 | 0.947 | 0.930 | 0.999 | 1.014 | 0.931 |
| S5 | 0.956 | 0.999 | 1.006 | 0.957 | 0.936 | 0.999 | 1.015 | 0.938 |
| S6 | 0.928 | 0.999 | 1.022 | 0.931 | 0.932 | 0.999 | 1.013 | 0.934 |
| Winter | ||||||||
| S1 | 0.924 | 0.998 | 1.020 | 0.926 | 0.929 | 0.998 | 1.013 | 0.930 |
| S2 | 0.939 | 0.998 | 1.010 | 0.940 | 0.933 | 0.999 | 1.013 | 0.934 |
| S3 | 0.919 | 0.998 | 1.019 | 0.922 | 0.942 | 0.999 | 1.013 | 0.943 |
| S4 | 0.929 | 0.999 | 1.021 | 0.932 | 0.938 | 0.999 | 1.013 | 0.940 |
| S5 | 0.936 | 0.998 | 1.020 | 0.940 | 0.924 | 0.998 | 1.023 | 0.928 |
| S6 | 0.936 | 0.998 | 1.009 | 0.937 | 0.922 | 0.998 | 1.013 | 0.923 |
| Annual | ||||||||
| S1 | 0.933 | 0.999 | 1.018 | 0.936 | 0.904 | 0.998 | 1.025 | 0.908 |
| S2 | 0.940 | 0.999 | 1.006 | 0.941 | 0.934 | 0.997 | 1.008 | 0.935 |
| S3 | 0.935 | 0.998 | 1.020 | 0.938 | 0.924 | 0.999 | 1.021 | 0.927 |
| S4 | 0.932 | 0.998 | 1.020 | 0.936 | 0.919 | 0.998 | 1.015 | 0.921 |
| S5 | 0.945 | 0.998 | 1.007 | 0.945 | 0.939 | 0.998 | 1.009 | 0.940 |
| S6 | 0.943 | 0.999 | 1.011 | 0.945 | 0.940 | 0.999 | 1.007 | 0.940 |
| Station | Precipitation | PET | AWD | |||||||||
|---|---|---|---|---|---|---|---|---|---|---|---|---|
| KGE | KGE | KGE | ||||||||||
| Overall | Correlation | Bias | Variability | Overall | Correlation | Bias | Variability | Overall | Correlation | Bias | Variability | |
| Summer | ||||||||||||
| S1 | 0.942 | 0.999 | 1.012 | 0.943 | 0.928 | 0.998 | 1.026 | 0.933 | 0.932 | 0.999 | 1.013 | 0.933 |
| S2 | 0.934 | 0.999 | 1.022 | 0.937 | 0.943 | 0.999 | 1.015 | 0.945 | 0.940 | 0.999 | 1.019 | 0.943 |
| S3 | 0.919 | 1.000 | 1.031 | 0.926 | 0.932 | 0.998 | 1.019 | 0.935 | 0.951 | 0.999 | 1.015 | 0.954 |
| S4 | 0.937 | 0.999 | 1.015 | 0.938 | 0.949 | 0.999 | 0.999 | 0.949 | 0.944 | 0.999 | 1.015 | 0.947 |
| S5 | 0.939 | 0.999 | 1.014 | 0.940 | 0.955 | 0.998 | 1.005 | 0.955 | 0.940 | 0.999 | 1.013 | 0.942 |
| S6 | 0.939 | 0.998 | 1.008 | 0.939 | 0.928 | 0.997 | 1.017 | 0.930 | 0.943 | 0.999 | 1.014 | 0.945 |
| Winter | ||||||||||||
| S1 | 0.925 | 0.999 | 1.008 | 0.925 | 0.956 | 0.998 | 1.000 | 0.956 | 0.923 | 0.999 | 1.025 | 0.927 |
| S2 | 0.903 | 0.999 | 1.042 | 0.913 | 0.865 | 0.999 | 1.031 | 0.903 | 0.935 | 0.999 | 1.005 | 0.936 |
| S3 | 0.940 | 0.998 | 1.010 | 0.941 | 0.932 | 0.999 | 0.999 | 0.932 | 0.924 | 0.998 | 1.021 | 0.927 |
| S4 | 0.917 | 0.999 | 1.028 | 0.922 | 0.868 | 0.994 | 1.070 | 0.888 | 0.933 | 0.999 | 1.013 | 0.934 |
| S5 | 0.939 | 0.999 | 1.006 | 0.939 | 0.934 | 0.998 | 1.021 | 0.938 | 0.919 | 0.999 | 1.018 | 0.922 |
| S6 | 0.952 | 0.999 | 0.998 | 0.952 | 0.954 | 0.999 | 1.008 | 0.956 | 0.878 | 0.997 | 1.032 | 0.882 |
| Annual | ||||||||||||
| S1 | 0.938 | 0.999 | 1.013 | 0.940 | 0.943 | 0.999 | 1.012 | 0.945 | 0.930 | 0.999 | 1.018 | 0.932 |
| S2 | 0.932 | 0.999 | 1.019 | 0.934 | 0.936 | 0.999 | 1.008 | 0.937 | 0.935 | 0.999 | 1.023 | 0.940 |
| S3 | 0.942 | 0.999 | 1.015 | 0.944 | 0.914 | 0.998 | 1.030 | 0.920 | 0.922 | 0.999 | 1.027 | 0.927 |
| S4 | 0.936 | 0.999 | 1.013 | 0.938 | 0.903 | 0.998 | 1.027 | 0.907 | 0.933 | 0.999 | 1.015 | 0.934 |
| S5 | 0.938 | 0.999 | 1.013 | 0.939 | 0.935 | 0.997 | 1.012 | 0.937 | 0.955 | 0.999 | 1.008 | 0.956 |
| S6 | 0.928 | 0.997 | 1.015 | 0.930 | 0.907 | 0.997 | 1.039 | 0.916 | 0.947 | 0.999 | 1.010 | 0.948 |
© 2020 by the authors. Licensee MDPI, Basel, Switzerland. This article is an open access article distributed under the terms and conditions of the Creative Commons Attribution (CC BY) license (http://creativecommons.org/licenses/by/4.0/).
Share and Cite
Gonzalez Cruz, M.; Hernandez, E.A.; Uddameri, V. Climatic Influences on Agricultural Drought Risks Using Semiparametric Kernel Density Estimation. Water 2020, 12, 2813. https://doi.org/10.3390/w12102813
Gonzalez Cruz M, Hernandez EA, Uddameri V. Climatic Influences on Agricultural Drought Risks Using Semiparametric Kernel Density Estimation. Water. 2020; 12(10):2813. https://doi.org/10.3390/w12102813
Chicago/Turabian StyleGonzalez Cruz, Marangely, E. Annette Hernandez, and Venkatesh Uddameri. 2020. "Climatic Influences on Agricultural Drought Risks Using Semiparametric Kernel Density Estimation" Water 12, no. 10: 2813. https://doi.org/10.3390/w12102813
APA StyleGonzalez Cruz, M., Hernandez, E. A., & Uddameri, V. (2020). Climatic Influences on Agricultural Drought Risks Using Semiparametric Kernel Density Estimation. Water, 12(10), 2813. https://doi.org/10.3390/w12102813