Article

Organic Degradation Potential of Real Greywater Using TiO2-Based Advanced Oxidation Processes

1
Department of Water Management and Environment, Faculty of Natural Resources and Environment, The Hashemite University, 13115 Zarqa, Jordan
2
Nanotechnology and Integrated Bioengineering Centre, School of Engineering, Ulster University, Jordanstown BT37 0QB, Northern Ireland, UK
*
Author to whom correspondence should be addressed.
Water 2020, 12(10), 2811; https://doi.org/10.3390/w12102811
Submission received: 24 July 2020 / Revised: 1 October 2020 / Accepted: 6 October 2020 / Published: 10 October 2020

Abstract

:
In keeping with the circular economy approach, reclaiming greywater (GW) is considered a sustainable approach to local reuse of wastewater and a viable option to reduce household demand for freshwater. This study investigated the mineralization of total organic carbon (TOC) in GW using TiO2-based advanced oxidation processes (AOPs) in a custom-built stirred tank reactor. The combinations of H2O2, O3, and immobilized TiO2 under either dark or UVA irradiation conditions were systematically evaluated—namely TiO2/dark, O3/dark (ozonation), H2O2/dark (peroxidation), TiO2/UVA (photocatalysis), O3/UVA (Ozone photolysis), H2O2/UVA (photo-peroxidation), O3/TiO2/dark (catalytic ozonation), O3/TiO2/UVA (photocatalytic ozonation), H2O2/TiO2/dark, H2O2/TiO2/UVA, H2O2/O3/dark (peroxonation), H2O2/O3/UVA (photo-peroxonation), H2O2/O3/TiO2/dark (catalytic peroxonation), and H2O2/O3/TiO2/UVA (photocatalytic peroxonation). It was found that combining different treatment methods with UVA irradiation dramatically enhanced the organic mineralization efficiency. The optimum TiO2 loading in this study was observed to be 0.96 mg/cm2 with the highest TOC removal (54%) achieved using photocatalytic peroxonation under optimal conditions (0.96 mg TiO2/cm2, 25 mg O3/min, and 0.7 H2O2/O3 molar ratio). In peroxonation and photo-peroxonation, the optimal H2O2/O3 molar ratio was identified to be a critical efficiency parameter maximizing the production of reactive radical species. Increasing ozone flow rate or H2O2 dosage was observed to cause an efficiency inhibition effect. This lab-based study demonstrates the potential for combined TiO2-AOP treatments to significantly reduce the organic fraction of real GW, offering potential for the development of low-cost systems permitting safe GW reuse.

Graphical Abstract

1. Introduction

Global water resources are under increasing pressure due to rising demand caused by climate change [1], urbanization, and the growing world population [2]. In order to tackle those challenges, there is a considerable interest in the diversification of water sources, with the use of reclaimed greywater (GW) highlighted as a crucial potential water source [3]. GW is defined the untreated domestic wastewater, excluding toilet, bidet and urinals [4], and, based on some reports, the wastewater generated in the kitchen can also be excluded [3]. Reclaiming GW could meet the needs of up to 75% of household water consumption [5]. In keeping with the circular economy approach, reclaiming GW will not only reduce household demand for freshwater [6], but will also reduce the volume of generated wastewater [7] and the associated energy required for collection/distribution. Given the pressure on freshwater resources in developing countries, and indeed the need to control pollution of water bodies, where around 80% of untreated sewage is discharged to [8], considering options to treat and reclaim GW offer significant promise.
Reclaiming GW is common in villages and rural areas in Jordan [9], where it is used for irrigation without any treatment [10], however the introduction of standards by the Jordan Standards and Metrology Organization (JSMO) in 2013 (JS1776:2013) aims to control GW quality for irrigation and toilet-flushing purposes [11].
Although there is a long list of traditional GW treatment methods, a limited number of studies have considered the use of advanced oxidation processes (AOPs) for GW treatment. AOPs involve the formation of hydroxyl radicals ( O H ) in sufficient quantity to remove pollutants [12,13,14]. TiO2 photocatalysis has gained significant attention [15,16,17] primarily due to the catalysts’ ability to utilize solar and near UV radiation, chemical and photochemical stability in water, wide availability, and low cost [12,18]. In most photocatalytic studies, TiO2 was utilized in suspended form [15], with limited research investigating the perhaps more scalable immobilized TiO2 system [12,19].
To enhance AOP degradation efficiency, primarily by boosting the production of reactive oxygen species, several studies have considered combining photocatalysis with ozone [14,20,21,22] or hydrogen peroxide [23,24,25,26]. However, the application of enhanced photocatalysis for GW treatment is limited and usually focused on laboratory-simulated GW, with few studies comparing different AOPs using the same real GW source. The objective of this study was to systematically examine the suitability of enhanced immobilized TiO2 based photocatalytic systems to treat real GW, focusing specifically on the removal of the organic fraction.

2. Materials and Methods

2.1. Greywater Selection and Characteristics

Domestic GW characteristics are greatly affected by the generating source (shower, kitchen sink, wash hand basin), the number, age, lifestyle and income level of residents, and the location of property [27]. In order to reduce the variation in GW characteristics, GW quality from individual houses in different Jordanian cities was monitored for several months, and one house in Irbid was selected based upon the consistency of biological load. The homeowner installed the GW collection system in the house during construction, with the wastewater generated from the washing machine, hand-washing basins and showers collected into a 200 L tank housed outside. The GW collection tank was fitted with a submersible pump connected to the sewer to ensure the tank did not overflow. The average GW retention time in the collection tank was roughly 48 h, before use for irrigation purposes or disposal to the sewer. The GW characteristics in this house during the monitoring period are summarized in Table 1 and compared with Jordan’s GW reuse standard JS1776:2013 [11], showing parameters as a function of reuse option. GW analysis was carried at the Royal Scientific Society laboratories according to the international standards [28] within 48 h of collection.

2.2. Greywater Collection and Storage

GW was collected manually from the top of the home-owners GW tank in a 20 L polyethylene container, transferred to the laboratory within 1–2 h, and stored at 3–5 °C to minimize any changes that might occur in GW properties before the experiments. Each set of experiments was conducted with a single batch of collected GW, which was manually shaken prior to addition to the reactor.

2.3. Materials

All chemicals used were of high purity grade and sourced from Sigma Aldrich and BDH. Potassium hydrogen phthalate, for TOC standards preparation, was supplied by Nacalai Tesque Inc. Titanium dioxide was a mixture (50:50) of Anatase (25 nm particle size, 99.7% trace metals basis) and Rutile (99.99% trace metals basis) supplied by Sigma-Aldrich. Methanol used in TiO2 suspension preparation was 96% HPLC grade (BDH, AnalaR).

2.4. Analytical Methods

To evaluate organic mineralization, total organic carbon (TOC) analysis was preferred over chemical oxygen demand (COD) to avoid H2O2 interference with COD measurement [29]. TOC was analyzed using Shimadzu 5000 TOC/V with solid sample combustion unit SSM-5000A employing regular sensitivity Pt catalyst. The solid samples procedure was used to avoid a reduction in TOC via pre-filtration solids removal. All samples in this study were analyzed in triplicate unless otherwise stated.

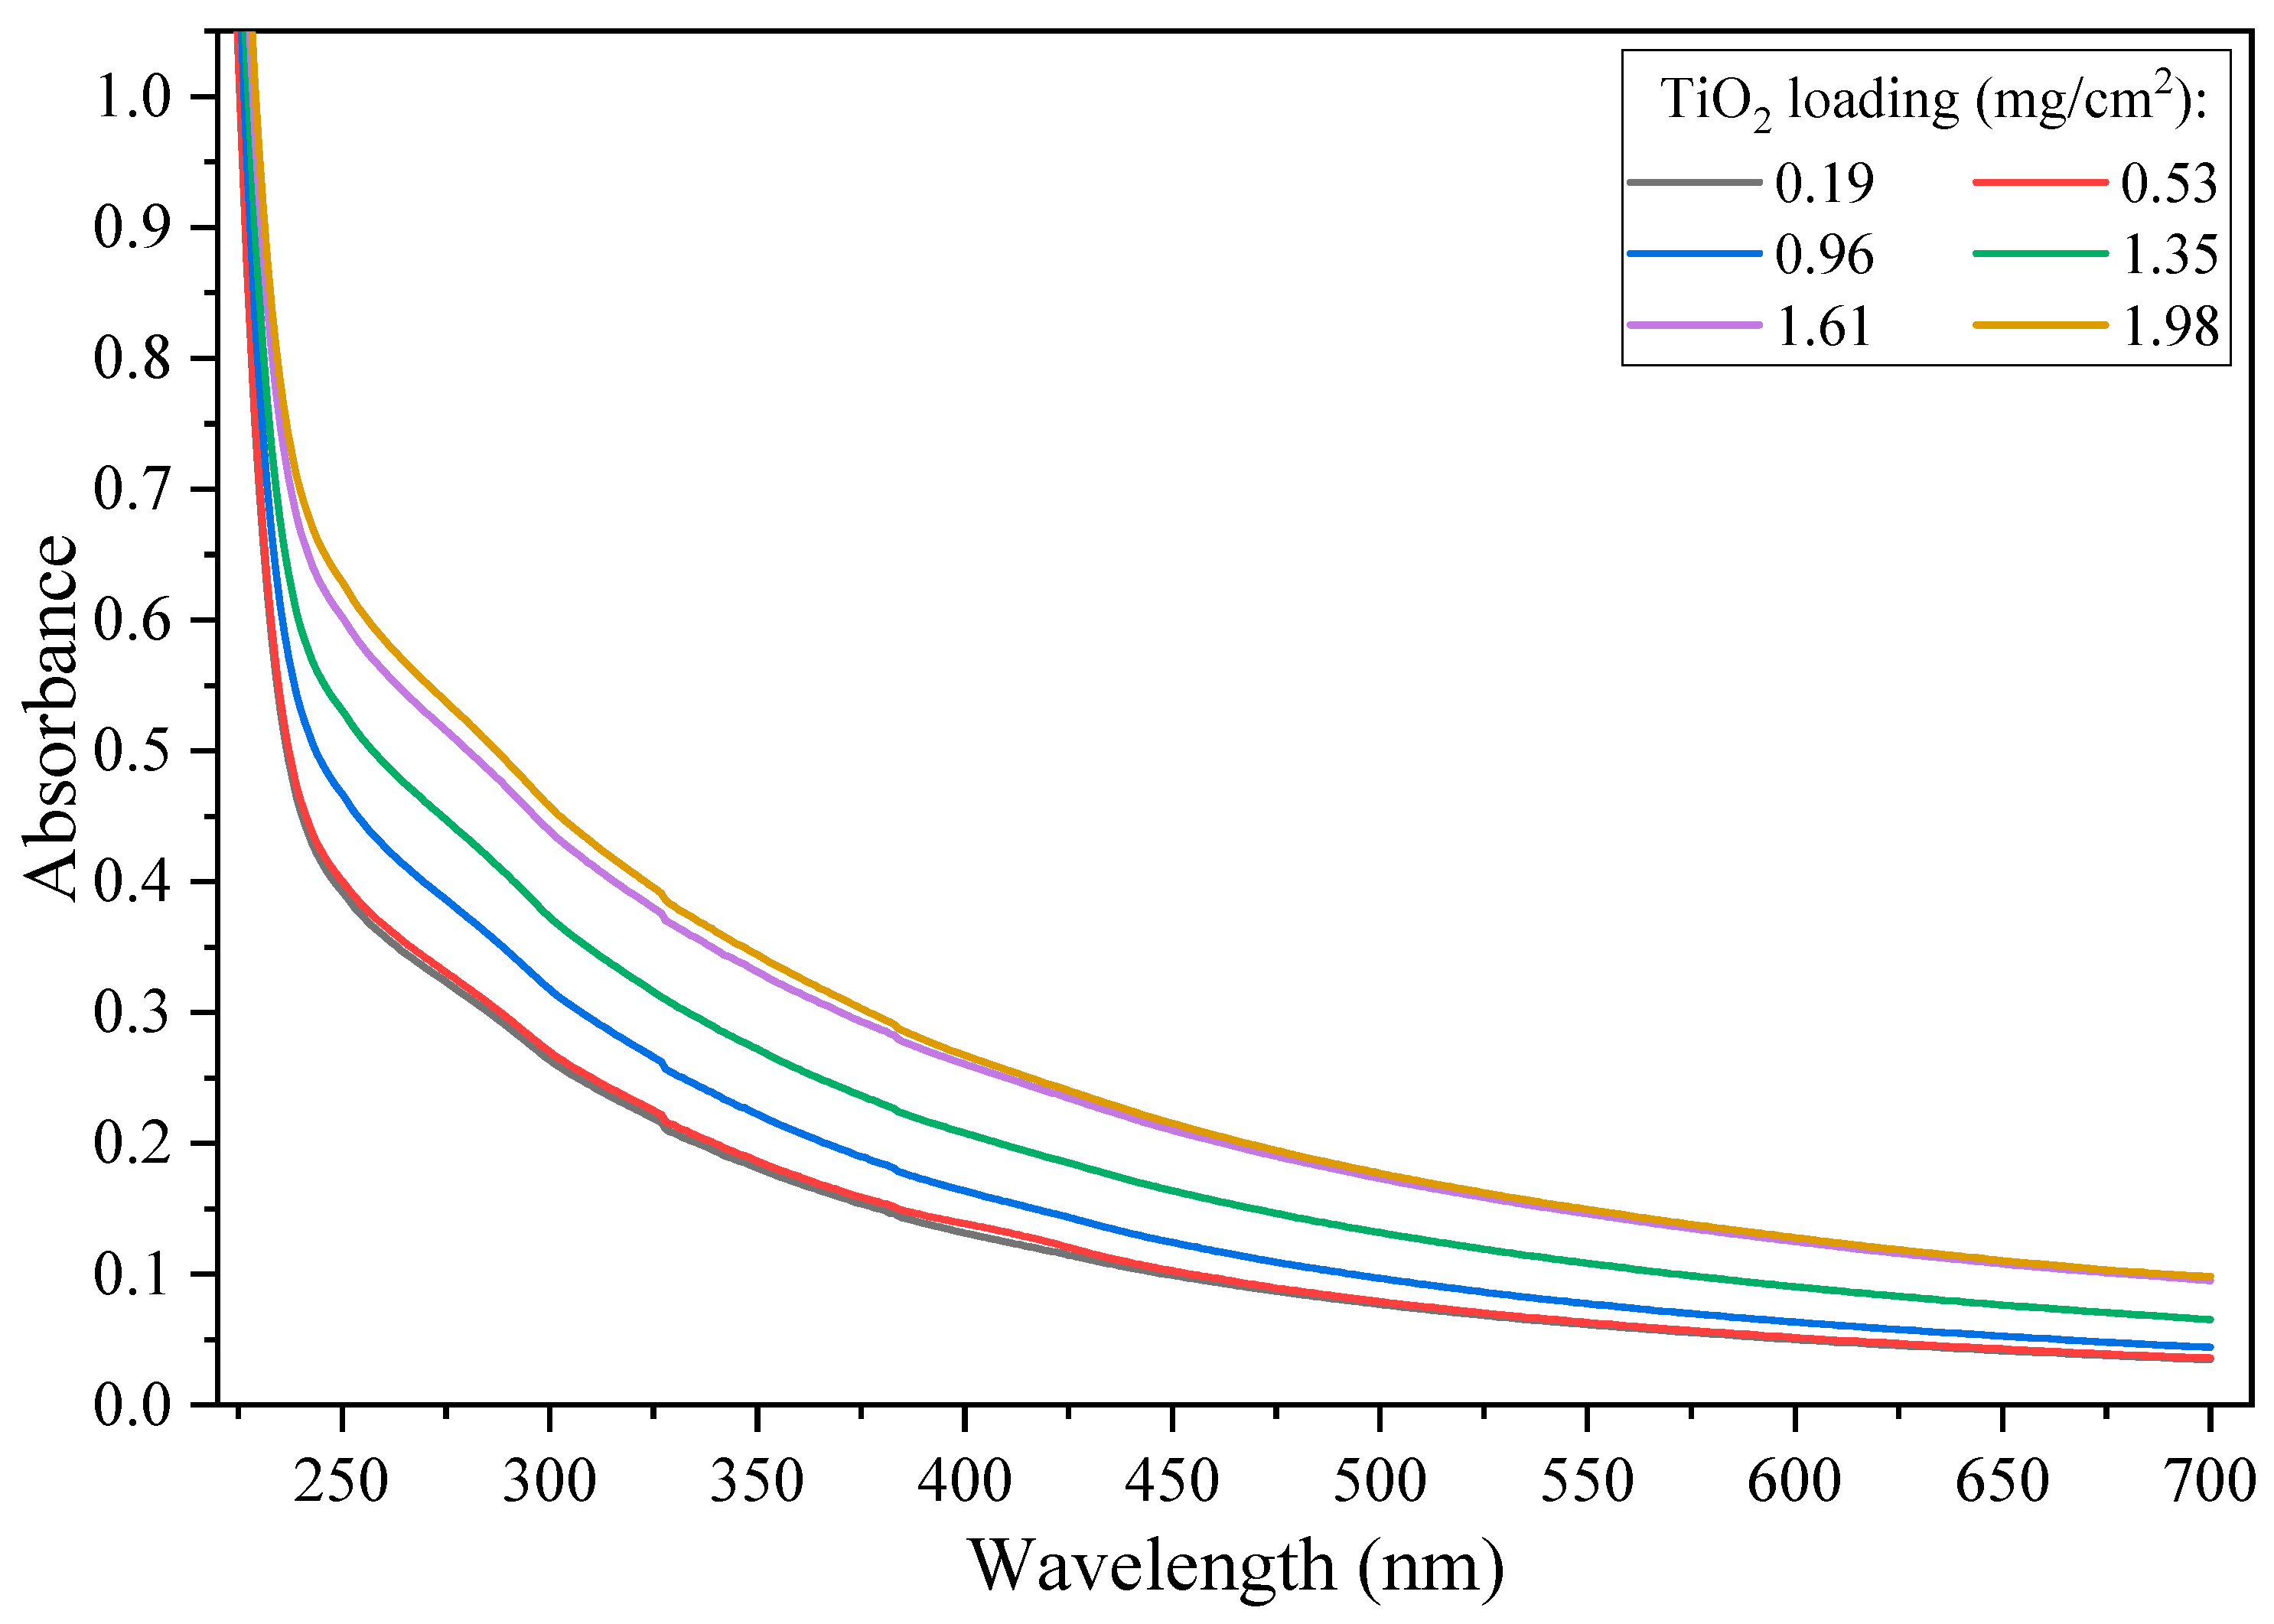
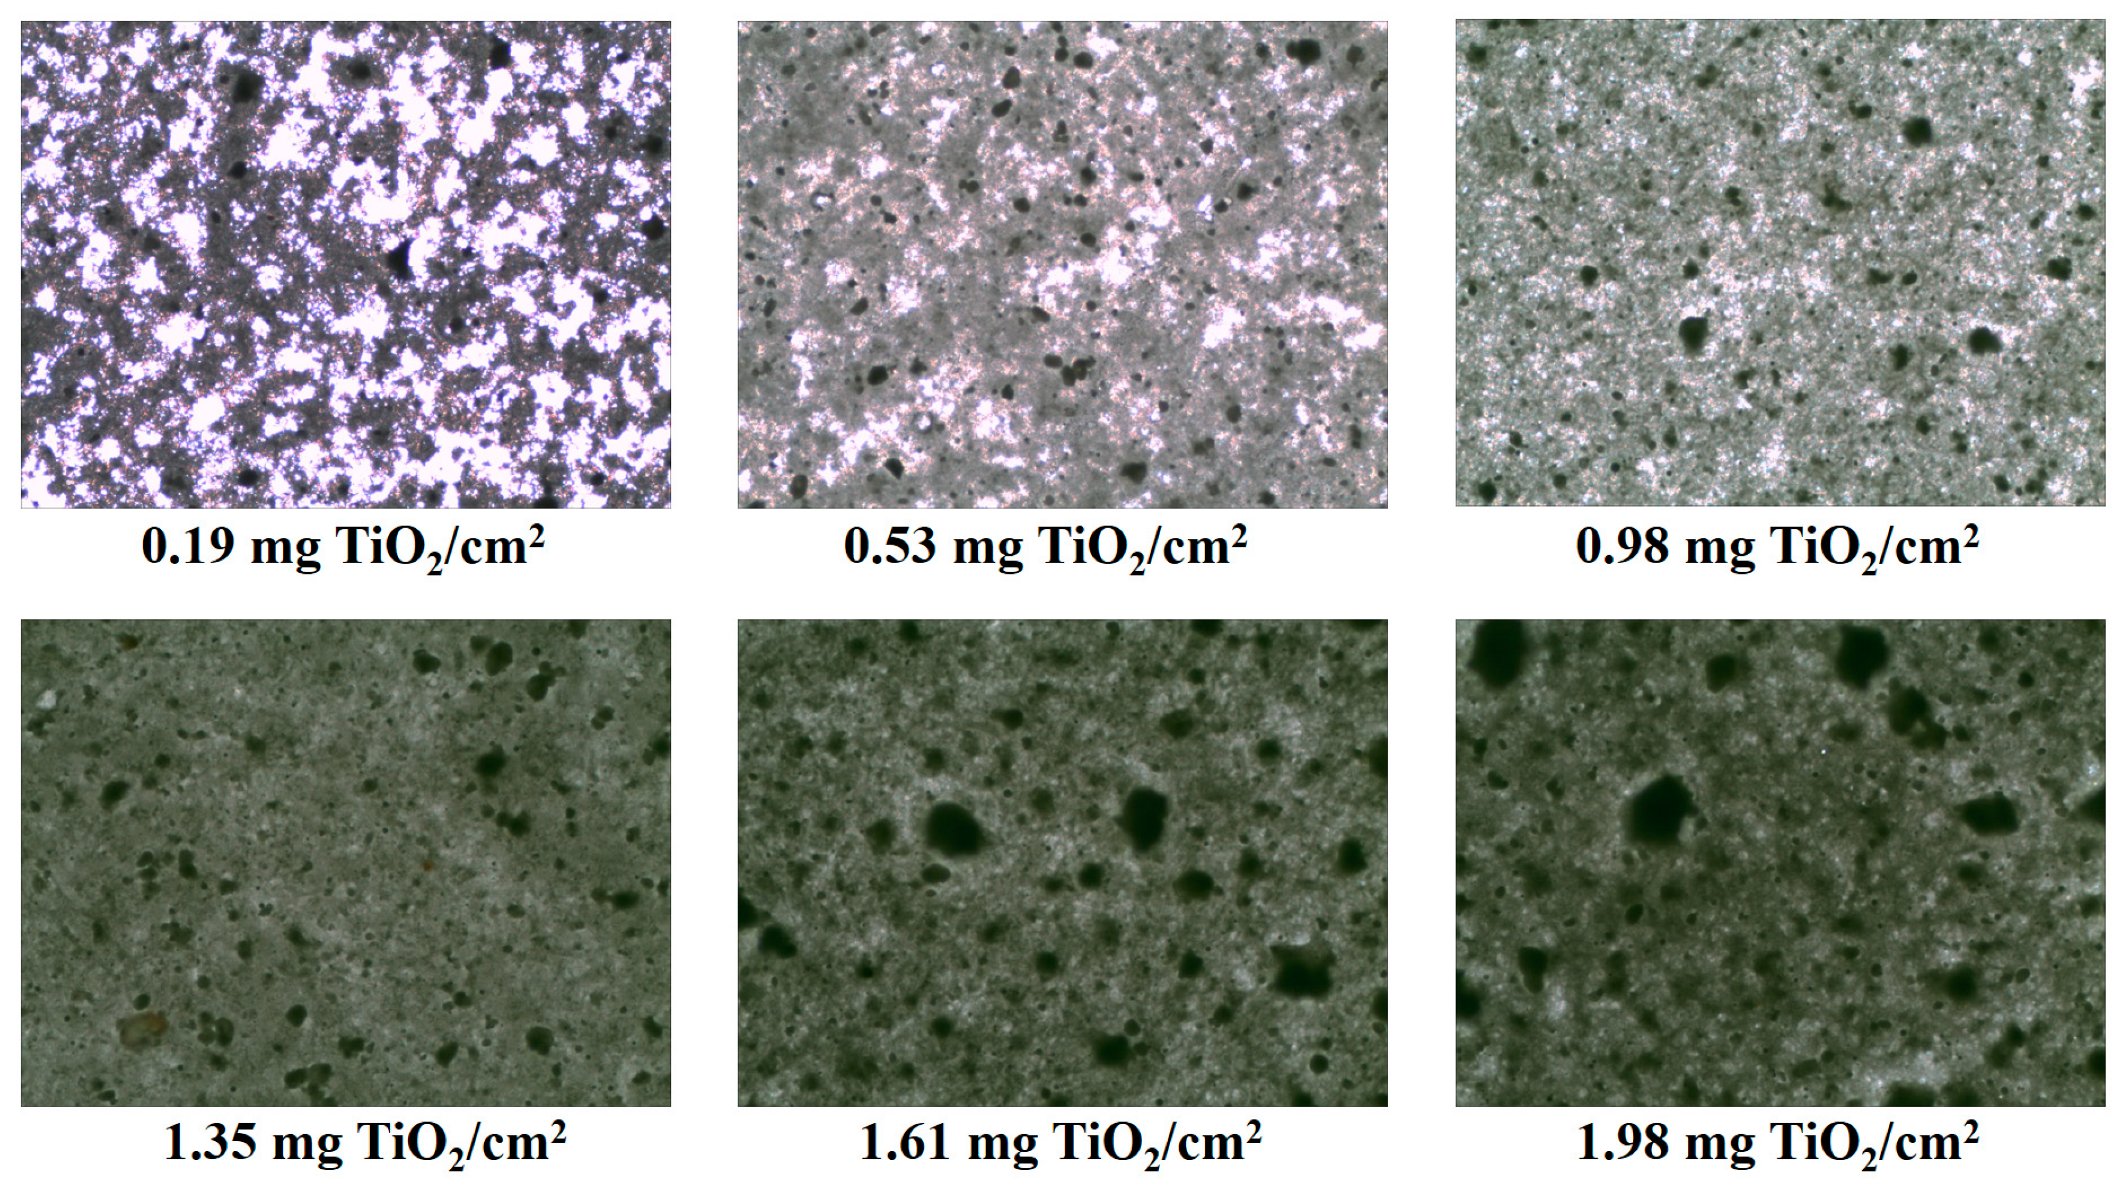
2.5. TiO2 Immobilization

Borosilicate glass plates (135 × 135 mm) were cleaned by sonication in hot water with detergent for 30 min and thrice rinsed in distilled water before drying and weighing. A (5% w/v) suspension of TiO2 in methanol was prepared and sonicated for 30 min before coating the glass substrates. The catalyst suspension was sprayed over the cleaned borosilicate glass plates at a fixed spraying rate using compressed air (Jialile Air Compressor, 0.8 MPa). The films were dried during the spray coating process using an IR lamp (A I.R.R OSRAM infrared lamp, 275 watts). Once coated with the desired loading, plates were annealed at 450 °C for 1 hour in the furnace (Stuart Muffle Furnace, SF7/s model) to achieve cohesion and adhesion of the particles and then allowed to naturally cool to ambient temperature. TiO2 powder was observed to be uniformly coated across the surface of the glass plate (supplementary materials Figure S1). With respect to mechanical strength, powder was not removed from the surface following use in the STR, but could be removed by low levels of direct mechanical force (such as a scratch with a soft pencil or press/rub of a finger). We have previously reported that such annealed films are highly fractured at micron scale, with the porous nature giving rise to an increase in the surface area available for the reaction [30]. The catalyst loading was determined gravimetrically by considering the weight difference and the coated area. Six representatives coated plates with catalyst loadings of 0.19 to 1.98 mg TiO2/cm2 were used in the experiments. The coated films were characterized by measuring the absorbance over the range of 200–700 nm of the coated films (Lambda 11 UV-vis spectrophotometer; Perkin Elmer, USA) with films examined visually (Eclipse polarizing microscope Nikon, LV100 POL).

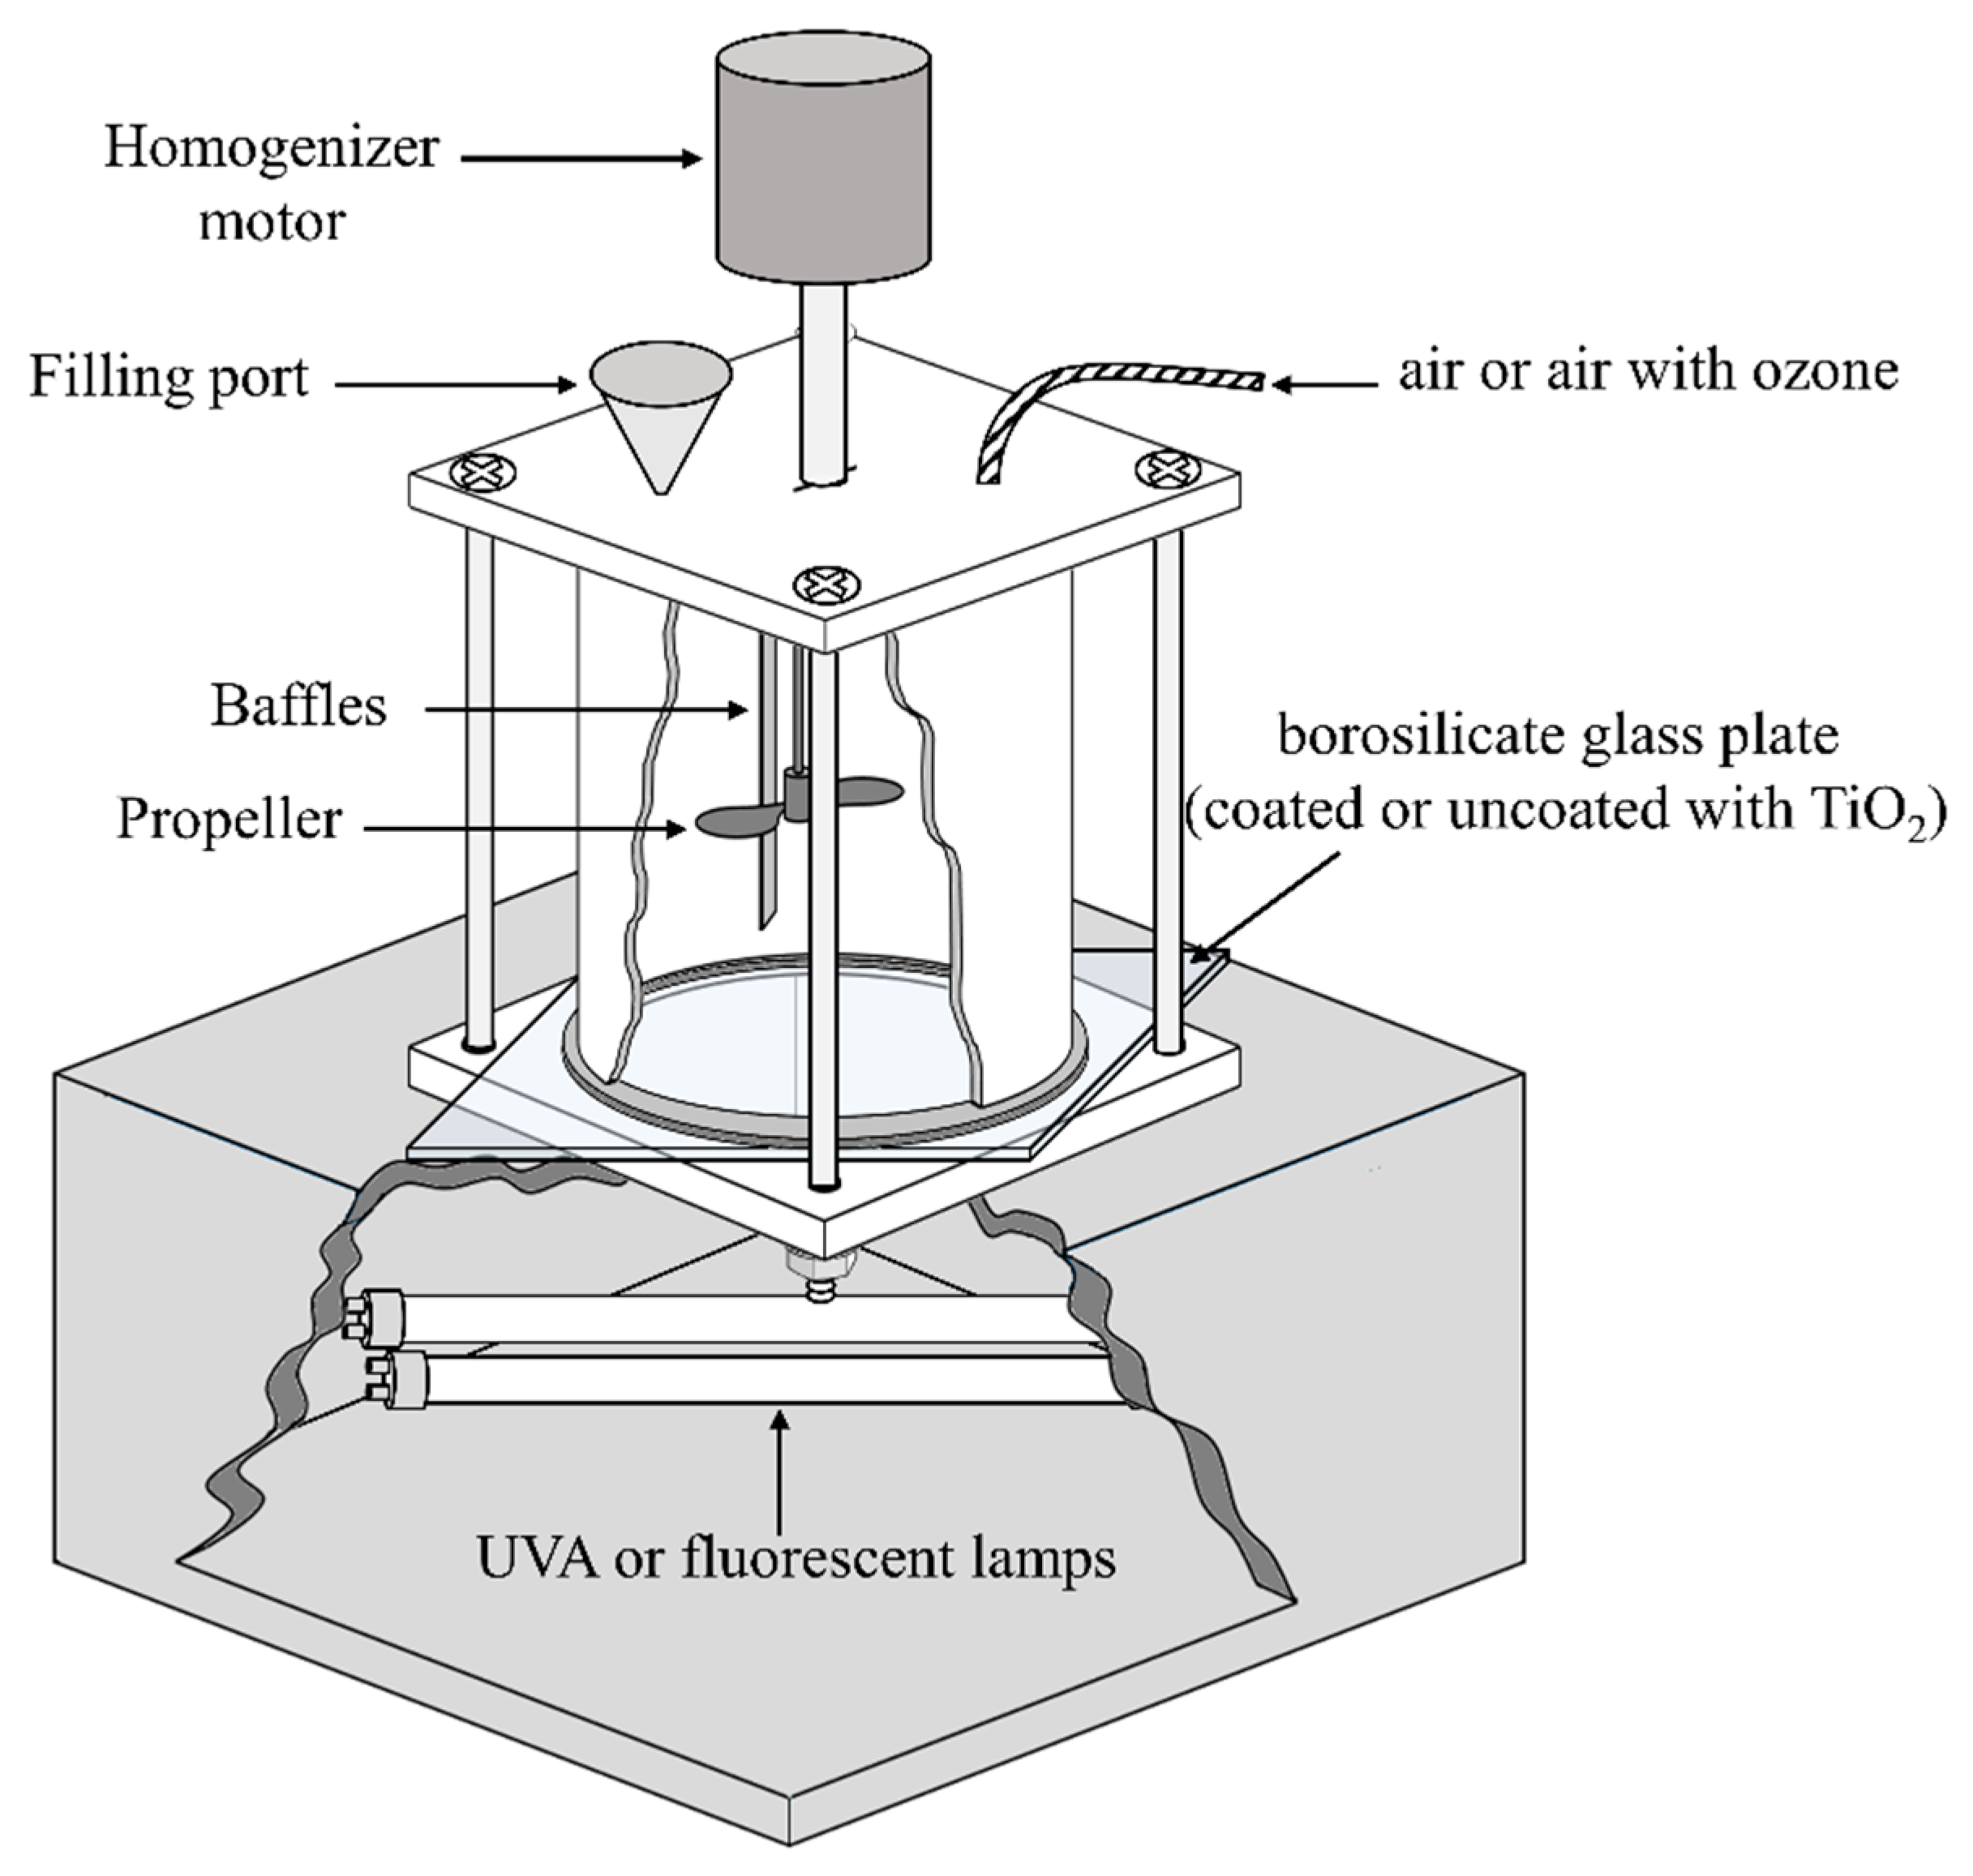
2.6. Stirred Tank Reactor

Experiments were performed using a custom-built stirred tank reactor (STR) based on a previous study [12], as shown in Figure 1 and specifications reported in Table 2. The STR was made from food-grade stainless steel (Type 304) in the form of an open-top-bottom cylinder (Figure S1a) with baffles on the side walls. The bottom of the cylinder was fastened to a borosilicate glass plate (Figure S1b), either coated or uncoated with TiO2, to form the reactor chamber. A stainless steel propeller driven at 2000 rpm by variable speed overhead homogenizer motor (JJ-1 electrical stirrer, Zhengzhou Boke Instrument Equipment Co., Ltd.) was used to achieve optimal mixing conditions during experiments. For experiments under illumination, the STR was illuminated from below using two 11W UVA lamps (Actinic BL TL 11W/10, Philips lamp, Holland) or two 11W fluorescent lamps (MASTER PL-S 11W/840/4P 1CT, Philips Lamps, Holland) positioned in a wooden box with an air fan for cooling. Details of the spectral output of the lamps are shown in Figure S2.

2.7. Experiments Operating Conditions

Depending on the purpose of the experiments, a coated or uncoated borosilicate glass plate was fastened to the bottom of the reactor. For experiments with the TiO2, coated borosilicate glass plates with different TiO2 loadings were used. Air or air with ozone was continuously bubbled into the reactor from an ozone generator (OZ-3G, Ozonefac Ltd., China) that has a constant air flow rate at 5 L/min and a variable ozone flow rate. Hydrogen peroxide was added as a single dosage to the greywater at the beginning of each experiment with different concentrations. All experiments were carried out for three hours, and samples (8 mL) were periodically withdrawn using a syringe for TOC analysis. Table 3 describes the systematic approach to the experimental conditions.

2.8. Calculations

TOC percentage removal was calculated as follows Equation (1)
T O C   removal   % = 100 × T O C 0 T O C T O C 0
where the (0) notation represents the initially measured values before the treatment.
The kinetics of TOC reduction were fitted using the pseudo-first-order rate equation as follows Equation (2) [31]
d ( T O C ) d t = k ( T O C ) l n ( T O C ) ( T O C ) 0 = k t
where k represents the apparent rate constant (min−1) and t the time (min).
For H2O2 with TiO2 experiments, the H2O2 dosage was calculated according to the H2O2/TiO2 molar ratio as follows Equation (3)
H 2 O 2 dosage ( mg L ) = Ti O 2 loading ( mg cm 2 ) × irradiated area ( cm 2 ) × H 2 O 2 Ti O 2 molar ratio × H 2 O 2 molar mass Ti O 2 molar mass × reactor water volume ( L )
For H2O2 with O3 experiments, the H2O2 dosage was calculated according to H2O2/O3 molar ratio as follows Equation (4)
H 2 O 2 dosage ( mg L ) = O 3 flow rate ( mg min ) × experiment time ( min ) × H 2 O 2 O 3 molar ratio × H 2 O 2 molar mass O 3 molar mass × reactor water volume ( L )

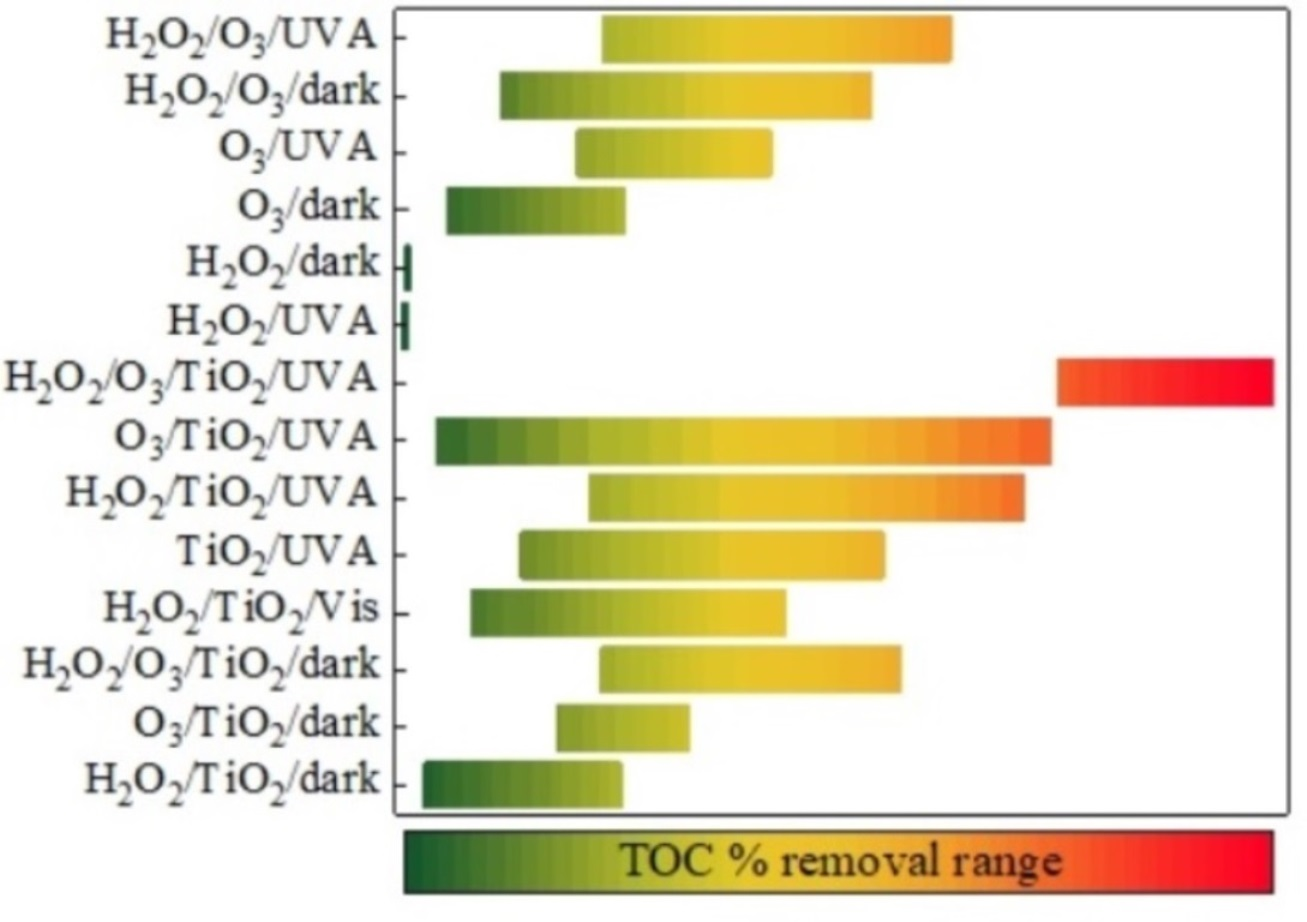
3. Results and Discussion

3.1. Control Experiments

In the control experiments, GW was stirred for three hours under different conditions to examine the TOC removal by aeration alone, direct photolysis (UVA with and without aeration), and adsorption of organics onto the TiO2 coated films in the dark (using catalyst loading 0.19–1.98 mg TiO2/cm2, with and without aeration). In all controls, the TOC reduction reached a maximum of 3%, with results implemented on the related figures throughout the paper. A 2% TOC reduction was observed in the aeration control, indicating a low fraction of volatile organic compounds in GW samples being collected and transported to the lab. Direct photolysis reduced the sample TOC by 2.3% and 1.3%, with and without aeration, respectively, which was attributed to the low energy of UVA photons and/or low concentration of natural photosensitizers in the GW limiting reactive oxygen species (ROS) production [32]. Whilst direct photolysis may cause different structural and chemical changes to the organic compounds in water, no significant reduction in organic content is commonly reported [33,34]. This trend has been reported with a range of different water sources and specifically for GW, with Chin et al. [33] reporting negligible COD reduction by direct photolysis using a photoreactor fitted with a higher intensity UV source (two 15 W UVC lamps). Similarly, Gulyas et al. [35] reported negligible TOC removal using UVA irradiation of biologically treated GW in the absence of a photocatalyst. The adsorption of organics onto the TiO2 films, regardless of the catalyst loading, was not observed (<1.0% TOC reduction). Organic adsorption onto the catalytic surface is regarded as one of the critical parameters for efficient catalytic and photocatalytic treatment [36], which could perhaps be a limitation within the STR system.

3.2. TiO2 Photocatalysis

The photocatalytic efficiency as a function of catalyst loading (0.19 to 1.98 mg TiO2/cm2) was examined under UVA illumination with aeration at a flowrate of 5 L/min (Figure 2). For all catalyst loadings, mineralization was observed to increase as a function of treatment time; no plateau was reached. The photocatalytic degradation kinetics followed a pseudo-first-order model [37] with good correlation between l n   ( T O C / T O C 0 ) and time (R2 ≥ 0.95). The maximum percentage TOC removal and apparent pseudo-first kinetic rate constants (k) for photocatalytic treatment using different catalyst loadings are depicted in Table 4. An optimal catalyst loading, at which the maximum TOC reduction (≈31%) and the highest apparent rate constant (22.10 × 10⁻⁴ min−1) was achieved, was 0.96 mg TiO2/cm2 (Figure 2 and Table 4). Above the optimal catalyst loading, the TOC removal reduced, as is commonly reported, due to screening of the photons by the increased immobilized catalyst mass [16,19], or the presence of unirradiated layers of photocatalyst [38].
The reduction in TOC content can be attributed to the photocatalytic generation of ROS [39]. The photocatalysis mechanism is widely explained in the literature [40], but, in summary, when a semiconductor such as titanium dioxide is illuminated by a light of energy ( h v ) greater than or equal to the band gap energy ( E g a p ) electrons are excited to the conduction band ( C B ), leaving a positive hole in valance band ( V B ) Equation (5) [41].
T i O 2 + h ν e ( C B ) + h + ( V B )
Electron–hole pairs can migrate to the catalyst surface, where they either recombine or participate directly in the oxidation of or reduction in pollutants and assist in the production of the very reactive hydroxyl radical ( O H ) and other reactive oxygen species (ROS) such as superoxide radical anions ( O 2 ) and hydroperoxyl radicals ( H O 2 ) Equations (6)–(10) [39]
h + ( V B ) + H 2 O O H + H +
h + ( V B ) + O H O H
e ( C B ) + O 2 O 2
e ( C B ) + O 2 + H + H O 2
H O 2 H 2 O 2 + O 2
When using back-face illumination of immobilized TiO2 films, increased catalyst loading (TiO2 film thickness) to the optimal loading increases photon absorption, and as such increased the concentration of generated ROS [12,19]. The ability of ROS to migrate to the water–catalyst interface also plays a critical role in the production of an efficient immobilized system [12]. For thick films, mass transfer of the generated ROS to the catalyst–water interface is often an issue [42,43]. As can be seen in Figure 3, an increase in absorbance was observed as a function of catalyst loading; however, the system does not consider scattering losses [44].

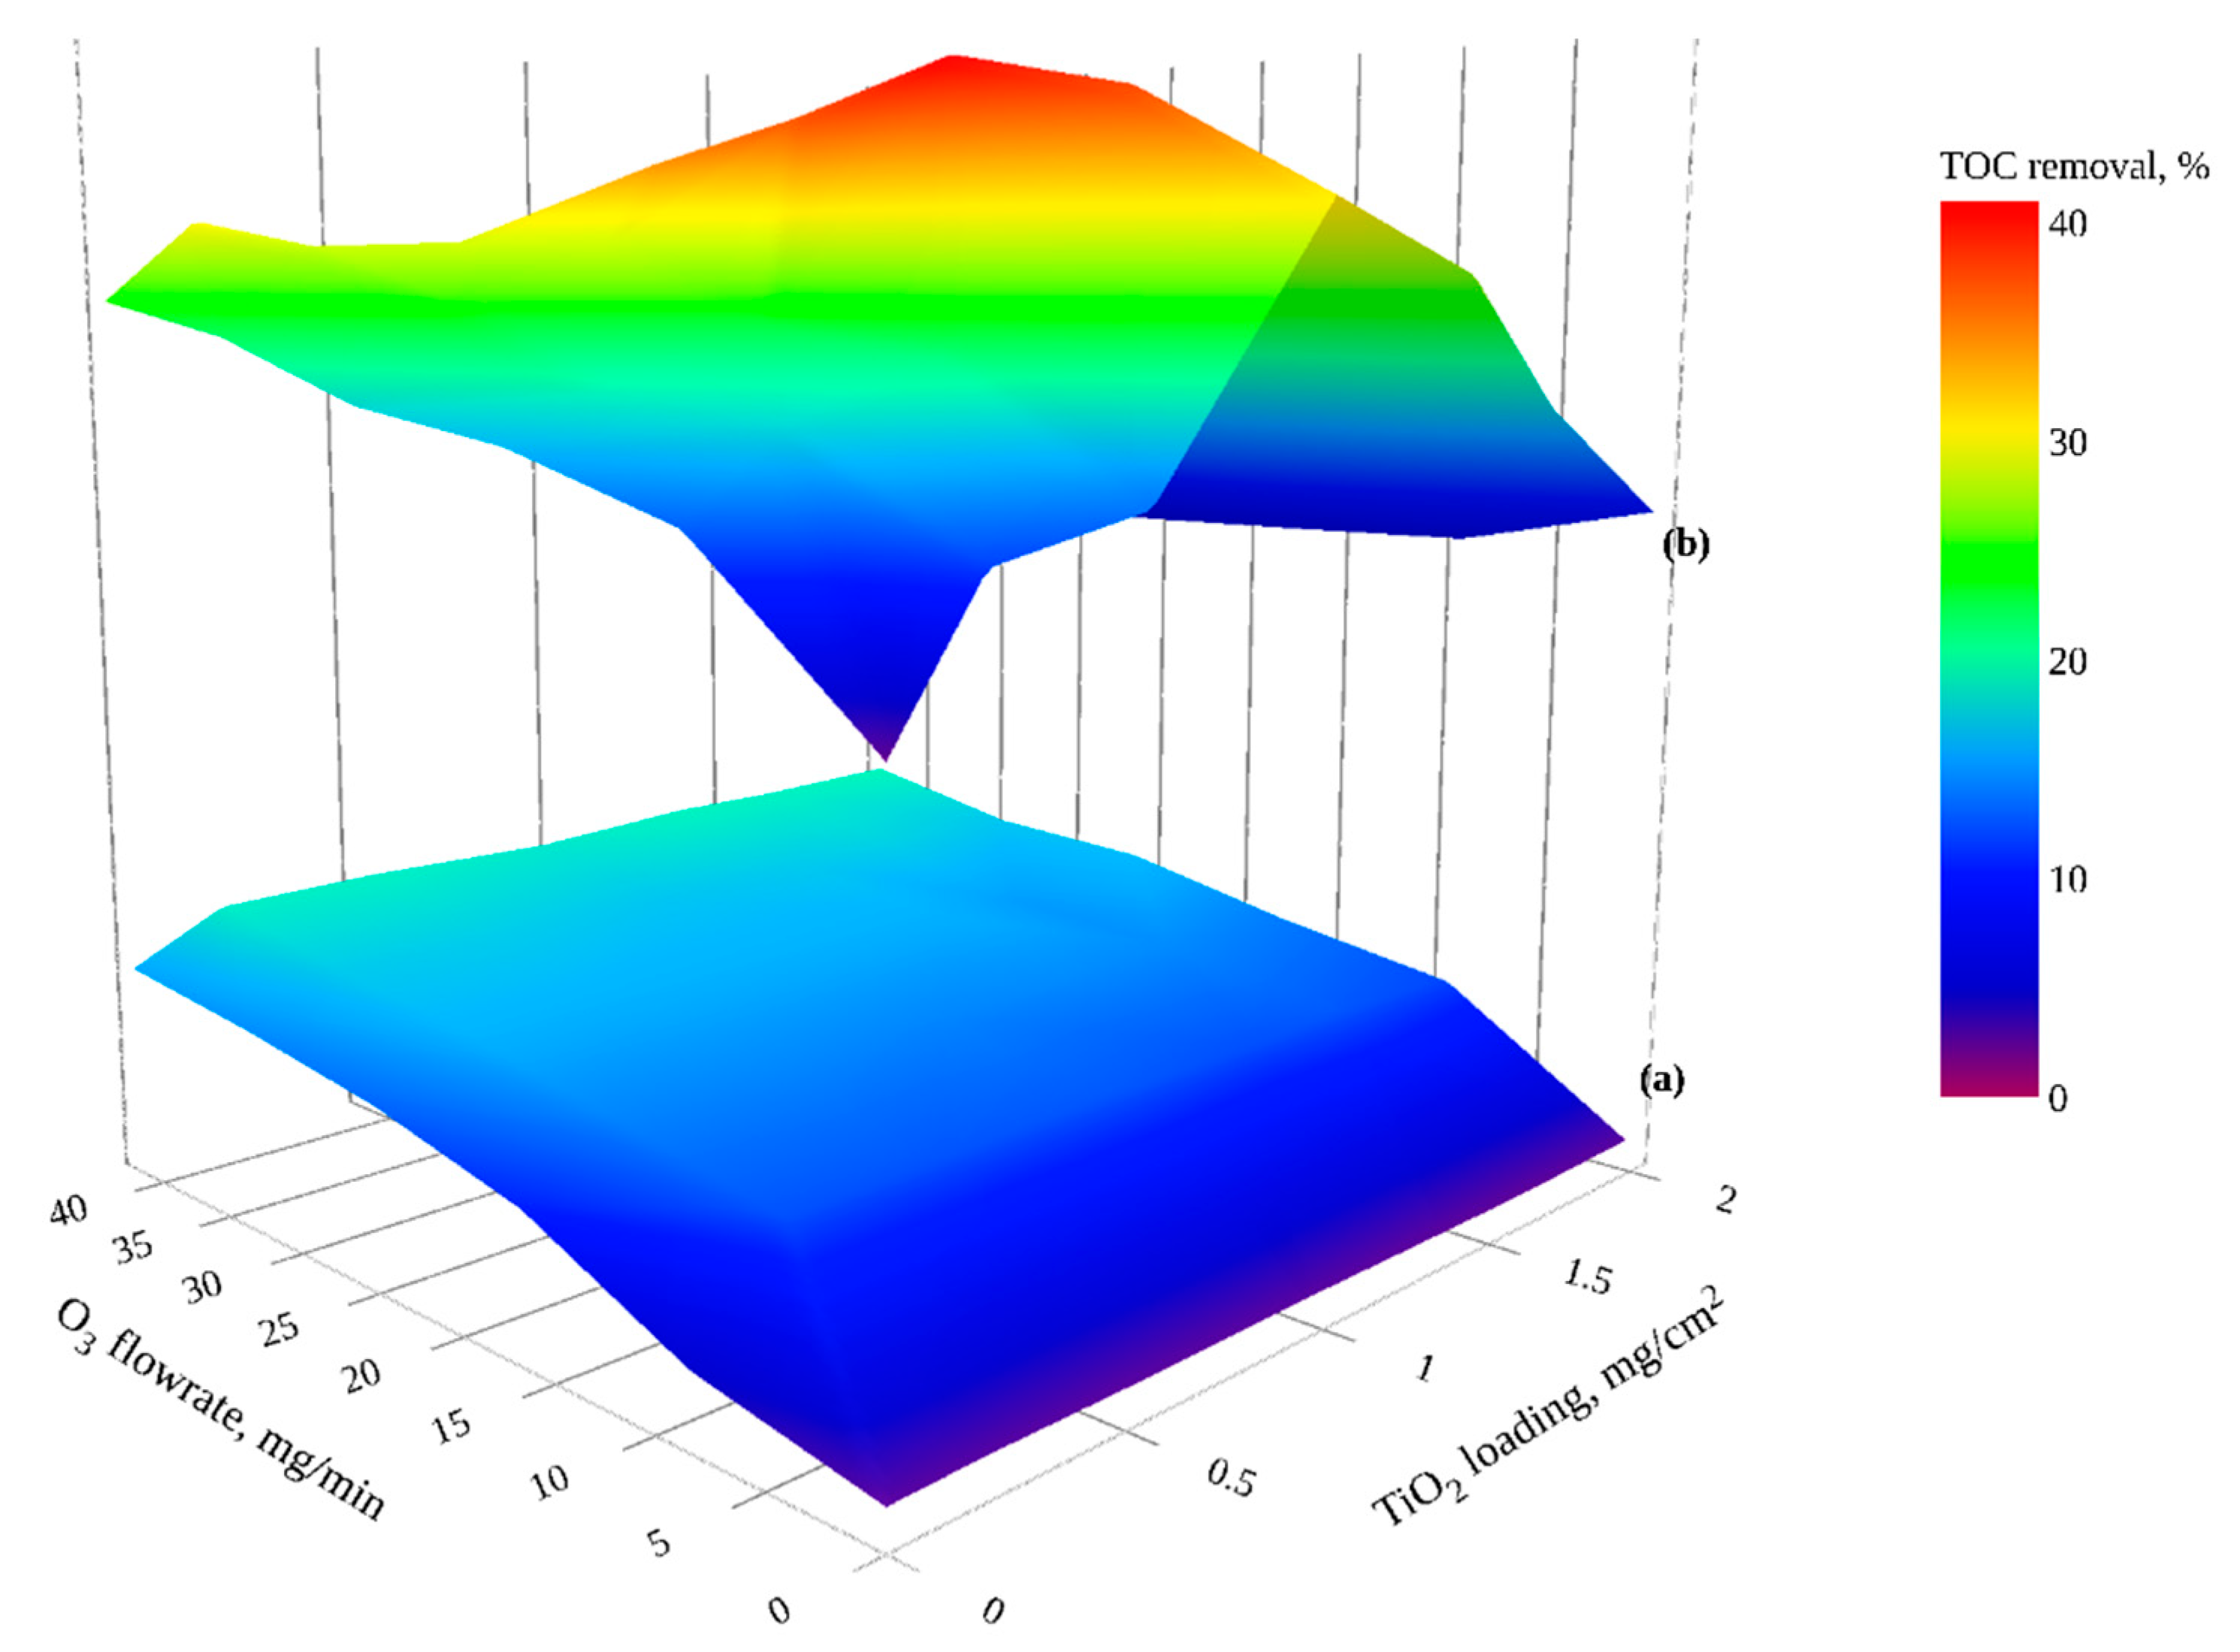
3.3. O3/dark, O3/TiO2/dark, O3/UVA and O3/TiO2/UVA

TOC reduction by ozonation (O3/dark), catalytic ozonation (O3/TiO2/dark), ozone photolysis (O3/UVA) and photocatalytic ozonation (O3/TiO2/UVA) was investigated using different combinations of ozone flowrates (0–41.7 mg O3/min ozone) with several TiO2 loadings (0–1.98 mg TiO2/cm2) in the dark and under UVA illumination (Figure 4).

3.3.1. Ozonation and Catalytic Ozonation

Ozonation alone (Figure 4a: 0 mg TiO2/cm2) resulted in significant TOC reduction (maximum of 16% with an ozone flow rate of 41.7 mg O3/min). Ozone has a high oxidation potential and can attack organic compounds directly, however, mineralization (and therefore TOC reduction) is mainly reported to result from ozone decomposition into hydroxyl radicals [36,45] as described by [46] and references there in Equations (11)–(14)
3 O 3 + O H O H +   O 3   + 3 O 2
If   pH   <     8      O 3 + H + H O 3 O H   + O 2
If   pH   >     8     O 3 O   + O 2
O + H 2 O O H   + O H
According to the literature, an inhibitory effect is often observed with high doses of ozone [5,47], where excess ozone reacts with the hydroxyl radicals and produces the less reactive hydroperoxyl radicals [48], (Equation (15) [5]).
O 3   +   O H H O 2   + O 2
As shown in Figure 4a, catalytic ozonation (O3/TiO2/dark) enhanced TOC removal compared to ozonation alone as previously observed in a range of water sources [49,50]. The maximum TOC removal observed was ≈19.5%, with an ozone flow rate of 41.7 mg O3/min and 1.98 mg/cm2 TiO2 loading. Unfortunately, regardless of the expansive list of the catalysts reported to enhance ozonation, the underpinning mechanisms are not well understood [21,22]. The generally proposed mechanism involves either the chemisorption of ozone or organic molecules or both on the catalyst surface, which may lead to either the formation of active species [36] or the formation of metal–organic complexes with higher reactivity toward molecular ozone [51]. In this work, no initial organic adsorption on the bare TiO2 was observed in the dark control experiment, however, the intermediates generated by direct ozone attack, known to transform organic compounds and functional groups into smaller molecular weight saturated species, could be adsorbed on the catalyst [45]. To investigate this hypothesis, dark adsorption experiments were carried out post-ozonation (at 41.7 mg O3/min) and post-catalytic-ozonation (41.7 mg O3/min and 1.98 mg TiO2/cm2) treatment (data not shown), with no change in TOC observed, contrary to reports by Garcia and coworkers [50]. As such, the mechanism described in Equations (16)–(19) relating to the chemisorption of ozone and subsequent formation of O H radicals on the TiO2 surface sites ( S ) is considered to be viable [22].
O H + S   O H S
O 3 + O H S   O 3 S +   O H
O 3 S     O S + O 2
O 3 + O S   O 2 +   S + O 2
Although catalytic ozonation enhanced the treatment efficiency compared to ozonation alone, increasing the catalyst loading to greater than the lowest used value (0.19 mg TiO2/cm2) resulted in minor increases in TOC removal. According to Ikhlaq et al. [21], this behavior implies that the catalyst acts as an adsorbent for the ozone and does not initiate the formation of ROS. Ma and Graham [52] also reported a low increase in enhancement for homogenous catalytic ozonation of atrazine using a Mn(II) based catalysts. Further work is required to identify the mesoporous nature of the immobilized TiO2 to aid in the design of a high catalytically active surface area.

3.3.2. Ozone Photolysis and Photocatalytic Ozonation

Ozone photolysis (Figure 4b: 0 mg TiO2/cm2) was more effective in reducing the organic content of GW in comparison to the dark scenario (Figure 4a) (removal maximum of 24% with an ozone flow rate of 41.7 mg O3/min). This effectiveness is attributed to ozone’s ability to absorb photons between 200 and 360 nm [53], and generate hydroxyl radicals Equation (20) [53,54].
O 3 + H 2 O h v   2   O H + O 2
In the photocatalytic ozonation experiments (Figure 4b), increasing the ozone flowrate did not exhibit an increased mineralization as a function of catalyst loading; (i) for the lowest catalyst loading (0.19 mg TiO2/cm2), TOC removal increased with increasing the ozone flowrate, (ii) for the middle range catalyst loading (0.53–1.35 mg TiO2/cm2), TOC removal increased to a maximum, then decreased, and (iii) for high catalyst loading (1.61 and 1.98 mg TiO2/cm2) ozone showed an inhibitory effect, as explained within within Equation (15) and supporting text.
In addition to the ozone and photocatalytic degradation mechanisms explained above, Wang et al. [55] and Agustina et al. [18] suggested that ozone could be adsorbed on TiO2 surfaces during photocatalytic ozonation reacting with photogenerated electrons Equations (21) and (22) to reduce charge carrier recombination at the catalyst surface, and, as such, result in the increased production of hydroxyl radicals. Moreover, the resultant generation of the ozonide radical ( O 3 ) could play a further role in degradation mechanism.
O 3 ( a d s ) + e     O 3 ( a d s )
We postulate that for low catalyst loadings, increasing ozone flowrate boosts organic degradation through generation of additional hydroxyl radicals via ozone decomposition, ozone photolysis, and catalytic ozonation. For higher catalyst loading, a smaller UVA photon flux penetrates through the TiO2 film, as can be observed from the brightness of the microscope images of the coated TiO2 films (Figure 5), hence the hydroxyl radical concentration generated from ozone photolysis was decreased. Similarly, reduced ozone decomposition by photolysis results in additional ozone being available for hydroxyl radicals scavenging [5,48] and, when coupled with increasing ozone flow rate, reduces efficiency.

3.4. H2O2/dark and H2O2/UVA

TOC reduction by peroxidation (H2O2/dark) and photo-peroxidation (H2O2/dark) was investigated across a range of H2O2 dosages (1.45–53.01 mg/L). The sole use of hydrogen peroxide with or without exposure to UVA resulted in less than a 2.7% reduction in TOC (data not shown).
Lamsal, Walsh and Gagon [56] observed a similar effect with the low oxidation potential of H2O2 [54] and the absence of hydroxyl radicals, attributed to low rates of mineralization [57]. Although hydrogen peroxide can be activated by UV photons to generate hydroxyl radicals [29], wavelengths below 280 nm are required for H2O2 decomposition [54]—much higher energy photons than the UVA lamps employed in this study [48].

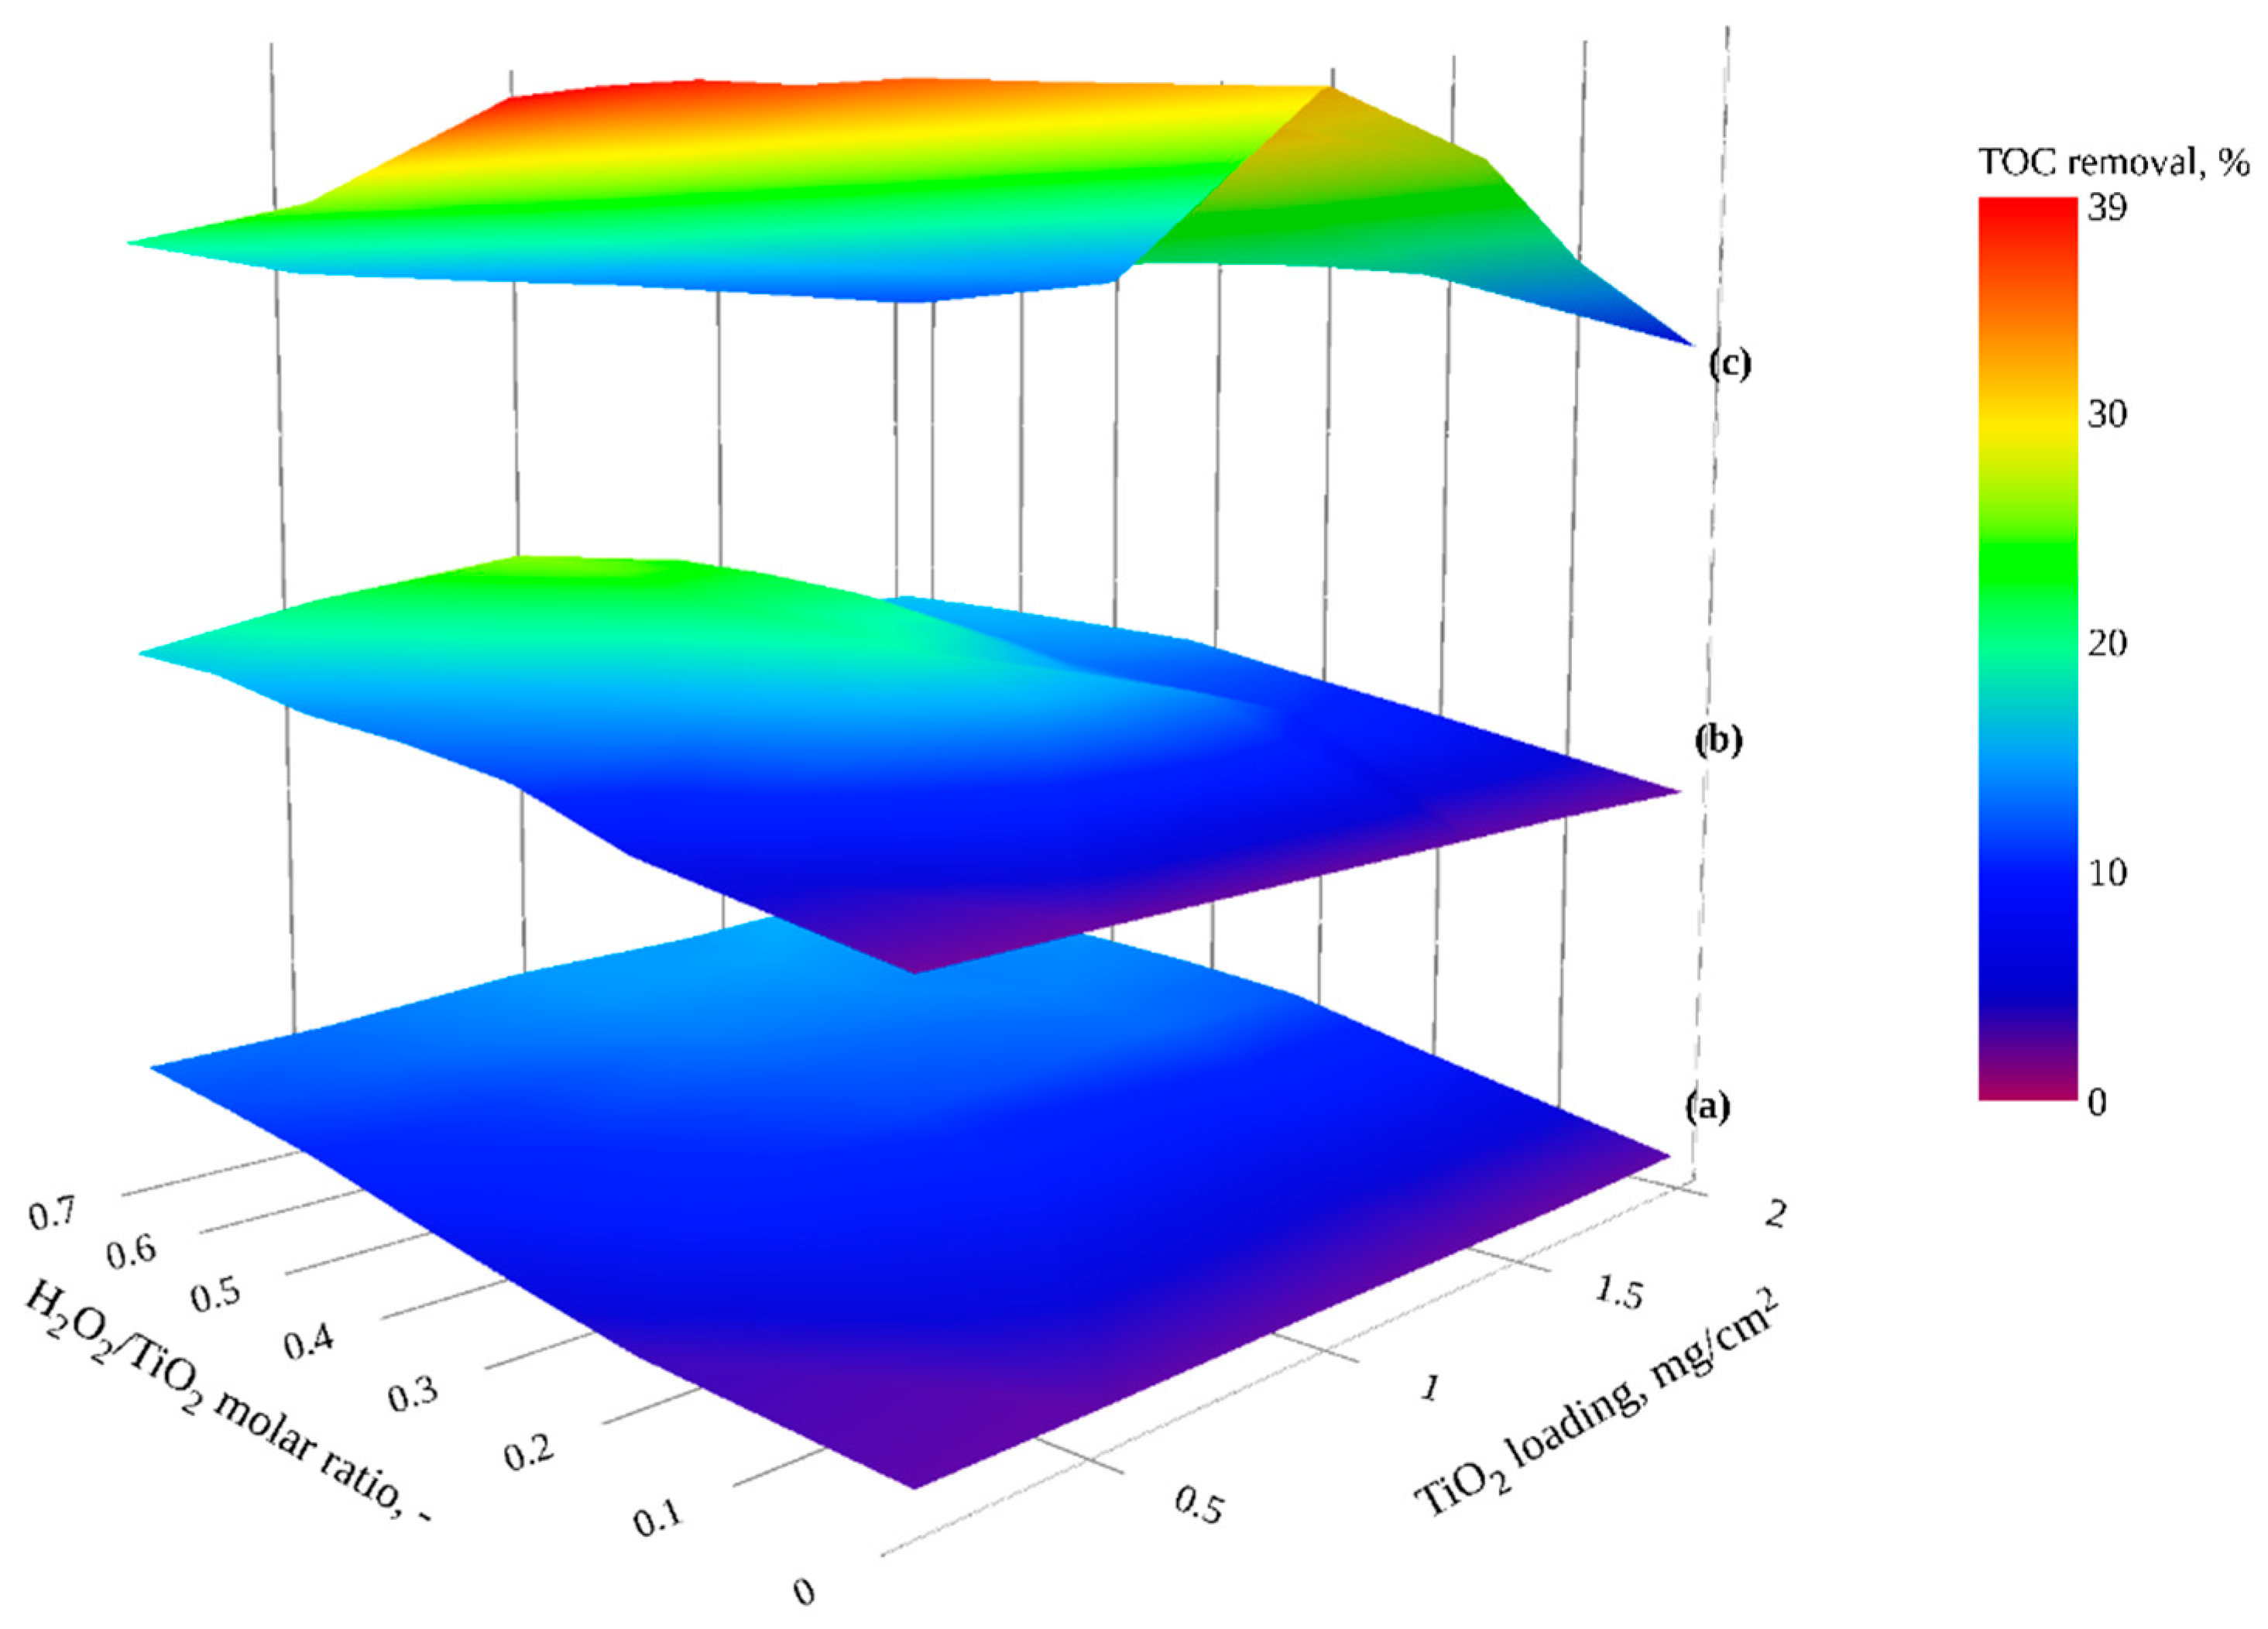
3.5. H2O2 Combined with TiO2 in the Dark, under Visible and UVA Irradiation

Figure 6 shows TOC reduction by H2O2 combined with TiO2 investigated under different irradiation conditions (dark, visible and UVA) using a range of catalyst loadings (0.19–1.98 mg TiO2/cm2) and H2O2 dosages (1.45–53.01 mg/L). In those experiments, H2O2/TiO2 molar ratios (0.0–0.7) were adopted from the H2O2 to O3 ratios used in peroxonation (H2O2/O3) studies [14,54,58] specifically to prevent excess H2O2 hindering treatment efficiency [59].

3.5.1. H2O2/TiO2 under Dark Conditions

Figure 6a shows that TOC reduction was significantly enhanced through the combination of TiO2 with H2O2 in the dark (H2O2/TiO2/dark) in comparison to H2O2-peroxidation (H2O2/dark) treatment, via the generation of hydroxyl and superoxide/hydroperoxyl radical catalyzing peroxide decomposition at TiO2 surface (Equation 23) [60].
H 2 O 2 + H 2 O T i O 2 O H + O 2 / H O 2
This synergistic effect has been documented in several studies [24,60,61], where reactive oxygen species (ROS) were detected in dark hydrogen peroxide/titanium dioxide suspensions. Janson et al. [25] reported an 11% decrease in the concentration of rhodamine B using 0.5 g/L mixture of Anatase and Rutile particles with 1.9 M H2O2 in the dark compared to less than 2% reduction with H2O2 alone.
For the studied catalyst loadings (0.19–1.98 mg TiO2/cm2), a greater TOC removal percentage was observed with increasing H2O2/TiO2 molar ratio. The TOC removal at the highest molar ratio (0.7) were comparable and ranged from 12.25% at 0.19 mg TiO2/cm2 to 15.42% at 1.98 mg TiO2/cm2. For catalyst loading greater than 0.98 mg TiO2/cm2 and an H2O2/TiO2 molar ratio greater than 0.3, a plateau in TOC reduction was observed (Figure 6a). Sánchez et al. [24] described similar behavior by an apparent saturation of the TiO2 sites at high molar ratios; additionally, scavenging of free radicals by H2O2 (Equation 24) could play a role [23,57].
H 2 O 2 + O H H O 2 + H 2 O

3.5.2. H2O2/TiO2 under Visible Irradiation

Figure 6b shows an increase in TOC reduction through irradiation of the H2O2/TiO2 system using visible radiation (H2O2/TiO2/Vis). Increased TOC removal was observed as a function of H2O2/TiO2 molar ratio. The maximum TOC removal was ≈ 25% with a catalyst loading of 0.98 mg TiO2/cm2 and 0.7 H2O2/TiO2 molar ratio. In the work of Liu et al. [26], methylene blue (MB) degradation was found to be enhanced by increasing H2O2 to TiO2 molar ratio under visible light irradiation, with the authors describing that H2O2 was adsorbed onto the TiO2 surface, forming a peroxo-titania complex (> Ti-OOH) which can be photo-activated even under visible light according to Equation 25.
> Ti OOH v i s i b l e   l i g h t   > Ti + OOH + e
The reaction of photogenerated charge carriers with H2O2 results in enhanced hydroxyl radical production and reduces surface recombination Equations (26) and (27) [23,62].
H 2 O 2 + e O H + O H
H 2 O 2 + h + 2 O H
Whilst mineralization increased as a function of TiO2 loading, TOC removal at catalyst loadings of 1.61 and 1.98 mg TiO2/cm2 was not enhanced, potentially due to the saturation of the active sites and also the limited visible light penetration through the thick films [63], as demonstrated in Figure 5.

3.5.3. H2O2/TiO2 under UVA Irradiation

Figure 6c demonstrates the enhancement in mineralization through coupling H2O2 with TiO2 under UVA irradiation in comparison to either dark or visible irradiation conditions, with a 39.34% reduction in GW organics under catalyst loading of 0.98 mg TiO2/cm2 and a 0.7 H2O2/TiO2 molar ratio observed. The literature reports conflicting results with a similar enhancement under UVA irradiation observed by Jedsukontorn et al. [62] and Janson et al. [25], however, Beltrán and Rodríguez reported no increase in removal efficiency of their H2O2/TiO2 system under UV as opposed to visible light irradiation [64].
The efficiency enhancement for H2O2/TiO2 under UVA illumination is primarily due to additional ROS generated via a series of mechanisms, including the reactions described for H2O2/TiO2 in the dark/visible illumination, and other reaction pathways based on multi-phase transport mechanisms at the catalyst surface or in the solution. Additional reaction pathways include the generation of H O 2 and O H catalyzing peroxide decomposition at oxidized ( S + ) and the reduced ( S ) TiO2 surface sites Equations (28) and (29) [23], reaction of H2O2 with the photogenerated electrons and holes Equations (26) and (27) [23,62] or with superoxide radical ( O 2 ) reactions that can lead to the formation of O H radical and singlet oxygen ( O 1 2 ) Equations (30)–(33) [62].
S + + H 2 O 2 S + H + + H O 2
S + H 2 O 2 O H + O H
H 2 O 2 + O 2 O H + O H + O 2
O 2 + h + O 1 2
O 2 + O 2 + 2 H + H 2 O 2 + O 1 2
O 2 + H 2 O 2 O 1 2 + O H + O H
The effect of H2O2/TiO2 molar ratio was more significant at low catalyst loadings; at high catalyst loading, there was no measured enhancement. Similar findings have been reported by Sakkas et al. [63], who mainly attributed the effect to the radical scavenging [23,57] and the reduction in light penetration when higher catalyst loadings were used.

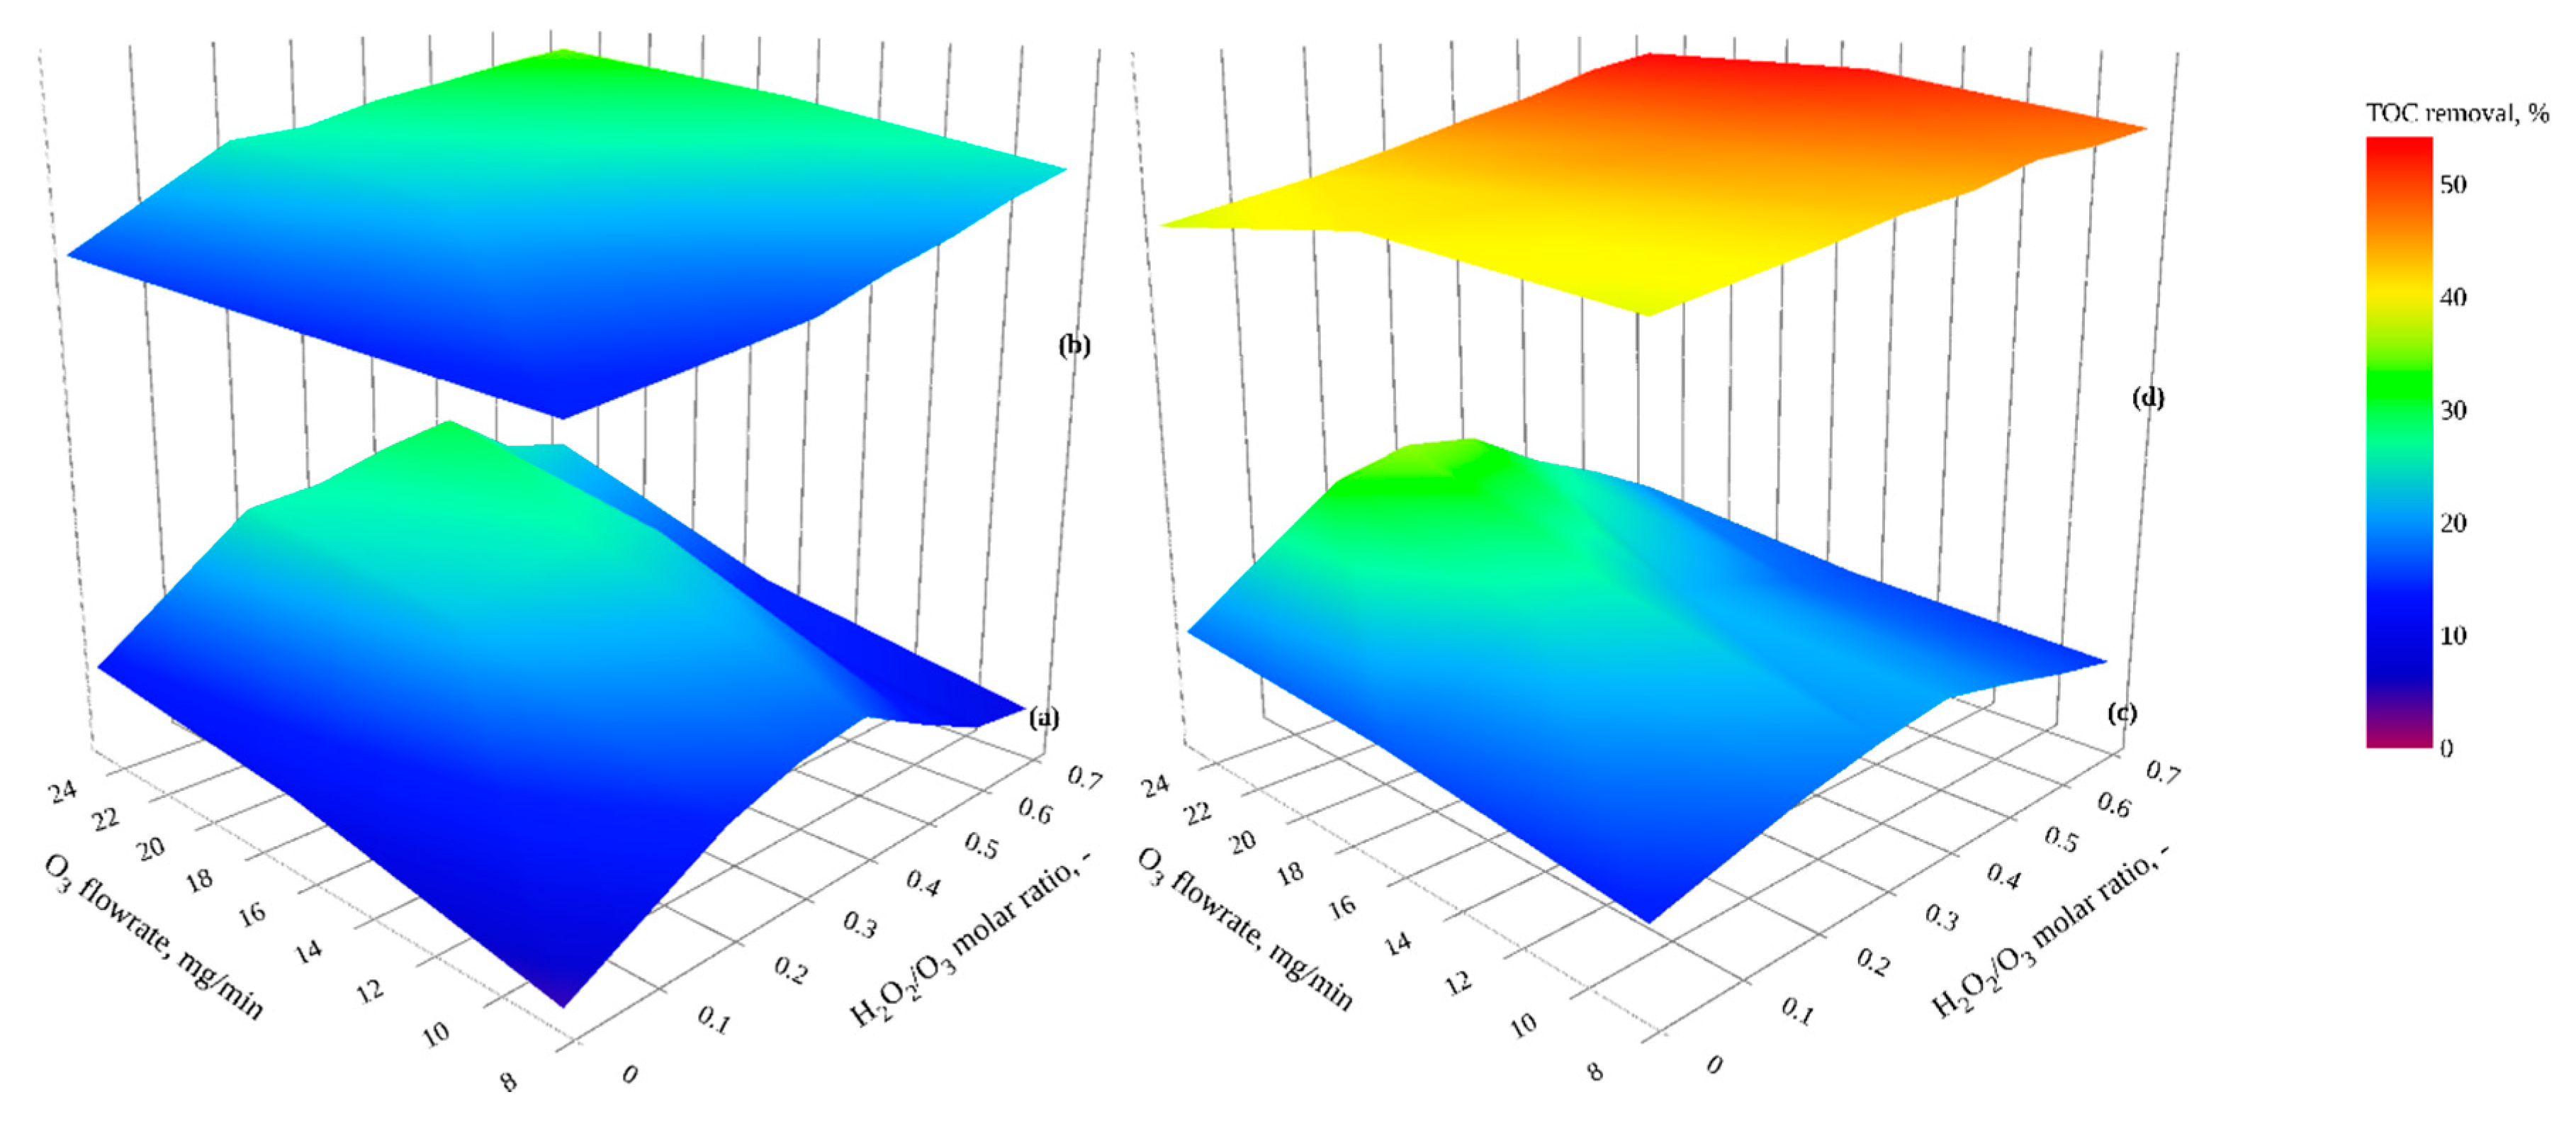
3.6. Peroxonation (H2O2/O3) and Catalytic Peroxonation (H2O2/O3/TiO2) under Dark and UVA Conditions

A systematic study of peroxonation (H2O2/O3/dark), UVA-peroxonation (H2O2/O3/UVA), catalytic peroxonation (H2O2/O3/TiO2/dark), and photocatalytic peroxonation (H2O2/O3/TiO2/UVA) was undertaken using different H2O2/O3 molar ratios (0–0.7). Ozone flow rates were controlled within the range of 8.3–25 mg O3/min to avoid the O3 inhibition effect observed in photocatalytic ozonation experiments. In catalytic and photocatalytic peroxonation, the optimal TiO2 loading from the previous experiment (0.96 mg TiO2/cm2) was used (Figure 7).
A synergistic effect was observed when combining hydrogen peroxide and ozone treatments, in accordance with other works [32,65] where additional hydroxyl radicals were proposed to be generated via Equation (34) [66].
2 O 3 + H 2 O 2 2 O H + 3 O 2
A greater synergetic effect was observed at higher ozone flowrates due to the lack of competition between the organic content of GW and H2O2 for the ozone. According to Gulyas et al. [15], at low doses of ozone, organic compounds in water can compete with hydrogen peroxide for the ozone, resulting in low rates of ROS formation. Further enhancement was observed with UV peroxonation treatment, as has been previously reported [16,65].
In experiments without TiO2, peroxonation and UVA-peroxonation (Figure 7a,c), the enhancement decreased with high H2O2/O3 molar ratios, with an optimal ratio observed between 0.3 and 0.5 in line with previous studies [14,54,58]. Excess hydrogen peroxide has been reported to lead to hydroxyl radical scavenging [39,57]. We observed that a maximum TOC removal with an ozone flow rate of 25 mg/min (30.31%) was achieved by peroxonation (at 0.5 H2O2/O3 molar ratio) with UVA-peroxonation (at 0.3 H2O2/O3 molar ratio) increasing TOC removal to 34.97%.
TOC removal via catalytic and photocatalytic peroxonation is shown in Figure 7b,d. Treatment efficiency was observed to improve with increasing H2O2/O3 ratio to a maximum of 33.42% TOC removal via catalytic peroxonation at an ozone flow rate of 25 mg/min and 0.7 H2O2/O3 molar ratio. Organic mineralization of GW was significantly enhanced to 54.12% through photocatalytic peroxonation. This increased oxidation can be accredited to the generation of additional hydroxyl radicals from surface state reactions (as described above), reducing scavenging of both hydrogen peroxide and ozone.

4. Conclusions

The data presented represent one of the most comprehensive and systematic studies of enhanced photocatalysis for the treatment of real greywater. We demonstrate that in a stirred tank reactor under optimal catalyst loading for an immobilized system, the ROS generated via photocatalysis can mineralize >30% of the organic content of GW. Either single or a combination of additional oxidants, H2O2 and/or ozone, under conditions of optimal molar ratio, enhanced the remediation efficiency—we observed 54.12% TOC removal through photocatalytic peroxonation. As we move to co-design AOP systems for use by members of communities in Jordan with whom we work [67], the data showing both UVA and visible light enhancement of the H2O2/TiO2 system are of particular interest, demonstrating potential for enhanced photocatalysis as a viable option to reduce the organic fraction of GW and permit local water reuse. Further work is underway to examine and quantify synergistic effects between AOPs and to demonstrate the potential of the above systems to disinfect GW, therefore moving towards attainment of the Jordanian GW reuse standard for indoor use (toilet flushing) as opposed to the lower requirements for vegetable irrigation.

Supplementary Materials

The following are available online at https://www.mdpi.com/2073-4441/12/10/2811/s1, Figure S1a: Photo of the steel stirred tank reactor (STR) used in this study, Figure S1b: Photo of the borosilicate glass plate coated with TiO2, Figure S2a: Measured spectral output for Philips Actinic BL TL 11W/10, Figure S2b: Spectral output for Philips MASTER PL-S 11W/840/4P 1CT. Figure S3: Effect of TiO2 loading and residence time on TOC reduction of GW, Figure S4: TOC reduction by ozonation and catalytic ozonation, examined with different ozone flowrate (0–41.7 mg O3/min) and a range of catalyst loading (0–1.98 mg TiO2/cm2), Figure S5: TOC reduction by Ozone photolysis and photocatalytic ozonation, examined with different ozone flowrate (0–41.7 mg O3/min) and a range of catalyst loading (0–1.98 mg TiO2/cm2), Figure S6: TOC reduction by H2O2/TiO2 in dark conditions as a function of H2O2/TiO2 molar ratio and TiO2 loading, Figure S7: TOC reduction by H2O2/TiO2 with visible light as a function of H2O2/TiO2 molar ratio and TiO2 loading, Figure S8: TOC reduction by H2O2/TiO2 with UVA irradiation as a function of H2O2/TiO2 molar ratio and TiO2 loading, Figure S9: Effect of H2O2/O3 molar ratios and TiO2 loading on TOC reduction by peroxonation, Figure S10: Effect of H2O2/O3 molar ratios and TiO2 loading on TOC reduction by catalytic peroxonation, Figure S11: Effect of H2O2/O3 molar ratios and TiO2 loading on TOC reduction by UVA-peroxonation, Figure S12: Effect of H2O2/O3 molar ratios and TiO2 loading on TOC reduction by photocatalytic peroxonation.

Author Contributions

Conceptualization, D.A. and P.D.; methodology, D.A.; software, A.A.; validation, D.A., P.D. and A.A.; formal analysis, D.A., P.D. and A.A.; investigation, D.A. and K.B.-M.; resources, D.A.; data curation, D.A.; writing—original draft preparation, P.D., D.A.; writing—review and editing, D.A., P.D., A.A. and K.B.-M.; visualization, A.A.; supervision, D.A., P.D. and K.B.-M.; project administration, D.A.; funding acquisition, D.A. and P.D. All authors have read and agreed to the published version of the manuscript.

Funding

This research was funded by The Deanship of Scientific Research at The Hashemite University, Ulster University’s VCRS Postgraduate Scholarship Scheme and SAFEWATER project sponsored by Global Challenges Research Fund (GCRF) UK Research and Innovation (SAFEWATER; EPSRC Grant Reference EP/P032427/1).

Acknowledgments

Authors would like to thank The Deanship of Scientific Research at The Hashemite University for the financial support provided for conducting this study. In addition, AA acknowledges support from Ulster University’s VCRS Postgraduate Scholarship Scheme with AA and PSMD grateful for support from the SAFEWATER project sponsored by Global Challenges Research Fund (GCRF) UK Research and Innovation (SAFEWATER; EPSRC Grant Reference EP/P032427/1).

Conflicts of Interest

The authors declare no conflict of interest. The funders had no role in the design of the study; in the collection, analyses, or interpretation of data; in the writing of the manuscript, or in the decision to publish the results.

References

  1. Maimon, A.; Gross, A. Greywater: Limitations and perspective. Curr. Opin. Environ. Sci. Health 2018, 2, 1–6. [Google Scholar] [CrossRef]
  2. Wang, W.L.; Wu, Q.Y.; Huang, N.; Xu, Z.B.; Lee, M.Y.; Hu, H.Y. Potential risks from UV/H2O2oxidation and UV photocatalysis: A review of toxic, assimilable, and sensory-unpleasant transformation products. Water Res. 2018, 141, 109–125. [Google Scholar] [CrossRef] [PubMed]
  3. Schoen, M.E.; Garland, J. Review of pathogen treatment reductions for onsite non-potable reuse of alternative source waters. Microb. Risk Anal. 2017, 5, 25–31. [Google Scholar] [CrossRef]
  4. Li, Z.; Boyle, F.; Reynolds, A. Rainwater harvesting and greywater treatment systems for domestic application in Ireland. Desalination 2010, 260, 1–8. [Google Scholar] [CrossRef] [Green Version]
  5. Barzegar, G.; Wu, J.; Ghanbari, F. Enhanced treatment of greywater using electrocoagulation/ozonation: Investigation of process parameters. Process Saf. Environ. Prot. 2019, 121, 125–132. [Google Scholar] [CrossRef]
  6. Assayed, A.; Chenoweth, J.; Pedley, S. Drawer compacted sand filter: A new and innovative method for on-site grey water treatment. Environ. Technol. 2014, 35, 2435–2446. [Google Scholar] [CrossRef] [Green Version]
  7. Ghunmi, L.A.; Zeeman, G.; Lier, J.V.; Fayyed, M. Quantitative and qualitative characteristics of grey water for reuse requirements and treatment alternatives: The case of Jordan. Water Sci. Technol. 2008, 58, 1385–1396. [Google Scholar] [CrossRef]
  8. WWAP. The United Nations World Water Development Report 2017. Wastewater: The Untapped Resource. Available online: https://unesdoc.unesco.org/ark:/48223/pf0000247153 (accessed on 15 February 2019).
  9. Halalsheh, M.; Dalahmeh, S.; Sayed, M.; Suleiman, W.; Shareef, M.; Mansour, M.; Safi, M. Grey water characteristics and treatment options for rural areas in Jordan. Bioresour. Technol. 2008, 99, 6635–6641. [Google Scholar] [CrossRef]
  10. Dalahmeh, S.S.; Assayed, M.; Suleiman, W.T. Themes of stakeholder participation in greywater management in rural communities in Jordan. Desalination 2009, 243, 159–169. [Google Scholar] [CrossRef] [Green Version]
  11. JSMO. Water—Reclaimed Grey Water JS1776:2013, 2nd ed.; Jordan Standards and Metrology Organization: Amman, Jordan, 2013; pp. 1–16. [Google Scholar]
  12. Alrousan, D.M.; Dunlop, P.S.; McMurray, T.A.; Byrne, J.A. Photocatalytic inactivation of E. coli in surface water using immobilised nanoparticle TiO2 films. Water Res. 2009, 43, 47–54. [Google Scholar] [CrossRef]
  13. Gassie, L.W.; Englehardt, J.D. Advanced oxidation and disinfection processes for onsite net-zero greywater reuse: A review. Water Res. 2017, 125, 384–399. [Google Scholar] [CrossRef] [PubMed]
  14. Miklos, D.B.; Remy, C.; Jekel, M.; Linden, K.G.; Drewes, J.E.; Hubner, U. Evaluation of advanced oxidation processes for water and wastewater treatment—A critical review. Water Res. 2018, 139, 118–131. [Google Scholar] [CrossRef] [PubMed]
  15. Gulyas, H.; Jorge, C.F.L.; Reich, M.; Otterpohl, R. Reclaiming Biologically Pretreated Greywater for Reuse by Photocatalytic Oxidation: Qualitative Study on the Removal of Trace Organics. J. Water Resour. Prot. 2013, 5, 568–584. [Google Scholar] [CrossRef]
  16. Hassanshahi, N.; Karimi-Jashni, A. Comparison of photo-Fenton, O3/H2O2/UV and photocatalytic processes for the treatment of gray water. Ecotoxicol. Environ. Saf. 2018, 161, 683–690. [Google Scholar] [CrossRef]
  17. Birben, N.; Uyguner-Demirel, C.; Bekbolet, M. Photocatalytic Removal of Microbiological Consortium and Organic Matter in Greywater. Catalysts 2016, 6, 91. [Google Scholar] [CrossRef] [Green Version]
  18. Agustina, T.E.; Ang, H.M.; Vareek, V.K. A review of synergistic effect of photocatalysis and ozonation on wastewater treatment. J. Photochem. Photobiol. A Chem. Rev. 2005, 6, 264–273. [Google Scholar] [CrossRef]
  19. McMurray, T.A.; Dunlop, P.S.M.; Byrne, J.A. The photocatalytic degradation of atrazine on nanoparticulate TiO2 films. J. Photochem. Photobiol. A Chem. 2006, 182, 43–51. [Google Scholar] [CrossRef]
  20. Gumus, D.; Akbal, F. A comparative study of ozonation, iron coated zeolite catalyzed ozonation and granular activated carbon catalyzed ozonation of humic acid. Chemosphere 2017, 174, 218–231. [Google Scholar] [CrossRef]
  21. Ikhlaq, A.; Brown, D.R.; Kasprzyk-Hordern, B. Mechanisms of catalytic ozonation: An investigation into superoxide ion radical and hydrogen peroxide formation during catalytic ozonation on alumina and zeolites in water. Appl. Catal. B Environ. 2013, 129, 437–449. [Google Scholar] [CrossRef]
  22. Wang, J.L.; Xu, L.J. Advanced Oxidation Processes for Wastewater Treatment: Formation of Hydroxyl Radical and Application. Crit. Rev. Environ. Sci. Technol. 2012, 42, 251–325. [Google Scholar] [CrossRef]
  23. Nguyen, A.T.; Juang, R.S. Photocatalytic degradation of p-chlorophenol by hybrid H2O2 and TiO2 in aqueous suspensions under UV irradiation. J. Environ. Manag. 2015, 147, 271–277. [Google Scholar] [CrossRef] [PubMed]
  24. Sánchez, L.D.; Taxt-Lamolle, S.F.M.; Hole, E.O.; Krivokapić, A.; Sagstuen, E.; Haugen, H.J. TiO2 suspension exposed to H2O2 in ambient light or darkness: Degradation of methylene blue and EPR evidence for radical oxygen species. Appl. Catal. B Environ. 2013, 142, 662–667. [Google Scholar] [CrossRef]
  25. Janson, O.; Unosson, E.; Stromme, M.; Engqvist, H.; Welch, K. Organic degradation potential of a TiO2/H2O2/UV-vis system for dental applications. J. Dent. 2017, 67, 53–57. [Google Scholar] [CrossRef] [PubMed]
  26. Liu, T.; Li, X.; Yuan, X.; Wang, Y.; Li, F. Enhanced visible-light photocatalytic activity of a TiO2 hydrosol assisted by H2O2: Surface complexation and kinetic modeling. J. Mol. Catal. A Chem. 2016, 414, 122–129. [Google Scholar] [CrossRef]
  27. Leong, J.Y.C.; Oh, K.S.; Poh, P.E.; Chong, M.N. Prospects of hybrid rainwater-greywater decentralised system for water recycling and reuse: A review. J. Clean. Prod. 2017, 142, 3014–3027. [Google Scholar] [CrossRef]
  28. APHA. Standard Methods for the Examination of Water and Wastewater; American Public Health Association, American Water Works Association, Water Environment Federation: Washington, DC, USA, 2005. [Google Scholar]
  29. Makhotkina, O.A.; Preis, S.V.; Parkhomchuk, E.V. Water delignification by advanced oxidation processes: Homogeneous and heterogeneous Fenton and H2O2 photo-assisted reactions. Appl. Catal. B Environ. 2008, 84, 821–826. [Google Scholar] [CrossRef]
  30. Byrne, J.A.; Eggins, B.R.; Brown, N.M.D.; McKinney, B.; Rouse, M. Immobilisation of TiO2 powder for the treatment of polluted water. Appl. Catal. B Environ. 1998, 17, 25–36. [Google Scholar] [CrossRef]
  31. Lopez, L.; Panther, B.C.; Turney, T.W. Contaminant effects on the photo-oxidation of greywater over titania film catalysts. J. Water Process. Eng. 2015, 7, 46–53. [Google Scholar] [CrossRef]
  32. Oller, I.; Malato, S.; Sanchez-Perez, J.A. Combination of Advanced Oxidation Processes and biological treatments for wastewater decontamination—A review. Sci. Total Environ. 2011, 409, 4141–4166. [Google Scholar] [CrossRef]
  33. Chin, W.H.; Roddick, F.A.; Harris, J.L. Greywater treatment by UVC/H2O2. Water Res. 2009, 43, 3940–3947. [Google Scholar] [CrossRef]
  34. Antonio da Silva, D.; Cavalcante, R.P.; Cunha, R.F.; Machulek, A.J.; Cesar de Oliveira, S. Optimization of nimesulide oxidation via a UV-ABC/H2O2 treatment process: Degradation products, ecotoxicological effects, and their dependence on the water matrix. Chemosphere 2018, 207, 457–468. [Google Scholar] [CrossRef] [PubMed]
  35. Gulyas, H.; Jain, H.B.; Susanto, A.L.; Malekpur, M.; Harasiuk, K.; Krawczyk, I.; Choromanski, P.; Furmanska, M. Solar photocatalytic oxidation of pretreated wastewaters: Laboratory scale generation of design data for technical-scale double-skin sheet reactors. Environ. Technol. 2005, 26, 501–514. [Google Scholar] [CrossRef]
  36. Kasprzyk-Hordern, B.; Ziółek, M.; Nawrocki, J. Catalytic ozonation and methods of enhancing molecular ozone reactions in water treatment. Appl. Catal. B Environ. 2003, 46, 639–669. [Google Scholar] [CrossRef]
  37. Zúñiga-Benítez, H.; Peñuela, G.A. Solar lab and pilot scale photo-oxidation of ethylparaben using H2O2 and TiO2 in aqueous solutions. J. Photochem. Photobiol. A Chem. 2017, 337, 62–70. [Google Scholar] [CrossRef]
  38. Selishchev, D.; Kozlov, D. Photocatalytic oxidation of diethyl sulfide vapor over TiO2-based composite photocatalysts. Molecules 2014, 19, 21424–21441. [Google Scholar] [CrossRef] [Green Version]
  39. Elmolla, E.S.; Chaudhuri, M. Photocatalytic degradation of amoxicillin, ampicillin and cloxacillin antibiotics in aqueous solution using UV/TiO2 and UV/H2O2/TiO2 photocatalysis. Desalination 2010, 252, 46–52. [Google Scholar] [CrossRef]
  40. Pelaez, M.; Nolan, N.T.; Pillai, S.C.; Seery, M.K.; Falaras, P.; Kontos, A.G.; Dunlop, P.S.M.; Hamilton, J.W.J.; Byrne, J.A.; O’Shea, K.; et al. A review on the visible light active titanium dioxide photocatalysts for environmental applications. Appl. Catal. B Environ. 2012, 125, 331–349. [Google Scholar] [CrossRef] [Green Version]
  41. Qiu, P.; Park, B.; Choi, J.; Thokchom, B.; Pandit, A.B.; Khim, J. A review on heterogeneous sonocatalyst for treatment of organic pollutants in aqueous phase based on catalytic mechanism. Ultrason. Sonochem. 2018, 45, 29–49. [Google Scholar] [CrossRef]
  42. Yang, L.; Liu, Z.; Shi, J.; Hu, H.; Shangguan, W. Design consideration of photocatalytic oxidation reactors using TiO2-coated foam nickels for degrading indoor gaseous formaldehyde. Catal. Today 2007, 126, 359–368. [Google Scholar] [CrossRef]
  43. Jung, S.-C.; Kim, S.-J.; Imaishi, N.; Cho, Y.-I. Effect of TiO2 thin film thickness and specific surface area by low-pressure metal–organic chemical vapor deposition on photocatalytic activities. Appl. Catal. B Environ. 2005, 55, 253–257. [Google Scholar] [CrossRef]
  44. Li Puma, G.; Brucato, A. Dimensionless analysis of slurry photocatalytic reactors using two-flux and six-flux radiation absorption–scattering models. Catal. Today 2007, 122, 78–90. [Google Scholar] [CrossRef]
  45. Sillanpaa, M.; Ncibi, M.C.; Matilainen, A. Advanced oxidation processes for the removal of natural organic matter from drinking water sources: A comprehensive review. J. Environ. Manag. 2018, 208, 56–76. [Google Scholar] [CrossRef] [PubMed]
  46. Von Gunten, U. Ozonation of drinking water: Part I. Oxidation kinetics and product formation. Water Res. 2003, 37, 1443–1467. [Google Scholar] [CrossRef]
  47. Gągol, M.; Przyjazny, A.; Boczkaj, G. Wastewater treatment by means of advanced oxidation processes based on cavitation—A review. Chem. Eng. J. 2018, 338, 599–627. [Google Scholar] [CrossRef]
  48. Abdel-Maksoud, Y.K.; Imam, E.; Ramadan, A.R. TiO2 water-bell photoreactor for wastewater treatment. Sol. Energy 2018, 170, 323–335. [Google Scholar] [CrossRef]
  49. Molnar, J.J.; Agbaba, J.R.; Dalmacija, B.D.; Klasnja, M.T.; Dalmacija, M.B.; Kragulj, M.M. A comparative study of the effects of ozonation and TiO2-catalyzed ozonation on the selected chlorine disinfection by-product precursor content and structure. Sci. Total Environ. 2012, 425, 169–175. [Google Scholar] [CrossRef] [PubMed]
  50. Gracia, R. TiO2-catalysed ozonation of raw Ebro river water. Water Res. 2000, 34, 1525–1532. [Google Scholar] [CrossRef]
  51. Molnar, J.; Agbaba, J.; Dalmacija, B.; Klašnja, M.; Watson, M.; Kragulj, M. Effects of Ozonation and Catalytic Ozonation on the Removal of Natural Organic Matter from Groundwater. J. Environ. Eng. 2012, 138, 804–808. [Google Scholar] [CrossRef]
  52. Ma, J. Degradation of atrazine by manganese-catalysed ozonation—Influence of radical scavengers. Water Res. 2000, 34, 3822–3828. [Google Scholar] [CrossRef]
  53. Xu, Y.; Wu, Y.; Zhang, W.; Fan, X.; Wang, Y.; Zhang, H. Performance of artificial sweetener sucralose mineralization via UV/O3 process: Kinetics, toxicity and intermediates. Chem. Eng. J. 2018, 353, 626–634. [Google Scholar] [CrossRef]
  54. Oturan, M.A.; Aaron, J.-J. Advanced Oxidation Processes in Water/Wastewater Treatment: Principles and Applications. A Review. Crit. Rev. Environ. Sci. Technol. 2014, 44, 2577–2641. [Google Scholar] [CrossRef]
  55. Wang, S.; Shiraishi, F.; Nakano, K. A synergistic effect of photocatalysis and ozonation on decomposition of formic acid in an aqueous solution. Chem. Eng. J. 2002, 87, 261–271. [Google Scholar] [CrossRef]
  56. Lamsal, R.; Walsh, M.E.; Gagnon, G.A. Comparison of advanced oxidation processes for the removal of natural organic matter. Water Res. 2011, 45, 3263–3269. [Google Scholar] [CrossRef] [PubMed]
  57. Kurniawan, T.A.; Lo, W.H. Removal of refractory compounds from stabilized landfill leachate using an integrated H2O2 oxidation and granular activated carbon (GAC) adsorption treatment. Water Res. 2009, 43, 4079–4091. [Google Scholar] [CrossRef] [PubMed]
  58. Beniwal, D.; Taylor-Edmonds, L.; Armour, J.; Andrews, R.C. Ozone/peroxide advanced oxidation in combination with biofiltration for taste and odour control and organics removal. Chemosphere 2018, 212, 272–281. [Google Scholar] [CrossRef] [PubMed] [Green Version]
  59. Lutterbeck, C.A.; Machado, E.L.; Kummerer, K. Photodegradation of the antineoplastic cyclophosphamide: A comparative study of the efficiencies of UV/H2O2, UV/Fe2+/H2O2 and UV/TiO2 processes. Chemosphere 2015, 120, 538–546. [Google Scholar] [CrossRef] [PubMed]
  60. Wiedmer, D.; Sagstuen, E.; Welch, K.; Haugen, H.J.; Tiainen, H. Oxidative power of aqueous non-irradiated TiO2-H2O2 suspensions: Methylene blue degradation and the role of reactive oxygen species. Appl. Catal. B Environ. 2016, 198, 9–15. [Google Scholar] [CrossRef] [Green Version]
  61. Lee, M.C.; Yoshino, F.; Shoji, H.; Takahashi, S.; Todoki, K.; Shimada, S.; Kuse-Barouch, K. Characterization by electron spin resonance spectroscopy of reactive oxygen species generated by titanium dioxide and hydrogen peroxide. J. Dent. Res. 2005, 84, 178–182. [Google Scholar] [CrossRef]
  62. Jedsukontorn, T.; Meeyoo, V.; Saito, N.; Hunsom, M. Effect of electron acceptors H2O2 and O2 on the generated reactive oxygen species 1O2 and OH in TiO2-catalyzed photocatalytic oxidation of glycerol. Chin. J. Catal. 2016, 37, 1975–1981. [Google Scholar] [CrossRef]
  63. Sakkas, V.A.; Calza, P.; Islam, M.A.; Medana, C.; Baiocchi, C.; Panagiotou, K.; Albanis, T. TiO2/H2O2 mediated photocatalytic transformation of UV filter 4-methylbenzylidene camphor (4-MBC) in aqueous phase: Statistical optimization and photoproduct analysis. Appl. Catal. B Environ. 2009, 90, 526–534. [Google Scholar] [CrossRef]
  64. Domínguez, J.R.; Beltrán, J.; Rodríguez, O. Vis and UV photocatalytic detoxification methods (using TiO2, TiO2/H2O2, TiO2/O3, TiO2/S2O82−, O3, H2O2, S2O82−, Fe3+/H2O2 and Fe3+/H2O2/C2O42−) for dyes treatment. Catal. Today 2005, 101, 389–395. [Google Scholar] [CrossRef]
  65. Bethi, B.; Sonawane, S.H.; Bhanvase, B.A.; Gumfekar, S.P. Nanomaterials-based advanced oxidation processes for wastewater treatment: A review. Chem. Eng. Process. Process Intensif. 2016, 109, 178–189. [Google Scholar] [CrossRef]
  66. Pérez-Lucas, G.; Aliste, M.; Vela, N.; Garrido, I.; Fenoll, J.; Navarro, S. Decline of fluroxypyr and triclopyr residues from pure, drinking and leaching water by photo-assisted peroxonation. Process Saf. Environ. Prot. 2020, 137, 358–365. [Google Scholar] [CrossRef]
  67. Alrousan, D.M.A.; Dunlop, P.S.M. Evaluation of ozone-based oxidation and solar advanced oxidation treatment of greywater. J. Environ. Chem. Eng. 2020, 8. [Google Scholar] [CrossRef]
Figure 1. Schematic representation of the Stirred Tank Reactor (STR).
Water 12 02811 g001
Figure 2. Effect of TiO2 loading and residence time on TOC reduction in GW (interactive plot presented in Figure S3).
Water 12 02811 g002
Figure 3. Absorbance spectra of the TiO2 coated films at different catalyst loadings (0.19–1.98 mg TiO2/cm2).
Water 12 02811 g003
Figure 4. TOC reduction by (a) ozonation and catalytic ozonation and (b) Ozone photolysis and photocatalytic ozonation, examined with different ozone flowrate (0–41.7 mg O3/min) and a range of catalyst loading (0–1.98 mg TiO2/cm2) (interactive plots presented in Figures S4 and S5).
Water 12 02811 g004
Figure 5. Microscopy images of the coated films demonstrating decreasing light transmission through increased loading/thickness of TiO2 (×10 magnification).
Water 12 02811 g005
Figure 6. TOC reduction by H2O2/TiO2 (a) in dark conditions (b) with visible light, and (c) with UVA irradiation as a function of H2O2/TiO2 molar ratio and TiO2 loading (interactive plots presented in Figures S6–S8).
Water 12 02811 g006
Figure 7. Effect of H2O2/O3 molar ratios and TiO2 loading on TOC reduction by (a) peroxonation, (b) catalytic peroxonation, (c) UVA-peroxonation and (d) photocatalytic peroxonation (interactive plots presented in Figures S9–S12).
Water 12 02811 g007
Table 1. Characteristics of the greywater (GW) from Irbid’s house and the Jordan GW standard.
All Represented by (mg/L) Unless Otherwise Was StatedJordan GW Standard JS1776:2013 for Different Uses [11]Measured ± STD
Cooked Vegetables IrrigationRaw Vegetables IrrigationToilet Flushing
Biochemical oxygen demand (BOD5)6060 347 ± 31.2
Chemical oxygen demand (COD)120120<10380 ± 28.6
Total organic carbon (TOC)--<20126.4 ± 13.2
Total suspended solids (TSS) 100100-45.3 ± 7.42
pH (unitless) 6–96-9<107.72 ± 0.14
N O 3 70706–90.375 ± 0.12
Total nitrogen (TN) 50507024.1 ± 2.27
Turbidity (NTU) --5057.8 ± 3.52
E. coli (CFU/100 mL) 104103<51.1 × 10⁴ ± 1.89 × 10³
Intestinal helminths eggs <1<1<100
Fat oil and grease (FOG)88<18.8 ± 1.5
Cl-5005008425.3 ± 22.57
S O 4 2 500500500114.1 ± 8.72
N O 2 N 5000.067 ± 0.08
Total phosphorous (TP) 1515 1.36 ± 0.37
Conductivity (µS/cm)--15724.6 ± 0.27
Table 2. Stirred tank reactor dimensions and specifications.
ParameterDescription
Outer diameter135 mm
Inner diameter131 mm
Height150 mm
Reactor total volume2.020 L
Reactor water volume1.50 L
Irradiated area134.71 cm2
Propeller position40 mm above the base of the reactor
Propeller diameter65 mm
Light source position4 cm below the base of the reactor
UVA source2 UVA lamps, emitted radiation (340–460) nm, Max. emission at 365 nm
Visible light source2 fluorescent lamps, emitted radiation (400–700) nm, Max. emission at 550 nm
Table 3. Matrix of experimental conditions.
ExperimentAir Flow (L/min)TiO2 Loading (mg/cm2)O3 Flow Rate (mg/min)H2O2 Dosage (mg/L)Light Exposure Conditions c
Control experiments0 or 50–1.980.000.00dark and UVA
TiO2 photocatalysis (TiO2/UVA)50.19–1.980.000.00UVA
Ozonation (O3/dark)50.008.3–41.70.00dark
Catalytic ozonation (O3/TiO2/dark)50.19–1.988.3–41.70.00dark
Ozone photolysis (O3/UVA)50.008.3–41.70.00UVA
photocatalytic ozonation (O3/TiO2/UVA)50.19–1.988.3–41.70.00UVA
H2O2-peroxidation (H2O2/dark)50.000.001.45–53.01dark
(H2O2/TiO2/dark) a50.19–1.980.001.45–53.01dark
(H2O2/UVA) a50.000.001.45–53.01UVA
(H2O2/TiO2/UVA) a50.19–1.980.001.45–53.01UVA
(H2O2/TiO2/Vis) a50.19–1.980.001.45–53.01visible
Peroxonation (H2O2/O3/dark) b50.008.3–25141.1–1487.5dark
Photo-peroxonation (H2O2/O3/UVA) b50.008.3–25141.1–1487.5UVA
Catalytic peroxonation (H2O2/O3/TiO2/dark) b50.988.3–25141.1–1487.5dark
Photocatalytic peroxonation (H2O2/O3/TiO2/UVA) b50.988.3–25141.1–1487.5UVA
a H2O2/TiO2 molar ratio ranged from 0.2 to 0.7; b H2O2/O3 molar ratio ranged from 0.2 to 0.7; c Average incident UVA intensity = 55.4 ± 6.3 W/m2.
Table 4. Maximum TOC removal (%) and apparent pseudo-first order rate constant as a function of TiO2 catalyst loading.
Catalyst Loading (mg/cm2)Maximum Removal %Pseudo-First Kinetic Fitting
Apparent Rate Constant (k) × 104R2
0.1911.40 ± 0.276.43 ± 0.140.994
0.5313.50 ± 0.417.83 ± 0.420.970
0.9630.98 ± 0.7522.10 ± 1.120.972
1.3526.25 ± 0.9118.41 ± 0.710.984
1.6117.44 ± 1.7212.53 ± 0.670.970
1.989.45 ± 0.605.86 ± 0.390.954

