Article

Modeling the Influence of Public Risk Perceptions on the Adoption of Green Stormwater Infrastructure: An Application of Bayesian Belief Networks Versus Logistic Regressions on a Statewide Survey of Households in Vermont

1
Rubenstein School of Environment and Natural Resources, University of Vermont, Burlington, VT 05405, USA
2
Department of Community Development and Applied Economics, University of Vermont, Burlington, VT 05405, USA
3
Department of Civil & Environmental Engineering, University of Vermont, Burlington, VT 05405, USA
*
Authors to whom correspondence should be addressed.
Water 2020, 12(10), 2793; https://doi.org/10.3390/w12102793
Submission received: 9 September 2020 / Revised: 30 September 2020 / Accepted: 3 October 2020 / Published: 8 October 2020

Abstract

:
There is growing environmental psychology and behavior literature with mixed empirical evidence about the influence of public risk perceptions on the adoption of environmentally friendly “green behaviors”. Adoption of stormwater green infrastructure on residential properties, while costlier in the short term compared to conventional greywater infrastructure, plays an important role in the reduction of nutrient loading from non-point sources into freshwater rivers and lakes. In this study, we use Bayesian Belief Networks (BBNs) to analyze a 2015 survey dataset (sample size = 472 respondents) about the adoption of green infrastructure (GSI) in Vermont’s residential areas, most of which are located in either the Lake Champlain Basin or Connecticut River Basin. Eight categories of GSI were investigated: roof diversion, permeable pavement, infiltration trenches, green roofs, rain gardens, constructed wetlands, tree boxes, and others. Using both unsupervised and supervised machine learning algorithms, we used Bayesian Belief Networks to quantify the influence of public risk perceptions on GSI adoption while accounting for a range of demographic and spatial variables. We also compare the effectiveness of the Bayesian Belief Network approach and logistic regression in predicting the pro-environmental behaviors (adoption of GSI). The results show that influencing factors for current adoption differ by the type of GSI. Increased perception of risk from stormwater issues is associated with the adoption of rain gardens and infiltration trenches. Runoff issues are more likely to be considered the governments’ (town, state, and federal agencies) responsibility, whereas lawn erosion is more likely to be considered the residents’ responsibility. When using the same set of variables to predict pro-environmental behaviors (adoption of GSI), the BBN approach produces more accurate predictions compared to logistic regression. The results provide insights for further research on how to encourage residents to take measures for mitigating stormwater issues and stormwater management.

1. Introduction

1.1. Public Perception of Environmental Issues and Pro-Environmental Behavior

Research efforts on public perception of environmental issues and their influence on the adoption of pro-environmental behaviors have increased significantly over the last two or three decades [1,2]. There is mixed empirical evidence about the influence of public risk perceptions (defined as recognition of stormwater related issues such as runoff and lawn erosion in the neighborhood) on the adoption of environmentally friendly “green behaviors”. The results for evaluating different types of environmental behaviors vary. O’Connor et al. [3] concluded that risk perception matters when predicting environmental behavioral intentions to mitigate climate change. In contrast, Bubeck et al. [4] reviewed the relationship between risk perception and flood mitigation behaviors and concluded there was little empirical evidence to support this relationship. The influence of various demographic characteristics under different scenarios has also been investigated with inconsistent results [3,5,6,7]. For example, some studies show gender and education to have the most influence on environmental attitude and pro-environmental behavior intentions, but they are not always effective predictors of actual behaviors [8,9].
Factors underlying environmental behaviors have also been studied through different theoretical perspectives [8,10,11]. Kollmuss and Agyeman [8] conducted a review including some of the most widely studied theoretical models and sociodemographic factors to characterize why people act environmentally and the barriers to pro-environmental behavior. One of the earliest linear models from the 1970s assumed that environmental knowledge leads to a change in attitude, and in turn, pro-environmental behaviors. These oversimplified assumptions soon proved limited in predicting pro-environmental behaviors, especially the discrepancy between attitude and behavior. Rajecki [12] defined some causes for this gap, pointing out that frequent flaws in research methodology make it especially difficult to measure attitude and behavior effectively. In developing the theory of reasoned action and theory of planned behavior, Ajzen and Fishbein [13,14,15] improved upon the earlier linear models and addressed the measurement issues. They kept the notion that humans are essentially rational and argued that attitude influences behavioral intentions rather than the behaviors directly. Attitude toward a specific behavior should be measured carefully in order to review the connections. Ajzen and Fishbein’s model remains one of the more influential frameworks in analyzing environmental behaviors and has inspired numerous variations applied to different circumstances. In a study evaluating attitudes toward the adoption of green infrastructures among U.S. municipal officials, Carlet [6] adopted the structure of the theory of reasoned action and added several factors contributing to attitude, including organization characteristics, perceived innovation attributes, perceived internal adoption readiness, and individual characteristics.
Vining and Ebreo [11] provided an extensive list of theoretical perspectives about pro-environmental behaviors from the perspective of environmental psychology. These frameworks take a wide range of methodological approaches under several major categories, including learning theory, motivational, moral, and value theories, theories of attitude, belief, or intention, and theories of emotion and affect. In their review on pro-environmental behaviors, Steg and Vlek [10] identified three major lines of research about individual motivations for pro-environmental behaviors: weighing cost and benefit, moral and normative concerns, and affect. They also argued that contextual factors (e.g., availability of recycling facilities, quality of public transport, market supply of goods) and habitual behavior also play an important role in analyzing environmental behaviors.

1.2. Adoption of Green Stormwater Infrastructure (GSI)

Green stormwater infrastructure (GSI) are practices and design principles that use natural processes to manage stormwater runoff. The EPA has been actively encouraging GSI since 2007 and maintains an extensive GSI website [16]. The purpose of GSI is to utilize natural processes to capture and retain stormwater locally in order to reduce runoff and erosion from precipitation events [17,18]. Compared to conventional greywater infrastructures, GSIs are cost-effective for capturing stormwater and more cost-effective at reducing pollutants [17].
GSI has been identified as a key measure to reduce nutrient loading from runoff into Vermont’s waters [19]. The adoption of GSI is especially critical for the major water bodies suffering from water quality decline caused by excessive nutrient loadings. For instance, the new Vermont Total Maximum Daily Load (TMDL) for Lake Champlain approved by US EPA requires a 25% reduction from developed lands within the Vermont portion of the basin, and certain lake segments such as Missisquoi Bay face challenges of up to 30% reduction [20].
Besides the reduction of runoff, well-planned and constructed GSI could bring other benefits such as groundwater replenishment, recreational opportunities, aesthetic, and wildlife habitat improvements [17,21]. While state and local governments could mandate or encourage private property owners to implement GSI, the adoption of GSI on residential properties is often made at the household level [22]. Identifying factors that influence how residents make these decisions would greatly inform the development of management strategies and incentive schemes to encourage residential GSI adoption.

1.3. Bayesian Belief Networks and Application in Research of Environmental Behavior

Bayesian Belief Networks (BBNs) are one kind of probabilistic model based on directed acyclic graphs (DAGs). The BBN approach was greatly advanced in the late 1970s to model the combination of top-down (semantic) and bottom-up (perceptual) evidence in reading and soon gained popularity in many fields of research besides cognitive science and artificial intelligence [23,24]. In a Bayesian Belief Network, each node represents a variable; each arc represents direct dependencies between the linked nodes, and the strength of the arcs (and nodes) are defined by conditional probabilities [23,24].
The name Bayesian belief network was derived from Bayes’ theorem, which is the fundamental method for computing conditional probabilities and conducting probabilistic inference. The theorem states that the probability of an event could be determined by prior knowledge of conditions that might be related to the event. Using information and knowledge about the variables related to a particular event, the probability of the event can be calculated. Bayesian probability of an event is a person’s (or a group of people’s) degree of belief in that event, and it allows modeling with subjectively assigned personal probabilities instead of running a large number of trials [25].
Conventional quantitative analytical methods to study public perceptions and awareness of environmental issues are usually based on classical frequentist statistical methods (parametric or non-parametric) that make fixed assumptions on the unknown parameters and yield dichotomic conclusions about the significance of a test. With the frequentist approach, it is difficult to look into the probabilistic associations in the data and conduct inference on the variables of interest. The Bayesian approach, on the other hand, provides a convenient probabilistic tool to handle more complex datasets with high uncertainties and perform inference. Using conditional probabilities involved in the influence chains that reflect the probabilistic relationship among all nodes of the network, BBNs provide a concise representation of the joint probability distribution of a large data set without increasing the involved parameters exponentially [25]. It is also ideal for conducting bidirectional probabilistic inference on variables of interest given the network [25,26].
The BBN approach is flexible when representing causal relationships in beliefs and also those based on a rigorous probabilistic foundation when constructed from prior knowledge. It is also a powerful tool to acquire structures from physical data and investigate the probabilistic associations between variables of interest to inform decisions. These features led to the rapid development of BBNs as the method of choice for uncertain reasoning in artificial intelligence and expert systems since the 1970s [23]. It has also gained popularity in many other domains such as genetics, risk assessment and management, engineering, ecological modeling, and conservation biology. In environmental and natural resource-related fields, BBNs have been applied in environmental modeling [27,28], natural resource management and decision making [29,30,31,32,33,34,35,36], ecosystem service modeling [31,37,38], and environmental behaviors [39,40].
The application of BBNs in the study of environmental behaviors, however, is fairly rare. Schwenk and Möser [39] used a Bayesian approach to conduct a meta-analysis based on the literature on the correlation between behavioral intentions and actual environmental behaviors. They apply BBNs to integrate prior knowledge for analyzing the causal relationship between variables of interest based on the theory of planned behavior. Keshavarz and Karami [40], on the other hand, use BBN as a data mining technique to analyze factors influencing farmers’ attitudes to support environmental conservation practices. They apply the Tree Augmented Naïve Bayes algorithm to construct a supervised learning network with pro-environmental behavior as the supreme parent node (target). This study offers a valuable case study for the application of BBNs to environmental behavioral data with both supervised and unsupervised learning algorithms, a large number of variables, and probabilistic inferences based on the networks.

1.4. Using Bayesian Belief Network to Understand Stormwater Risk Perception and Adoption of GSI

In this study, we applied a Bayesian Belief Network (BBN) approach to a 2015 dataset comprised of mail-in, public opinion surveys on GSI adoption at private residential properties in Vermont. Compared to conventional frequentist analytical methods, the BBN approach offers an alternative methodology to analyze the internal connections in a dataset from a Bayesian probabilistic perspective [41,42]. It is also convenient for conducting Bayesian probabilistic inference between variables of interest given the whole network.
We performed both supervised and unsupervised machine learning to yield BBNs based on the dataset. (See pp. 31–33 in Heckerman [25] for detailed definitions of supervised and unsupervised learning in BBN). Unsupervised learning allowed us to investigate the internal structure among variables in the dataset and unveiled potential connections that would otherwise be difficult to detect. The supervised learning method focused on a target behavioral variable, GSI adoption, and examined how all other survey variables contribute to it. These analyses provided insights on the current adoption of six types of residential GSIs and how demographics and the respondents’ perception of potential environmental hazards and risks caused by flooding and runoff influence their adoption behaviors. We also explored the application of BBNs to environmental behavior by comparing BBNs with logistic regression models.
The research objectives are (1) to reveal the underlying structure of variables related to GSI adoption in Vermont, including demographic variables (county, income, age, residence type, and residence ownership), perception of stormwater-related risks (runoff, lawn erosion, and neighborhood flooding issues), and responsibility attribution (opinion on which parties should be responsible for mitigating stormwater runoff) in order to identify significant connections between these factors; and (2) to compare the Bayesian Belief Network approach to logistic regression models and explore the utility of BBN in studying public perception of environmental issues and pro-environmental behaviors.

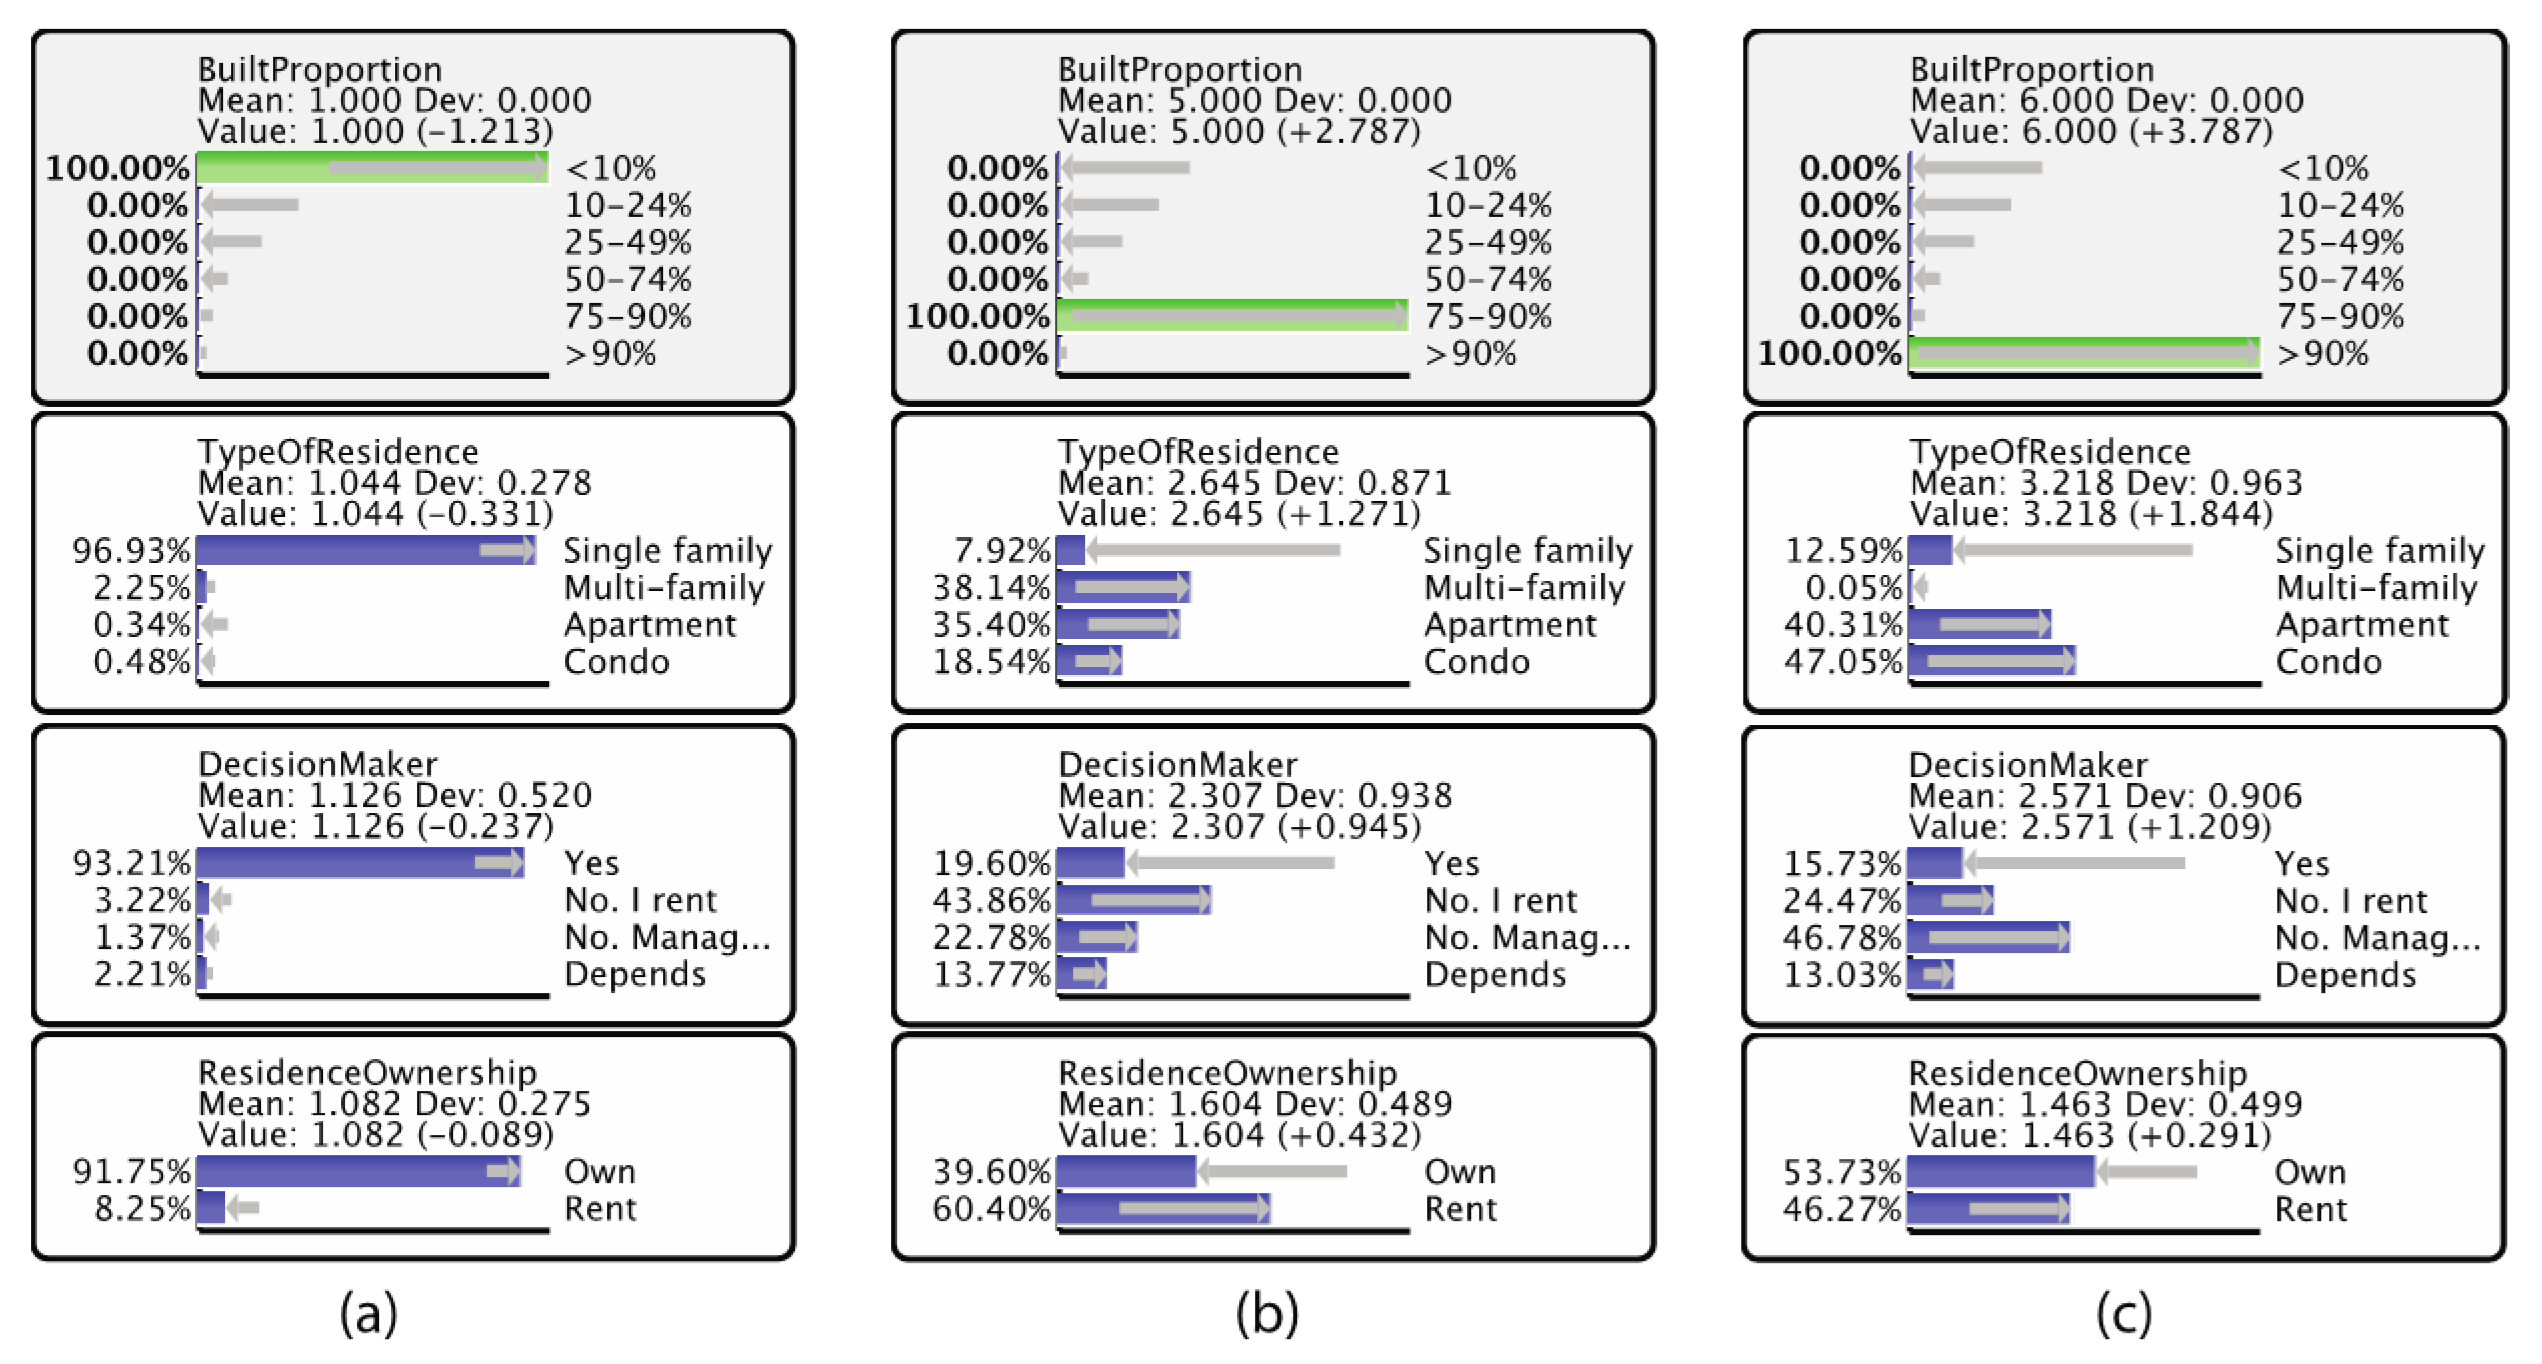
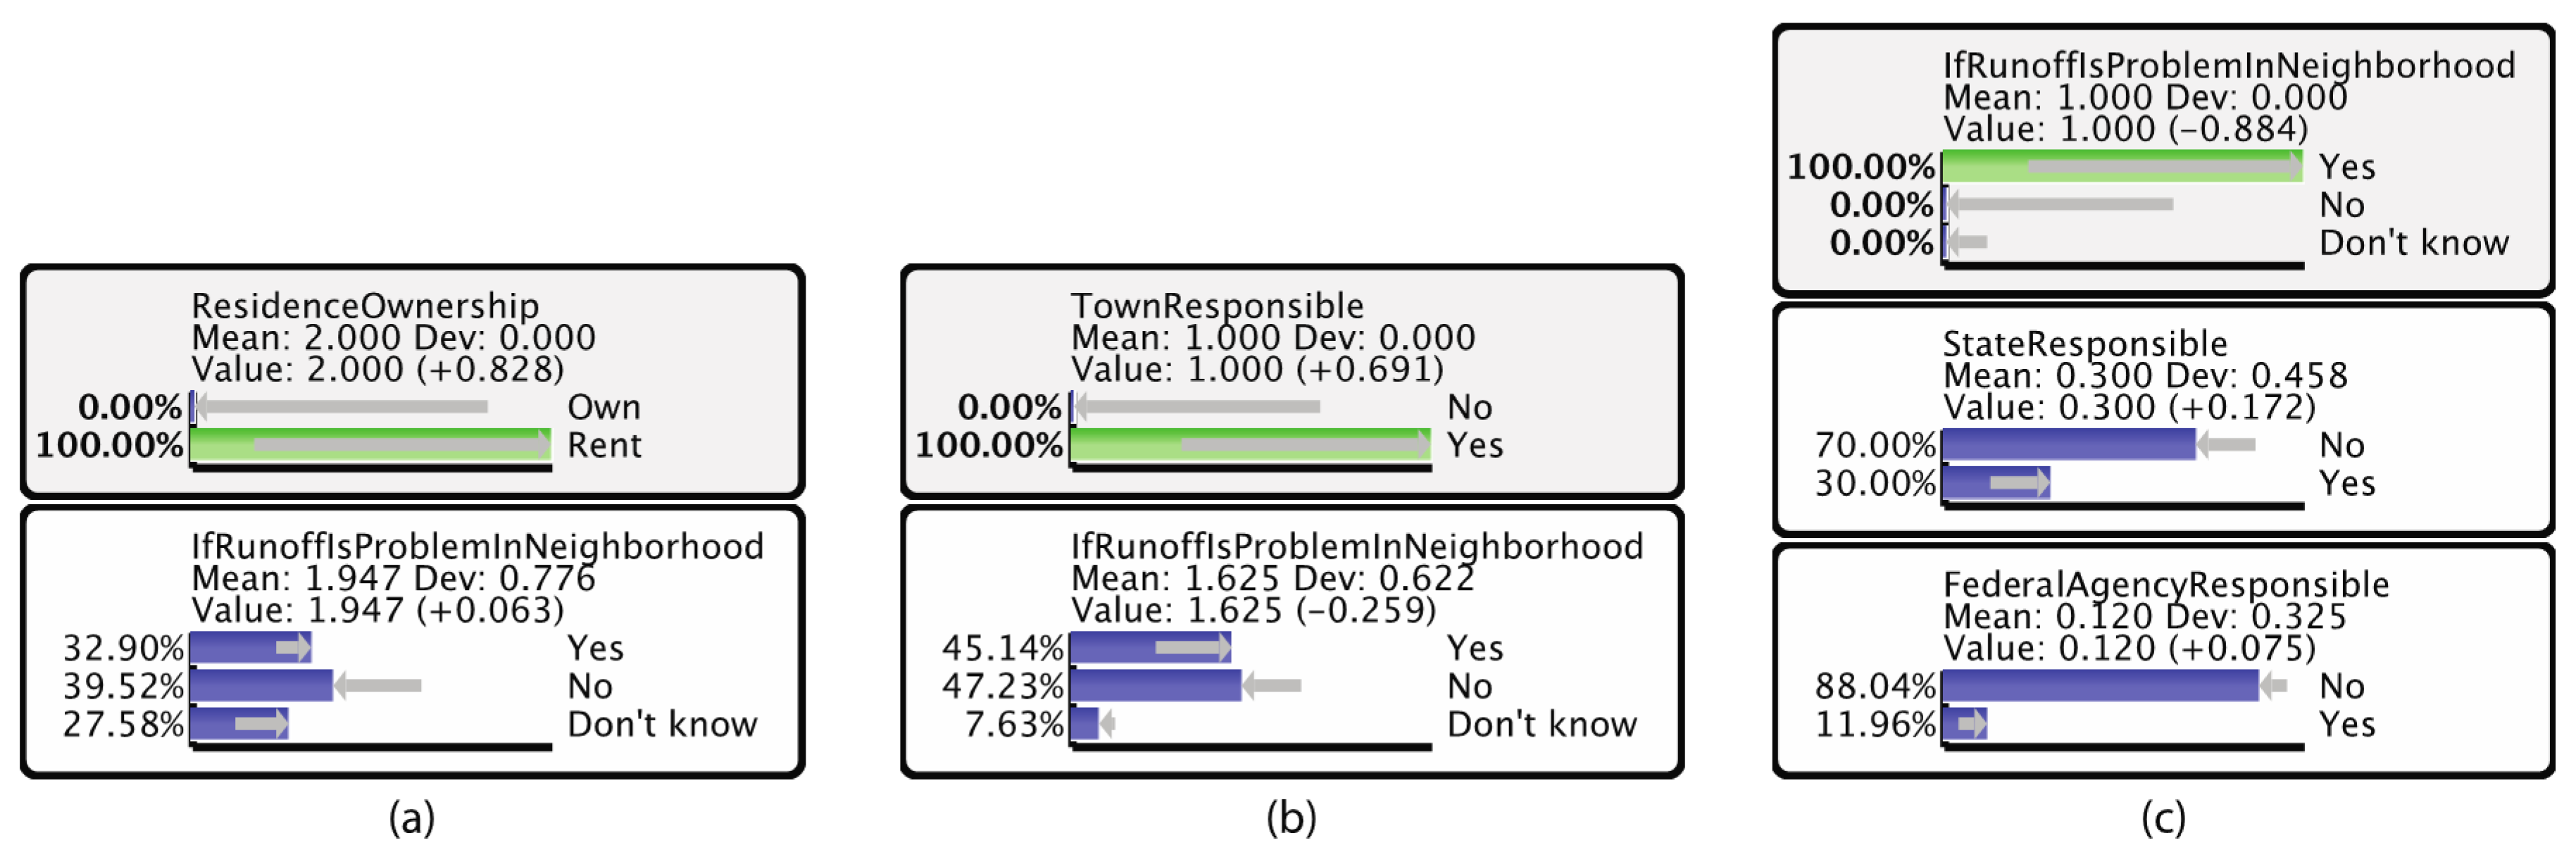
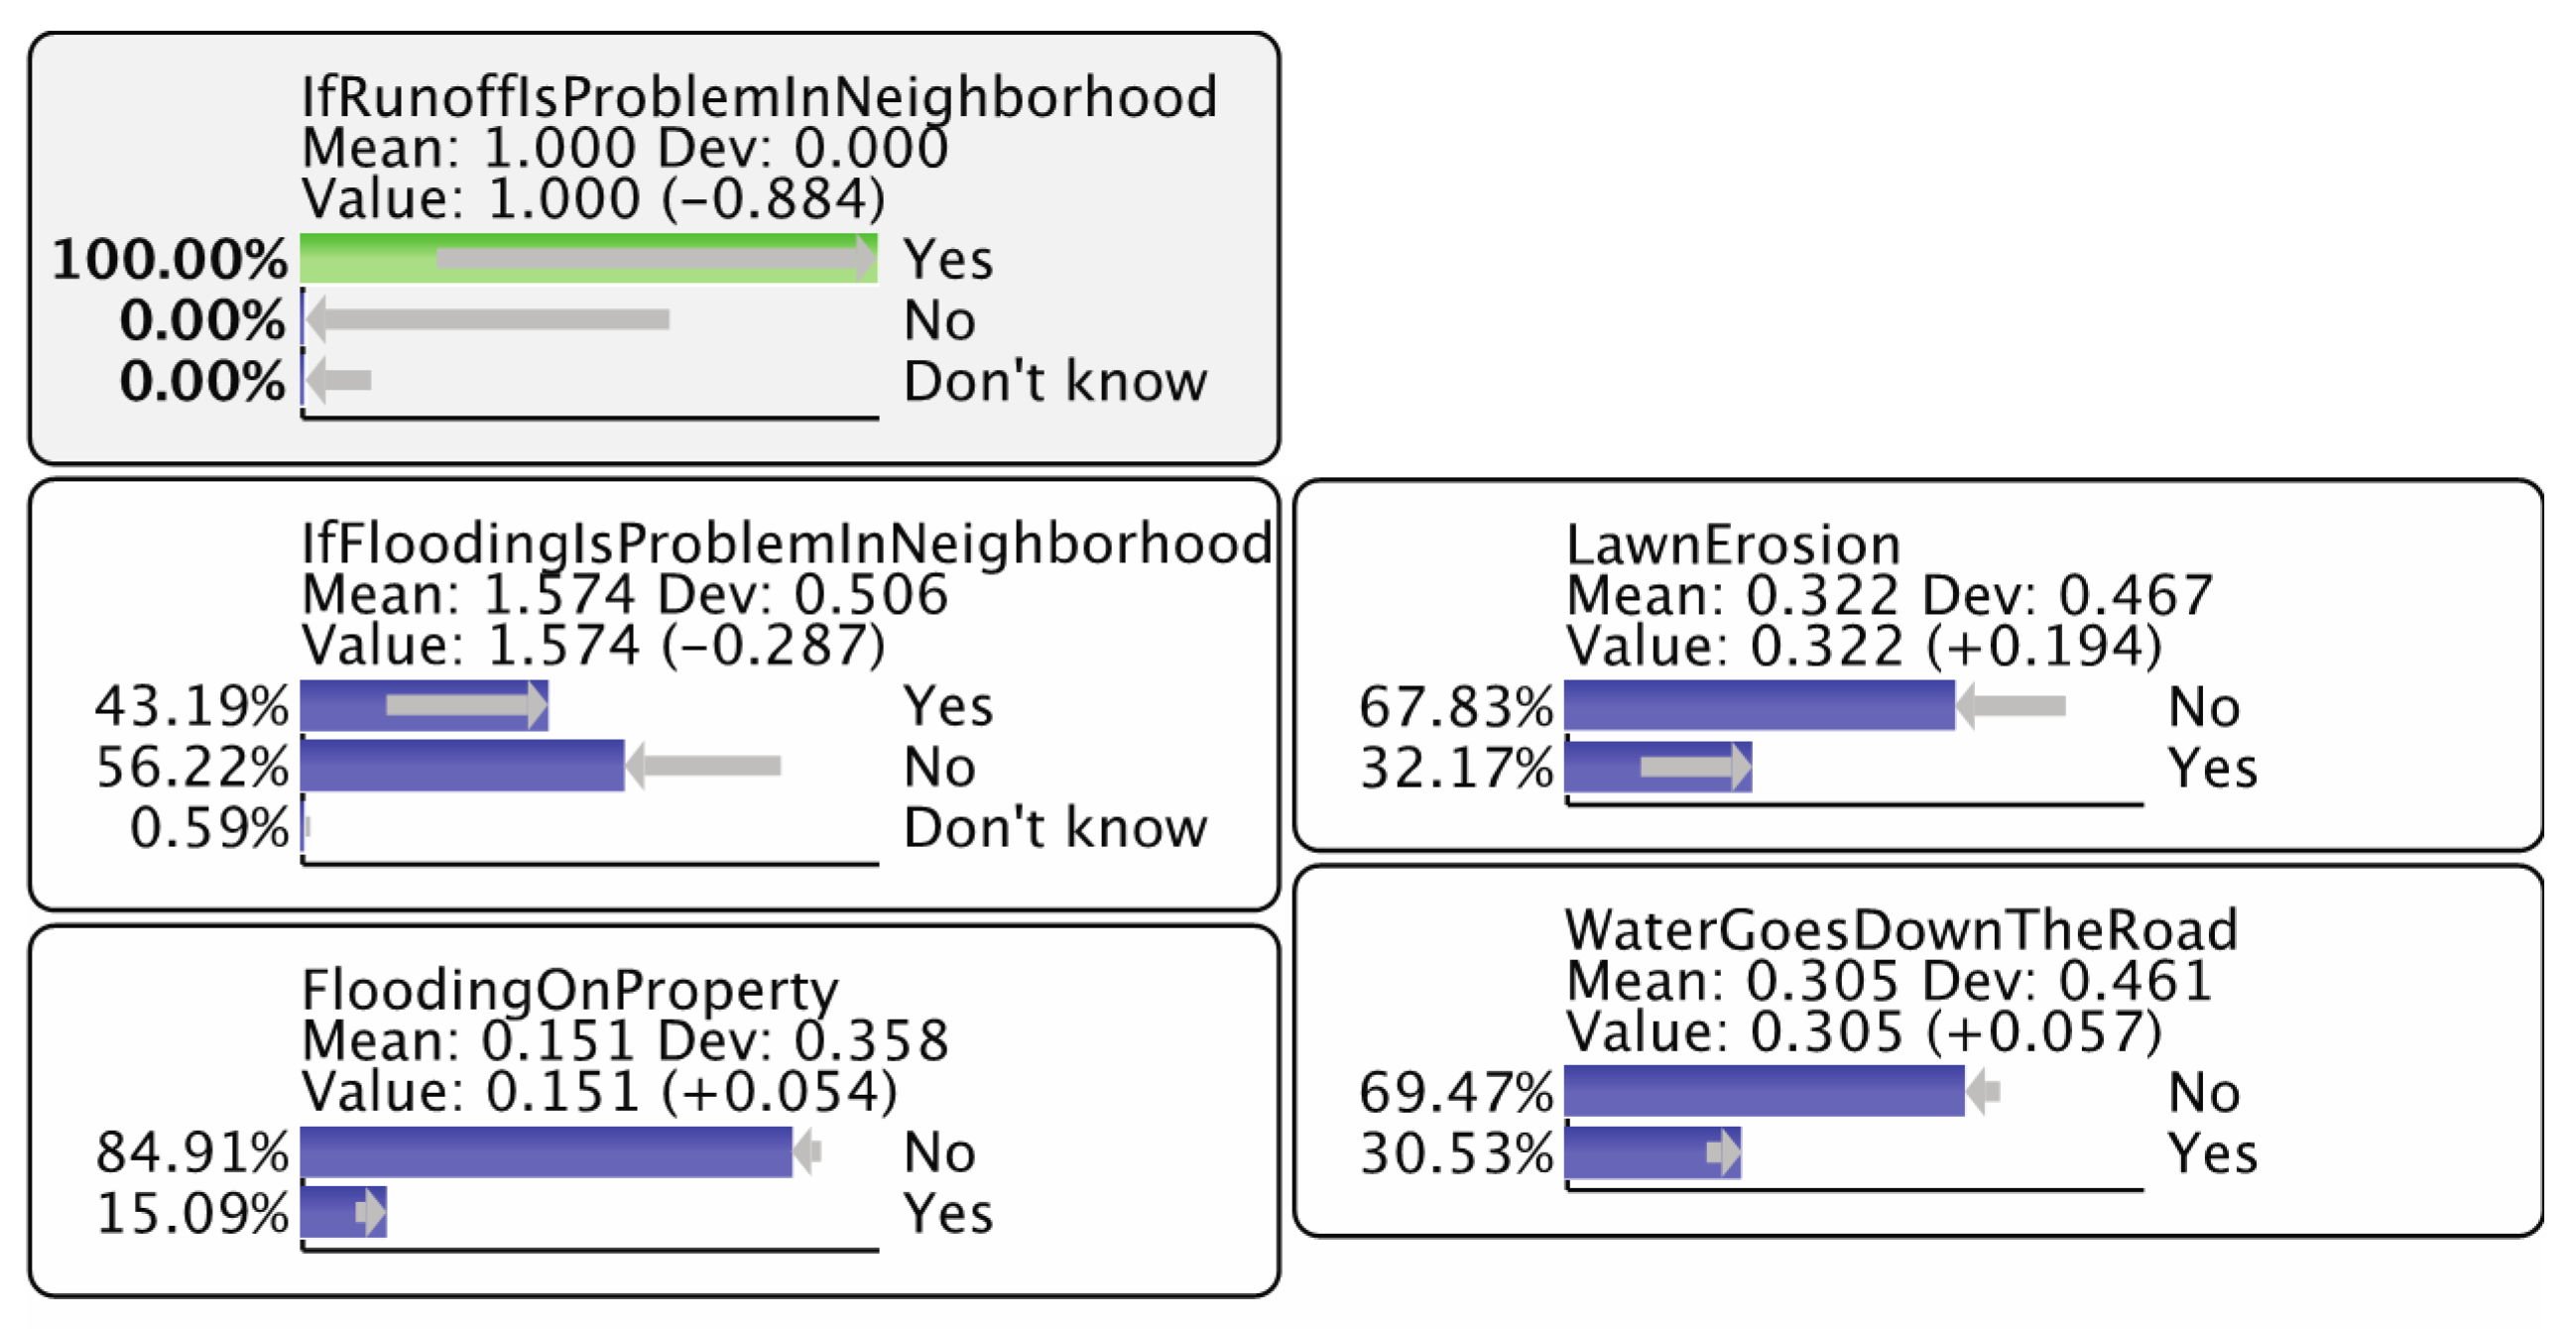
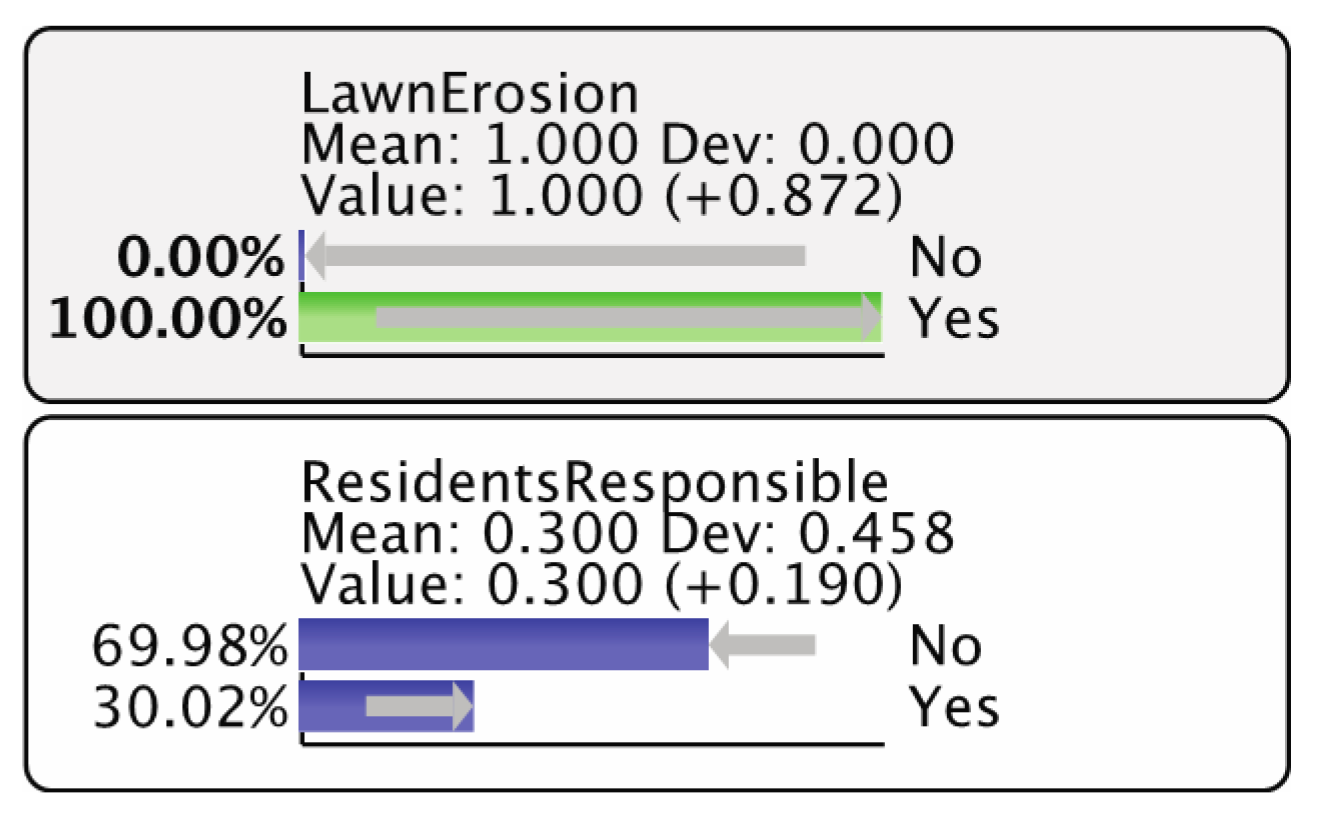
2. Materials and Methods

2.1. Methods and Survey Data

This study uses survey data collected in the summer of 2015 from residential properties in the state of Vermont, U.S. See Appendix A for the full list of survey questions listed in this study. The questionnaire contained 23 multiple choice questions on a probabilistic, address-based sample of the entire state of Vermont.
This dataset was also analyzed in Coleman et al. [43] using logistic regression. The analysis in this study looked into different hypotheses and used BBN as the analyzing method. It included 18 questions from the survey. The sample was rebalanced using the procedure of iterative proportional fitting, and weights were generated according to four variables: income, education, age, and gender based on the 2015 estimate of the U.S. Census for Vermont.
The survey received 577 responses, and the response rate is 15.2%. After dropping incomplete cases for the four variables used in data raking (income, education, age, and gender), the final sample size was 472. The preprocessed data with weights were imported into Bayesialab (v.6, 2017), software for conducting analyses based on Bayesian Belief Networks. Both unsupervised and supervised learning algorithms were implemented on the dataset.
Unsupervised learning was used for knowledge discovery from the whole dataset without network(s) graphically based on their probabilistic relationships. This method revealed the underlying group-structure among all variables and identified important connections for further interpretation. In the outcome networks, we set a few key variables to a 100% probability as "hard evidence" to observe the implications and influences on other variables given the entire network. Hard evidence means no uncertainty regarding the state of the variable (node), i.e., P (Event = True) = 100% [44]. This allowed us to inspect the dynamics that emerged from the associated variables and causal relationships.
Supervised learning targeted the behavioral question (Q14. Which GSIs are currently adopted at your primary residence? See Appendix A for the complete questionnaire) on eight categories of adopted GSIs (roof diversion, permeable pavement, infiltration trenches, green roofs, rain gardens, constructed wetlands, tree boxes, and other) and explored the associations between all other variables and the target question. Once the networks were generated, we also used hard evidence to explore how the other variables impose influences on the target behavioral question (adoption of GSIs at primary residence, Q14 in Appendix A). The supervised learning method provided insights for how strongly each factor influenced the behaviors (or the behavioral intentions) to adopt the green infrastructures.
For both the unsupervised and supervised learning analyses, networks were generated using different algorithms available in Bayesialab to find the most concise model. The minimum description length (MDL) scores of different algorithms were compared, and the network with the lowest score was selected for the subsequent analysis and probabilistic inference. Network performance was evaluated using a k-fold cross-validation procedure for the supervised learning networks. MDL score is a two-component score for estimating the number of bits required to represent a model and the data given this model. Based on Occam’s razor used in machine learning, a more concise model is better than a more complex one [44].
The MDL scores for different types of unsupervised algorithms (maximum spanning tree, taboo, EQ, SopLEO, and taboo order) and supervised algorithms (naïve Bayes, augmented naïve Bayes, and tree augmented naïve Bayes) applied to all variables of the behavioral questions (Q14, currently adopted GSI) are shown in Appendix B. The algorithms with the lowest score were selected to conduct the following analyses. The results of performance evaluation and model validation are attached in Appendix C. In the networks produced by the selected algorithm, the node size indicates the predictive importance on the target variable (in supervised networks) or entire network (in unsupervised networks) of observing the predictive variable [45] (p. 48). The thickness of the edges represents Pearson’s correlation between the node and the target node.

2.2. Comparison with Logistic Regression Models

Logistic regression analyses were also performed on the data. The dataset was split into a learning set (75%) and a testing set (25%). The models were generated from the learning set, and the predictions and Receiver Operating Characteristic (ROC) curves were generated based on the test set (plotting sensitivity, the probability of predicting a real positive will be a positive, against 1-specificity, the probability of predicting a real negative will be positive). The ROC curves of both logistic and BBN models were used to compare the predictability of the two modeling methods.
The tested hypotheses are:
  • Respondents having higher household incomes are more likely to adopt GSI.
  • Older respondents (>40 years) are more likely to adopt GSI.
  • Respondents living in single-family houses are more likely to adopt GSI compared to other types of residence.
  • Respondents who have larger land parcels are more likely to adopt GSI.
  • Compared to renters, respondents who own their properties are more likely to adopt GSI.
  • Respondents who perceive stormwater-related risks in their neighborhood are more likely to adopt GSI.

3. Results

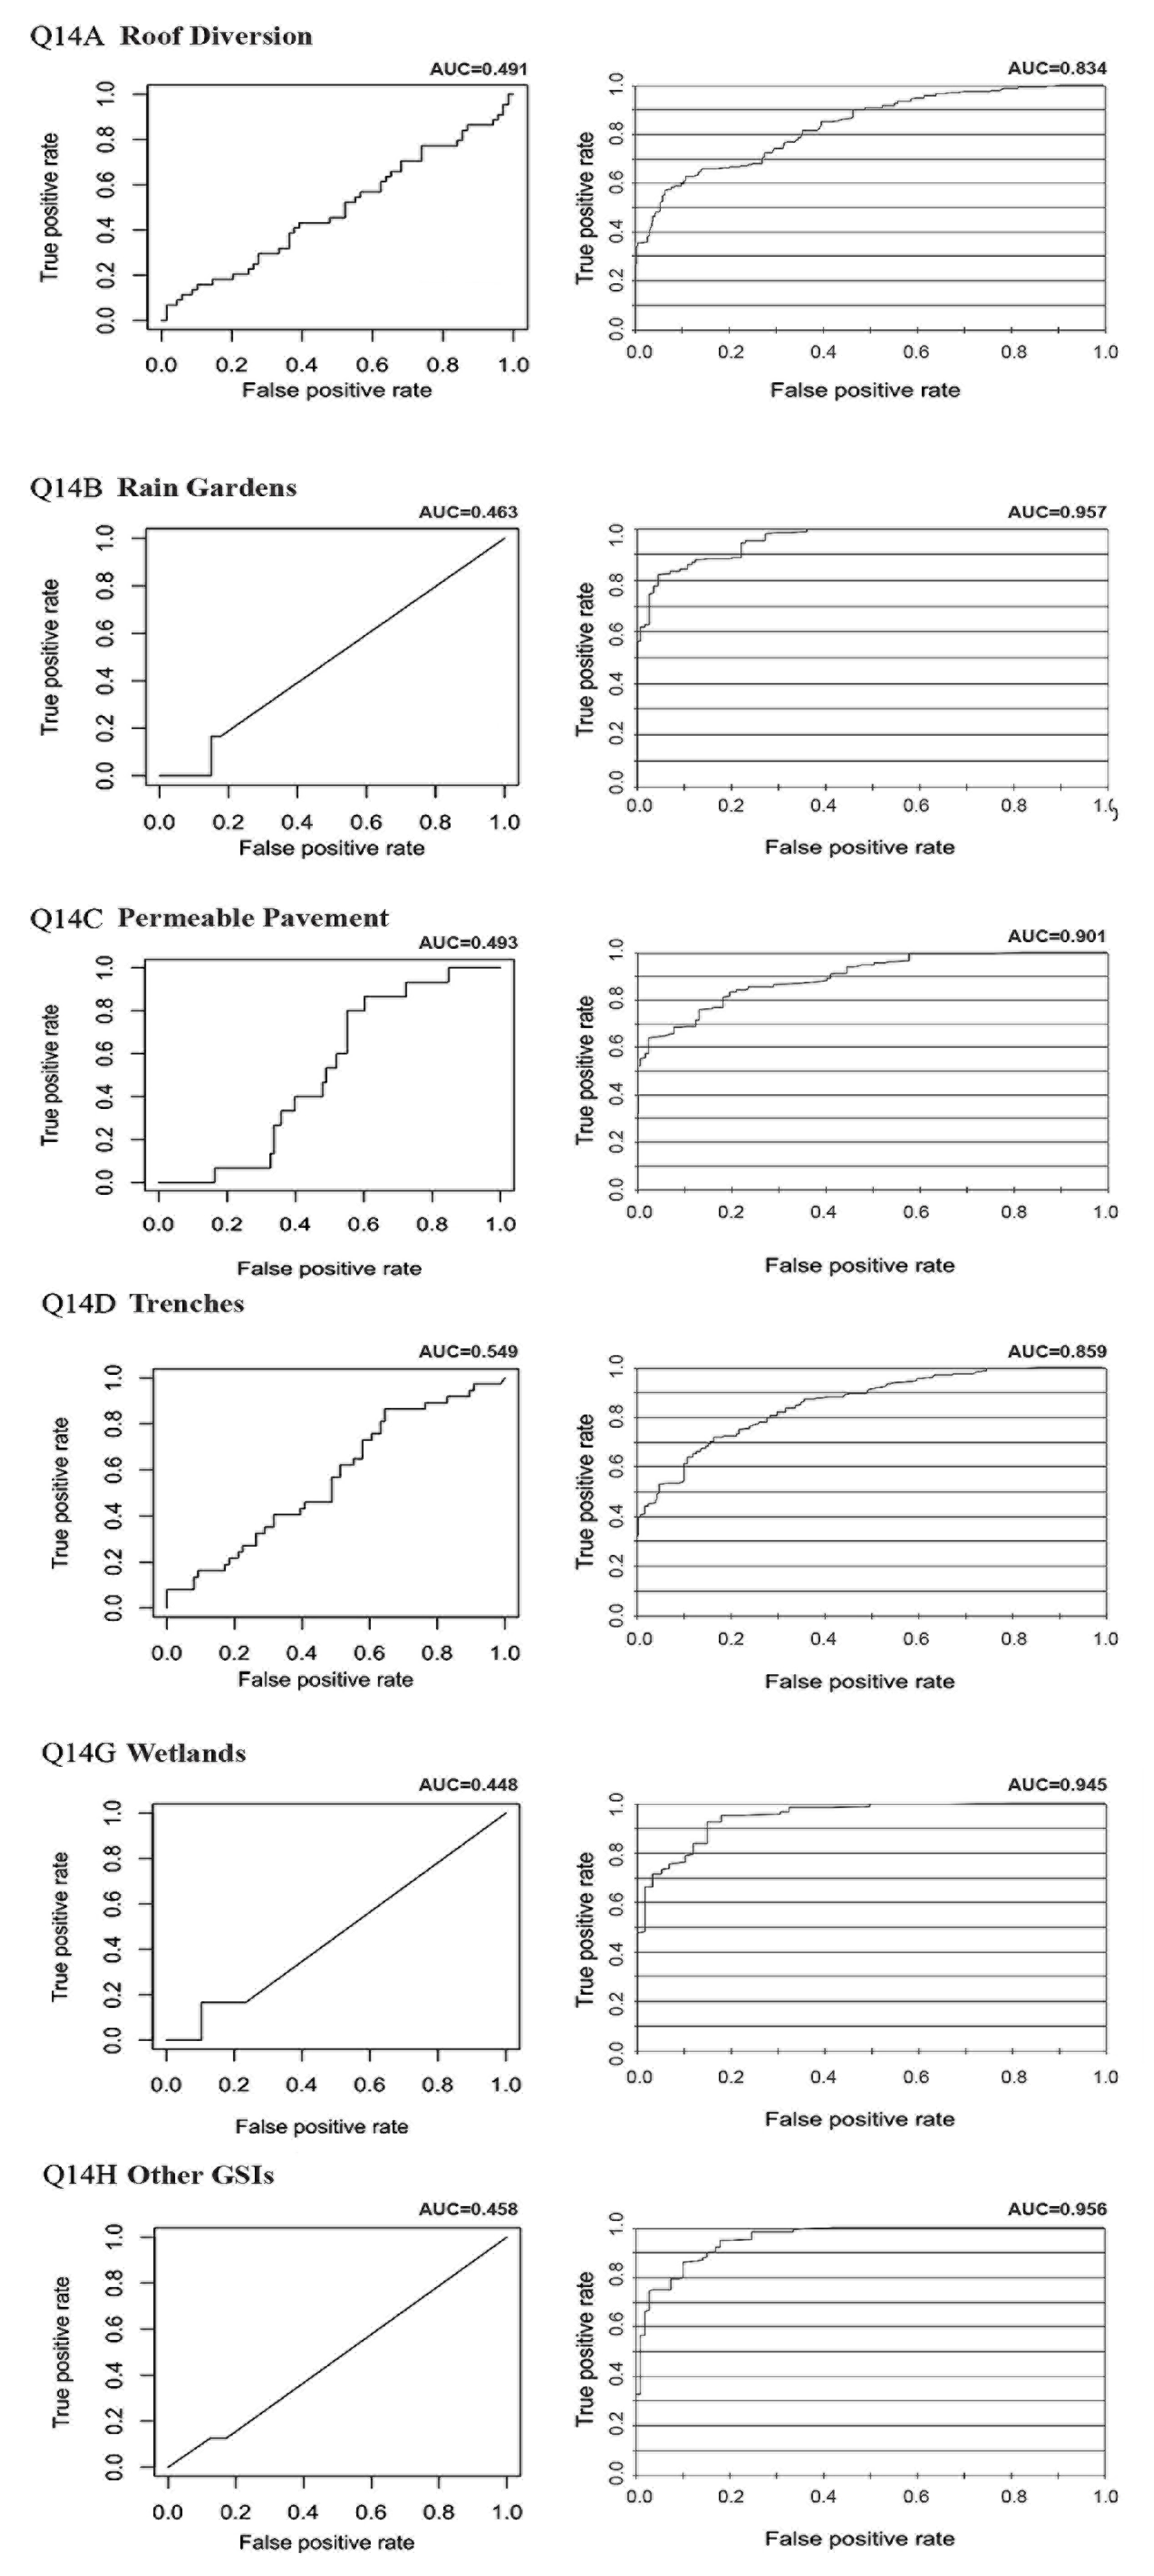
3.1. Comparison of BBN and Logistic Regression Models

The logistic regression model did not yield any meaningful predictors for rain gardens, wetlands, and other types of GSI, presumably because of the low sample sizes in these categories. Green roofs and tree boxes have too few respondents that have adopted these GSIs, and the test set does not have any positive values, so the model also produced unreliable results on these two types of GSI. More reliable results were obtained for roof diversion, permeable pavement, and infiltration trenches. Appendix D summarizes the relatively meaningful variables in predicting the currently adopted green infrastructure. The results show some similarities with the Bayesian network results, such as compost usage and income for the adoption of infiltration trenches. However, there is little overlap among predictors between the two methods.
Figure 1 shows the ROC curves of each GSI option in Q14. Tree boxes (Q14E) and green roofs (Q14F) are not included because of the small number of positive responses. In the figure, AUC, “Area Under the ROC Curve,” is used to indicate the reliability of the models. An AUC of 1.0 indicates that the model predictions are 100% accurate. An AUC of 0.0 indicates that the model predictions are 0% accurate. The higher the AUS is, the more reliable the model is. As shown in the figure, the Bayesian Belief Network approach outperforms the logistic models in predicting the test set data effectively.

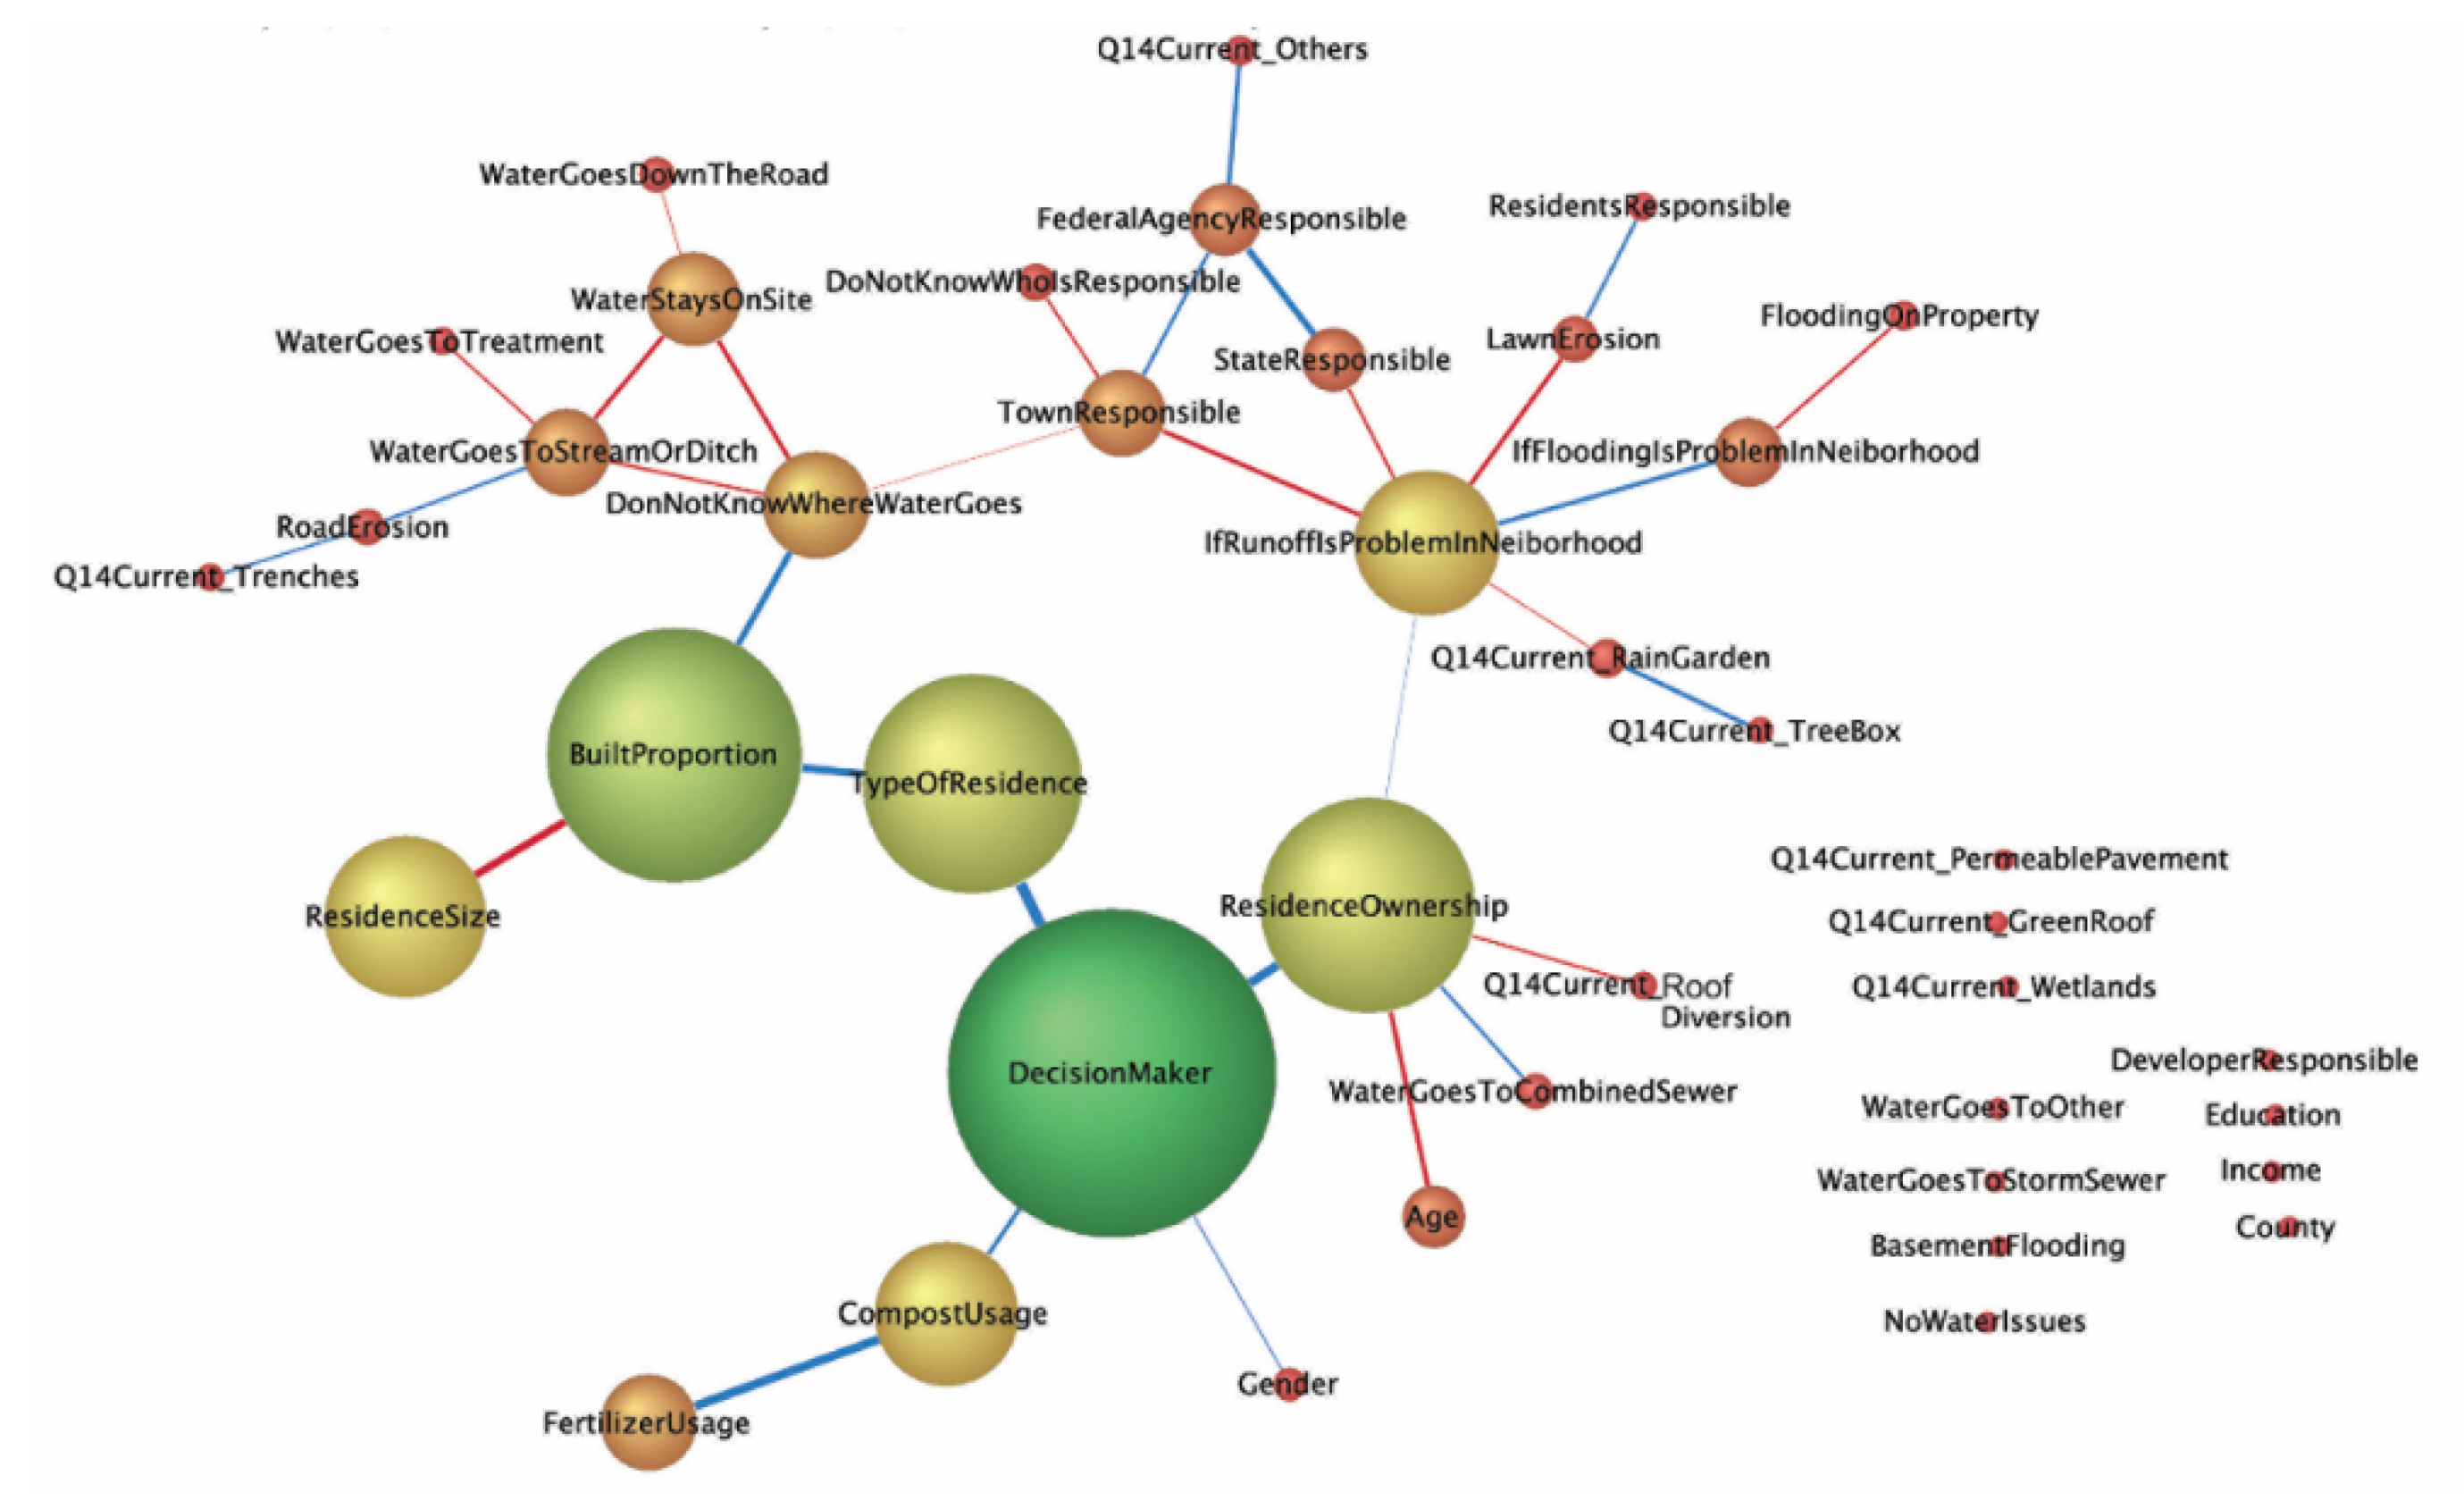
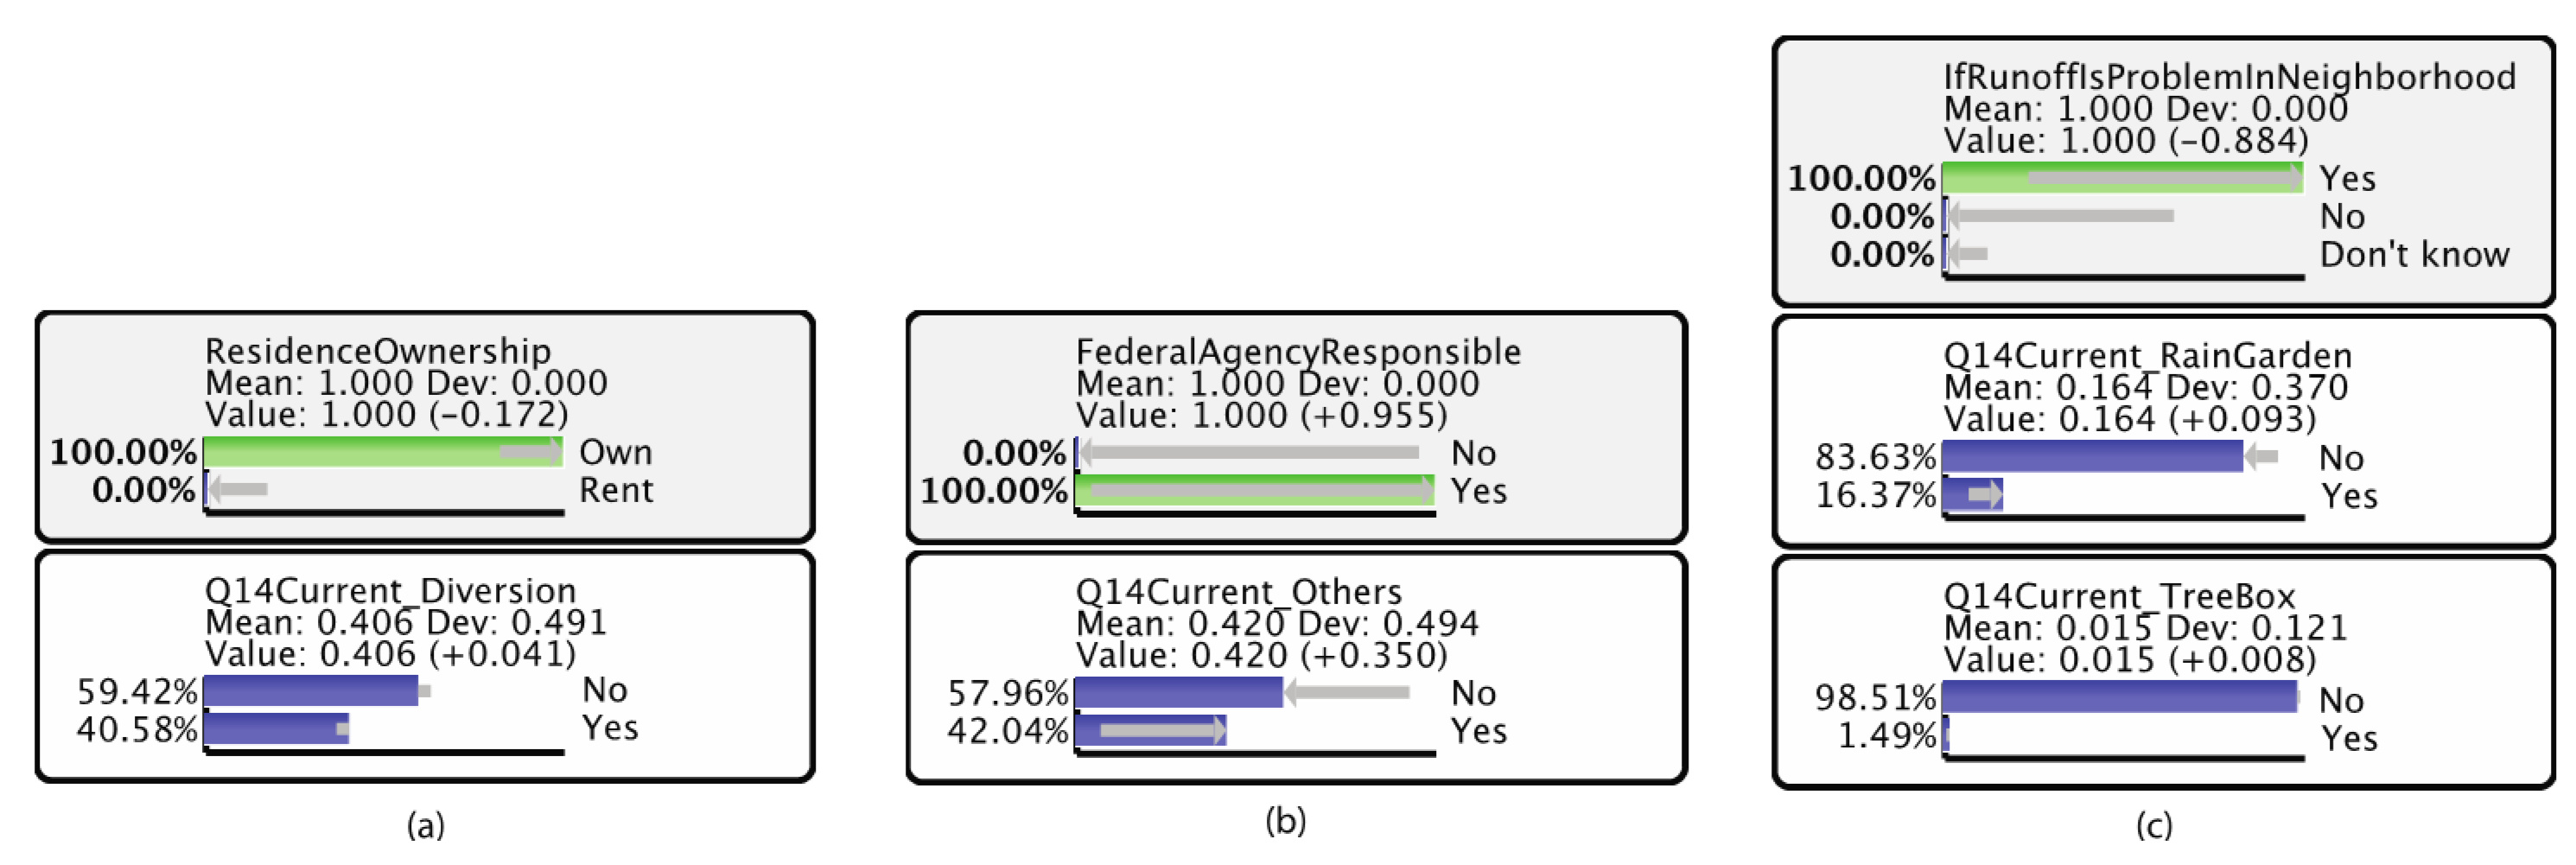
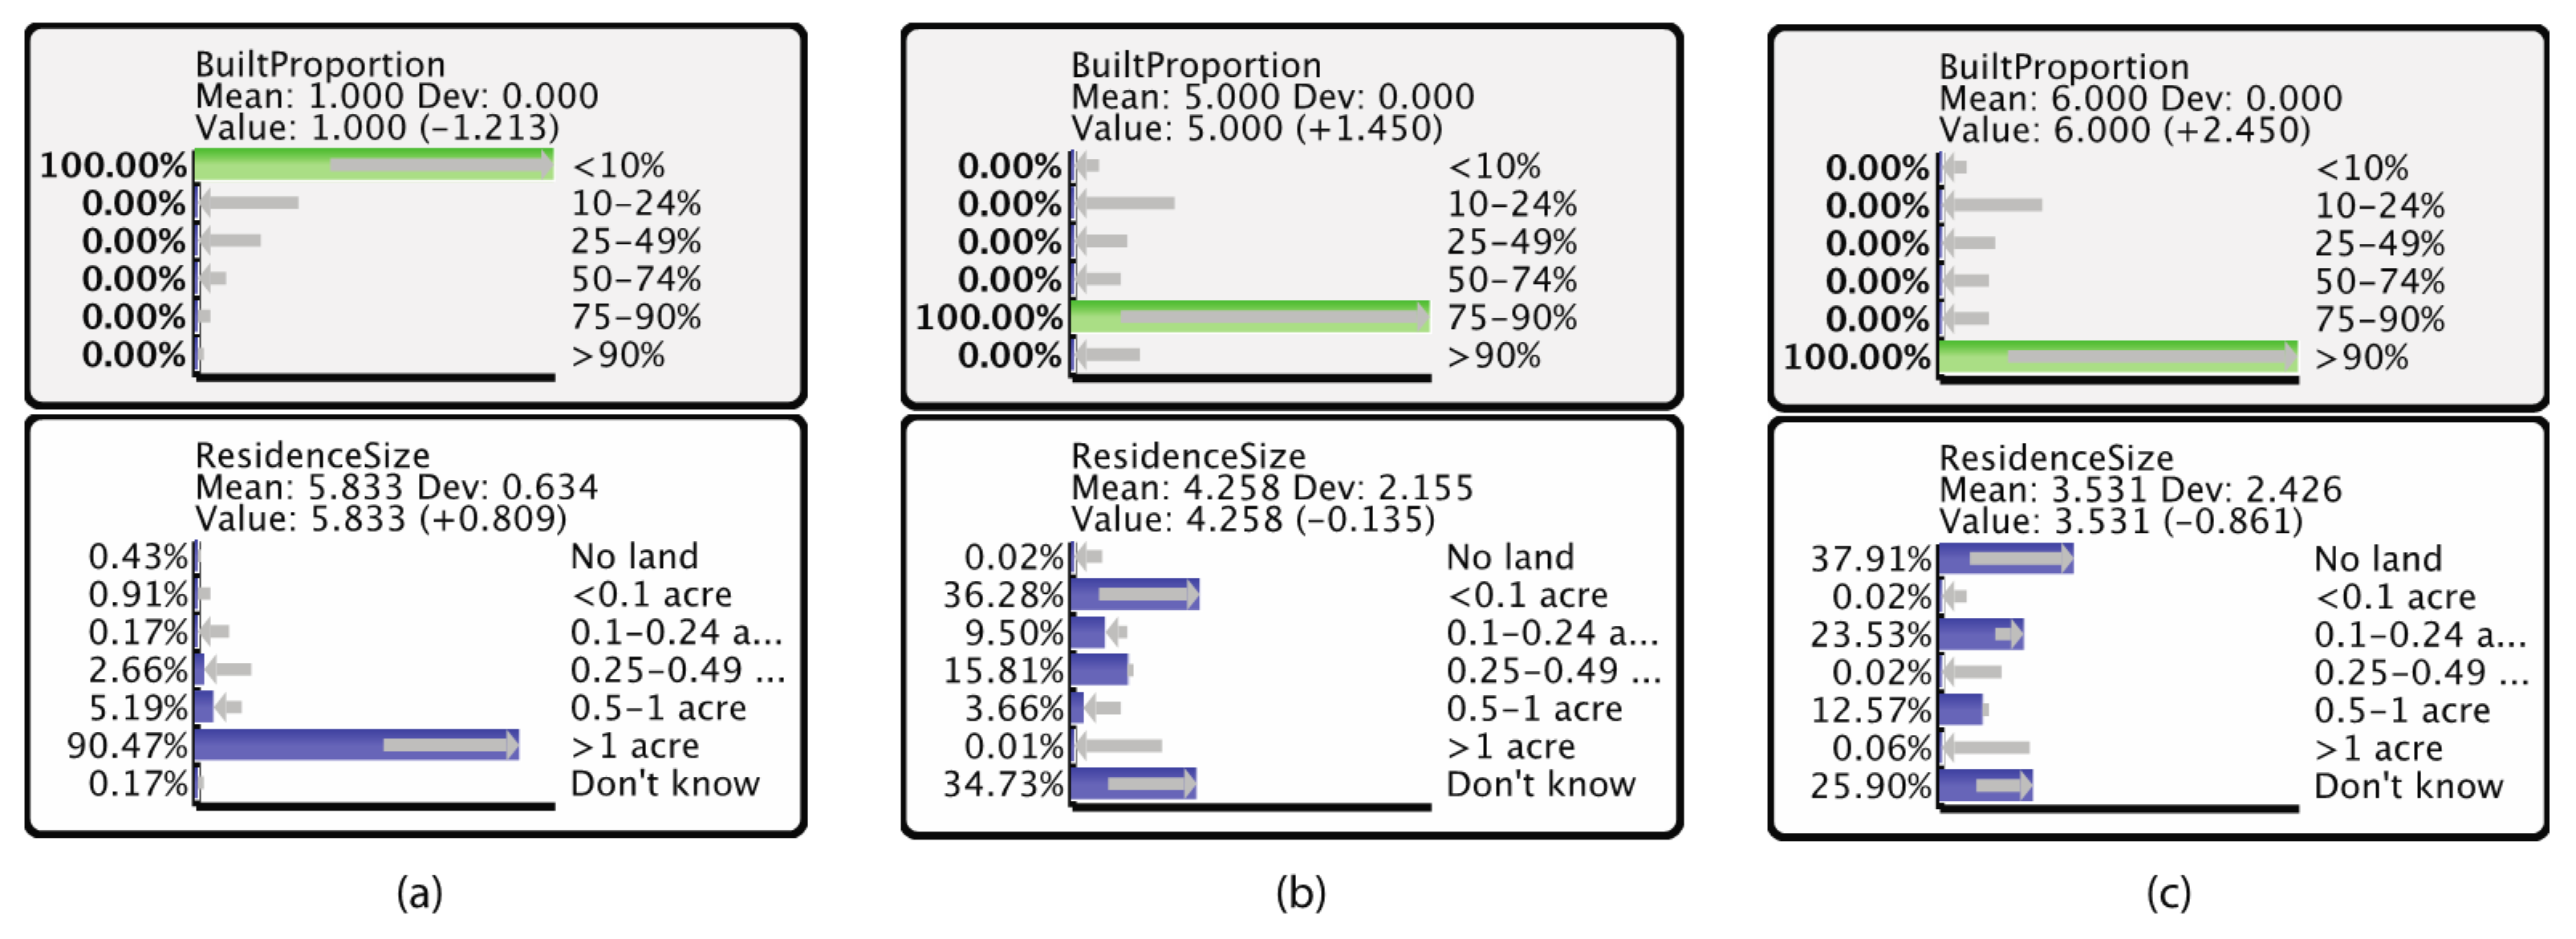
3.2. Unsupervised Learning on Currently Adopted Green Stormwater Infrastructures

The behavioral variable (Q14, currently adopted GSIs) and the other variables are connected in the network, as shown in Figure 2. The variables isolated by the major network are shown separately on the lower right corner of the diagram. The nodes having the largest influence on the network are those who make decisions, built proportion (proportion of built infrastructure on the property), ownership of property, and type of property. Meanwhile, property size, compost usage, and if the runoff is an issue in the neighborhood are also relatively influential in the network.
Three of the eight categories of currently adopted green stormwater infrastructure included in the questionnaire (permeable pavement, green roof, and constructed wetlands) are not connected with the other variables. The other five types of stormwater infrastructures (roof diversion, tree boxes, rain gardens, infiltration trenches, and other GSIs) are connected in the general network. The probabilistic inference results shown in Figure 3 indicate that owning the residence is associated with a higher likelihood of having adopted roof diversion (Figure 3a). The residents that report problems with runoff in their neighborhoods are more likely to have adopted rain gardens as a mitigation strategy, which subsequently increases the likelihood of having adopted tree boxes (Figure 3c). Attributing responsibility to the federal agencies for the stormwater issues in the neighborhood increases the probability of the current adoption of other types of stormwater infrastructures (Figure 3b).
The residences with lower built proportion tend to have larger lots (oftentimes single-family residence, Figure 4a and Figure 5a), and higher built proportion associates with smaller lots or land that is not owned by the resident (apartment or condominium, Figure 4b and Figure 5b). Lower built proportion and larger lots are linked to a higher posterior probability of owning the residence (Figure 5a). Therefore, it is more likely that the respondents (owners) make decisions on property management (Figure 5a). Residence with higher built proportion and smaller lots are more likely to be rental or have no owned land, and the decisions are more likely to be made by non-resident owners or neighborhood decision-making bodies such as a homeowner association (Figure 5b,c).
The recognition of stormwater runoff issues in the neighborhood is tied to several factors. Compared to homeowners, renters are more likely to think that stormwater runoff is an issue in the neighborhood (Figure 6a). Those who think their town is responsible for addressing runoff issues are also more likely to identify them as an issue in the neighborhood (Figure 6b). Meanwhile, when runoff issues are present in the neighborhood, the respondents are more likely to consider it to be the state and/or federal government’s responsibility to mitigate the runoff issue (Figure 6c).
Stormwater-related issues are likely to be identified together (i.e., residents that identify either runoff or flooding issues in the neighborhood are also likely to identify the other). The occurrence of a runoff issue also increases the probability of reporting lawn erosion issues, water running down the road, and flooding issues on the property (Figure 7). When a lawn erosion issue is reported on the property, the respondents are more likely to consider themselves to be responsible for mitigation measurements (Figure 8).

3.3. Supervised Learning

Only 0.18% of respondents reported their current adoption of tree boxes, and 0.46% have identified the current adoption of green roofs. The extremely small sample sizes caused model overfitting, so these two types of GSIs are not included in this section.

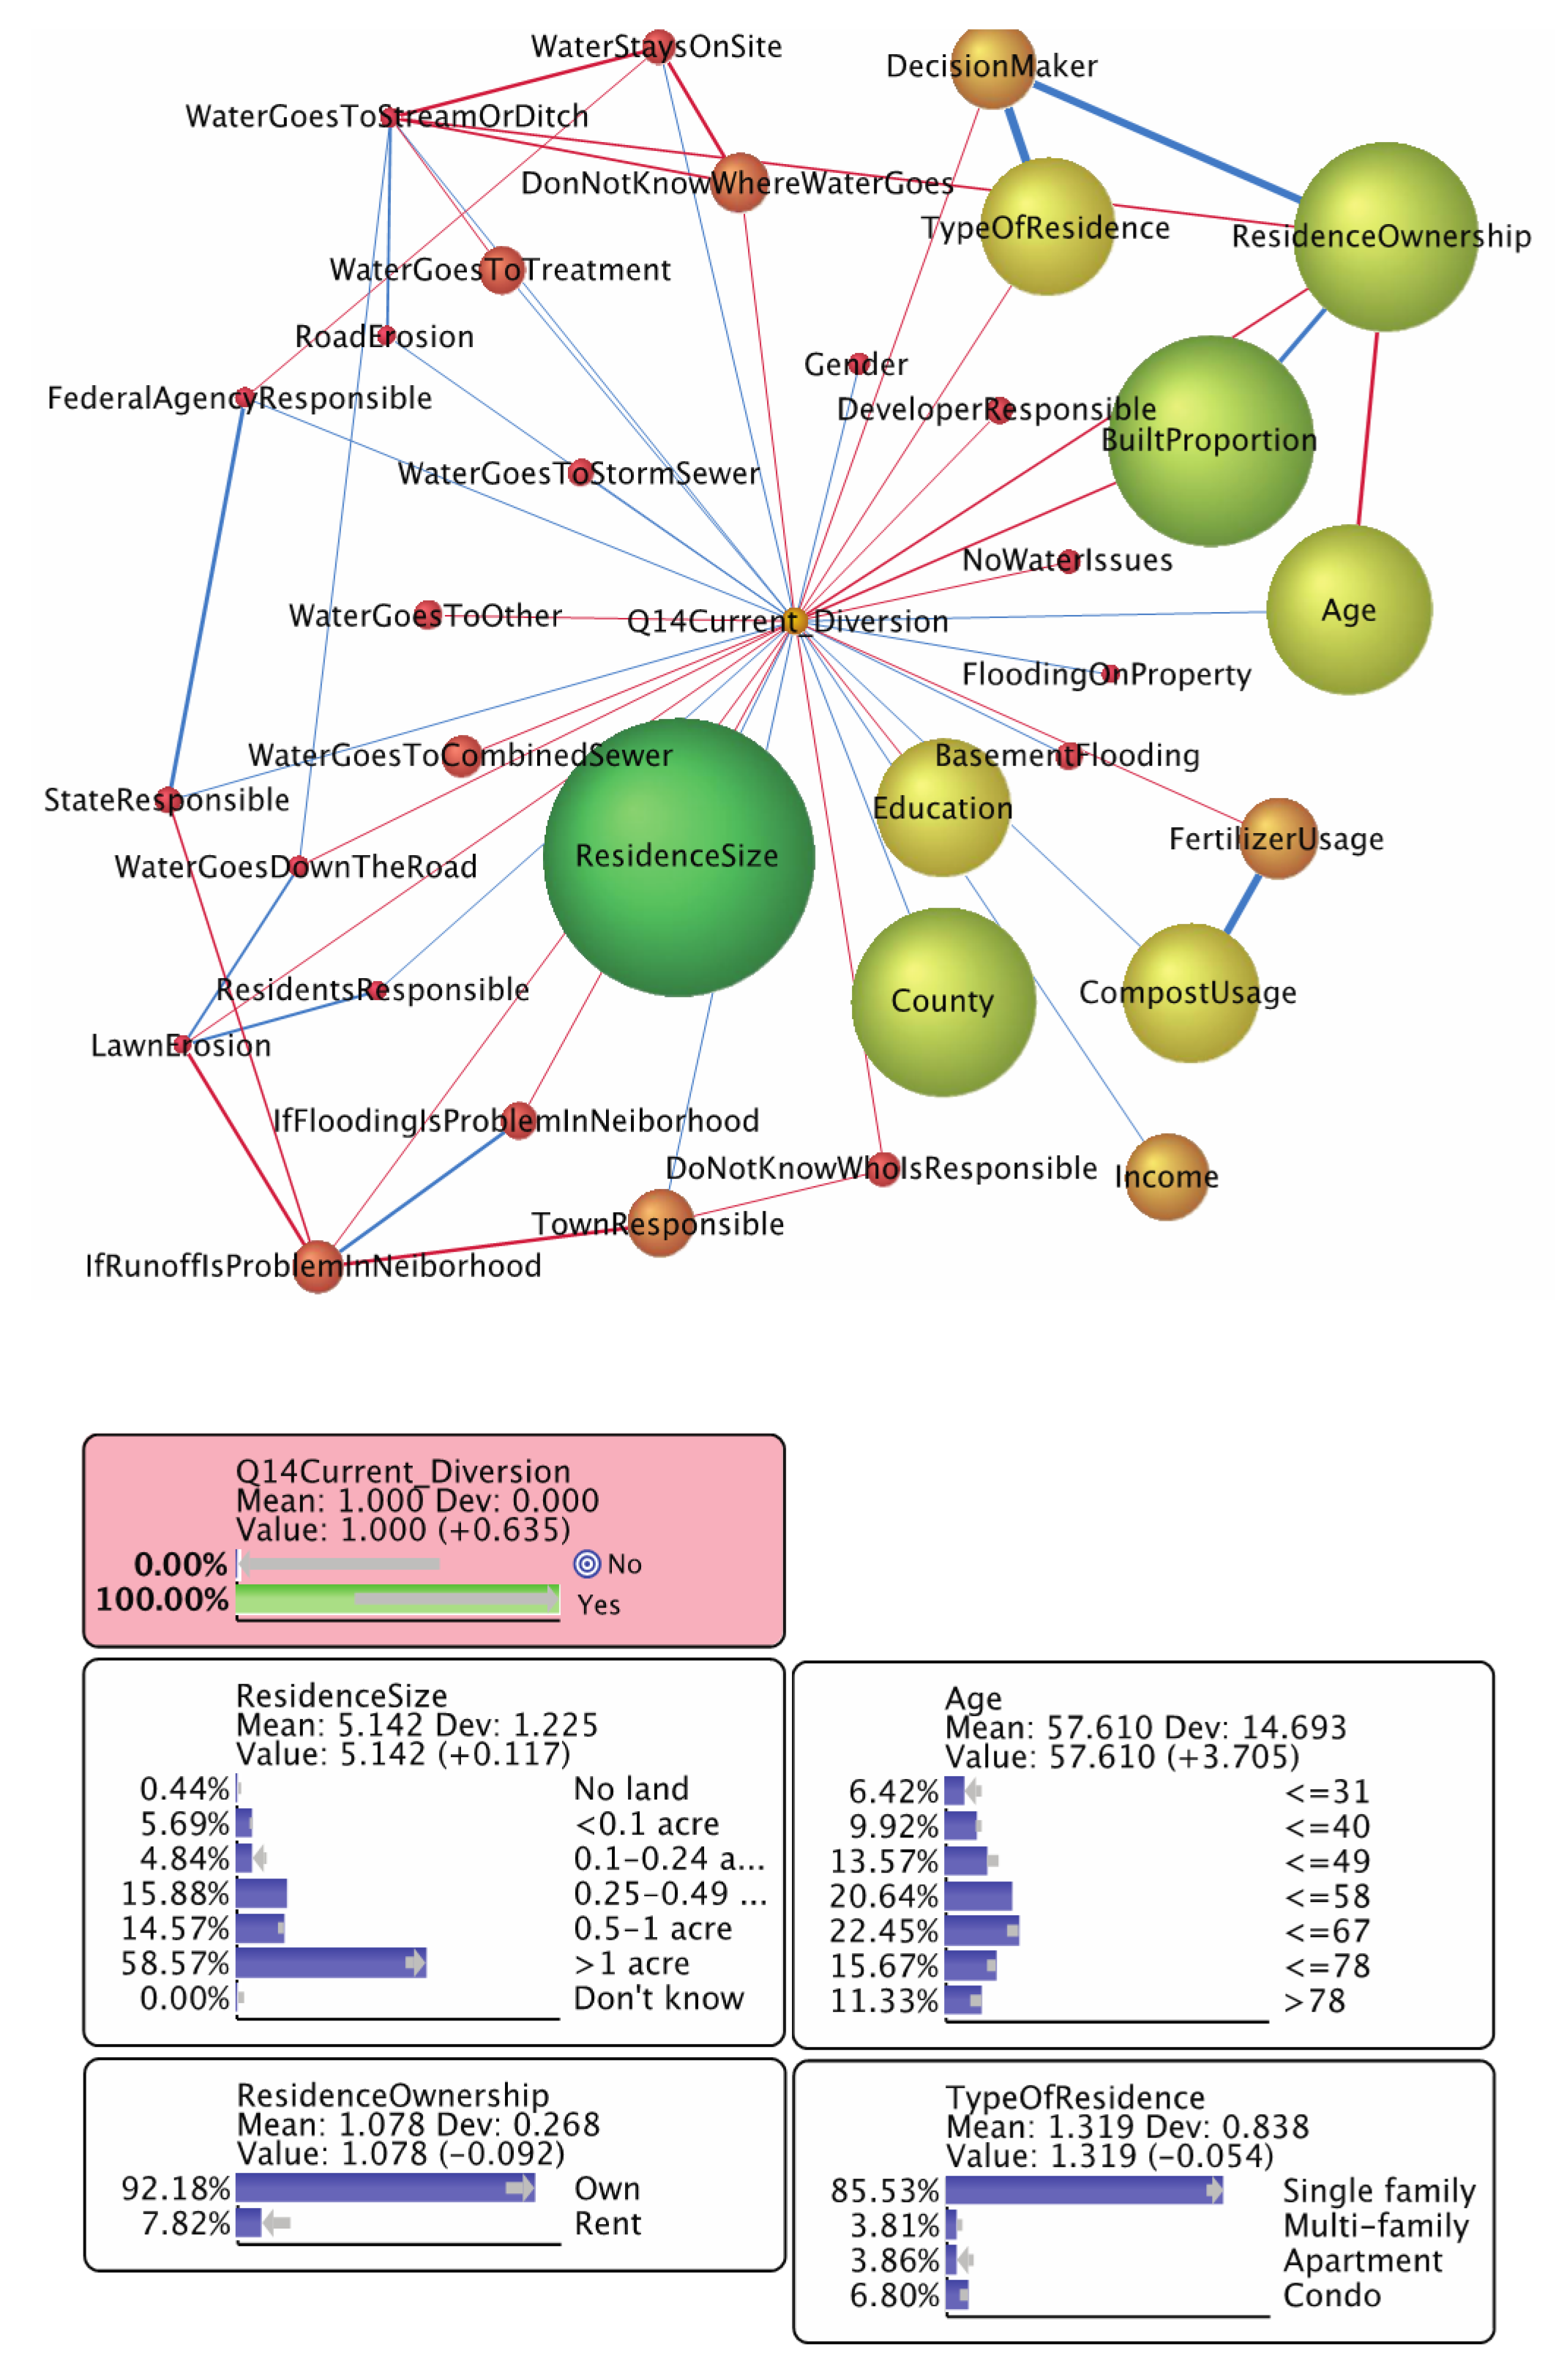
3.3.1. Roof Diversion
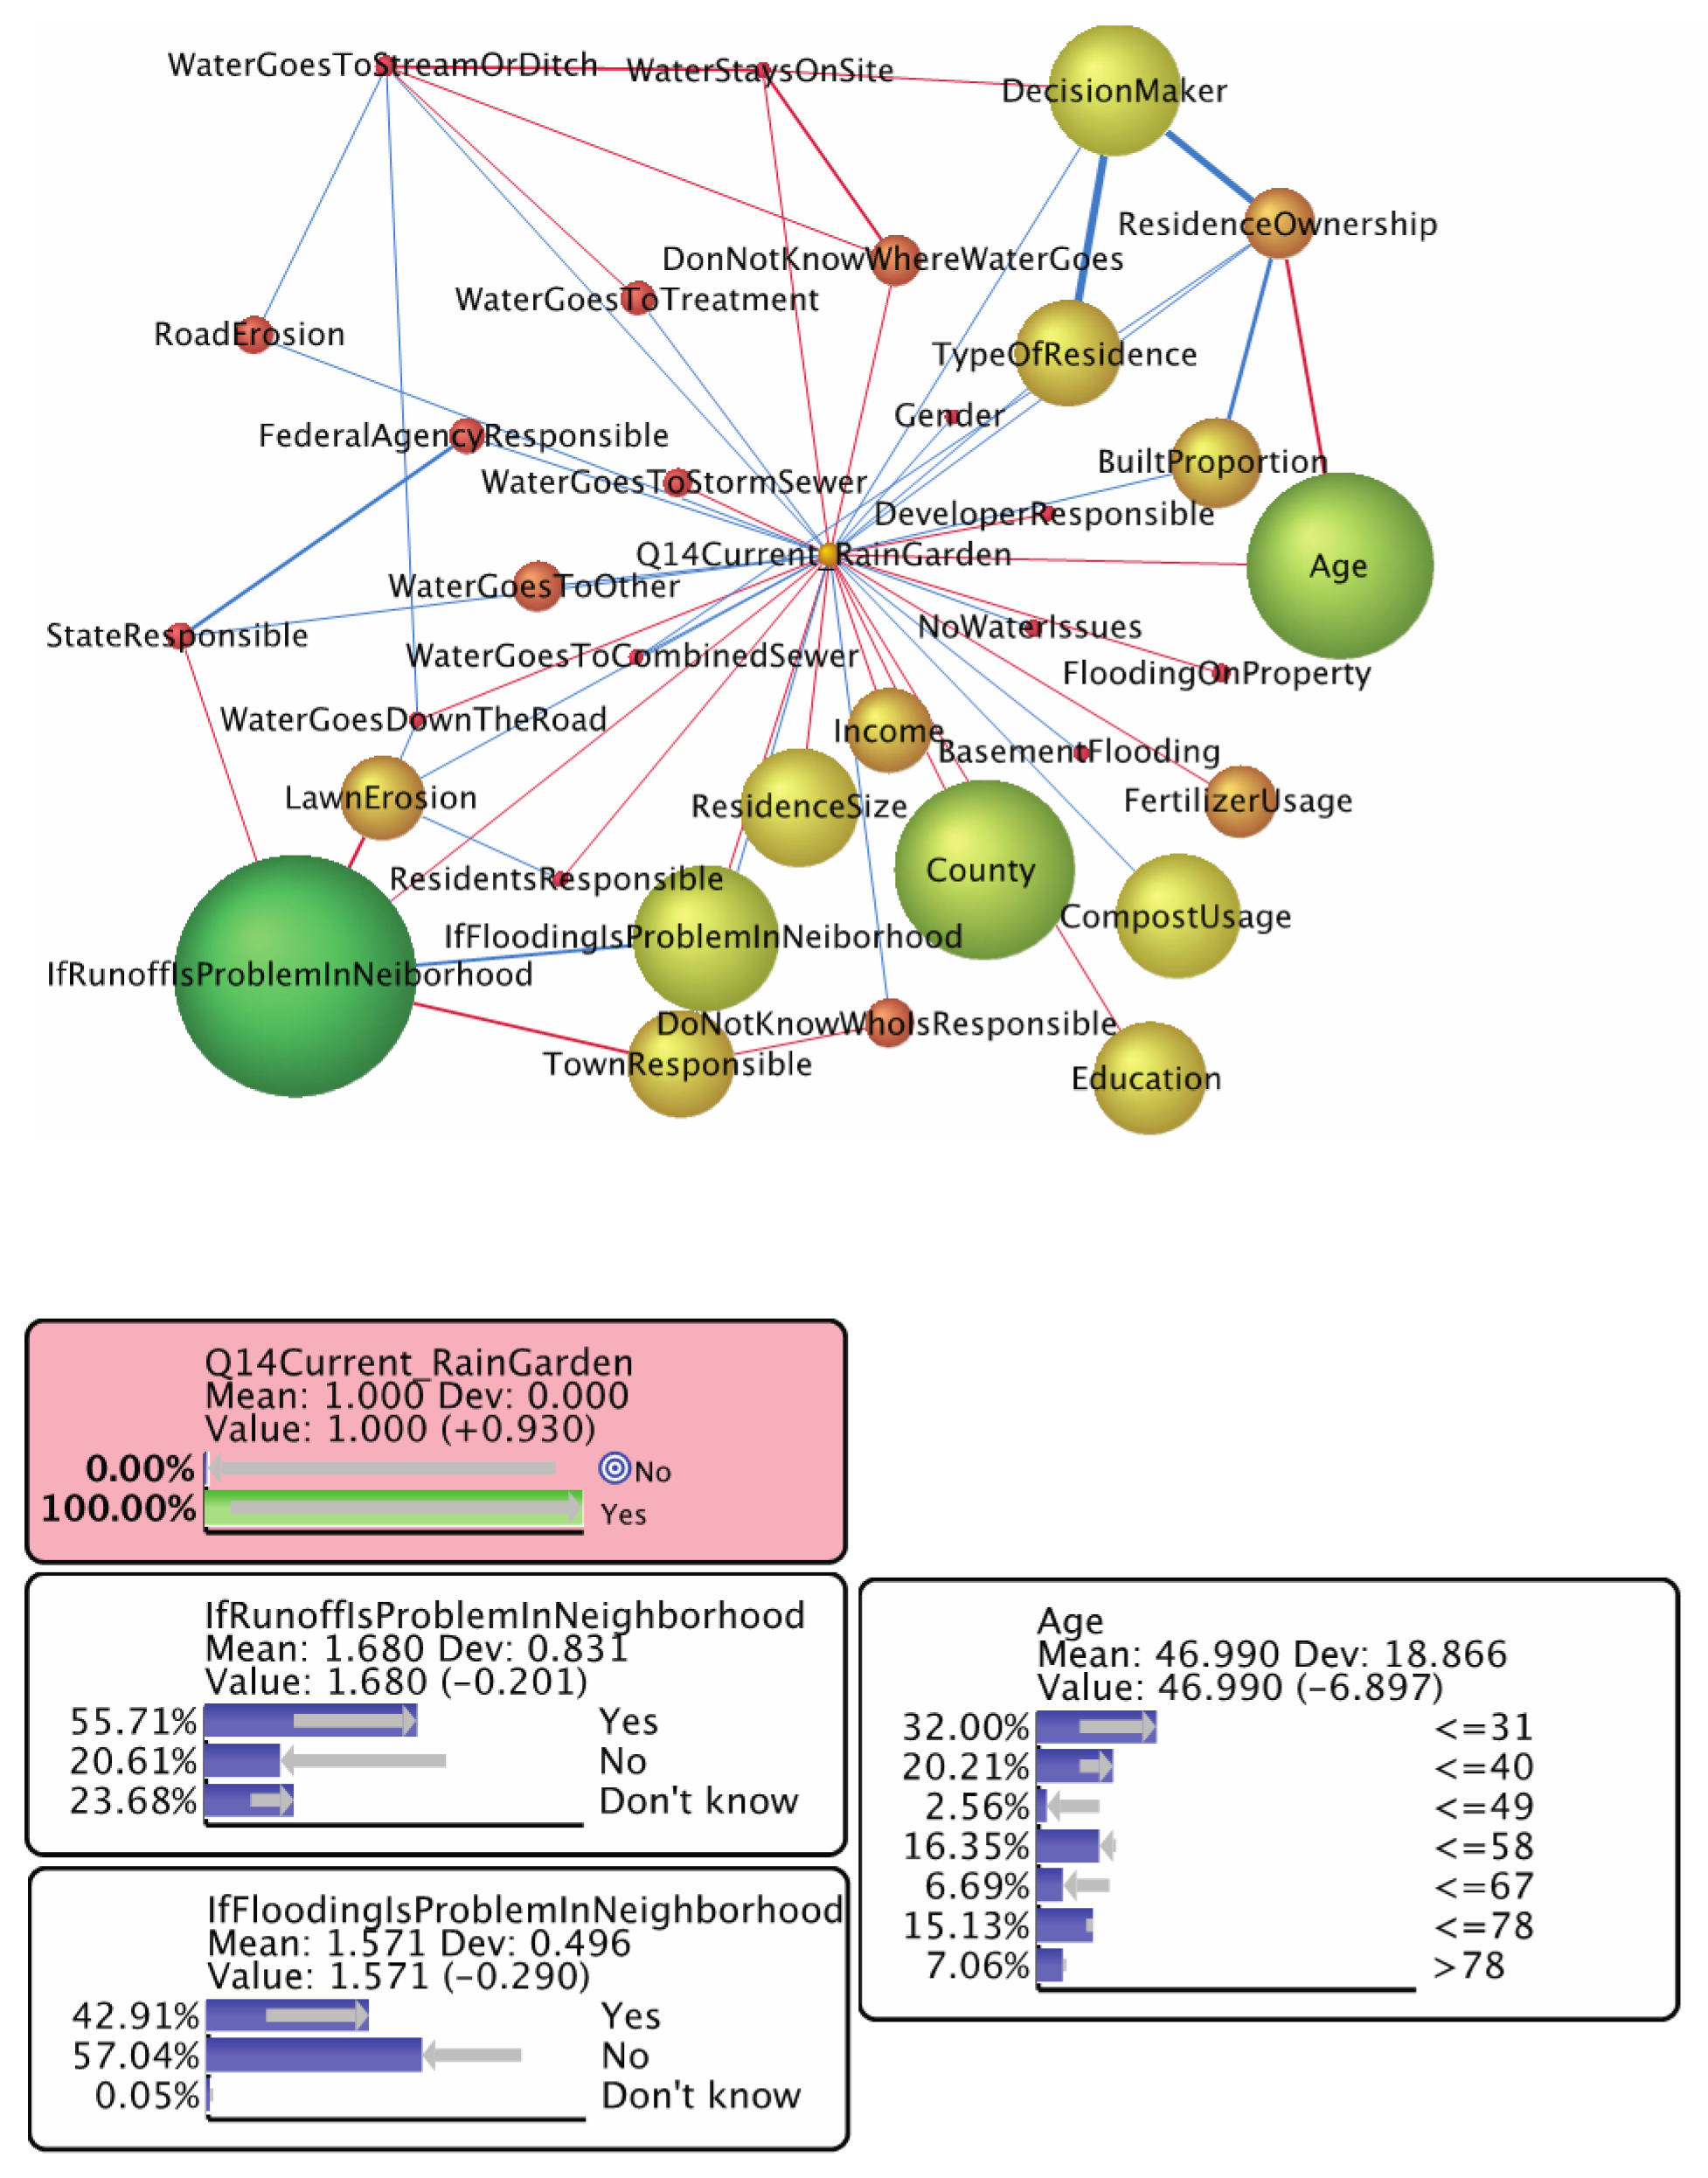
The current adoption of diverting roof runoff onto the impermeable surface or rain barrels has a higher association with respondents who own their residence and have a larger amount of land (>0.5 acres) and lower proportion of built infrastructure (<0.24). These properties are also more likely to be single-family houses. Respondents with an age of 58 years or older are more likely to adopt roof diversion than younger respondents (Figure 9). Income, stormwater issues (runoff, lawn erosion, and flooding), and responsibility attribution are relatively less influential on the behavioral variable.

3.3.2. Rain Gardens

Whether stormwater runoff and flooding is identified as an issue in the neighborhood is a very strong predictive variable for the current adoption of rain gardens. When these issues are present in the neighborhood, the respondents are more likely to have already adopted rain gardens as a mitigation measure. Younger respondents (≤40) are more likely to have adopted rain gardens, and respondents above 78 years are also slightly more likely to have rain gardens established. Renters are more likely to adopt rain gardens than property owners (Figure 10).

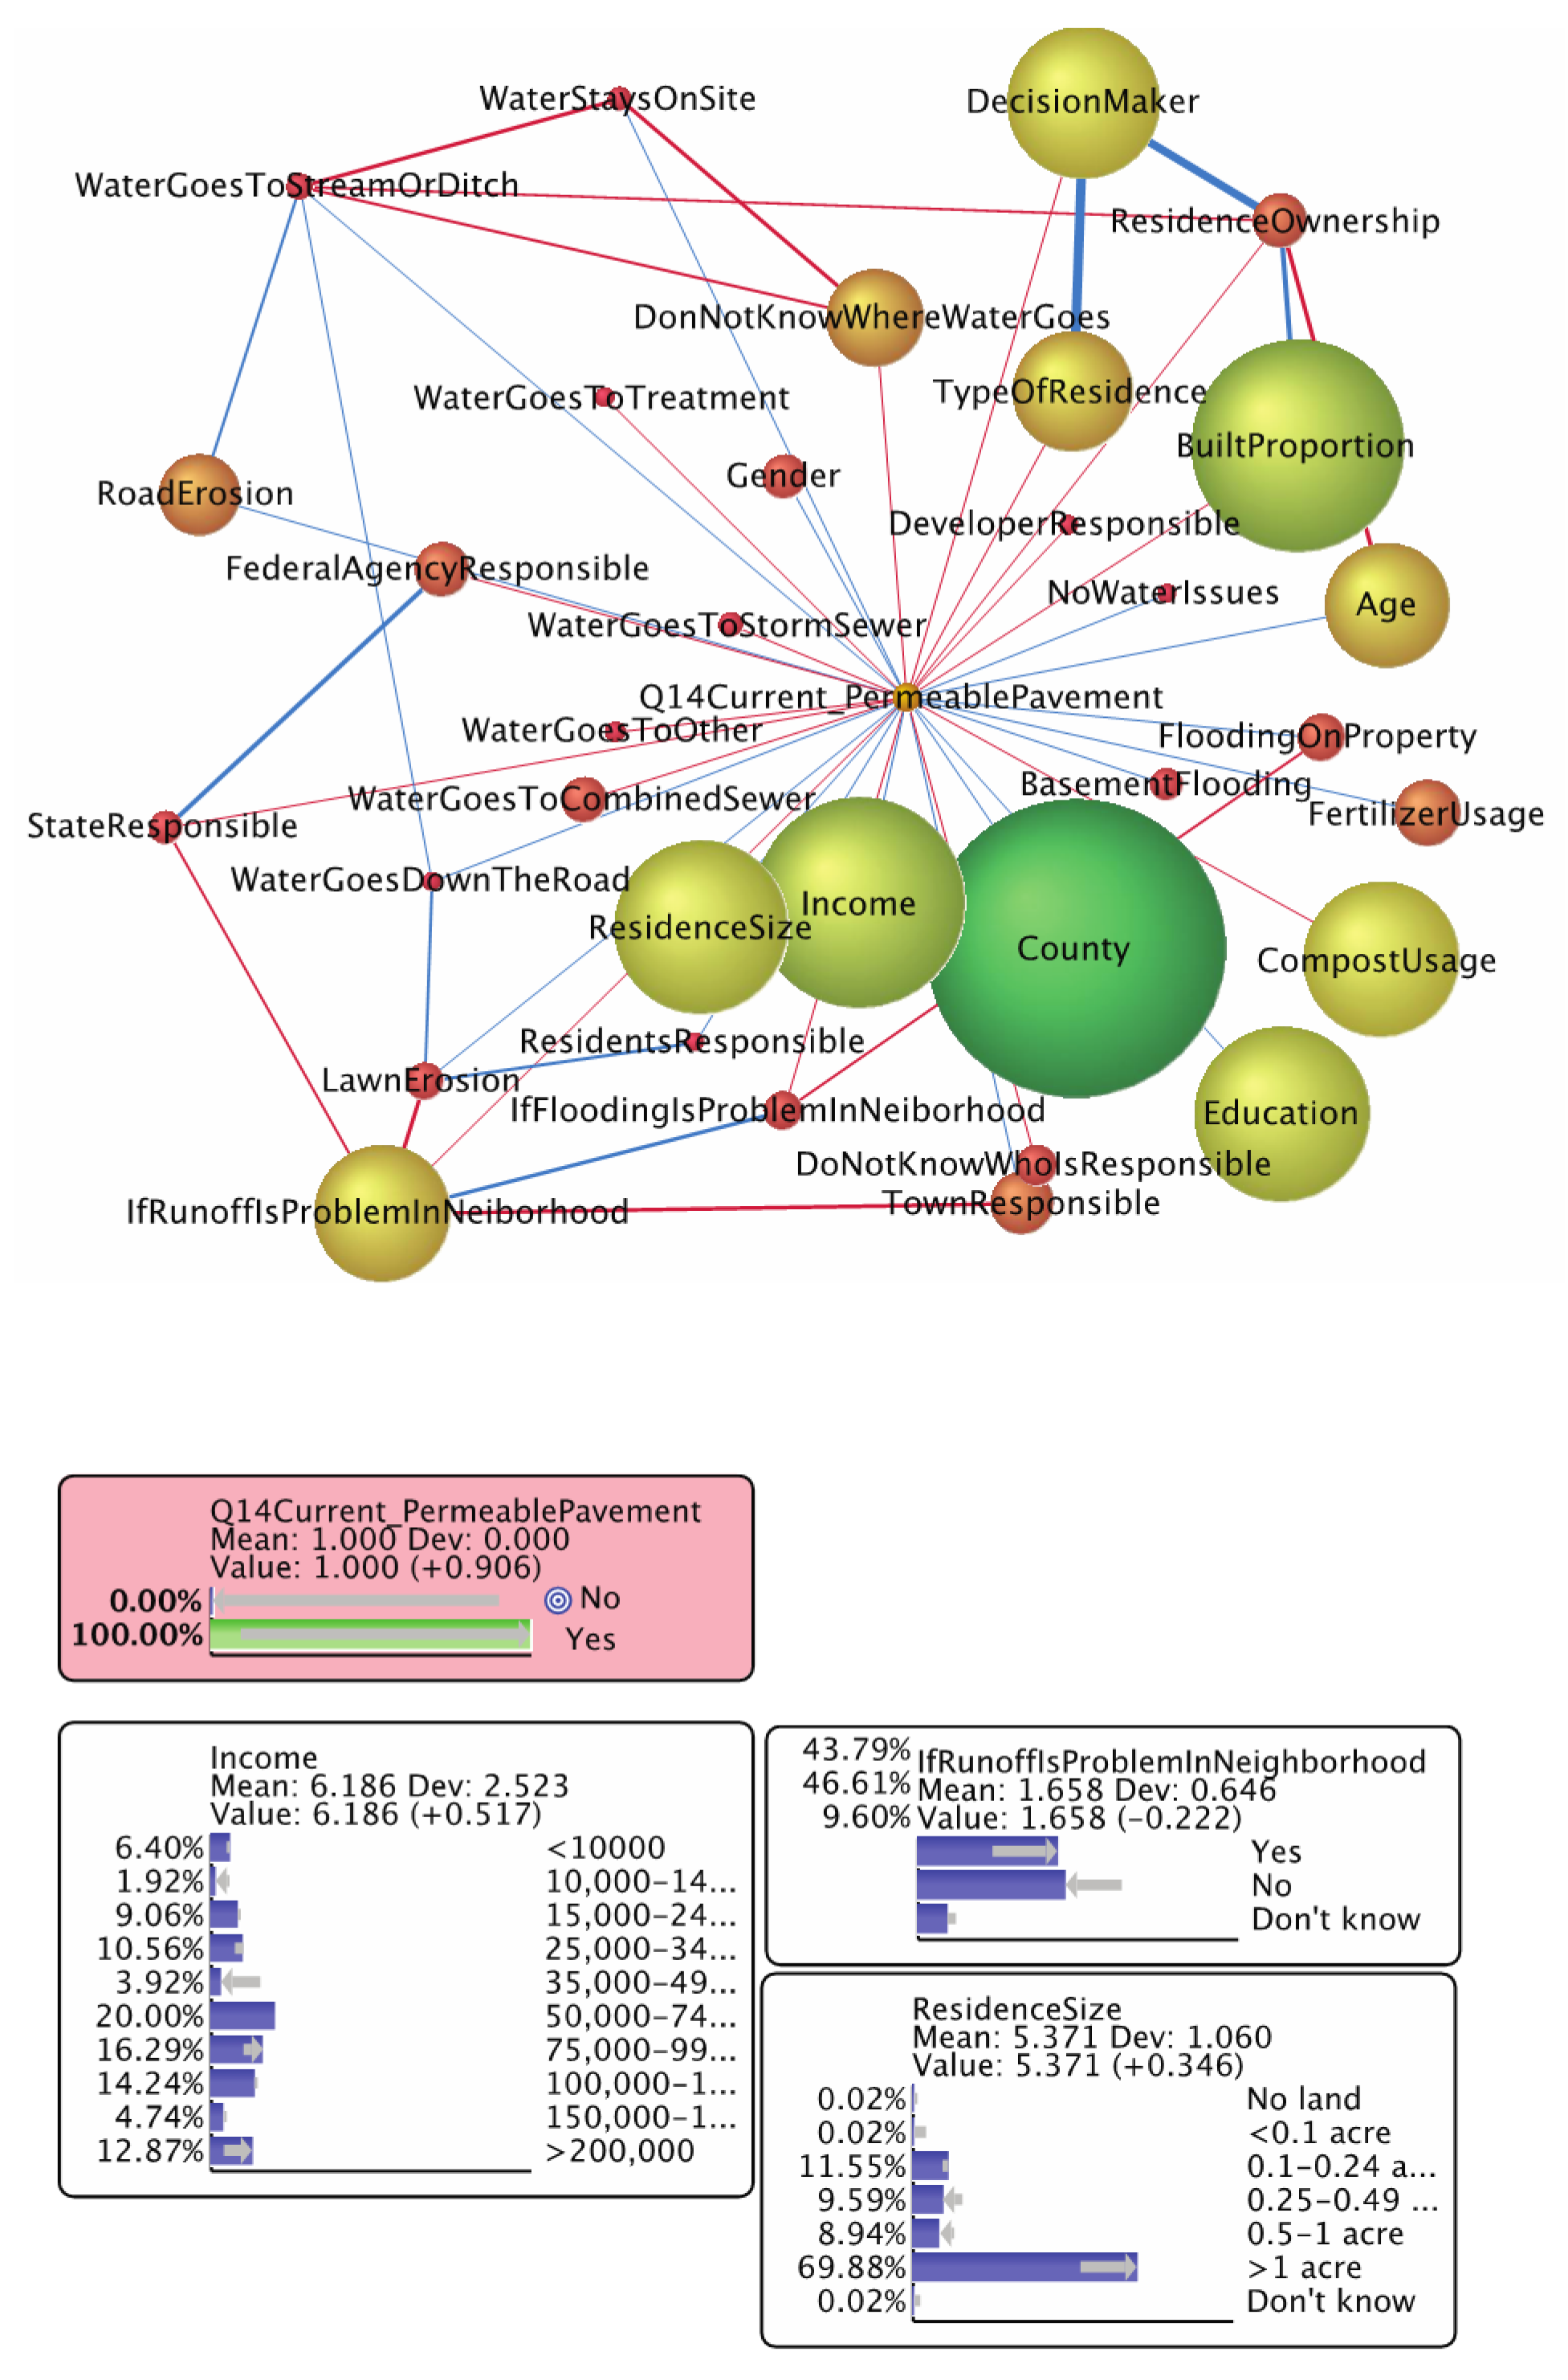
3.3.3. Permeable Pavement

Figure 11 shows that higher household income (>75,000) provides a strong predictive power on having adopted permeable pavement. Respondents who have more than 1 acre of land and a lower proportion (<10%) of built infrastructure are more likely to have adopted permeable pavement. The influence of income on the adoption of permeable pavement is not consistently associated with one direction. For example, respondents with $25,000–34,000 annual household income and the two highest income groups ($150,000–$200,000 and > $200,000) are associated with adoption. Larger land parcels (>1 acre) and the positive identification of runoff issues in neighborhoods are both associated with the adoption of permeable pavement.

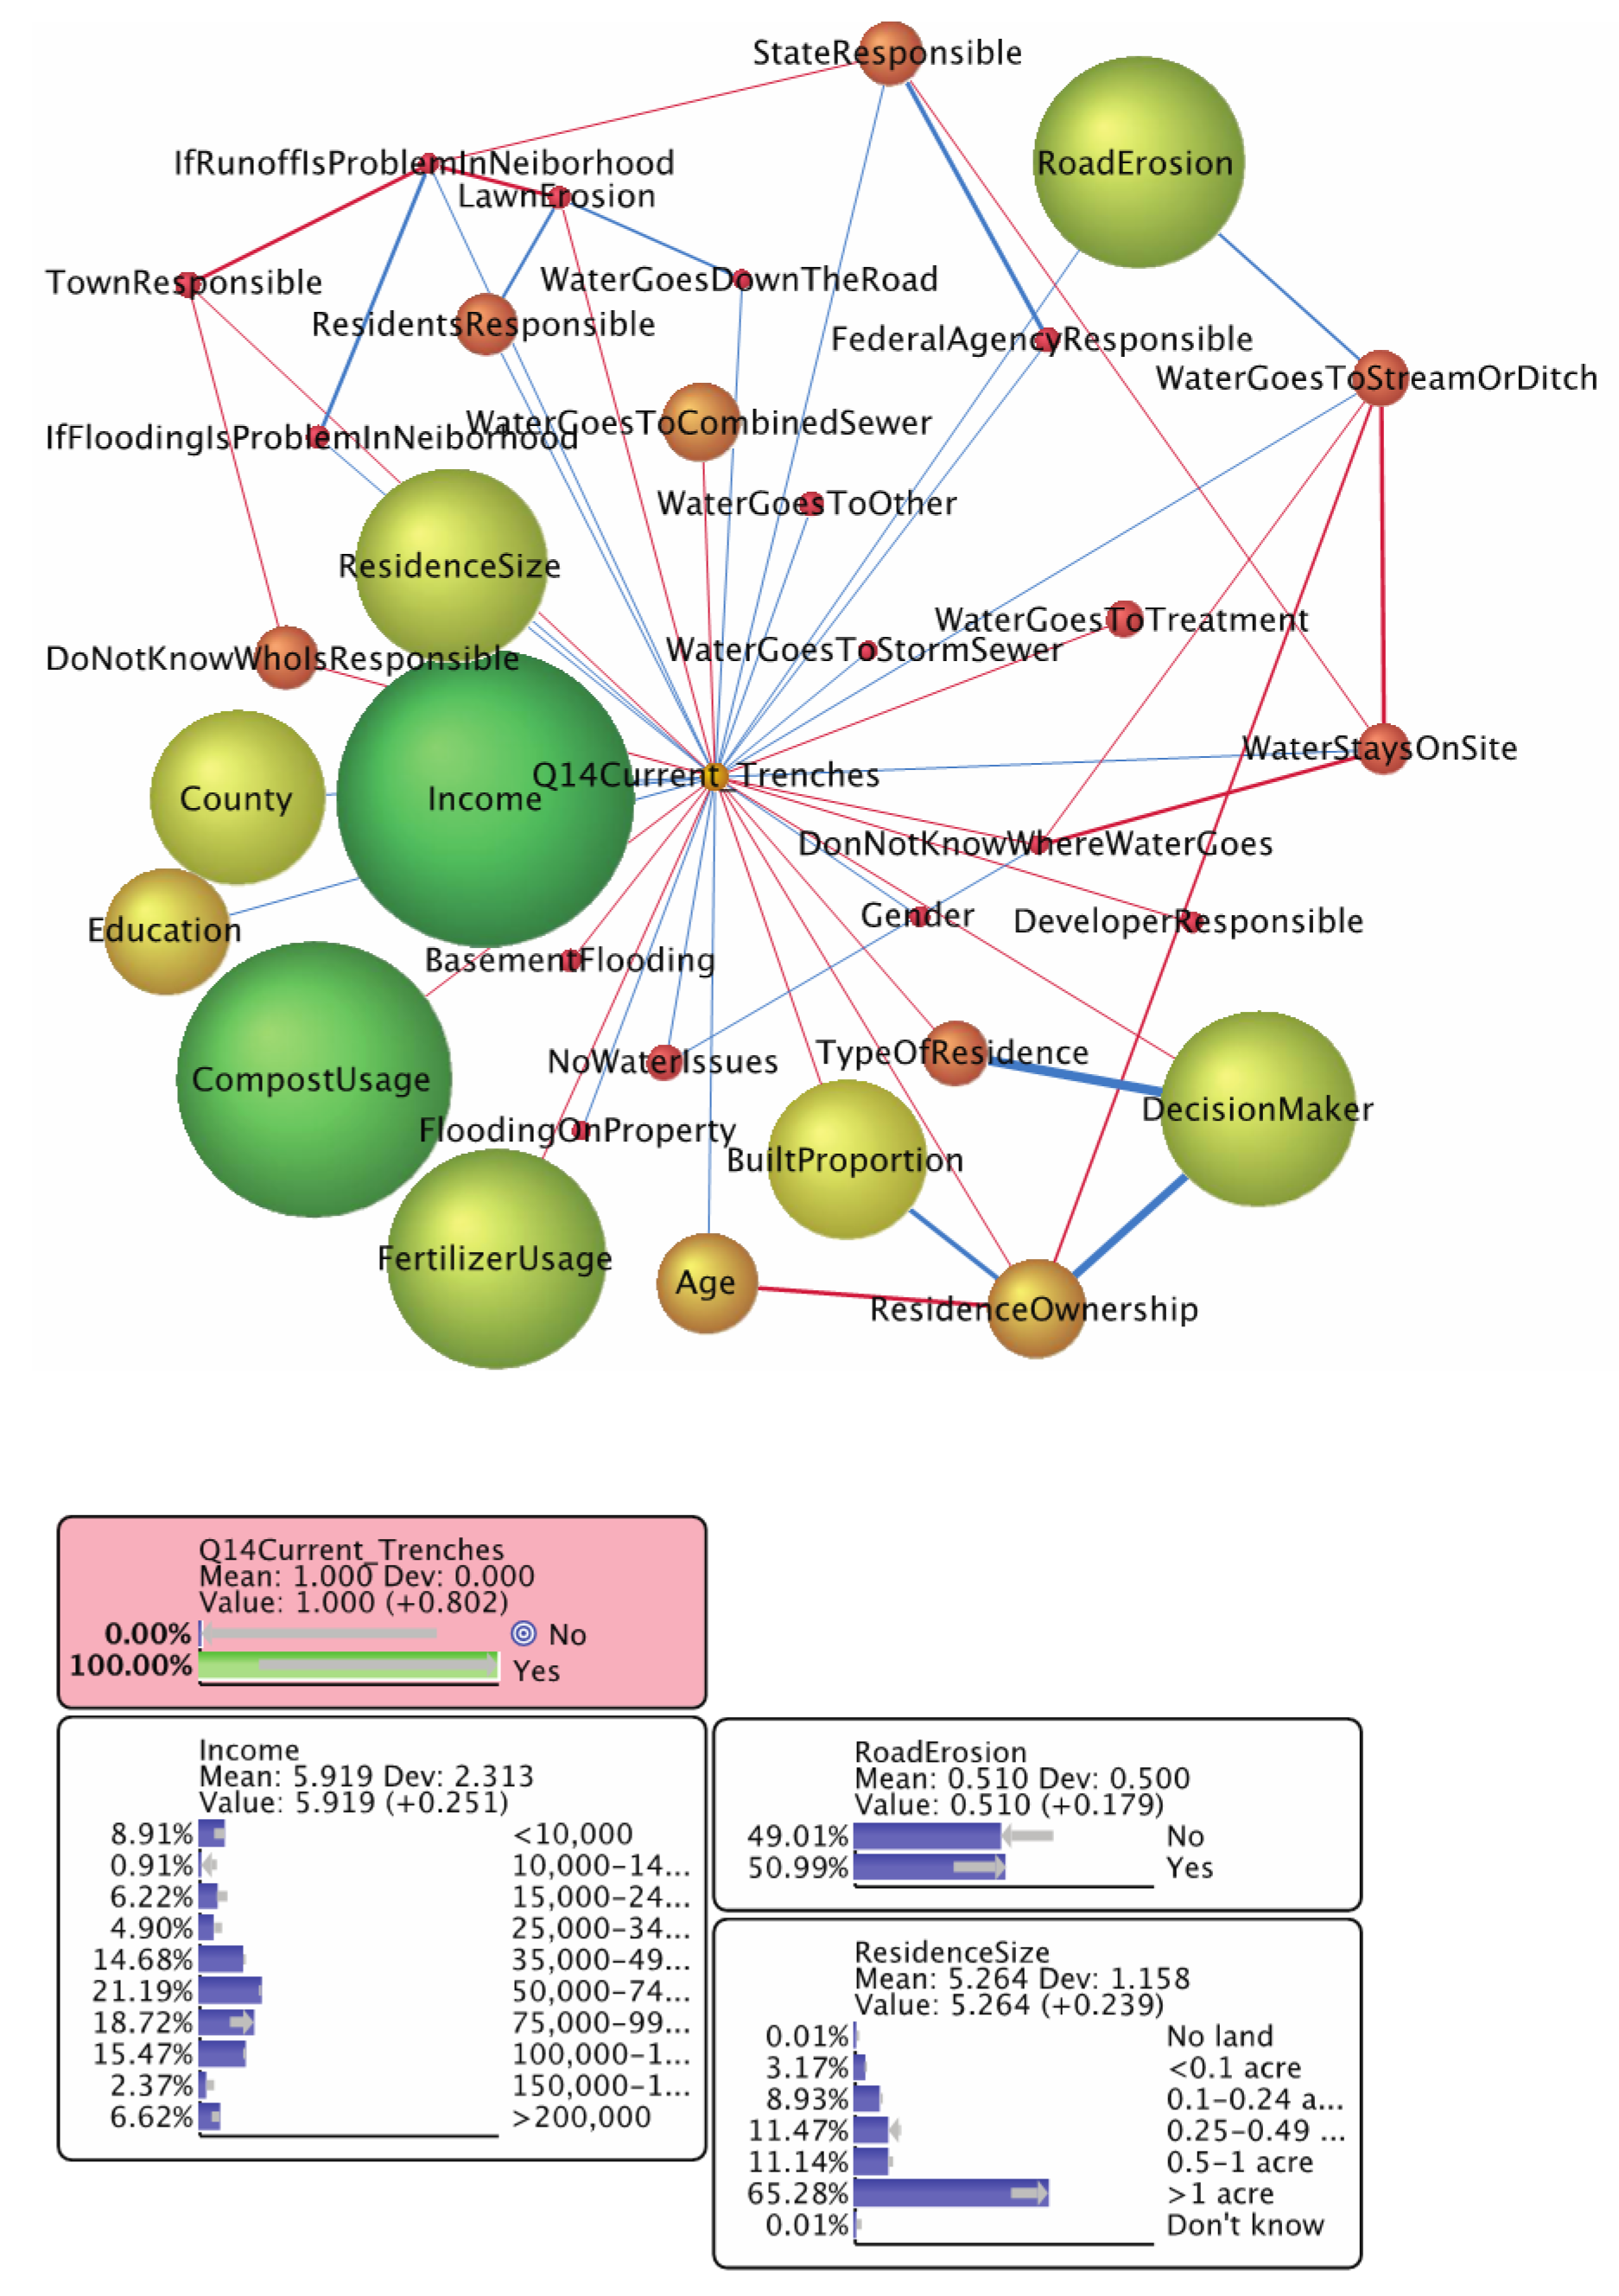
3.3.4. Infiltration Trenches

Respondents who have higher annual household income (>75,000) are more likely to adopt infiltration trenches. Compost and fertilizer use on isolated areas, as well as no fertilizer use, are associated with the current adoption of infiltration trenches. If the respondents have more than one acre of land, they are more likely to have adopted infiltration trenches. Meanwhile, the current adoption of infiltration trenches is highly associated with the identification of road erosion problems (Figure 12).

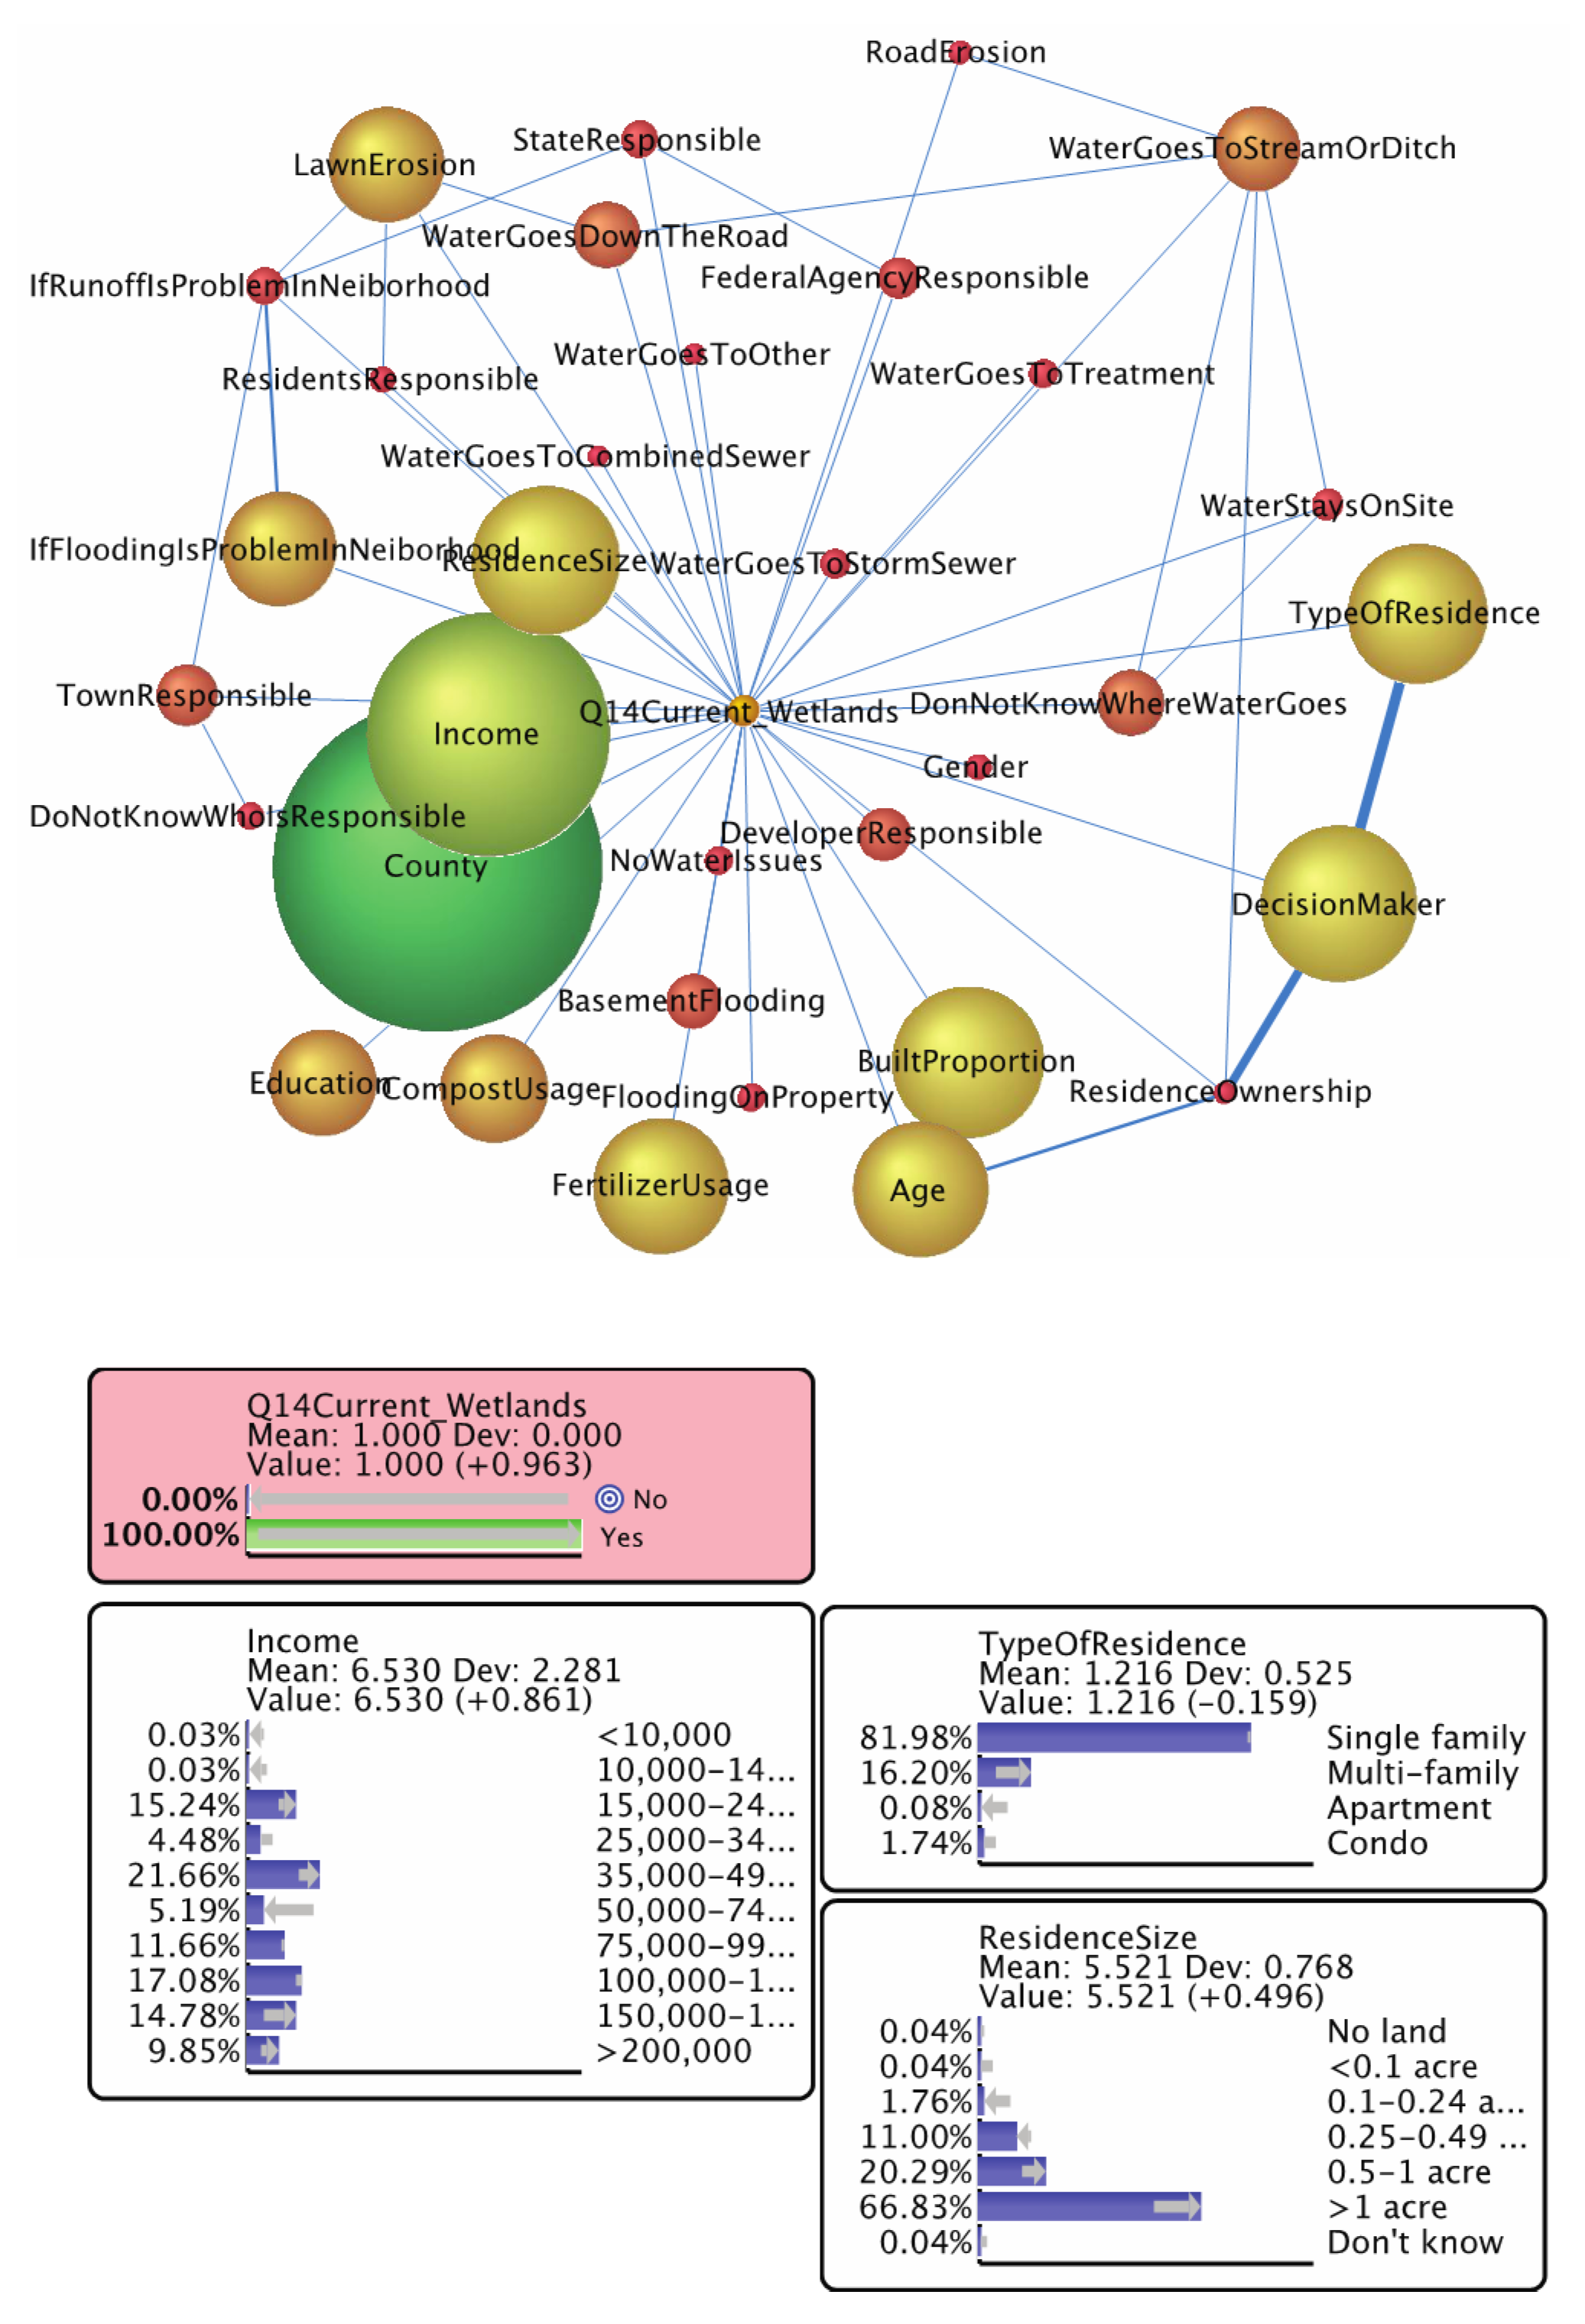
3.3.5. Constructed Wetland

Respondents who earn an annual household income less than $10,000, $25,000–$34,999, and $50,000–$74,999 are less likely to have constructed wetlands. Respondents who have more than 0.5 acres of land or reside in a multi-family dwelling are more likely to have currently adopted constructed wetlands (Figure 13).

3.3.6. Influence of independent variables on all types of GSIs

Table 1 shows the influence of the independent variables on the adoption of GSIs. County has more of a significance across the board, while the influence of other variables vary by the type of GSI.

4. Discussion

4.1. Influential Factors Vary for Different Types of GSI

The adoptions of different types of green stormwater infrastructure have dissimilar relationship patterns with the independent variables (demographic variables and perceived stormwater-related issues in the neighborhood). Roof diversion is the most common currently adopted infrastructure to mitigate stormwater runoff in Vermont. It is more associated with respondents who own their residence (mostly single-family residence) and possess a larger amount of land. Owners of larger properties are also more likely to adopt infiltration trenches and permeable pavement.
Income level is a significant component in the adoption of infiltration trenches and permeable pavement. Respondents that have a higher annual income are generally more likely to adopt these two types of GSI. Meanwhile, age has also shown some influence in some categories of GSI adoption. Younger respondents (<30 years of age) are more likely to have adopted rain gardens. Respondents older than age 58 are more likely to have adopted roof diversion.
Respondents who live in multi-family houses are more likely to have adopted constructed wetlands as a mitigation measure to reduce stormwater runoff. This could be attributed to the requirement of a stormwater permit for the construction of multi-family residential complexes by the state of Vermont. While constructed wetlands are a relatively more expensive GSI for an individual single-family residence to adopt, they have been a more popular stormwater solution for the development of neighborhoods with multi-family residences.

4.2. Risk Perception of Stormwater Issues is Related to the Adoption of GSIs

Stormwater issues are associated with the adoption of certain types of GSI. Positive identification of runoff issues in the neighborhood is connected with currently adopted rain gardens. Identifying road erosion as an issue in the neighborhood is associated with currently adopted infiltration trenches. The respondents who positively identify these issues are more likely to adopt the corresponding type of GSI for a mitigation strategy. For other types of GSI, risk perception does not show a strong effect. The effect of risk perception on adoption of GSI depends on the specific type of issue and action. This is consistent with the mixed results from the current literature [3,4].
Residents in more populated, urbanized counties, such as Chittenden and Rutland, showed a higher likelihood of adopting roof diversion and rain gardens. However, they are less likely to adopt constructed wetlands, which are expensive and also require homeownership and larger land. While there are more impermeable surfaces in these urban areas, the higher proportion of renters and smaller land parcels seem to require more flexible and smaller-scaled GSIs.
Meanwhile, these stormwater issues are highly connected with each other. Problems of runoff, flooding, and lawn erosion are associated and oftentimes identified together. Having one increases the likelihood of having others. This suggests that the areas with a higher risk of stormwater issues usually suffer from multiple issues, which calls for a comprehensive assessment and strategy to mitigate the impacts.
Compared to homeowners, renters are more likely to identify stormwater runoff risk in the neighborhood. This could be interpreted as runoff being more likely to be a real issue in areas with more rental properties, or that renters are more candid about recognizing the runoff issues.
Table 2 shows whether the hypotheses are supported by the results. These factors show various influences on different types of GSIs, and sometimes the results point to the opposite direction to the hypotheses.

4.3. Responsibility Attribution Differs Depending on the Type of Stormwater Issue

The survey respondents have different perceptions about who is responsible for addressing certain types of stormwater issues. Runoff is more likely to be considered the governments’ (federal, state, or town) responsibility. The question about who is responsible for the stormwater issue in the neighborhood was phrased as “if stormwater is a problem in your neighborhood, who … has the responsibility …”, so the respondents that report the federal or state government as being responsible could also be assumed to positively identify stormwater issues in their neighborhood. The inverse is also supported in the analysis. When runoff issues are present in the neighborhood, the respondents are more likely to consider the state and/or federal government to be responsible for mitigation.
In contrast, residents are more likely to consider lawn erosion to be their own responsibility. It is understandable that water issues occurring within the property lines might seem natural to be the owner’s responsibility to address.

4.4. Bayesian Belief Network vs. Logistic Regression

In our comparison, the BBN method showed stronger and more accurate predictive power than logistic regression. The independent variables (demographic variables and perception of stormwater-related issues) with the strongest predictive power in both models have some overlap but in general differ from each other. This comparison is not a definitive test on whether one method is superior to the other. Both methods examine the predictive capability of the independent variables and produce classifiers for the response (target) variable, but the computational approaches are different. A Bayesian network defines a unique joint probability distribution over the set of random variables, while logistic regression uses training data to directly estimate the conditional probabilities of the response variable given the predictive variables. The Bayesian approach assumes that the input variables are all independent of each other, and it might perform poorly when this assumption is violated. Meanwhile, logistic regression can produce acceptable estimates when the input variables have a certain degree of dependency. In this study, BBN showed a stronger predictive power than logistic regression and therefore was able to yield more detailed directional predictions in addition to the results of logistic regression conducted by Coleman et al. [43] using the same dataset.
BBNs have practical advantages in research on environmental behavior. Explicitly showing the relationship between variables in a graph, a BBN provides comprehensible and visible results for stakeholders and decision-makers. It is also easy to conduct bidirectional inference to examine the influence of independent variables on the response variable, which is not possible with logistic regression. In addition, because BBN uses joint probability to represent the entire set of variables, it involves much fewer parameters than logistic regression analysis. This could be a computational advantage when dealing with a large quantity of data and limited computational capacity.

5. Conclusions

Several aspects of the results have implications on how to best encourage Vermont residents to adopt stormwater GSI on private properties. First, certain types of GSI, especially rain gardens, are related to risk perception of specific stormwater issues in the neighborhood. Identifying areas with a perceived high risk of these stormwater issues may help with identifying the type of GSIs that residents are more likely to adopt. Second, relations between income and adoption of GSI have been observed in some categories of GSI (mostly for infiltration trenches and permeable pavement), and therefore providing some financial incentive might enable the residents to justify the cost associated with the construction and maintenance of GSI. Third, different living situations and age groups have different preferences for GSI types. Renters are more likely to identify stormwater-related issues in the neighborhood and more willing to adopt rain gardens. Younger respondents are more likely to have adopted rain gardens, and older respondents are more likely to have adopted roof diversion. Reaching out to certain groups with their preference in mind might improve the chances of a successful adoption. Fourth, since lawn erosion is primarily considered the residents’ responsibility, promoting GSI programs designed to address lawn erosion issues might be useful to encourage the residents to adopt.
The modeling method of this study could also be used in the process of developing programs to promote GSI on private properties in specific areas. For example, it can be used to explore the internal connections between variables in a baseline dataset to conveniently indicate which factors affect the adoption of GSI. Conducting evidence inference with setting probabilities of the influencing factors to 0% or 100% can predict the degree of change in the behavioral variable (adoption of GSI). Results show that geographic location (county) plays an important role in the overall network, which means there is a considerable amount of variation in the local opinions at different places. A specific analysis tailored for the area would always benefit the management process at a local level.

Author Contributions

Conceptualization, A.Z., D.M.R. and Q.R.; methodology, A.Z., D.M.R. and Q.R.; software, Q.R.; resources, N.M.; data curation, A.Z.; writing—original draft preparation, Q.R.; writing—review and editing, A.Z., D.M.R., N.M.; visualization, Q.R.; funding acquisition, A.Z., N.M. All authors have read and agreed to the published version of the manuscript.

Funding

This research is based upon work supported by the National Science Foundation EPS-1556770.

Acknowledgments

Thanks to Sarah Coleman and Stephanie Hurley for designing the original instrument and contributing to the data of this research.

Conflicts of Interest

The authors declare no conflict of interest.

Appendix A. Survey Questions Included in This Study and Variable Type

Table A1. Survey questions and variable type.
NumberContentVariable Type
Q1Where does the majority of your stormwater runoff go immediately after it leaves your property?Discrete
Q3Do you think stormwater runoff is a problem in your neighborhood? Discrete
Q4Do you think flooding is a problem in your neighborhood?Discrete
Q5In the past 3 years, which if any of the following problems have you experienced at your primary residence?Discrete
Q6If stormwater is a problem in your neighborhood, who do you think has the responsibility for fixing the problem?Discrete
Q7What type of primary residence do you have?Discrete
Q8Do you own or rent your primary residence?Discrete
Q9What is the lot size of your primary residence?Discrete
Q10Around what proportion of your lot area is built?Discrete
Q11Do you make the decisions about your landscape and property management?Discrete
Q12What is your usage of compost on your property?Discrete
Q13What is your usage of fertilizer on your property?Discrete
Q14Which, if any, of the following practices are currently implemented at your primary residence (adopted and maintained)? Discrete
Q24What is your gender?Discrete
Q25What year were you born? (Age)Continuous
Q26What is the highest level of education you have completed?Discrete
Q27What is your household income?Discrete
CountyWhich county the respondent resides in?Discrete

Appendix B. MDL Scores of Different Types (Combinations) of Learning Algorithms

Table A2. MDL scores of different types (combinations) of learning algorithms. Unsupervised learning, Q14.
Algorithm MDL Score
Maximum Spanning Tree17,530.253
Maximum Spanning Tree + Taboo17,481.523
Taboo (from scratch)17,493.183
EQ17,470.664
EQ + Taboo17,470.664
SopLEQ17,493.361
SopLEQ + Taboo17,476.293
Taboo Order17,457.052 *
Taboo Order + Taboo17,457.058
* Lowest MDL Score. Supervised, Q14
Table A3. MDL scores of different types (combinations) of learning algorithms. Supervised learning, Q14.
Algorithm MDL Score
Q14A Roof Diversion
Naïve Bayes17,687.349
Augmented Naïve Bayes17,164.171 *
Tree Augmented Naïve Bayes 17,179.782
Q14B Rain Gardens
Naïve Bayes17,379.76
Augmented Naïve Bayes16,858.536 *
Tree Augmented Naïve Bayes 16,885.656
Q14C Permeable Pavement
Naïve Bayes17,469.272
Augmented Naïve Bayes16,965.952 *
Tree Augmented Naïve Bayes 16,989.163
Q14D Trenches
Naïve Bayes17,579.387
Augmented Naïve Bayes17,049.492 *
Tree Augmented Naïve Bayes 17,067.485
Q14E Tree Boxes
Naïve Bayes17,254.818
Augmented Naïve Bayes16,803.641 *
Tree Augmented Naïve Bayes 16,820.125
Q14F Green Roof
Naïve Bayes17,350.022
Augmented Naïve Bayes16,872.642 *
Tree Augmented Naïve Bayes 16,890.903
Q14G Wetlands
Naïve Bayes17,410.658
Augmented Naïve Bayes16,920.558 *
Tree Augmented Naïve Bayes 16,939.009
Q14H Others
Naïve Bayes17,333.345
Augmented Naïve Bayes16,844.032 *
Tree Augmented Naïve Bayes 16,872.497
* Lowest MDL Score.

Appendix C. Model Validation for Supervised Learning Models

The results of evaluating the network performance in regard to predicting each target variable in Q14 are shown in Table A3. The overall precision, mean precision, overall reliability, mean reliability, R, R2, RMSE, and NRMSE are reported.
Table A4. Network targeted performance for the networks generated by supervised learning with each option of Q14 as the target node.
Target NodeOverall PrecisionMean PrecisionOverall ReliabilityMean ReliabilityRR2RMSENRMSE
Q14. Currently adopted green stormwater infrastructure
A. Roof Diversion67.9376%65.2115%67.3499%66.1839%0.40270.16220.448244.8187%
B. Rain Gardens94.9740%62.0413%93.8476%78.6416%0.49640.24640.199919.9854%
C. Permeable Pavement89.4281%64.6357%87.9872%70.6589%0.40590.16470.288528.8502%
D. Infiltration Trenches77.6430%62.8419%76.2288%64.8821%0.38610.14910.383838.3809%
E. Tree Boxes100.0000%100.0000%100.0000%100.0000%1.00001.00000.00000.0000%
F. Green Roof100.0000%100.0000%100.0000%100.0000%0.98830.97680.01221.2164%
G. Constructed Wetland95.6672%59.5471%94.4591%73.2363%0.43620.19030.185418.5361%
F. Other89.9480%61.0076%88.4242%65.7106%0.37520.14080.275027.4988%
Table A5 shows the results of using K-fold approach to cross validate each targeted network with 10 subsamples. The overall precision, mean precision, overall reliability, mean reliability, R, R2, RMSE, and NRMSE between the validation and the target variable are reported.
Table A5. K-fold cross validation for the networks generated by supervised learning with each option of Q14 as the target node.
Target NodeOverall PrecisionMean PrecisionOverall ReliabilityMean ReliabilityRR2RMSENRMSE
Q14. Currently adopted green stormwater infrastructure
A. Roof Diversion55.2860%52.2284%54.4568%52.3320%0.05070.00260.528352.8326%
B. Rain Gardens92.8943%50.6451%89.7850%51.8069%0.02840.00080.253025.3033%
C. Permeable Pavement84.0555%49.1151%80.9469%48.6598%0.08140.00660.344534.4458%
D. Infiltration Trenches73.1369%54.4666%70.4181%55.6399%0.11000.01210.445044.4990%
E. Tree Boxes99.8267%50.0000%99.6537%49.9133%−0.00240.00000.04174.1725%
F. Green Roof99.4801%50.0000%98.9628%49.7400%−0.00820.00010.07217.2109%
G. Constructed Wetland94.8007%51.4565%92.2581%55.0376%−0.00890.00010.235223.5233%
F. Other87.0017%47.6281%83.0614%45.4710%−0.06770.00460.338533.8506%

Appendix D. Significant Predictors of Q14 in Logistic Regression

Table A6. Significant predictors of Q14 in logistic regression.
Estimate Std. Errorz valuePr(>|z|)
Q14A: Currently Adopted Roof Diversion
Q1H Other stormwater issues−1.940430.78000−2.4880.0129 *
Q11 Property manager or HOA makes decisions 3.25958 1.42043 2.2950.0217 *
Q13 Fertilizer used on most land (3)−1.477440.70880 −2.0840.0371 *
County Bennington−1.969440.89958−2.1890.0286 *
Q14C: Currently Adopted Permeable Pavement
Q12 Used on most land (3)2.502 × 1001.118 × 1002.239 0.0252 *
Age5.249 × 10−22.566 × 10−22.0460.0408 *
Q14D: Currently Adopted Infiltration Trenches
Q1C Water goes to storm sewer pipe−1.940 × 1009.309 × 10−1−2.084 0.037132 *
Q5C Runoff, erosion and washout to house1.003 × 1004.428 × 10−12.264 0.023564 *
Q12 Compost used on isolated areas (2)1.947 × 1005.623 × 10−13.462 0.000535 ***
Q12 Compost used on most land (3) 2.182 × 1009.350 × 10−12.333 0.019633 *
Q27(2)$10,000–$14,999−5.840 × 1002.461 × 100−2.373 0.017649 *
Q27(3)$15,000–$24,999−4.428 × 1001.833 × 100−2.415 0.015719 *
Q27(4)$25,000–$34,999 −5.277 × 1001.863 × 100−2.833 0.004615 **
Q27(5)$35,000–$49,999−5.323 × 1001.816 × 100−2.931 0.003375 **
Q27(6)$50,000–$74,999−4.144 × 1001.758 × 100−2.357 0.018412 *
Q27(7)$75,000–$99,999−4.482 × 1001.814 × 100−2.470 0.013513 *
Q27(8)$100,000–$149,999−4.707 × 1001.782 × 100−2.6410.008260 **
Q27(9)$150,000–$199,999−5.358 × 1001.892 × 100−2.832 0.004631 **
Q27(10) ≥ $200,000 −4.755 × 1001.939 × 100−2.4520.014192 *
Significance codes: 0 ‘***’ 0.001 ‘**’ 0.01 ‘*’ 0.05.

References

  1. White, M.J.; Hunter, L.M. Public perception of environmental issues in a developing setting: Environmental concern in coastal Ghana. Soc. Sci. Q. 2009, 9, 960–982. [Google Scholar] [CrossRef] [Green Version]
  2. Marquart-Pyatt, S.T. Concern for the environment among general publics: A cross-national study. Soc. Nat. Resour. 2007, 20, 883–898. [Google Scholar] [CrossRef]
  3. O’Connor, R.E.; Bard, R.J.; Fisher, A. Risk perceptions, general environmental beliefs, and willingness to address climate change. Risk Anal. 1999, 19, 461–471. [Google Scholar] [CrossRef]
  4. Bubeck, P.; Botzen, W.J.W.; Aerts, J.C.J.H. A review of risk perceptions and other factors that influence flood mitigation behavior. Risk Anal. 2012, 32, 1481–1495. [Google Scholar] [CrossRef] [Green Version]
  5. Hines, J.M.; Hungerford, H.R.; Tomera, A.N. Analysis and synthesis of research on responsible. J. Environ. Educ. 1987, 18, 1–8. [Google Scholar] [CrossRef]
  6. Carlet, F. Understanding attitudes toward adoption of green infrastructure: A case study of U.S. municipal officials. Environ. Sci. Policy 2015, 51, 65–76. [Google Scholar] [CrossRef]
  7. Barr, S. Factors influencing environmental attitudes and behaviors. Environ. Behav. 2007, 39, 435–473. [Google Scholar] [CrossRef]
  8. Kollmuss, A.; Agyeman, J. Mind the gap: Why do people act environmentally and what are the barriers to pro-environmental behavior? Environ. Educ. Res. 2002, 8, 239–260. [Google Scholar] [CrossRef] [Green Version]
  9. Schahn, J.; Holzer, E. Studies of individual environmental concern: The role of knowledge, gender, and background variables. Environ. Behav. 1990, 22, 767–786. [Google Scholar] [CrossRef]
  10. Steg, L.; Vlek, C. Encouraging pro-environmental behaviour: An integrative review and research agenda. J. Environ. Psychol. 2009, 29, 309–317. [Google Scholar] [CrossRef]
  11. Vining, J.; Ebreo, A. Emerging theoretical and methodological perspectives on conservation behavior. In New Handbook of Environmental Psychology; Bechtel, R., Churchman, A., Eds.; Wiley: New York, NY, USA, 2002; pp. 541–558. [Google Scholar]
  12. Rajecki, D.W. Attitudes: Themes and Advances; Sinauer Associates: Sunderland, MA, USA, 1982. [Google Scholar]
  13. Fishbein, M.; Ajzen, I. Belief, Attitude, Intention, and Behavior: An Introduction to Theory and Research; Addison-Wesley: Reading, MA, USA, 1977. [Google Scholar]
  14. Ajzen, I. The theory of planned behavior. Organ. Behav. Hum. Decis. Process. 1991, 50, 179–211. [Google Scholar] [CrossRef]
  15. Ajzen, I.; Fishbein, M. Understanding Attitudes and Predicting Social Behavior; Prentice-Hall: Upper Saddle River, NJ, USA, 1980. [Google Scholar]
  16. U.S. Environmental Protection Agency. Green Infrastructure. Available online: https://www.epa.gov/green-infrastructure (accessed on 20 October 2017).
  17. Hjerpe, E.; Adams, J. Green Stormwater Infrastructure Economics in the Boise Urban Area; Idaho Rivers United: Boise, ID, USA, 2015. [Google Scholar]
  18. Lucas, W.C.; Sample, D.J. Reducing combined sewer overflows by using outlet controls for Green Stormwater Infrastructure: Case study in Richmond, Virginia. J. Hydrol. 2015, 520, 473–488. [Google Scholar] [CrossRef]
  19. Vermont Department of Environmental Conservation. Green Stormwater Infrastructure (GSI). Available online: http://dec.vermont.gov/watershed/cwi/green-infrastructure (accessed on 5 April 2018).
  20. U.S. Environmental Protection Agency. Phosphorus TMDLs for Vermont Segments of Lake Champlain; 2016. Available online: https://www.epa.gov/sites/production/files/2016-06/documents/phosphorus-tmdls-vermont-segments-lake-champlain-jun-17-2016.pdf (accessed on 8 October 2020).
  21. Nylen, G. Accelerating Cost-Effective Green Stormwater Infrastructure: Learning from Local Implementation. Available online: http://scholarship.law.berkeley.edu/cleepubs/14 (accessed on 12 October 2017).
  22. Copeland, C. Green Infrastructure and Issues in Managing Urban Stormwater. 2016. Available online: https://fas.org/sgp/crs/misc/R43131.pdf (accessed on 8 October 2020).
  23. Pearl, J. Bayesian Networks. Department of Statistics, UCLA, 2011. Available online: https://ftp.cs.ucla.edu/pub/stat_ser/R246.pdf (accessed on 8 October 2020).
  24. Pearl, J. Fusion, propagation, and structuring in belief networks. Artif. Intell. 1986, 29, 241–288. [Google Scholar] [CrossRef] [Green Version]
  25. Heckerman, D. A Tutorial on Learning with Bayesian Networks. 1995. Available online: https://www.cis.upenn.edu/~mkearns/papers/barbados/heckerman.pdf (accessed on 8 October 2020).
  26. Stone, J.V. Bayes’ Rule: A Tutorial Introduction to Bayesian Analysis; Sebtel Press: Opole, Poland, 2013. [Google Scholar]
  27. Uusitalo, L. Advantages and challenges of Bayesian networks in environmental modelling. Ecol. Model. 2007, 203, 312–318. [Google Scholar] [CrossRef]
  28. Aguilera, P.A.; Fernández, A.; Fernández, R.; Rumí, R.; Salmerón, A. Bayesian networks in environmental modelling. Environ. Modell. Softw. 2012, 26, 1376–1388. [Google Scholar] [CrossRef]
  29. Laurans, Y.; Mermet, L. Ecosystem services economic valuation, decision-support system or advocacy? Ecosyst. Serv. 2014, 7, 98–105. [Google Scholar] [CrossRef]
  30. Varis, O.; Kuikka, S. Learning Bayesian decision analysis by doing: Lessons from environmental and natural resources management. Ecol. Model. 1999, 119, 177–195. [Google Scholar] [CrossRef] [Green Version]
  31. Landuyt, D.; Broekx, S.; D’hondt, R.; Engelen, G. A review of Bayesian belief networks in ecosystem service modelling. Environ. Modell. Softw. 2013, 46, 1–11. [Google Scholar] [CrossRef]
  32. Cain, J.; Batchelor, C.; Waughray, D. Belief networks: A framework for the participatory development of natural resource management strategies. Environ. Dev. Sustain. 1999, 1, 123–133. [Google Scholar] [CrossRef]
  33. Castelletti, A.; Soncini-Sessa, R. Bayesian Networks and participatory modelling in water resource management. Environ. Modell. Softw. 2007, 22, 1075–1088. [Google Scholar] [CrossRef]
  34. Varis, O. Bayesian decision analysis for environmental and resource management. Environ. Modell. Softw. 1997, 12, 177–185. [Google Scholar] [CrossRef]
  35. Barton, D.N.; Kuikka, S.; Varis, O.; Uusitalo, L.; Henriksen, H.J.; Borsuk, M.; de la Hera, A.; Farmani, R.; Johnson, S.; Linnell, J.D.C. Bayesian networks in environmental and resource management. Integr. Environ. Asses. 2012, 8, 418–429. [Google Scholar] [CrossRef]
  36. Chan, T.U.; Hart, B.T.; Kennard, M.J.; Pusey, B.J.; Shenton, W.; Douglas, M.M.; Valentine, E.; Patel, S. Bayesian network models for environmental flow decision making in the Daly River, Northern Territory, Australia. River Res. Appl. 2010, 28, 283–301. [Google Scholar] [CrossRef]
  37. Haines-Young, R. Exploring ecosystem service issues across diverse knowledge domains using Bayesian Belief Networks. Prog. Phys. Geogr. 2011, 35, 681–699. [Google Scholar] [CrossRef]
  38. Sun, Z.; Müller, D. A framework for modeling payments for ecosystem services with agent-based models, Bayesian belief networks and opinion dynamics models. Environ. Modell. Softw. 2013, 45, 15–28. [Google Scholar] [CrossRef]
  39. Schwenk, G.; Möser, G. Intention and behavior: A Bayesian meta-analysis with focus on the Ajzen–Fishbein Model in the field of environmental behavior. Qual. Quant. 2009, 43, 743–755. [Google Scholar] [CrossRef]
  40. Keshavarz, M.; Karami, E. Farmers’ pro-environmental behavior under drought: Application of protection motivation theory. J. Arid. Environ. 2016, 127, 128–136. [Google Scholar] [CrossRef]
  41. Fenton, N.; Neil, M. Risk Assessment and Decision Analysis with Bayesian Networks; CRC Press: Boca Raton, FL, USA, 2012. [Google Scholar]
  42. Pourret, O.; Naïm, P.; Marcot, B. Bayesian Networks; John Wiley & Sons: Hoboken, NJ, USA, 2008. [Google Scholar]
  43. Coleman, S.; Hurley, S.; Rizzo, D.; Koliba, C.; Zia, A. From the household to watershed: A cross-scale analysis of residential intention to adopt green stormwater infrastructure. Landsc. Urban Plan. 2018, 180, 195–206. [Google Scholar] [CrossRef]
  44. Bayesialab. BayesiaLab User Manual. Available online: https://www.bayesia.com/bayesialab-inference (accessed on 24 October 2018).
  45. Conrady, S.; Jouffe, L. Bayesian Networks and BayesiaLab: A Practical Introduction for Researchers, 1st ed.; Bayesia: Franklin, TN, USA, 2015. [Google Scholar]
  46. BayesiaLab User Guide. Available online: https://library.bayesia.com/articles/?__hstc=221168007.37414d9c264ebfa7c9f79fe0dd598c7b.1601391423390.1601391423390.1601391423390.1&__hssc=221168007.2.1601391423391&__hsfp=2043891175#!bayesialab-knowledge-hub/unsupervised-learning-2392576 (accessed on 7 October 2020).
Figure 1. Comparison of Receiver Operating Characteristic (ROC) curves of Bayesian Belief Networks (BBN) and logistic regression. Q14A-H are the model curves of different GSI options provided in Q14 of the questionnaire. Q14E (tree boxes) and Q14F (green roof) were not included in this analysis because there were too few respondents that confirmed current adoption of these GSI.
Water 12 02793 g001
Figure 2. The Bayesian network generated by Taboo Order (unsupervised) with Q14. Note: Among the six different types of unsupervised learning methods provided by BayesiaLab and their combination with Taboo (except for Taboo itself), the lowest MDL score was generated by the Taboo Order algorithm, and the resulting network was used for the following analyses (the MDL scores are shown in Appendix B). See the BayesiaLab User Guide [46] for detailed explanation of the algorithms.
Water 12 02793 g002
Figure 3. Inference with hard evidence on unsupervised learning network of Q14—variables connected to the currently adopted green stormwater infrastructure (GSIs). (a) Inference with 100% set probability of respondents owning their residences; (b) inference with 100% set probability of respondents considering the federal agencies are responsible for stormwater issues; (c) inference with 100% set probability of respondents identifying runoff as an issue in their neighborhoods. Note: The probability of the top variable in each column (green color) was set to 100% for one of the answers, and the grey arrows in the chart(s) below in blue color show(s) how the corresponding variables change with the set probability. All the charts in the graphs below are interpreted in the same way. The “Yes” and “No” answers for each green infrastructure indicate the adoption or non-adoption of the type of GSI.
Water 12 02793 g003
Figure 4. Inference with hard evidence on unsupervised learning network of Q14—built proportion and residence size. (a) Inference on residence size with 100% set probability of respondents having a built proportion of <10%; (b) inference on residence size with 100% set probability of respondents having a built proportion of 75-90%; (c) inference on residence size with 100% set probability of respondents having a built proportion of >90%.
Water 12 02793 g004
Figure 5. Inference with hard evidence on unsupervised learning network of Q14—built proportion, residence type, decision-making body, and residence ownership. (a) Inference with 100% set probability of respondents having a built proportion of <10%; (b) inference with 100% set probability of respondents having a built proportion of 75-90%; (c) inference with 100% set probability of respondents having a built proportion of >90%.
Water 12 02793 g005
Figure 6. Inference with hard evidence on unsupervised learning network of Q14—residence size and runoff problems. (a) Inference with 100% set probability of respondents renting their residences; (b) inference with 100% set probability of respondents considering the town is responsible for stormwater issues; (c) inference with 100% set probability of respondents identifying runoff as an issue in their neighborhoods.
Water 12 02793 g006
Figure 7. Inference with hard evidence on unsupervised learning network of Q14—stormwater-related issues on the property.
Water 12 02793 g007
Figure 8. Inference with hard evidence on unsupervised learning network of Q14—identified lawn erosion issues and recognition of residents’ responsibility.
Water 12 02793 g008
Figure 9. The network generated by a supervised learning algorithm (Augmented Naïve Bayes) for Q14—currently adopted roof diversion as a target node and inference with hard evidence.
Water 12 02793 g009
Figure 10. The network generated by a supervised learning algorithm (Augmented Naïve Bayes) for Q14—currently adopted rain gardens as a target node and inference with hard evidence.
Water 12 02793 g010
Figure 11. The network generated by a supervised learning algorithm (Augmented Naïve Bayes) for Q14—currently adopted permeable pavement as a target node and inference with hard evidence.
Water 12 02793 g011
Figure 12. The network generated by a supervised learning algorithm (Augmented Naïve Bayes) for Q14—currently adopted infiltration trenches as a target node and inference with hard evidence.
Water 12 02793 g012
Figure 13. The network generated by a supervised learning algorithm (Augmented Naïve Bayes) for Q14—currently adopted constructed wetland as a target node and inference with hard evidence.
Water 12 02793 g013
Table 1. Summary of mutual information scores between the more influential variables and the target node (Q14–currently adopted GSIs).
Target GSI Adoption
Influential VariablesRoof DiversionRain GardenPermeable PavementInfiltration TrenchesConstructed Wetland
County0.02730.03170.03390.020.0228
Income0.01110.01350.02330.03560.0165
Age0.02410.03310.01280.01060.0085
Type of residence0.01920.01770.01240.0060.0088
Residence size0.04120.020.01880.02230.0095
Residence Ownership0.02720.01080.00430.01030.0001
If runoff is problem in neighborhood0.00560.04350.01430.00030.0012
If flooding is problem in neighborhood0.00320.02520.00250.00060.0069
Low score   Water 12 02793 i001  High score
Note: Tree boxes and green roofs are not included here due to the small sample size of positive responses and the overfitting problem.
Table 2. Hypotheses testing results.
HypothesisTypes of GSI that Supported HypothesisTypes of GSI that Showed Opposite Pattern to Hypothesis
Respondents having higher household incomes are more likely to adopt GSIs infiltration trenches permeable pavement-
Older respondents (>40 years) are more likely to adopt GSIsroof diversionrain gardens
Respondents living in single-family houses are more likely to adopt GSIs compared to other types of residenceroof diversionconstructed wetlands
Respondents who have larger land parcels are more likely to adopt GSIsroof diversion permeable pavement constructed wetlands-
permeable pavement
Compared to renters, respondents who own their properties are more likely to adopt GSIsroof diversion-
Respondents who perceive stormwater-related risks in their neighborhood are more likely to adopt GSIsrain gardens infiltration trenches-

