1. Introduction
Granular filtration is a traditional water treatment step, and sand and anthracite are classical media, but alternative products are also used. For example, Filtralite, an expanded aluminosilicate clay, has been in use worldwide for more than 30 years [
1].
Filtralite is made by the high temperature treatment (~1200 °C) of certain raw clays, and this results in strong and porous grains. This process allows control over physical properties, such as size and density. The filters can be further tailored by the crushing and sieving of the expanded grains into defined fractions. The crushing of the grains opens up the macroporous structure of the expanded clay, affects the sphericity-factor, and exposes a specific surface area (SSA) of up to 23 m
2/g [
2].
The large specific surface of Filtralite available for biofilm growth makes it an ideal carrier in biological treatment processes [
3]. Testing of Filtralite NC 0.8–1.6 (through standard EN 1097–6, Annex E) shows a porosity of 62%, which is higher than sand or anthracite and provides extra storage capacity for suspended solids, which results in slower pressure build-ups during operations [
4]. This trait makes Filtralite usable for direct filtration and coagulated water filtration processes [
5].
When comparing filter run-times to reach terminal headloss, it has been found that expanded clays of 1.2 mm size can operate 2.3 times longer than anthracite, while expanded clays of 1.0 mm size or GAC (Granular Activated Carbon) can achieve 1.5 times longer filter run times than anthracite. When considering headloss development, the use of expanded clays such as Filtralite can extend overall filter runs two- to four-fold when compared with anthracite [
6].
In relation to the durability of the materials, Phillip D. Davies analyzed results from different attrition tests, demonstrating that Filtralite material presents a volume loss 4.25 times lower than sand, 3 times lower than limestone and 5.5 times lower than slate [
7].
By using expanded clays, increased production stability and longer production cycles could translate into potential savings in terms of lower energy and water requirements with respect to filter operations [
8]. For each treatment plant, the backwashing processes has to be understood independently before applying a new filter. The data from clean-bed backwashing with novel materials such as Filtralite should be available as performance indicators prior to full-scale testing. The objectives of this trial were to show how grain size and particle densities can affect the expansion and headloss regimes for clean-bed granular filter materials of sand, anthracite and expanded clay, as well as to observe the effect on viscosity of temperature variations.
This study was initiated to provide research for operators that assesses the requirements for proper backwashes to achieve correct filter cleaning, avoid filter media losses and optimize energy use.
2. Materials and Methods
2.1. Materials
A selection of Filtralite, sand and anthracite with various densities and grain sizes was made. The characteristics are given in
Table 1.
For Filtralite, the particle densities range from 1050 kg/m
3 to 1800 kg/m
3, and Filtralite can consequently be used in both single- and dual-media set-ups [
9]. For sand and anthracite, the densities vary, but are respectively around 2600 kg/m
3 and 1400 kg/m
3. The typical effective sizes are for sand 0.3–0.7 mm and are for anthracite 0.7–1.7 mm [
10]. This was the basis for the selection of sand grain size, which were accordingly Rådasand 0.4–0.6 mm and anthracite 0.8–1.6 mm. In order to compare sand to Filtralite 1.5–2.5, the Rådasand 1.2–2 mm was chosen.
Mono Multi and Mono Multi Fine are composed of 50–50 mixtures of normal and high-density Filtralite that constitutes a dual-media filter that can be used as an alternative to anthracite–sand dual-filters [
11]. Alternatively, replacing anthracite, Filtralite can act in combination with sand in a dual-media filter set-up [
12].
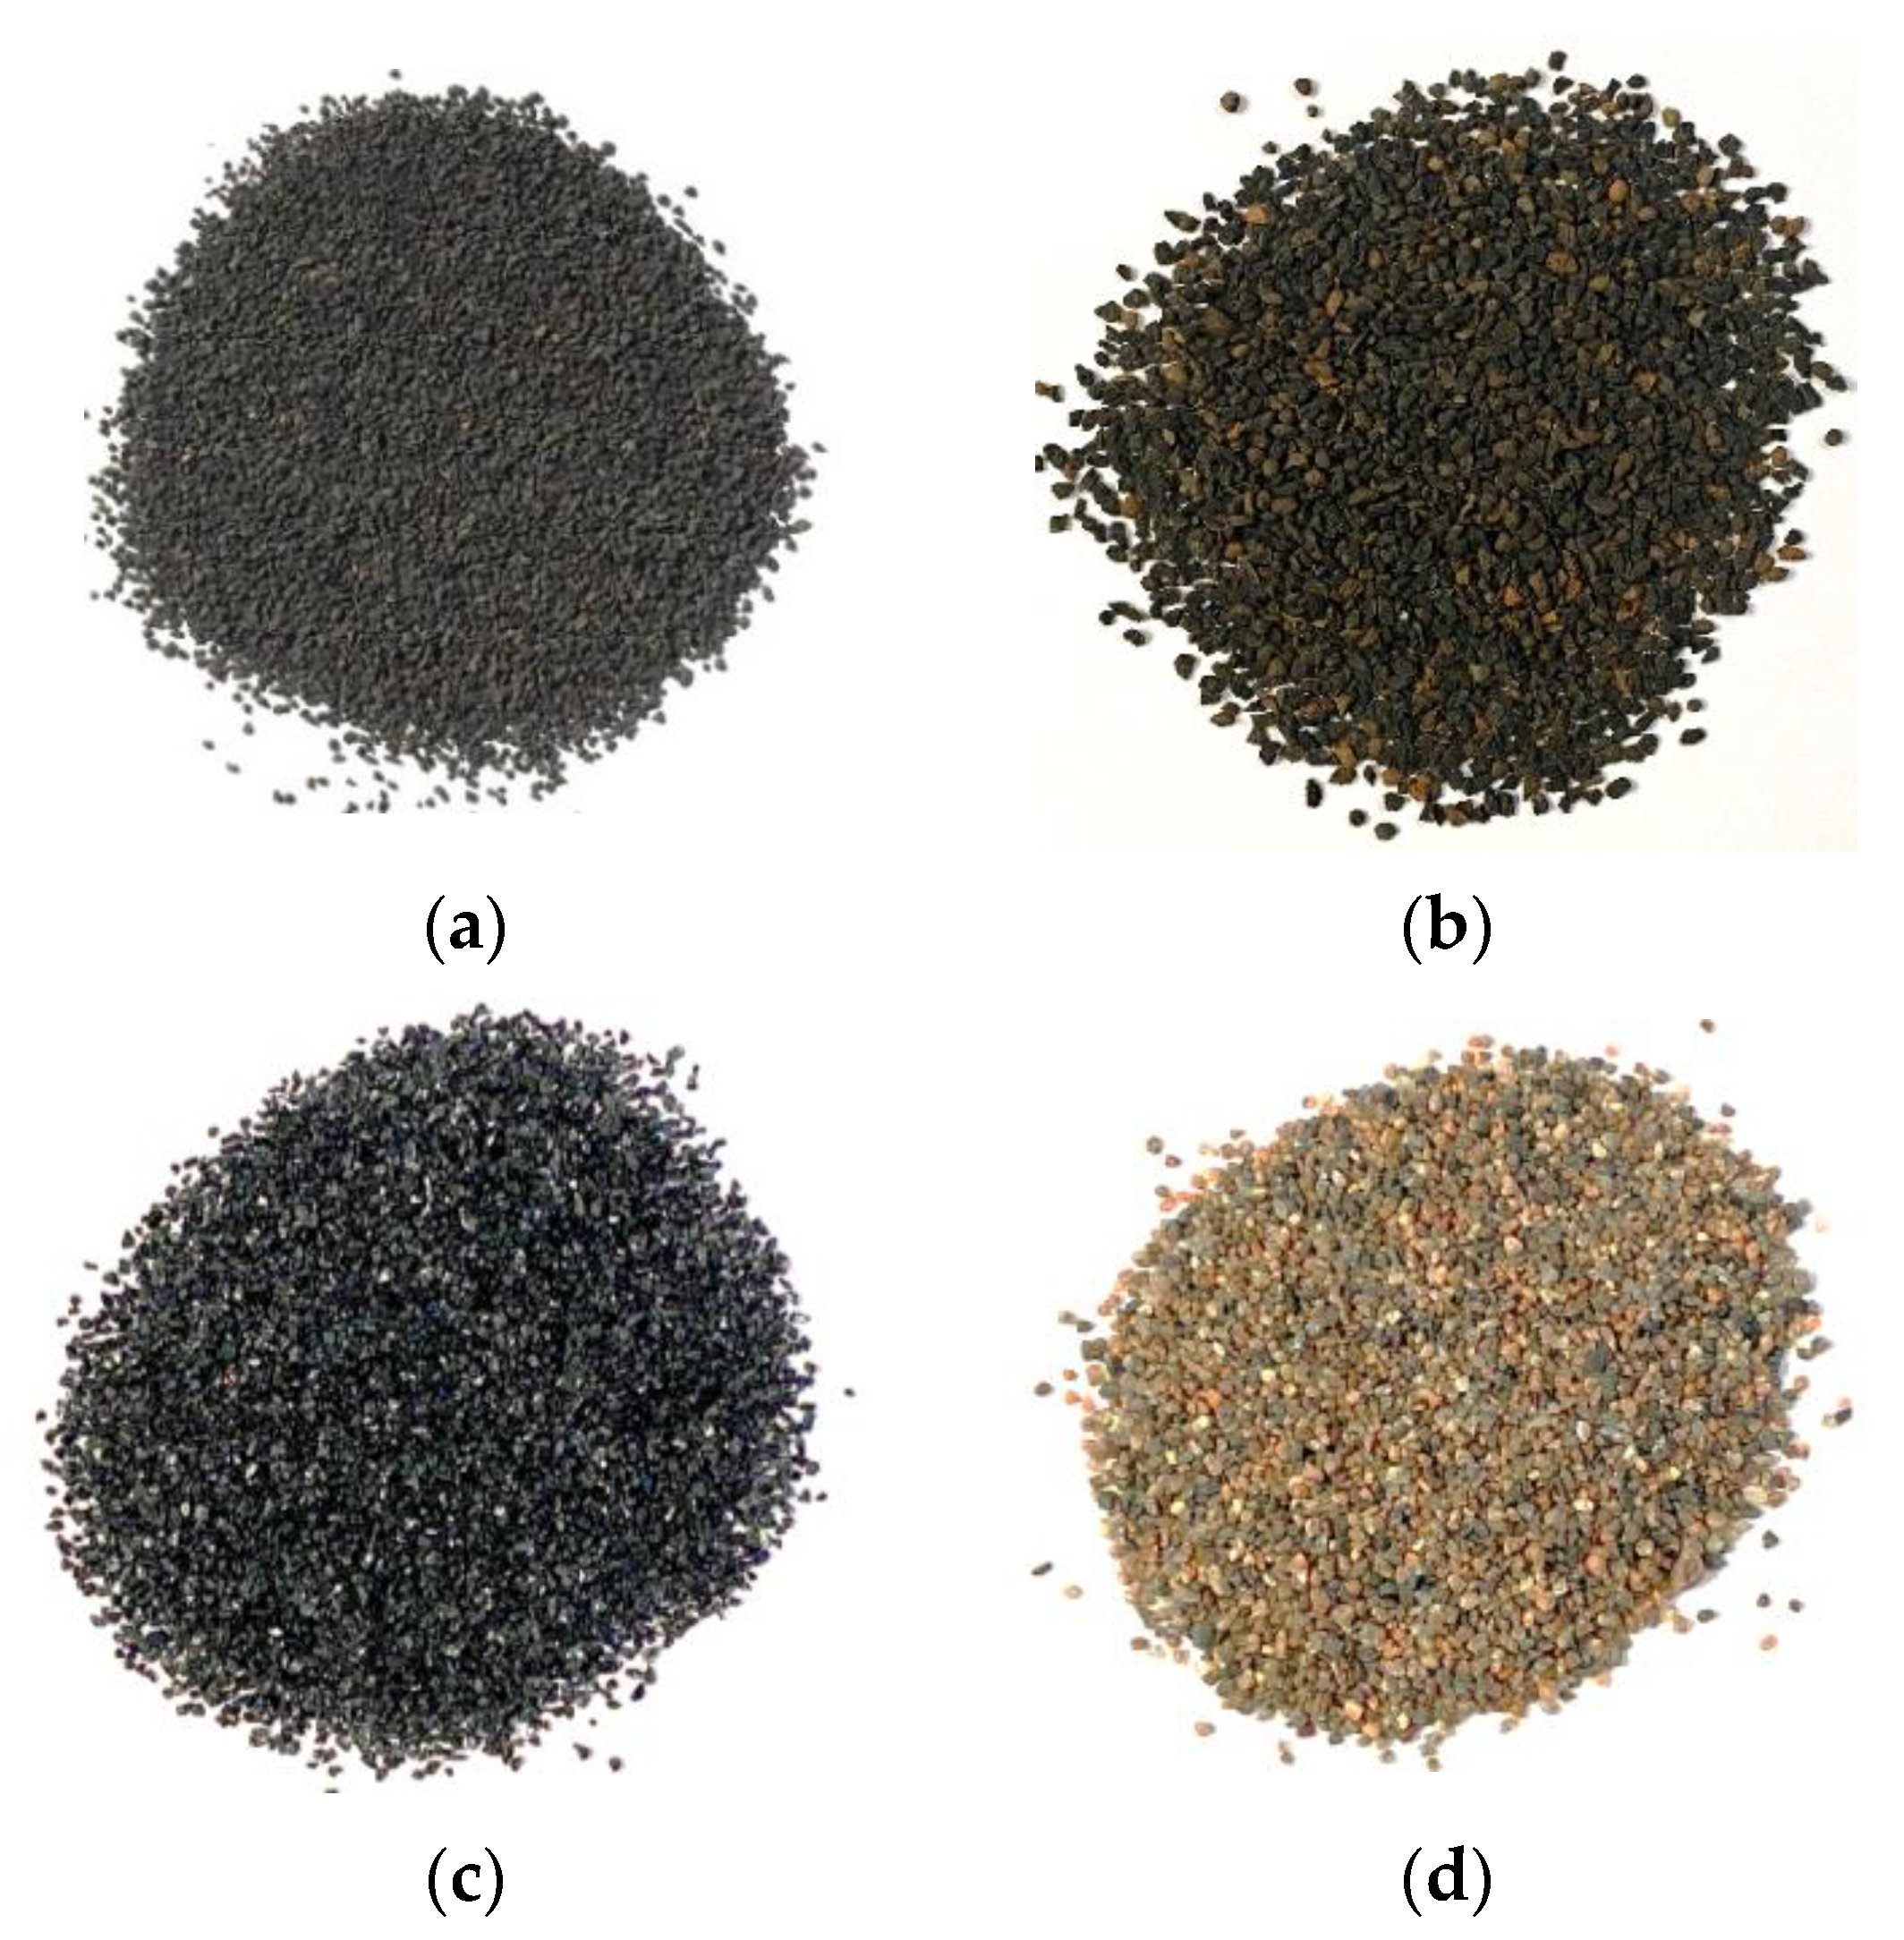
Filtralite appears as brown–grey, crushed grains with a sharp geometry and an open, porous internal structure. The anthracite was silvery grey, with a similar grain size distribution to that of the Filtralite 0.8–1.6. “Rådasand” is quartz filter-sand.
Figure 1a–d show photos of selected materials.
2.2. Methods
British Water test standard BW:P.18.93 First revision was the main guideline when carrying out the bed expansion experiments [
13]. Apparent particle densities were measured by standard EN 1097-6, Annex E. Effective size D
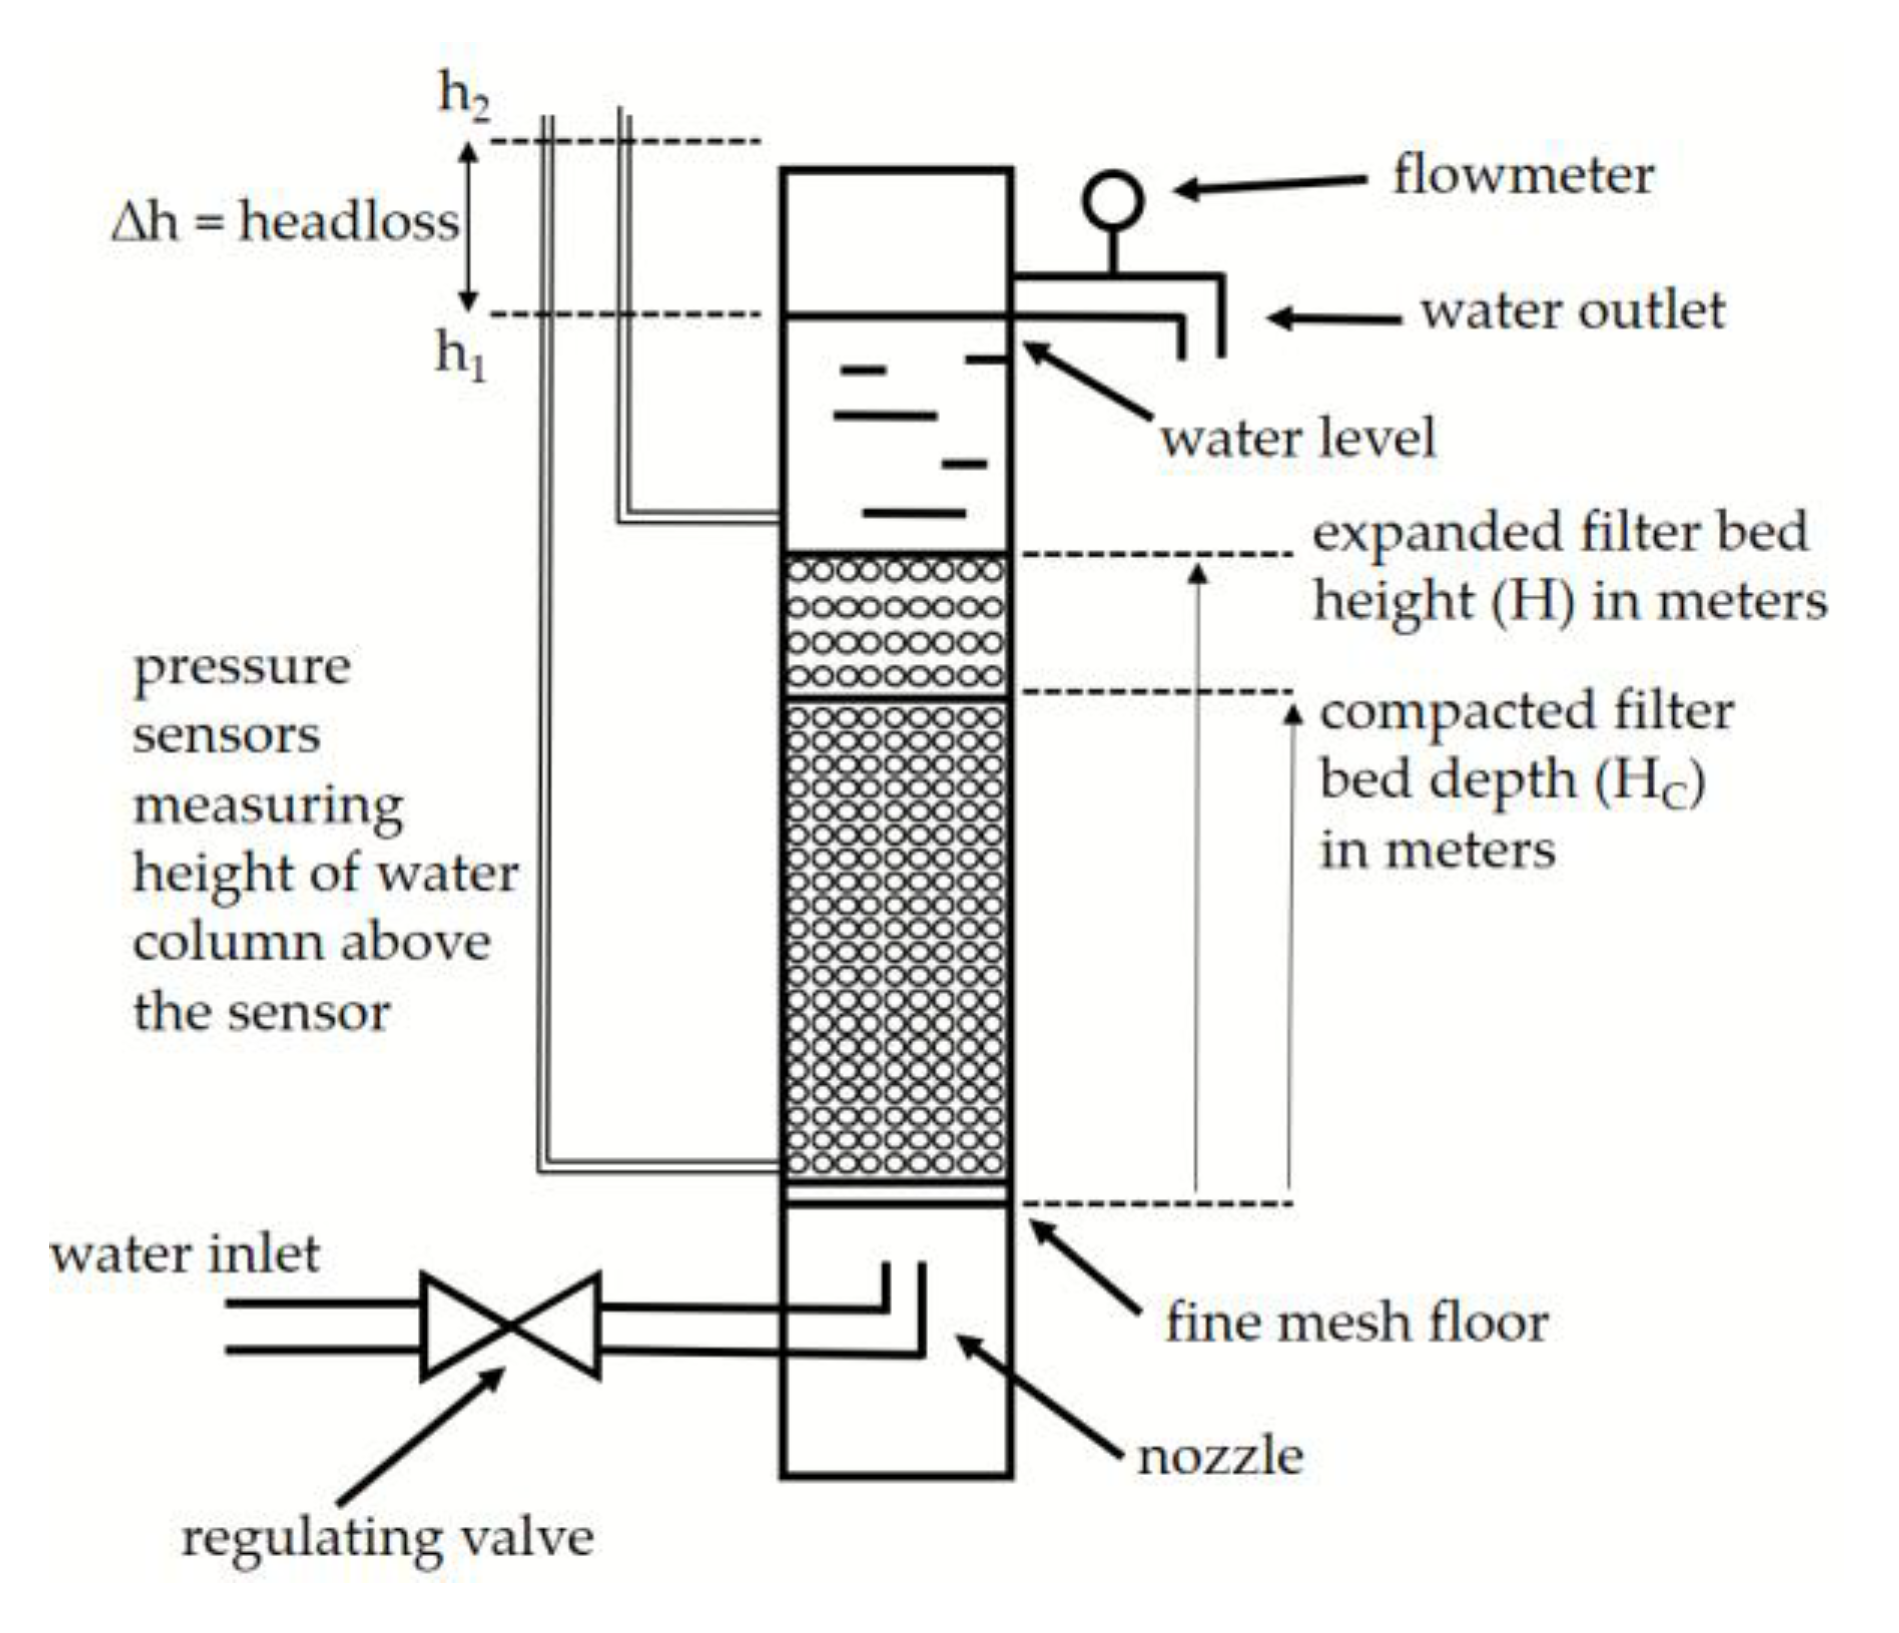
10 was measured by standard EN 12905. As described and illustrated in
Figure 2, a transparent filter-column was constructed.
A bottom nozzle was covered with a mesh floor and a diffuser to prevent jetting. Outlets for pressure sensors (manometers) were connected to the tubing. The bottom pressure sensor outlet was placed just above the mesh, i.e., at the bottom of the filter media. The top measuring manometer was above the material bed and remained above the fluidized material during the measurements. The internal column diameter was 150 mm. Prior to the tests, all materials were submerged in water for 2 weeks to be completely saturated. There were no floating grains.
Tap-water at two different temperatures was used for the tests; nominally room-temperature water and cold, fresh tap water. Temperatures were registered by a thermocouple in the inlet water chamber. Since the setup lacked precise temperature control, data were grouped in the following ranges: (1) 13–17 °C and (2) 21–26 °C, see
Table 2 and
Table 3. The filters were too loosely packed after initial gravitational settling, so all samples were completely compacted by knocking on the column until the material could not be further compacted. This was done to ensure consistent initial states, and the procedure is explained in a test method for filter materials [
14]. Filtralite compacts very readily using this method. The depth of all filter materials in the compacted state was about 500 mm.
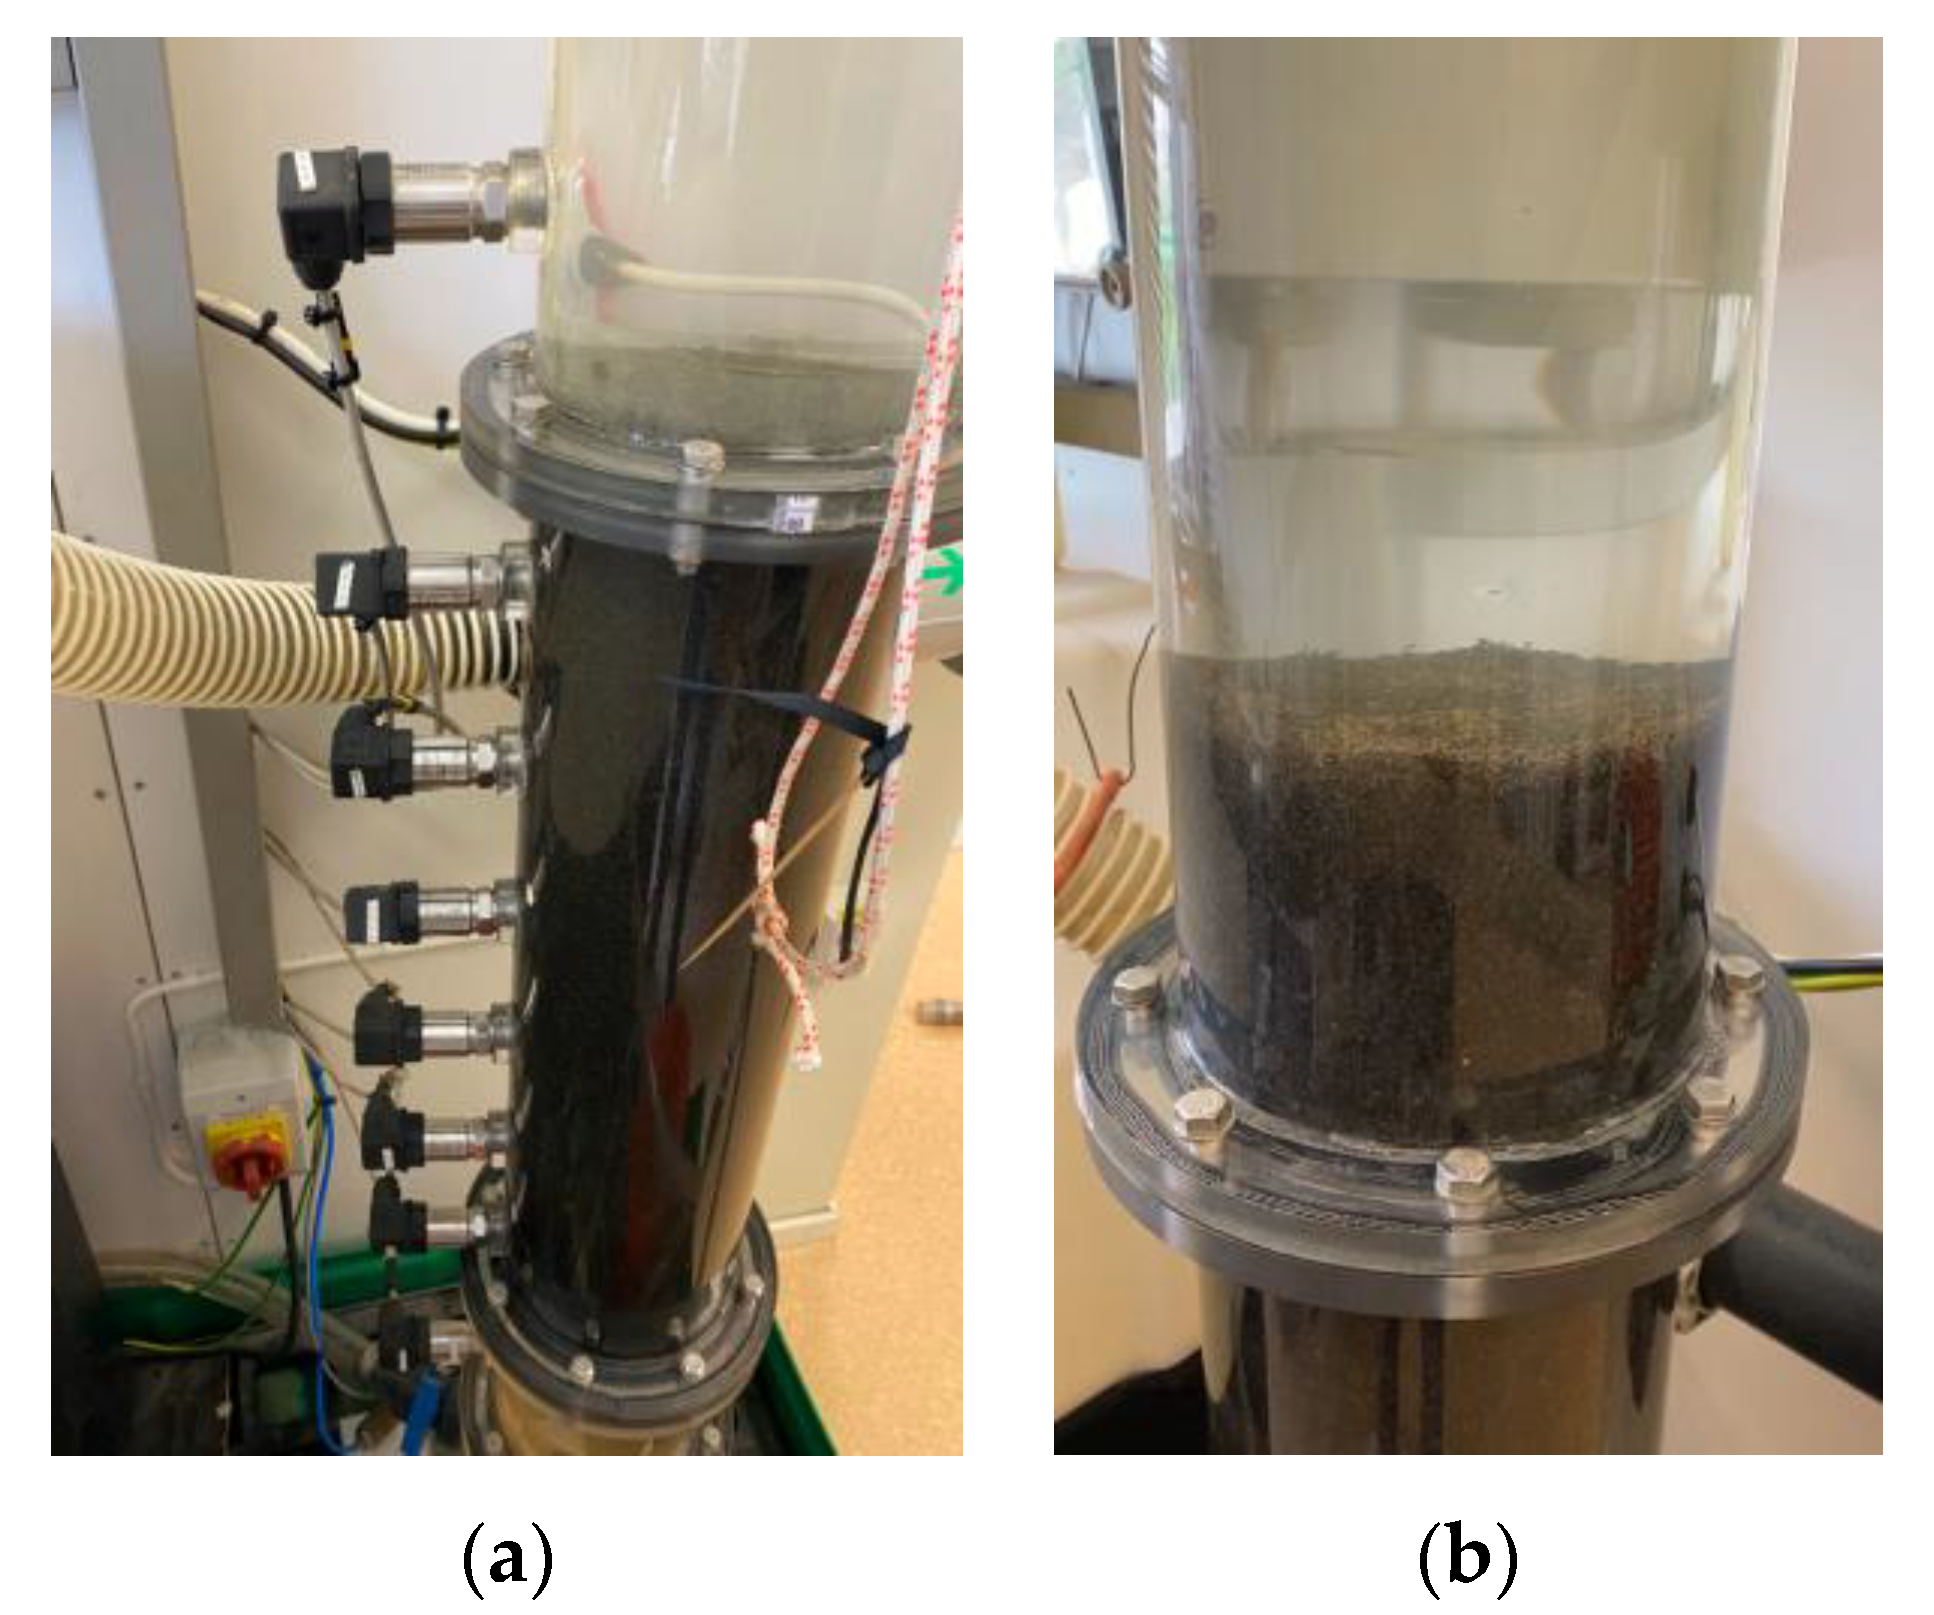
Figure 3 below shows photos of the filter column.
No sediments or coagulants were added, as the purpose was to investigate clean-bed expansion at different temperatures. Air was not used. All tests were firstly carried out with increasing water flow, starting at 0 m/h and ramping up with 5–15 m/h steps (dependent on media type) until the flow rate needed to obtain an expanded bed depth of 1.5 times the initial height (HC) was reached. After full fluidization, the process was repeated, but with decreasing the rate until the surface of the materials had ceased to move. Manometer levels (h1 and h2) and bed height (H) were recorded for each flow rate.
The headloss gradient value required was the difference between the levels of the digital manometers divided by the initial (compacted) depth of the filter bed (H
C). In a basic form, headloss can be expressed as meter headloss per meter bed depth (m/m). The headloss increased with the flow rate up to the minimum fluidization flow rate (V
mf), where a maximum headloss (fluidization headloss plate) was reached. Headloss gradient (m/m), m headloss per m bed depth:
The expansion (%) of the filter bed is calculated as the percentage increase in depth over the compacted depth (H
C):
During backwash, friction forces act on the grains and expand the media. The state of fluidization is reached when the friction drag or the pressure drop across the filter bed is just enough to support the weight of the media [
15].
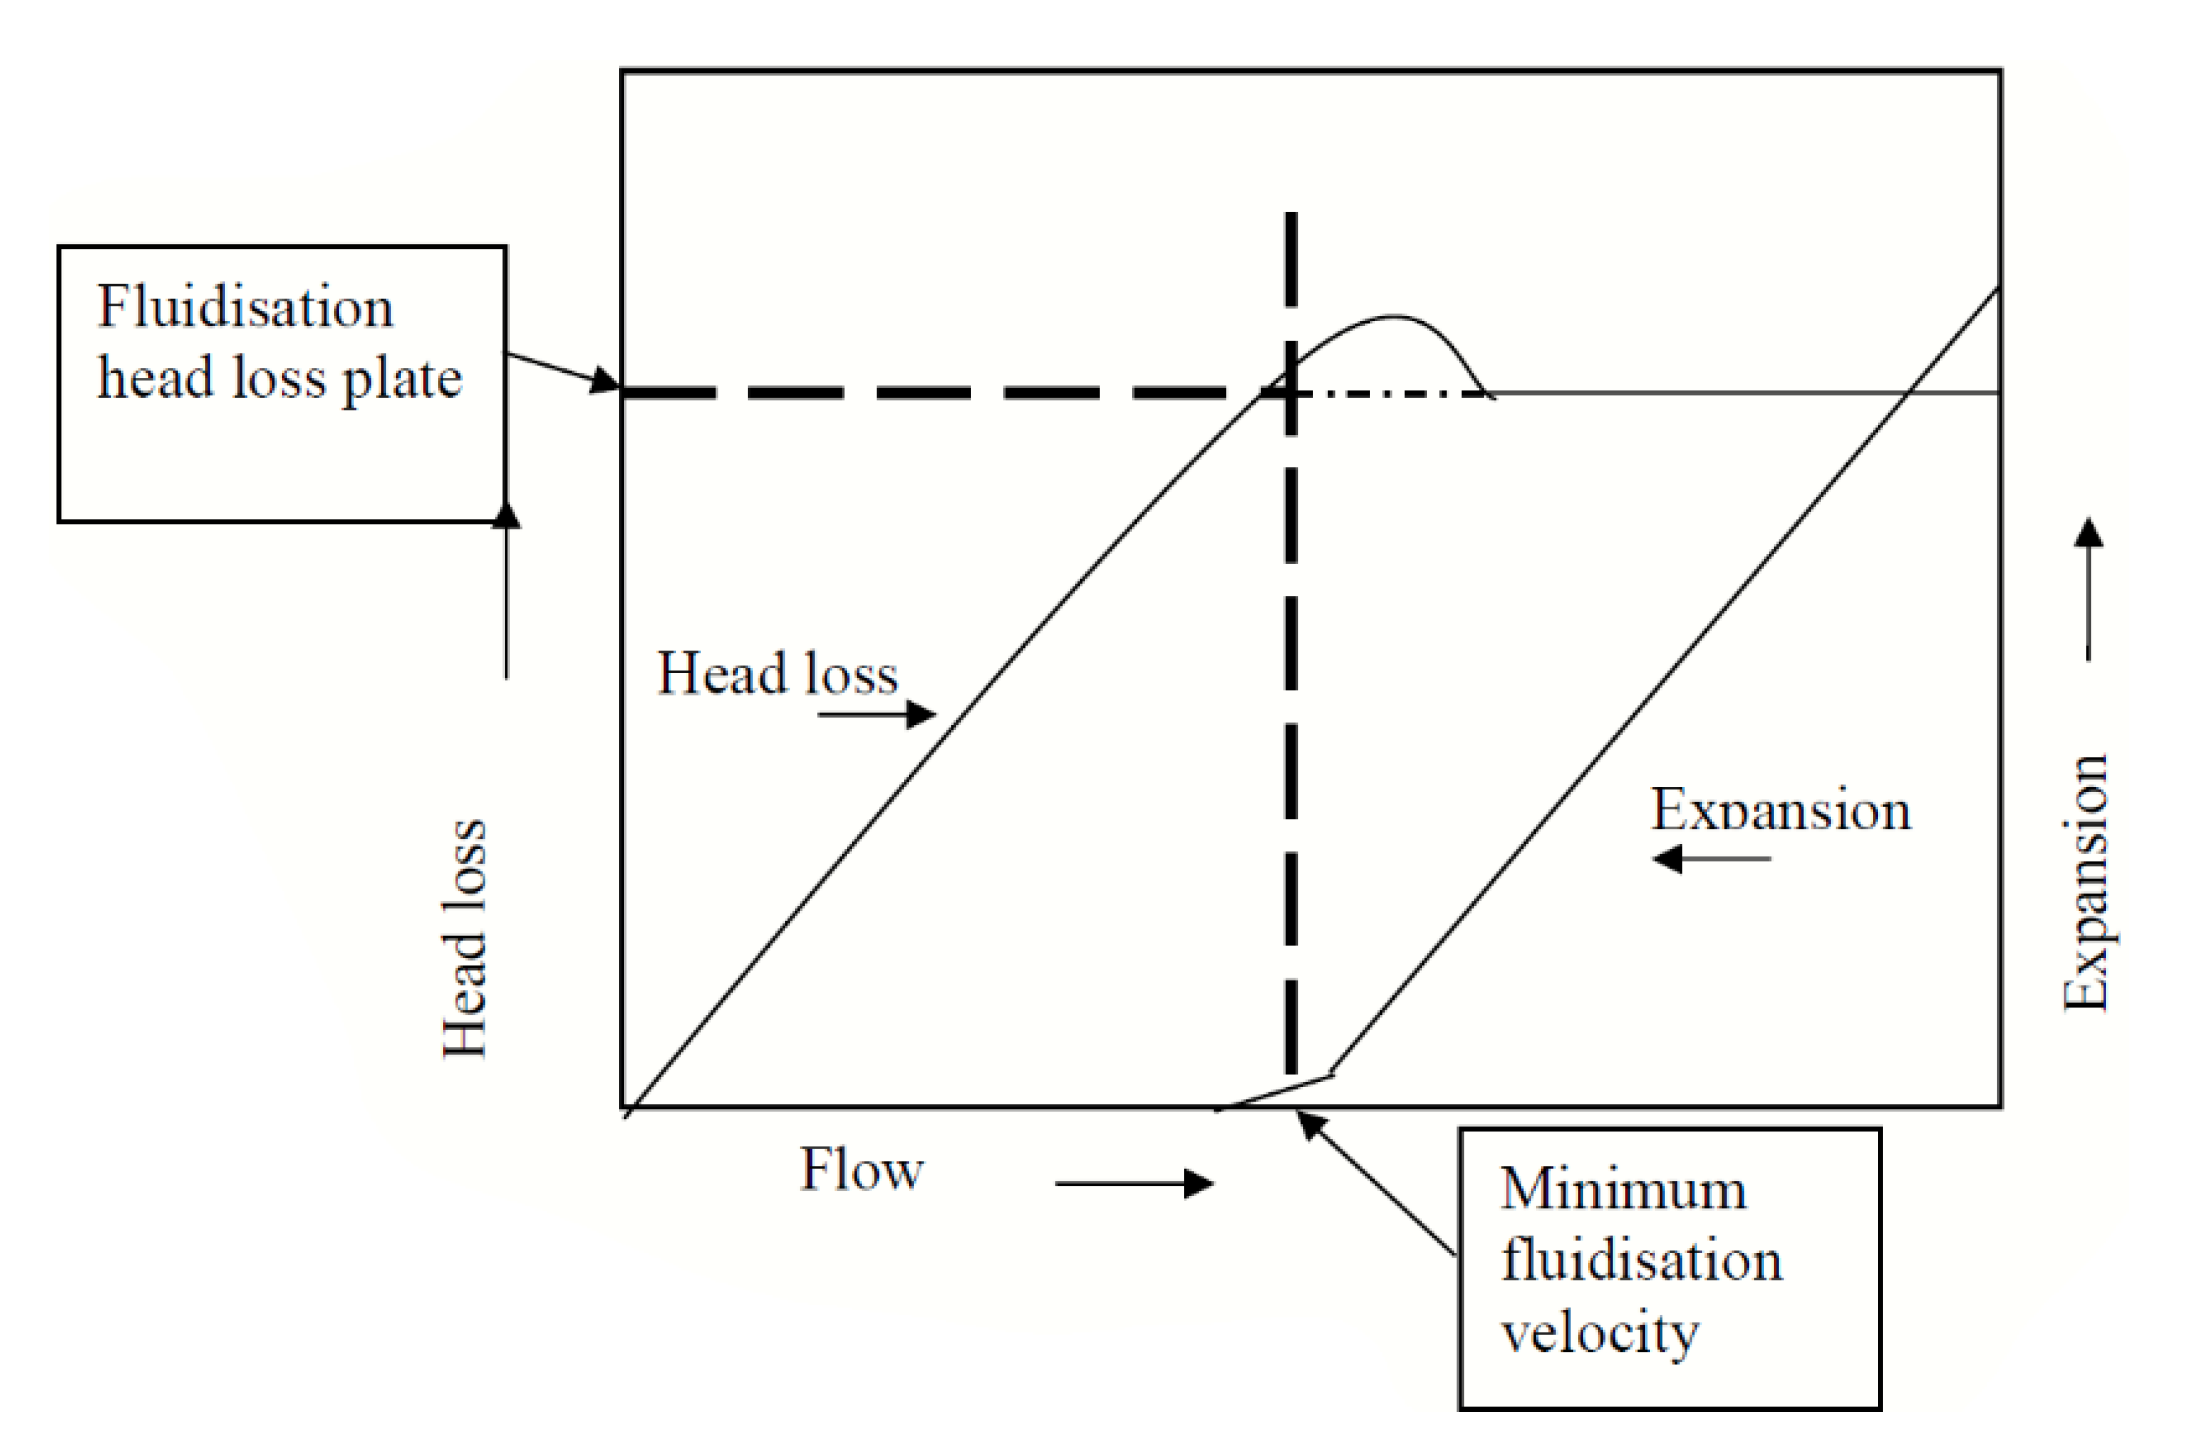
Figure 4 shows a graphical illustration of the generalized expected results for headloss and expansion as a function of water flow rate (m/h). The minimum fluidization rate and fluidization headloss plate should be later recognized, as shown in this theoretical model [
16].
3. Results
The results are presented in
Figure 5,
Figure 6,
Figure 7,
Figure 8,
Figure 9,
Figure 10,
Figure 11,
Figure 12 and
Figure 13. The plots represent the volume expansion (%) of the relative height difference. At 15–20% expansion, all media are in a fluidized state and scouring should be in effect [
17]. The expansion target was set to be 15%, and the corresponding flow rates were recorded along with peak headlosses at partial fluidization. A 15% expansion is a typical target, as this rate usually signifies the transition from partial to full fluidization. Sphericity effects were not considered.
Due to time limitations, only one test per batch of material was executed, and consequently deviations could not be recorded, although tests were performed prior to the trial to establish consistent repeatability. As recommended by standards [
13,
14], the measurements were done with increasing flow and decreasing flow rate. For simplicity, decreasing flow plots were omitted, as they did not significantly differ from the increasing flows plots.
4. Discussion
Selected backwashing properties of common granular filter media were analyzed according to standardized tests [
13,
14].
Firstly, the purpose of the experiments was to compare filter materials with different physical properties, and secondly, to indicate the dependence of backwash expansion on water temperature. Raw water may seasonally vary above and below 20 °C, hence temperature conditions are highly relevant to treatment plants that need to adapt water production to viscosity.
The overall results suggest that both filter density and media size can be adjusted to suit backwash regimes and operational limitations for a unique treatment train. Increasing grain size and porosity will act towards maintaining hydraulic permeability, and the filters will resist high pressure drops during backwashes, especially when compacted. Furthermore, the finer grained materials expand more readily as a result of the induced pressure, i.e., headloss, acting on the grains during backwash.
Listed in
Table 2 are the corresponding flow rates necessary for 15% expansion in the two temperature ranges. Partial fluidization is sufficient to cause the rubbing of grains, whilst avoiding full fluidization, as full fluidization provides negligible rubbing and may cause filter wash-out [
17].
A key consideration is media particle grain size distribution and size range. Comparisons of effective sizes and fluidization headlosses at different temperatures are summarized in
Table 3.
In the dissertation of T. Saltnes (2002), a linear increase in headloss with an increasing flow rate before fluidization, as well as a constant headloss pattern after bed expansion, are seen [
4]. Saltnes observed that the fluidization of anthracite–sand starts at about 12 m/h, and at about 28 m/h for the Filtralite filter, a result that correlates fairly well with the current study.
For further reference,
Table 4 provides a list of backwashing requirements from an extensive case study on granular filtration media, with regards to biological aerated filters (BAF) [
18].
The final backwashing requirements and duration are often developed via cooperation between designer and user. For example, the backwash sequence for an upflow sunken media BAF can include drain down, air scour, air and water scour (and may also include cycling between air only and air/water scour), water-only rinse, and a filter-to-waste step when the filter bed is placed back in operation, and the whole process is adjusted during long-term operation [
18]. It follows that backwash rates are highly dependent on the configuration of a treatment train and the filter-bed hardware, and must be considered when assessing plant-specific data on the performance of a new material or a specific filtering process for a full-scale pilot test.
Possible continuations of this study could be abrasion, settling rates, turbidity performance and filter run-times for ripening and breakthrough, as well theoretical calculations for examining further dependencies.
5. Conclusions
It was established that differences in fluidization rates could be attributed to density and grain sizes, as also seen in earlier research [
7].
For the two established temperature ranges (13–17 °C and 21–26 °C), the temperature dependency of water viscosity could be observed, as all expansion rates were higher at the lower temperatures.
A clear temperature dependency of headloss at the fluidization plate was not demonstrated, as the fluidization headlosses were not consistently suppressed at higher temperatures, and vice a versa.
To illustrate the dependencies, the following conclusions refer to the temperature range 13–17 °C.
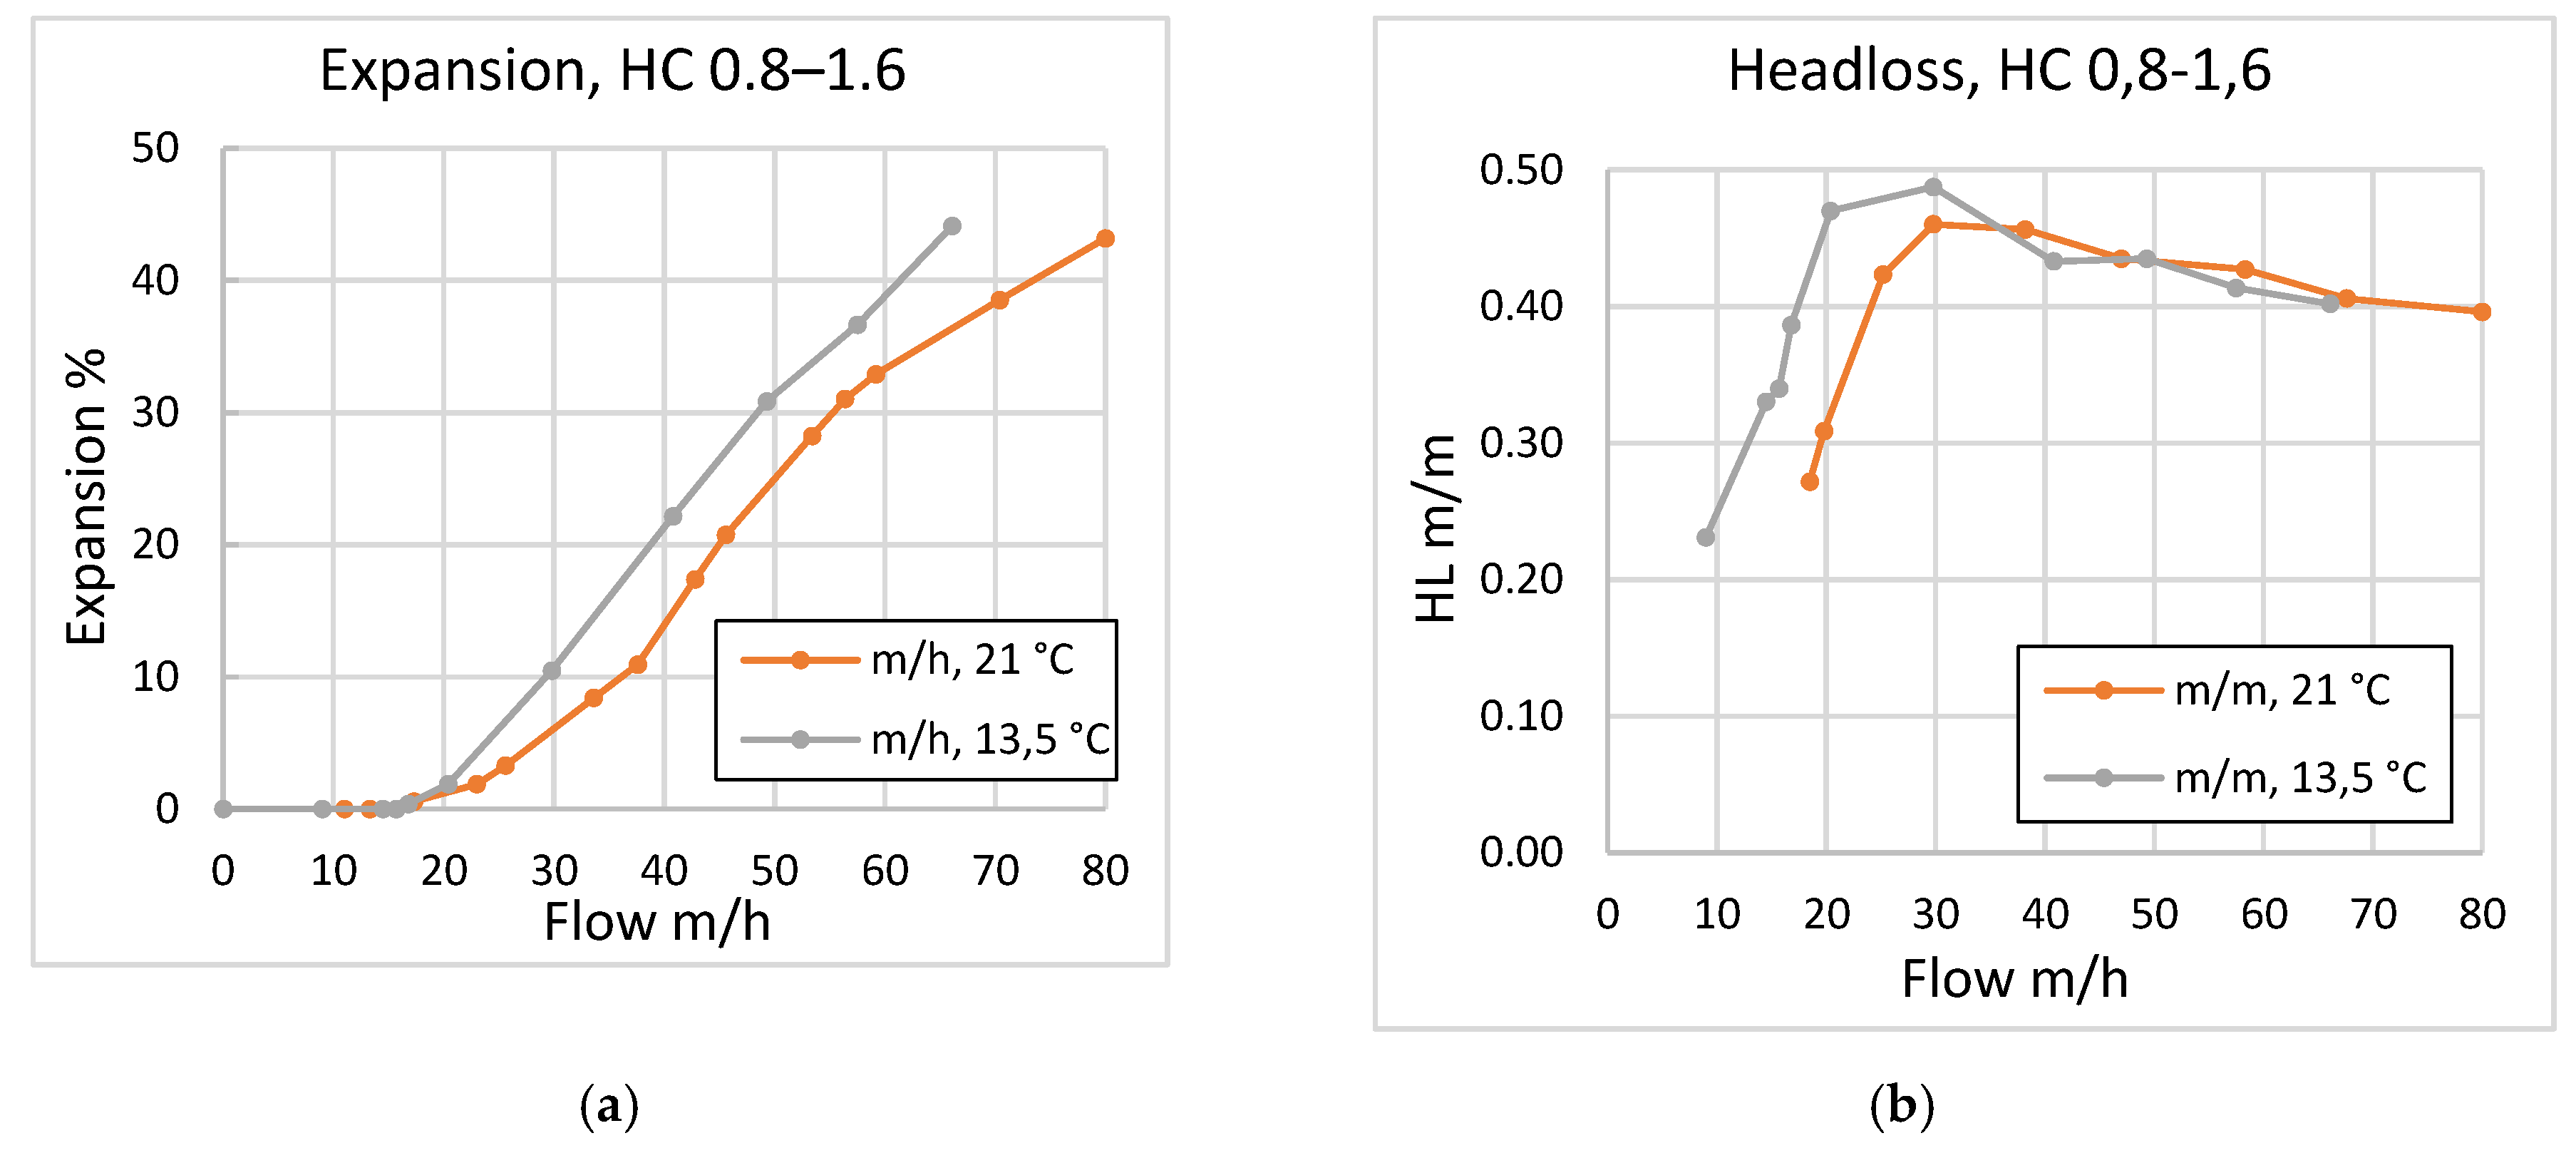
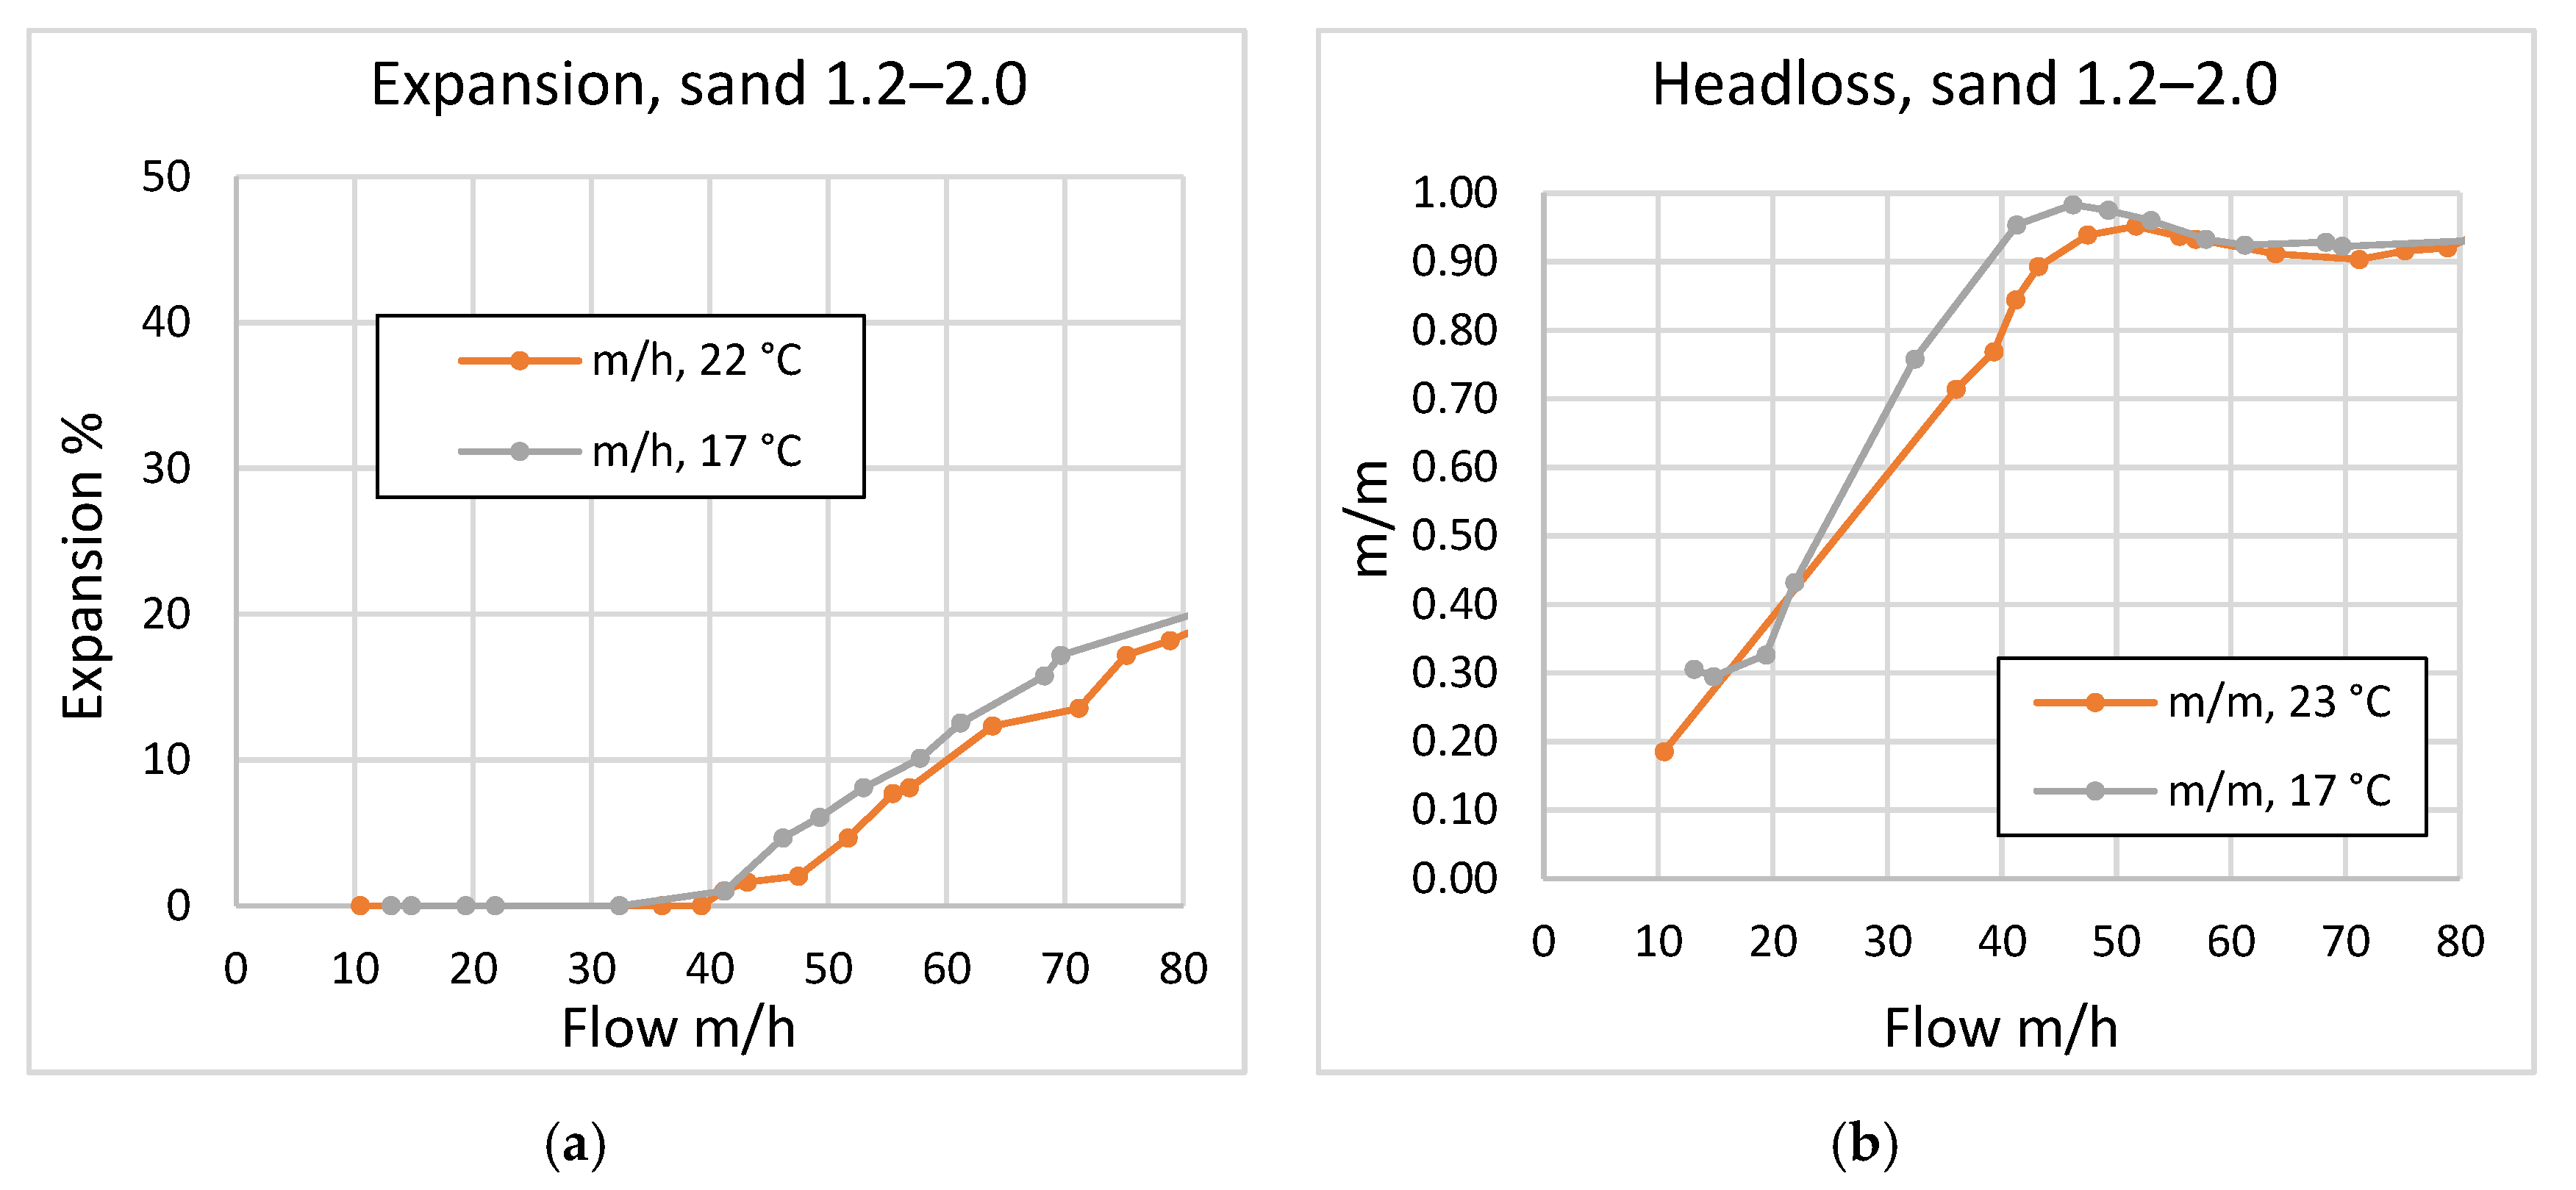
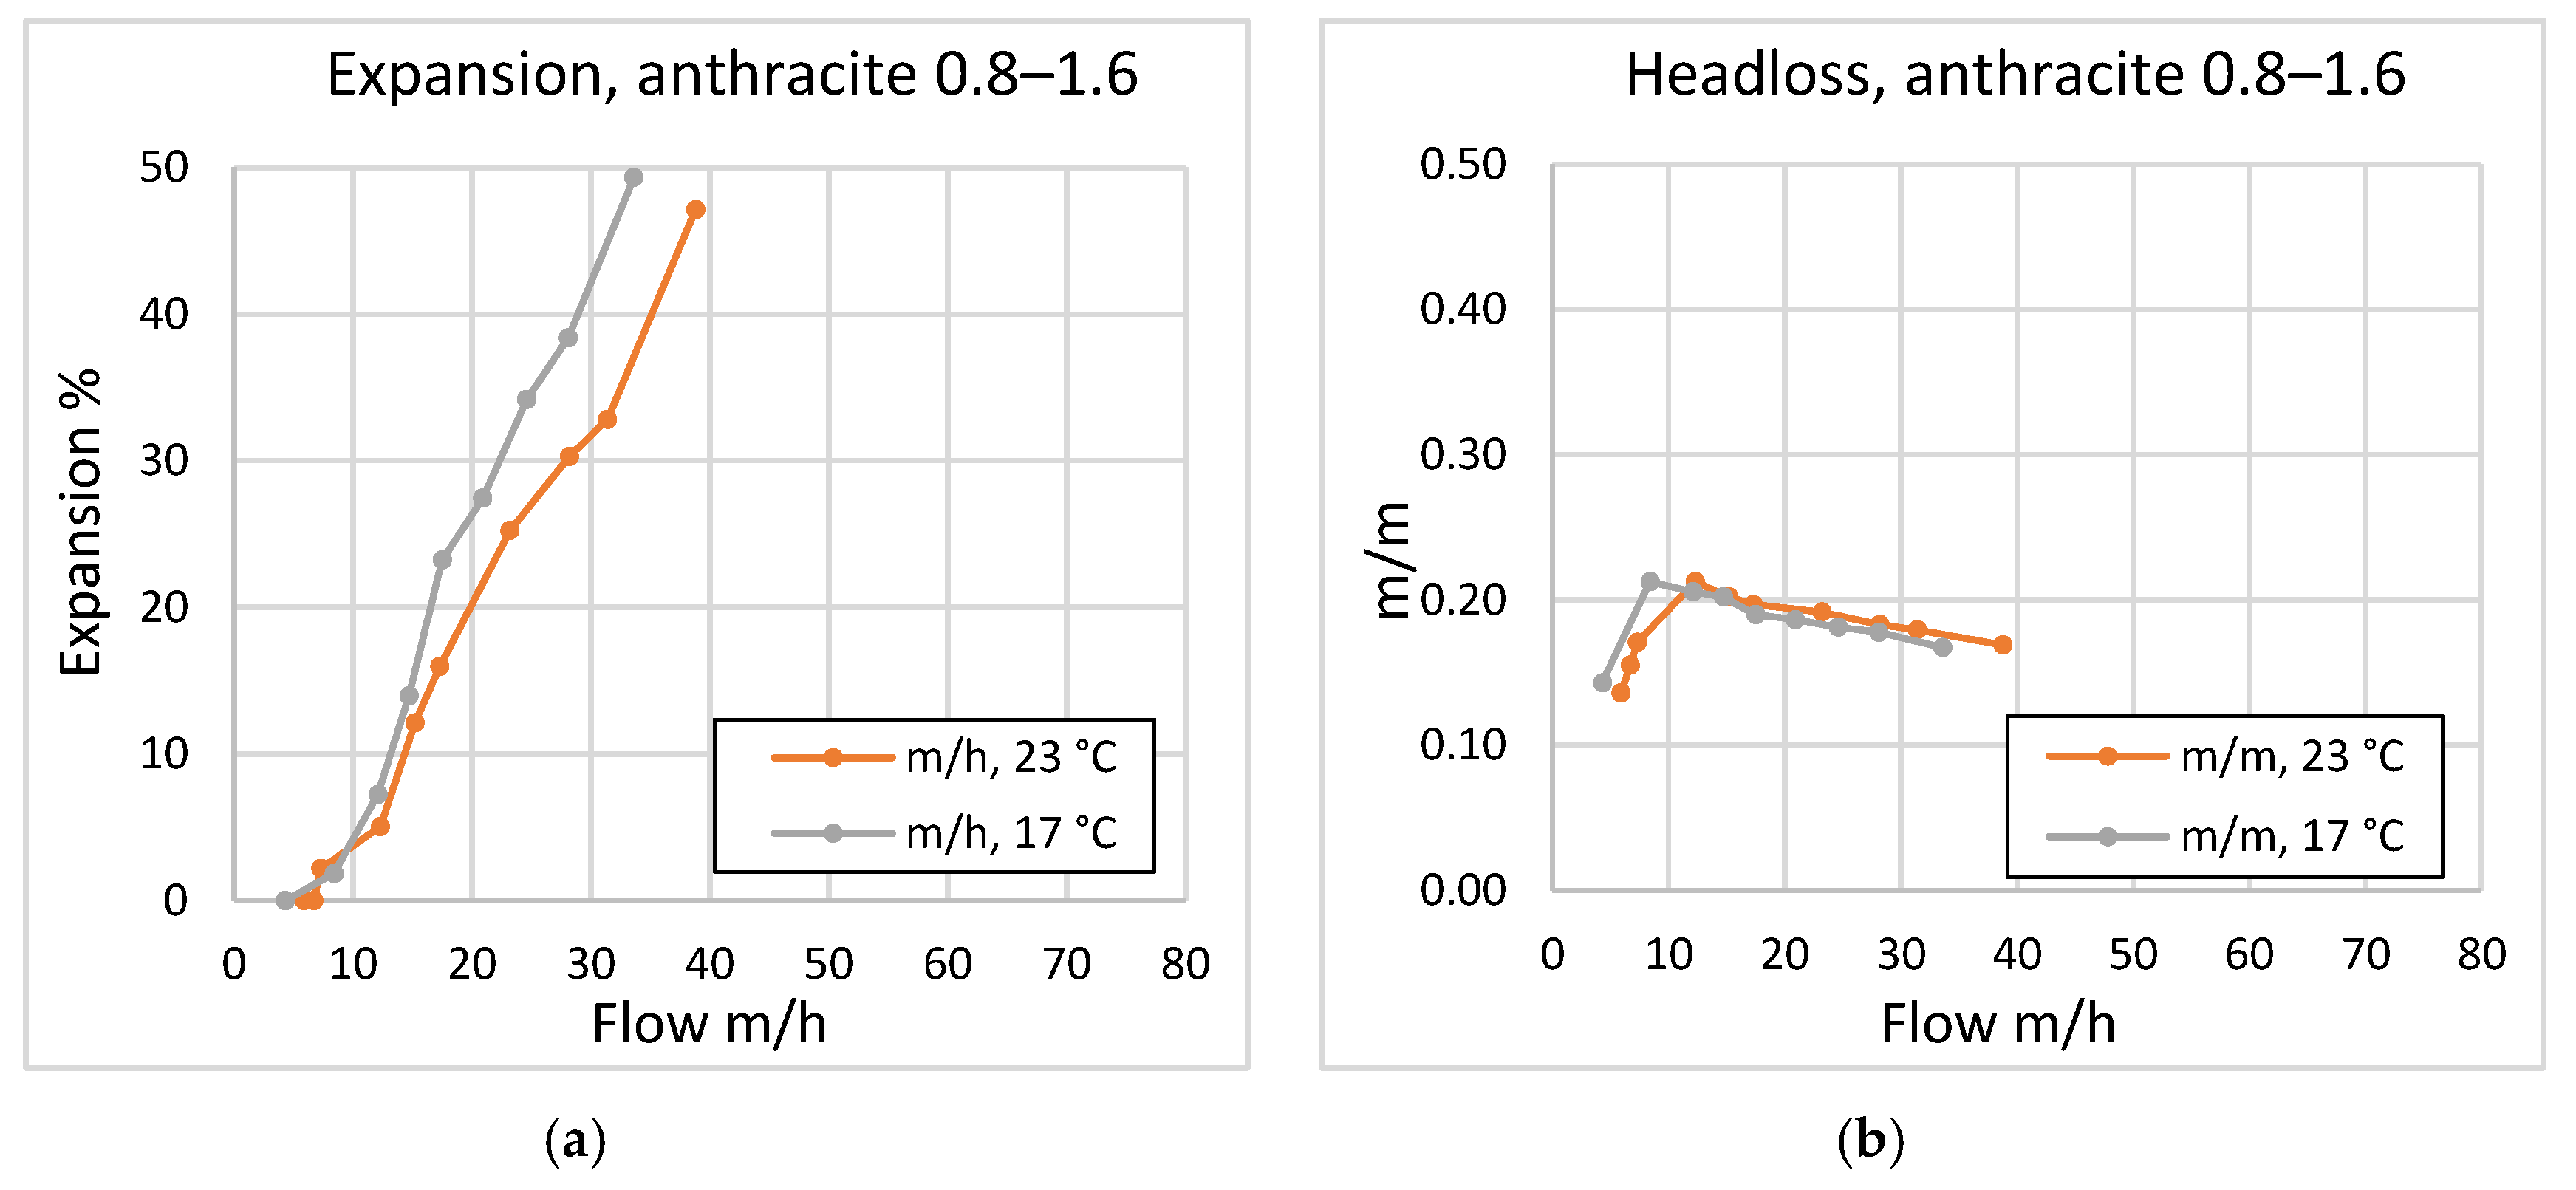
The corresponding flow rates for achieving the expansion target (15%) increased with particle density. This was seen when comparing sand 1.2–2.0 mm (2656 kg/m3) with a 67 m/h flow rate, HC 0.8–1.6 (1742 kg/m3) with a 34 m/h flow rate, and anthracite 0.8–1.6 mm (1355 kg/m3) with a 15 m/h flow rate.
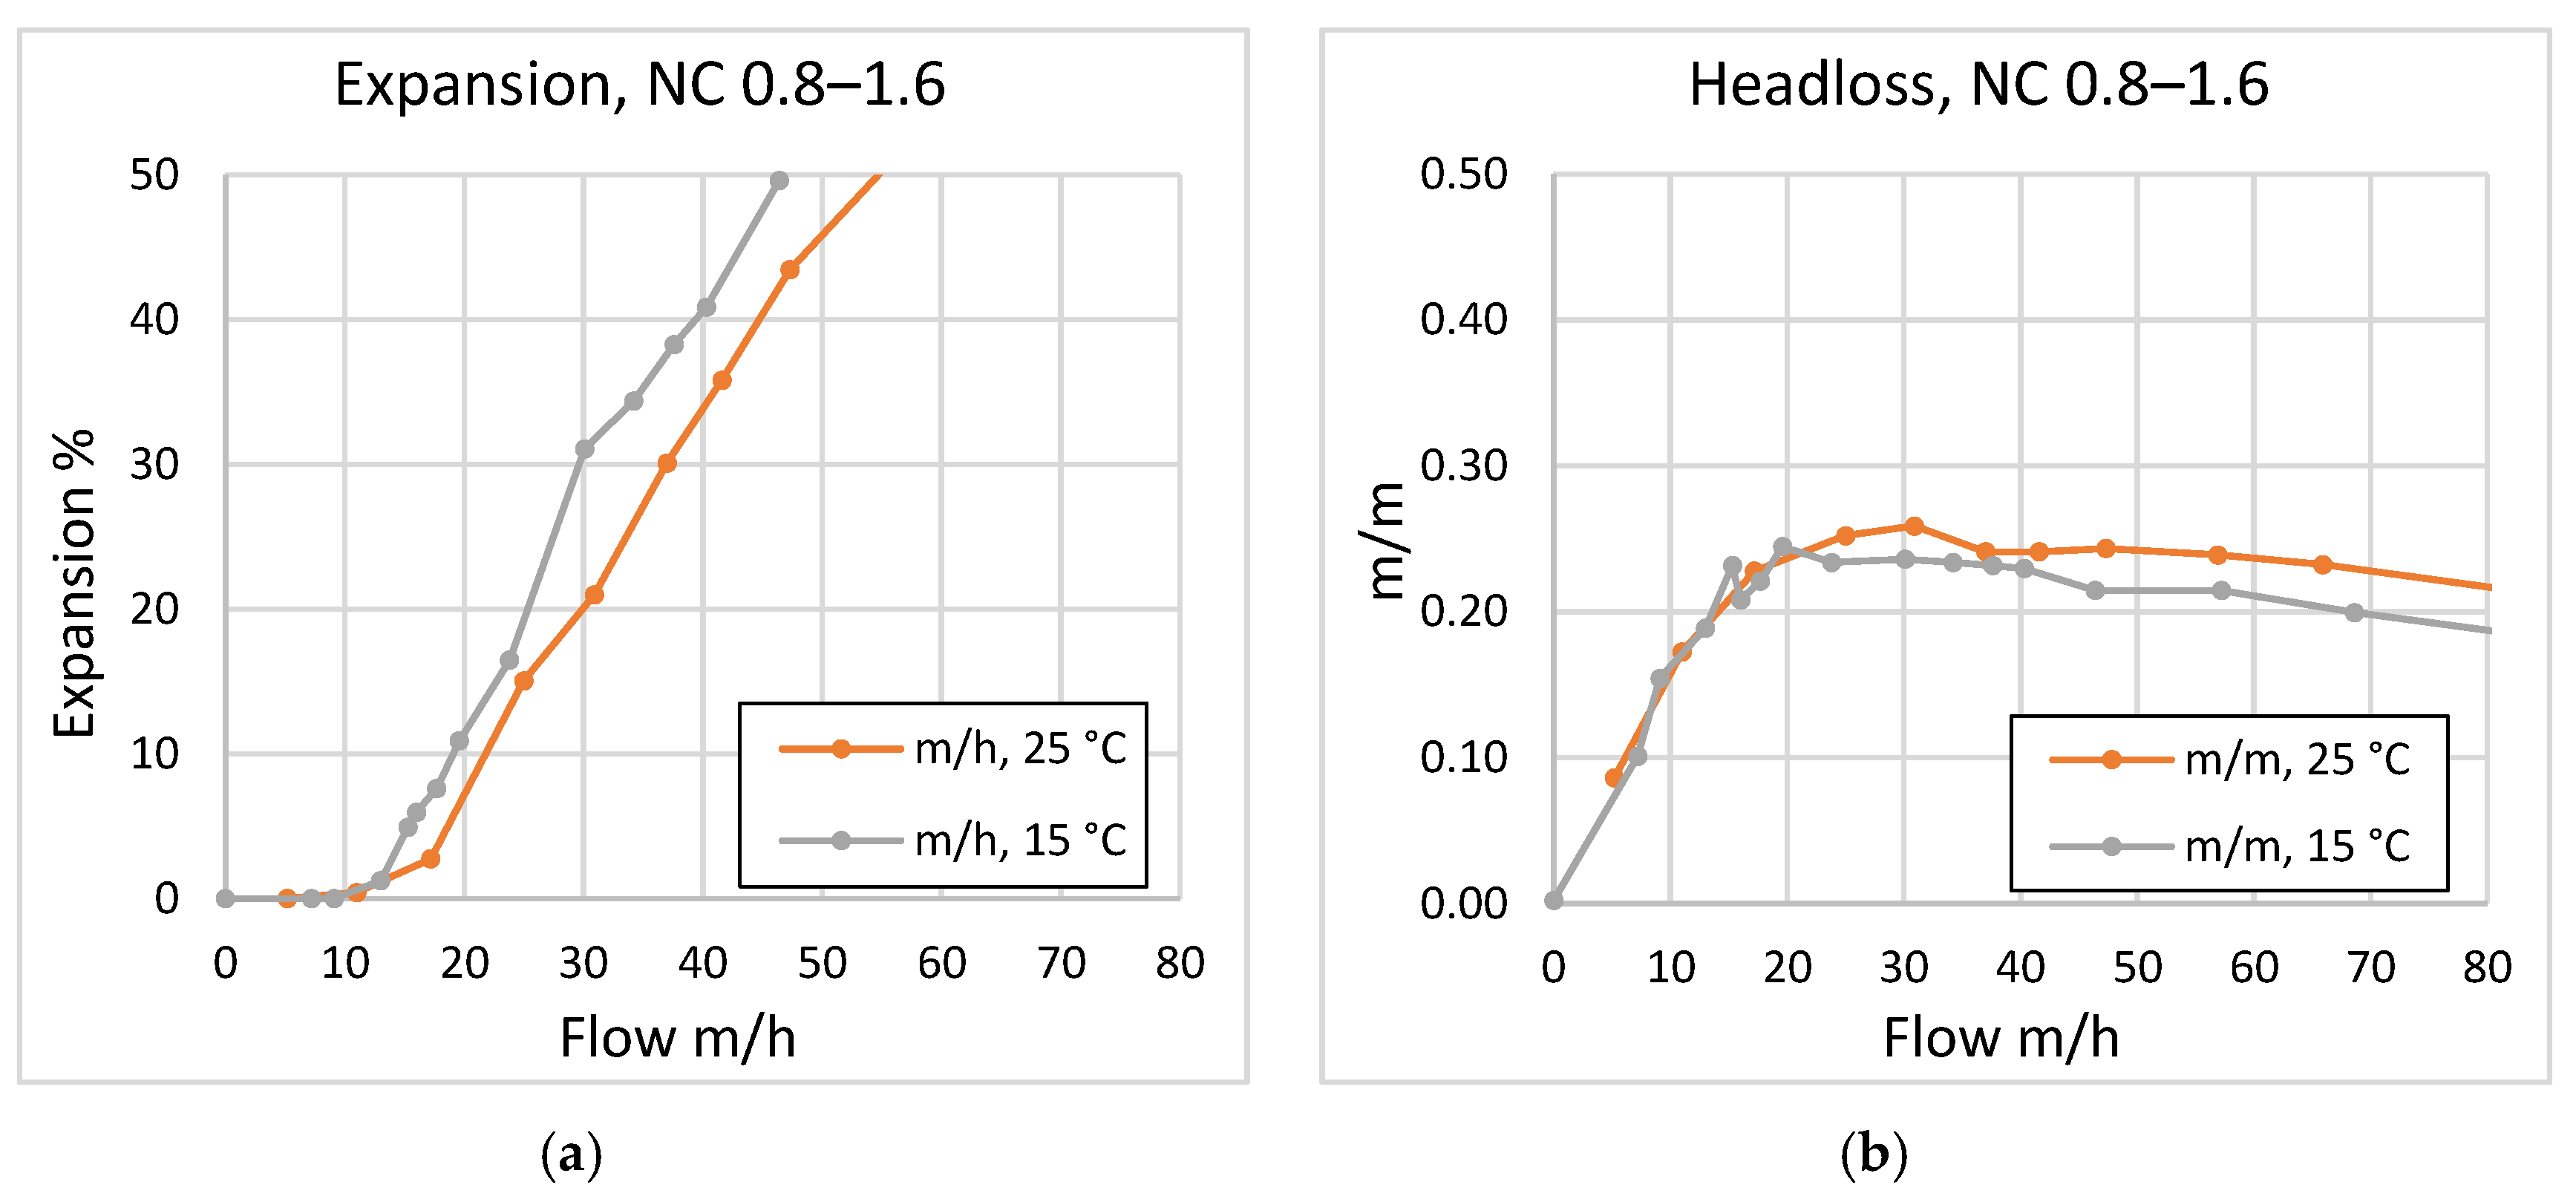
Anthracite 0.8–1.6 had lower headloss and expansion rate (respectively, 15 m/h and 0.21 m/m vs. 22 m/h and 0.24 m/m for the slightly lower particle density of 1250 kg/m3 for NC 0.8–1.6). This conflicts with the hypothesis, and the effect may be due to the high amount of undersized grains (7%) in the anthracite, over-packing in the column, or an unaccounted-for characteristic of anthracite.
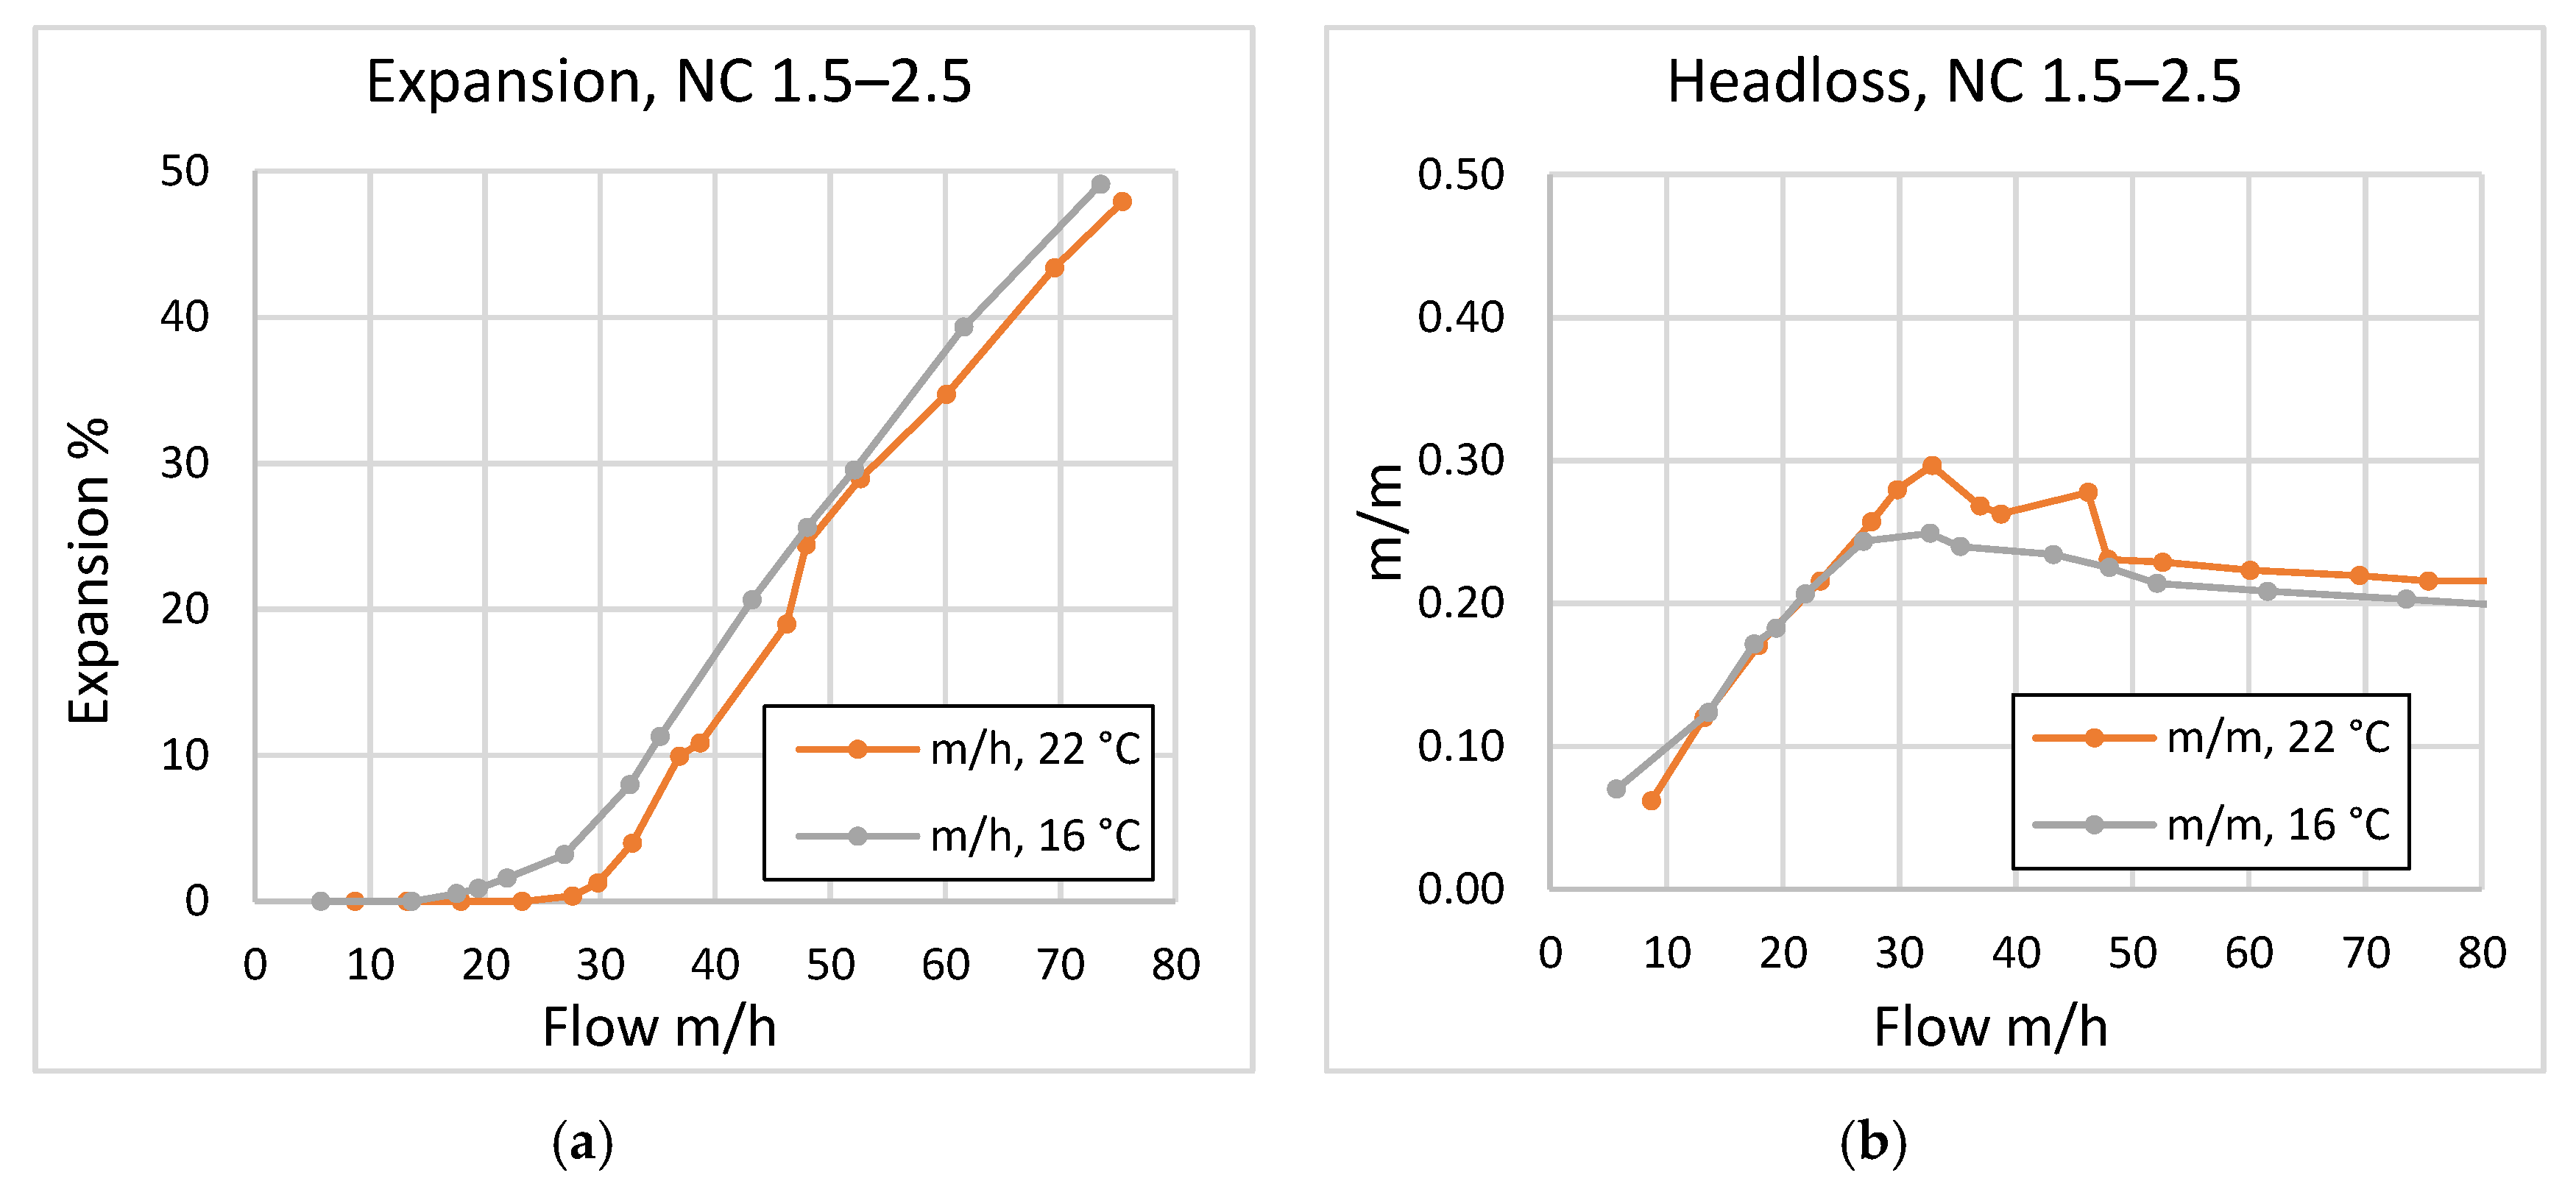
Sand 1.2–2 (2656 kg/m3), with its higher particle density compared with the less dense NC 1.5–2.5 (1042 kg/m3), required a higher flow rate to achieve the expansion target—respectively 67 m/h and 38 m/h. This supports the conclusion that increasing particle density requires increasing the corresponding flow rate to reach the expansion target.
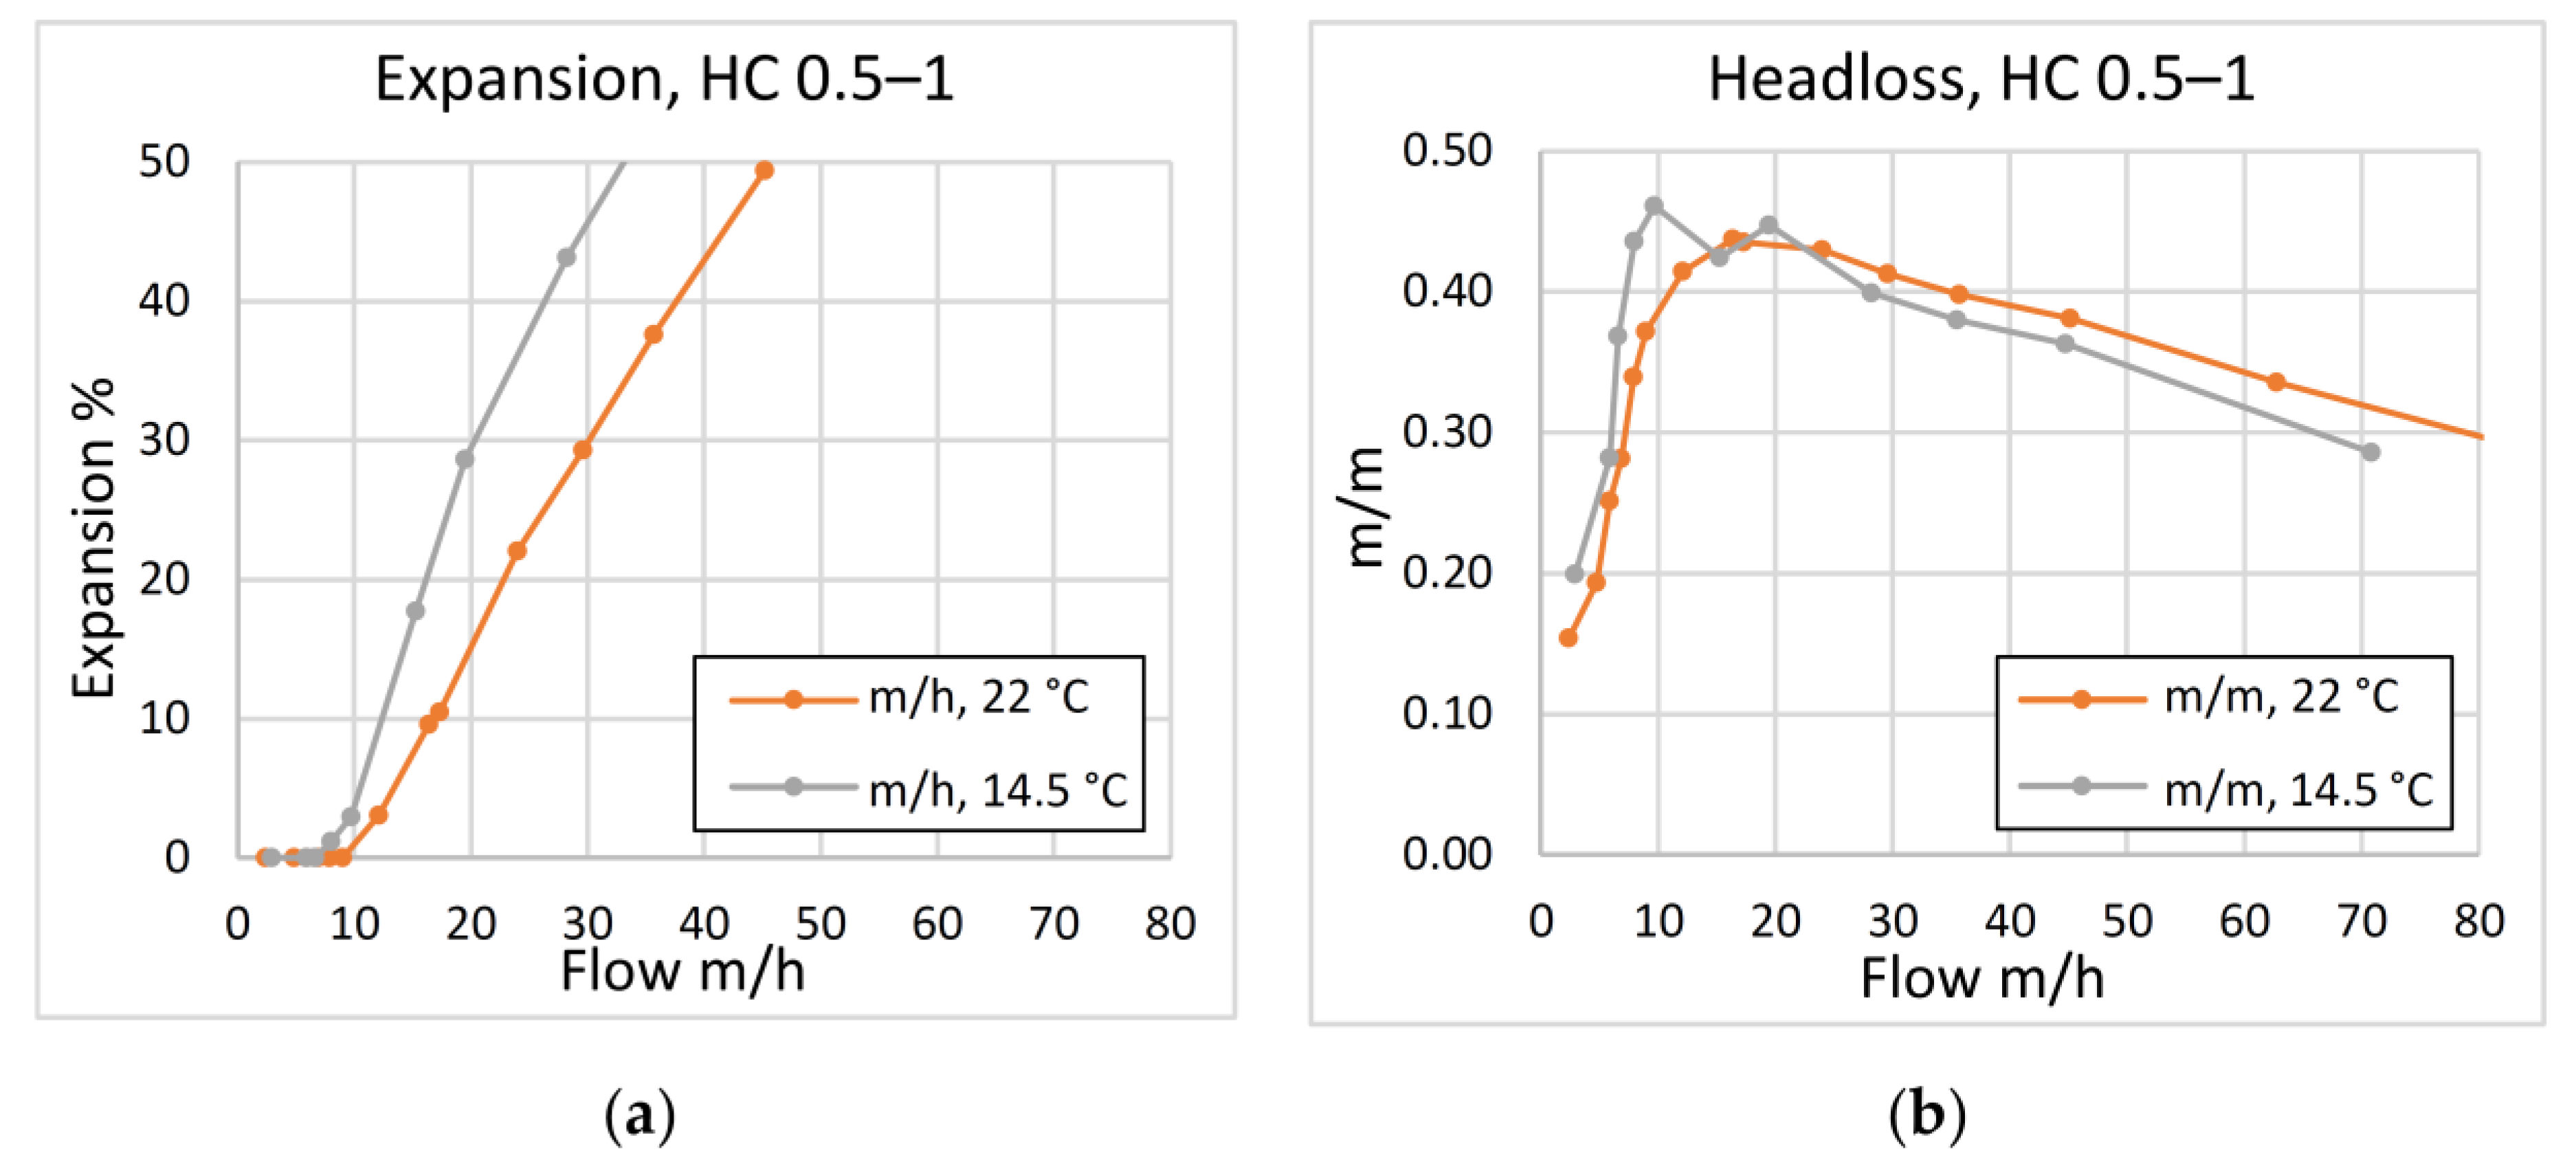
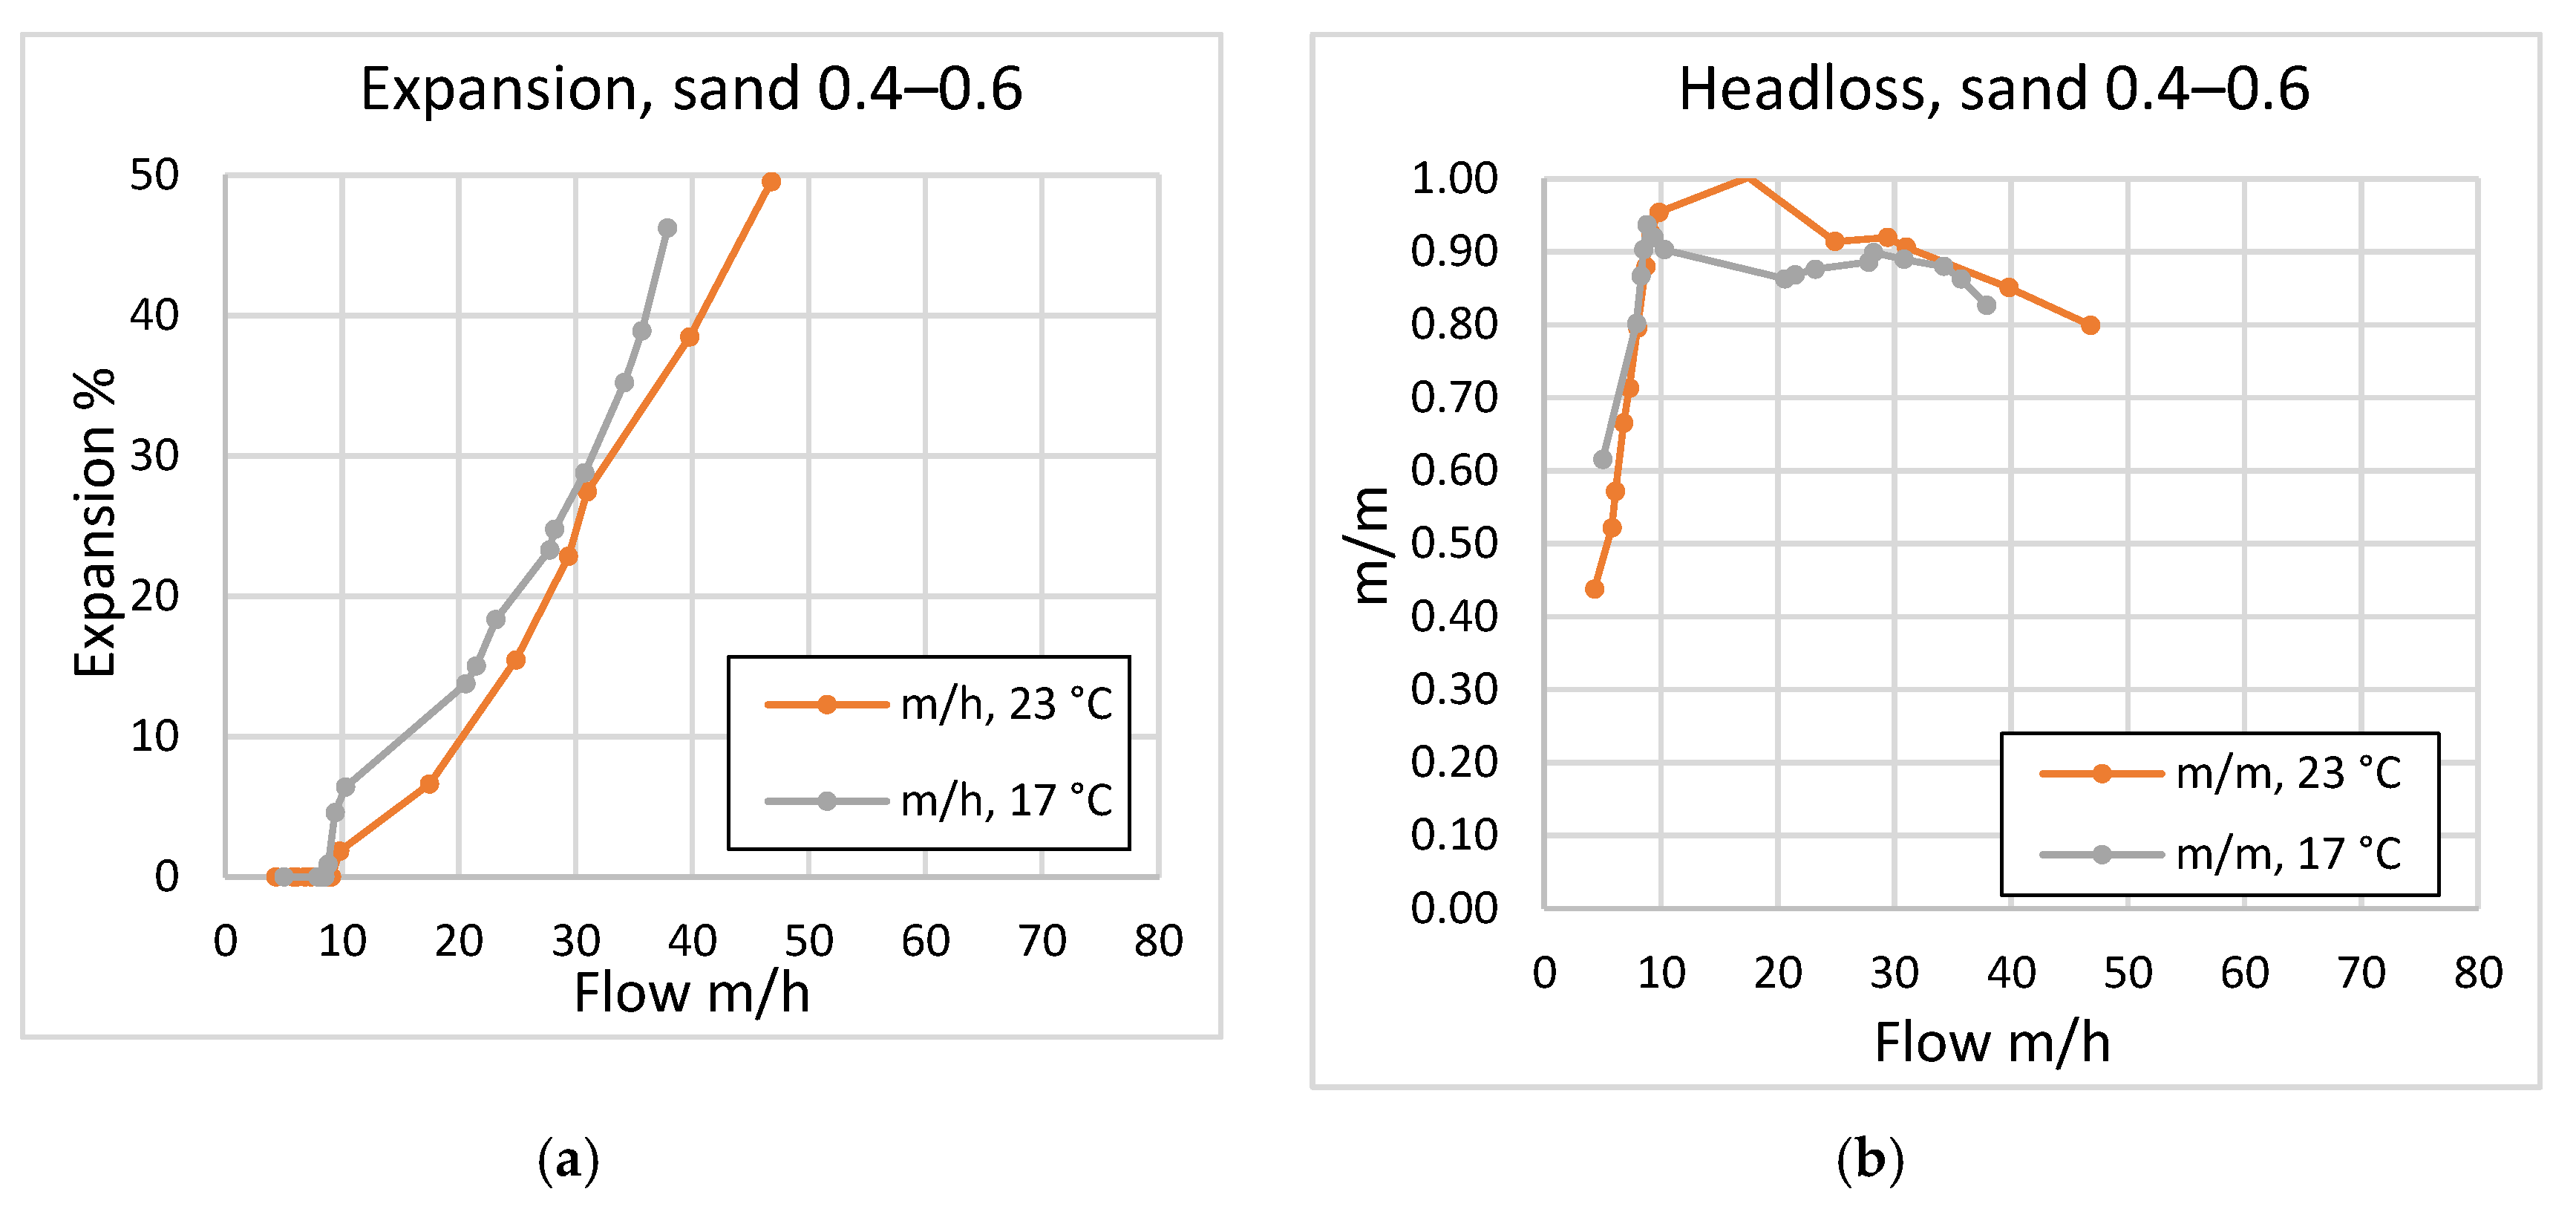
The fine sand 0.4–0.6 had an early expansion at 22 m/h, but at the cost of high headloss (0.94 m/m) due to its narrow grain size distribution. As HC 0.5–1 (1874 kg/m
3) and sand 0.4–0.6 (2698 kg/m
3) both have comparatively early expansion regimes, respectively 14 m/h and 22 m/h. Between the materials, the main difference was the headloss plate, as the sands 0.4–0.6 vs. HC 0.5–1 differed in performance by 0.46 m/m and 0.94 m/m, respectively. Thus, it can be concluded that lower fluidization headlosses can be attributed to particle density as well [
19].
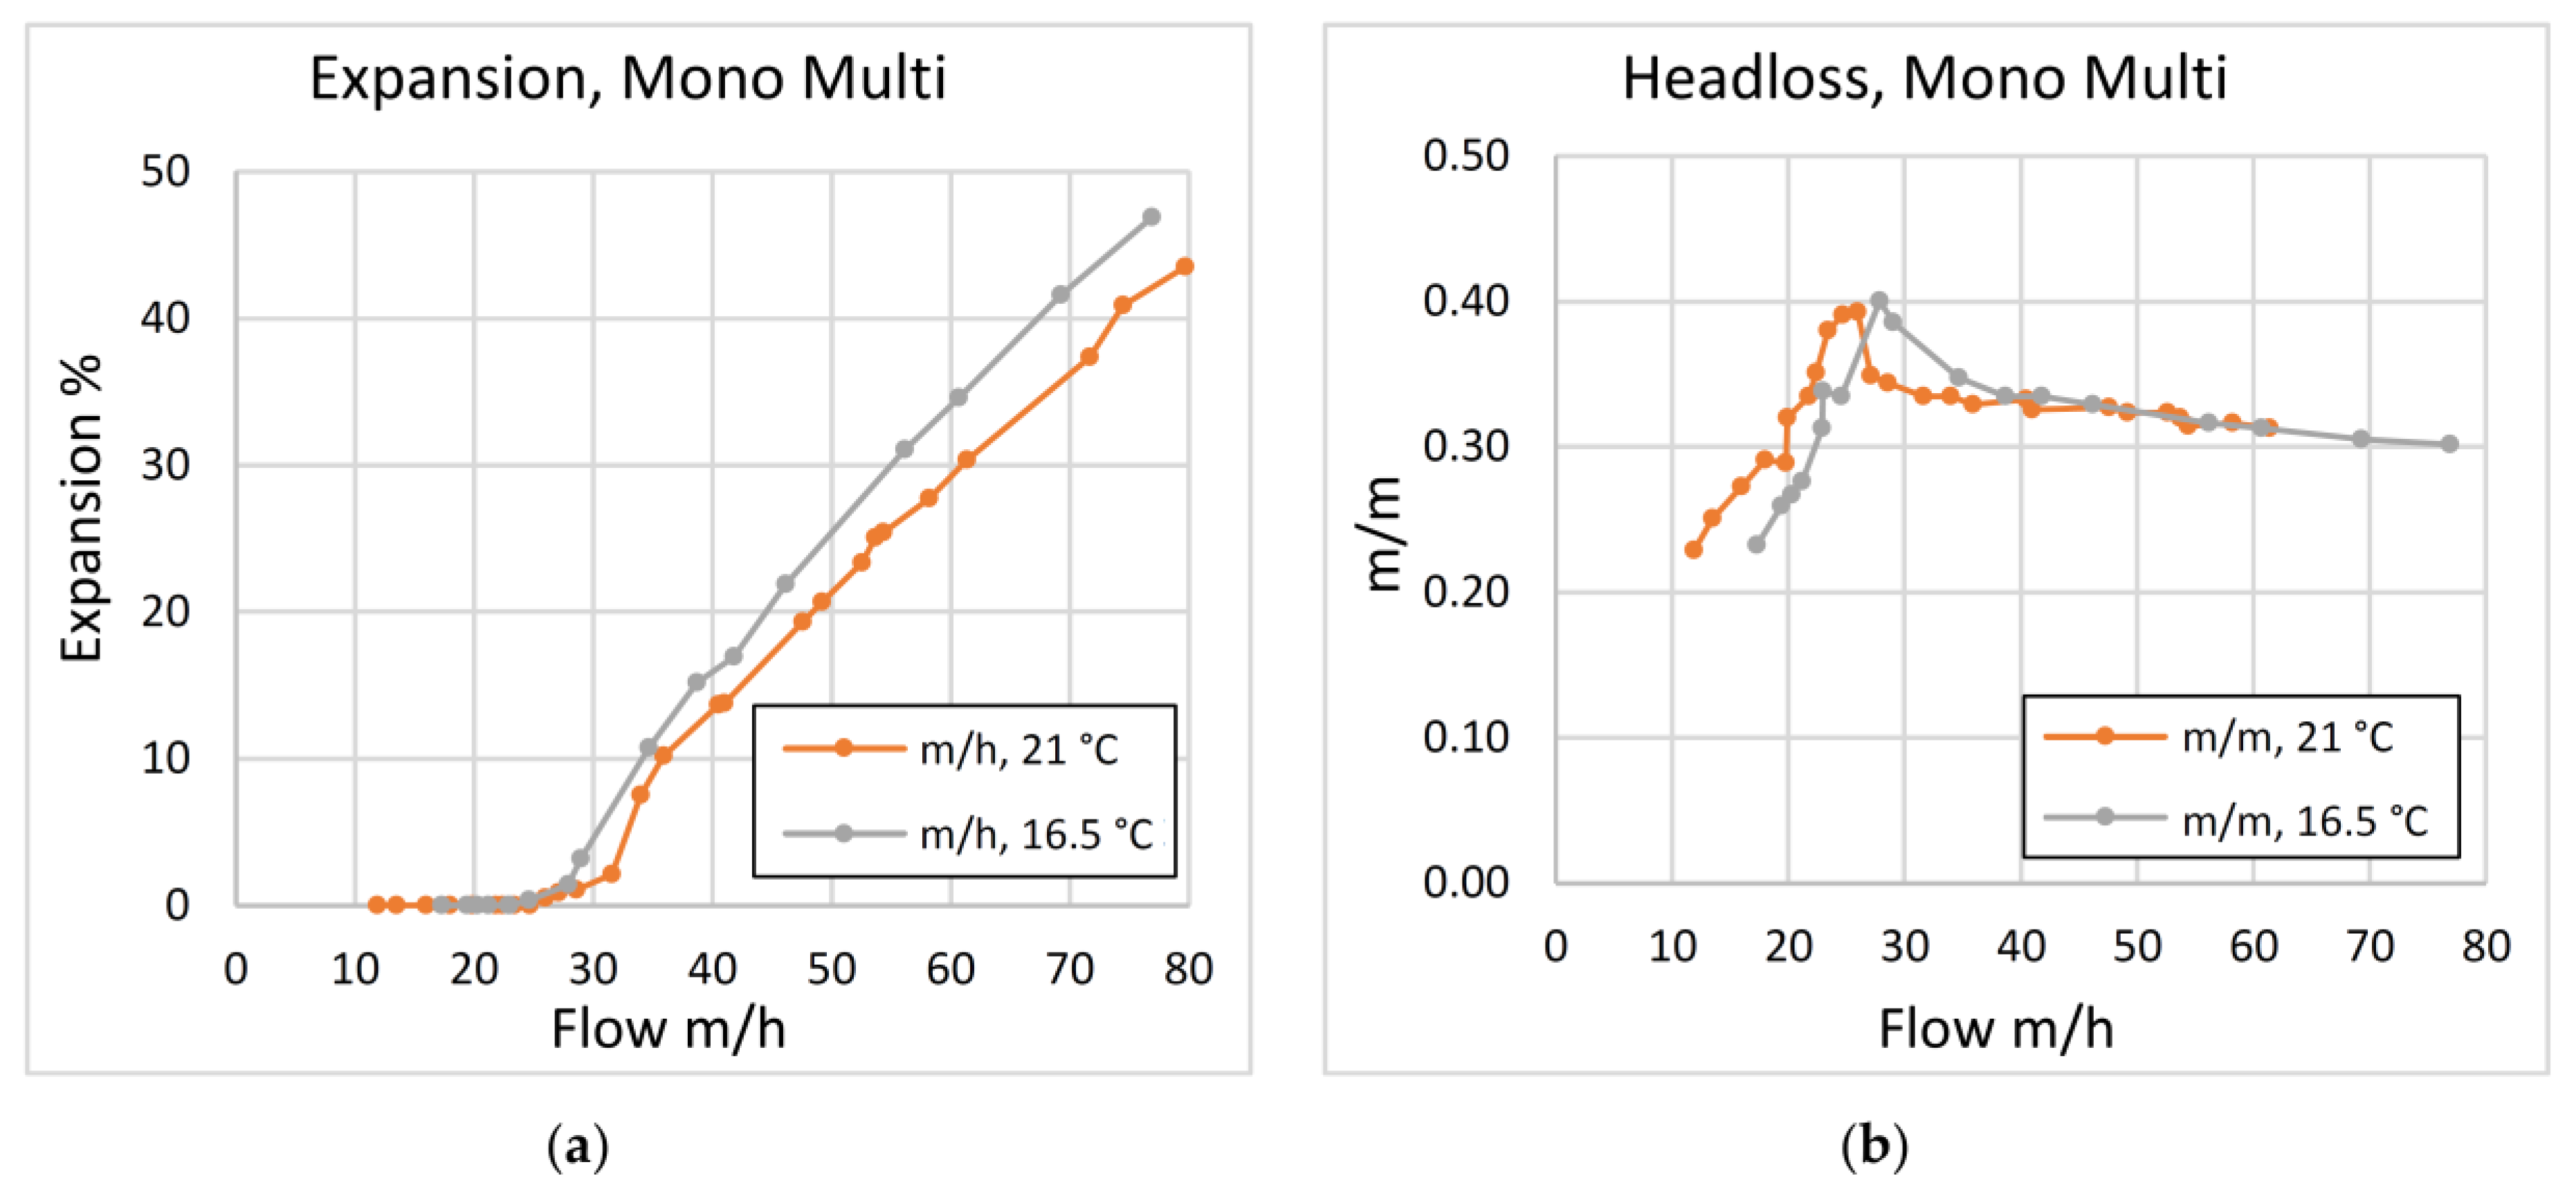
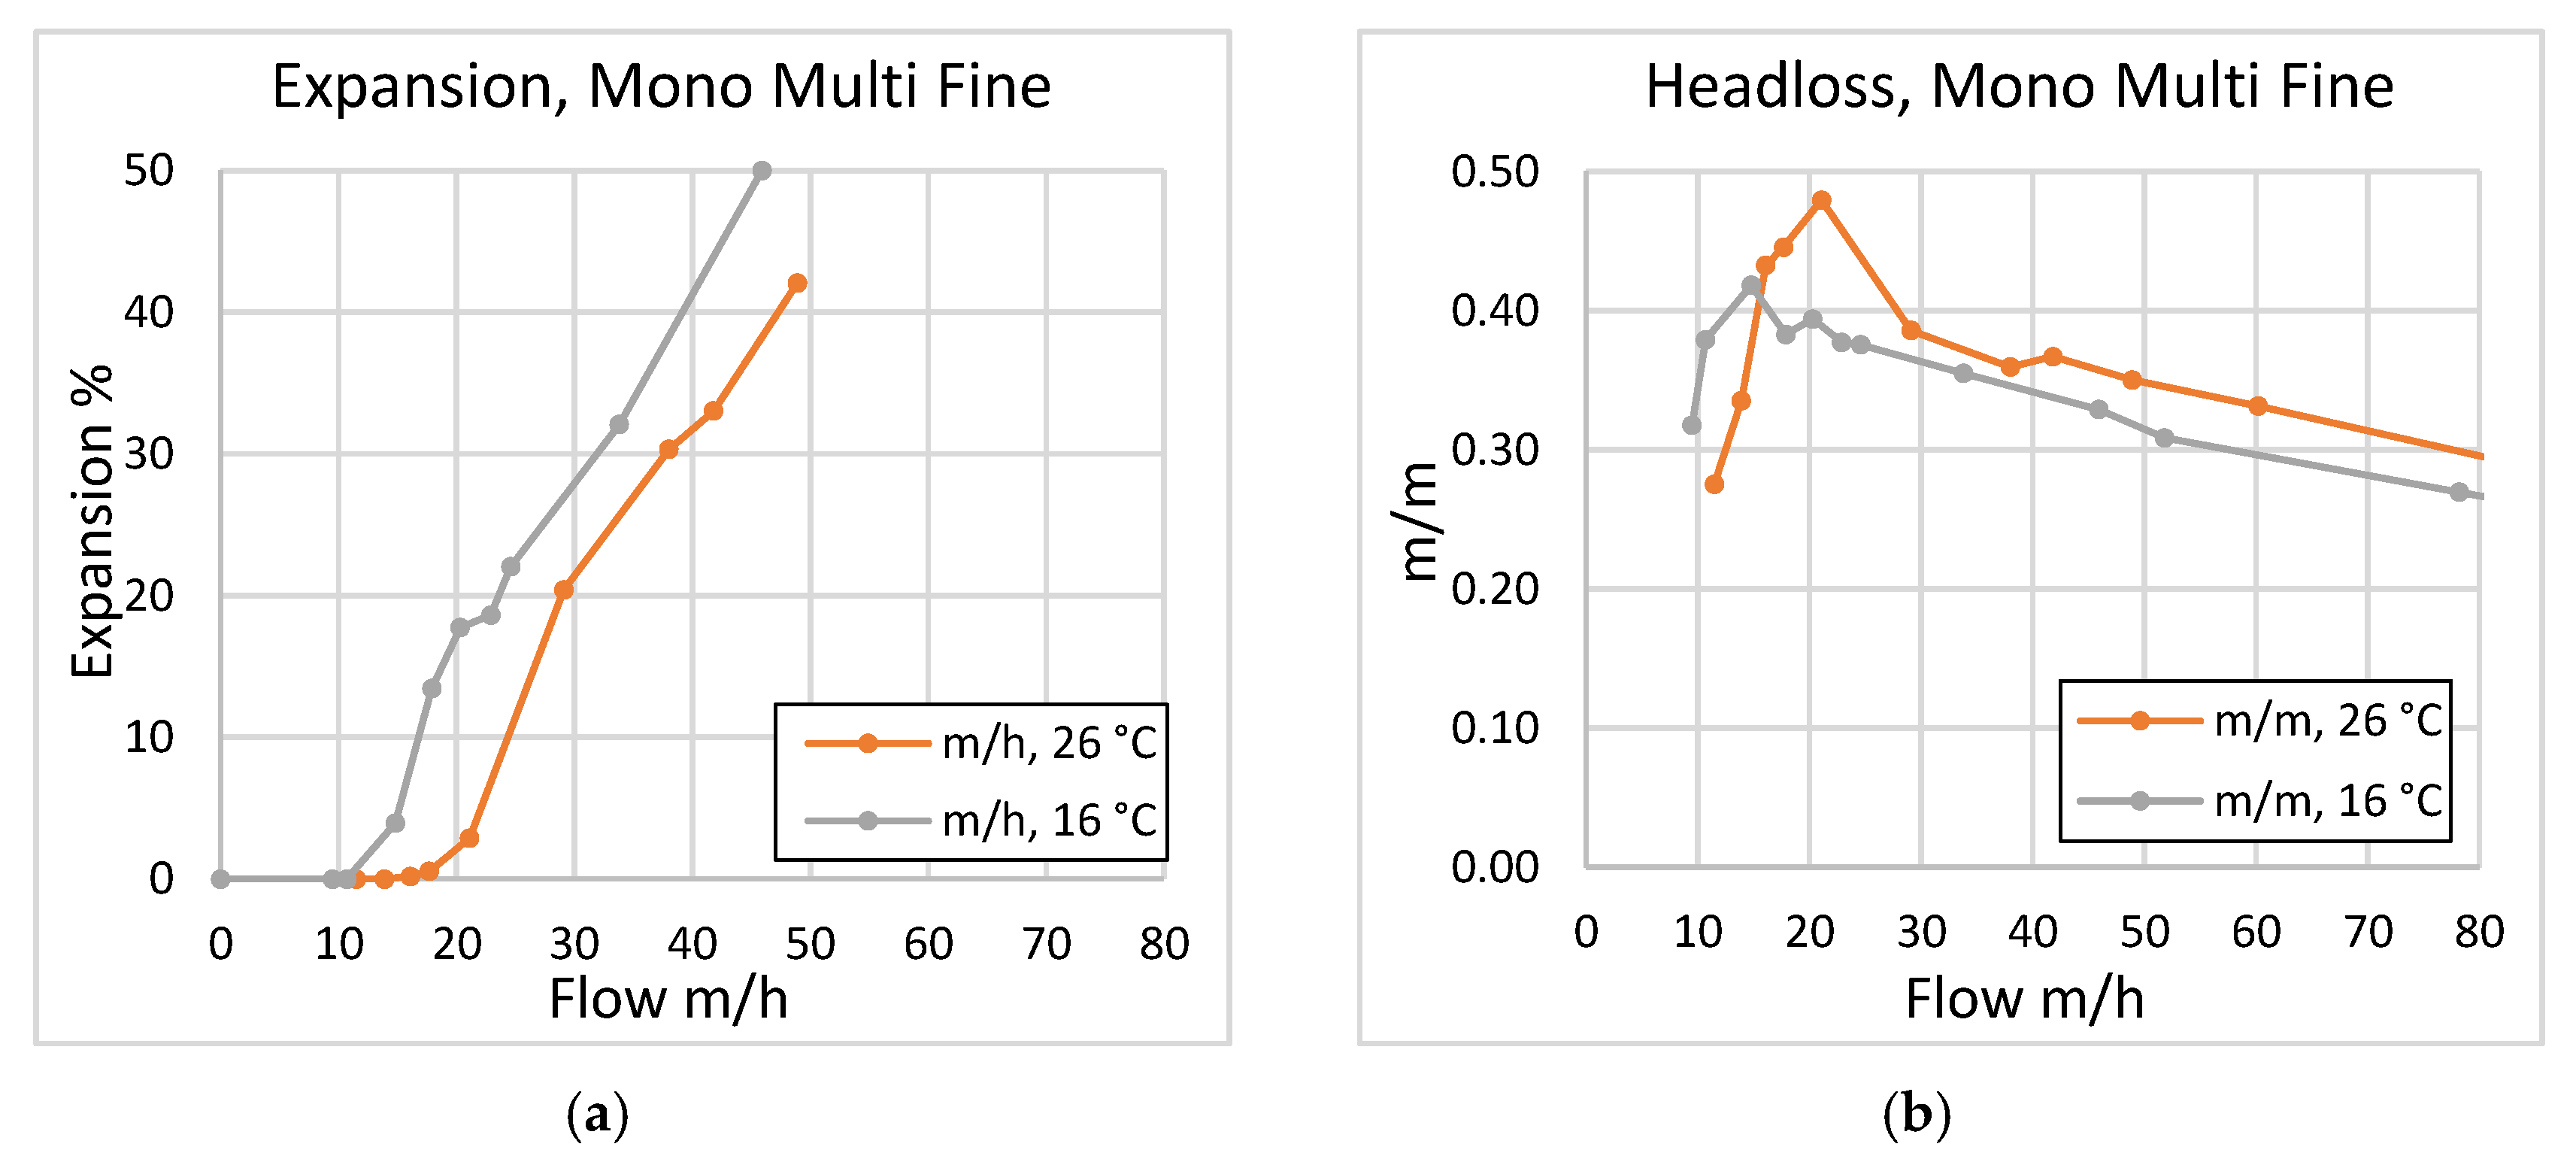
The expansion regimes of the Filtralite dual-layer combinations Mono Multi and Mono Multi Fine performed as expected when intermediately compared with their single-layer components—respectively 38 m/h and 18 m/h—and presumably operated with the added benefit of increased solids capacity [
20].
Author Contributions
Conceptualization, J.R.W. and T.S.; methodology, T.S.; software, J.R.W.; validation, J.R.W.; formal analysis, J.R.W. and T.N.; investigation, J.R.W. and T.N.; resources, J.R.W.; data curation, J.R.W.; writing—original draft preparation, J.R.W.; writing—review and editing, J.R.W.; visualization, J.R.W.; supervision, J.R.W.; project administration, J.R.W.” All authors have read and agree to the published version of the manuscript.
Funding
This research received no external funding.
Conflicts of Interest
The authors declare no conflict of interest.
References
- Filtralite Manufacturer’s Web-Site. Available online: www.filtralite.com (accessed on 31 August 2020).
- Blom, R.; Spjelkavik, A.I.; Kvello, J. SINTEF Materials & Chemistry; BET* Analyses of Various Products and Pre-Products; *(Brunauer–Emmett–Teller); Project no. 102019024; 02.10.2018; SINTEF Materials and Chemistry: Oslo, Norway, 2018. [Google Scholar]
- García-Ruiz, M.; Maza-Márquez, P.; González-Martínez, A.; Campos, E.; González-López, J.; Osorio, F. Performance and bacterial community structure in three autotrophic submerged biofilters operated under different conditions. J. Chem. Technol. Biotechnol. 2018, 93, 2429–2439. [Google Scholar] [CrossRef]
- Saltnes, T. Contact Filtration of Humic Waters in Expanded Clay Aggregate Filters. Ph.D. Thesis, Norwegian University of Science and Technology, Trondheim, Norway, March 2002. [Google Scholar]
- Ødegaard, H.; Østerhus, S.; Melin, E.; Eikebrokk, B. NOM removal technologies-Norwegian experiences. Drink. Water Eng. Sci. 2010, 3, 1–9. [Google Scholar] [CrossRef]
- Sharma, D. Taylor-Edmonds L, Andrews R C; Comparative assessment of ceramic media for drinking water biofiltration. Water Res. 2018, 128, 1–9. [Google Scholar] [CrossRef] [PubMed]
- Davies, D.P. Alternative Filter Media in Rapid Gravity Filtration of Potable Water. Ph.D. Thesis, Institutional Repository, Loughborough University, Loughborough, UK, 2012. [Google Scholar]
- Uhl, W.; Nahrstedt, A. Research Report; Investigation of the Newly Developed Filter Media Filtralite on Its General Filtration Performance in Surface Water Treatment for Drinking Water and with Special Respect to Removal of Microbial Contaminants; University of Duiburg-Essen; Germany; Institute for Energy- and Environmental Process Engineering Water Technology and IWW Rheinisch-Westfälisches Institut für Wasser Mülheim, Ruhr. 30 June 2004. Available online: https://filtralite.com/sites/default/files/pdfs/Investigation_of_filtralite_general_filtration_performance_-_iww_report.pdf (accessed on 17 August 2020).
- Saltnes, T.; Eikebrokk, B.; Ødegaard, H. Contact filtration of humic waters: Performance of an expanded clay aggregate filter (Filtralite) compared to a dual anthracite/sand filter. Water 2002, 2, 17–23. [Google Scholar] [CrossRef]
- SUEZ Handbook of Industrial Water Treatment; Chapter 06 Filtration. Available online: www.suezwatertechnologies.com/handbook/chapter-06-filtration (accessed on 31 August 2020).
- Steele, M.E.; Chipps, M.J.; Bayley, R.; Mikol, A.; Fitzpatrick, C.S.B. Alternative filter media for potable water treatment; Article; Thames Water Research & Development; Department of Civil & Environmental Engineering University College London, 05.01.2016; Research Report. Available online: https://issuu.com/e-weber/docs/alternative_filter_media_for_potabl (accessed on 31 August 2020).
- Eikebrokk, B.; Haaland, S.; Jarvis, P.; Riise, G.; Vogt, R.D.; Zahlsen, K. NOMiNOR: Natural Organic Matter in Drinking Waters within the Nordic Region; Norwegian Water Report 231/2018; Norwegian Water BA: Vangsvegen, Norway, 2018; ISBN 978-82-414-0406-1. [Google Scholar]
- British Water Test Standard. BW:P.18.93 First revision. In Standard for the Specification, Approval and Testing of Granular Filtering Materials; British Water; 1 Queen Anne’s Gate: London, UK, 1996; ISBN 0-9509979-6X. [Google Scholar]
- NF X 45-402:1996-12; Matériax filtrants; E: Granular Filtering Media—Test Methods—Functional Characteristics; AFNOR: Paris, France, 1996; Available online: https://www.boutique.afnor.org/standard/nf-x45-402/granular-filtering-media-test-methods-functional-characteristics/article/780428/fa043059 (accessed on 17 August 2020).
- Cleasby, J.L.; Rice, G.A.; Stangl, E.W.; McKeown, G.H. Development in backwashing of granular filters. J. Environ. Eng. Div. 1975, 101, 713–727. [Google Scholar]
- Fan, K.S. Sphericity and Fluidization of Granular Filter Media. Master’s Thesis, Iowa State University, Ames, IA, USA, 1981. [Google Scholar]
- Kawamura, S. Design and Operation of High-Rate Filters-Part 2. J. Am. Water Works Assoc. 1975, 67, 653–662. [Google Scholar] [CrossRef]
- Debarbadillo, C.; Rogalla, F.; Tarallo, S.; Boltz, J.P. Factors Affecting the Design and Operation of Biologically Active Filters. In Proceedings of the Water Environment Federation, Portland, OR, USA, 15–18 August 2010. [Google Scholar] [CrossRef]
- Mitrouli, S.T.; Karabelas, A.J.; Yiantsiosa, S.G.; Kjølseth, P.A. New granular materials for dual-media filtration of seawater: Pilot testing. Sep. Purif. Technol. 2009, 65, 147–155. [Google Scholar] [CrossRef]
- Dobiáš, P.; Dolejš, P. Filtralite FMMF pilot and full-scale operation experience. In Conference Papers “Pitná Voda 2016”; W&ET Team, Budejovice, C., Eds.; Poloprovozní a provozní zkušenosti s použitím; Filtralite–FMMF: Tábor, Czech Republic, 2016; pp. 81–86. ISBN 978-80-905238-2-12014. [Google Scholar]
Figure 1.
(a) Filtralite Pure HC 0.5–1, (b) Filtralite Pure NC 1.5–2.5, (c) anthracite 0.8–1.6 mm, (d) sand 1.2–2.0 mm “Rådasand”.
Figure 1.
(a) Filtralite Pure HC 0.5–1, (b) Filtralite Pure NC 1.5–2.5, (c) anthracite 0.8–1.6 mm, (d) sand 1.2–2.0 mm “Rådasand”.
Figure 2.
Principal illustration of the filter column and the placement of sensors for measuring the water pressures for the headloss calculations.
Figure 2.
Principal illustration of the filter column and the placement of sensors for measuring the water pressures for the headloss calculations.
Figure 3.
Photos of the filter column: (a) The sensor positions. During the tests, only the second sensor from the bottom and the top sensor were used; (b) Filtralite at about 20% fluidization during backwash.
Figure 3.
Photos of the filter column: (a) The sensor positions. During the tests, only the second sensor from the bottom and the top sensor were used; (b) Filtralite at about 20% fluidization during backwash.
Figure 4.
Illustration showing the expected theoretical expansion and headloss behavior for increasing water flow. The evolution of headloss is dependent on the point of minimum water fluidization rate and expansion.
Figure 4.
Illustration showing the expected theoretical expansion and headloss behavior for increasing water flow. The evolution of headloss is dependent on the point of minimum water fluidization rate and expansion.
Figure 5.
(a) Expansion vs. water flow rate for Filtralite HC 0.5–1; (b) headloss vs. water flow rate.
Figure 5.
(a) Expansion vs. water flow rate for Filtralite HC 0.5–1; (b) headloss vs. water flow rate.
Figure 6.
(a) Expansion vs. water flow rate for Filtralite HC 0.8–1.6; (b) headloss vs. water flow rate.
Figure 6.
(a) Expansion vs. water flow rate for Filtralite HC 0.8–1.6; (b) headloss vs. water flow rate.
Figure 7.
(a) Expansion vs. water flow rate for Filtralite NC 0.8–1.6; (b) headloss vs. water flow rate.
Figure 7.
(a) Expansion vs. water flow rate for Filtralite NC 0.8–1.6; (b) headloss vs. water flow rate.
Figure 8.
(a) Expansion vs. water flow rate for Filtralite NC 1.5–2.5; (b) headloss vs. water flow rate.
Figure 8.
(a) Expansion vs. water flow rate for Filtralite NC 1.5–2.5; (b) headloss vs. water flow rate.
Figure 9.
(a) Expansion vs. water flow rate for Filtralite Mono Multi; 50% NC 1.5–2.5 and 50% HC 0.8–1.6; (b) headloss vs. water flow rate.
Figure 9.
(a) Expansion vs. water flow rate for Filtralite Mono Multi; 50% NC 1.5–2.5 and 50% HC 0.8–1.6; (b) headloss vs. water flow rate.
Figure 10.
(a) Expansion vs. water flow rate for Filtralite Mono Multi Fine; 50% NC 0.8–1.6 and 50% HC 0.5–1; (b) headloss vs. water flow rate.
Figure 10.
(a) Expansion vs. water flow rate for Filtralite Mono Multi Fine; 50% NC 0.8–1.6 and 50% HC 0.5–1; (b) headloss vs. water flow rate.
Figure 11.
(a) Expansion vs. water flow rate for 0.4–0.6 mm filter-sand (Rådasand); (b) headloss vs. water flow rate.
Figure 11.
(a) Expansion vs. water flow rate for 0.4–0.6 mm filter-sand (Rådasand); (b) headloss vs. water flow rate.
Figure 12.
(a) Expansion vs. water flow rate for 1.2–2.0 mm filter-sand (Rådasand); (b) headloss vs. water flow rate.
Figure 12.
(a) Expansion vs. water flow rate for 1.2–2.0 mm filter-sand (Rådasand); (b) headloss vs. water flow rate.
Figure 13.
(a) Expansion vs. water flow rate for anthracite 0.8–1.6 mm; (b) headloss vs. water flow rate.
Figure 13.
(a) Expansion vs. water flow rate for anthracite 0.8–1.6 mm; (b) headloss vs. water flow rate.
Table 1.
The filter materials, their size ranges and density.
Table 1.
The filter materials, their size ranges and density.
| Filter Product | Fraction 1 (mm) | Particle Density 2 (kg/m3) | Bulk Density 2, (kg/m3) Compressed |
|---|
| Filtralite Pure HC 0.5–1 | 0.4–1.0 | 1874 | 779 |
| Filtralite Pure HC 0.8–1.6 | 0.8–1.6 | 1742 | 712 |
| Filtralite Pure NC 0.8–1.6 | 0.8–1.6 | 1250 | 422 |
| Filtralite Pure NC 1.5–2.5 | 1.5–2.5 | 1042 | 424 |
Filtralite Pure
Mono Multi | 50% NC 1.5–2.5
50% HC 0.8–1.6 | n/a | n/a |
Filtralite Pure
Mono Multi Fine | 50% NC 0.8–1.6
50% HC 0.5–1 | n/a | n/a |
| Filter-sand 1 | 0.4–0.6 | 2698 | 1554 |
| Filter-sand 2 | 1.2–2.0 | 2656 | 1508 |
| Anthracite | 0.8–1.6 3 | 1355 | 698 |
Table 2.
Sizes and densities compared with constant 15% expansion flow rate.
Table 2.
Sizes and densities compared with constant 15% expansion flow rate.
| Filter-Product | Particle Density (kg/m3) | Effective Size, D10 | 15% Expansion Flow Rate (m/h), 13–17 °C | 15% Expansion Flow Rate (m/h), 21–26 °C |
|---|
| HC 0.5–1 | 1874 | 0.5 1 | 14 | 20 |
| HC 0.8–1.6 | 1742 | 0.9 1 | 34 | 41 |
| NC 0.8–1.6 | 1250 | 0.8 1 | 22 | 25 |
| NC 1.5–2.5 | 1042 | 1.4 1 | 38 | 42 |
| Mono Multi | n/a | n/a | 38 | 43 |
| Mono Multi Fine | n/a | n/a | 18 | 27 |
| Filter-sand 0.4–0.6 | 2698 | 0.3 | 22 | 24 |
| Filter-sand 1.2–2.0 | 2656 | 1.2 | 67 | 73 |
| Anthracite 0.8–1.6 | 1355 | 0.8 2 | 15 | 17 |
Table 3.
Size ranges and densities compared with filter headloss peaks.
Table 3.
Size ranges and densities compared with filter headloss peaks.
| Filter-Product | Particle Density (kg/m3) | Effective Size, D10 | Headloss (m/m) at Fluidization Peak, 13–17 °C | Headloss (m/m) at Fluidization Peak, 21–26 °C |
|---|
| HC 0.5–1 | 1874 | 0.5 1 | 0.46 | 0.44 |
| HC 0.8–1.6 | 1742 | 0.9 1 | 0.49 | 0.46 |
| NC 0.8–1.6 | 1250 | 0.8 1 | 0.24 | 0.26 |
| NC 1.5–2.5 | 1042 | 1.4 1 | 0.25 | 0.30 |
| Mono Multi | n/a | n/a | 0.40 | 0.39 |
| Mono Multi Fine | n/a | n/a | 0.42 | 0.48 |
| Filter-sand 0.4–0.6 | 2698 | 0.3 | 0.94 | 1.00 |
| Filter-sand 1.2–2.0 | 2656 | 1.2 | 0.98 | 0.95 |
| Anthracite 0.8–1.6 | 1355 | 0.8 2 | 0.21 | 0.21 |
Table 4.
Summary of biologically active filter (BAF) backwashing requirements.
Table 4.
Summary of biologically active filter (BAF) backwashing requirements.
| | Backwash Rate (m/h) | Air Scour Rate (m/h) | Total Duration (min) |
|---|
| Upflow, sunken media | | | |
| Normal BW | 20 | 97 | 50 |
| Energetic BW | 30 | 97 | 25 |
| Downflow, sunken media | 15 | 90 | 20–50 |
© 2020 by the authors. Licensee MDPI, Basel, Switzerland. This article is an open access article distributed under the terms and conditions of the Creative Commons Attribution (CC BY) license (http://creativecommons.org/licenses/by/4.0/).


