Article

Water Footprint Management for Sustainable Growth in the Bangladesh Apparel Sector

Environmental Sustainability in Textile Industries (ESTex), Department of Chemical Engineering, Bangladesh University of Engineering & Technology (BUET), Dhaka 1000, Bangladesh
*
Author to whom correspondence should be addressed.
Water 2020, 12(10), 2760; https://doi.org/10.3390/w12102760
Submission received: 4 September 2020 / Revised: 28 September 2020 / Accepted: 30 September 2020 / Published: 4 October 2020

Abstract

:
Bangladesh is one of the fastest growing economies in the world, primarily driven by its textile industries. A high amount of water is consumed and polluted in the production and processing of raw material to the final product in the textile industry. Therefore, water footprint assessment is important for textile products. In this study, the water footprint of cotton cultivation, transportation and textile industry was calculated by analyzing the amount of imported cotton, production and processing capacity of cotton yarn and cotton fabrics, wastewater volume, number of workers and pollution load database, for 2012–2016. For the textile industry, the annual water footprint was found to be 1.8 billion m3. This high amount of water footprint and water pollution may result in depletion of groundwater level and can lead to major health problems for the local people, respectively. Total water footprint for ready-made garment product is found to be 27.56 billion m3, whereas considering proper water treatment and water reuse facilities can reduce the grey water footprint to around 1.26 billion m3. This study shows the extent of water pollution, groundwater depletion and economic impact of groundwater extraction, and possible means to reduce water footprint in cotton cultivation and textile industries.

1. Introduction

The ready-made garment (RMG) industry has become the backbone of the Bangladesh economy, being the second largest exporter of clothing after China [1]. The export from the ready-made garment (RMG) sector has reached 32 billion USD in the last fiscal year [2]. Besides contributing significantly to the GDP (gross domestic product), this sector creates about 4.2 million employment opportunities [3]. The growth in this sector undoubtedly has a positive effect on national economic development, but there are also negative implications. The textile industry uses massive amounts of water in the production of goods. Untreated effluent generated by Bangladesh textile industries is one of the major sources of water pollution [4]. In Bangladesh, textile dyeing is categorized as a red category industry under the Environmental Conservation Act (1995) [5]. Textile wastewater contains various chemicals such as oil, grease, caustic, glauber salt, ammonia, sulfide, lead, heavy metals and other toxic substances [6,7]. Typical characteristics of textile industry wastewater generally include a wide range of pH, biochemical oxygen demand (BOD), chemical oxygen demand (COD), total dissolved solids (TDS), heavy metals and strong color [8,9,10,11]. The high volume of textile wastewater may cause alteration of the physical, chemical and biological properties of aquatic environment, and could be harmful to public health and livestock [6,12]. It is reported that in most of the cases, industrial effluents are discharged to nearby river or wetlands without proper treatment [13].
As a water intensive sector, the growth and the sustainability of the RMG sector is highly dependent on how it manages its water risks. Textile industry in general has an enormous water footprint in terms of agricultural water consumption for cotton farming, high water use in textile manufacturing and water pollution [14]. In the textile industry, inlet water mainly comes from groundwater extraction and no water is recycled back to the process, which causes groundwater depletion in the industrial regions. The underground water levels around the city center are dropping at an alarming two to three meters per year due to excessive and indiscriminate withdrawal of groundwater in Dhaka city [15,16]. In addition, high volume untreated textile effluents cause high gray water footprint and increase water stress, which may instigate a quick change of ecosystem and climate change [17]. Thus, it is required to quantify the amount of water consumption and pollution for the growing textile industry in Bangladesh. Calculating the water footprint of textile production is an effective tool to calculate the water consumption and pollution.
Water footprint (WF) is a measure of the use of freshwater for productive activities both in terms of the amount of water consumed (green and blue WF) or polluted (grey WF) was first introduced in 2002 [18,19]. Green water footprint is the volume of rainwater that is stored in the root zone of the soil and evaporated, transpired or incorporated by plants. Blue water footprint is the volume of surface and groundwater required (evaporated or used directly) for the production of a good or service [20,21]. Grey water footprint indicates the water volume needed to assimilate a pollutant load to meet specific water quality standards that reaches a water body [22].
Measuring water footprint and taking all the necessary steps to keep the water footprint level as low as possible is very important for mankind because freshwater is vital to our daily life, but the supply of freshwater is limited [23]. To assess water consumption and pollution for textile cotton products, the water footprint for every stage (from raw material to final product) was calculated in this study. Cotton production was chosen because around 80% of garments made in Bangladesh are sourced from cotton [24]. Uncertainties associated with technological and environmental change (drought) were not considered in this study. Energy consumption in textile processing was also not considered in WF calculation. The effect of current and future pollution load (Biological Oxygen Demand: BOD, Chemical Oxygen Demand: COD, Total Suspended Solid: Total Dissolved Solid: TDS) of textile industries on the environment and human life has been studied in our previously published article [25]. Effect of conventional practice and improved practice (adoption of improved technologies and cleaner production) has been quantified and it was found that the amount of effluent water and pollution load decreased around 22.6% if improved practice is followed [25]. The main objectives of this study are to provide an analysis on the impact of the growth in RMG and textile sector on water security in Bangladesh, calculate water footprint for cotton cultivation for RMG products, calculate water footprint for transportation, calculate water footprint for textile industry for cotton product, calculate productwise water footprint for RMG cotton product and identify opportunities to reduce water use while achieving the aspirations of growth from the industries. Water footprint for cotton cultivation, transportation, spinning, yarn dyeing, fabric manufacturing, fabric washing, dyeing, finishing, and water footprint in RMG sector are calculated. Water footprint for cotton cultivation is calculated by studying and analyzing 101 regions of 11 countries. For the textile industry, water footprint is calculated by analyzing annual production rate, processing capacity, number of workers involved, water consumption and pollution load for different products. Furthermore, effects of adapting new technologies (e.g., zero liquid discharge options) to reduce water footprint are assessed. Overall, this study helps policy makers and industry management to take necessary steps towards sustainable water management.

2. Materials and Method

2.1. Imported Cotton, Cotton Yarn and Cotton Fabric

From cotton field to final RMG products, there are various stages with different impact on water resources. Bangladesh imports a large amount of cotton for its textile and RMG sector. Cotton yarn and cotton fabrics are also imported to meet the demand of this sector. Percentage and amount of imported cotton, cotton yarn and cotton fabric from different countries collected from the Bangladesh Cotton Association (BCA), USDA gain report and Bangladesh Bank Annual Import Payment Report (2012–2013 to 2015–2016) are presented in Appendix A. It was considered that Bangladesh imports cotton yarn at 3300 USD/ton and cotton woven fabric at 8570 USD/ton [26,27]. Seed cotton yield for the countries from which Bangladesh import cotton, cotton yarn and cotton fabric are also given in Appendix A.

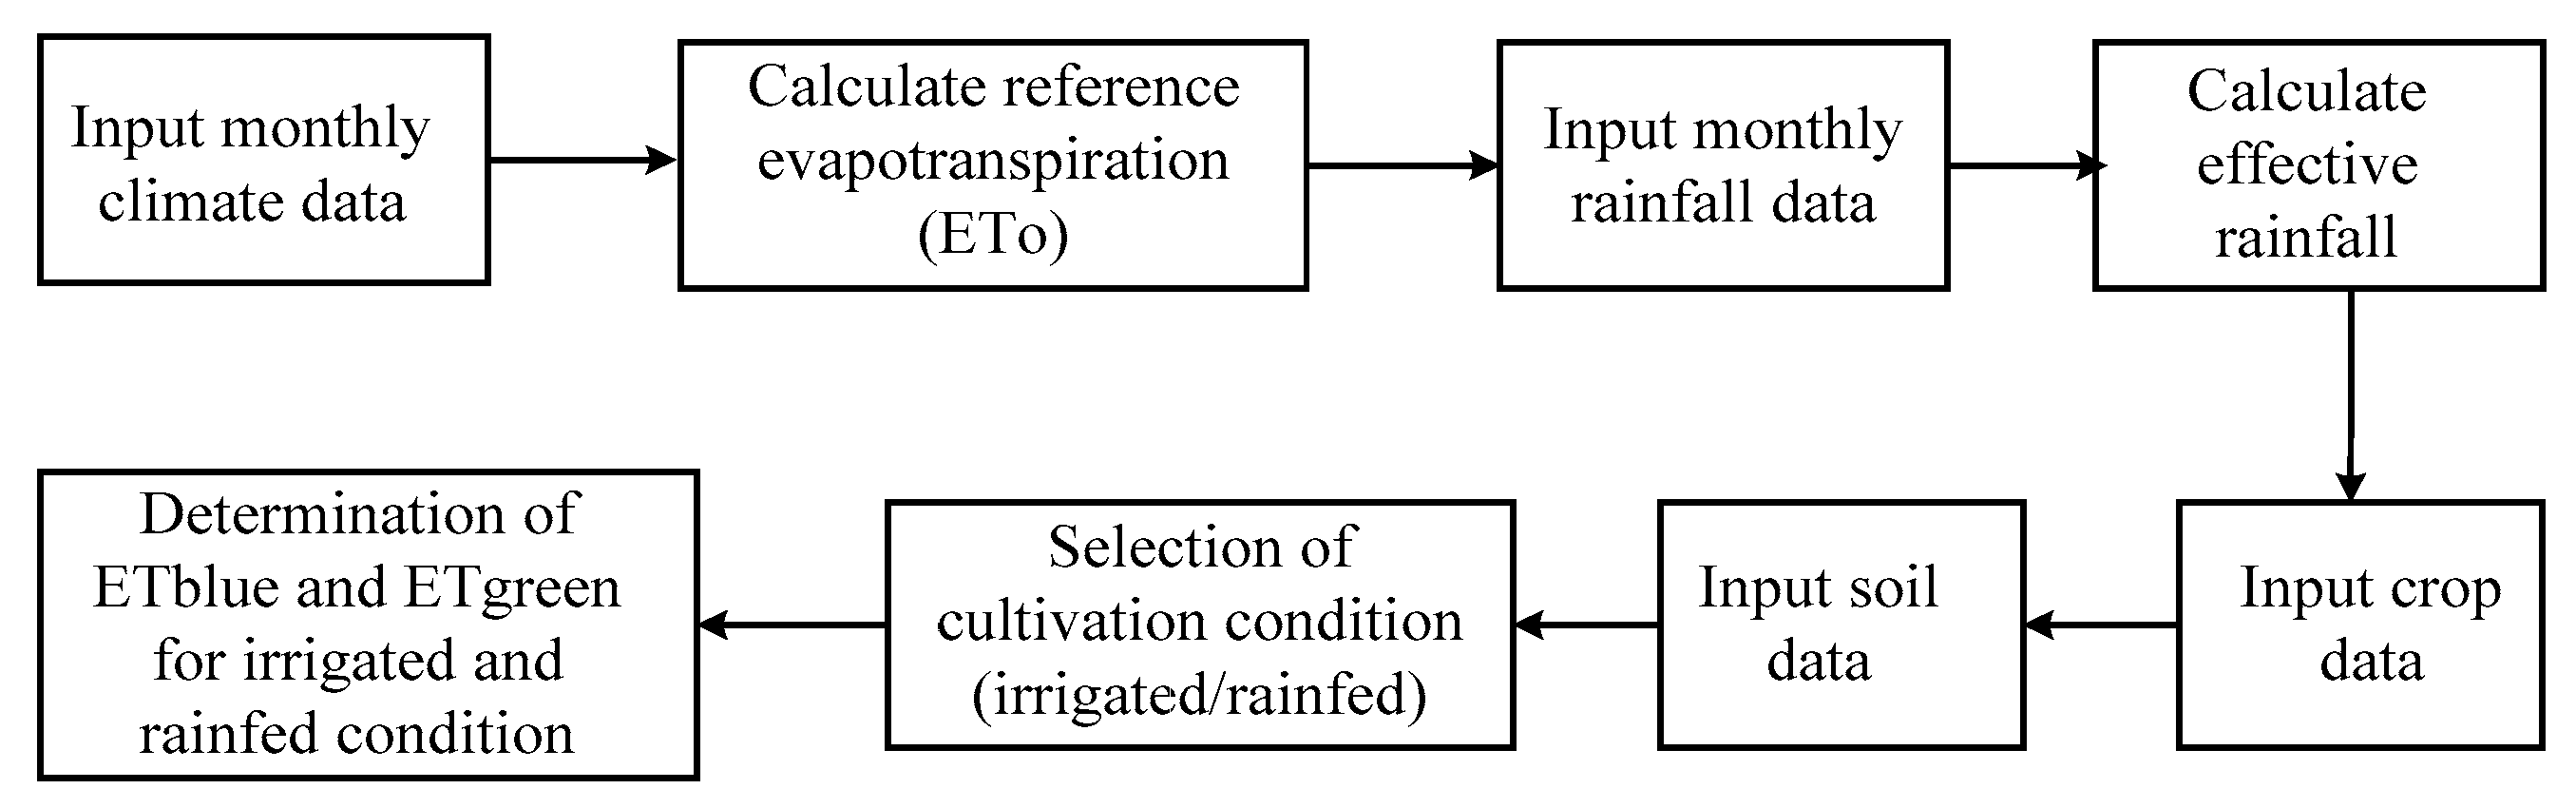
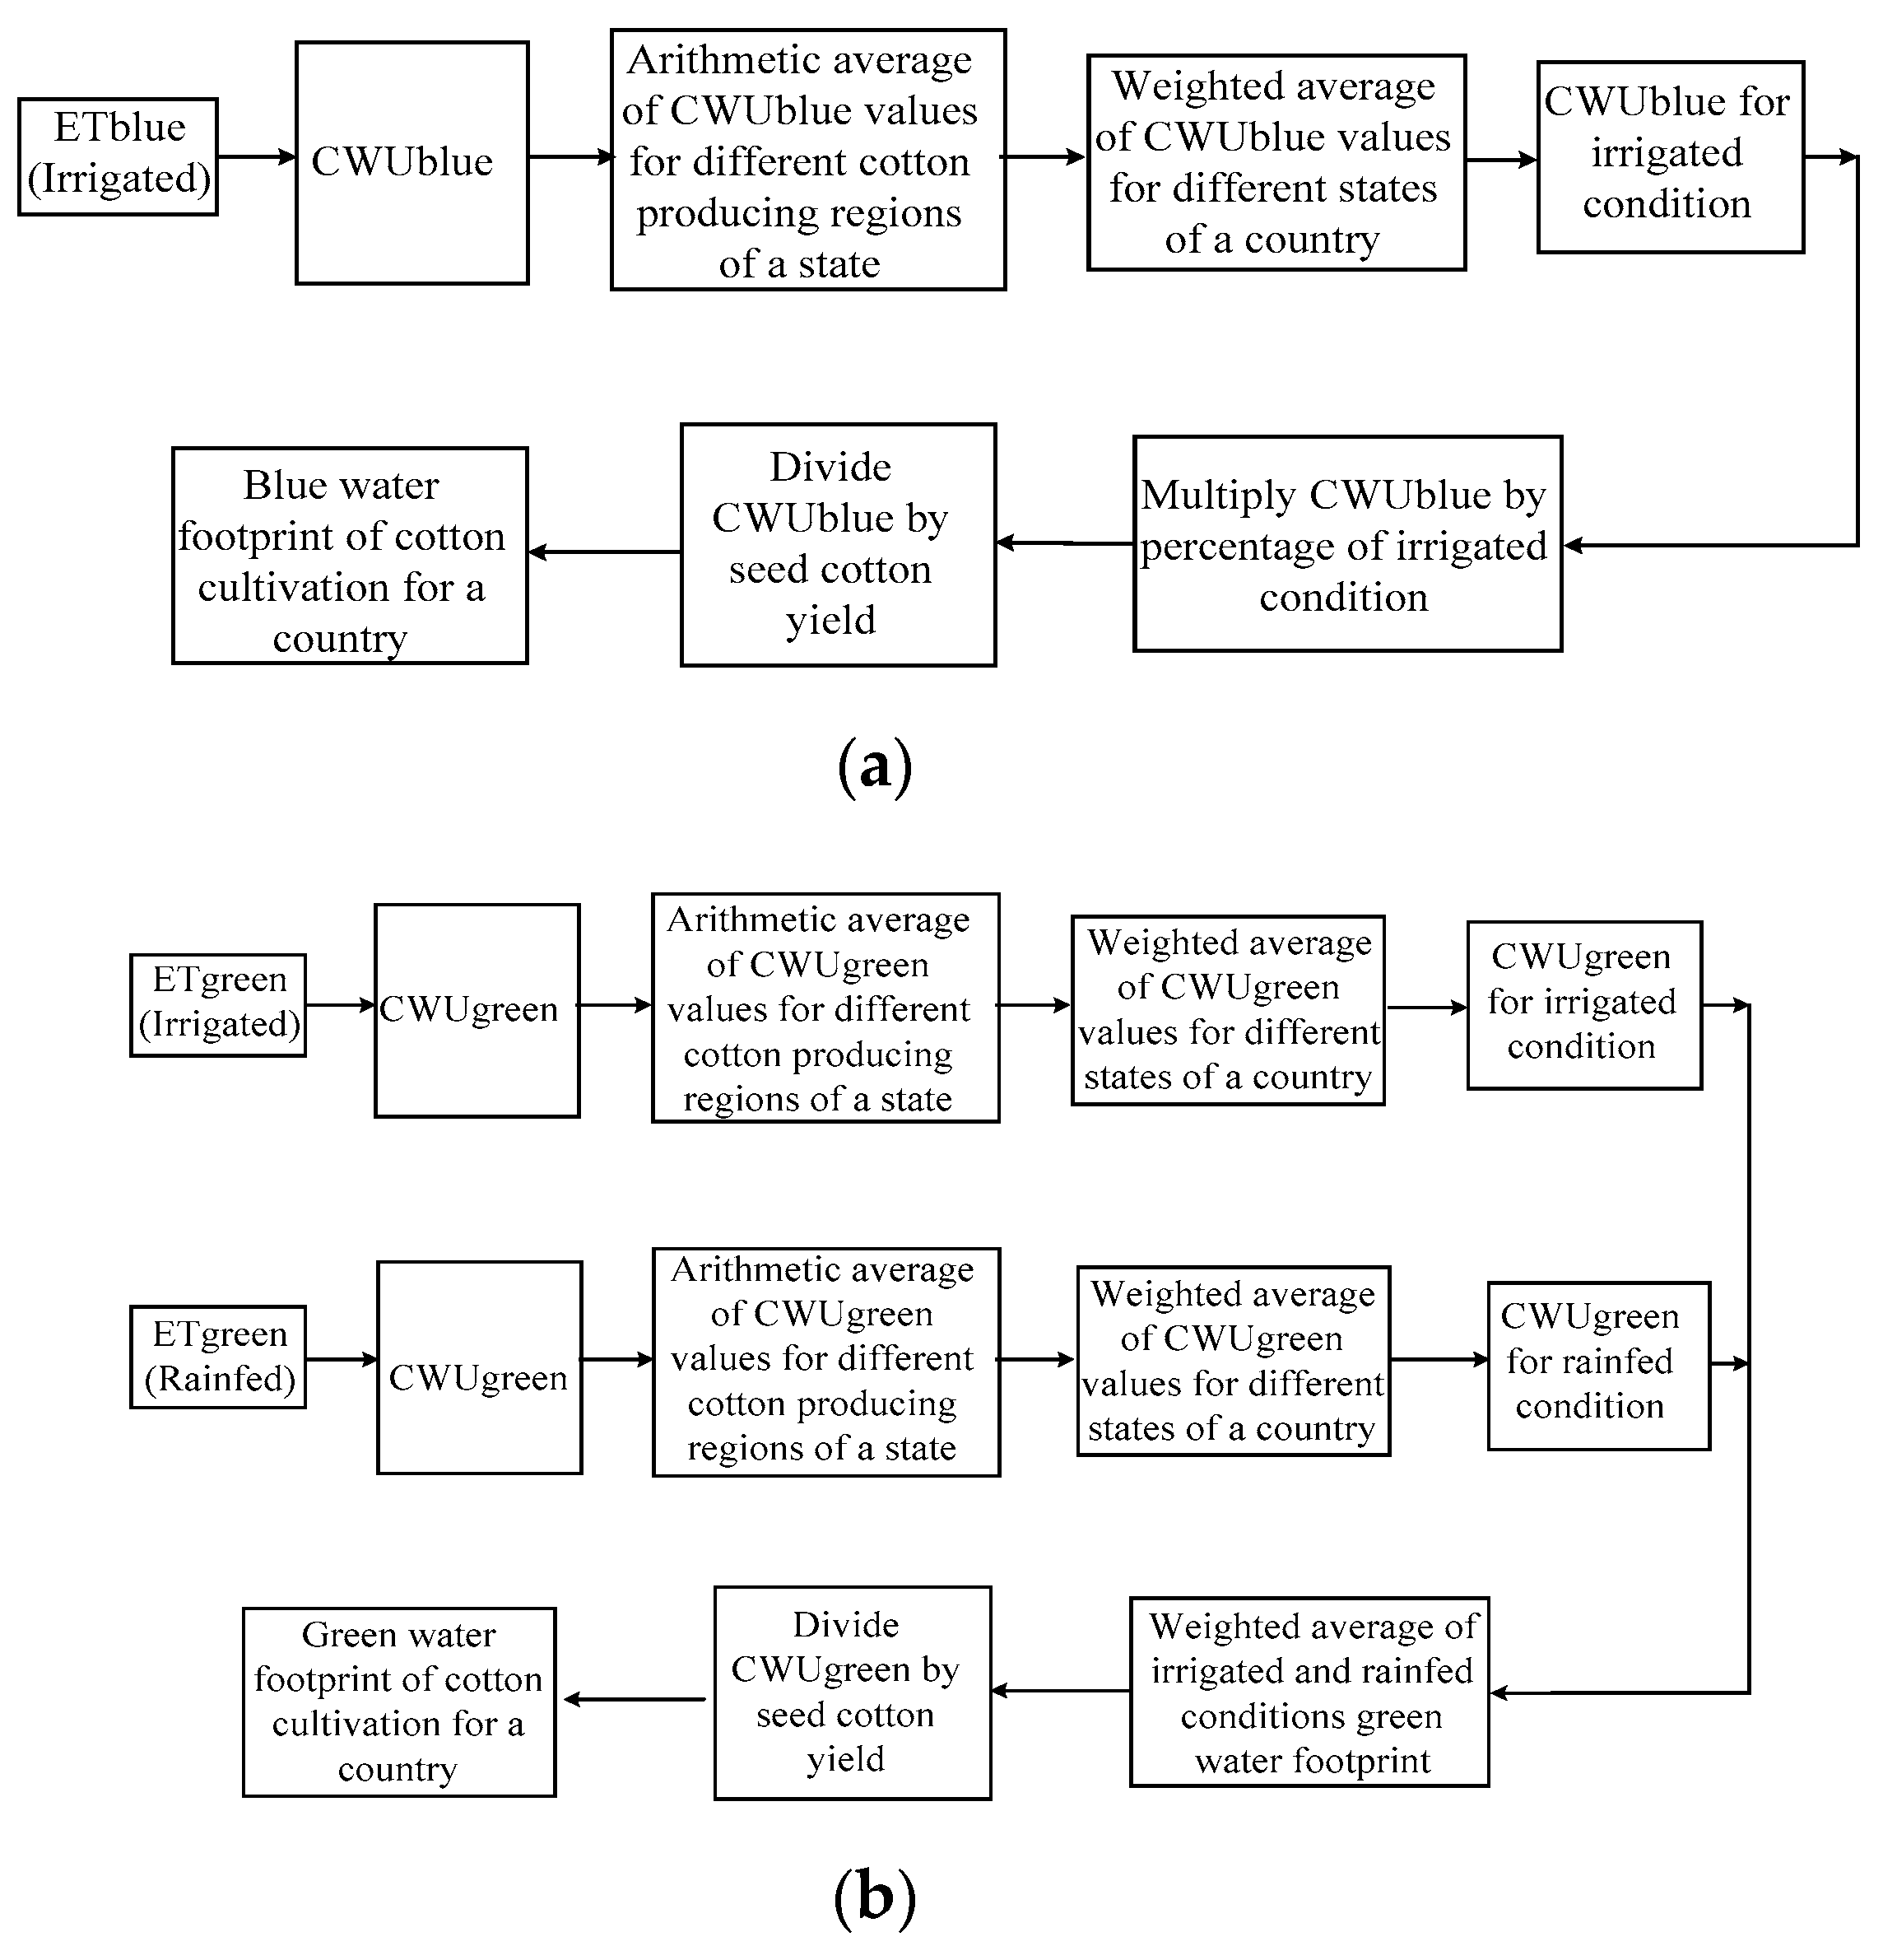
2.2. Water Footprint of Cotton Cultivation

During cotton cultivation, three types of water usage are recognized [28]: (i) green water—consumptive use of rainwater stored in soils as soil moisture, (ii) blue water—consumptive use of water withdrawn from the groundwater or surface water and (iii) grey water—pollution of water.
The CROPWAT 8.0 model, a computer model developed by the Food and Agriculture Organization of the United Nations [29] for the calculation of crop water and irrigation requirements based on soil, climate and crop data, was used to estimate blue and green water footprint. Figure 1 represents the calculation procedure of crop water evapotranspiration from which blue and green water footprint were calculated. Figure 2 represents the blue and green water calculation steps from crop water evapotranspiration (mm) and crop water use (CWU in m3/ha). Detailed calculation procedure is given in Appendix B. The crop and soil data, which are required in the CROPWAT model, are given in Appendix C.
The formula to calculate grey water footprint is shown in Equation (1) [32]. In this study, the grey water footprint related to nitrogen use only was quantified. The effect of the use of nutrients, pesticides and herbicides to the environment was not analyzed. The quantity of nitrogen that reaches free flowing water bodies was assumed to be 10 percent of the applied fertilization rate (in kg/ha/year) [33]. The fertilizer application rate in different countries is given in Appendix D. The total volume of water required per ton of nitrogen is calculated considering the volume of nitrogen that leaches or runs off and the maximum allowable concentration in the free-flowing surface water bodies. As ambient water quality standard for nitrogen, 10 mg/L (measured as N: nitrogen) was used for this study [22]. The natural concentration in the receiving water body was assumed to be 0.4 mg/L [34,35].
Grey   water   footprint ,   WFgrey = L C max C nat = α × Appl C max C nat
where
  • α = the leaching–runoff fraction, defined as the fraction of applied chemicals reaching freshwater bodies,
  • Appl = application rate of chemicals on or into the soil (in mass/time),
  • cmax = the maximum acceptable concentration for a pollutant and
  • cnat = natural concentration for a pollutant in the receiving water body.

2.3. Water Footprint of Textile Industry

A major part of the internal water footprint of RMG products comes from the textile industry. A lot of water is consumed in yarn dyeing, fabric manufacturing, dyeing and finishing. During textile operation, two types of water usage are distinguished: (i) blue water—consumptive use of water withdrawn from the groundwater or surface water and (ii) grey water—pollution of water.

2.3.1. Raw Material for Textile Industry

It was assumed that 100 kg cotton lint produces 95 kg cotton yarn and 100 kg cotton yarn produces 95 kg fabric [36]. Around 95% of imported and domestically produced cotton is used in the textile industry to meet the national and international demand of textile products; the remaining 5% is used by handloom, medical and other sectors [37]. It was considered that 100% of imported cotton yarn and woven fabrics of cotton is used by the textile industry. The local spinning sector can meet up 90% demand of knit wear garment industries and around 40% demand of woven industries [38]. Around 80 percent of garments made in Bangladesh are sourced from cotton [24]. The percentage of imported and domestically produced raw cotton, imported cotton yarn and imported cotton woven fabric employed in knit and woven fabric manufacturing is shown in Appendix E, which was calculated considering a knit product export price of 4 USD/piece (per piece weight: 250 g) and a woven product export price of 5 USD/piece (per piece weight: 400 g) (collected from local industries).

2.3.2. Water Footprint Calculation for Textile Industry

Mass ratio of dyed and undyed cotton fabric was considered as 4:1. Effluent water from yarn dyeing is calculated by multiplying the total yarn dyed in a year by water key performance indication (KPI). Effluent water from fabric dyeing is calculated as the same procedure as yarn dyeing effluent water. It is considered that water KPI for yarn dyeing, knit fabric dyeing and woven fabric dyeing are 80 L/kg yarn dyed, 120 L/kg fabric dyed and 140 L/kg fabric dyed, respectively, which were collected from local industries. In fabric washing, around one-third water of fabric dyeing is required. Blue water footprint can be calculated by the following formula [22]:
Blue water footprint = Blue water evaporation + Blue water incorporation + Lost return flow
The lost return flow refers to the part of the return flow that is not available for reuse within the same catchment within the same period of withdrawal. In this study, the assumption was made that the textile processing mills do not return their effluents into the same catchment in the same period of time [32]. Therefore, the lost return flow is assumed to be 95% of inlet water (water abstraction) in a process.
The formula to calculate grey water footprint is shown in Equation (3) [22]. In this study, grey water footprint is calculated for BOD since grey water footprint for BOD is about three times higher than that of COD [25]. However, water quality standard considering COD is four times higher than that of BOD, while the standard for natural concentration of COD in the receiving water body is three times higher than that of BOD standard (Appendix F). This leaves the denominator with a higher value (compared to the denominator when considering BOD) and consequently a lower grey water footprint. The actual and natural concentration of pollution load and ambient water quality standard for pollution load is given in Appendix F.
To calculate grey water footprint in textile industry, BOD values for knit and woven industries were considered to be 450 and 550 ppm [39]. In this study, pollution load from the outlet of industry (ETP inlet) is considered for calculating grey water footprint.
Grey   water   footprint = L C max C nat = Effl × c effl Abstr × c act c max c nat
where
  • Effl = effluent volume,
  • Abstr = water volume of the abstraction,
  • ceffl = concentration of the pollutant in the effluent and
  • cact = actual concentration of the intake water.

2.4. Water Footprint of Workers

The number of farmers/workers involved in cotton cultivation, cotton yarn manufacturing in spinning mills, cotton yarn dyeing, cotton fabric manufacturing and cotton fabric dyeing in textile mills is given in Appendix G. It was assumed that a worker produces 30 L of wastewater daily and takes 5% of wastewater (1.5 L) everyday, which comes from groundwater extraction. Here, the 1.5 L water is assumed to be employed in blue water incorporation and evaporation. The number of workers in RMG was obtained from Bangladesh Garment Manufacturers and Exporters Association BGMEA website [40]. Total number of workers in a stage was multiplied by the amount of water abstraction for a worker to get blue water footprint for the stage over a certain period of time. Grey water footprint for a worker was calculated in the same way as described earlier for grey water footprint for textile processing. In this case, effluent BOD concentration was assumed to be 300 ppm (collected from local industries).

2.5. Water Footprint for Transportation

It was assumed that an average ship size of 7000 TEU (twenty-foot equivalent unit) is used for the transportation of raw cotton, cotton yarn and cotton woven fabric from abroad. Fuel consumption for a 7000 TEU ship is 205 tons per day to travel at a speed of approximately 24 knots [41]. Time required to travel from different countries to Bangladesh is given in Appendix H. Total fuel consumption was calculated by multiplying required time with fuel consumption (205 ton per day) considering 40 feet (capacity: 14,000 kg of yarns) and 20 foot (capacity: 6550 kg of yarns) container sizes for import purpose [42].
To import cotton from Uzbekistan, at first the cotton is transported to Poti, Georgia, by road and then from Georgia to Chittagong port by sea [43]. On the other hand, Indian cotton is imported by road and for the other countries it was considered that cotton is imported by sea. It was assumed that a heavy-duty diesel truck that hauls 19 tons of freight a distance of 7 miles would consume approximately 1 gallon of diesel fuel. Water consumption per ton crude oil recovery to refining conventional gasoline was considered 0.41 m3 [44] and blue water evaporation and incorporation were considered negligible.

3. Results

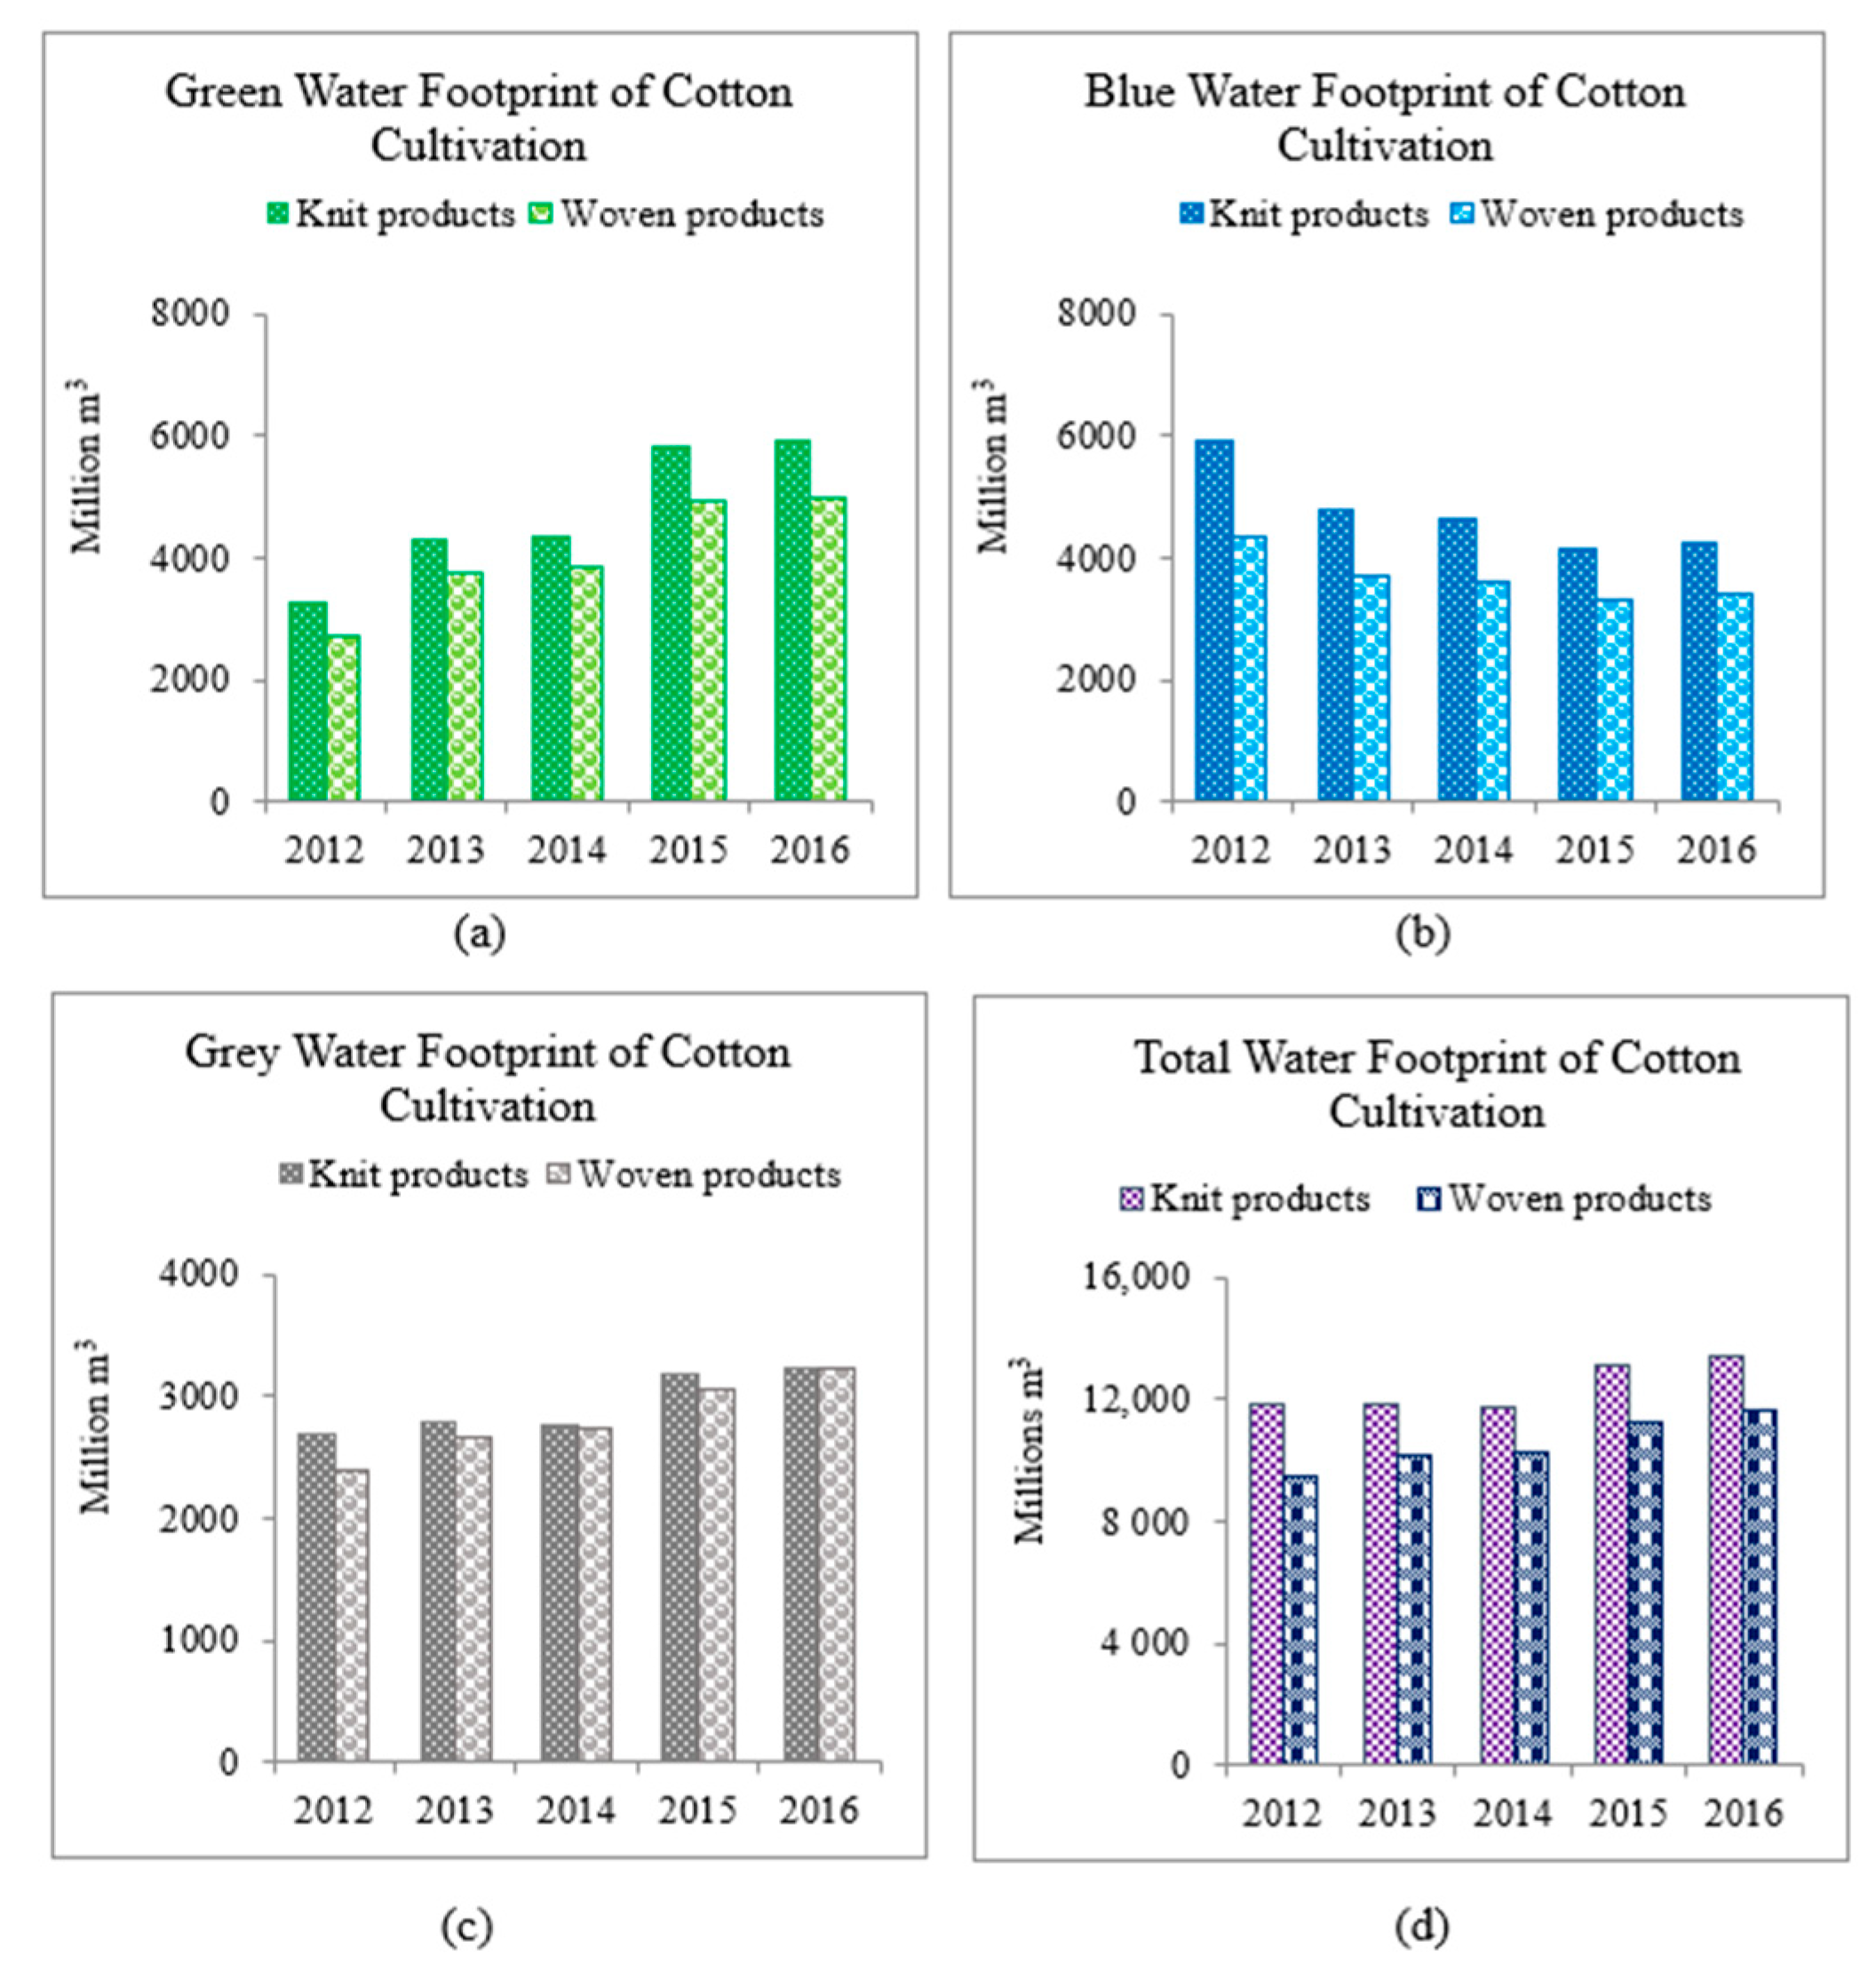
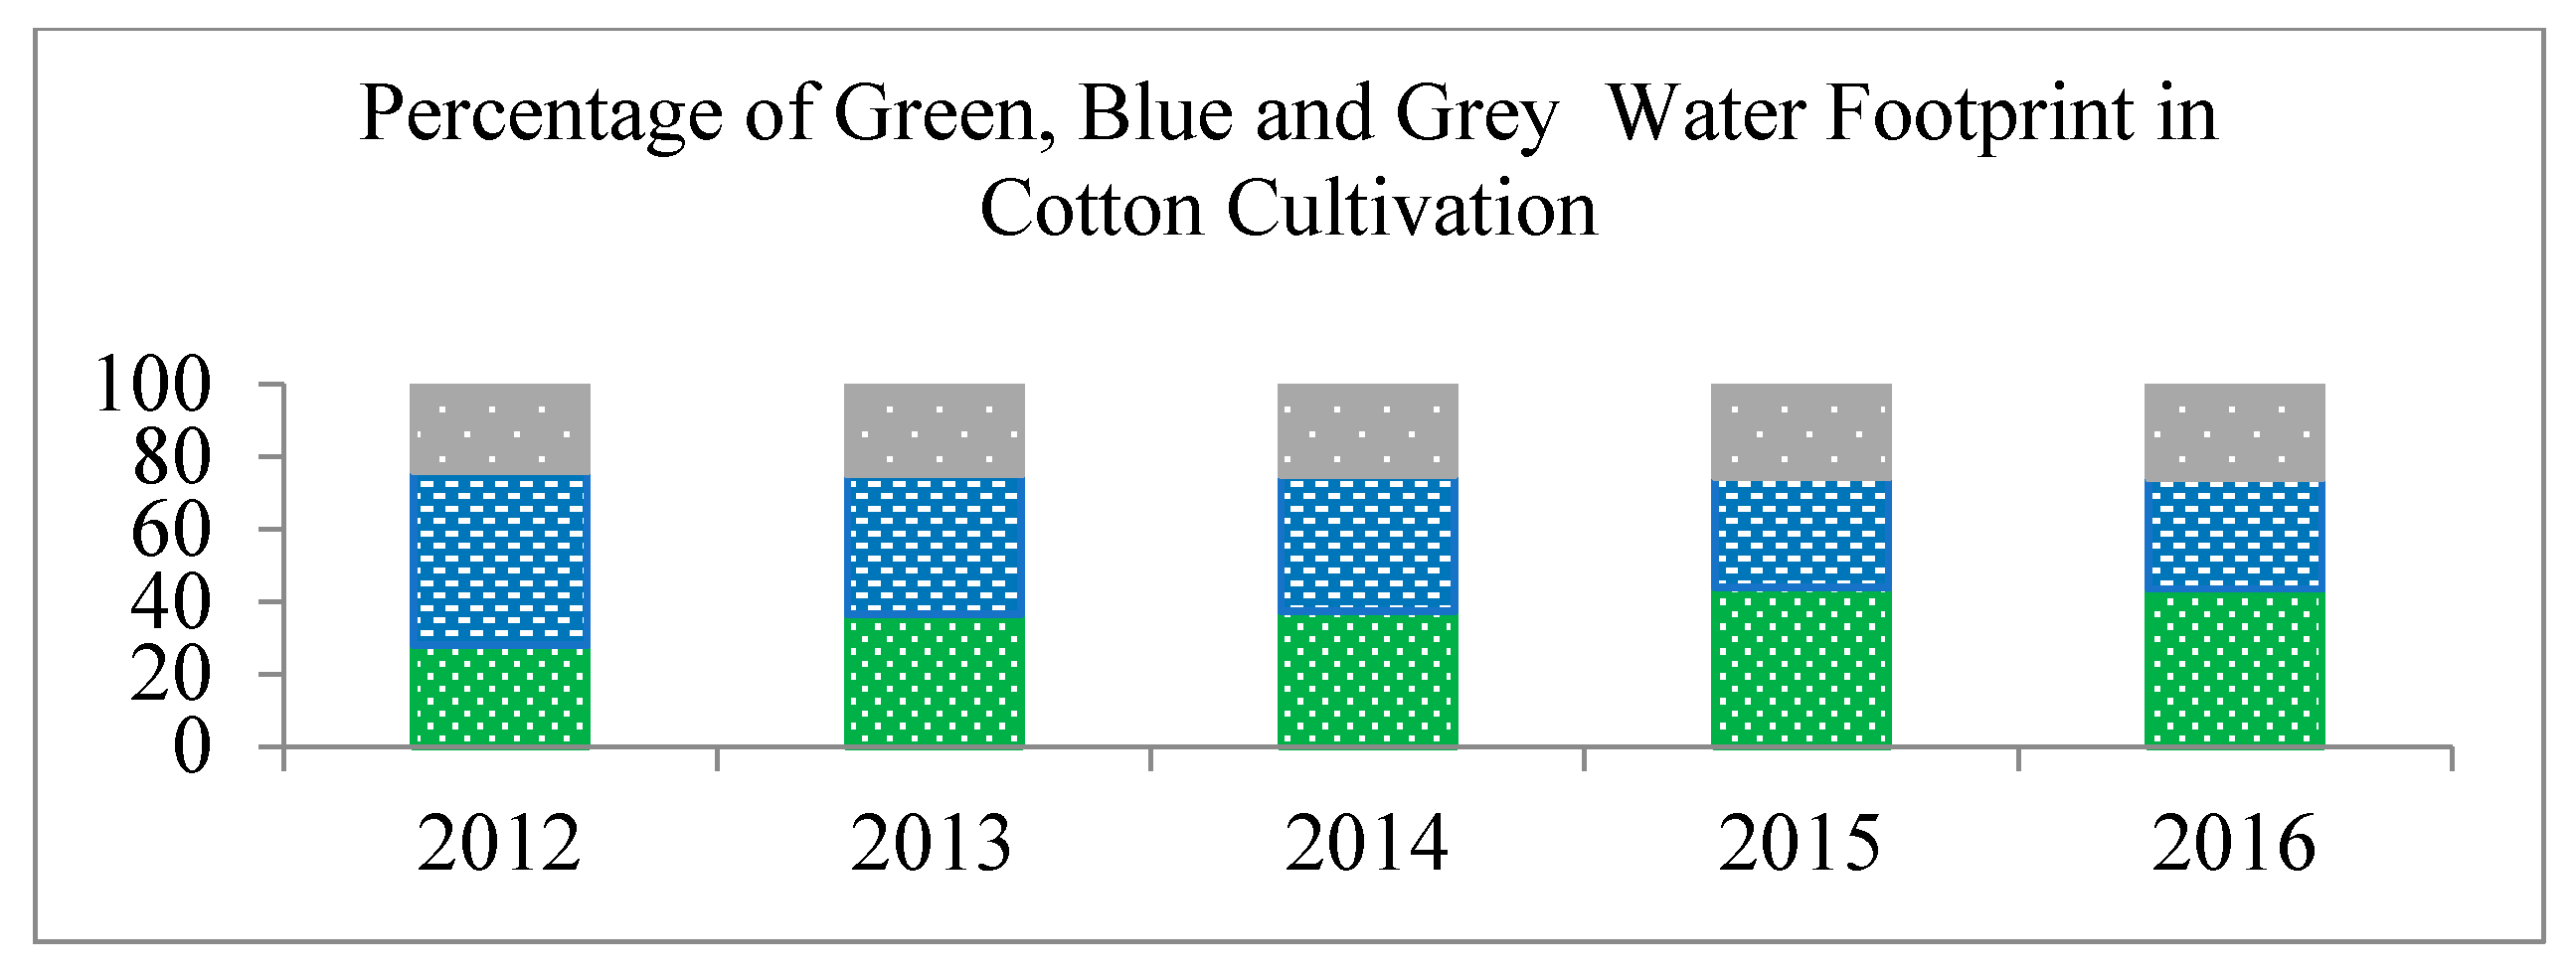
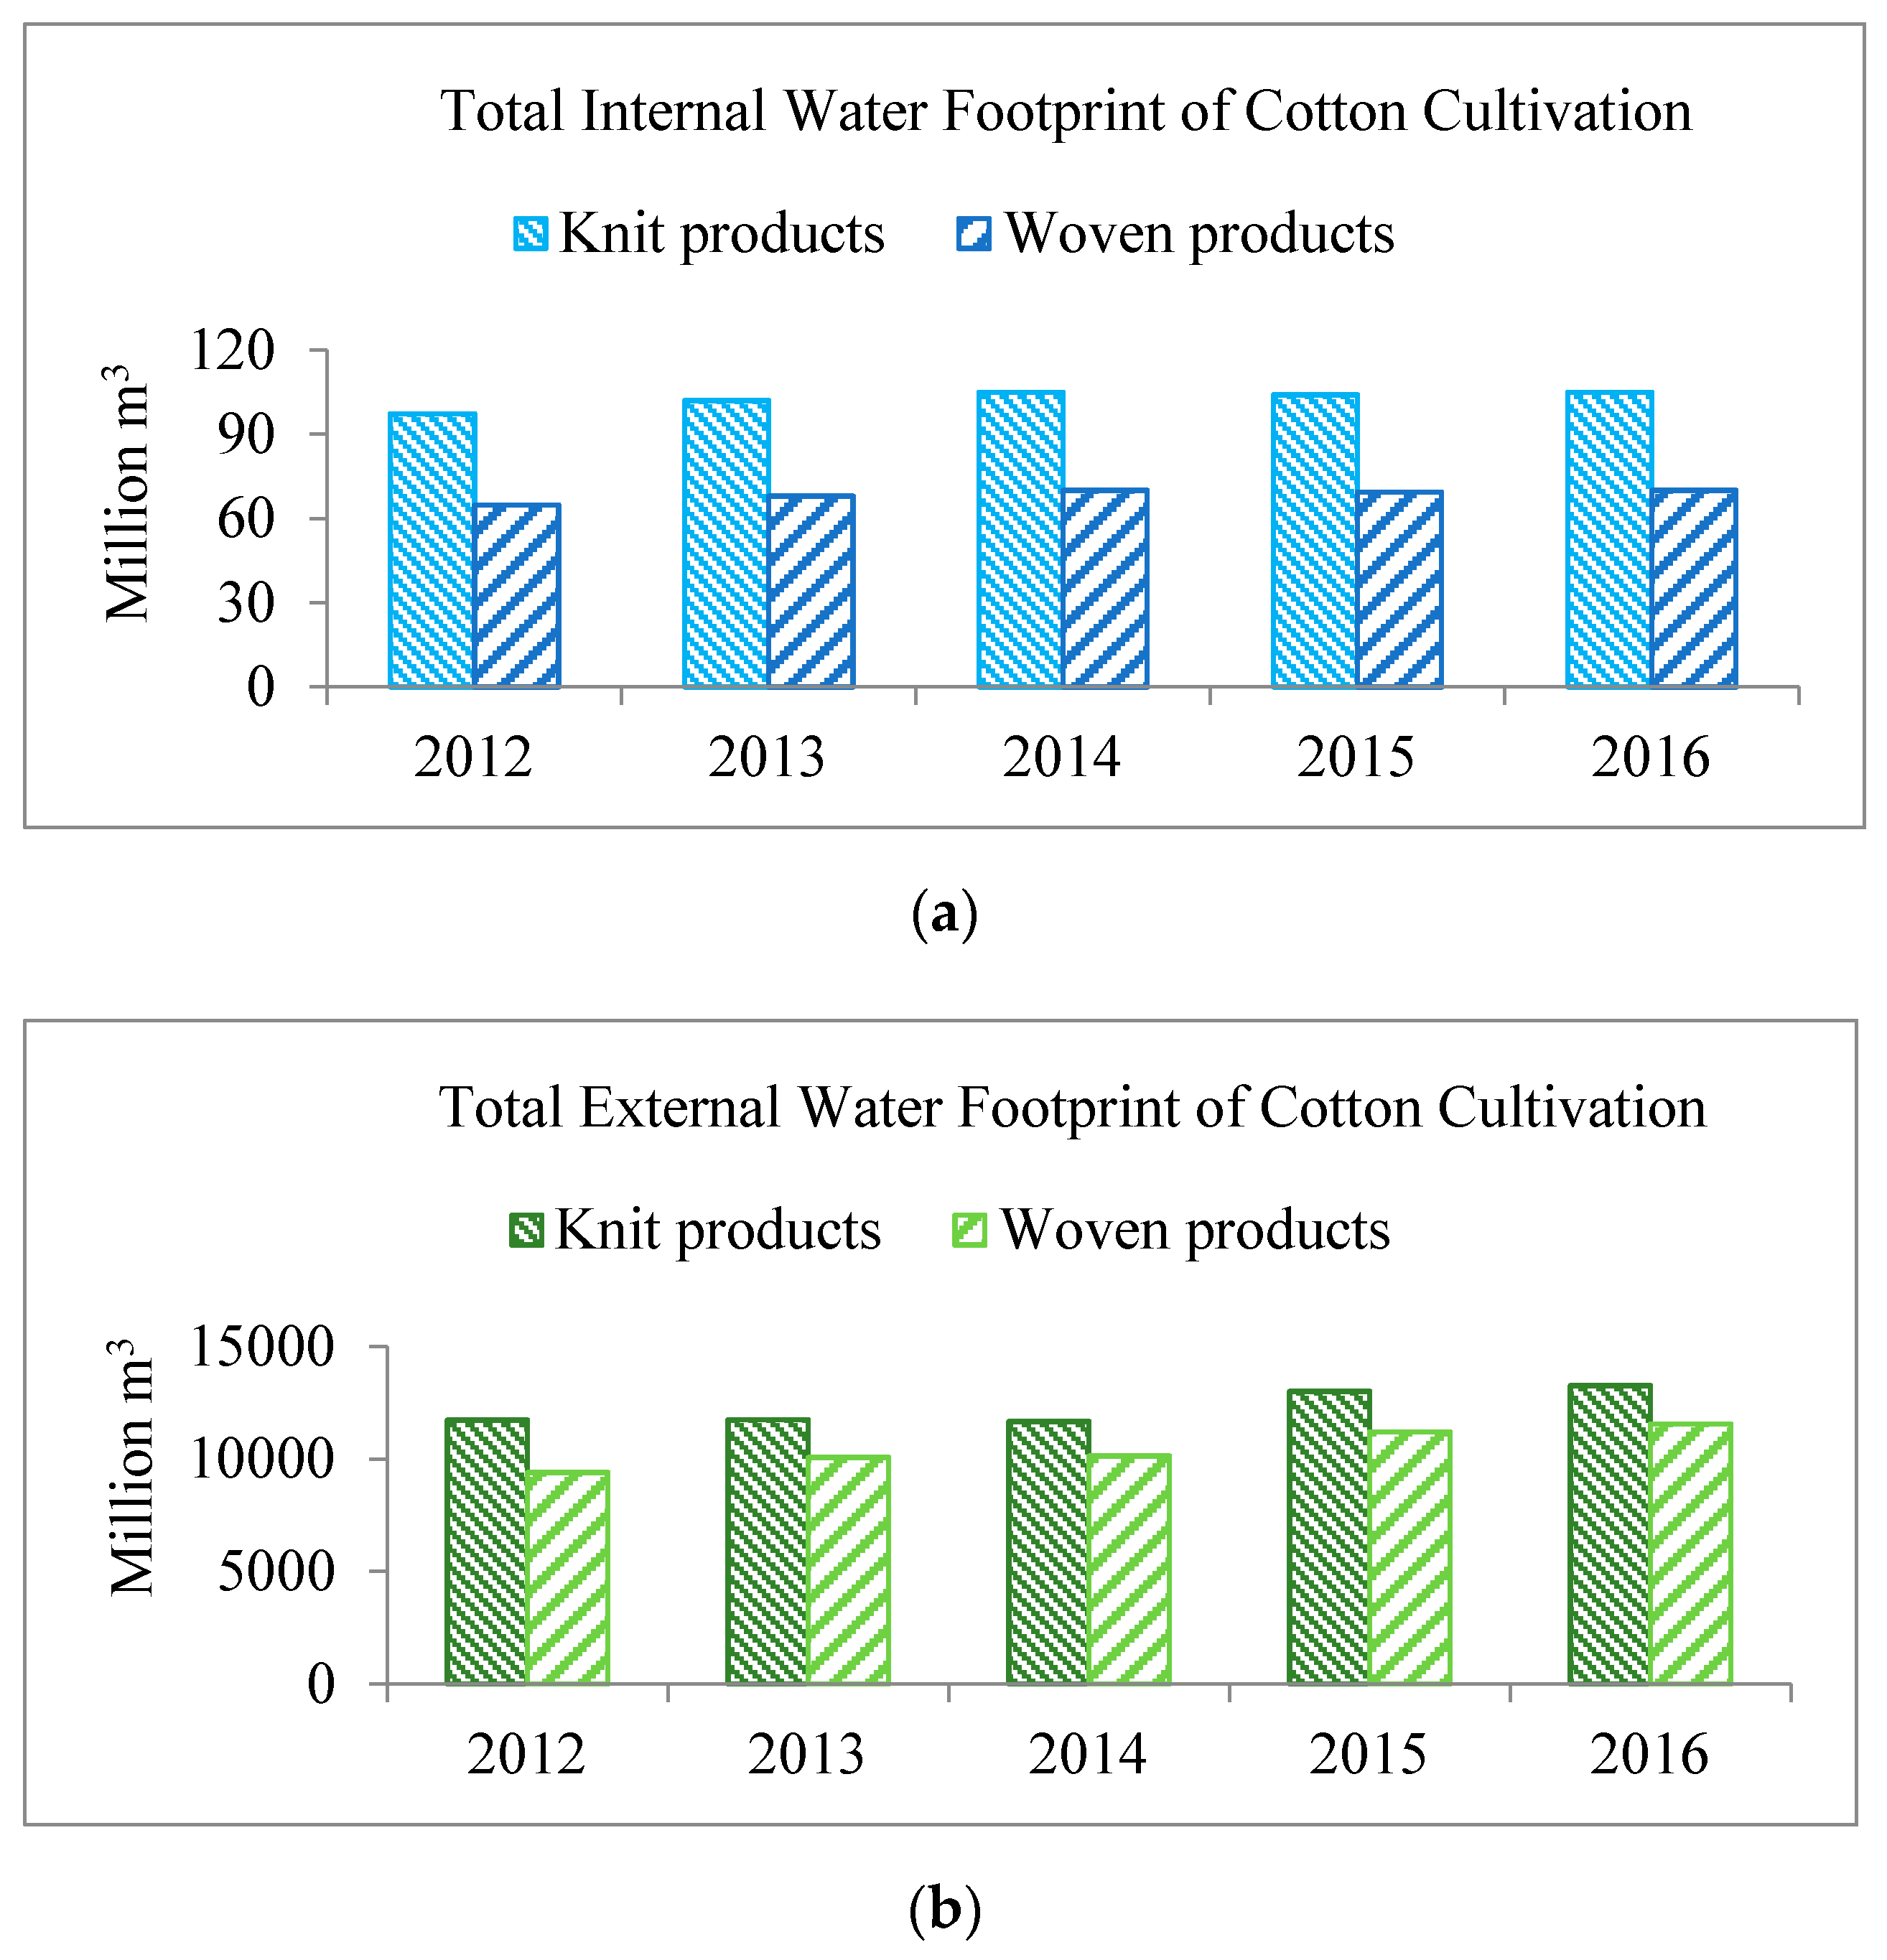
3.1. Water Footprint of Cotton Cultivation

Bangladesh imports a huge quantity of cotton every year to meet the increasing demand of RMG products and other value-added products in domestic and foreign markets. Thus, water footprint of cotton cultivation comes mainly from the countries from where Bangladesh imports raw material for RMG products.
In 2016, Bangladesh imported 6.3 million bales (1,371,665 metric tons) of raw cotton with a major share from India (around 50%). Around 2% of the national requirement is fulfilled through local production (around 0.13 million bales). Besides raw cotton, around 263,071 tons of cotton yarn and 294,335 tons of cotton fabric were imported in 2016.
Figure 3 presents green, blue, grey water footprint and total water footprint of cotton cultivation for knit and woven products for the five years from 2012 through 2016. Water footprint of cotton cultivation for knit products is mostly higher than that of woven products. This is because around 60% of raw materials for knit products are met by local spinning mills; the remaining 40% comes from imported cotton yarn. On the other hand, for woven products, around 40% of raw materials comes from imported raw cotton, with the remaining 60% coming from imported cotton yarn and fabric. Local spinning mills use mostly the imported raw cotton to produce cotton yarn. In recent years, around 80% of this imported raw cotton comes from India, Uzbekistan and Africa, where green and blue water requirements for cotton production is much higher than China, from where a major amount of cotton yarn and cotton fabric is imported. As seen in Figure 3a,b, green water footprint for knit and woven products is increasing gradually and blue water footprint for knit and woven products is decreasing gradually. In 2012, green and blue water footprint of cotton cultivation for RMG products was found to be 5.98 and 10.21 billion m3, respectively, whereas, in 2016, the values were 10.87 and 7.65 billion m3, respectively. Currently, a larger percentage of raw cotton is imported from India, where around 65% of cotton is grown under a rainfed condition. The percentage of raw cotton imported from Uzbekistan is decreasing, where almost 100% of cotton is grown under an irrigated condition. Thus, over the years, green water footprint is increasing and blue water footprint is decreasing for both knit and woven products.
Grey water footprint of cotton cultivation is increasing gradually because of greater cotton demand; for per kg RMG production, grey water footprints of cotton cultivation were found to be 3695 L in 2012 and 3705 L in 2016. Here, only nitrogen fertilizer was considered to calculate grey water footprint as nitrogen is most susceptible to leaching because it cannot be retained by the soil. Phosphorus has low mobility in the soil and leaching is generally not a problem. Potassium mobility in soils is intermediate between nitrogen and phosphorus, but it is not easily leached because of having positive charge (K+), which causes it to be attracted to negatively charged soil colloids [36]. Total water footprints of knit and woven products are shown in Figure 3d. In 2016, total water footprint of cotton cultivation for knit and woven products was 13.4 billion m3 and 11.6 billion m3, respectively.
Figure 4 presents the percentage of green, blue and grey water footprint of cotton cultivation for the last five years. In 2012, percentage of green, blue and grey water footprint of cotton cultivation was 28, 48 and 24% respectively; whereas, for 2016, the values were 43, 31 and 26%, respectively. The percentage of blue water footprint is decreasing and the percentage of green water footprint is increasing because of greater percentage of imported cotton from countries where cotton is cultivated mostly under rainfed conditions. The percentage of grey water footprint changes with year is not large enough compared to the import percentage because of imported cotton from the countries where nitrogen fertilizer application rate is lower.
The internal water footprint comes from the water use and pollution inside the country, while external water footprint comes from water use and pollution abroad. In cotton cultivation, water footprint comes mainly from abroad because the amount of cotton cultivated in Bangladesh is only 2% of the demand of the RMG sector. External water footprint for cotton cultivation is 98.93% whereas internal water footprint for cotton cultivation is only 0.7%.
Total internal water footprint (due to domestically produced cotton) of cotton cultivation increased around 8% in the last five years due to increase of cotton production from 170 to 184 million metric tons (Figure 5a). In 2016, total internal water footprint of cotton cultivation was 184 million m3 (114 million m3 for knit products and 70 million m3 for woven products) and total external water footprint for cotton cultivation was 25,600 million m3 (14,100 million m3 for knit products and 11,500 million m3 for woven products). The total external water footprint of cotton cultivation increased around 16% in the last five years due to more imported cotton to meet RMG sector export demand (Figure 5b).

3.2. Water Footprint for Transportation

Blue water footprint to transport raw cotton, cotton yarn and cotton fabric from different countries to Bangladesh was calculated by considering fuel consumption during the transportation. Blue water footprint for transportation for knit and woven products was found to be 79,988 m3 and 65,461 million m3, respectively, in 2016 (Figure 6). For knit production, water footprint is higher than woven products because the amount of raw material transported by road for knit product is higher than that for woven product. Blue water footprint for transportation depends on fuel consumption, and fuel consumption depends on the distance between countries and the mode of transportation (by road/by sea). Fuel consumption by road transportation is larger than transportation by ship.

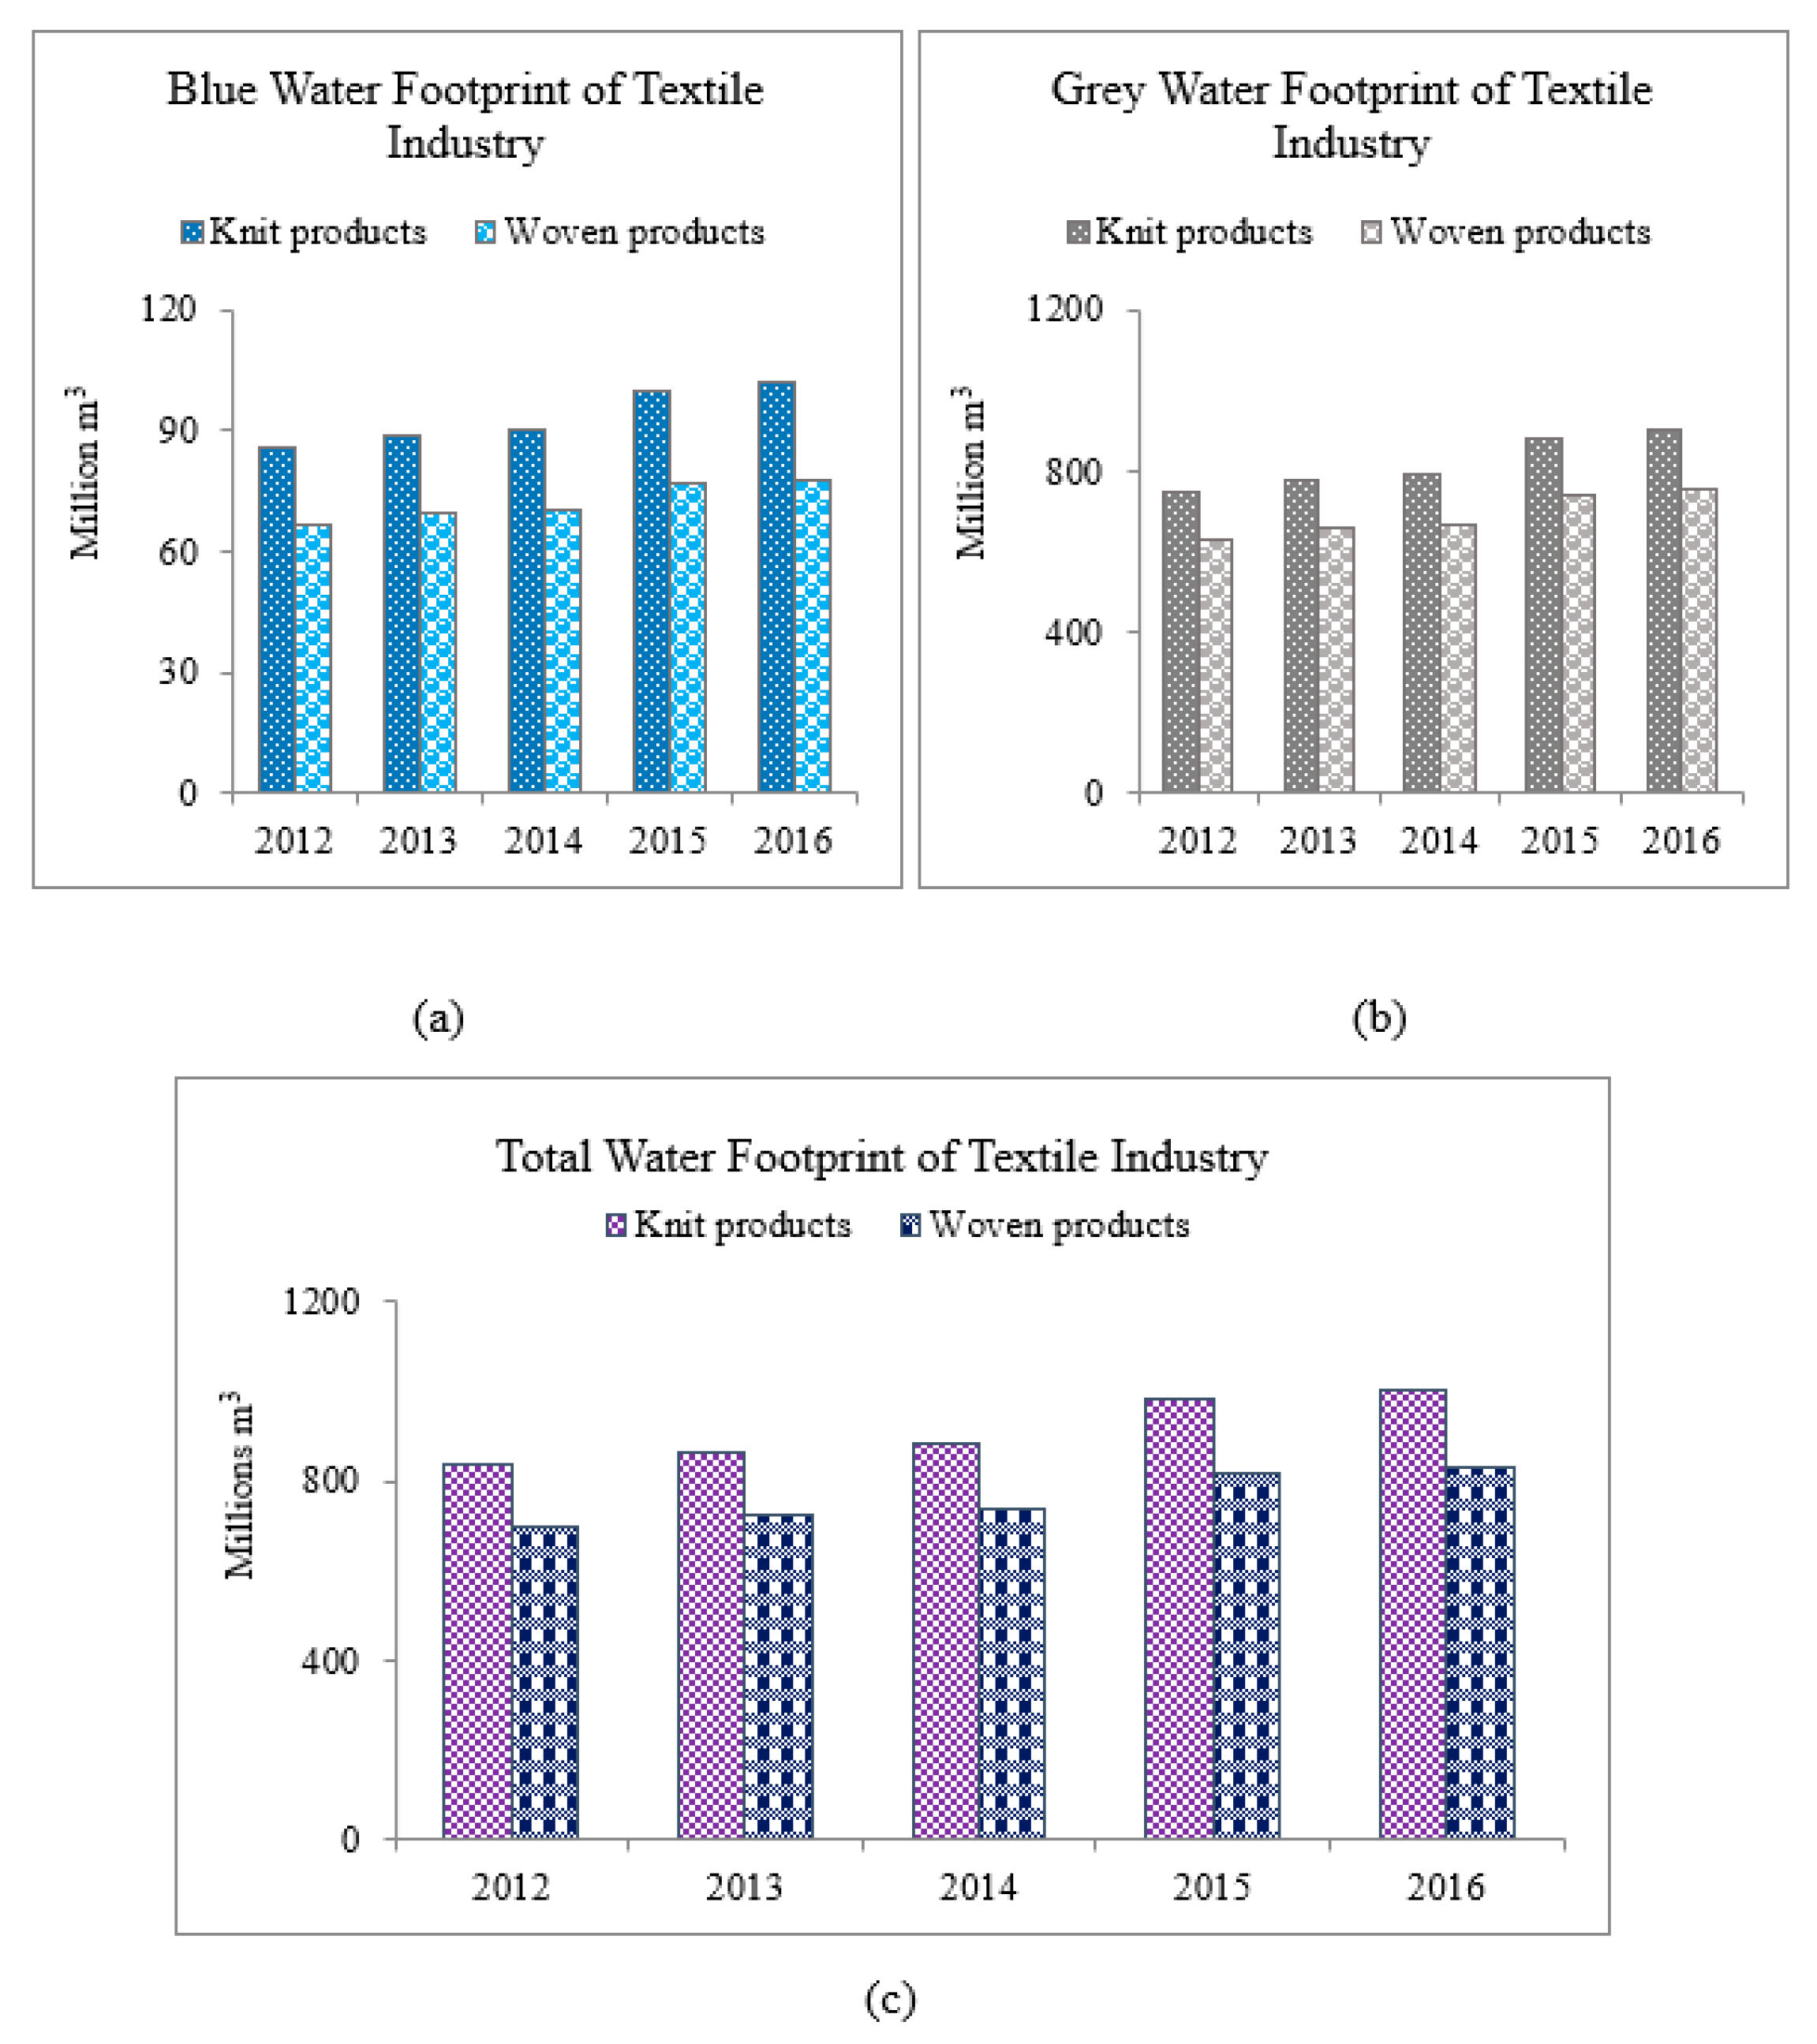
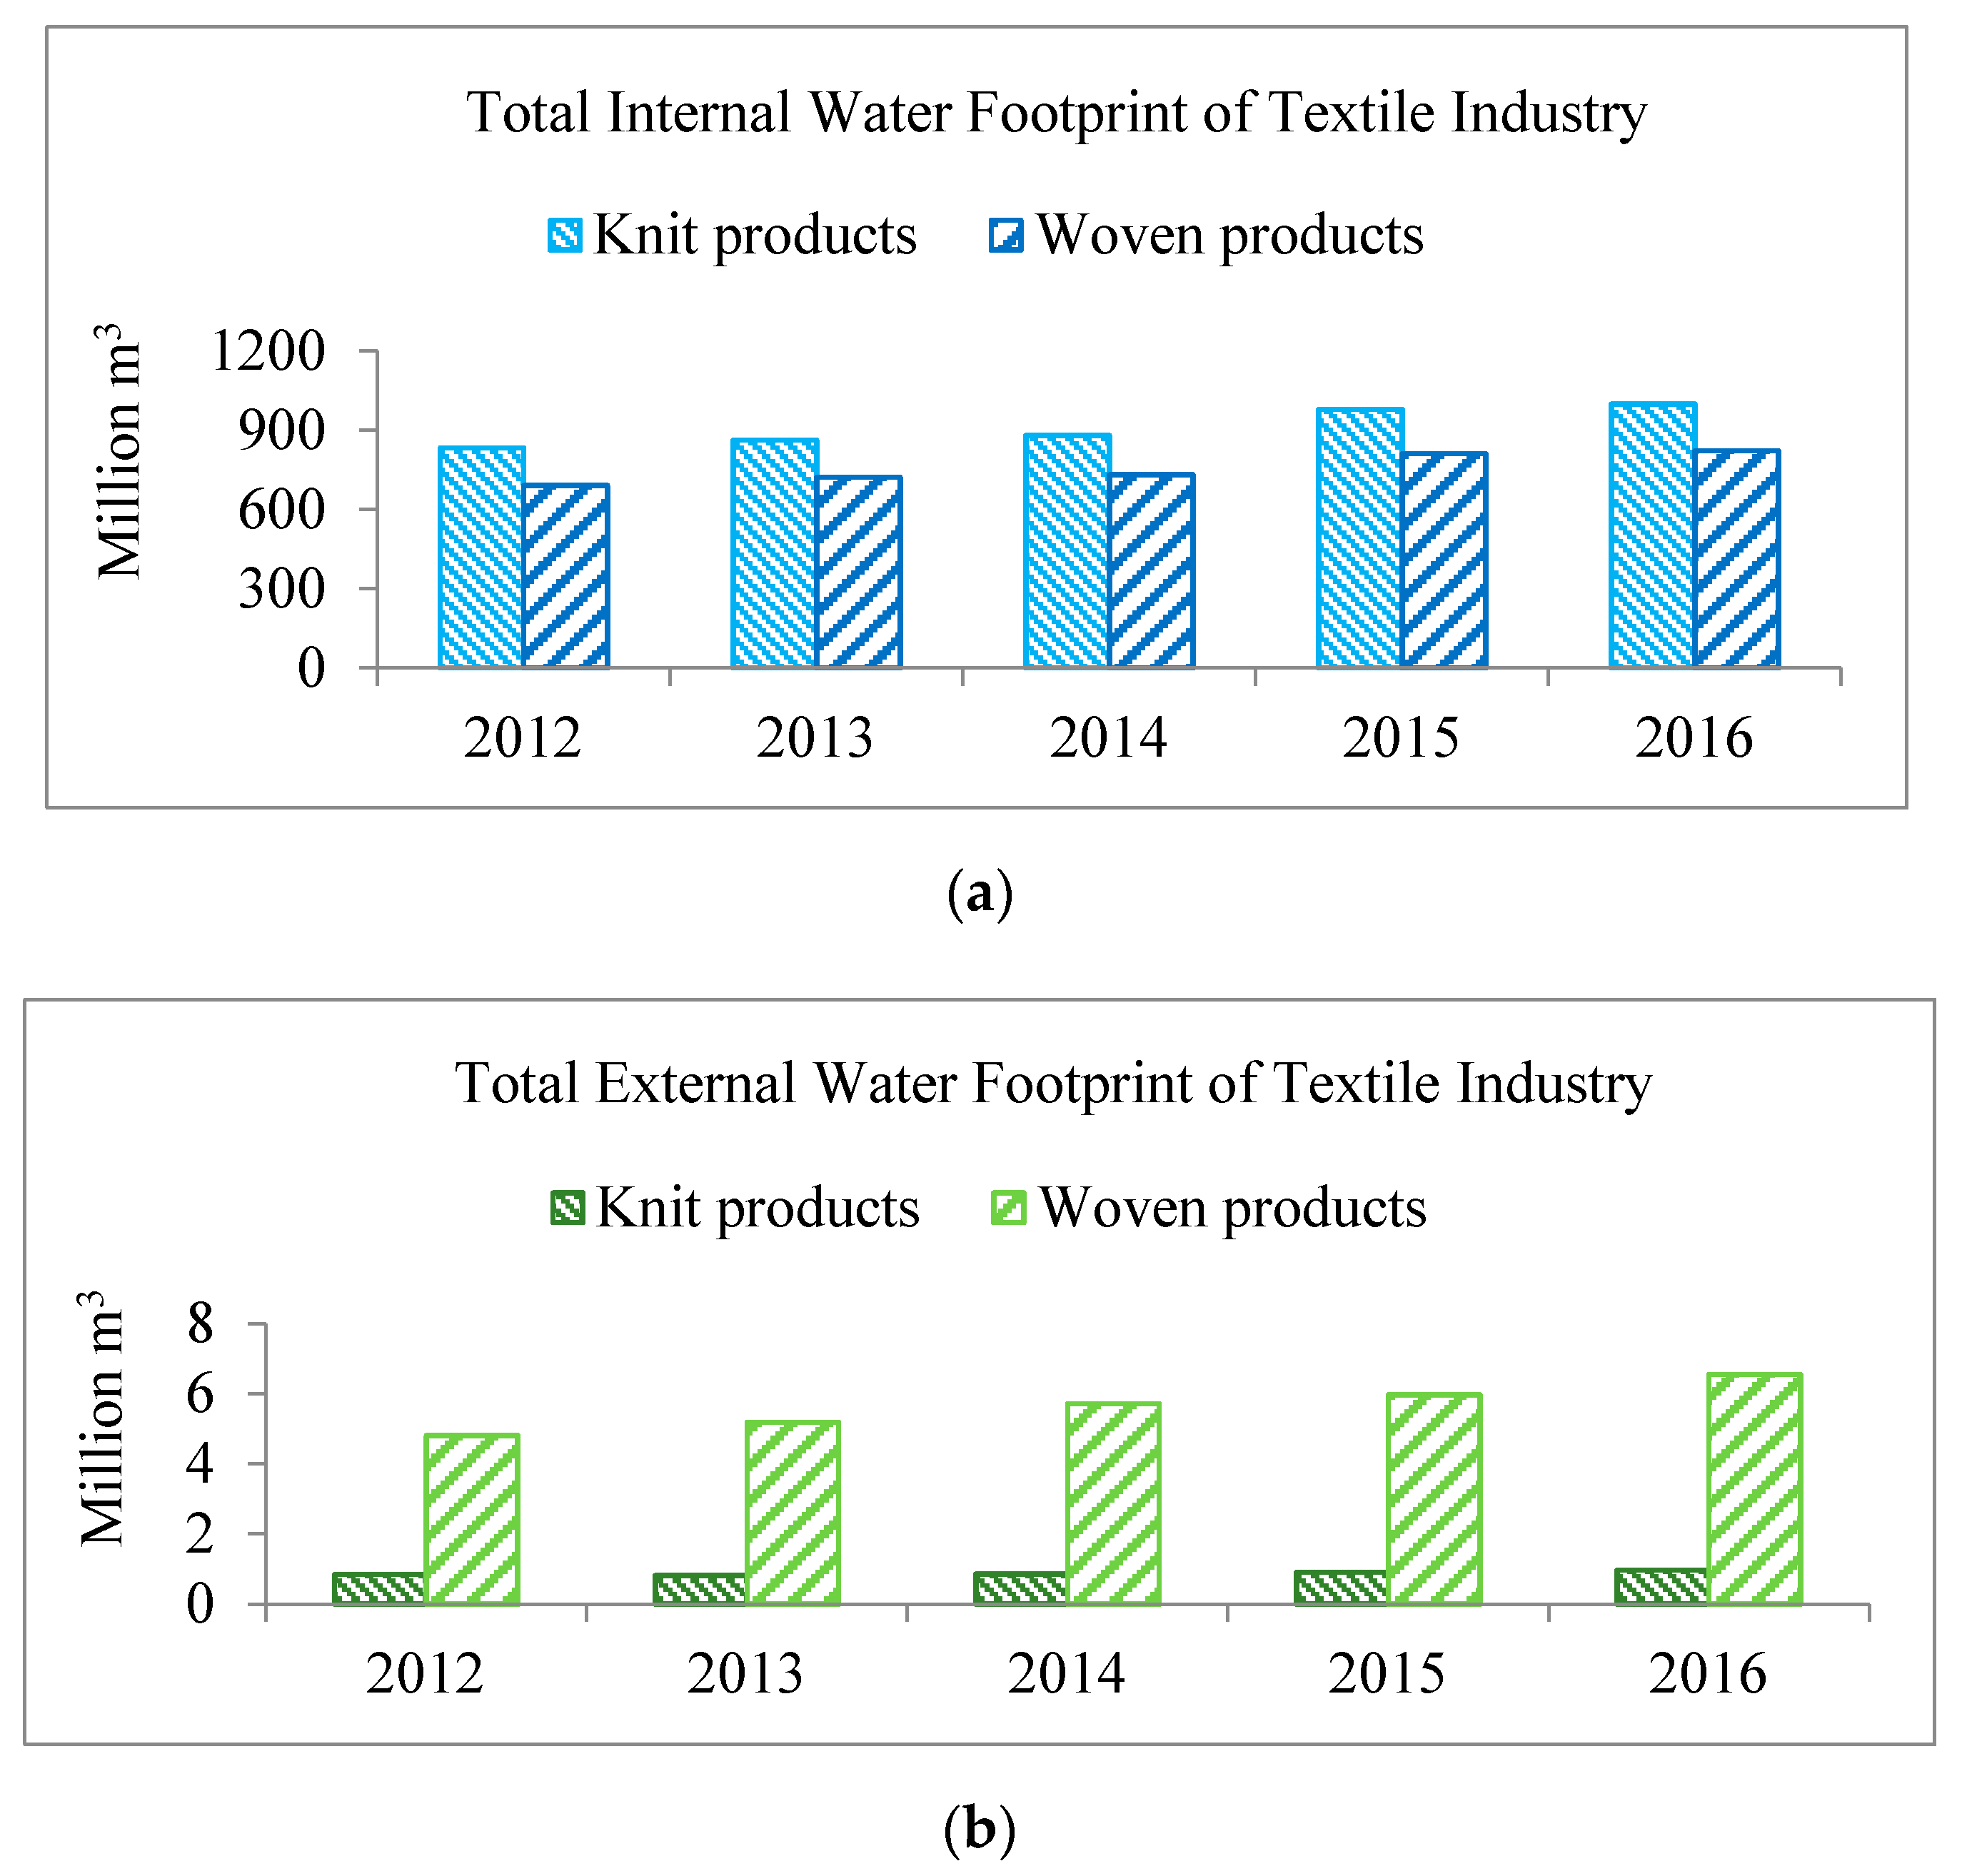
3.3. Water Footprint of Textile Industry

In the textile industry, there are various processes to convert the raw material into the final product. At first, the raw cotton is spun in spinning mills to produce cotton yarn. After necessary processing, cotton yarn is employed to produce cotton fabric. Necessary treatments (bleaching, washing, dyeing, printing, finishing etc.) are done to make the fabric and produce fabric suitable for garment use. From raw cotton to final products in the garments, a huge amount of water is required for various processes. In this study, water consumption in every step both for process and by worker was calculated.
Figure 7 shows blue, grey and total water footprint of textile industry for the last five years. In 2016, the blue water footprint for knit and woven products were 102 and 77.5 million m3, respectively (Figure 7a), whereas the grey water footprint for knit and woven products were 898 and 750 million m3, respectively (Figure 7b). The total water footprint for the textile industry increased around 20% for knit products and around 23% for woven products from 2012 to 2016 (Figure 7c). To fulfill this high amount of water demand in the textile industry, around 180 million m3 of groundwater was extracted in 2016. A large amount of groundwater is extracted, which causes groundwater depletion in the industrial regions. High pollution load is harmful for environment and human health. Industrial toxic and chemical wastes that are disposed into water bodies are responsible for several types of health problem of illness and premature deaths across the globe. The presence of dyes in surface and subsurface water causes many waterborne diseases, viz., nausea, hemorrhage, ulceration of skin and mucous membrane, dermatitis, perforation of nasal septum and severe irritation of respiratory tract [45,46]. Moreover, any increase of salinity water caused by excessive groundwater extraction may cause high blood pressure, heart disease and heart failure [47]. A large number of villages at Gazipur and D.N.D (Dhaka–Narayanganj–Demra) Embankment are now being threatened by the environmental degradation caused by textile effluent [45].
For the textile industry, blue water footprint was 9% and grey water footprint is around 91% for 2012–2016. The main reason for this huge percentage of grey water footprint is high amount of water pollution during textile processing.
As most of the raw materials for cotton products are imported as raw cotton, 99.58% of water footprint is internal in the textile operation. Imported cotton yarn and cotton woven fabric are also dyed in the country; as a result, only water footprint for workers to produce cotton yarn and cotton fabric contributed to the external water footprint (0.42%).
Figure 8 shows the total internal and external water footprint for the textile industry. In 2016, total internal water footprint of textile processing was 1820 million m3 (999 million m3 for knit fabric and 821 million m3 for woven fabric), whereas the total external water footprint of textile processing was 7.51 million m3 (0.97 million m3 for knit fabric and 6.54 million m3 for woven fabric). Total internal water footprint of textile processing was around 242 times higher than the total external water footprint of textile processing (in 2016).
Water footprint in different stages in the textile industry can be seen in Figure 9. A large amount of water is employed in fabric washing, dyeing and finishing, which is 53%, while water footprint in yarn dyeing is 28% of total water footprint in the textile industry. Percentages of water footprint in spinning (0.9%) and fabric manufacturing (0.5%) are very small because in these stages most water footprint comes from worker water consumption and pollution. For yarn dyeing and fabric dyeing water footprint comes from both the dyeing process and the workers involved in the process. In RMG sector, there is also no water footprint of the process, the only water footprint is contributed by the workers, which is 18% of total water footprint in textile industry. This percentage of worker water footprint is higher than spinning and fabric manufacturing as in RMG sector number of workers is higher than spinning and fabric manufacturing. Water footprint in wet processing is 81% because of high consumption of water in various steps of product manufacturing; the remaining 19% of water footprint was contributed by the workers working in the industry.

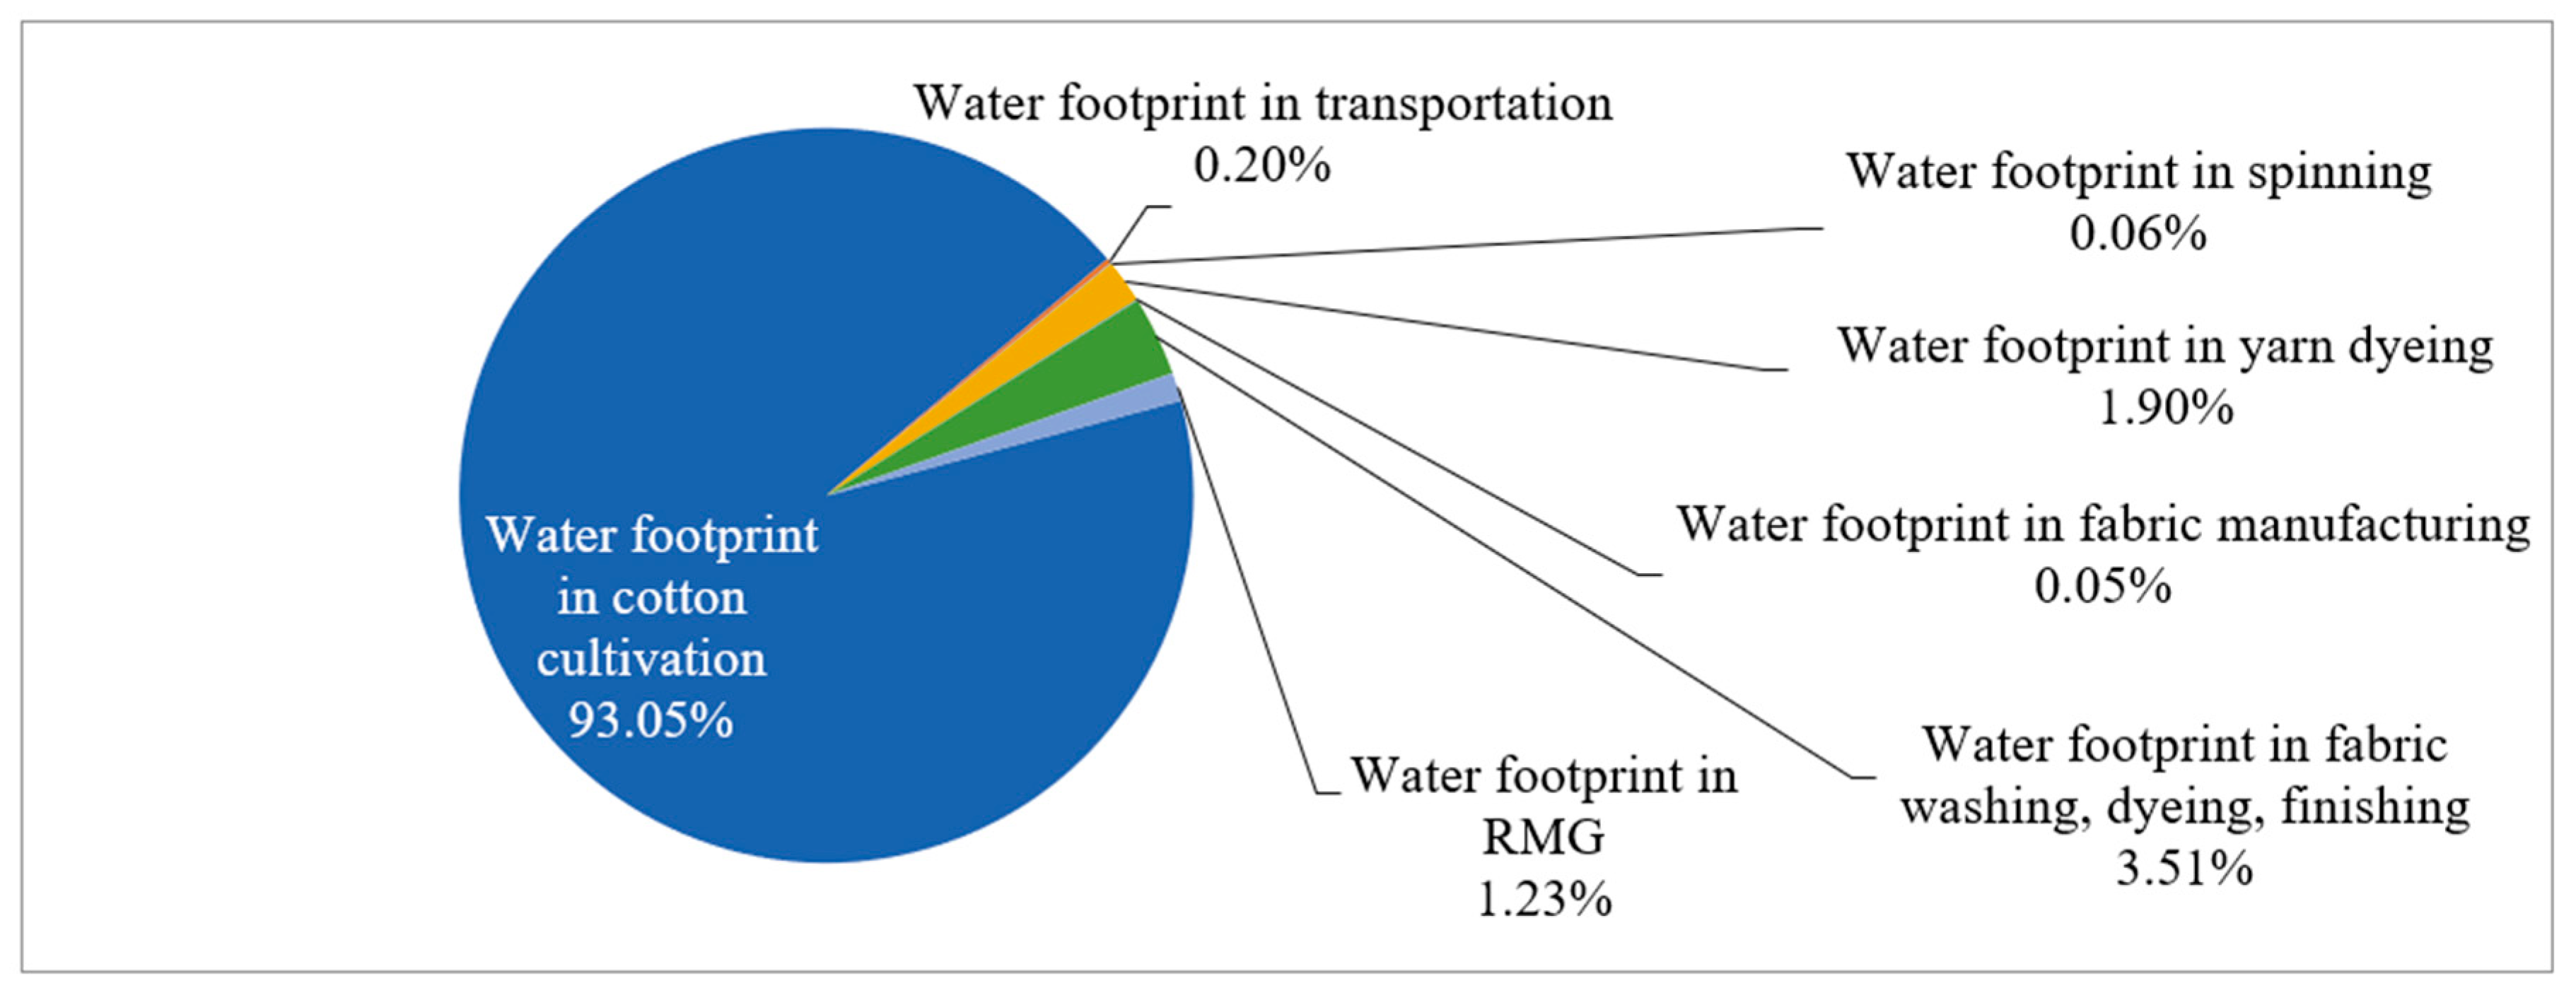
3.4. Water Footprint in Different Stages from Cotton Cultivation to Final Product

Figure 10 shows the percentage of water footprint in different stages of RMG production (from cotton cultivation to final product). The highest water footprint is in cotton cultivation, 93%; the second highest is for fabric washing, dyeing and finishing, 3.5%. Around 7% of total water footprint is associated with the textile industry. The percentage of water footprint in cotton cultivation is 93% of total water footprint because of a higher percentage of water consumption and pollution during cotton cultivation.

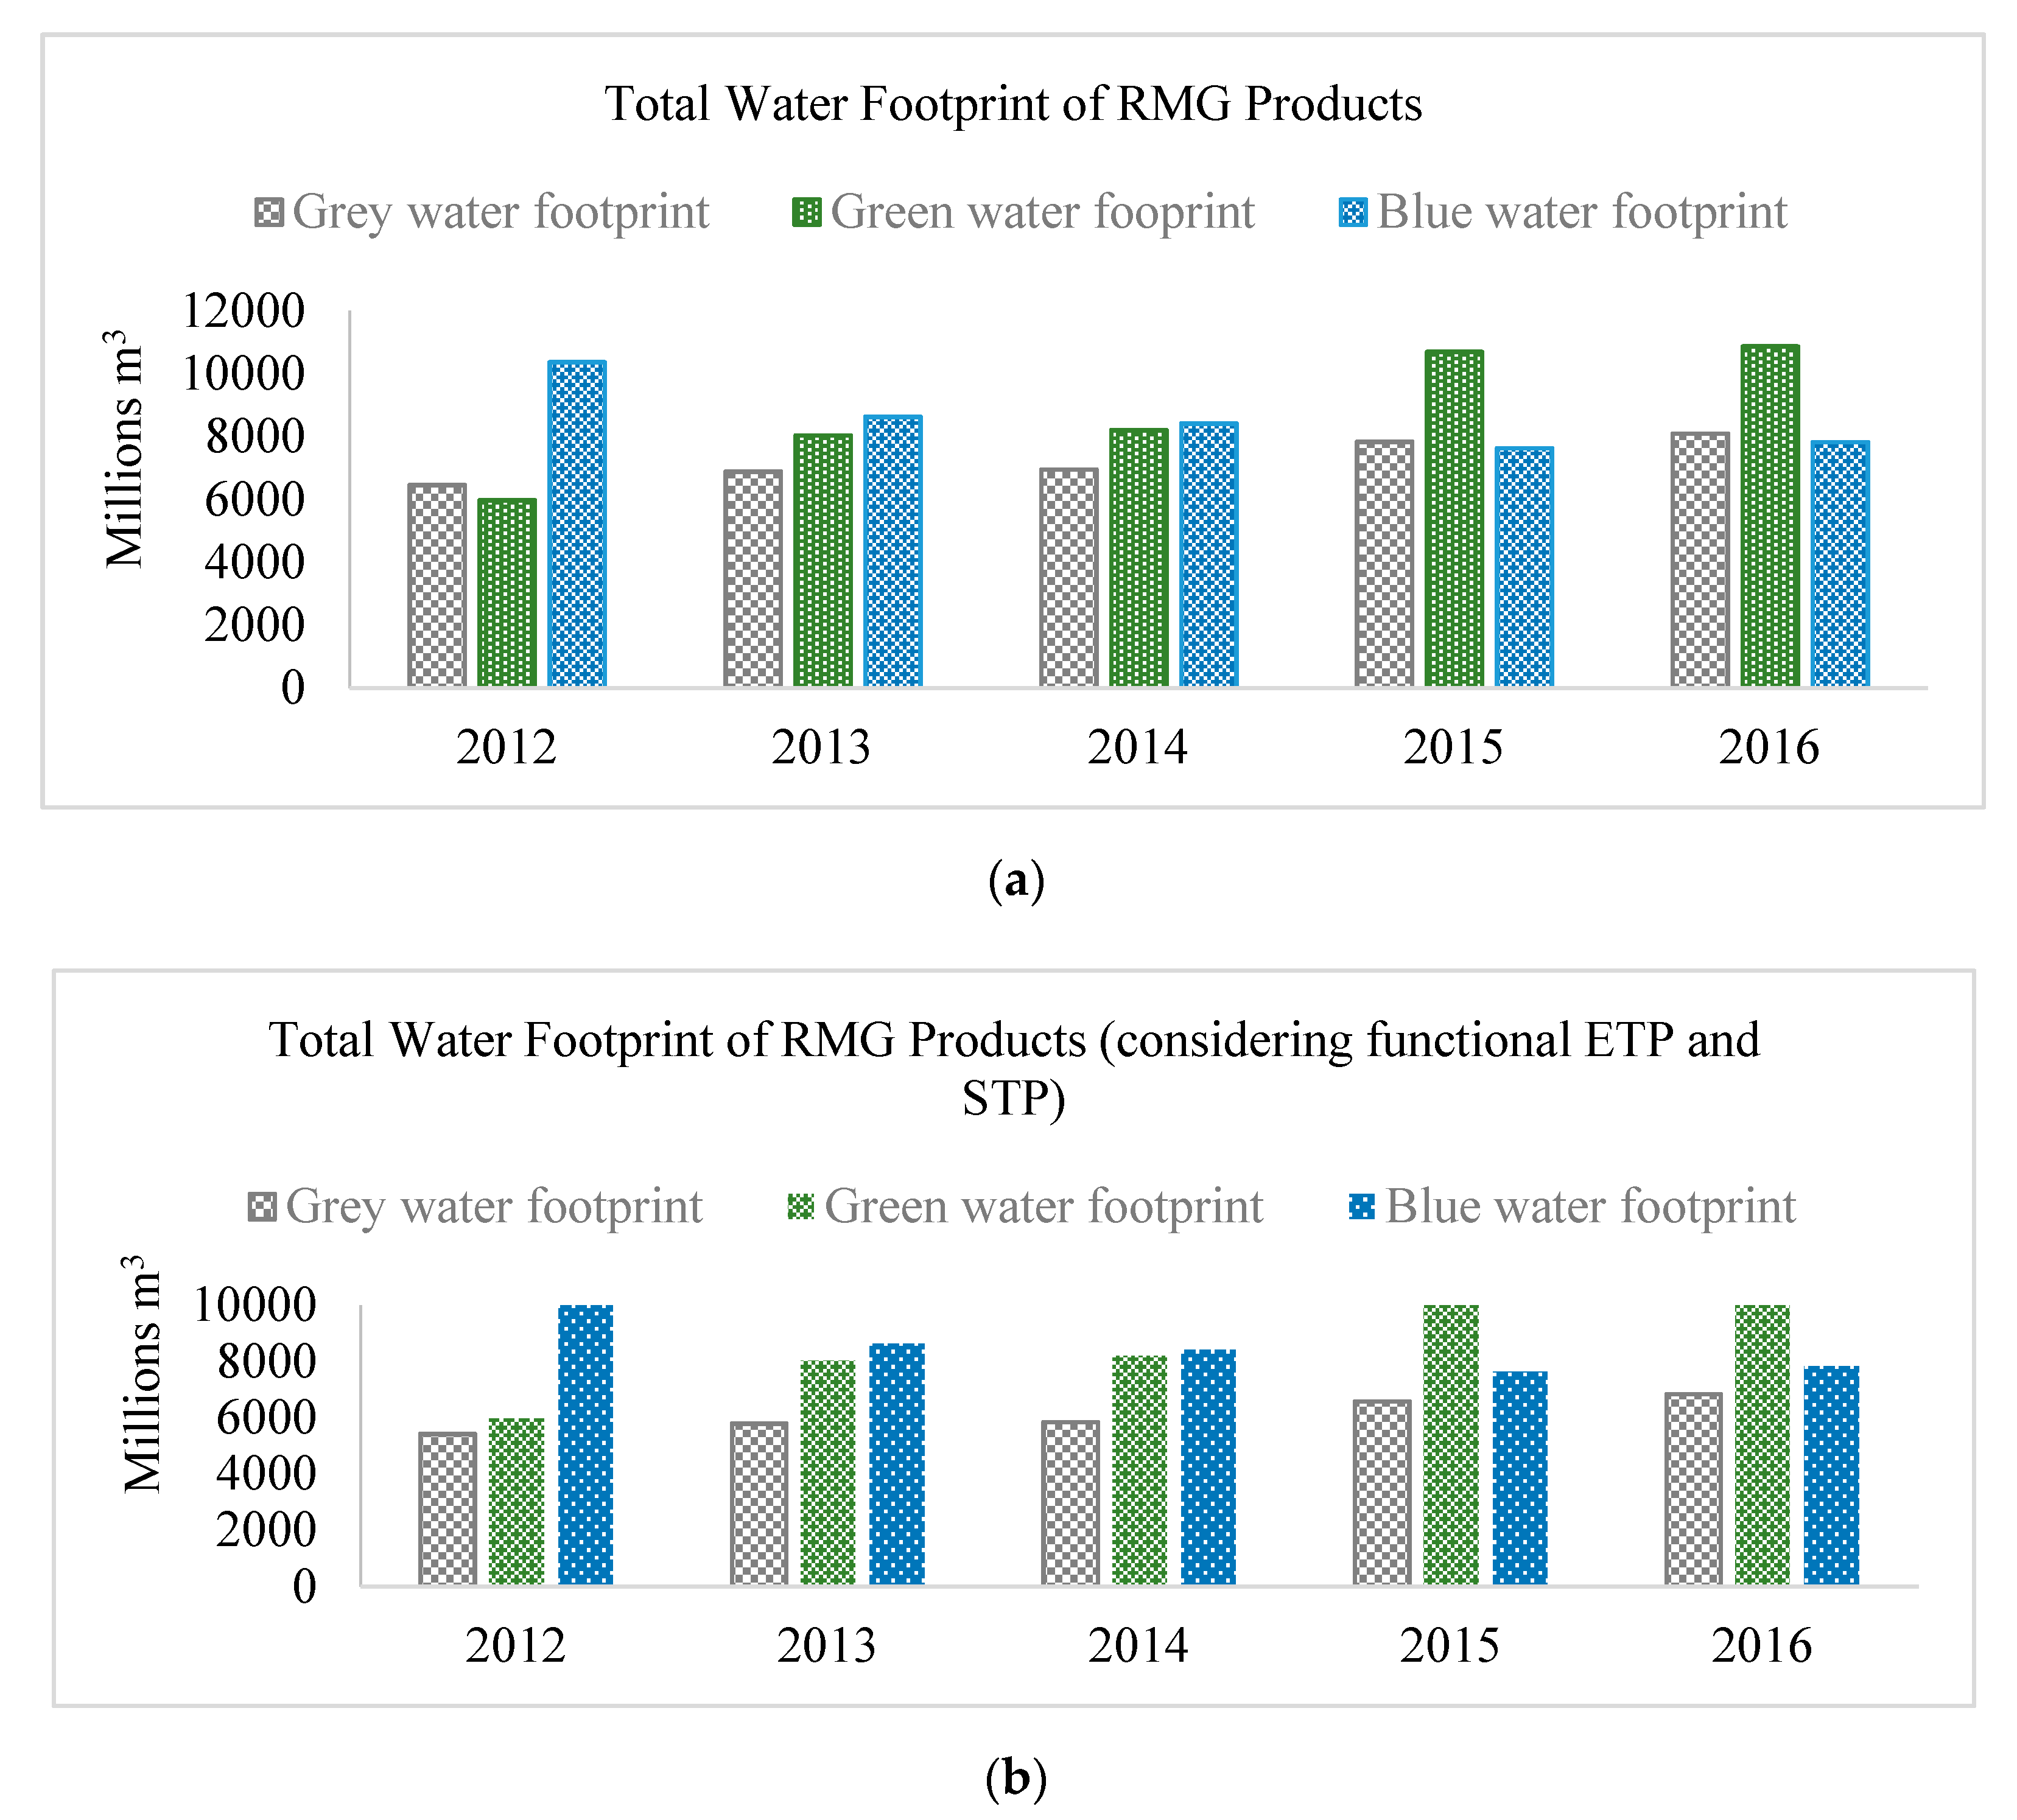
3.5. Total Water Footprint of RMG Production

The total water footprint of RMG production is the water footprint of product from cotton cultivation to final product in the garments. Figure 11a shows total water footprint of RMG production for the last five years. Total green, blue and grey water footprint of RMG production was 10.87 billion m3, 7.88 billion m3 and 8.81 billion m3, respectively in 2016. Total consumptive water was 18.75 billion m3 for 1.74 million tons of fabric.
If it is considered that textile industries are running an ETP (effluent treatment plant) and STP (sewage treatment plant) as per national requirements (ECR 1997), the grey water footprint will be reduced, which is shown in Figure 11b; green and blue water footprint will remain same as the values calculated without considering ETP and STP. In 2016, grey water footprint was found to be 6.84 million m3, which is 22% lower than the grey water footprint calculated without considering ETP and STP.

3.6. Water Footprint Calculation for Different Products

Water footprints for different textile products, such as shirt, T-shirt, bedsheet and a pair of jeans were calculated considering water consumption and pollution in every stage from cotton cultivation to final product in the RMG sector.

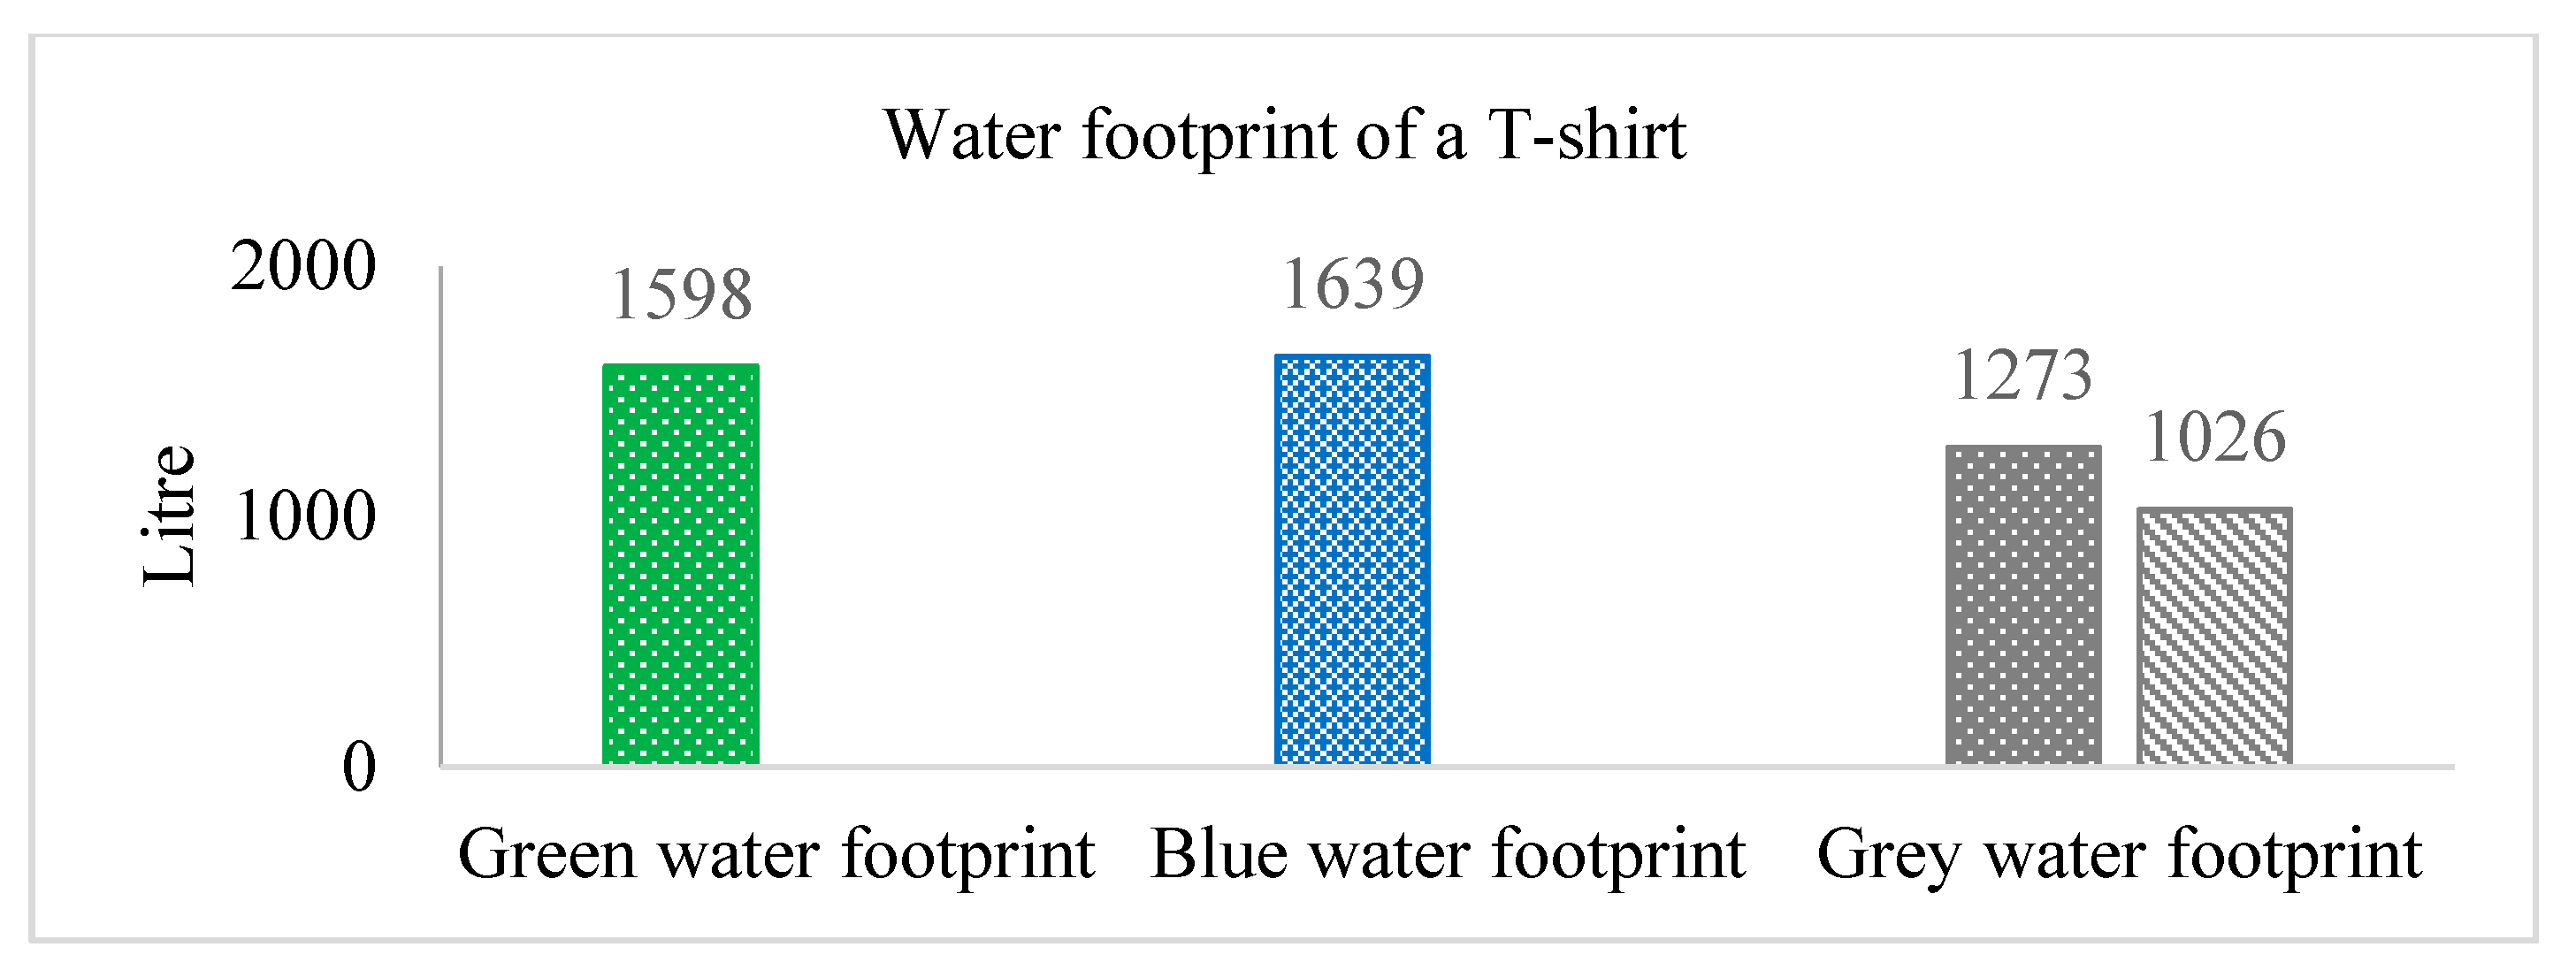
3.6.1. Water Footprint of a T-Shirt

Water footprint of a T-shirt is estimated to be 4510 L, considering that the weight of one T-shirt is 250 g [48]. Among the total water footprint, green, blue and grey water footprints were found to be 1598 L, 1639 L and 1273 L, respectively (Figure 12). This calculation was made without considering ETP and STP. If ETP and STP are considered, grey water footprint for one T-shirt is reduced to 1026 L.

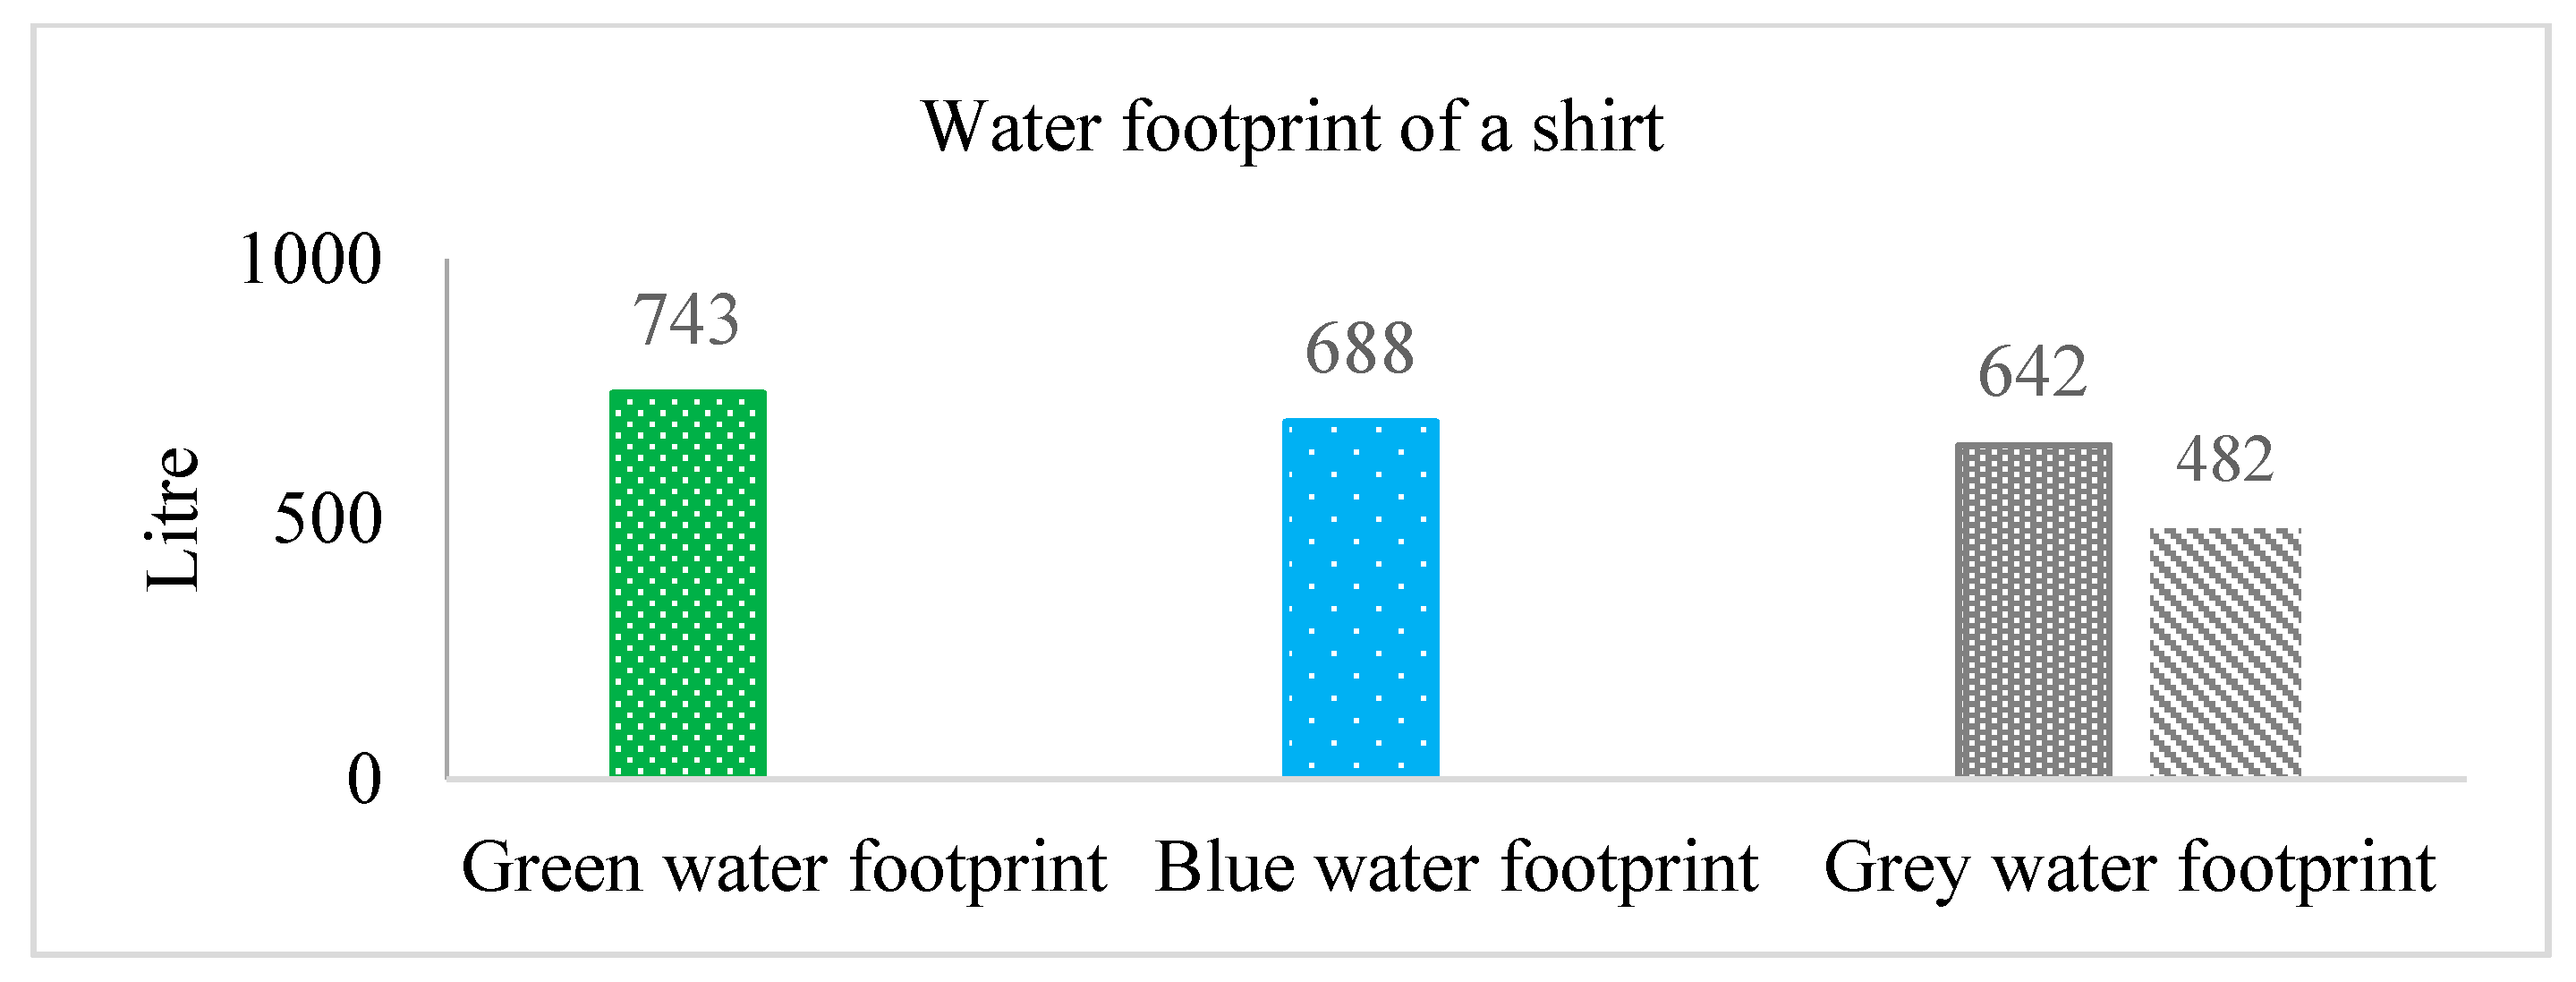
3.6.2. Water Footprint for a Shirt

Water footprint of a shirt was estimated at 2194 L, considering weight of one shirt is 150 g [48]. Among the total water footprint, green, blue and grey water footprints were found to be 743 L, 696 L and 642 L, respectively (Figure 13). This calculation was made without considering ETP and STP. If ETP and STP are considered, the grey water footprint for one shirt is reduced to 482 L.

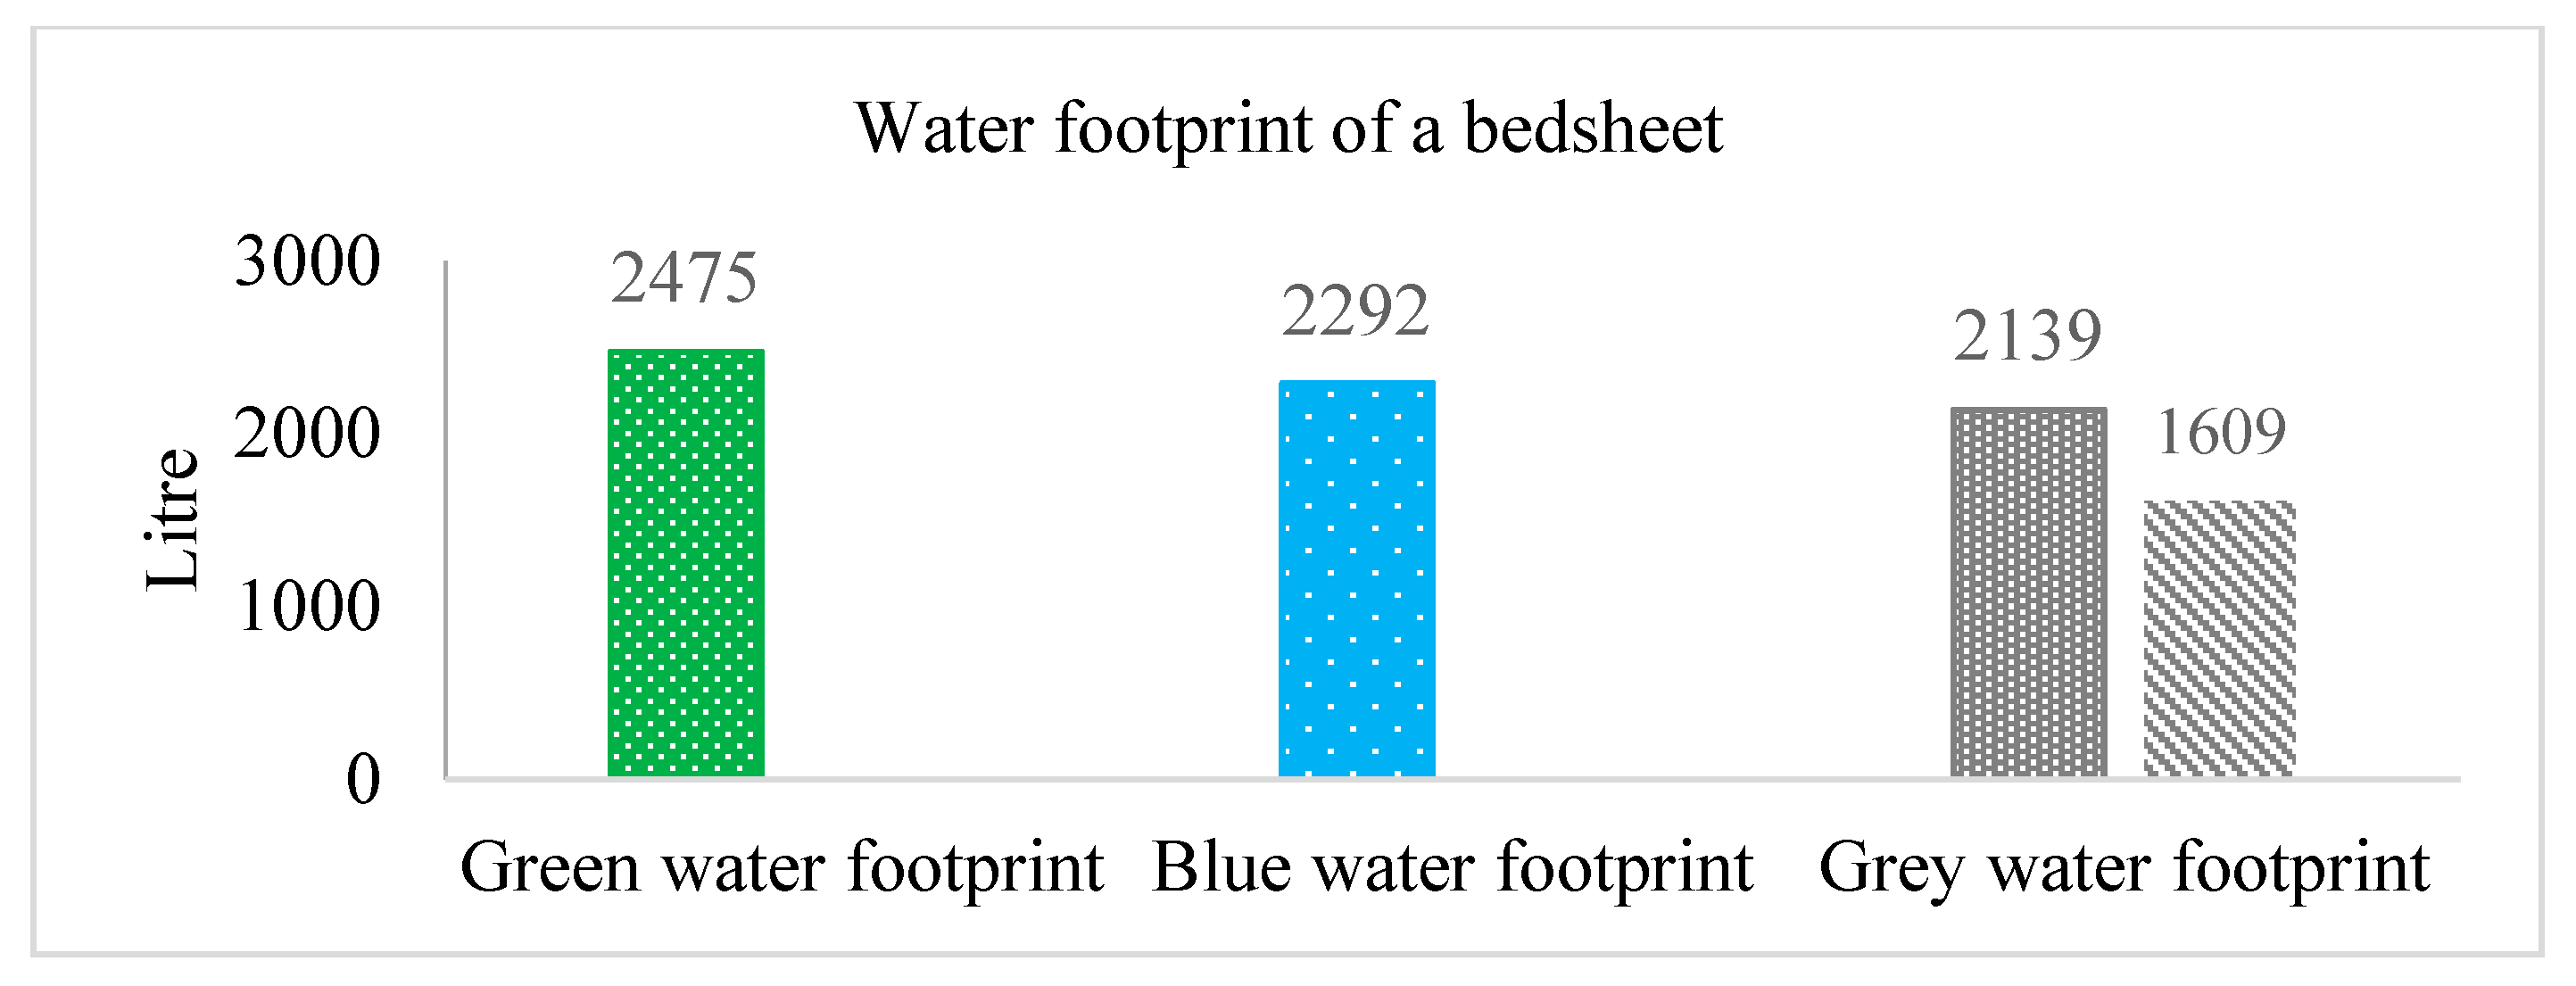
3.6.3. Water Footprint for a Single Bedsheet

Water footprint of a single bedsheet was estimated to be 7312 L, considering the weight of a single bedsheet is 500 g [49]. Among the total water footprint, green, blue and grey water footprints were found to be 2475 L, 2292 L and 2139 L, respectively (Figure 14). This calculation was made without considering ETP and STP. If ETP and STP are considered, the grey water footprint for a single bedsheet is reduced to 1609 L.

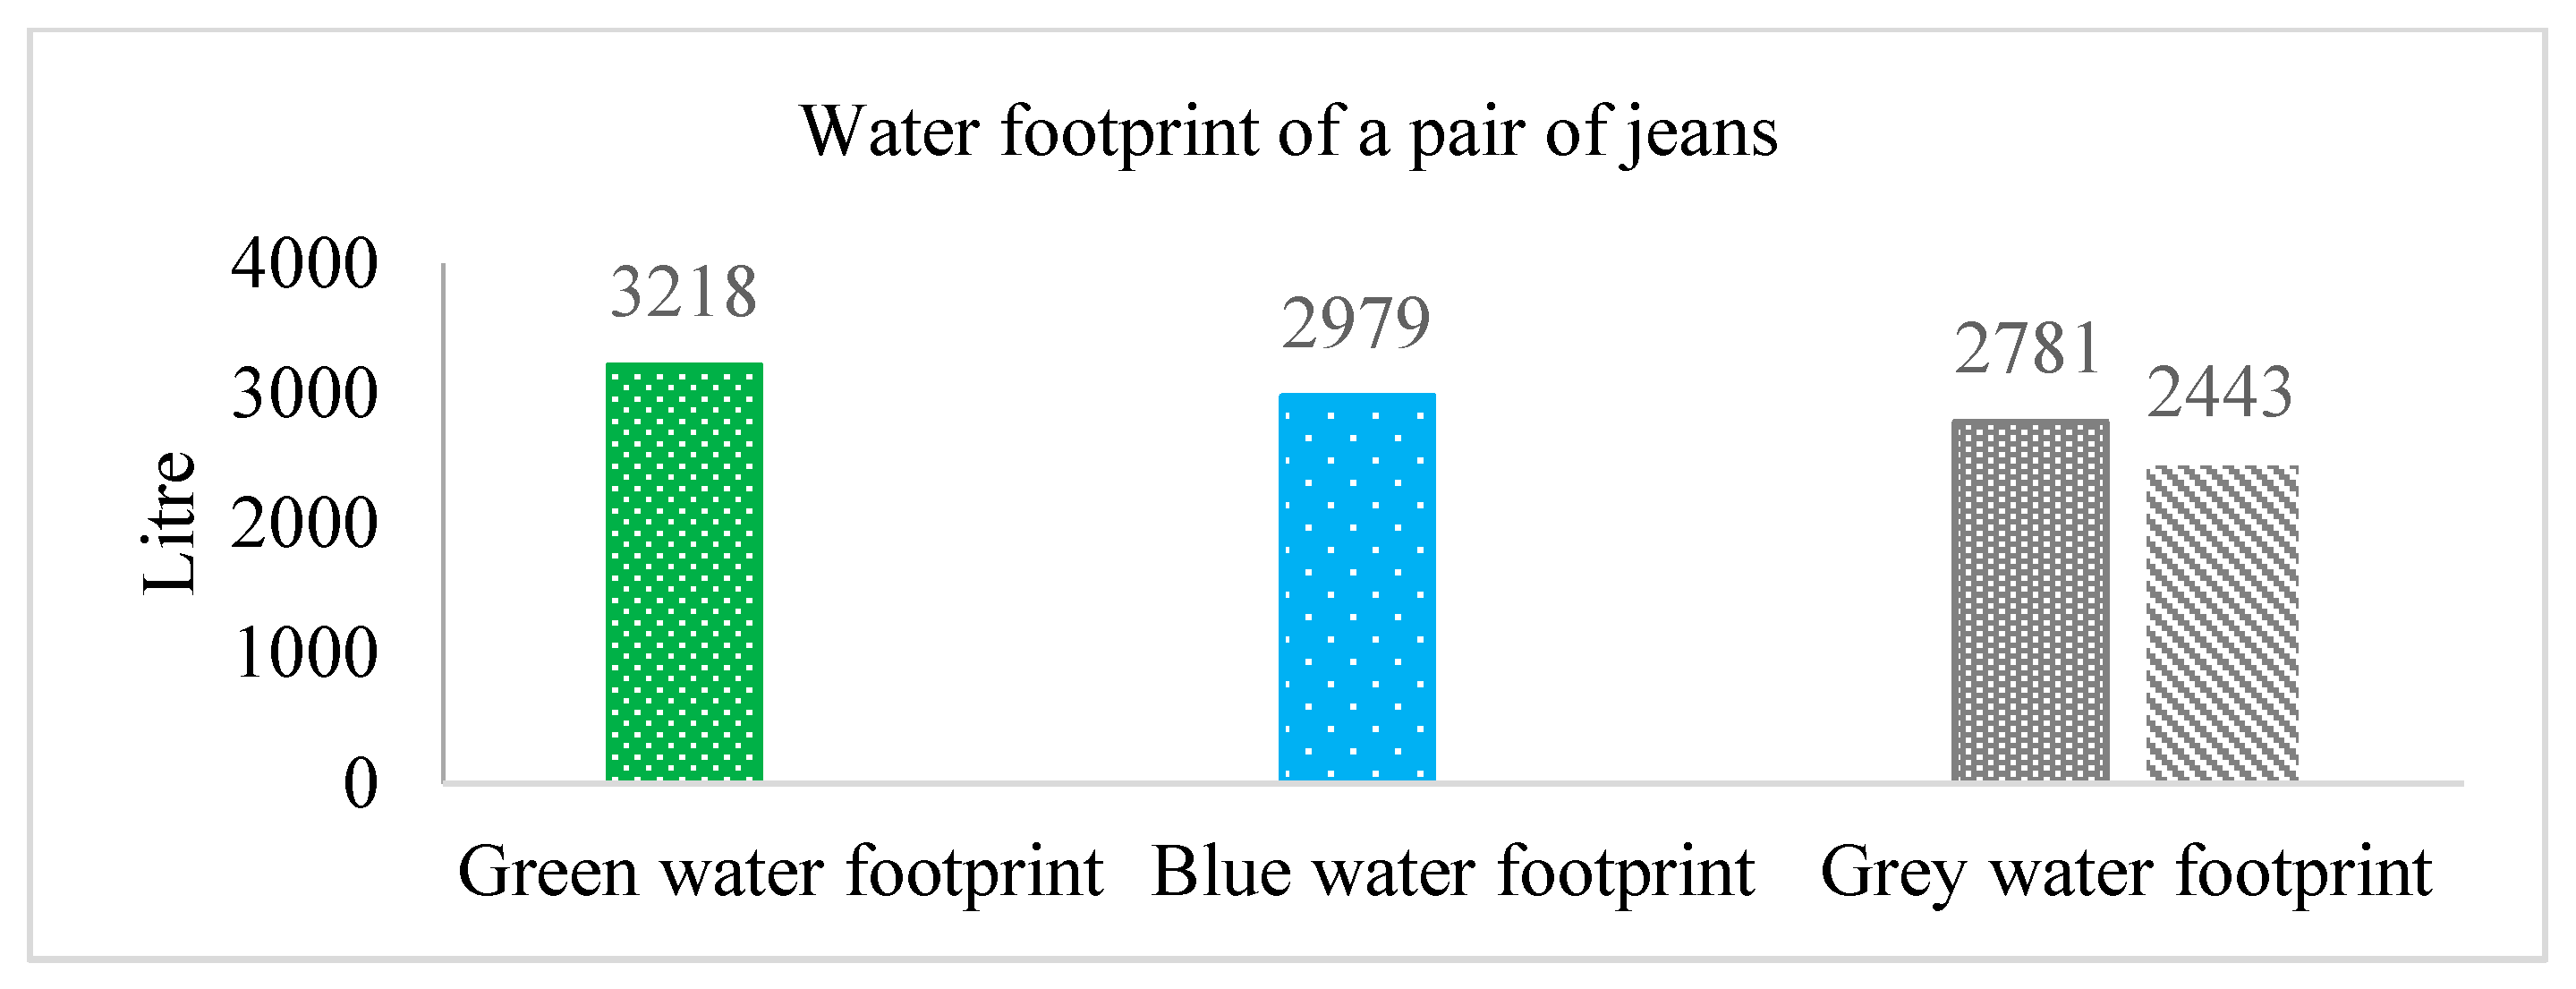
3.6.4. Water Footprint for a Pair of Jeans

Water footprint of a pair of jeans was estimated to be 9506 L, considering the weight of a pair of jeans is 650 g [48]. Among the total water footprint, green, blue and grey water footprints were found to be 3218 L, 2979 L and 2781 L, respectively (Figure 15). This calculation was made without considering ETP and STP. If ETP and STP are considered, grey water footprint for a pair of jeans is reduced to 2443 L.

4. Discussion

4.1. Cotton Cultivation

A large amount of water is being used for cotton production in every year, which is quantified by water footprint calculation (Figure 3d). To reduce this water consumption, farmers are trying to adopt new technologies. Organic cotton farming is gaining popularity because of the elimination of toxic pesticide use, reduction of water consumption in cotton farming, and reduction of blue water footprint up to 63 percent [50,51]. The main producers of organic cotton are India, China, Turkey and Kyrgyzstan. One of the drawbacks of organic cotton farming is high labor requirements for manual weeding. However, it might be an opportunity for developing countries like Bangladesh to create employment opportunities for its large population [52].
Bangladesh mainly imports raw cotton to meet its textile demand. However, cotton production in Bangladesh is increasing daily to fulfill the growing raw material demand of the RMG sector and reduce the import load. Therefore, it is time for Bangladesh to look for organic farming and smart irrigation systems to reduce water consumption in cotton cultivation. The main challenges of organic cotton production in Bangladesh are lack of training facilities for farmers, land scarcity and an unstable world market [53]. Government and stakeholders need to come forward to initiate the sustainable cotton farming and take necessary steps to overcome these challenges.

4.2. Textile Industry

The textile sector is the backbone of Bangladesh’s economy. However, the industry is faced with many challenges due to high resource (energy, water and chemical) footprint and consequent environmental impact [54]. Around 180 million m3 of water is consumed by textile industries annually, and water consumption will increase with the increasing demand of RMG production. Total water footprint for cotton product was found to be 15,748 L for per kg product, which is close to the previously done study for global water footprint for cotton products [55].
In 2021, textile production will increase around 1.6 times, which will consume and pollute more water [25]. Increasing wastewater volume results in increasing water footprint (both blue and grey water footprint) and lowers the level of the water table. It has been reported that in Dhaka city, groundwater levels dropped more than 60 m over the last 50 years and these levels continue to decline at a high rate [56]. Groundwater helps in supporting overlying rock and soil; once the water table drops, gradual settling of the land may occur, a phenomenon known as land subsidence [57]. From 2012 to 2016, blue water footprint (water consumption) and grey water footprint (water pollution) in the textile industry increased around 21% and 23%. Grey water footprint associated with chemical production and consumption was not considered in this study. Considering those parameters will further increase the grey water footprint.
According to a recent study, textile industries near the Shitalakkhya River discharge their untreated dye with heavy metals into the river [58]. By consumption and using this polluted water in bathing, washing and household work, the marginal people who are living on the bank of the Shitalakkhya River, especially children, are prone to different types of water borne diseases, viz., nausea, skin sores, irritation in respiratory tract [12], typhoid, dysentery, cholera, viral hepatitis etc. and loss of life [58]. Inland water bodies affect climate at the regional scale through exchange of heat and water with the atmosphere [59]. In addition, they play a substantial role in the global carbon (C) cycle and thus potentially affect climate as well [60].
In addition, excessive groundwater extraction and inconsistent rainfall caused by climate change may increase the salinity of groundwater and soil [61], and further affect aquatic ecosystems and reduce the productivity of crops and aquatic life. Therefore, it is important to treat, recycle and reuse industrial wastewater to minimize groundwater extraction and relevant water footprint. Implementation of zero liquid discharge (ZLD) in the textile industry will contribute significantly to reduce water footprint in the textile industry.
A ZLD system involves a range of advanced wastewater treatment technologies to recycle, recovery and reuse of the "treated" wastewater, and thereby ensure there is no discharge of wastewater to the environment. A typical ZLD system comprises the following components [62]: (i) pretreatment, (ii) reverse osmosis and (iii) evaporator and crystallizer. One of the major problems of ZLD is disposal of solid waste that will be generated. The problem can be solved by using the solid waste in other industries or by developing ZLD technologies that will generate lower solid waste or, no solid waste [63]. The high cost of operation of a ZLD is also a major challenge. The recovery of water and salt offsets these costs significantly [54].
Bangladesh DoE (Department of Environment) recently issued a zero liquid discharge (ZLD) regulation to deal with the problem of effluent, mandating all textile mills to install zero liquid discharge effluent treatment plant (ZLD–ETP) systems. The initiative is focused on incorporating learning from best practices, technologies and policy initiatives to support effective implementation of the ZLD mandate in Bangladesh [64].
Figure 16 shows water footprint before and after the implementation of ZLD. It was considered that 5% of effluent water from the textile industry is lost in the treatment process and the rejection from the RO is further treated in evaporator to separate the salt from the liquid. From the figure, it can be seen that after implementation of ZLD, blue water footprint will decrease around 72% and grey water footprint will decrease around 88% for per kg textile product (considering no liquid discharge and only 5% of effluent water being lost in the process). This huge decrease in water usage and pollution can protect the environment and aquatic life from further pollution and extinction, respectively.

5. Conclusions

Water footprint calculation is a useful tool for the identification of relevant water consumption and pollution. In this study, annual water footprint of apparel products was calculated from the supply chain to final product in the garments. About one-third of water footprint in RMG sector is related to the pollution. This is due to the high amount of water pollution during cotton cultivation and textile operation.
Around 91% of total water footprint of RMG production is associated with cotton cultivation, which is mostly external water footprint. Total water footprint of cotton cultivation was found to be 25 billion m3. This large water footprint indicates the importance of organic cotton farming, which can reduce water and fertilizer consumption during cotton cultivation. Cotton produced in India, East and West Africa and Bangladesh is less dependent on irrigated water (more dependent on green water) due to cultivation in rainfed condition, whereas most cotton in Uzbekistan, USA, Pakistan, Australia, Egypt, Turkmenistan and China is grown under irrigated condition (more dependent on blue water). The amount of irrigated water in these countries can be reduced by adopting organic farming. In cotton cultivation, water pollution (grey water footprint) can be reduced by reducing use of fertilizer.
In the textile industry, the grey water footprint was found to be around 91% of total water footprint in textile industry, which is quite alarming for the country as around 99.5% water footprint in the textile industry is internal water footprint. This will severely affect the aquatic system, public health and surrounding environment. It is important to treat textile effluents and reuse the treated water. It can reduce water extraction, water footprint and water stress, and protect the aquatic ecosystem. If it is considered that textile industries are running their ETPs, grey water footprint will be less for the industries running ETP. But in most of the cases, ETPs are not properly operated in the industries.
The results and analysis show the RMG sector’s current scenario in terms of amount of rainwater used, groundwater extraction and water pollution. This study will be highly useful for the government, funding agencies, industry management and technologists to make strategic policies and adopt appropriate technologies to reduce water footprint for the sustainable growth in the Bangladesh apparel sector.

Author Contributions

L.H. contributed in conceptualizing the study and carried out literature review, investigation, methodology development, calculation, drafting and finalizing the manuscript. M.S.K. conceived the study, supervised the research project and manuscript preparation, contributed in writing, and reviewed, edited and finalized the manuscript. All authors have read and agreed to the published version of the manuscript.

Funding

BCEF Academic Research Fund, BUET CASR Research Fund, and ESTex Research Funding.

Acknowledgments

The authors would like to express gratitude to Cotton Development Board (CDB), Bangladesh Cotton Association (BCA), Bangladesh Garment Manufacturers and Exporters Association (BGMEA) and local industries for their support and valuable suggestions in conducting the study. This research was supported by Environmental Sustainability through Enhancing Local Capacity in Textile Chemical and Waste Management program (ESTex; www.estexbd.com) of the Department of Chemical Engineering, BUET, BCEF Academic Research Fund and CASR Research Fund. The authors wish to express her thanks and gratitude to the Environmental Laboratory assistants of Chemical Engineering Department of BUET for their assistance during the experimental work. The author would also like to acknowledge Shariful Hoque (Environment Sustainability Manager, H&M), Sumit Kanti Sarker (Ex Sustainability Developer–Environment, H&M) and Muradur Rashedin (Environmental Specialist, H&M) for their assistance in carrying out the study.

Conflicts of Interest

The authors declare no conflict of interest.

Appendix A

Table A1. Percentage of imported cotton from different countries [65,66,67].
CountryImported Cotton (%)
20122013201420152016
Uzbekistan2625201313
India3740405050
East and West Africa713131818
Turkmenistan113322
USA57733
Australia63544
Egypt22333
Brazil23444
Pakistan44533
Table A2. Percentage of imported cotton yarn from different countries [68].
CountryImported Cotton Yarn (%)
20122013201420152016
India75.4969.0466.1669.2266.59
China15.0922.2325.8922.6823.89
Pakistan8.637.597.097.337.11
USA0.060.150.170.140.65
Uzbekistan0.390.690.330.111.21
Egypt0.320.290.370.520.54
Table A3. Percentage of imported cotton woven fabric from different countries [68].
CountryImported Cotton Woven Fabric (%)
20122013201420152016
India14.4213.6311.7614.079.48
China73.2072.1370.0571.1164.38
Pakistan12.1514.2017.9714.2425.33
USA0.180.040.180.570.29
Brazil0.030.0040.030.0010.51
Table A4. Amount of imported cotton, cotton yarn and cotton woven fabric for the five years from 2012 through 2016 [68,69].
YearCotton (Metric ton)Cotton Yarn (Metric ton)Cotton Woven Fabric (Metric ton)
20121,088,623231,901203,793
20131,153,940236,133228,761
20141,175,712247,783255,686
20151,349,892264,432265,830
20161,371,665280,044294,335
Table A5. Seed cotton yield for different cotton importing countries [70].
CountrySeed Cotton Yield (ton/ha)
20122013201420152016
Uzbekistan2.64472.56822.61332.59852.6133
India1.51741.61651.61021.61101.6201
East and West Africa1.00031.02121.02101.02001.024
Turkmenistan1.14291.03631.03641.03501.0300
USA2.72512.49972.58862.58952.5800
Australia4.95675.53155.47835.47945.5000
Egypt2.94263.61223.38593.3993.4000
Brazil3.59583.62013.75133.80013.8501
Pakistan2.21132.27242.30212.33012.3500
China3.20003.24713.29413.30003.3101

Appendix B

Appendix B.1. Blue and Green Water Footprint Calculation Procedure for Cotton Cultivation

In the CROPWAT 8.0 model, the reference evapotranspiration (ETo) was estimated on the basis of the Penman–Monteith formula [71], which needs minimum and maximum temperature, rainfall, relative humidity, wind speed and sunshine hours for a region. Crop evapotranspiration (ETa) which is the amount of water lost through the process of evaporation (from soil surface) and transpiration (from plant tissues) from a crop, grown in a large field, under a given climatic condition is estimated by first calculating reference ETo. Then ETo is adjusted by a crop-specific crop coefficient function, Kc, which accounts for specific crop and growth-stage conditions [72]. The FAO Penman–Monteith equation (Equation (A1)) determines the evapotranspiration from the hypothetical grass reference surface and provides a standard to which evapotranspiration in different periods of the year can be related. CLIMWAT, a climatic database, was used to collect climate data for different regions under considerations. Climate data for few regions that were not available in CLIMWAT were collected from the website.
ET o = 0.408 Δ ( R n G ) + γ 900 T + 273 u 2 ( e s e a ) Δ + γ ( 1 + 0.34 u 2 )
where
  • ETo = reference evapotranspiration (mm/day),
  • Rn = net radiation at the crop surface (MJ/m2/day),
  • G = soil heat flux density (MJ/m2/day),
  • T = mean daily air temperature at 2 m heights (°C),
  • u2 = wind speed at 2 m height (m/s),
  • es = saturation vapor pressure (kPa),
  • ea = actual vapor pressure (kPa),
  • Δ = slope of saturation vapor pressure curve (kPa/°C) and
  • a = psychrometric constant (kPa/°C)
The calculations take into account a dynamic soil water balance and the “irrigation schedule option” of the model was used. When running the model, for rainfed condition in cotton cultivation, “nonirrigation (rainfed)” was chosen; in case of irrigated cotton cultivation, the option “irrigate at critical depletion; refill soil to field capacity” was chosen. Figure 1 in the main manuscript represents flow diagram for major steps of CROPWAT 8 to calculate crop water evapotranspiration. The calculated crop evapotranspiration in mm is converted to crop water use (CWU) in m3/ha by applying the factor 10 [22].
Bangladesh imports cotton, cotton yarn and cotton woven fabric from different countries. In this study, CWUblue and CWUgreen were calculated for the studied regions in different countries for both irrigated and rainfed conditions. CWUblue for cotton cultivation in a country was calculated individually for irrigated and rainfed conditions by doing weighted average of the regionwise CWUblue values. Percentage of cotton grown in different regions of different countries is described in Table A6 and Table A7. Then from the percentage of cotton cultivation condition (irrigated/rainfed) (Table A8) in a country, CWUblue for cotton cultivation was calculated. For some countries, the percentage of cotton production in different regions was not available. In that case, an arithmetic average was done to calculate CWUblue for cotton cultivation. CWUgreen was calculated using the same procedure as CWUblue.
The blue and green water footprints were calculated as crop water use (CWU) per crop yield, as shown in the formulas [22]:
Blue   water   footprint ,   volume / mass = Crop   water   use   ( CWU blue ) Seed   cotton   yield
Green   water   footprint ,   volume / mass = Crop   water   use   ( CWU green ) Seed   cotton   yield
Table A6. Percentage of cotton grown in different regions of India, East and West Africa, Uzbekistan, Brazil, Turkmenistan, Egypt and China [73,74,75].
CountryRegionsPercentage
IndiaGujarat30
Maharashtra23
Punjab2
Andhra Pradesh and Telegana25
Karnataka6
Haryana4
Tamil Nadu1
Rajasthan5
Madhya Pradesh6
West and East AfricaBurkina Faso19
Benin15
Mali22
Senegal3
Cote d’Ivoire14
Nigeria9
Togo7
Uganda3
Tanzania7
UzbekistanSamarkand, Kashkadar, Dzhiak36
Bukhara14
Fergana11
Khorezm, Karnapak18
Andizhan11
Tashkent10
BrazilMato Grosso44
Bahia23
Goias13
Sao Paulo6
Mato Grosso do Sul6
Minas Gerais4
Parana3
TurkmenistanAhal50
Mary50
EgyptCairo33
Alexandria33
Asswan33
ChinaUrumqi100
Table A7. Percentage of cotton grown in different regions of Bangladesh, USA, Pakistan and Australia [76,77,78].
CountryRegionsPercentage
BangladeshFaridpur20
Jessore20
Mymensingh20
Khulna20
Dinajpur20
USATexas65
Georgia23
California11
PakistanPunjab75
Sindh25
AustraliaNew South Wales70
Queensland30
Table A8. Cotton cultivation condition (irrigated/rainfed) for different countries [79,80,81,82,83,84,85,86,87,88,89].
CountryIrrigatedRainfed
Uzbekistan1000
India3565
East and West Africa199
USA7525
Pakistan1000
Brazil5050
Australia9010
Egypt1000
Turkmenistan1000
China982
Bangladesh298

Appendix C

Appendix C.1. Crop Data

The cotton plant undergoes a series of stages during its development from latent seed to the production of mature bolls [90]. In CROPWAT, the whole cotton growing season is divided into four stages: (i) initial, (ii) development, (iii) mid season and (iv) late season. Water requirement by the plant in different stages is different. Crop coefficient function, Kc is required to relate the reference evapotranspiration with the actual evapotranspiration, which accounts for specific crop and growth-stage conditions [72]. There are also some other parameters (rooting depth, critical depletion fraction, yield response fraction and crop height) required to calculate water requirement of a cotton plant. The response of yield to water supply is quantified through the yield response fraction (Ky), which relates relative yield decrease to relative evapotranspiration deficit. The critical depletion fraction represents the critical soil moisture level when first drought stress occurs, affecting crop evapotranspiration and crop production [30]. Crop data used to calculate crop water evapotranspired are described in Table A9.
Table A9. Crop data used in CROPWAT to calculate crop water use (CWU) [29,91].
Crop ParameterInitialDevelopmentMid SeasonLate SeasonTotal
Crop coefficient, Kc 0.35-1.150.75-
Stage (days)30505545-
Rooting depth (m)0.3-0.9--
Critical depletion fraction0.6-0.60.6-
Yield response fraction, Ky0.50.50.60.31.5
Crop height (m)--1--

Appendix C.2. Soil Data

Bangladesh imports cotton, cotton yarn and cotton fabric mainly from Uzbekistan, India, East and West Africa, Turkmenistan, USA, Australia, Egypt, Brazil, Pakistan and China. For calculation purposes, soil type and cotton planting season of different regions of these countries are evaluated, which are described in Table A10, Table A11, Table A12 and Table A13.
Table A10. Soil type and cotton planting season of different states of India [92,93,94,95,96,97,98,99,100,101,102,103,104,105,106,107,108,109,110,111,112,113,114,115,116,117,118,119,120,121].
CountryStateCitySoil TypePlanting Season
IndiaGujaratAhmadabadSandy loamJune–July
BharuchSandy loam
RajkotBlack cotton
BhavnagarBlack cotton
SurendranagarMedium black
MaharashtraJalagonBlack cottonJune–July
AkolaBlack cotton
AurangabadDeep and medium black
AhmednagarDeep and medium black
AmravatiDeep and medium black
PunjabLudhianaSandyApril
FaridkotSandy
Andhra PradeshKurnoolRed earth and black cottonJuly–August
AnantapurStony red
GunturBlack cotton
PrakasamRed
KarnatakaRaichurMixed red and blackJune–August
BellaryDeep black
GulbargaBlack cotton
BijapurBlack cotton
HariyanaHisarBlack cottonApril–May
JindSandy loam
Tamil NaduCoimabatoreBlack cotton, loamy, clayeyAugust–September
MaduraiBlack cotton, Loam and clay loam
SalemRed sandy
RajasthanSri GanganagarMedium blackApril–May
AjmerMedium black, red sandy loam
Madhya PradeshSanawadBlack cottonJune–July
KhargoneBlack cotton
Table A11. Soil type and cotton planting season of different cotton producing states of East and West Africa [122,123,124,125,126,127,128,129,130,131,132,133,134,135,136,137,138,139,140,141,142,143,144,145,146,147].
Region of African ContinentCountryCitySoil TypePlanting Season
West AfricaBurkina FasoBoboLoamy sand, clay loamMay–June
BoromoLoamy sand, clay loam
Fada N’GourmaLoamy sand, clay loam
OuagadougouLoamy sand, clay loam
BeninParakouSilty clay loamMay–June
NattingouSilty clay loam
BohiconSilty clay loam
KandiSilty clay loam
MaliBamakoSandy loamJune–July
SegouSandy loam
SikassoSandy loam
SenegalKedougouMediumJune–July
ZiguinchorMedium
KoldaMedium
Cote d’IvoireKorhogoSandyMay–July
FerkessedougouSandy
NigeriaKatsinaReddish brownMay–June
KadunaReddish brown
KanoReddish brown
BauchiReddish brown
TogoLoamSandy loam, silty loamMay
UgandaGuluSandy, sandy loamMay–June
KitgumSandy, sandy loam
LiraSandy
MasindiSandy, sandy loam
MbaleSandy loam
East AfricaTanzaniaSimiyu BariadiSandy clay, clayeyDecember
ShinyangaShallow red clay, shallow black cotton
MwanzaSandy
Table A12. Soil type and cotton planting season of different cotton producing states of Uzbekistan, Brazil, Turkmenistan, Egypt, China and Bangladesh [146,148,149,150,151,152,153,154,155,156,157,158,159,160,161,162,163,164,165,166,167,168,169,170,171,172].
CountryCitySoil TypePlanting Season
UzbekistanBukharaSilty clay loamMarch–April
FerganaSilty clay loam
KhorezmHard and loamy
AndizhanSandy loam
TashkentSilty clay loam
SamarkandSilty clay loam
KashkadarSilty clay loam
DzhiakSilty clay loamNovember–January
BrazilMato GrossoSandy loam
BahiaSandy loam
GoiasClay
Sao PauloSandy loam
ParanaClay
Mato Grosso do SulClay
Minas GeraisClay
TurkmenistanAhalSandy desertMarch
MarySandy desert
EgyptCairoAlluvialSeptember–November
AlexandriaAlluvial
AsswanAlluvial
ChinaUrumqiSilt loamMarch–May
BangladeshFaridpurClay loamMay–June
JessoreClay loam
KhulnaSandy loam
MymensinghSandy loam
DinajpurSandy loam
Table A13. Soil type and cotton planting season of different cotton producing states of USA, Pakistan, Australia [77,78,173,174,175,176,177,178,179,180,181,182,183,184,185,186,187].
CountryStateCitySoil typePlanting Season
USATexasAmarilloLoamy sand, loamyMay–June
LubbockClayey
El PasoClay loam
AbileneSandy loam, loamy
GeorgiaMacon LewisLoamy sandMarch–May
SavannahLoamy sand
CaliforniaFresnoSandy loamMarch
PakistanPunjabBahawalpurLaomMay–June
Rahimyar KhanClay loam
Multan
SindhSangharSandy clay loamMarch–April
KhairpurSandy clay loam
GhotkiSandy clay loam
AustraliaNew South WalesNamoiClaySeptember–October
Macquarie ValleyClay
QueenslandSt. GeorgeClaySeptember–October
Water footprint varies for different types of soils as total available moisture content, maximum infiltration rate, maximum rooting depth and initial available moisture content vary for different types of soils. Soil information for different types of soils is presented in Table A14.
Table A14. Soils information for water footprint calculation [188].
Soil TypeTotal Available Moisture, mm/mMaximum Infiltration Rate, mm/dayMaximum Rooting Depth, cmInitial Available Moisture, mm/m
Light soil60409060
Medium soil2904090290
Heavy soil2004090200
Red sandy1003090100
Red loamy1803090180
Red sandy loam1403090140

Appendix D

Appendix D.1. Fertilizer Application Rate

The grey water footprint of cotton cultivation depends on the amount and kind of fertilizer used during cotton cultivation. Table A15 represents average fertilizer application rate for different cotton producing countries.
Table A15. Average fertilizer application for difference countries [36,189].
CountryAverage Fertilizer Application Rate, kg/Ha
N
Uzbekistan210
India66
East and West Africa35
USA120
Pakistan180
Brazil40
Australia121
Egypt54
Turkmenistan210
China120
Bangladesh130

Appendix E

Table A16. Percentage of raw cotton, cotton yarn and cotton woven fabrics in knit and woven fabric manufacturing [24,38,40].
Raw MaterialKnit Fabric (%)Woven Fabric (%)
Imported raw cotton5738
Domestically produced raw cotton5738
Imported cotton yarn4060
Imported cotton woven fabric0100

Appendix F

Table A17. Pollution load concentration in groundwater, surface water and ambient water quality standard [190,191].
Type of Pollution LoadActual Concentration
in Groundwater, cact (ppm)
Natural Concentration
of Surface Water, cnat (ppm)
Ambient Water
Quality Standard, cmax (ppm)
BOD3550
COD1015200

Appendix G

Table A18. Number of farmers/workers involved in cotton cultivation and different stages of textile industry, which was collected from local industries.
Stages in Textile IndustryNumber of Workers
No. of farmers8/acre
Yarn manufacturing40/ton
Yarn dyeing30/ton
Fabric manufacturing100/3 ton
Fabric washing100/13.5 ton
Fabric dyeing, printing and finishing10/ton
Water KPI, L/day30/person
Water abstract (intake), L/day31.5/person

Appendix H

Table A19. Time required to travel from different countries to Bangladesh by ship [192].
CountryTime (Traveled by Sea): Days
Uzbekistan22.58
India-
East and West Africa27.88
USA23.5
Pakistan4.54
Brazil22.83
Australia8.46
Egypt7.96
Turkmenistan23.5
China6.88

References

  1. Islam, M.M.; Khan, A.M.; Islam, M.M. Textile Industries in Bangladesh and Challenges of Growth. Res. J. Eng. Sci. 2013, 2278, 9472. [Google Scholar]
  2. Uddin, M. RMG Industry as the Major Employment Sector. 2019. Available online: https://www.thedailystar.net/supplements/28th-anniversary-supplements/entrepreneurship-key-youth-employment/news/rmg-industry-the-major-employment-sector-1702951 (accessed on 15 March 2017).
  3. Natasha, R.Y.C.; Jeny, U.M. Design & Product Development (DPD) Expansion: Key Factors for Sustainable Growth of RMG Sector’s in Bangladesh. 2018. Available online: https://www.researchgate.net/publication/328333897_Design_Product_Development_DPD_Expansion_Key_factors_for_sustainable_growth_of_RMG_Sector%27s_in_Bangladesh (accessed on 1 October 2020).
  4. Khan, M.S.; Selim, S.; Evans, A.E.; Chadwick, M. Characterizing and Measuring Textile Effluent Pollution using a Material Balance Approach: Bangladesh Case Study. In Proceedings of the 9th International Conference on Mechanical Engineering (ICME), Dhaka, Bangladesh, 18–20 December 2011. [Google Scholar]
  5. Khan, M.S.; Knapp, J.; Clemett, A.; Chadwick, M.; Mahmood, M.; Sharif, M.I. Managing and Monitoring Effluent Treatment Plants; Managing Industrial Pollution from Small and Medium Scale Industries in Bangladesh Booklet Series; SEI, BCAS, University of Leeds Dhaka: Dhaka, Bangladesh, 2006. [Google Scholar]
  6. Islam, M.; Chowdhury, M.; Billah, M.; Tusher, T.; Sultana, N. Investigation of Effluent Quality Discharged from The Textile Industry of Purbani Group, Gazipur, Bangladesh and Its Management. Bangladesh. J. Environ. Sci. 2012, 23, 123–130. [Google Scholar]
  7. Haque, F.; Khandaker, M.M.R.; Chakraborty, R.; Khan, M.S. Identifying Practices and Prospects of Chemical Safety and Security in the Bangladesh Textiles Sector. J. Chem. Educ. 2020, 97, 1747–1755. [Google Scholar] [CrossRef]
  8. Dey, S.; Islam, A. A Review on Textile Wastewater Characterization in Bangladesh. Res. Environ. 2015, 5, 15–44. [Google Scholar]
  9. El-Gohary, F.; Tawfik, A.; Mahmoud, U. Comparative Study Between Chemical Coagulation/Precipitation (C/P) Versus Coagulation/Dissolved Air Flotation (C/DAF) for Pre-Treatment of Personal Care Products (PCPs) Wastewater. Desalination 2010, 1, 106–112. [Google Scholar] [CrossRef]
  10. Nergis, Y.; Sharif, M.; Akhtar, N.; Hussain, A. Quality Characterization and Magnitude of Pollution Implication in Textile Mills Effluents. J. Qual. Technol. Manag. 2009, 5, 153–161. [Google Scholar]
  11. Rott, U.; Minke, R. Overview of Wastewater Treatment and Recycling in the Textile Processing Industry. Water Sci. Technol. 1999, 40, 137–144. [Google Scholar] [CrossRef]
  12. Sultana, M.S.; Islam, M.S.; Saha, R.; Al-Mansur, M. Impact of the effluents of textile dyeing industries on the surface water quality inside DND embankment. Narayanganj. Bangladesh J. Sci. Indust. Res. 2009, 44, 65–80. [Google Scholar] [CrossRef] [Green Version]
  13. Ali, M.; Ahmed, S.; Khan, M. Characteristics and Treatment Process of Wastewater in a Nylon Fabric Dyeing. Plant. J. Chem. Eng. 2005, 23, 17–22. [Google Scholar] [CrossRef] [Green Version]
  14. Restiani, P. Water Governance Mapping Report: Textile Industry Water Use in Bangladesh; Stockholm International Water Institute (SIWI) and Sweden Textile Water Initiative (STWI): Stockholm, Sweden, 2016. [Google Scholar]
  15. Anas, A. Textile Plants are Dhaka’s Water Problem and also its Solution. 2015. Available online: http://citiscope.org/story/2015/textile-plants-are-dhakas-water-problem-and-also-its-solution (accessed on 16 July 2017).
  16. Ahmad, Z. Study on Groundwater Depletion and Land Subsidence in Dhaka City. Master’s Thesis, Bangladesh University of Engineering & Technology (BUET), Dhaka, Bangladesh, 2006. [Google Scholar]
  17. Nevill, J.C.; Hancock, P.J.; Murray, B.R.; Ponder, W.F.; Humphreys, W.F.; Phillips, M.L.; Groom, P.K. Groundwater-dependent Ecosystems and the Dangers of Groundwater Overdraft: A Review and an Australian Perspective. Pacific Conserv. Biol. 2010, 16, 187–208. [Google Scholar] [CrossRef]
  18. Hoekstra, A.Y.; Chapagain, A.K.; Van Oel, P.R. Advancing Water Footprint Assessment Research: Challenges in Monitoring Progress towards Sustainable Development Goal 6. Water 2017, 9, 438. [Google Scholar] [CrossRef] [Green Version]
  19. Hoekstra, A.Y. Virtual water trade. In Proceedings of the International Expert Meeting on Virtual Water Trade, Delft, The Netherlands, 12–13 December 2002. [Google Scholar]
  20. Falkenmark, M.; Rockström, J. Balancing Water for Humans and Nature: The New Approach in Ecohydrology; Earthscan: Sterling, VA, USA, 2004. [Google Scholar]
  21. Watson, N. Globalization of Water: Sharing the Planet’s Freshwater Resources–By Arjen Y Hoekstra and Ashok K Chapagain. Area 2011, 43, 116–117. [Google Scholar] [CrossRef]
  22. Hoekstra, A.Y.; Chapagain, A.K.; Aldaya, M.M.; Mekonnen, M.M. The water footprint assessment manual. In Setting the Global Standard; Earthscan: London, UK, 2011. [Google Scholar]
  23. LeBlanc, R. Water Footprint and Its Growing Importance. Available online: https://www.thebalance.com/water-footprint-and-its-growing-importance-2878071 (accessed on 16 July 2017).
  24. USDA. Gain Report. Bangladesh Cotton and Products Annual. 2017. Available online: https://www.fas.usda.gov/data/bangladesh-cotton-and-products-annual-1 (accessed on 2 August 2017).
  25. Hossain, L.; Sarker, S.K.; Khan, M.S. Evaluation of present and future wastewater impacts of textile dyeing industries in Bangladesh. Environ. Dev. 2018, 26, 23–33. [Google Scholar] [CrossRef]
  26. Emerging Textiles.com. India Yarn Prices: Domestic and Export Markets. 2017. Available online: http://www.emergingtextiles.com/?q=art&s=170118-india-spun-yarn-market-prices&r=free&i=samplearticle (accessed on 3 August 2017).
  27. Emerging Textiles.com. China Yarn Prices: Domestic and Import Markets. 2017. Available online: http://www.emergingtextiles.com/?q=art&s=170228-yarn-market-price-china&r=free (accessed on 3 August 2017).
  28. Sikirica, N. Water Footprint Assessment Bananas and Pineapples; Dole Food Company, Soil & More International: Driebergen, The Netherlands, 2011; Volume 41. [Google Scholar]
  29. Food and Agriculture Organization. Chapter 6: ETcSingle Crop Coeficient (Kc). Available online: http://www.fao.org/docrep/X0490E/x0490e0b.htm (accessed on 3 August 2017).
  30. Food and Agriculture Organization. Land & Water. Available online: http://www.fao.org/land-water/databases-and-software/cropwat/en/#:~:text=CROPWAT%20is%20a%20decision%20support,soil%2C%20climate%20and%20crop%20data (accessed on 14 June 2017).
  31. Chapagain, A.K.; Hoekstra, A.; Savenije, H.; Gautam, R. The Water Footprint of Cotton Consumption: An Assessment of the Impact of Worldwide Consumption of Cotton Products on the Water Resources in the Cotton Producing Countries. Ecol. Econ. 2006, 60, 186–203. [Google Scholar] [CrossRef]
  32. Aldaya, M.M.; Chapagain, A.K.; Hoekstra, A.Y.; Mekonnen, M.M. The Water Footprint Assessment Manual: Setting the Global Standard; Routledge: Abingdon, UK, 2012. [Google Scholar]
  33. Chapagain, A.K.; Hoekstra, A.Y. The Global Component of Freshwater Demand and Supply: An Assessment of Virtual Water Flows Between Nations As a Result of Trade in Agricultural and Industrial Products. Water Int. 2008, 33, 19–32. [Google Scholar] [CrossRef]
  34. Liu, W.; Antonelli, M.; Liu, X.; Yang, H. Towards Improvement of Grey Water Footprint Assessment: With an Illustration for Global Maize Cultivation. J. Clean. Prod. 2017, 147, 1–9. [Google Scholar] [CrossRef]
  35. Mekonnen, M.M.; Hoekstra, A.Y. Global gray water footprint and water pollution levels related to anthropogenic nitrogen loads to fresh water. Environ. Sci. Technol. 2015, 4, 12860–12868. [Google Scholar] [CrossRef]
  36. Chapagain, A.; Hoekstra, A.; Savenije, H.; Gautam, R. The Water footprint of Cotton Consumption. Value of Water Research Report Series No. 18. UNESCO-IHE, The Netherlands. Available online: http://www.waterfootprint.org/Reports/Report18.pdf (accessed on 20 June 2017).
  37. Liton, M.R.I.; Islam, T.; Saha, S. Present Scenario and Future Challenges in Handloom Industry in Bangladesh. Soc. Sci. 2016, 5, 70–76. [Google Scholar]
  38. Islam, M.I. Bangladesh Spinning Sector Focuses to Higher Capacity Utilization and Diversification of Yarn. 2017. Available online: https://www.textiletoday.com.bd/bangladesh-spinning-sector-focuses-higher-capacity-utilization-diversification-yarn/ (accessed on 4 November 2017).
  39. Sarker, S.K. Material Balance Approach to Measure Water Pollution Load of Industrial Development in Bangladesh. Master’s Thesis, Bangladesh University of Engineering and Technology, Dhaka, Bangladesh, 2017. [Google Scholar]
  40. Bangladesh Garment Manufacturers and Exporters Association. Value of Total Apparel Export. 2017. Available online: http://www.bgmea.com.bd/home/pages/TradeInformation (accessed on 2 March 2017).
  41. Rodrigue, J.-P.; Comtois, C.; Slack, B. The Geography of Transport Systems, 4th ed.; Routledge Taylor & Francis Group: Abington, UK, 2009. [Google Scholar]
  42. Organic Touch. Organic Cotton Yarn. Available online: http://www.parkotex.com/_en/organic-cotton-yarn/193/menu (accessed on 10 September 2017).
  43. Ardena Transport. Export of Uzbek Cotton. 2017. Available online: http://www.ardenatransport.com/en/project/export-uzbek-cotton (accessed on 23 November 2017).
  44. Wu, M.; Mintz, M.; Wang, M.; Arora, S. Consumptive Water Use in the Production of Ethanonl and Petroleum Gasoline. 2009. Available online: https://www.osti.gov/biblio/947085 (accessed on 3 June 2017).
  45. Islam, M.M.; Mahmud, K.; Faruk, O.; Billah, S. Assessment of environmental impacts for textile dyeing industries in Bangladesh. In Proceedings of the International Conference on Green Technology and Environmental Conservation (GTEC-2011), Chennai, India, 15–17 December 2011; pp. 173–181. [Google Scholar]
  46. Mathur, N.; Bhatnagar, P.; Sharma, P. Review of the mutagenicity of textile dye products. Univers. J. Environ. Res. Technol. 2012, 2, 1–18. [Google Scholar]
  47. Strazzullo, P.; D’Elia, L.; Kandala, N.-B.; Cappuccio, F.P. Salt intake, stroke, and cardiovascular disease: Meta-analysis of prospective studies. BMJ 2009, 339, b4567. [Google Scholar] [CrossRef] [Green Version]
  48. PARCL. Approximate Weight of Goods. Available online: https://www.parcl.com/education/forwarders/docs/parcl-approximate-weight-of-goods.pdf (accessed on 10 March 2017).
  49. Shopclues.com. Bombay Dyeing Bedsheet Blue Single Bed 100 Cotton Heavy Discount. Available online: http://www.shopclues.com/bombay-dyeing-bedsheet-blue-single-bed-100-cotton-heavy-discount.html (accessed on 2 November 2017).
  50. Exchange, T. Quick Guide to Organic Cotton. Textile Exchange. 2017. Available online: https://textileexchange.org/wp-content/uploads/2017/06/Textile-Exchange_Quick-Guide-To-Organic-Cotton_2017.pdf (accessed on 2 November 2017).
  51. Safaya, S.; Zhang, G.; Mathews, R. Toward Sustainable Water Use in the Cotton Supply Chain: A Comparative Assessment of the Water Footprint of Agricultural Practices in India; Water Footprint Network, The Hague, Netherlands/C&A Foundation: Zug, Switzerland, 2016. [Google Scholar]
  52. Lakhal, S.Y.; Sidibé, H.; H’Mida, S. Comparing conventional and certified organic cotton supply chains: The case of Mali. Int. J. Agricult. Res. Gov Ecol. 2008, 7, 243–255. [Google Scholar] [CrossRef]
  53. Tabib, D.M.F.A.I. Prospects and Challenges of Organic Cotton in Bangladesh. 2016. Available online: https://www.global-standard.org/images/stories/GOTS_ConfBangla16/7-Fakhre-Alam-Ibne-Tabib-CDB-Organic-Cotton-Bangladesh-.pdf (accessed on 3 November 2017).
  54. Policy Paper Series. Promoting Zero Liquid Discharge Mandate for the Bangladesh Textile Industry. Available online: http://www.ipekpp.com/admin/upload_files/Report_1_19_Promoting_1175846345.pdf (accessed on 11 March 2017).
  55. Newell, A. Quenching Cotton’s Thirst: Reducing the Use of Water in the Cotton Lifecycle. Available online: https://www.triplepundit.com/story/2016/quenching-cottons-thirst-reducing-use-water-cotton-lifecycle/57196 (accessed on 3 May 2020).
  56. Roberts, K.B. Water Crisis in Bangladesh: Overpumping in Dhaka May Threaten Regional Groundwater Resources Outside the City. Available online: https://phys.org/news/2016-09-crisis-bangladesh-overpumping-dhaka-threaten.html (accessed on 29 August 2017).
  57. Sah, R.C. Groundwater Depletion and its Impact on Environment in Kathmandu Valley. Nepal. 2001. Available online: https://www.Elaw.org/content/nepal-groundwater-depletion-and-its-impact-environment-kathmandu-valley (accessed on 23 August 2017).
  58. Islam, J.B.; Sarkar, M.; Rahman, A.L.; Ahmed, K.S. Quantitative assessment of toxicity in the Shitalakkhya River, Bangladesh. Egypt. J. Aqua. Res. 2015, 41, 25–30. [Google Scholar] [CrossRef] [Green Version]
  59. Krinner, G. Impact of lakes and wetlands on boreal climate. J. Geophys. Res. Atmos. 2003, 108, 4520. [Google Scholar] [CrossRef]
  60. Cole, J.J.; Prairie, Y.T.; Caraco, N.F.; McDowell, W.H.; Tranvik, L.J.; Striegl, R.G.; Duarte, C.M.; Kortelainen, P.; Downing, J.A.; Middelburg, J.J. Plumbing the global carbon cycle: Integrating inland waters into the terrestrial carbon budget. Ecosystems 2007, 10, 172–185. [Google Scholar] [CrossRef] [Green Version]
  61. Qureshi, A.S.; McCornick, P.G.; Sarwar, A.; Sharma, B.R. Challenges and Prospects of Sustainable Groundwater Management in the Indus Basin, Pakistan. Water Res. Manag. 2010, 24, 1551–1569. [Google Scholar] [CrossRef] [Green Version]
  62. Tamilnadu Water Investment Company Limited. Zero Liquid Discharge Facility for Textile Dyeing Effluents & Pulp and Paper Effluents; Deutsche Gesellschaft für Internationale Zusammenarbeit (giz): Bonn, Germany, 2013. [Google Scholar]
  63. Battacharjee, S.; Bharadwaj, R. Zero Liquid Discharge: Options for Bangladesh Textile Industry. 2014. Available online: http://www.iipinetwork.org/wp-content/uploads/2016/12/ZLD-Excerpt-from-Apparel-Story-magazine_IIP.pdf (accessed on 29 August 2017).
  64. Knowledge Partnership Programme; UKaid, I.G. Paving the Way for Learning: Exposure Visit by Bangladesh Garments Manufacturing and Export Association (BGMEA) Members on Zero Liquid Discharge Technology, Chennai and Tirupur. 2015. Available online: http://ipekpp.com/pdf/Achievements/Achievement_BGMEA_textile_exposure_visit_FINAL.pdf (accessed on 29 August 2017).
  65. Uzbekistan- Republic of Cotton and Products Annual. 2014. Available online: http://www.thefarmsite.com/reports/contents/UzbekistanCotton2April2014.pdf (accessed on 10 April 2017).
  66. Hussain, S. Bangladesh Cotton and Products Annual 2013. In GAIN Report Number: BG3005; USDA Foreign Agricultural Service: Washington DC, USA, 2013. [Google Scholar]
  67. Anas, A. Bangladesh Cotton Imports to Double in Six Years. Available online: http://www.pri-bd.org/main/view_news/bangladesh-cotton-imports-to-double-in-six-years-conference-told_98 (accessed on 3 August 2017).
  68. Bangladesh Bank. Import Payments. Available online: https://www.bb.org.bd/pub/publictn.php (accessed on 3 August 2017).
  69. Indexmundi. Bangladesh Cotton Production by Year. Available online: https://www.indexmundi.com/agriculture/?country=bd&commodity=cotton&graph=production (accessed on 10 August 2017).
  70. Wang, T.K.; Audebert, R. Flocculation Mechanisms of A Silica Suspension by Some Weakly Cationic Polyelectrolytes. J. Colloid Int. Sci. 1987, 119, 459–465. [Google Scholar] [CrossRef]
  71. Allen, R.G.; Pereira, L.S.; Raes, D.; Smith, M. Crop Evapotranspiration-Guidelines for Computing Crop Water Requirements-FAO Irrigation and Drainage Paper 56; FAO: Rome, Italy, 1998; Volume 300, p. D05109. [Google Scholar]
  72. Cotton Incorporated. Cotton Water Requirements. Available online: http://www.cottoninc.com/fiber/agriculturaldisciplines/engineering/irrigation-management/cotton-water-requirements/ (accessed on 16 September 2017).
  73. Sood, D. Cotton and Products Annual. USA. 2017. Available online: https://apps.fas.usda.gov/newgainapi/api/report/downloadreportbyfilename?filename=Cotton%20and%20Products%20Annual_New%20Delhi_India_4-2-2018.pdf (accessed on 10 September 2017).
  74. Atlas on Regional Integration in West Africa, Cotton. 2006. Available online: https://Oecd.org/regional/atlasonregionalintegrationinwestafrica.htm (accessed on 10 September 2017).
  75. Sirtioglu, I. Cotton and Products Annual. USA. 2016. Available online: https://apps.fas.usda.gov/newgainapi/api/report/downloadreportbyfilename?filename=Cotton%20and%20Products%20Annual_Tashkent_Uzbekistan%20-%20Republic%20of_4-4-2016.pdf (accessed on 10 September 2017).
  76. Person, J. Top 10 Cotton States in Production/Total Number of Bales. 2012. Available online: http://janiceperson.com/cotton/top-10-cotton-states-area-production-bales-yield-acre-2012/ (accessed on 17 September 2017).
  77. United States Department of Agriculture. Pakistan Cotton Conditions Improve. USA. 2016. Available online: https://ipad.fas.usda.gov/highlights/2016/10/Pakistan/index.htm (accessed on 3 August 2017).
  78. Queensland Government. Cotton Production in Queensland. 2015. Available online: https://www.daf.qld.gov.au/plants/field-crops-and-pastures/broadacre-field-crops/cotton (accessed on 15 August 2017).
  79. Uzbekistan: Climate Change and Agriculture Country Note, Climate Change and Agriculture Country Note. 2010. Available online: http://documents.worldbank.org/curated/en/362081468131400417/Uzbekistan-Climate-change-and-agriculture-country-note (accessed on 3 August 2017).
  80. Osakwe, E. Cotton Fact Sheet: India. 2009. Available online: http://staging.icac.org/econ_stats/country_facts/e_india.pdf (accessed on 3 August 2017).
  81. Fletcher, K. Sustainable Fashion and Textiles: Design Journeys, 2nd ed.; Routledge: Abington, UK, 2013. [Google Scholar]
  82. Stone, J. Plant Modification for More Efficient Water Use; Elsevier: Stillwater, OK, USA, 2012. [Google Scholar]
  83. Naheed, G.; Rasul, G. Recent water requirement of cotton crop in Pakistan. Pak. J. Meteor 2010, 6, 75–84. [Google Scholar]
  84. Grose, L. Sustainable Cotton Production and Processing; California College of the Arts San Francisco: Oakland, CA, USA, 2009. [Google Scholar]
  85. Australian Cotton Industries Statistics. Cotton Annual. 2017. Available online: https://www.cottonaustralia.com.au/assets/general/Publications/Cotton-Annuals/Cotton-Annual-2017.pdf (accessed on 29 November 2017).
  86. Central Asian Countries Initiative for Land Management. Table of Technologies Database. Available online: http://www.cacilm.org/en/visual/table (accessed on 17 August 2017).
  87. Commodity Intelligence Report. China: 2017/18 Cotton Production Outlook. 2017. Available online: https://ipad.fas.usda.gov/highlights/2017/08/china/index.htm (accessed on 17 August 2017).
  88. Tabib, M.F.A.I. The Way of Sustainable Cotton Production. 2005. Available online: http://www.cottonbangladesh.com/October2011/SustainableCotton.htm (accessed on 17 August 2017).
  89. International Cotton Advisory Committee. Measuring Sustainability in Cotton Farming Systems. Towards a Guidance Framework. 2015. Available online: https://www.crdc.com.au/publications/measuring-sustainability-cotton-farming-systems-towards-guidance-framework (accessed on 27 November 2017).
  90. Stewart, J.M.; Oosterhuis, D.; Heitholt, J.J.; Mauney, J.R. Physiology of Cotton; Springer Science & Business Media: New York, NY, USA, 2009. [Google Scholar]
  91. Smith, M.; Kivumbi, D. Use of The FAO CROPWAT Model in Deficit Irrigation Studies. Available online: http://www.fao.org/docrep/004/Y3655E/y3655e05.htm (accessed on 3 August 2017).
  92. Malhotra, K. Brief Note on Types of Soil in Gujarat. 2014. Available online: http://www.importantindia.com/12355/brief-note-on-types-of-soil-in-gujarat/ (accessed on 15 August 2017).
  93. Mondal, P. Cotton Cultivation in India: Conditions, Types, Production and Distribution. Available online: http://www.yourarticlelibrary.com/cultivation/cotton-cultivation-in-india-conditions-types-production-and-distribution/20949/ (accessed on 15 August 2017).
  94. Khadi, B.M. Impact of Bt-cotton on agriculture in India. In Proceedings of the Ninth International Symposium on Biosafety of Genetically Modified Organisms Biosafety Research and Environmental Risk Assessment, Jeju Island, Korea, 24–29 September 2006; Sabesh, M., Ed.; Approved Package of Practices for Cotton: Gujarat State, India, 2006–2007. Available online: http://www.cicr.org.in/pop/gj.pdf (accessed on 16 April 2017).
  95. Jagannath, P.S.; Waykole, D.M.M. Status of Cotton Global to Khandesh; Indira Institute of Management and Nahata Commerce College: Pune, India, 2013. [Google Scholar]
  96. Cotton: Soils and Climate. Available online: http://ikisan.in/mh-cotton-Soils-Climate.html (accessed on 15 August 2017).
  97. District Profile. Available online: http://www.kvk.pravara.com/pages/District%20Profile/District%20Profile.htm (accessed on 15 August 2017).
  98. Vasudeva, V. Cotton Sowing May Dip in Punjab. In The Hindu; India, The Hindu Group: Chennai, India, 2016; Available online: https://www.thehindu.com/news/national/other-states/cotton-sowing-may-dip-in-punjab/article8443732.ece (accessed on 15 October 2017).
  99. Food and Agriculture Organization. Chapter 2: Soil and Water. Available online: http://www.fao.org/docrep/r4082e/r4082e03.htm (accessed on 15 August 2017).
  100. ENVIS Centre. Soil Types. 2015. Available online: http://punenvis.nic.in/index2.aspx?slid=205&sublinkid=1127&langid=1&mid=1 (accessed on 15 August 2017).
  101. Andhra Pradesh: Cotton Update for Kharif. Anantpur Dist Cotton Acreage Estimates: Drastic Revision Cautions Traders. Available online: http://www.commoditiescontrol.com/eagritrader/staticpages/index.php?id=96 (accessed on 15 August 2017).
  102. Sciencing, Different Soils of Andhra Pradesh. 2017. Available online: https://sciencing.com/different-soils-of-andhra-pradesh-12383628.html (accessed on 2 November 2017).
  103. Gopalakrishnan, N.; Manickam, S.; Prakash, A.H. Problems and Prospects of Cotton in Different Zones of India. Available online: https://www.cicr.org.in/pdf/ELS/general3.pdf (accessed on 30 September 2017).
  104. Vittal, K.; Rajendran, T.; Chary, G.R.; Sankar, G.M.; Srijaya, T.; Ramakrishna, Y.; Samra, J.; Singh, G. Districtwise Promising Technologies for Rainfed Cotton based Production System in India; All India Co-ordinated Research Project for Dryland Agriculture; Central Research Institute for Dryland Agriculture, Indian Council of Agricultural Research: Hyderabad, India, 2004. [Google Scholar]
  105. Raju, B.Y. Andhra Pradesh Vision 2020; New Age International Limited: Delhi, India, 2001. [Google Scholar]
  106. eFresh. Crop Cultivation of Cotton. Available online: http://www.efreshglobal.com/eFresh/Content/Prod_Cotton.aspx?u=ppperi (accessed on 15 August 2017).
  107. Agropedia. Soils of Karnakata. 2010. Available online: http://agropedia.iitk.ac.in/content/soils-karnataka (accessed on 15 August 2017).
  108. Naya Haryana. Time to Improve Cotton Production in Haryana. Available online: http://www.nayaharyana.com/agriculture/time-improve-cotton-production-haryana/ (accessed on 15 August 2017).
  109. Manav, S. Whitefly Detected in Cotton-producing Districts: Survey, in The Tribune. 2016. Available online: https://www.tribuneindia.com/news/archive/features/whitefly-detected-in-cotton-producing-districts-survey-248196 (accessed on 15 August 2017).
  110. The Agriculture Department. Kharip Crops. Available online: http://agriharyana.gov.in/variouscrops.htm (accessed on 15 August 2017).
  111. Department of Economics and Statistics, Season and Crop Report 2005–06. India. Available online: https://statistics.py.gov.in/season-and-crop-report-2005-06 (accessed on 15 August 2017).
  112. World Blaze. Top 10 Largest Cotton Producing States of India. Available online: http://www.worldblaze.in/top-10-largest-cotton-producing-states-in-india/ (accessed on 15 August 2017).
  113. Fullstopindia. The Business of Cotton in India. Available online: http://archive.india.gov.in/citizen/agriculture/index.php?id=12 (accessed on 15 August 2017).
  114. Portal, T.A. Cotton: Season and Varieties. 2016. Available online: http://agritech.tnau.ac.in/agriculture/agri_seasonandvarieties_cotton.html (accessed on 15 August 2017).
  115. Directorate of Horticulture and Plantation Crops. Coimabatore. 2017. Available online: http://tnhorticulture.tn.gov.in/horti/coimbatore (accessed on 15 August 2017).
  116. Department of Agriculture, M.D. Basic Details and Schemes Implementation Details. Available online: http://www.madurai.tn.nic.in/agri.html (accessed on 15 August 2015).
  117. Singh, G. Technological Gap in Cotton Production Technology Among the Growers of Sriganganagar District of Rajasthan; Swami Keshwanand Rajasthan Agricultural University: Bikaner, India, 2011. [Google Scholar]
  118. Madhya Pradesh: Cotton Update for Kharif. Cotton Acreage Exceeds Target in Khargone District. Available online: http://www.commoditiescontrol.com/eagritrader/staticpages/index.php?id=105 (accessed on 15 August 2017).
  119. The Cotton Corporation of India. Maharashtra. 2011. Available online: http://cotcorp.gov.in/maharashtra.aspx (accessed on 15 August 2017).
  120. The Gazetteers Department. Agriculture and Irrigation. Available online: http://amravati.nic.in/gazetteer/gazetteerB/agri_soils.html (accessed on 15 August 2017).
  121. Textile Exchange. Growing Regions: Africa. Available online: http://farmhub.textileexchange.org/learning-zone/growing-regions/africa (accessed on 3 October 2017).
  122. Cotton Technical Assistance Programme for Africa. Country Profile: Burkina Faso. Available online: http://www.cottontapafrica.org/burkina-faso.html (accessed on 15 August 2017).
  123. Better Cotton Initiative. Mali. Available online: http://bettercotton.org/about-better-cotton/where-is-better-cotton-grown/mali/ (accessed on 15 August 2017).
  124. Gao, J.; Liu, J.; Peng, H.; Wang, Y.; Cheng, S.; Lei, Z. Preparation of a low-cost and eco-friendly superabsorbent composite based on wheat bran and laterite for potential application in Chinese herbal medicine growth. R. Soc. Open Sci. 2018, 5, 180007. [Google Scholar] [CrossRef] [Green Version]
  125. Better Cotton Initiative. Senegal. Available online: http://bettercotton.org/about-better-cotton/where-is-better-cotton-grown/senegal/ (accessed on 15 August 2017).
  126. Kirby, N.M.; Mudie, S.T.; Hawley, A.M.; Cookson, D.J.; Mertens, H.D.; Cowieson, N.; Samardzic-Boban, V. A low-background-intensity focusing small-angle X-ray scattering undulator beamline. J. Appl. Crystal. 2013, 46, 1670–1680. [Google Scholar] [CrossRef]
  127. Reuters Staff. Ivory Coast 2015–16 Cotton Forecast Output Revised Lower. Available online: http://af.reuters.com/article/ivoryCoastNews/idAFL5N10W2LT20150821 (accessed on 15 August 2017).
  128. Uckles, D.B.; Teka, A.E.; Siname, O.O.; Aliba, G.; Aliano, G.G. Cover Crops in West Africa. Available online: https://www.idrc.ca/sites/default/files/openebooks/270-8/index.html (accessed on 7 October 2017).
  129. Cotton Technical Assistance Programme for Africa. Country Profile: Nigeria. Available online: http://www.cottontapafrica.org/nigeria.html (accessed on 15 August 2017).
  130. Issman, L.; Talmon, Y. Cryo-SEM specimen preparation under controlled temperature and concentration conditions. J. Microsc. 2012, 1, 60–69. [Google Scholar] [CrossRef]
  131. Agriculture Nigeria. Soil and Water. Available online: http://agriculturenigeria.com/research/introduction/soil-and-water (accessed on 15 August 2017).
  132. Aregheore, E.M. Country Pasture/Forage Resource Profiles. Available online: http://www.fao.org/ag/agp/agpc/doc/counprof/nigeria/nigeria.htm (accessed on 15 August 2017).
  133. Agriculture Nigeria. Cotton (Gossypium Species). Available online: http://agriculturenigeria.com/farming-production/crop-production/cash-crops/cotton (accessed on 15 August 2017).
  134. Sant’Anna, R. Major Soils for Food Production in Africa. Available online: http://www.fao.org/3/T1696E/t1696e07.htm (accessed on 27 November 2017).
  135. United States Department of Agriculture. Tanzania: Mid-season Drought Reduces 2015/16 Cotton Output. Available online: https://pecad.fas.usda.gov/highlights/2015/09/TZ/index.htm (accessed on 15 August 2017).
  136. Zhao, F.; Repo, E.; Song, Y.; Yin, D.; Hammouda, S.B.; Chen, L.; Kalliola, S.; Tang, J.; Tam, K.C.; Sillanpää, M. Polyethylenimine-cross-linked cellulose nanocrystals for highly efficient recovery of rare earth elements from water and a mechanism study. Green Chem. 2017, 19, 4816–4828. [Google Scholar] [CrossRef]
  137. The United Republic of Tanzania, The President’s Office Regional Administration, and Local Government Simiyu Region. Simiyu Region Investment Guide; Tanzania, UNDP-ESRF: Simiyu, Tanzania, 2017.
  138. Kalumuna, M.C.; Masuki, K.F.G.; Mkavidanda, A.T.; Wickama, J.M. Responses of Cotton, Maize and Rice to Fertilizers in Sukumaland; Tanzania, ARI-Mlingano: Mlingano, Tanzania, 2000. [Google Scholar]
  139. Matata, P. Environmental Law Regulations of Pesticide Usage: Challenges of Enforcement and Compliance in the Shinyanga Region, Tanzania; Anchor Academic Publishing: Hamburg, Gernman, 2013. [Google Scholar]
  140. Kabissa, J.C. Cotton in Tanzania: Breaking the Jinx, 6th ed.; Tanaznia Educational Publishers: Bukoba, Tanzania, 2015. [Google Scholar]
  141. Nyamekye, C.; Thiel, M.; Schönbrodt-Stitt, S.; Zoungrana, B.J.B.; Amekudzi, L.K. Soil and Water Conservation in Burkina Faso, West Africa. Sustainability 2018, 10, 3182. [Google Scholar] [CrossRef] [Green Version]
  142. Minai, J.O. Assessing the Spatial Variability of Soils in Uganda. Master’s Thesis, Purdue University, West Lafayette, IN, USA, 2015. [Google Scholar]
  143. Mbogga, M. Climate Profiles and Climate Change Vulnerability Assessment for the Mbale Region of Uganda. 2013. Available online: https://www.adaptation-undp.org/sites/default/files/downloads/tacc_mbale_climate_profile_and_cc_vulnerability_assessment_report_final.pdf (accessed on 23 August 2017).
  144. Cotton Sector Profile. Available online: http://www.ugandainvest.go.ug/uia/images/Download_Center/SECTOR_PROFILE/Cotton_Sector_Profile.pdf (accessed on 14 August 2017).
  145. Norris, P.K. Cotton Production in Egypt; US Department of Agriculture: Washington, DC, USA, 1934; p. 451. [Google Scholar]
  146. Cotton Development Organization. Available online: https://www.cdouga.org/production/production-trends-earnings/ (accessed on 10 August 2017).
  147. Food and Agriculture Organization. Chapter 2. Agro-Ecological Zones and Land Quality. Available online: http://www.fao.org/docrep/006/Y4711E/y4711e05.htm (accessed on 18 August 2017).
  148. Khan, S. Cotton Farming in Uzbekistan Is rModern Slavery. 2016. Available online: https://muftah.org/cotton-farming-uzbekistan-modern-slavery/#.WZZGvtIjHIV (accessed on 18 August 2017).
  149. UGF. Regions of Cotton Production. Available online: http://harvestreport.uzbekgermanforum.org/ (accessed on 18 August 2017).
  150. Wheat Atlas. Uzbekistan, Andizan: General Information. Available online: http://wheatatlas.org/(X(1)S(eouzvmrp0khpr1jnv5acflnc))/station/UZB/29201?AspxAutoDetectCookieSupport=1 (accessed on 18 August 2017).
  151. Young, A. Tropical Soils and Soil Survey; CUP Archive, Cambridge University Press: Cambridge, UK, 1980; Volume 9, pp. 1–48. [Google Scholar]
  152. Lal, R.; Follett, R.F.; Stewart, B.; Kimble, J.M. Soil Carbon Sequestration to Mitigate Climate Change and Advance Food Security. Soil Sci. 2007, 12, 943–956. [Google Scholar] [CrossRef]
  153. Lacerda, M.P.; Demattê, J.A.; Sato, M.V.; Fongaro, C.T.; Gallo, B.C.; Souza, A.B. Tropical Texture Determination by Proximal Sensing Using a Regional Spectral Library and Its Relationship with Soil Classification. Remote Sens. 2016, 8, 701. [Google Scholar] [CrossRef] [Green Version]
  154. Kiawu, J.; Valdes, C.; MacDonald, S. Brazil’s Cotton Industry: Economic Reform and Development. In Cotton and Wool Outlook No. (CWS-11d-01); USDA: Washington, DC, USA, 2011; pp. 1–31. Available online: https://www.ers.usda.gov/publications/pub-details/?pubid=35850 (accessed on 15 June 2017).
  155. Buol, S.W.; Southard, R.J.; Graham, R.C.; McDaniel, P.A. Soil Genesis and Classification; John Wiley & Sons: Hoboken, NJ, USA, 2011. [Google Scholar]
  156. Naumov, A. Mapping Spatial and Temporal Potassium Balances in Brazilian Soils of South-west Goias; Embrapa Solos-Artigo em periódico indexado (ALICE), International Fertilizer Correspondent: Horgen, Switzerland, 2008; Available online: http://www.alice.cnptia.embrapa.br/alice/handle/doc/339722 (accessed on 18 September 2017).
  157. Schiavo, J.A.; Neto, D.; Hypólito, A.; Pereira, M.G.; Rosset, J.S.; Secretti, M.L.; Pessenda, L.C.R. Characterization and Classification of Soils in the Taquari River Basin-Pantanal Region, State of Mato Grosso do Sul, Brazil. Rev. Bras. Ciência Solo 2012, 3, 697–708. [Google Scholar] [CrossRef]
  158. Hilbeck, A.; Andow, D.A.; Fontes, E. Environmental Risk Assessment of Genetically Modified Organisms Methodologies for Assessing Bt Cotton in Brazil; CABI: Wallingford, UK, 2006; Volume 2, pp. 1–20. [Google Scholar]
  159. Spera, S.A.; Cohn, A.S.; VanWey, L.K.; Mustard, J.F.; Rudorff, J.F.; Risso, J. Adami, M. Recent Cropping Frequency, Expansion, and Abandonment in Mato Grosso, Brazil had Selective Land Characteristics. Environ. Res. Lett. 2014, 9, 064010. [Google Scholar] [CrossRef] [Green Version]
  160. Carvalho, P.C.D.F. Country Pasture/Forage Resource Profiles. Available online: http://www.fao.org/ag/agp/agpc/doc/counprof/brazil/brazil.htm#2.SOI (accessed on 18 August 2017).
  161. Hasanov, H. Cotton Sowing Starts in Turkmenistan. Available online: https://en.trend.az/casia/turkmenistan/2256280.html (accessed on 18 August 2017).
  162. Trending Top Most. Top 10 Largest Cotton Producing Countries in The World. Available online: http://www.trendingtopmost.com/worlds-popular-list-top-10/2017-2018-2019-2020-2021/agriculture/largest-cotton-producing-countries-world-best-quality-highest/ (accessed on 18 August 2017).
  163. Robinson, W.O.; Edgington, G.; Byers, H.G. Chemical Studies of Infertile Soils Derived from Rocks High in Magnesium and Generally high in Chromium and Nickel; No. 1488-2016-124356; USDA: Washington, DC, USA, 1935.
  164. Karvy Comtrade Limited, Cotton Seasonal Report. 2009. Available online: http://www.karvycommodities.com/downloads/karvySpecialReports/karvysSpecialReports_20090313_01.pdf (accessed on 29 August 2017).
  165. Cotton Development Board. Cotton Development Program. Available online: http://cdb.portal.gov.bd/site/page/84e5a06c-0463-47cf-a0c4-24ac18d77484 (accessed on 18 August 2017).
  166. Rahman, M.A. Cotton Research and Production in Bangladesh; Cotton Development Board, Government of Bangladesh: Dhaka, Bangladesh, 2018.
  167. Banglapedia. Forest Soil. Available online: http://en.banglapedia.org/index.php?title=Forest_Soil (accessed on 18 August 2017).
  168. Banglapedia. Crop. Available online: http://en.banglapedia.org/index.php?title=Crop (accessed on 18 August 2017).
  169. Amin, S.; Chakravarty, D.K.; Huda, N.; Khan, S. Agricultural Education; The National Curriculum & Textbook Board: Dhaka, Bangladesh, 1931.
  170. Huq, S.I.; Shoaib, J.M. The Soils of Bangladesh; Springer: Dordrecht, The Netherlands, 2013. [Google Scholar]
  171. Banglapedia. Seven Soil Tracts. Available online: http://en.banglapedia.org/index.php?title=Seven_Soil_Tracts (accessed on 18 August 2017).
  172. Pakistan Bureau of Statistics, Crops Area and Production By Districts (1981-82 TO 2008-09). Available online: http://www.pbs.gov.pk/content/crops-area-and-production-districts-1981-82-2008-09 (accessed on 18 August 2017).
  173. Noonari, S.; Memon, M.I.N.; Bhatti, M.A.; Perzado, M.B.; Wagan, S.A.; Memon, A.A.; Chandio, A.A.S.; Kalwar, G.Y.; Shah, S.T.; Jamroo, A.S. Comparative Economics Analysis of the Bt. Cotton V/S Conventional Cotton Production in Khairpur District, Sindh, Pakistan. Int. J. Bus. Econ. Res. 2015, 4, 72–85. [Google Scholar] [CrossRef]
  174. Mohsin, M.; Jamal, F.; Khan, A.A.; Ajmal, F. Transformation of Fertile Agricultural Soil into Housing Schemes: A Case of Bahawalpur City, Punjab, Pakistan. Int. Rev. Soc. Sci. Hum. 2014, 2, 141–156. [Google Scholar]
  175. Australian Government: Department of Agriculture and Water Resources. Cotton. 2015. Available online: http://www.agriculture.gov.au/ag-farm-food/crops/cotton (accessed on 15 August 2017).
  176. Cotton Australia. Where Is It Grown? Available online: http://cottonaustralia.com.au/australian-cotton/basics/where-is-it-grown (accessed on 15 August 2017).
  177. Department of Primary Industries. The Ideal Soil for Cotton. Available online: http://www.dpi.nsw.gov.au/agriculture/soils/guides/soilpak-series/soilpak (accessed on 15 August 2017).
  178. NASS, U. Usual Planting and Harvesting Dates for US Field Crops. In Agricultural Handbook; USDA: Washington, DC, USA, 1997. [Google Scholar]
  179. Cotton Insect Management Guide. Cotton Production Regions of Texas. Available online: http://cottonbugs.tamu.edu/cotton-production-regions-of-texas/ (accessed on 15 August 2017).
  180. Cotton Counts. Cotton from Field to Fabric. Available online: https://www.cotton.org/pubs/cottoncounts/fieldtofabric/crops.cfm (accessed on 15 August 2017).
  181. AgMRC: Agricultural Market Resource Center. Cotton. 2012. Available online: http://www.agmrc.org/commodities-products/fiber/cotton/ (accessed on 15 August 2017).
  182. Georgia Integrated Pest Management, Crop Profile for Cotton in Georgia. 2006. Available online: https://ipmdata.ipmcenters.org/documents/cropprofiles/GAcotton.pdf (accessed on 4 November 2017).
  183. Texas AgriLife Extension Service, Crop Profile for Cotton in Texas. Texas, USA. 1999. Available online: http://agrilife.org/aes/files/2010/06/Crop-Profile-for-Cotton-in-Texas2.pdf (accessed on 30 August 2017).
  184. Farris, S.; Schaich, K.M.; Liu, L.; Piergiovanni, L.; Yam, K.L. Development of polyion-complex hydrogels as an alternative approach for the production of bio-based polymers for food packaging applications: A review. Trends Food Sci. Technol. 2009, 8, 316–332. [Google Scholar] [CrossRef] [Green Version]
  185. Jaime-Garcia, R.; Cotty, A.P.J. Spatial Relationships of Soil Texture and Crop Rotation to Aspergillus Flavus Community Structure in South Texas. Phytopathology 2006, 6, 599–607. [Google Scholar] [CrossRef] [Green Version]
  186. Blackstock, D.A. Soil Survey of Lubbock County, Texas; United States Department of Agriculture, Soil Conservation Service (USDA): Washington, DC, USA, 1979.
  187. SLBC. Command Area Development, Chapter 6. India. Available online: https://pdfslide.net/reader/f/chapter-6-slbc-command-area-d-6pdf-124-chapter-6-slbc-command-area-development (accessed on 15 August 2017).
  188. Production Technology of Cotton in Bangladesh. 2012. Available online: http://cottonbd.blogspot.com/ (accessed on 15 August 2017).
  189. Department of Chemical Engineering. Environmental Impact Assessment For Western Bangladesh Bridge Improvement Project; Bangladesh University of Engineering and Technology: Dhaka, Bangladesh, 2014. [Google Scholar]
  190. Environmental Conservation Rules, Department of Environment; Ministry of Environment and Forest: Dhaka, Bangladesh, 1997.
  191. Sea_Distances.Org. Available online: https://sea-distances.org/ (accessed on 3 August 2017).
  192. Sabesh, M. Approved Package of Practices for Cotton: Gujarat State. 2006. Available online: https://tnaucottondatabase.files.wordpress.com/2012/03/gj.pdf (accessed on 15 August 2017).
Figure 1. Flow diagram for major steps of CROPWAT 8 to calculate crop water evapotranspiration [30].
Water 12 02760 g001
Figure 2. Flow diagram for calculation of (a) blue water footprint of cotton farming and (b) green water footprint of cotton farming for a country (recreated from [31]).
Water 12 02760 g002
Figure 3. Water footprint of cotton cultivation for knit and woven products: (a) green water footprint, (b) blue water footprint, (c) grey water footprint and (d) total water footprint.
Water 12 02760 g003
Figure 4. Percentage of green, blue and grey water footprint of cotton cultivation.
Water 12 02760 g004
Figure 5. Total water footprint of cotton cultivation (a) internal water footprint and (b) external water footprint.
Water 12 02760 g005
Figure 6. Blue water footprint for transportation.
Water 12 02760 g006
Figure 7. Water footprint of textile industry for knit and woven products: (a) blue water footprint, (b) grey water footprint and (c) total water footprint.
Water 12 02760 g007
Figure 8. Total water footprint of textile industry (a) internal water footprint and (b) external water footprint.
Water 12 02760 g008
Figure 9. Percentage of water footprint in different stages in textile industry.
Water 12 02760 g009
Figure 10. Percentage of water footprint in different stages of RMG production.
Water 12 02760 g010
Figure 11. Total water footprint of (a) RMG production and (b) RMG production considering functional Effluent Treatment Plant (ETP) and Sewerage Treatment Plant (STP).
Water 12 02760 g011
Figure 12. Water footprint of a T-shirt; with and without having functional ETP and STP the grey water footprint would be 1026 L and 1273 L, respectively.
Water 12 02760 g012
Figure 13. Water footprint of a shirt; with and without having functional ETP and STP the grey water footprint would be 482 L and 642 L, respectively.
Water 12 02760 g013
Figure 14. Water footprint of a single bedsheet; with and without having functional ETP and STP, the grey water footprint would be 1609 L and 2139 L.
Water 12 02760 g014
Figure 15. Water footprint of a pair of jeans; with and without having functional ETP and STP, the grey water footprint would be 2443 L and 2781 L, respectively.
Water 12 02760 g015
Figure 16. Water footprint for per kg fabric before and after ZLD.
Water 12 02760 g016

