The Soil Water Evaporation Process from Mountains Based on the Stable Isotope Composition in a Headwater Basin and Northwest China


Abstract
1. Introduction
2. Data and Methods
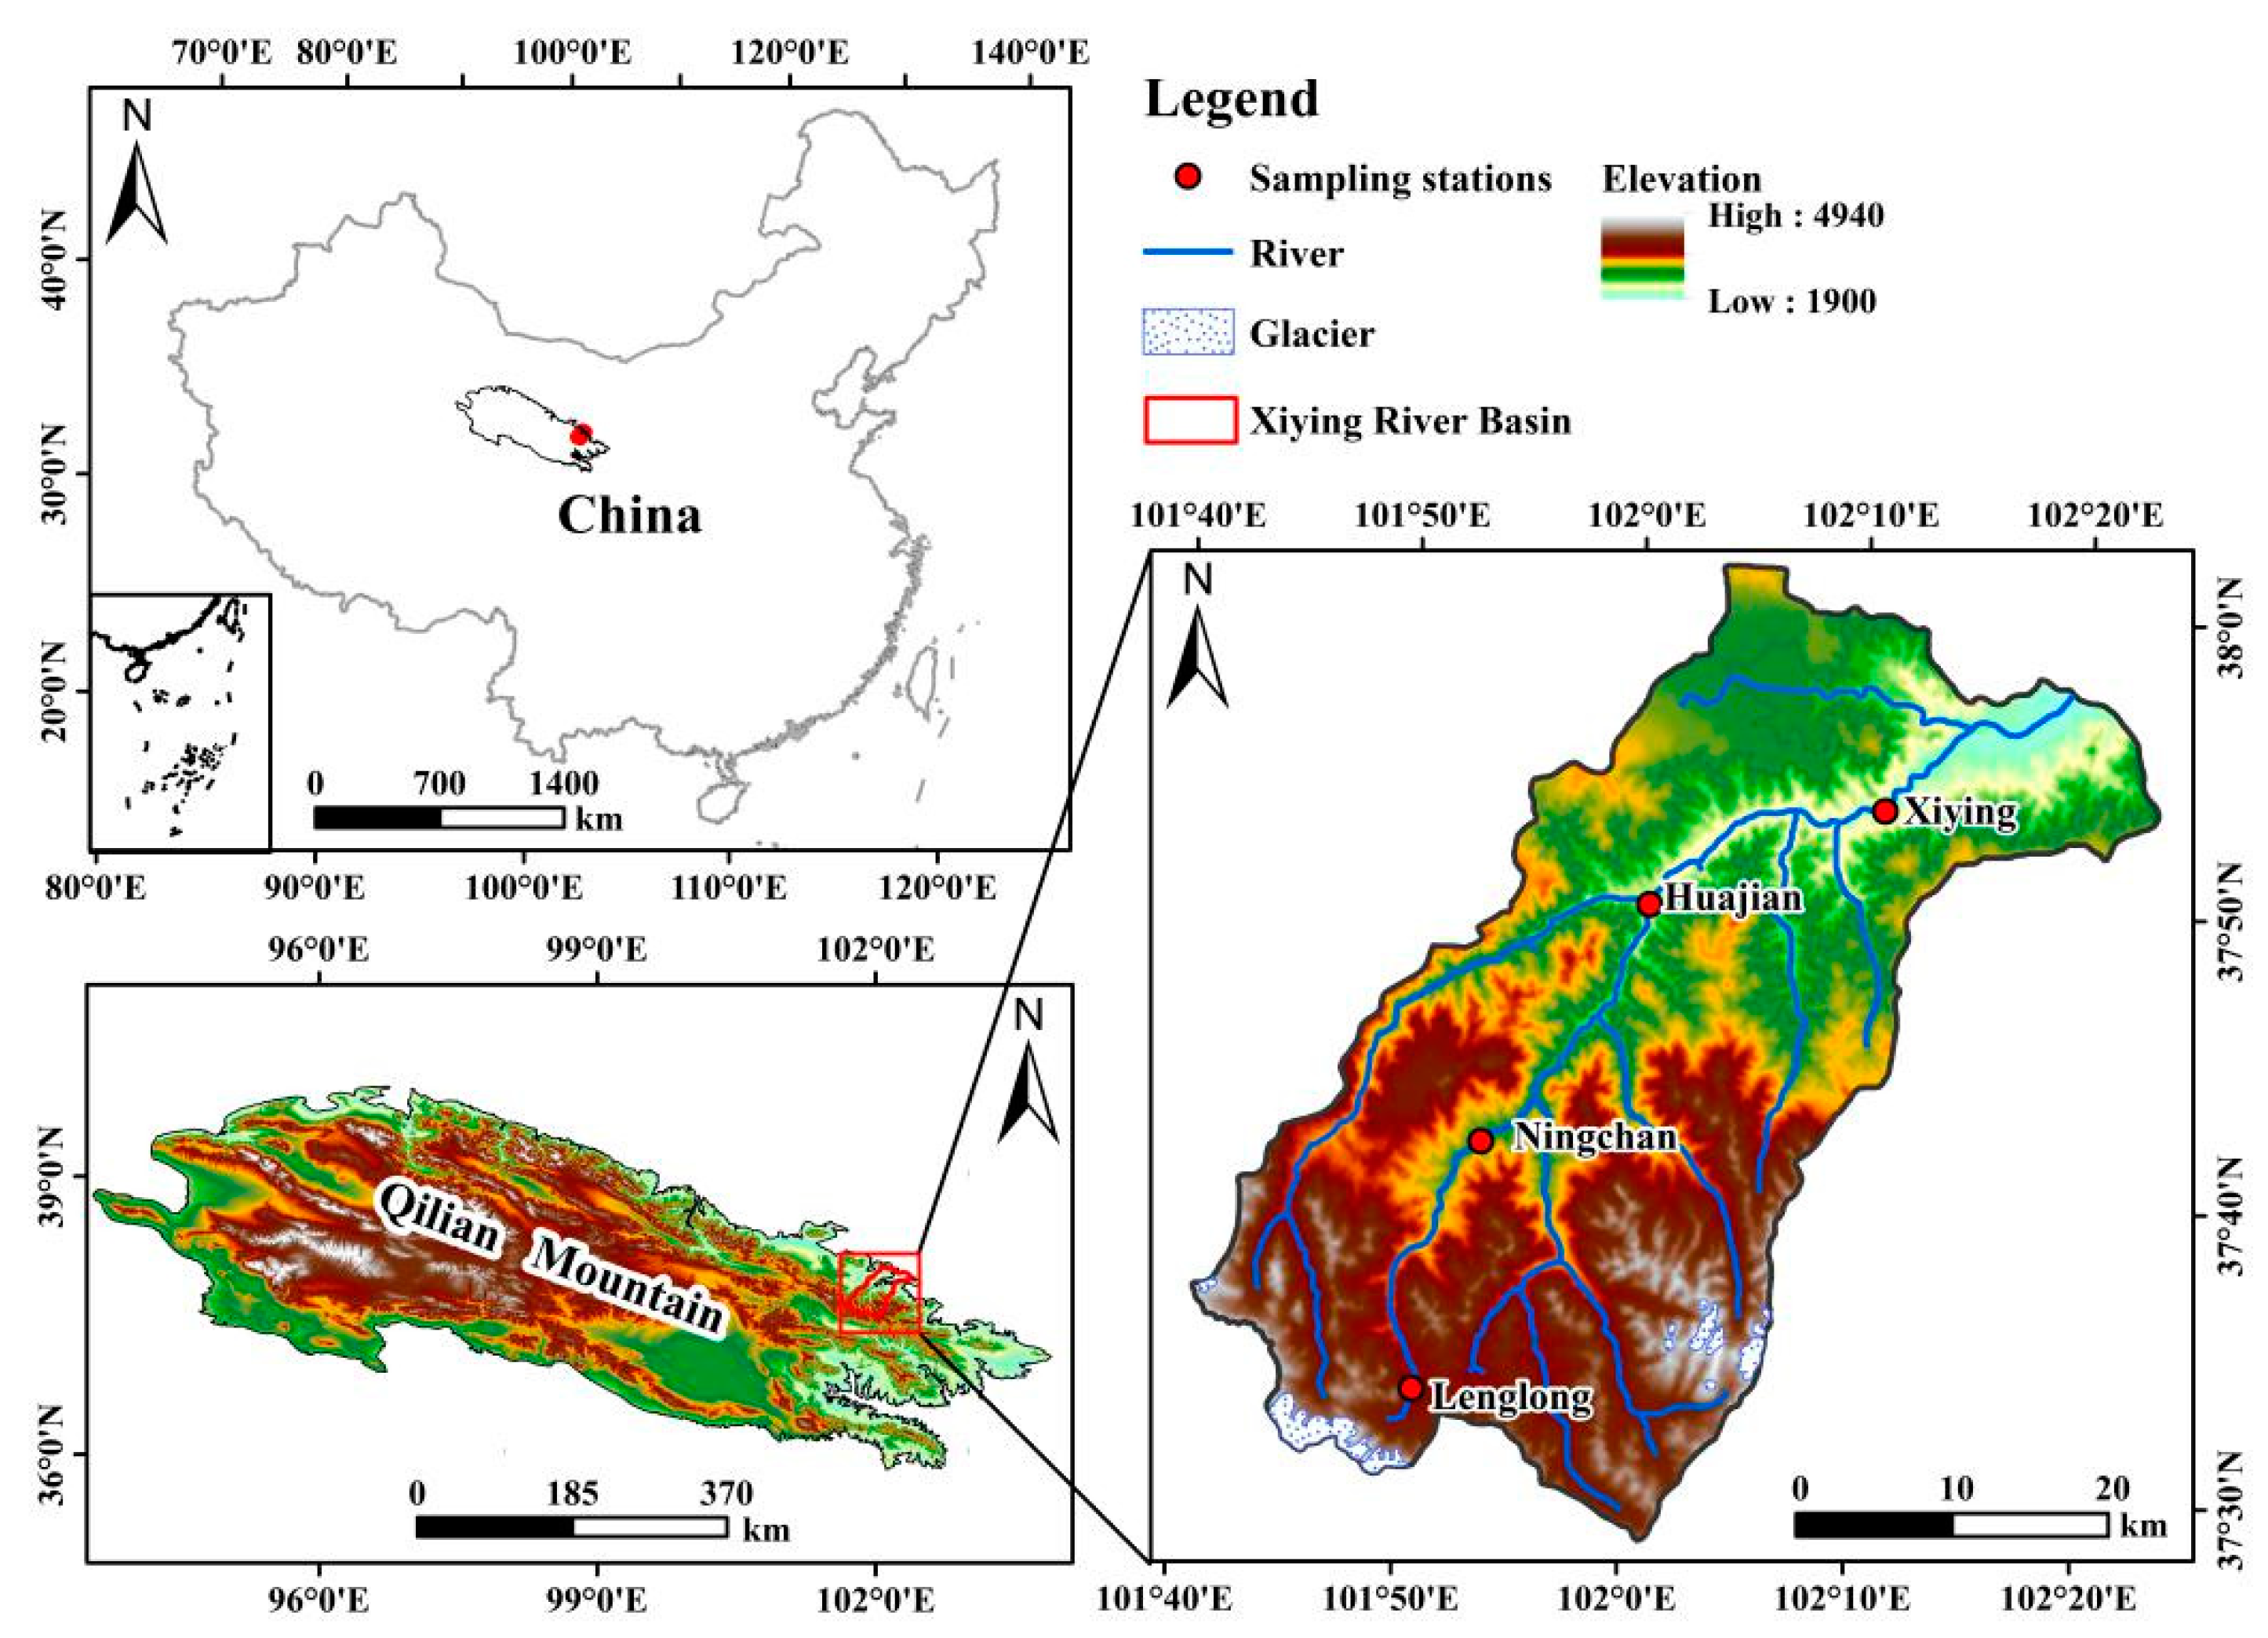
2.1. Study Area
2.2. Sample Collection
2.3. Sample Processing and Analysis
2.4. Meteorological Data
2.5. lc-Excess
2.6. Craig-Gordon Model
3. Results
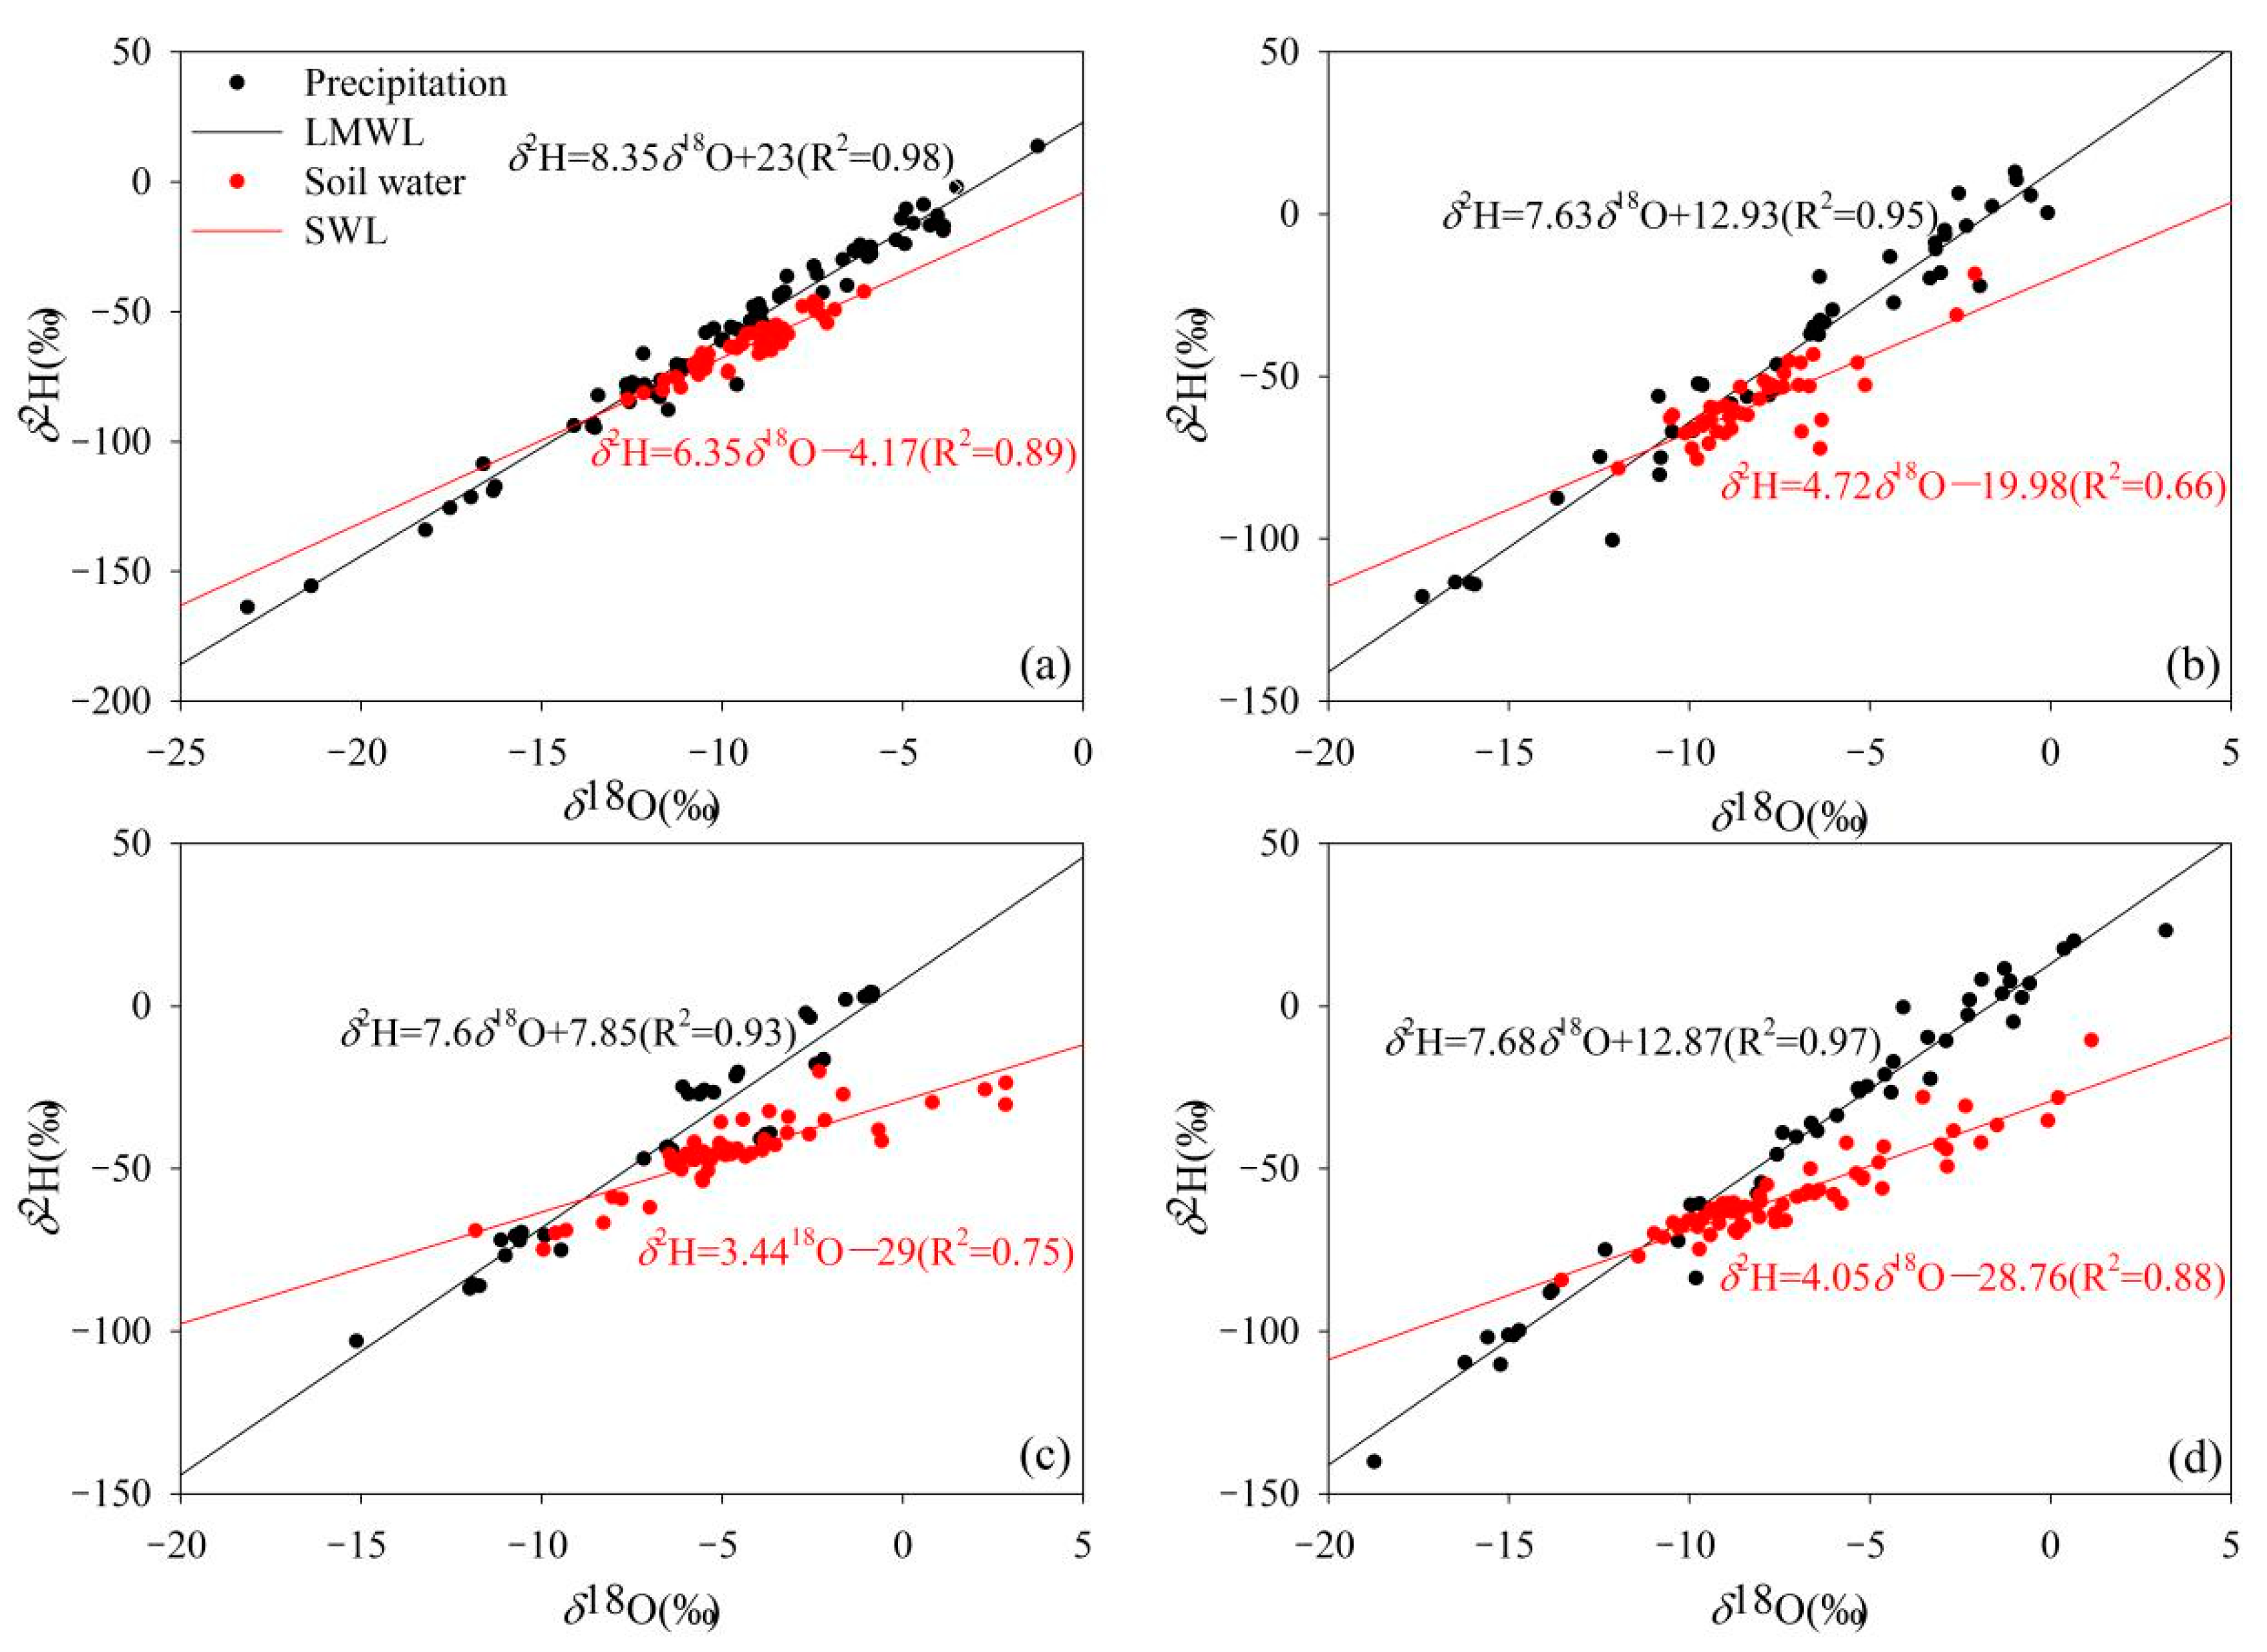
3.1. The Isotopic Composition of Various Water Bodies and Its Evaporation Signal
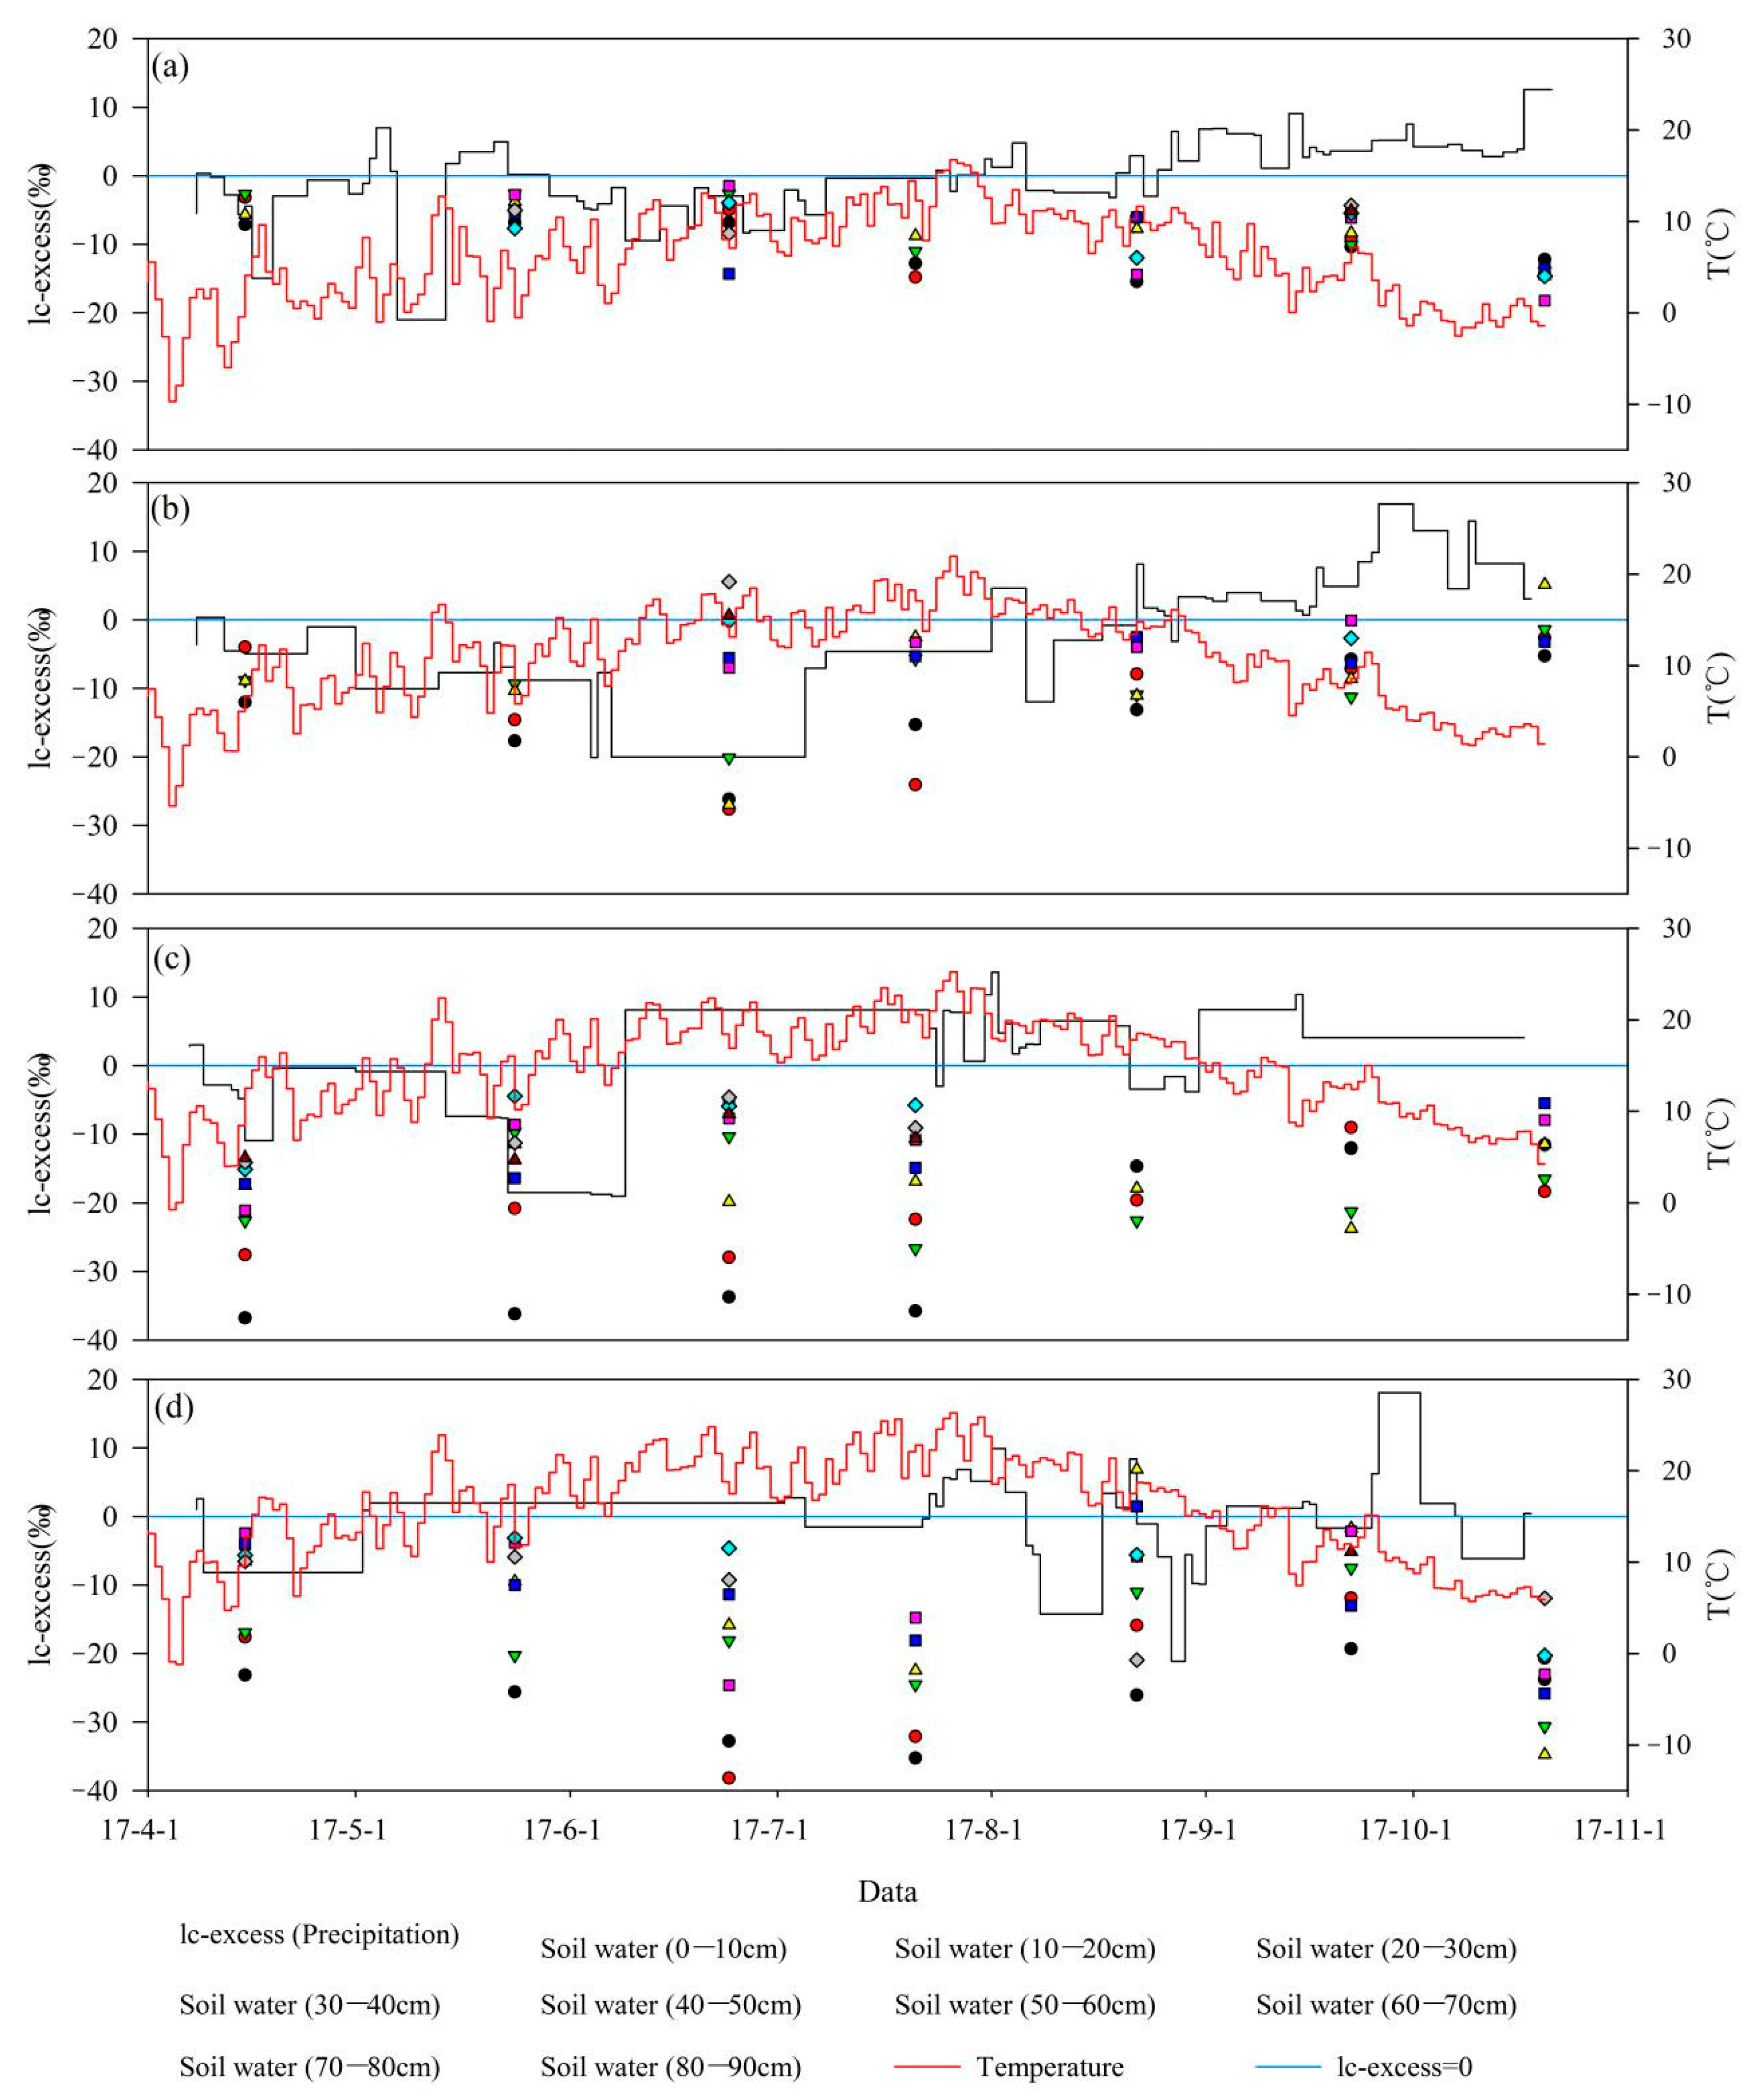
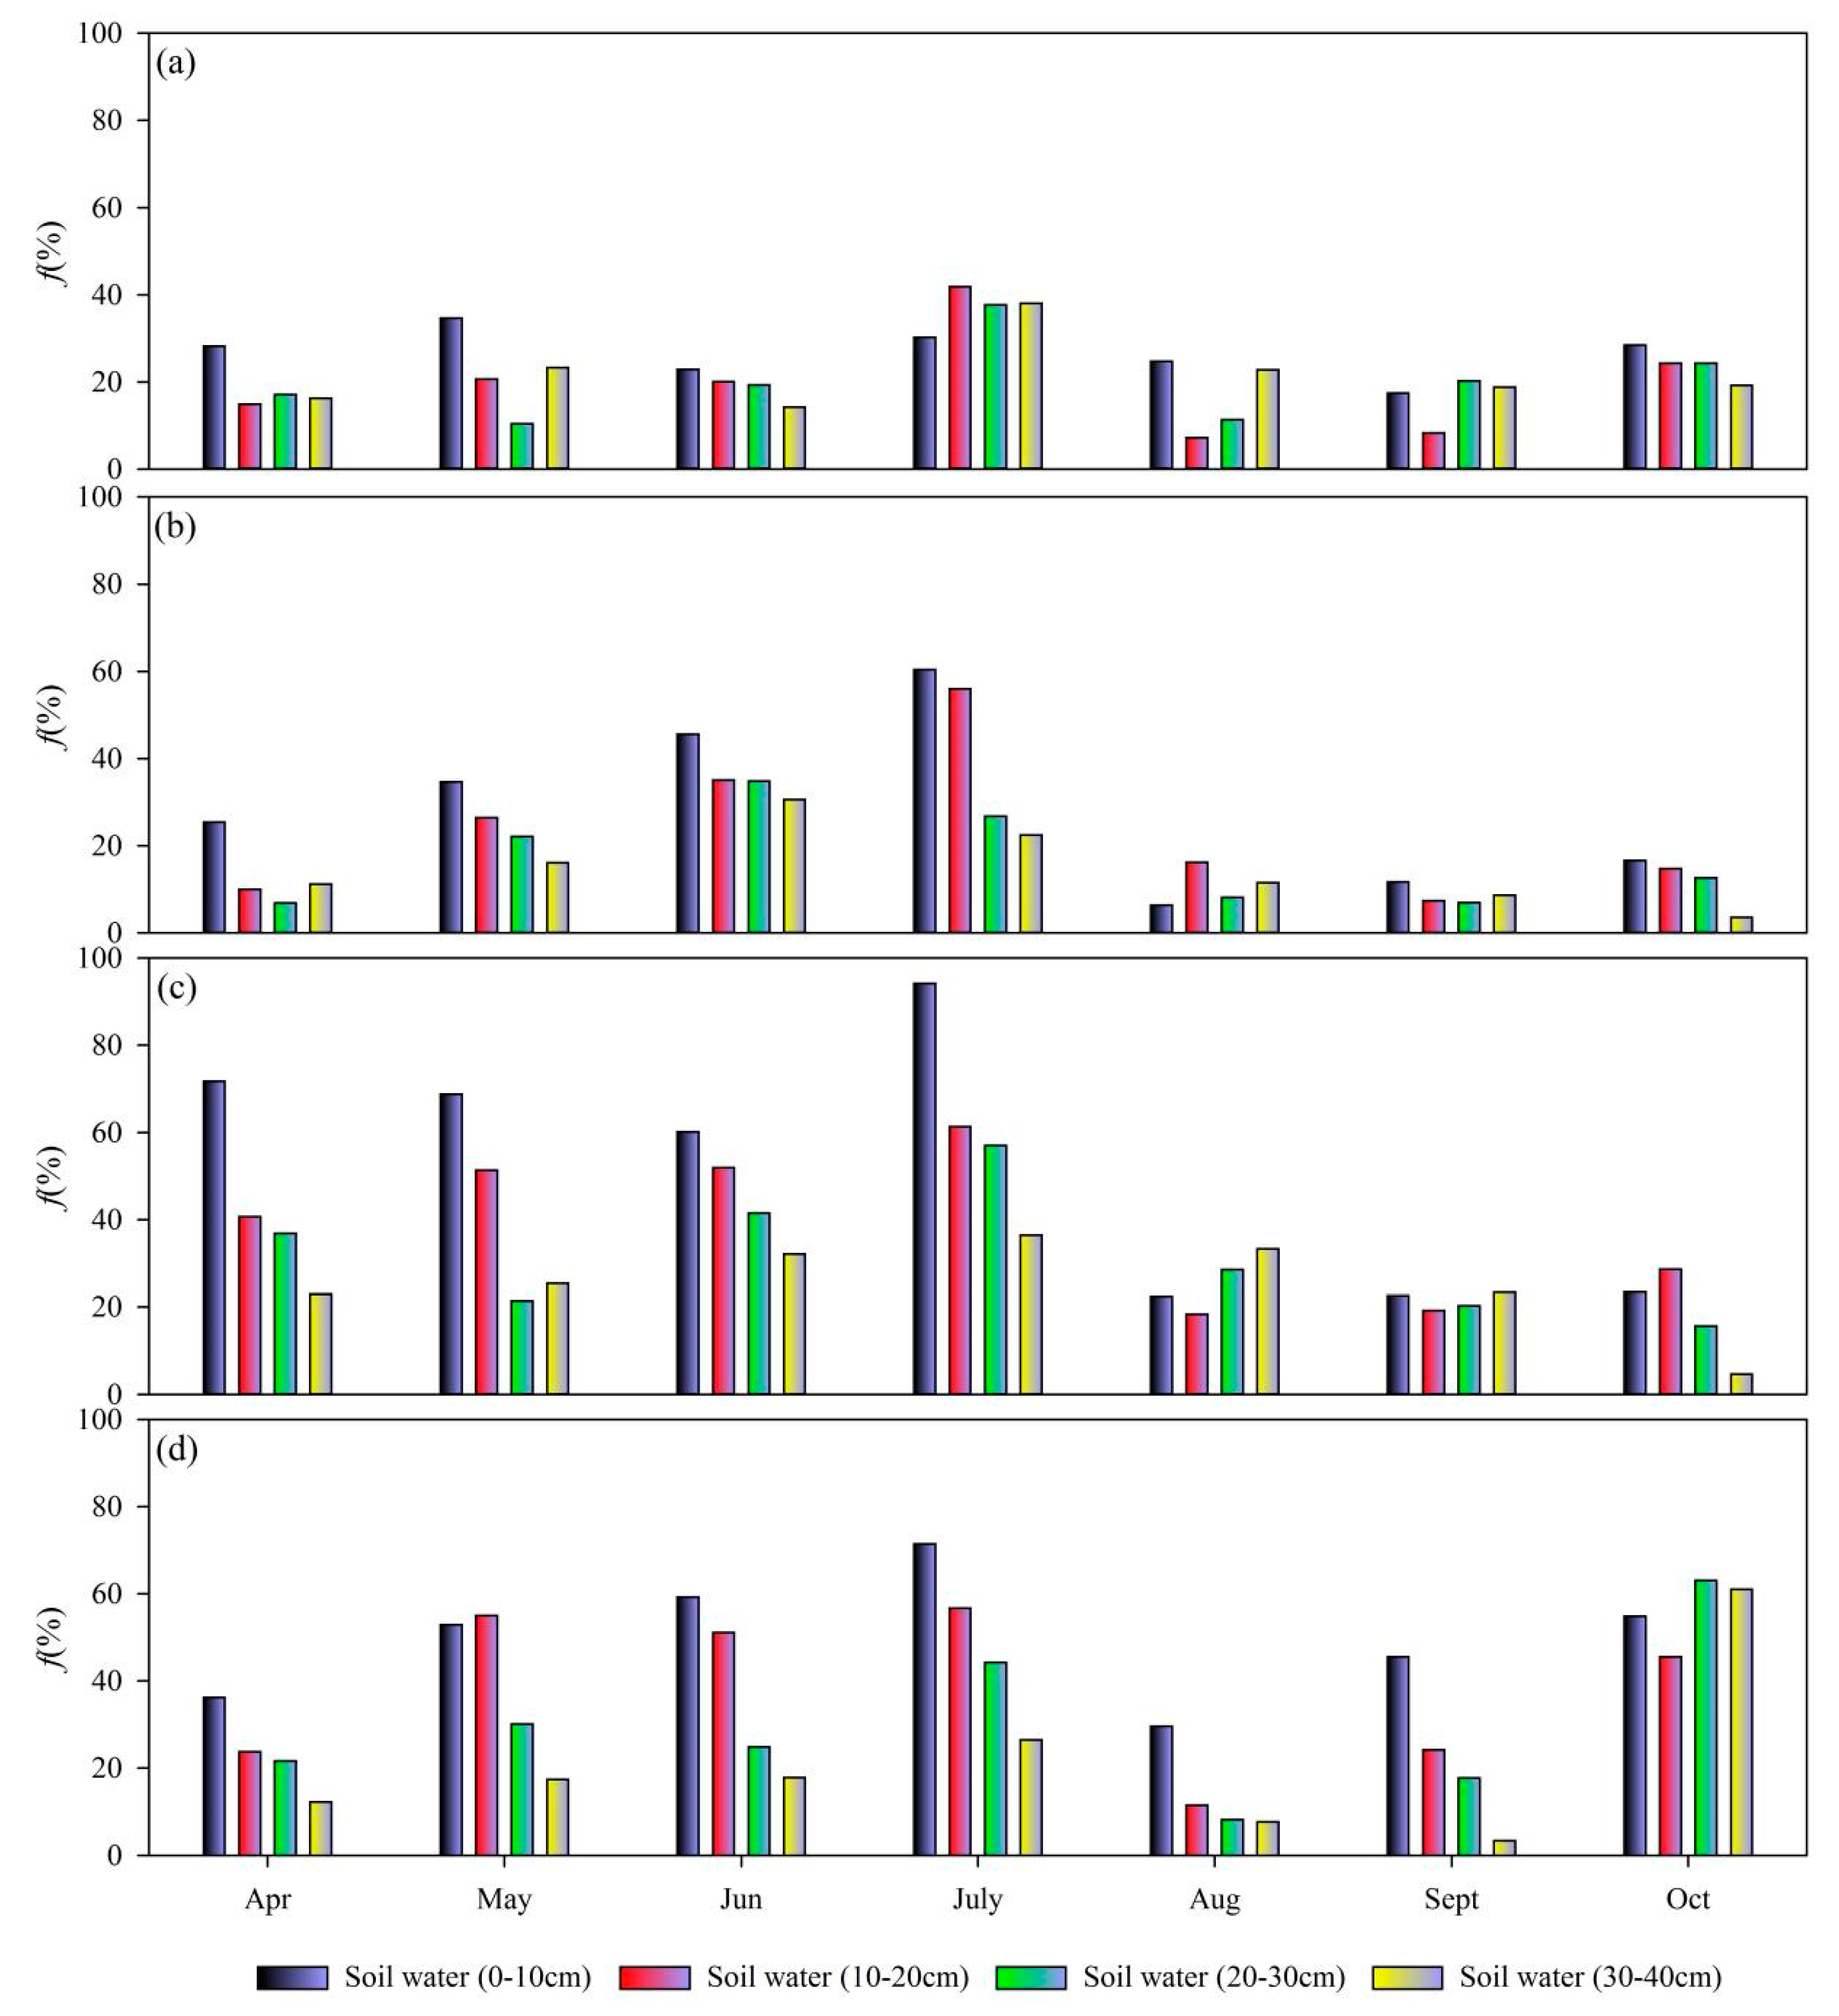
3.2. Temporal Dynamics in Soil Water Isotopes
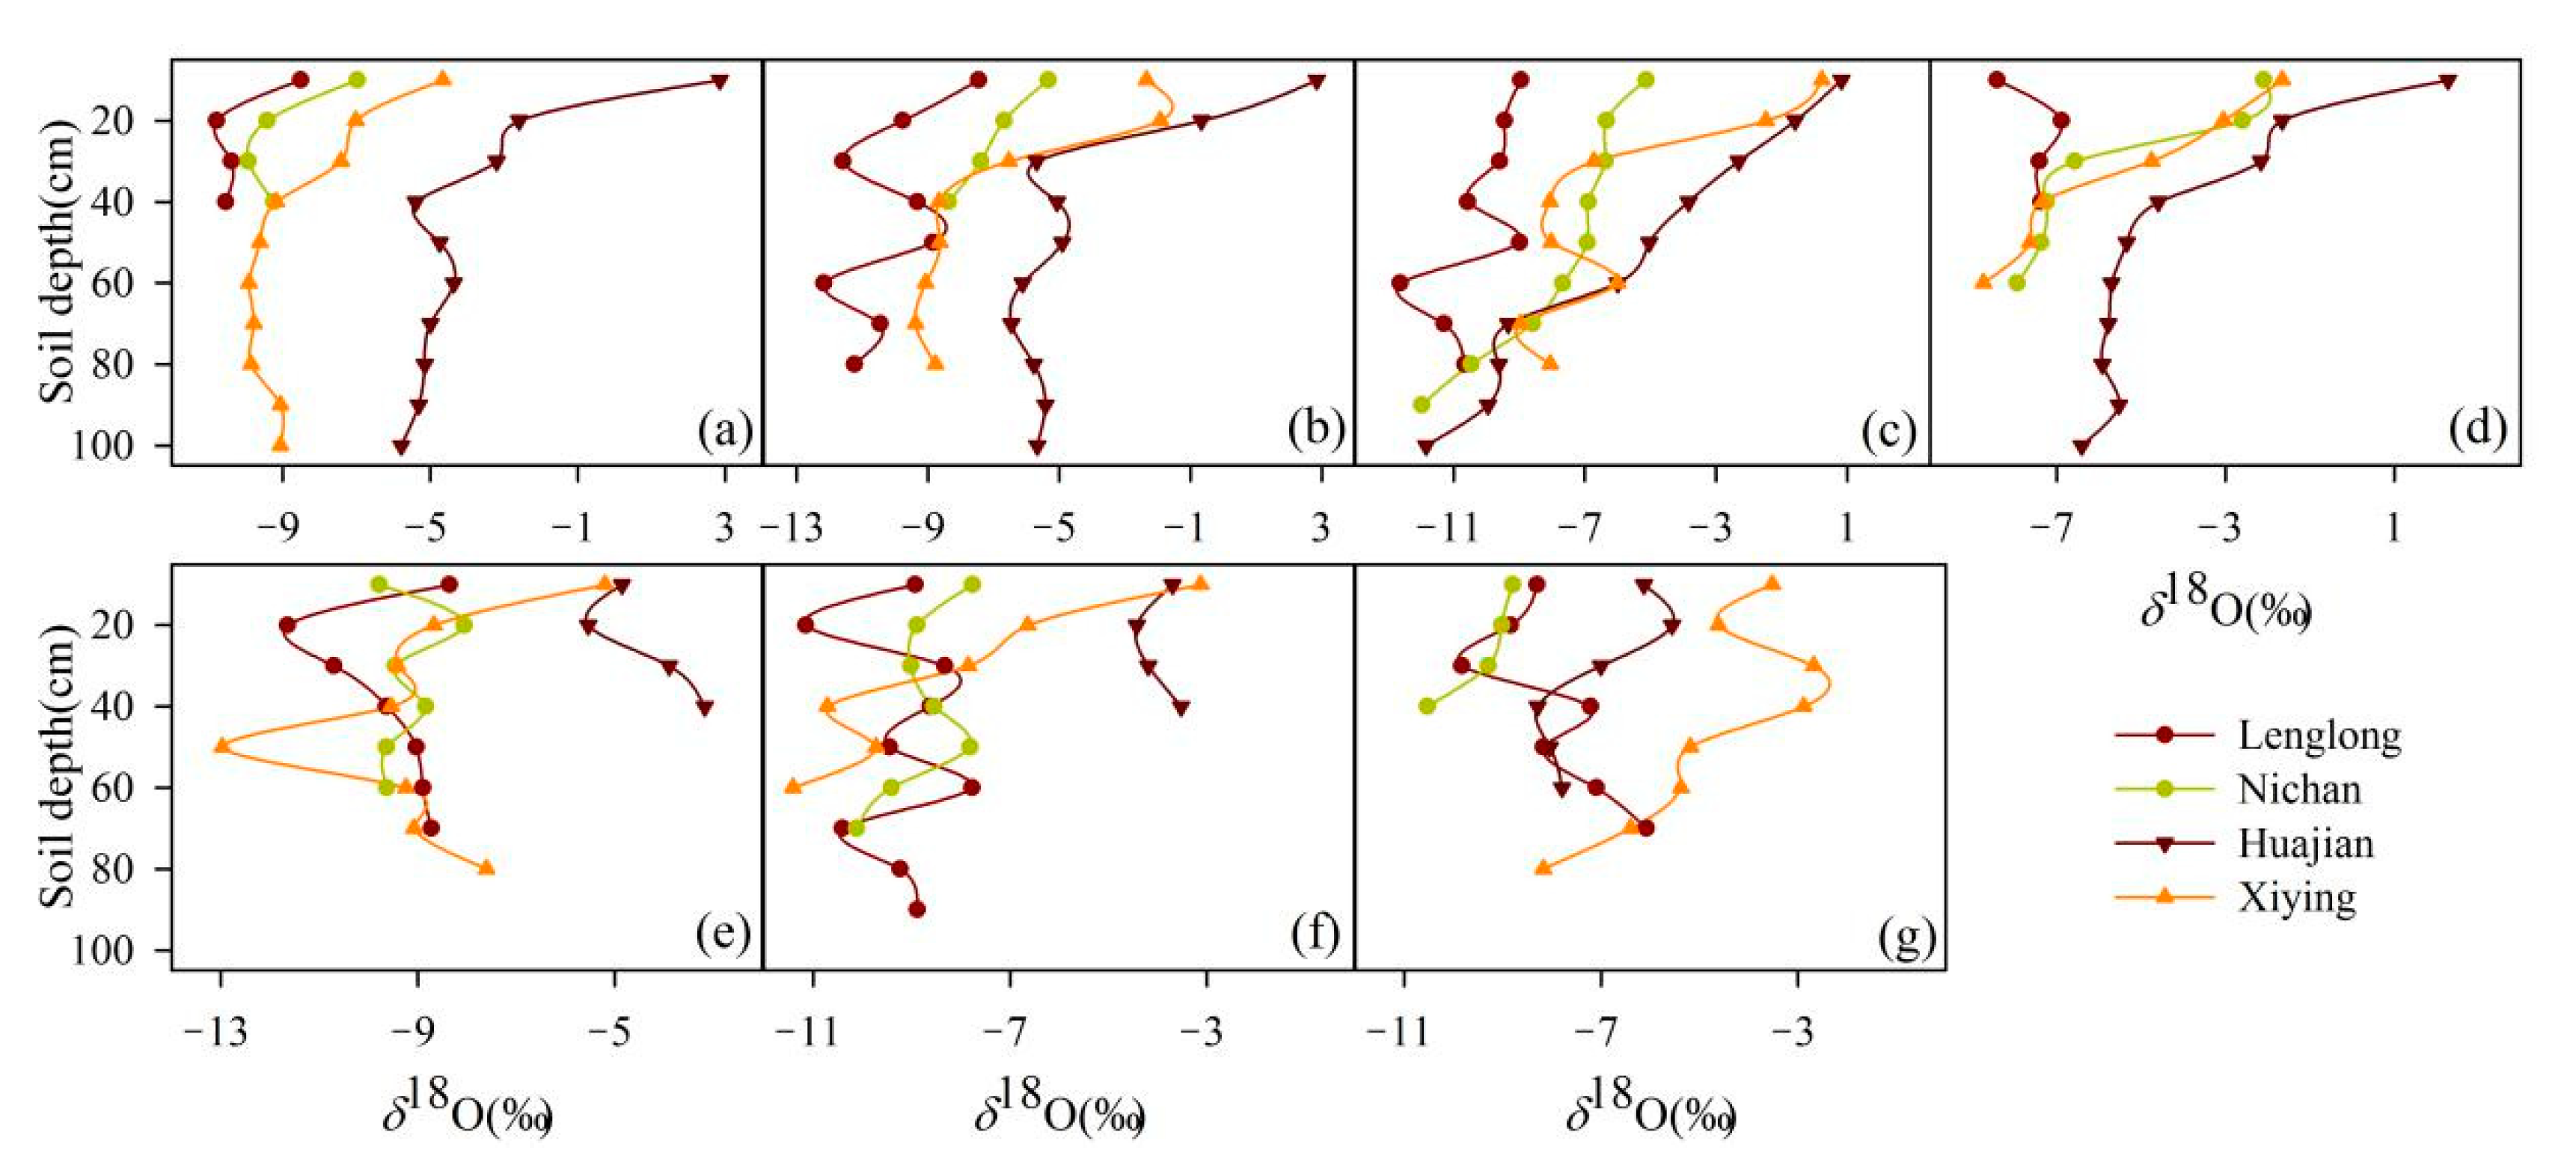
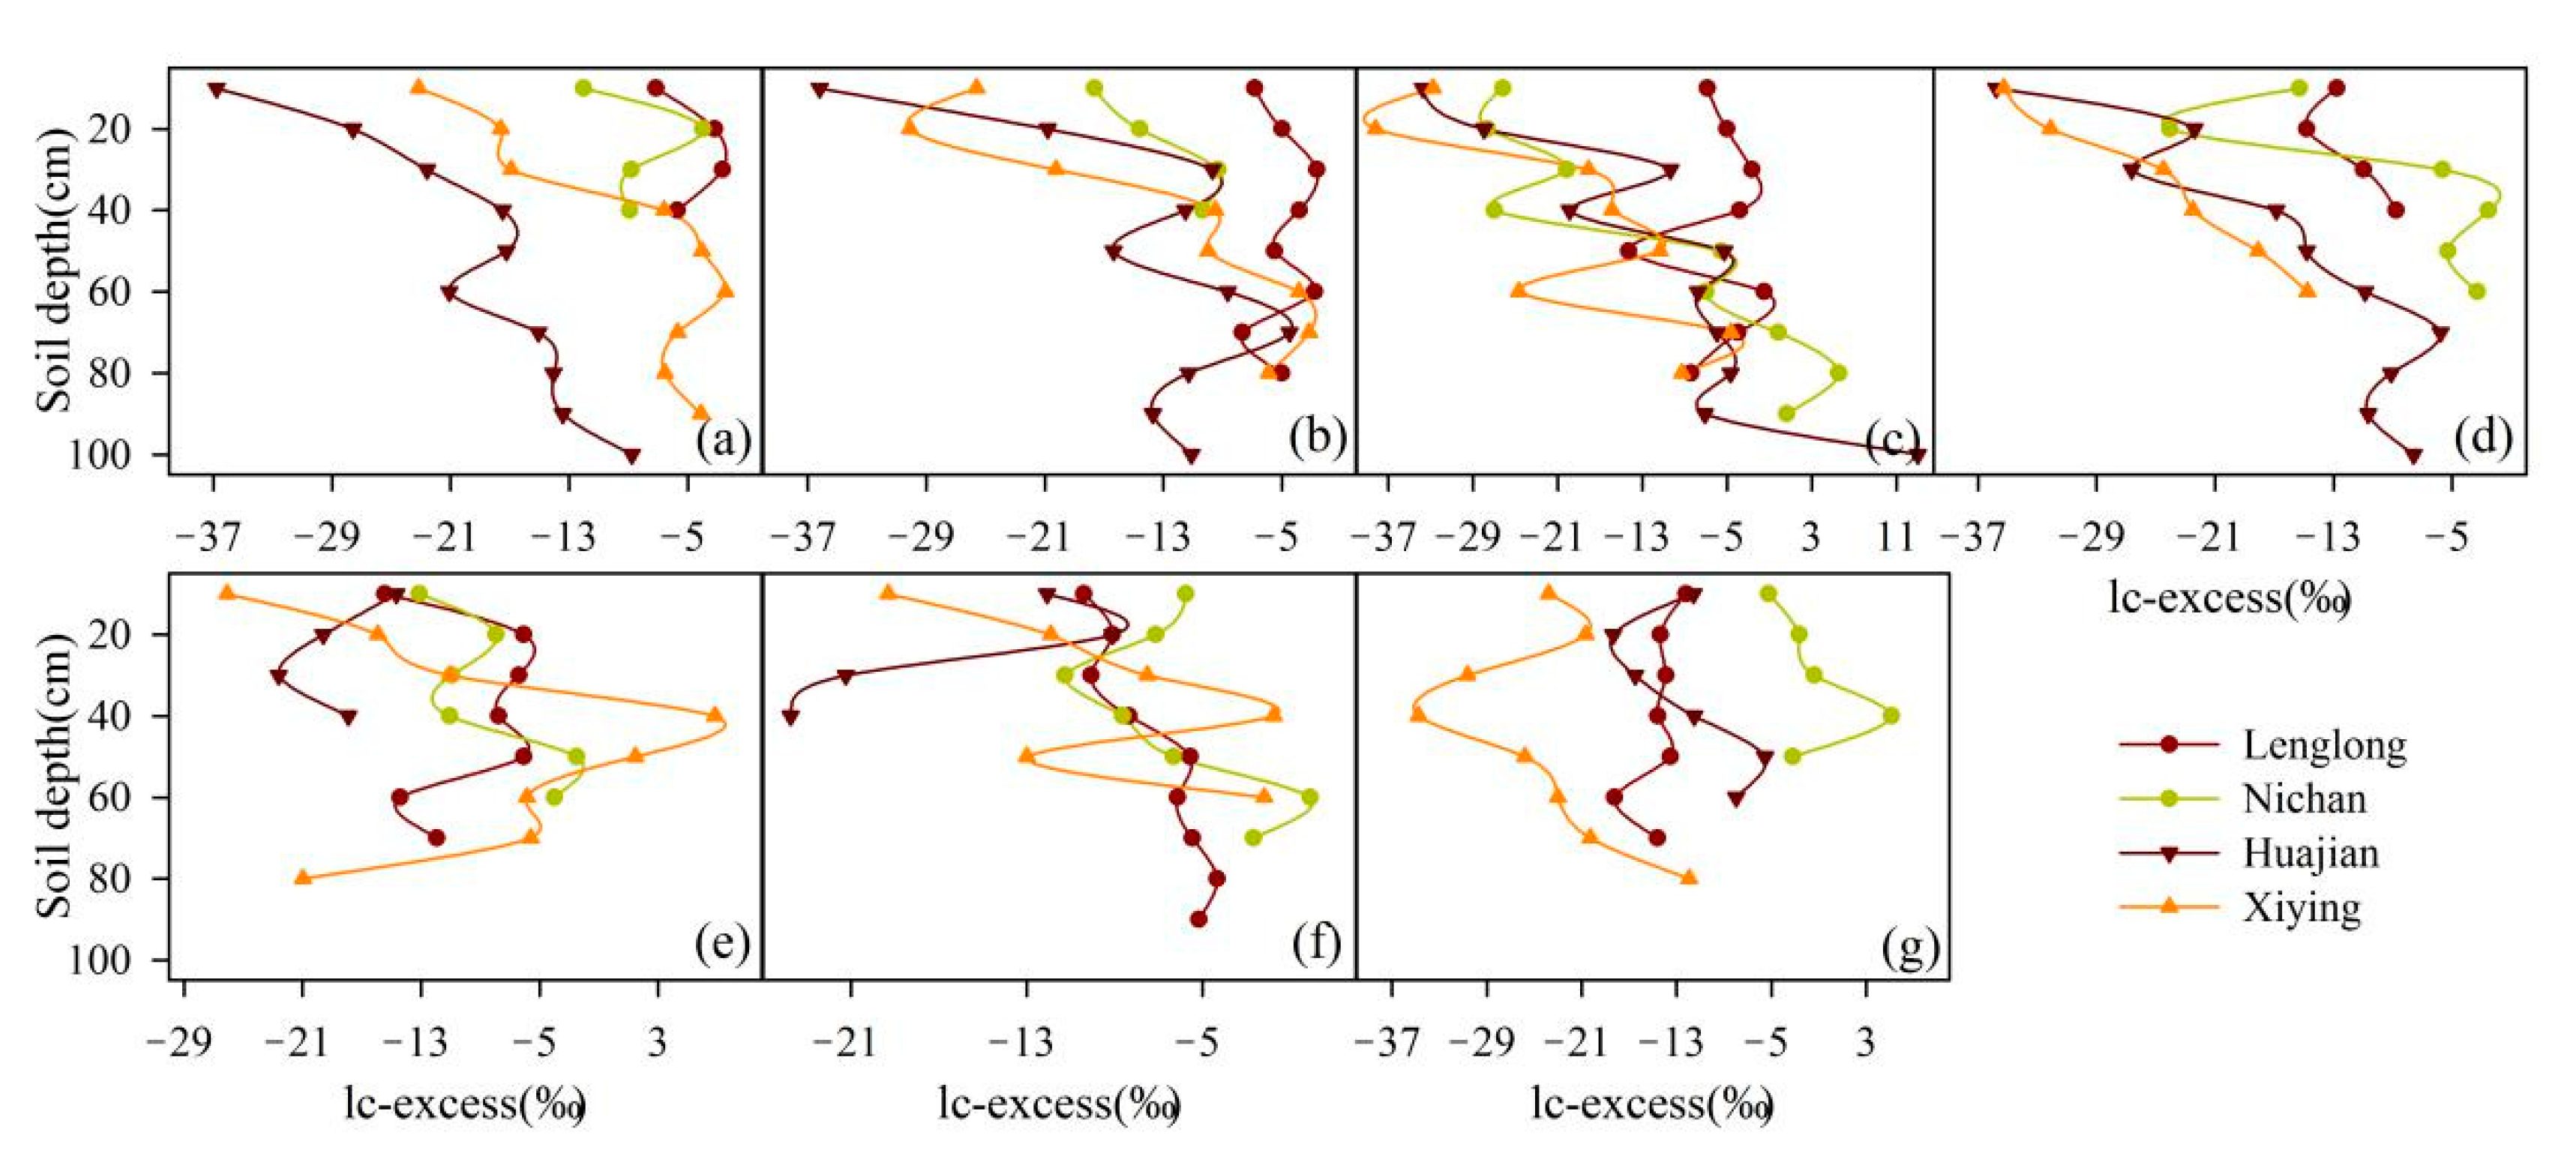
3.3. Spatial Soil Water Isotope Patterns
3.4. Evaporation Estimates
4. Discussion
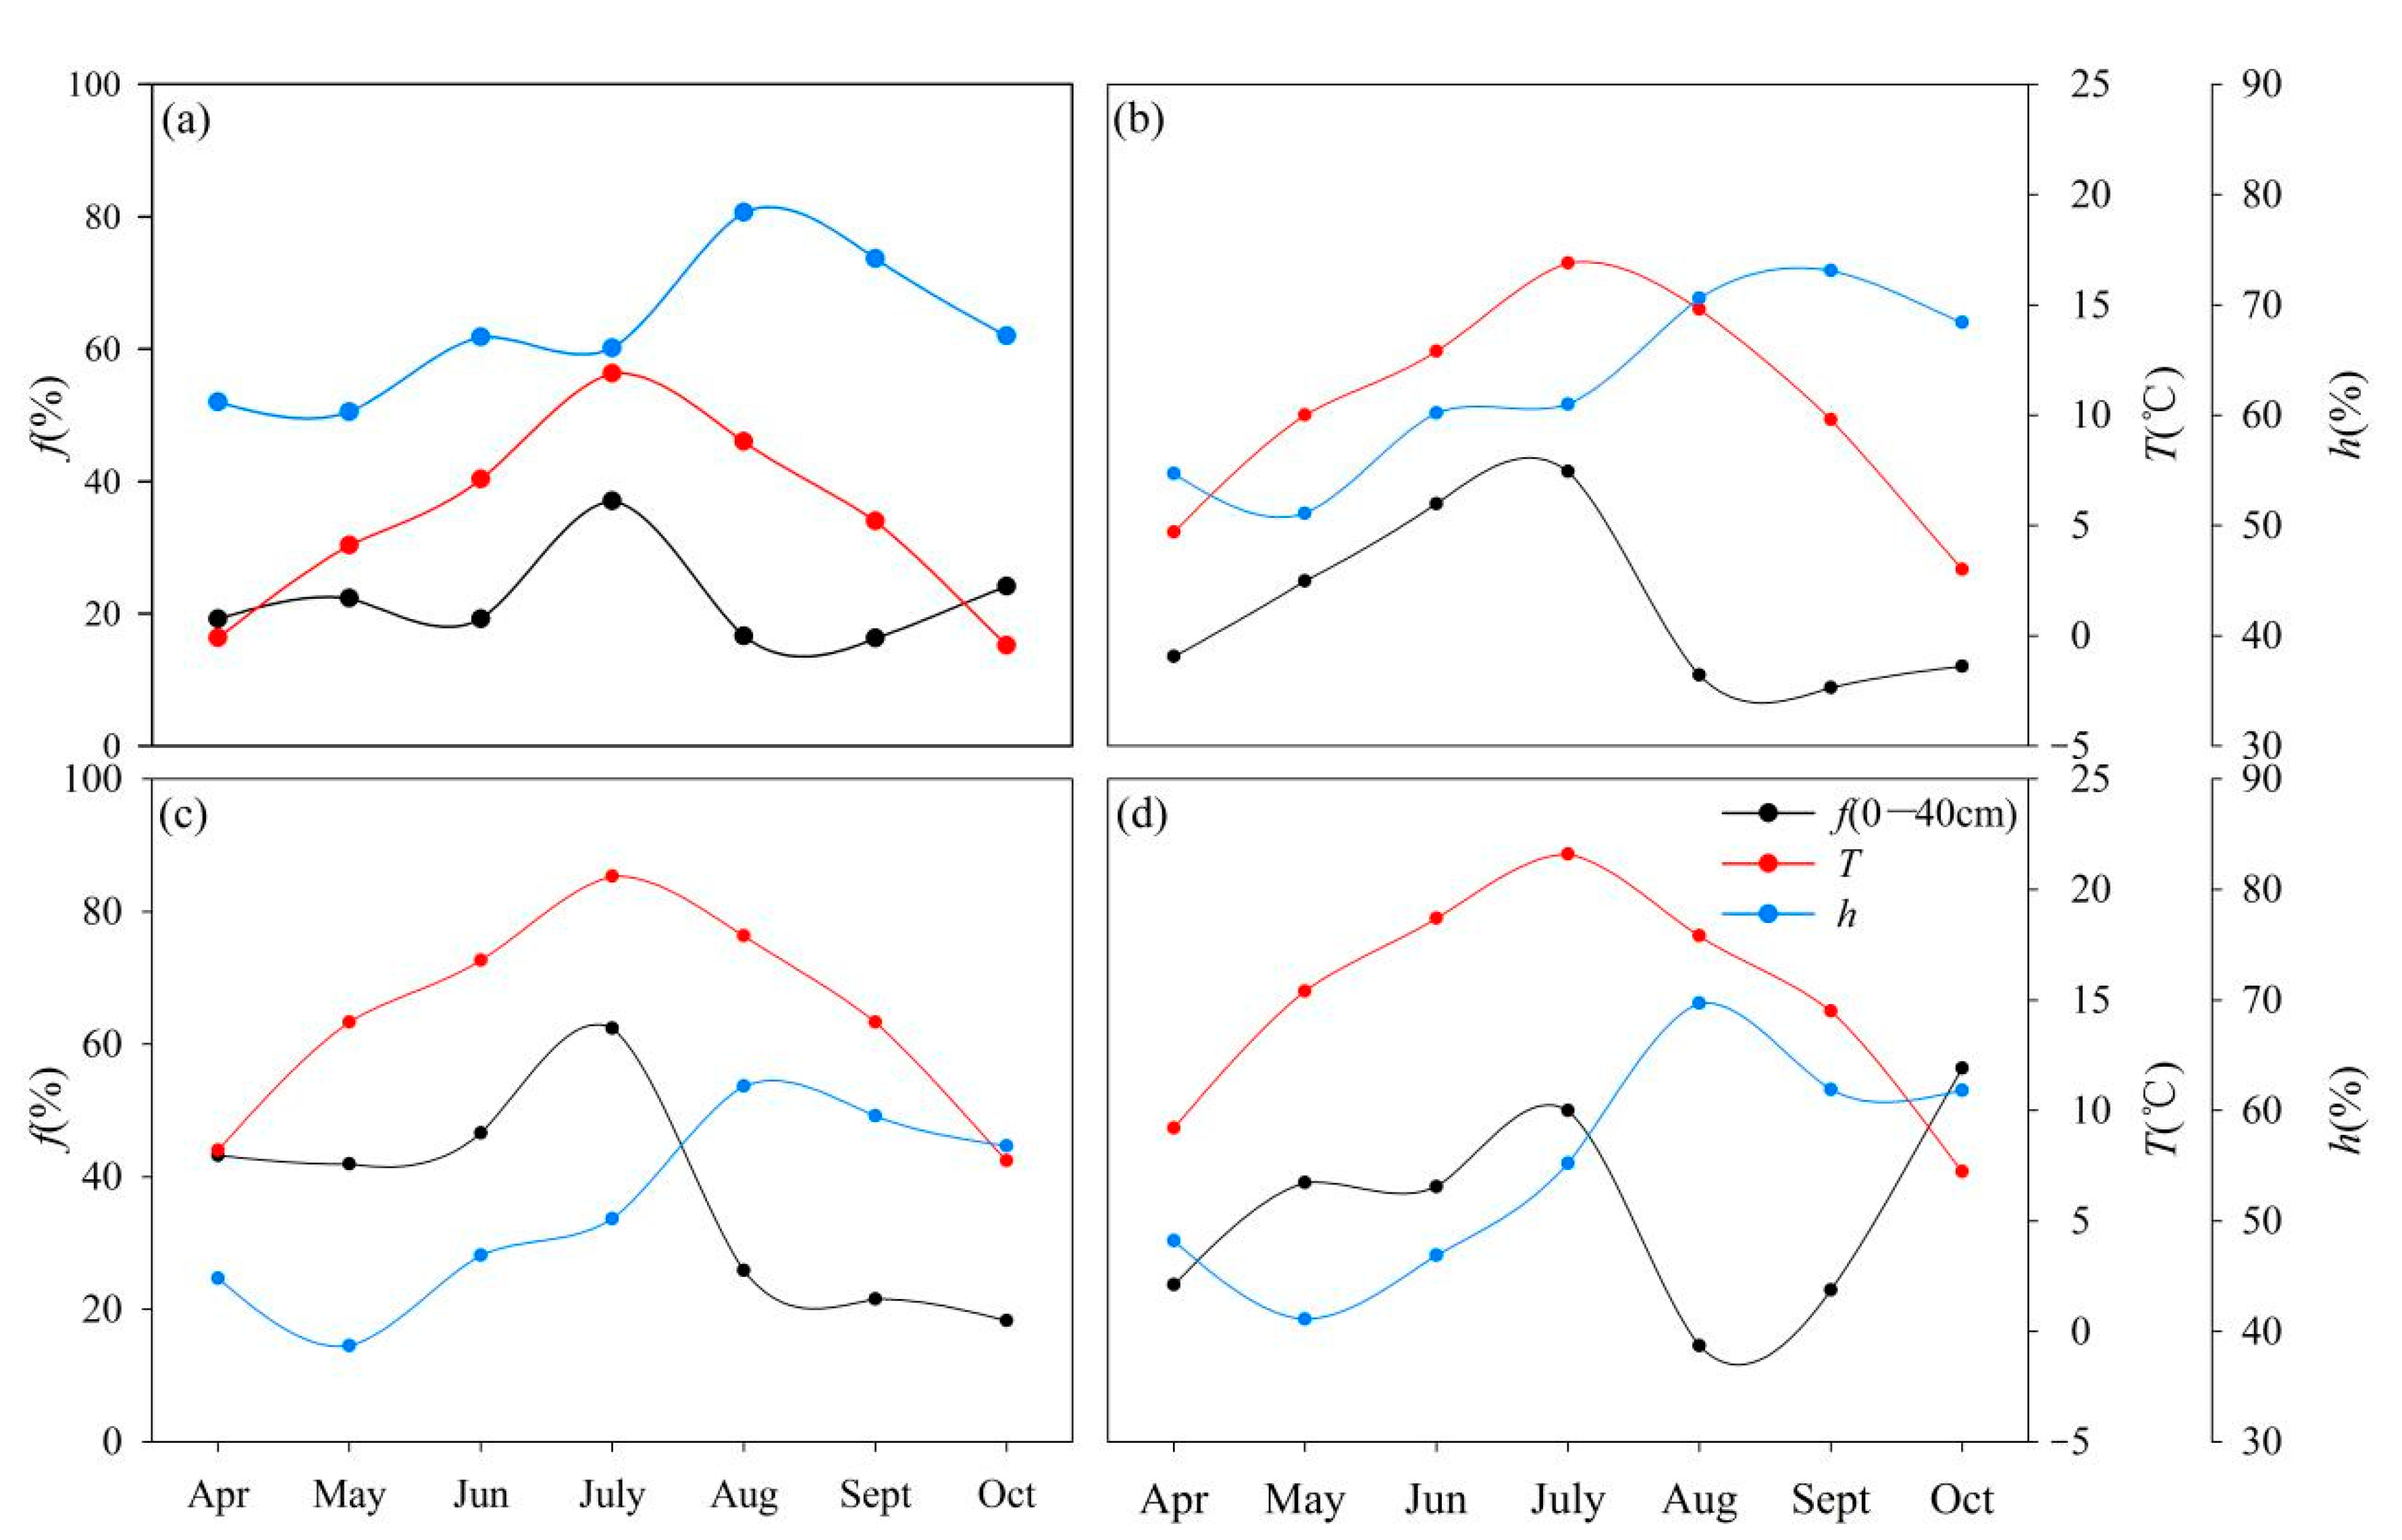
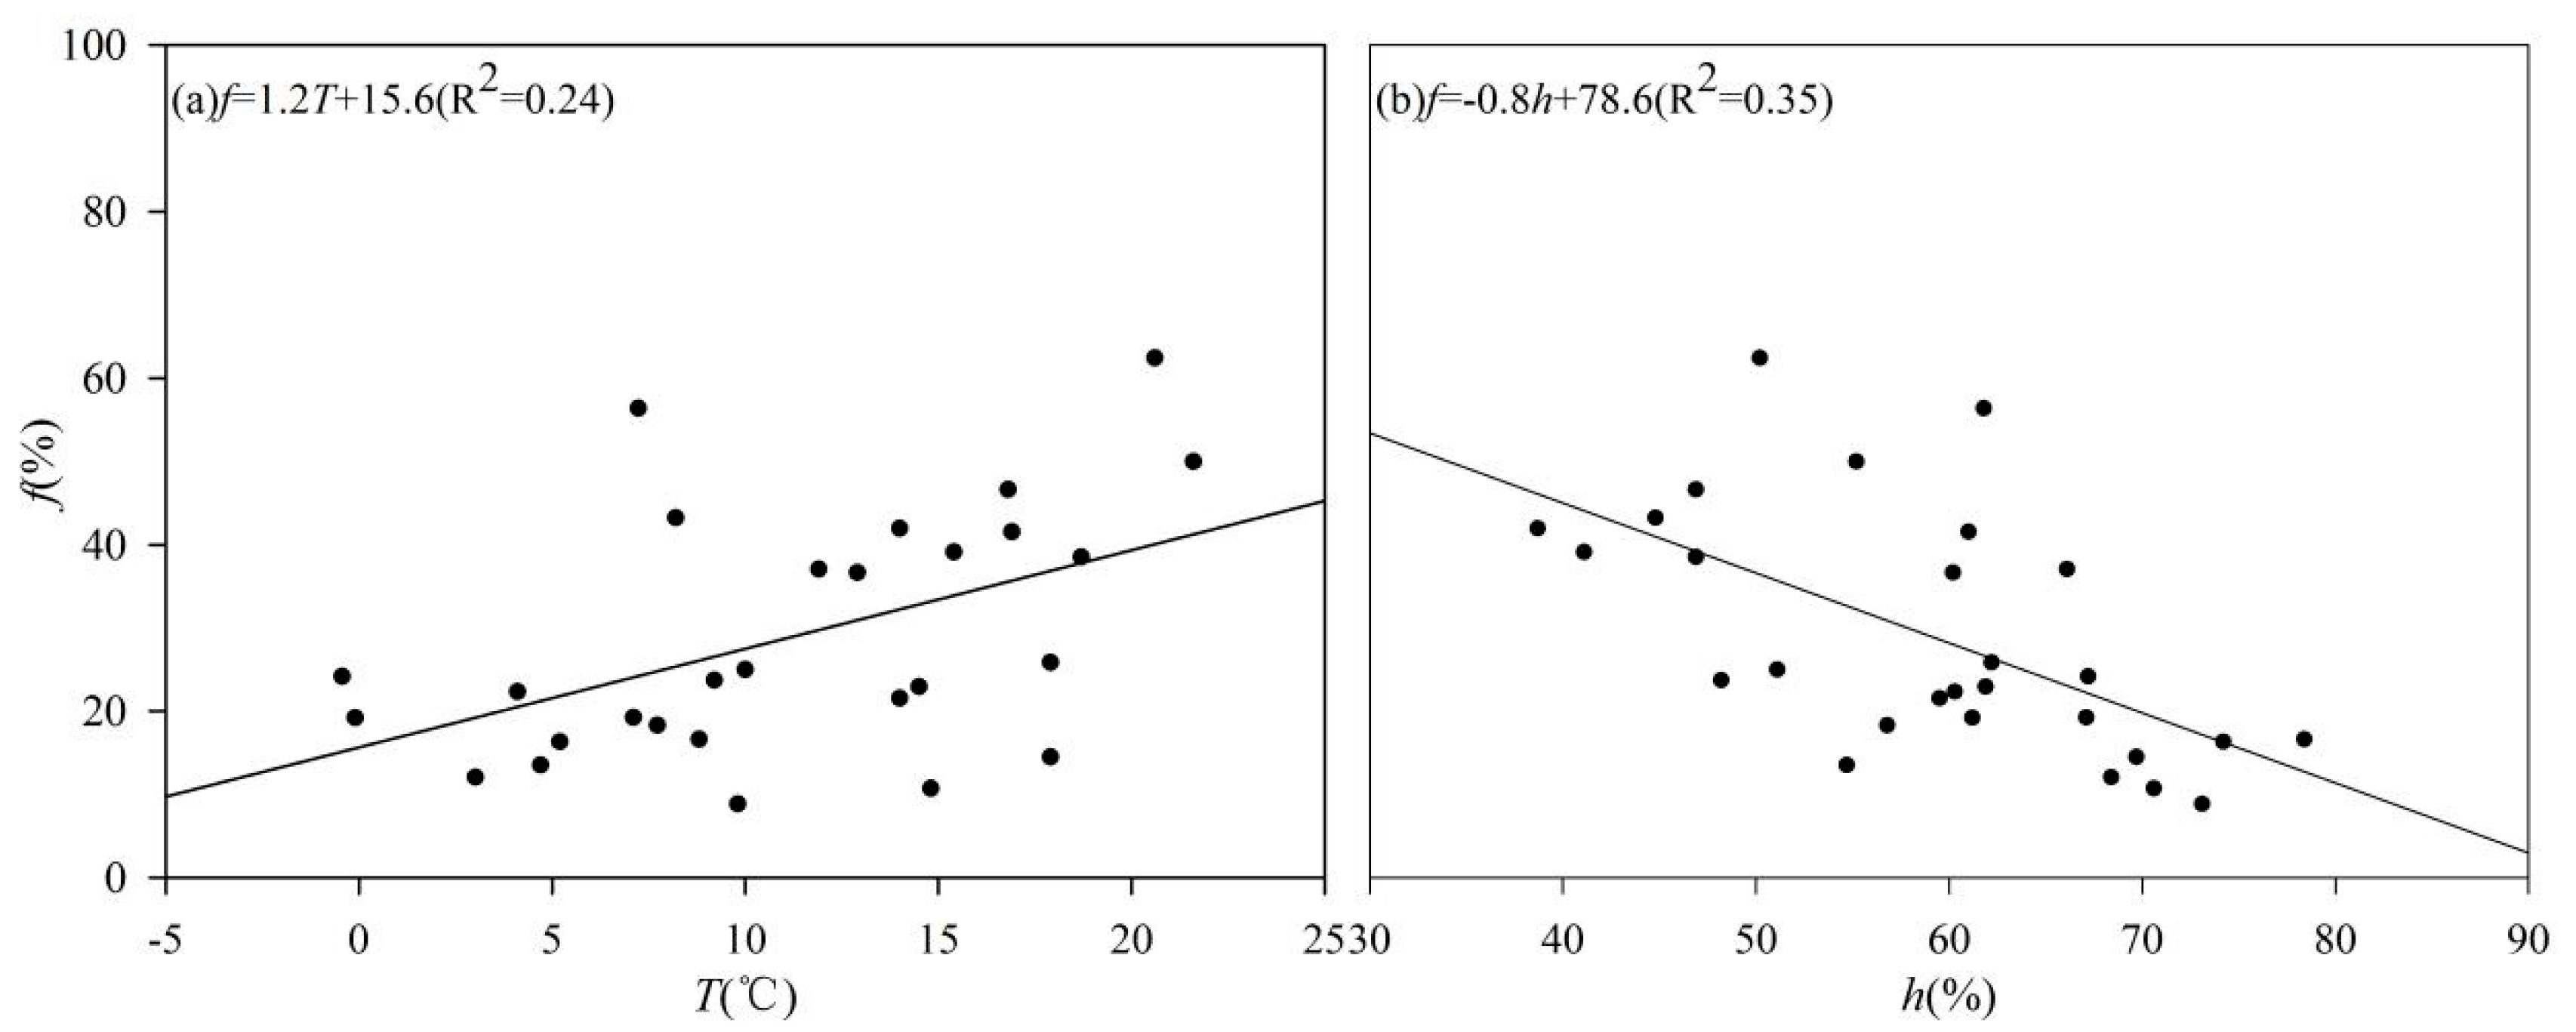
4.1. Temperature and Humidity Affects Soil Water Evaporation Losses
4.2. Soil Salt Content and Surface Vegetation Affects Soil Water Evaporation Losses
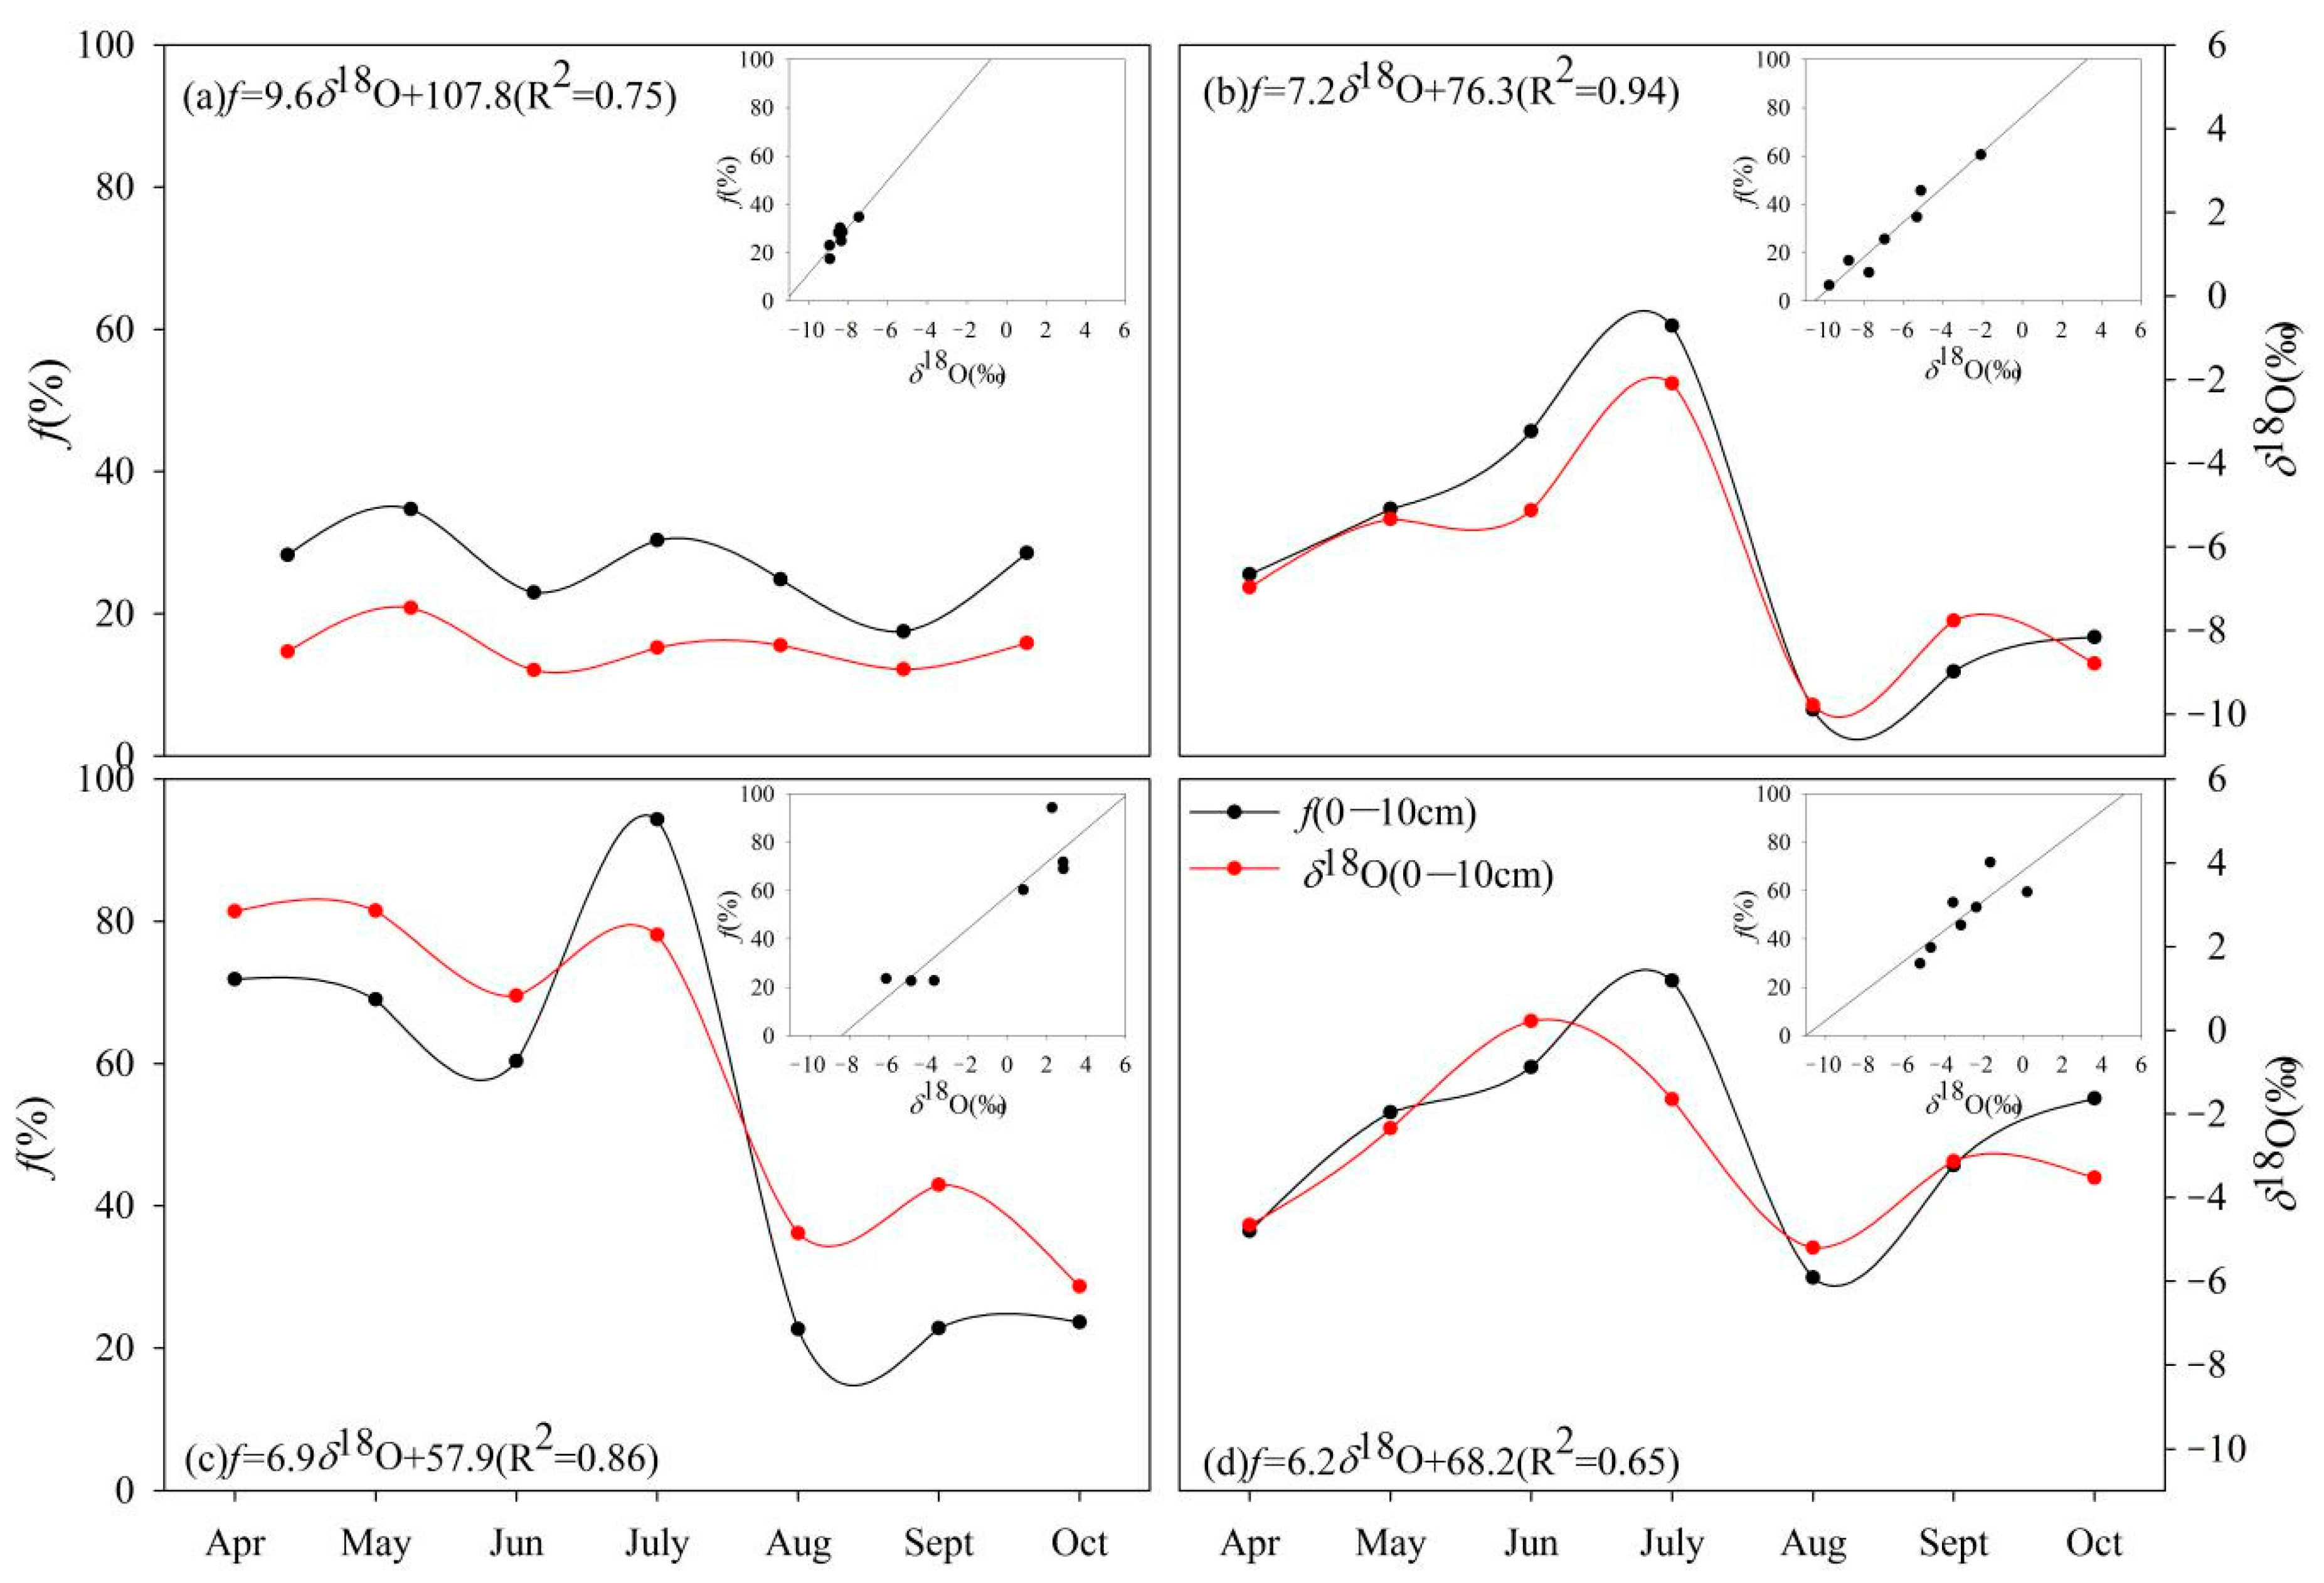
4.3. Is Evaporation Loss f Similar to δ18O Variation in Topsoil?
5. Conclusions
Author Contributions
Funding
Acknowledgments
Conflicts of Interest
References
- Ishikawa, M.; Zhang, Y.; Kadota, T.; Ohata, T. Hydrothermal regimes of the dry active layer. Water Resour. Res. 2006, 42. [Google Scholar] [CrossRef]
- Comola, F.; Schaefli, B.; Rinaldo, A.; Lehning, M. Thermodynamics in the hydrologic response: Travel time formulation and application to alpine catchments. Water Resour. Res. 2015, 51, 1671–1687. [Google Scholar] [CrossRef]
- Ferronsky, V.I. Stable Isotopes in Study of the Global Hydrological Cycle. In Nuclear Geophysics: Applications in Hydrology, Hydrogeology, Engineering Geology, Agriculture and Environmental Science; Ferronsky, V.I., Ed.; Springer International Publishing: Cham, Switzerland, 2015; pp. 227–322. [Google Scholar]
- Fu, B.; Wang, J.; Chen, L.; Qiu, Y. The effects of land use on soil moisture variation in the danangou catchment of the loess plateau, china. Catena 2003, 54, 197–213. [Google Scholar] [CrossRef]
- Rothfuss, Y.; Merz, S.; Vanderborght, J.; Hermes, N.; Weuthen, A.; Pohlmeier, A.; Vereecken, H.; Brüggemann, N. Long-term and high-frequency non-destructive monitoring of water stable isotope profiles in an evaporating soil column. Hydrol. Earth Syst. Sci. 2015, 19, 4067–4080. [Google Scholar] [CrossRef]
- Oerter, E.J.; Bowen, G.J. Spatiotemporal heterogeneity in soil water stable isotopic composition and its ecohydrologic implications in semi-arid ecosystems. Hydrol. Process. 2019, 33, 1724–1738. [Google Scholar] [CrossRef]
- Schlesinger, W.H. Evidence from chronosequence studies for a low carbon-storage potential of soils. Nature 1990, 348, 232–234. [Google Scholar] [CrossRef]
- Walter, I.A.; Allen, R.G.; Elliott, R.; Jensen, M.E.; Itenfisu, D.; Mecham, B.; Howell, T.A.; Snyder, R.; Brown, P.; Echings, S.; et al. ASCE’s standardized reference evapotranspiration equation. Presented at the Watershed Management & Operations Management, Fort Collins, CO, USA, 20–24 June 2000. [Google Scholar]
- Haghighi, E.; Gianotti, D.J.S.; Akbar, R.; Salvucci, G.D.; Entekhabi, D. Soil and Atmospheric Controls on the Land Surface Energy Balance: A Generalized Framework for Distinguishing Moisture-Limited and Energy-Limited Evaporation Regimes. Water Resour. Res. 2018, 54, 1831–1851. [Google Scholar] [CrossRef]
- Gusev, E.M.; Nasonova, O.N. Parametrization of heat and moisture transfer in the groundwater-soil-plant (snow) cover-atmosphere system in the regions with continental climate. Pochvovedenie 2000, 33, 641–653. [Google Scholar]
- Xie, S.; Qu, J.; Zhang, K.; Mu, Y.; Xu, X.; Pang, Y.; Wang, T. Hydrothermal variation and its influence on the desertified ground surface of qinghai–tibet plateau. Appl. Therm. Eng. 2018, 131, 201–208. [Google Scholar] [CrossRef]
- Aydın, M.; Watanabe, T.; Kapur, S. Sensitivity of Reference Evapotranspiration and Soil Evaporation to Climate Change in the Eastern Mediterranean Region. In Climate Change Impacts on Basin Agro-ecosystems; Watanabe, T., Kapur, S., Aydın, M., Kanber, R., Akça, E., Eds.; Springer International Publishing: Cham, Switzerland, 2019; pp. 295–315. [Google Scholar]
- Zimmermann, U.; Munnich, K.O.; Roether, W.; Kreutz, W.; Schubach, K.; Siegel, O. Tracers determine movement of soil moisture and evapotranspiration. Science 1966, 152, 346–347. [Google Scholar] [CrossRef]
- Oleghe, E.; Naveed, M.; Baggs, E.M.; Hallett, P.D. Plant exudates improve the mechanical conditions for root penetration through compacted soils. Plant Soil 2017, 421, 19–30. [Google Scholar] [CrossRef] [PubMed]
- Barnes, C.J.; Allison, G.B. Tracing of water movement in the unsaturated zone using stable isotopes of hydrogen and oxygen. J. Hydrol. 1988, 100, 143–176. [Google Scholar] [CrossRef]
- Rothfuss, Y.; Braud, I.; Le Moine, N.; Biron, P.; Durand, J.; Vauclin, M.; Bariac, T. Factors controlling the isotopic partitioning between soil evaporation and plant transpiration: Assessment using a multi-objective calibration of SiSPAT-Isotope under controlled conditions. J. Hydrol. 2012, 442–443, 75–88. [Google Scholar] [CrossRef]
- Zhu, G.; Guo, H.; Qin, D.; Pan, H.; Zhang, Y.; Jia, W.; Ma, X. Contribution of recycled moisture to precipitation in the monsoon marginal zone: Estimate based on stable isotope data. J. Hydrol. 2019, 569, 423–435. [Google Scholar] [CrossRef]
- Rothfuss, Y.; Biron, P.; Braud, I.; Canale, L.; Durand, J.L.; Gaudet, J.P.; Richard, P.; Vauclin, M.; Bariac, T. Partitioning evapotranspiration fluxes into soil evaporation and plant transpiration using water stable isotopes under controlled conditions. Hydrol. Process. 2010, 24, 3177–3194. [Google Scholar] [CrossRef]
- Mathieu, R.; Bariac, T. An isotopic study (2H and 18O) of water movements in clayey soils under a semiarid climate. Water Resour. Res. 1996, 32, 779–790. [Google Scholar] [CrossRef]
- Fekete, S.; Weis, P.; Driesner, T.; Bouvier, A.S.; Baumgartner, L.; Heinrich, C.A. Contrasting hydrological processes of meteoric water incursion during magmatic-hydrothermal ore deposition: An oxygen isotope study by ion microprobe. Earth Planet. Sci. Lett. 2016, 451, 263–271. [Google Scholar] [CrossRef]
- Craig, H. Isotopic variations in meteoric waters. Science 1961, 133, 1702–1703. [Google Scholar] [CrossRef]
- Gibson, J.J.; Fekete, B.M.; Bowen, G.J. Stable Isotopes in Large Scale Hydrological Applications. In Isoscapes; Springer: Dordrecht, The Netherlands, 2010; pp. 389–405. [Google Scholar]
- Yin, L.; Zhao, L.J.; Yun-Feng, R.; Xiao, H.L.; Cheng, G.D.; Zhou, M.X.; Li, C. Study of the replenishment sources of typical ecosystems water and dominant plant water in the lower reaches of the heihe, China. J. Glaciol. Geocryol. 2012, 38, 85–88. [Google Scholar]
- Ala-Aho, P.; Soulsby, C.; Pokrovsky, O.S.; Kirpotin, S.N.; Karlsson, J.; Serikova, S.; Vorobyevd, S.N.; Manasypovd, R.M.; Loikod, S.; Tetzlaffa, D. Using stable isotopes to assess surface water source dynamics and hydrological connectivity in a high-latitude wetland and permafrost influenced landscape. J. Hydrol. 2018, 556, 279–293. [Google Scholar] [CrossRef]
- Craig, H.; Gordon, L.I. Nitrous oxide in the ocean and the marine atmosphere. Geochim. Cosmochim. Acta 1963, 27, 949–955. [Google Scholar] [CrossRef]
- Majoube, M. Fractionation factor of 18O between water vapour and ice. Nature 1970, 226, 1242. [Google Scholar] [CrossRef] [PubMed]
- Gonfiantini, R. Environmental isotopes in lake studies. Terr. Environ. 1986, 2, 113–168. [Google Scholar]
- Skrzypek, G.; Mydlowski, A.; Dogramaci, S.; Hedley, P.; Gibson, J.J.; Grierson, P.F. Estimation of evaporative loss based on the stable isotope composition of water using Hydrocalculator. J. Hydrol. 2015, 523, 781–789. [Google Scholar] [CrossRef]
- Barnes, C.J.; Allison, G.B.; Hughes, M.W. Temperature gradient effects on stable isotope and chloride profiles in dry soils. J. Hydrol. 1989, 112, 69–87. [Google Scholar] [CrossRef]
- Gowing, J.W.; Konukcu, F.; Rose, D.A. Evaporative flux from a shallow watertable: The influence of a vapour-liquid phase transition. J. Hydrol. 2006, 321, 77–89. [Google Scholar] [CrossRef]
- Zimmermann, U.; Ehhalt, D.; Muennich, K.O. Soil-water movement and evapotranspiration: Changes in the isotopic composition of the water. In Isotopes in Hydrology; International Atomic Energy Agency: Vienna, Austria, 1967; pp. 567–585. [Google Scholar]
- Craig, H.; Gordon, L.I.; Horibe, Y. Isotopic exchange effects in the evaporation of water: 1. Low-temperature experimental results. J. Geophys. Res. 1963, 68, 5079–5087. [Google Scholar] [CrossRef]
- Phillips, D.L.; Gregg, J.W. Uncertainty in source partitioning using stable isotopes. Oecologia 2001, 127, 171–179. [Google Scholar] [CrossRef]
- Choi, W.J.; Ro, H.M. Differences in isotopic fractionation of nitrogen in water-saturated and unsaturated soils. Soil Biol. Biochem. 2003, 35, 483–486. [Google Scholar] [CrossRef]
- Skuratovič, Ž.; Mažeika, J.; Petrošius, R.; Martma, T. Investigations of the unsaturated zone at two radioactive waste disposal sites in lithuania. Isot. Environ. Health Stud. 2016, 52, 544–552. [Google Scholar] [CrossRef]
- Allison, G.B.; Barnes, C.J.; Hughes, M.W. The distribution of deuterium and 18O in dry soils 2. Experimental. J. Hydrol. 1983, 64, 377–397. [Google Scholar] [CrossRef]
- Wang, H.; Zhanbin, L.I.; Bo, M.A.; Jianye, M.A.; Zhang, L. Characteristics of Hydrogen and Oxygen Isotopes in Different Waters of the Loess Hilly and Gully Region. J. Soil Water Conserv 2016, 4, 85–90, 135. [Google Scholar]
- Gat, J.R. Comments on the stable isotope method in regional groundwater investigations. Water Resour. Res. 1971, 7, 980–993. [Google Scholar] [CrossRef]
- Dawson, T.E.; Ehleringer, J.R. Streamside trees that do not use stream water. Nature 1991, 350, 335–337. [Google Scholar] [CrossRef]
- Turner, J.V.; Arad, A.; Johnston, C.D. Environmental isotope hydrology of salinized experimental catchments. J. Hydrol. 1987, 94, 89–107. [Google Scholar] [CrossRef]
- Depaolo, D.J.; Conrad, M.E.; Maher, K.; Gee, G.W. Evaporation Effects on Oxygen and Hydrogen Isotopes in Deep Vadose Zone Pore Fluids at Hanford, Washington. Vadose Zone J. 2004, 3, 220–232. [Google Scholar] [CrossRef]
- Braud, I.; Bariac, T.; Biron, P.; Vauclin, M. Isotopic composition of bare soil evaporated water vapor. Part II: Modeling of RUBIC IV experimental results. J. Hydrol. 2009, 369, 17–29. [Google Scholar] [CrossRef]
- Wang, C.; Dong, Z.; Qin, X.; Zhang, J.; Du, W.; Wu, J. Glacier meltwater runoff process analysis using δD and δ18O isotope and chemistry at the remote Laohugou glacier basin in western Qilian mountains, China. J. Geophys. Sci. 2016, 26, 722–734. [Google Scholar] [CrossRef]
- Wu, J.K.; Ding, Y.J.; Yang, J.H.; Liu, S.W.; Chen, J.Z.; Zhou, J.X.; Qin, X. Spatial variation of stable isotopes in different waters during melt season in the Laohugou glacial catchment, Shule river basin. J. Mt. Sci. 2016, 13, 1453–1463. [Google Scholar] [CrossRef]
- Xinggang, M.; Wenxiong, J.; Guofeng, Z.; Dan, D.; Hanxiong, P.; Xiuting, X.; Huiwena, G.; Yua, Z.; Ruifeng, Y. Stable isotope composition of precipitation at different elevations in the monsoon marginal zone. Quat. Int. 2018, 493, 86–95. [Google Scholar] [CrossRef]
- Landwehr, J.M.; Coplen, T.B. Line-conditioned excess: A new method for characterizing stable hydrogen and oxygen isotope ratios in hydrologic systems. In Isotopes in Environmental Studies; International Atomic Energy Agency: Vienna, Austria, 2004. [Google Scholar]
- Landwehr, J.M.; Coplen, T.B.; Stewart, D.W. Spatial seasonal, and source variability in the stable hydrogen and oxygen isotopic composition of tap water throughout the USA. Hydrol. Process. 2014, 28, 5382–5422. [Google Scholar] [CrossRef]
- Sprenger, M.; Tetzlaff, D.; Soulsby, C. Soil water stable isotopes reveal evaporation dynamics at the soil–plant–atmosphere interface of the critical zone. Hydrol. Earth Syst. Sci. 2017, 21, 3839–3858. [Google Scholar] [CrossRef]
- Javaux, M.; Rothfuss, Y.; Vanderborght, J.; Vereecken, H.; Bruggemann, N. Isotopic composition of plant water sources. Nature 2016, 536, E1–E3. [Google Scholar] [CrossRef] [PubMed]
- Horita, J.; Wesolowski, D.J. Liquid-vapor fractionation of oxygen and hydrogen isotopes of water from the freezing to the critical temperature. Geochim. Cosmochim. Acta 1994, 58, 3425–3437. [Google Scholar] [CrossRef]
- Gat, J.R. Oxygen and hydrogen isotopes in the hydrologic cycle. Annu. Rev. Earth Planet. Sci. 1996, 24, 225–262. [Google Scholar] [CrossRef]
- Araguasaraguas, L.; Froehlich, K.; Rozanski, K. Deuterium and oxygen-18 isotope composition of precipitation and atmospheric moisture. Hydrol. Process. 2000, 14, 1341–1355. [Google Scholar] [CrossRef]
- Gibson, J.J.; Reid, R. Water balance along a chain of tundra lakes: A 20-year isotopic perspective. J. Hydrol. 2014, 519, 2148–2164. [Google Scholar] [CrossRef]
- Gibson, J.J.; Birks, S.J.; Yi, Y. Stable isotope mass balance of lakes: A contemporary perspective. Quat. Sci. Rev. 2016, 131, 316–328. [Google Scholar] [CrossRef]
- Pang, H.X.; He, Y.Q.; Lu, A.G.; Zhao, J.D.; Ning, B.Y.; Yuan, L.L.; Song, B. Synoptic-scale variation of δ18O in summer monsoon rainfall at Lijiang, China. Chin. Sci. Bull. 2006, 51, 2897–2904. [Google Scholar] [CrossRef]
- Zongxing, L.; Qi, F.; Song, Y.; Wang, Q.J.; Yang, J.; Yongge, L.; Jianguo, L.; Xiaoyan, G. Stable isotope composition of precipitation in the south and north slopes of Wushaoling Mountain, northwestern China. Atmos. Res. 2016, 182, 87–101. [Google Scholar] [CrossRef]
- Meißner, M.; Köhler, M.; Schwendenmann, L.; Hölscher, D.; Dyckmans, J. Soil water uptake by trees using water stable isotopes (δ2H and δ18O)—A method test regarding soil moisture, texture and carbonate. Plant Soil 2014, 376, 327–335. [Google Scholar] [CrossRef]
- Sofer, Z.; Gat, J.R. The isotope composition of evaporating brines: Effect of the isotopic activity ratio in saline solutions. Earth Planet. Sci. Lett. 1975, 26, 179–186. [Google Scholar] [CrossRef]
- Tang, K.; Feng, X. The effect of soil hydrology on the oxygen and hydrogen isotopic compositions of plants’ source water. Earth Planet. Sci. Lett. 2001, 185, 355–367. [Google Scholar] [CrossRef]
- Morel-Seytoux, H.J. Unsaturated Flow in Hydrologic Modeling. Nato Asi 1989, 275. [Google Scholar] [CrossRef]
- Che, C.; Zhang, M.; Argiriou, A.; Wang, S.; Du, Q.; Zhao, P.; Ma, Z. The Stable Isotopic Composition of Different Water Bodies at the Soil–Plant–Atmosphere Continuum (SPAC) of the Western Loess Plateau, China. Water 2019, 11, 1742. [Google Scholar] [CrossRef]
- Stewart, M.K.; Friedman, I. Deuterium fractionation between aqueous salt solutions and water vapor. J. Geophys. Res. 1975, 80, 3812–3818. [Google Scholar] [CrossRef]
- da Silveira Lobo Sternberg, L. D/h ratios of environmental water recorded by d/h ratios of plant lipids. Nature 1988, 333, 59–61. [Google Scholar] [CrossRef]
- Sprenger, M.; Tetzlaff, D.; Tunaley, C.; Dick, J.; Soulsby, C. Evaporation fractionation in a peatland drainage network affects stream water isotope composition. Water Resour. Res. 2017, 53, 851–866. [Google Scholar] [CrossRef]


| Sampling Station and Abbreviation | Geographical Parameter | Meteorological Parameters | Number of Samples | Vegetation Species | ||||||
|---|---|---|---|---|---|---|---|---|---|---|
| Long (°E) | Lat (°N) | Alt (m) | T (°C) | P (mm) | H (%) | Precipitation | Soil | |||
| M1 | Lenglong | 101°51′16″ | 37°33′28″ | 3637 | −0.19 | 595.1 | 69.2 | 72 | 47 | Alpine meadow |
| M2 | Ningchan | 101°53′23″ | 37°41′50″ | 2721 | 3.34 | 431.9 | 66.6 | 42 | 41 | Picea crassifolia |
| M3 | Huajian | 102°00′25″ | 37°50′23″ | 2390 | 6.6 | 363.5 | 60.4 | 37 | 54 | Subalpine shrub |
| M4 | Xiying | 102°10′56″ | 37°53′27″ | 2097 | 7.9 | 262.5 | 59.8 | 40 | 53 | Populus |
| Stations | Types | δ2H/‰ | δ18O/‰ | ||||
|---|---|---|---|---|---|---|---|
| Max | Min | Average | Max | Min | Average | ||
| Lenglong | Precipitation | 13.7 | −163.9 | −73.1 | −1.3 | −23.1 | −10.0 |
| Soil | −42.4 | −83.9 | −63.5 | −6.1 | −12.6 | −9.3 | |
| Ningchan | Precipitation | 13.0 | −117.8 | −42.0 | −0.1 | −17.4 | −7.1 |
| Soil | −18.5 | −78.45 | −58.2 | −2.1 | −12.0 | −8.1 | |
| Huajian | Precipitation | 4.2 | −103.1 | −37.4 | −0.9 | −15.1 | −5.9 |
| Soil | −20.1 | −74.9 | −45.3 | 2.9 | −11.8 | −4.7 | |
| Xiying | Precipitation | 23.2 | −110.2 | −31.8 | 3.2 | −15.2 | −5.8 |
| Soil | −18.5 | −84.3 | −54.8 | 0.2 | −13.5 | −6.9 | |
© 2020 by the authors. Licensee MDPI, Basel, Switzerland. This article is an open access article distributed under the terms and conditions of the Creative Commons Attribution (CC BY) license (http://creativecommons.org/licenses/by/4.0/).
Share and Cite
Yong, L.; Zhu, G.; Wan, Q.; Xu, Y.; Zhang, Z.; Sun, Z.; Ma, H.; Sang, L.; Liu, Y.; Guo, H.; et al. The Soil Water Evaporation Process from Mountains Based on the Stable Isotope Composition in a Headwater Basin and Northwest China. Water 2020, 12, 2711. https://doi.org/10.3390/w12102711
Yong L, Zhu G, Wan Q, Xu Y, Zhang Z, Sun Z, Ma H, Sang L, Liu Y, Guo H, et al. The Soil Water Evaporation Process from Mountains Based on the Stable Isotope Composition in a Headwater Basin and Northwest China. Water. 2020; 12(10):2711. https://doi.org/10.3390/w12102711
Chicago/Turabian StyleYong, Leilei, Guofeng Zhu, Qiaozhuo Wan, Yuanxiao Xu, Zhuanxia Zhang, Zhigang Sun, Huiying Ma, Liyuan Sang, Yuwei Liu, Huiwen Guo, and et al. 2020. "The Soil Water Evaporation Process from Mountains Based on the Stable Isotope Composition in a Headwater Basin and Northwest China" Water 12, no. 10: 2711. https://doi.org/10.3390/w12102711
APA StyleYong, L., Zhu, G., Wan, Q., Xu, Y., Zhang, Z., Sun, Z., Ma, H., Sang, L., Liu, Y., Guo, H., & Zhang, Y. (2020). The Soil Water Evaporation Process from Mountains Based on the Stable Isotope Composition in a Headwater Basin and Northwest China. Water, 12(10), 2711. https://doi.org/10.3390/w12102711