1. Introduction
Floods, especially flash floods, cause extensive damage to property, disrupt human lives, and may result in irreparable losses. The HANZE (Historical Analysis of Natural Hazards in Europe) database notes that the previously mentioned flood type is the most frequent in the Europe, as out of 1564 events, 56% were flash floods [
1]. The majority of work is built around flash floods, as these are the most prevailing. Analysis that focuses on social aspects of floods mainly deals with circumstances of death with the intersection of parameters like population density, time of the event, and hydrological parameters (catchment size). In order to work towards loss prevention, there has been valuable work performed on flood hazard modelling, which includes flood prone areas and flood damage maps [
2]. The focus in research has also been on the importance of population growth, infrastructure decay, increasing urbanisation, and effective risk communication [
3]. It is imperative to have an interdisciplinary approach as multiple factors may play a vital role.
Based on public perception, loss of life is ranked on the top of the spectrum of damage severity. Thus, it is considered the most important type of loss. The scale of impacts varies between different locations and social environments as it does among different forms and sizes of floods. Hence, each flood event can be considered a unique hazard with specific characteristics [
4]. Diversity and specificity of the flood events and uniqueness of the environments bring different, individual vulnerability factors but patterns can be observed with a larger sample. The available literature on loss of life focuses on different aspects of the topic [
5]. Different angles of loss of life analysis contribute to the understanding of important factors, which influence the vulnerability and exposure of individuals and groups on a global level with cultural diversity. Furthermore, these different angles represent the variety of contextual emphasis in the areas of flood fatalities that have been studied.
Existing analyses focus on a global scale [
6,
7,
8], discuss fatalities in the context of health impacts [
9], investigate circumstances of loss of life [
10,
11,
12,
13,
14,
15], study mortality in flash flood events in the US [
16], and analyse vehicle flood fatalities [
17].
The complexity of the factors that contribute to loss of life probability implies a need for a different, interdisciplinary approach that is emphasised by Gruntfest and Handmer [
18] and has been applied in studies [
10,
19]. Furthermore, Creutin et al. [
20] have pointed out the importance of collaboration between hydrologists and social scientists and have set the groundwork that is needed for solving complex problems and for effective decision-making. The results of analyses increasingly display the relationship of distribution and correlation of flood fatalities with physical vulnerability as well as with social vulnerability. Studies of flood fatalities in general relate to demographic data (gender, age, and ethnic groups), circumstances of loss of life, and evaluation of geographic, temporal, and hydrological parameters and their interplay with societal factors [
7,
10,
19,
21]. For example, Vinet et al. [
22] studied flash floods over the period 1988–2015 and showed that 50% of fatalities happened in a small watershed (<150 km
2). Recent analyses have focused more on models for predicting the human impacts of floods [
4,
23,
24].
Circumstances of loss of life represent an important part of works because of the detailed sources of information. There are studies on the topic globally. Jonkman and Kelman [
7] have analysed 13 flood events and a total of 247 of fatalities that have happened in the US and Europe with a goal to bring about a better understanding of circumstances and improvement of prevention measures. The highest portion of victims (67, 6%) was due to drowning that occurred while the victims crossed flooded bridges and roads. Analysis of loss of life in the US between 1969 and 1981 has also shown a higher share of victims in cars [
16].
Furthermore, a study carried out by Ashley and Ashley [
10] also supports previous findings in which a 47-year-long database (1959–2005) has shown that 63% of victims in the US were car-related. Sharif et al. [
17] focused on flood fatalities in Texas (from 1959 till 2008), and the majority were found to happen in cars. Texas is the only state that had, in the era from 1960 till 2009, flood victims every year [
25]. In the latest analysis performed by Sharif et al. [
14] it was pointed out again that Texas is the leading state with regard to the number of flood fatalities. Gissing et al. [
26] analysed flood fatalities in Australia between 1960 and 2015. The results showed, similarly, that 49% of flood fatalities were vehicle-related. The findings of Diakakis et al. [
27], which were based on an analysis of 60 flood fatalities in Greece (all vehicle-related), concluded that in most cases loss of life happened during the night and in rural areas.
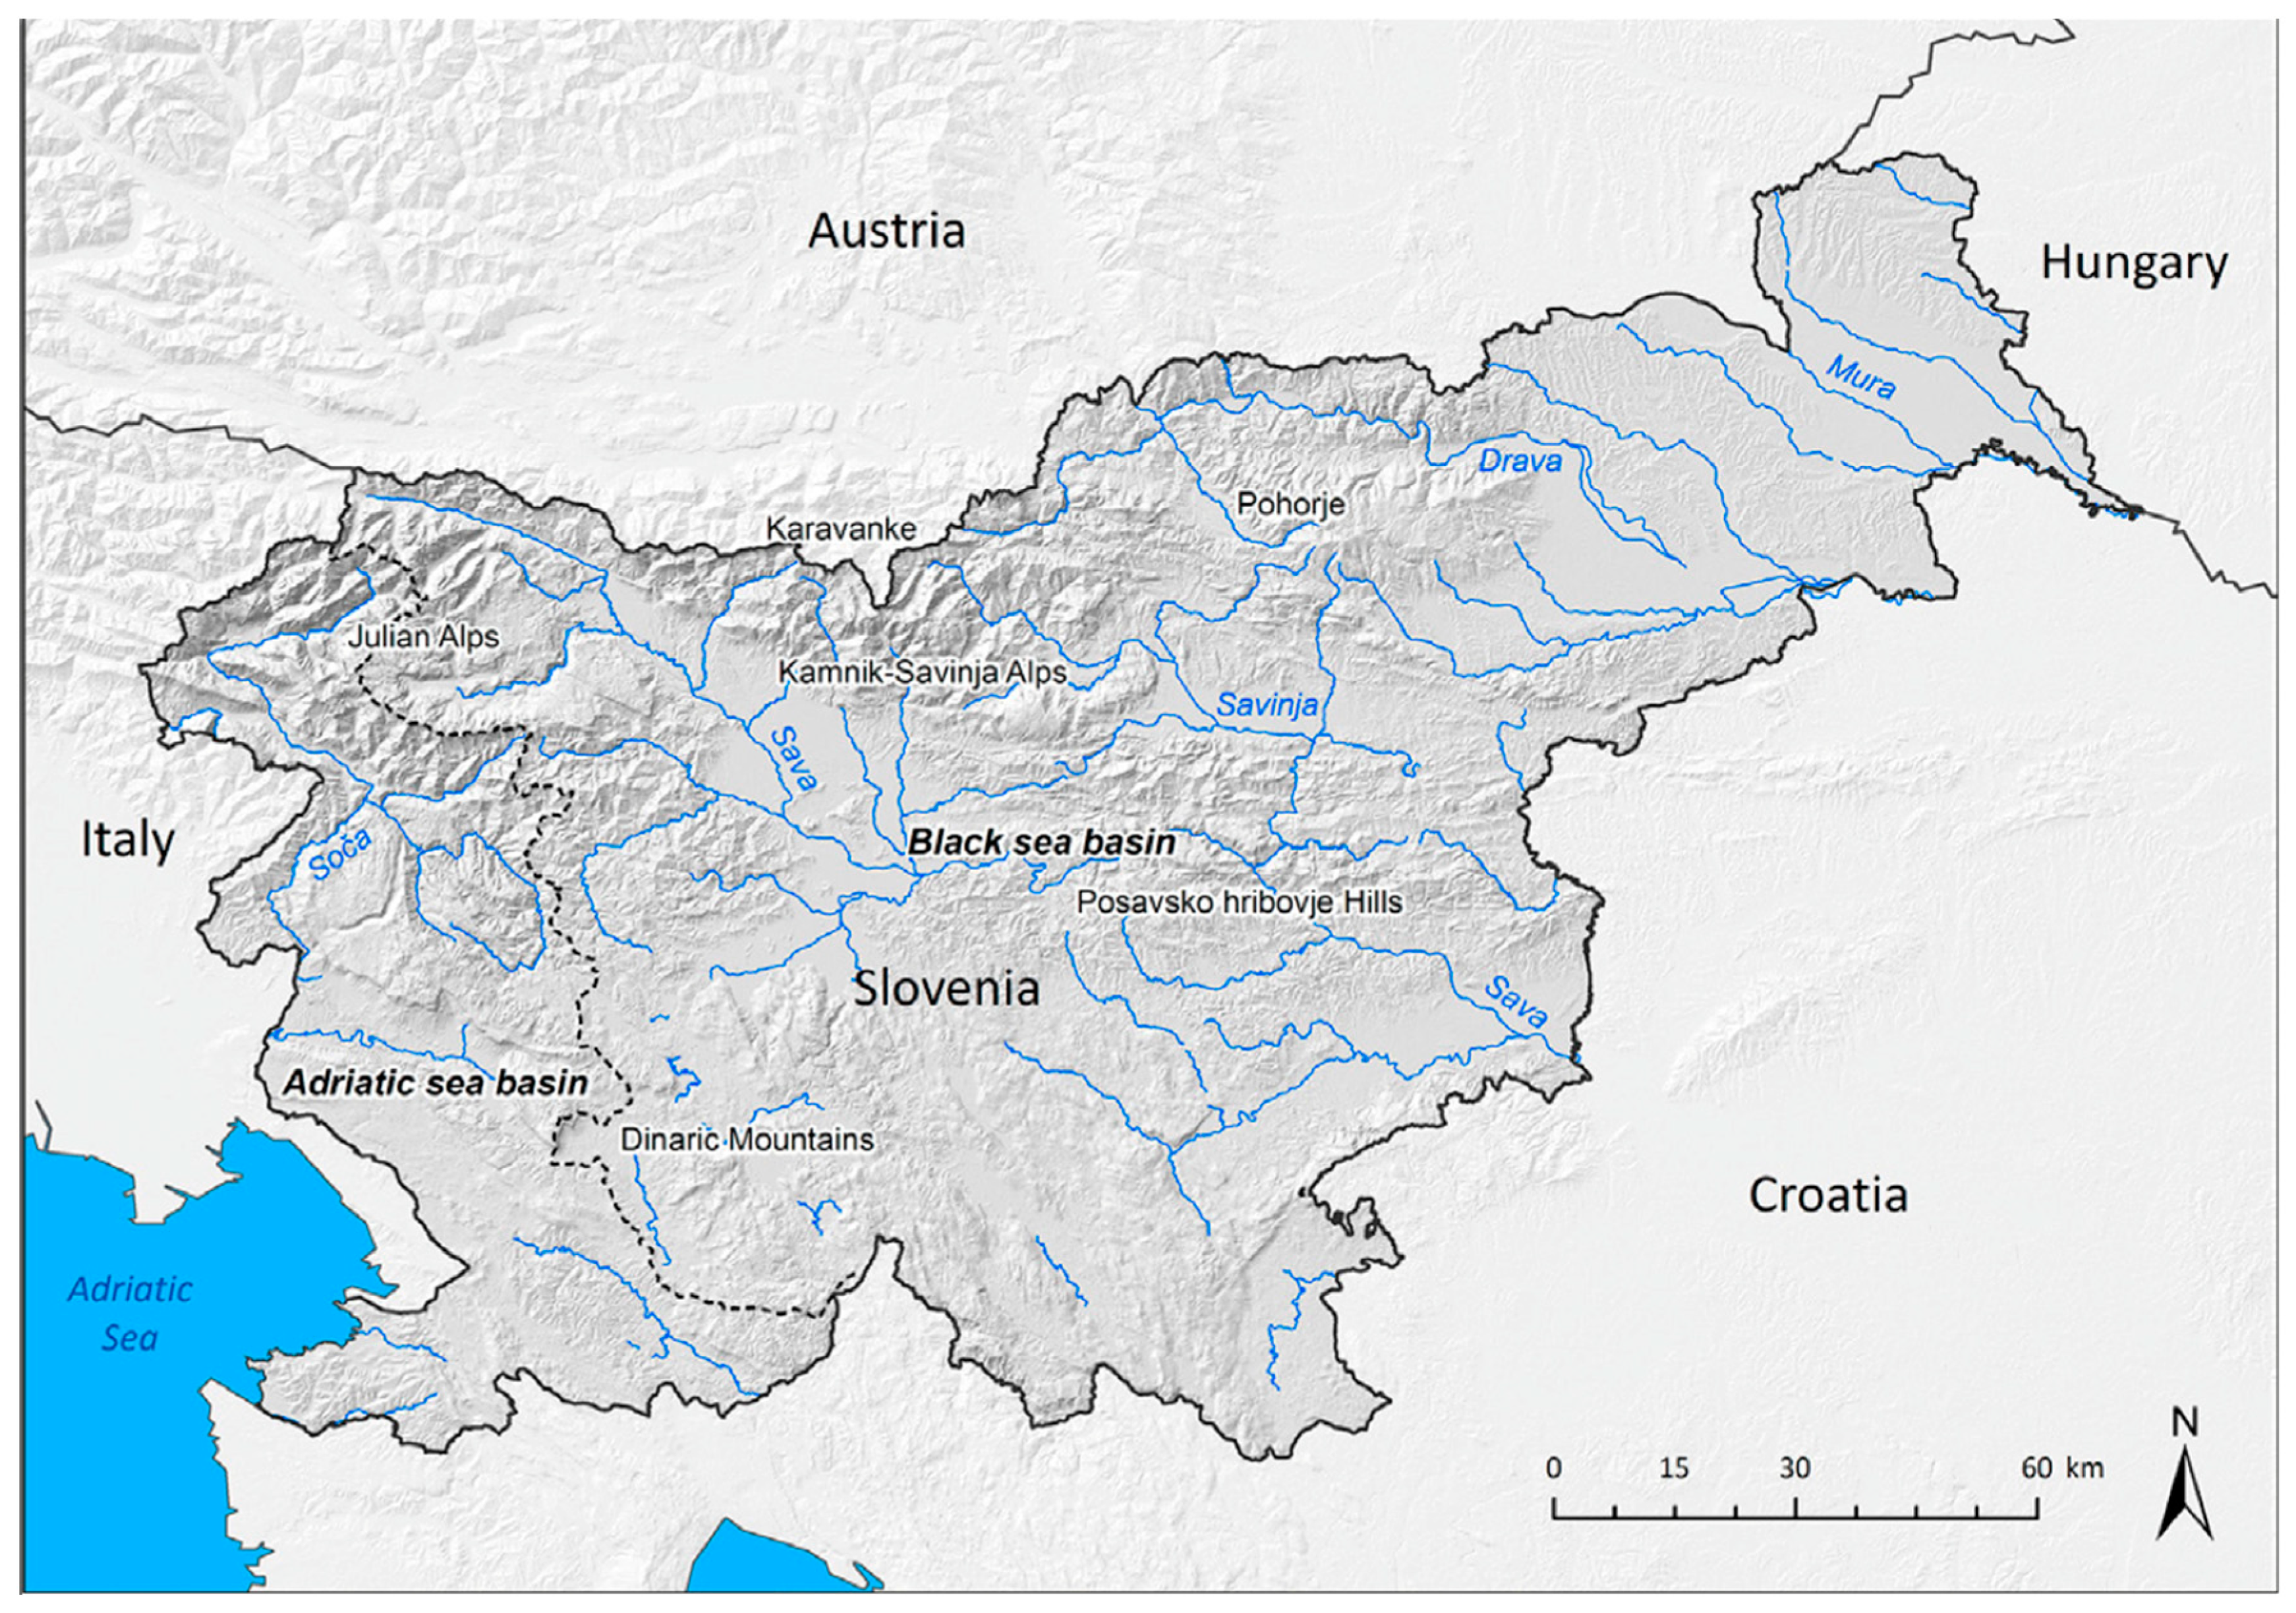
This paper focuses on Slovenia (which has an area of around 20,000 km
2), which is located in Central Europe and borders Italy, Croatia, Hungary, and Austria (
Figure 1). It has a coastline on the Adriatic Sea and a population of 2 million people. In terms of geographical regions, it is possible to divide countries’ land into four major natural units, namely, the Mediterranean, the Dinaric mountains, the Pannonian basin and the Alps [
28], which contribute to a diverse climate. Floods rank number three on a scale of damage severity after droughts and hail. Flash floods are the prevailing type of flood because of the structure of most river basins (relatively steep slopes that cause rapid runoff) [
29]. Floods in Slovenia pose a danger to around 15% of the country’s surface area. Nearly half the flood zone is in the Sava basin, 40% in the Drava basin, and 4% in the Soča basin.
The importance of information on the circumstances of death and the lack of an existing database in Slovenia which could store information on human impacts in floods was the reason for this research. Good practises existing in the US which have comprehensive collections on fatalities and injuries in flood events was also an initiative.
Furthermore, findings in the analysis of flash floods in the US have been used at the end solely for illustration [
21]. Employing historical analysis, this study addresses circumstances of flood fatalities in Slovenia using primary and secondary sources (available papers, reports from institutions, and mass media). Available data in the sources about the victims enabled us to address three aspects, namely, circumstantial (vulnerable groups in
Table 1), demographic (distribution of victims across gender and age) and temporal (did fatalities occur during the night or in the daytime) aspects. Our work represents a comprehensive collection and analysis of fatalities in flood events based on a long time scale, which was lacking in our system. This research does not incline towards making generalisations of any sort, but the main goal and purpose was to investigate and address human impacts, analyse demographic data of fatalities, and interplay it with the nature of hazards. Based on that information it is possible to determine vulnerable groups, which is an important tool for creating preventative measures. The essential goal of flood risk management is management “without fatalities”. In order to develop flood risk management with a victim prevention approach, there needs to be an understanding of factors that contribute to loss of life during flood events. Measures of social impact management can be carried out efficiently based on the information of the circumstances of death and knowing which parts of the population are more vulnerable. An existing dataset of previous impacts can provide a base ground of needed information for preventative actions in the future.
Analysis brings a new perspective to the field of natural hazards in Slovenia. The paper is organised in the following way. The following part focuses on the data analysis framework, and then we present the results, which include variability of human impacts in flood events from 1926–2014, analysis of demographic information, analysis of loss of life circumstances, types of flood fatalities and findings from the interviews, and a discussion, followed by conclusions.
2. Data Analysis Framework
The approach used in our research of the human impacts of floods in Slovenia was historical analysis of fatalities. Primary and secondary sources were analysed to collect data on the victims. Based on this data we addressed circumstantial, demographic, and temporal aspects. Descriptive statistics were used to analyse fatalities and categorise them and address especially demographic aspects. Structured interviews were executed to obtain more information on rescuing during floods and how people evaluated the help received. Questions were not related to a specific flood event but more so an overall view on what they had experienced so far. Three of the interviews were carried out with people, who have been rescuers during flooding and five were with people who had experienced flood events. Based on the two groups, two different sets of questions were constructed. This means that three interviewees were asked the same questions (questioner 1) and the rest (five interviewees) were interviewed based on questioner 2. Questions in questioner 1 were related to the following areas: description of the flood events that the interviewees had experienced, description of sources of information regarding the hazard, what they felt when experiencing the flood, what would contribute to their feeling of safety, what surprised them the most, description of the work of the rescuers, how long the redevelopment of the area took, what their preventative measures will be, and how much more attention they pay to the weather channel. Questioner 2 covered the following points: description of the flood events, the location of intervention, work flow of the protection and rescuing, all the sources of flood information and forecasts, problems that they faced during intervention, reactions of the people, how can each individual’s events be useful for future (preventative) measures, and how common was evaluation at the end of the events.
Injuries were also a part of the framework, but through the data collections it was unfortunately evident that there was no detailed information available except some numbers that were not consistent for all flood events. Furthermore, the time frame of the flood events analysed was 88 years, starting from 1926 and continuing all the way to 2014. Flood events used in the analysis were chosen based on their production of at least 1 human impact. We found 10 flood events and a total of 74 fatalities in the data, which had been collected from several different available sources (news channels, Administration of the Republic of Slovenia for civil protection and disaster relief, and the Slovenian environment agency). Years 1926, 1933, and 1954 were particularly difficult since the only sources of information were the few existing general newspapers (Slovenec, Savinjski vestnik, and Jutro) that mainly covered economic and political news but sometimes also wrote about natural hazards and the damage inhabitants suffered in the affected areas. After the year 1954, human impact data was mentioned in the reports on flood events among main hydrological details performed by the Slovenian Environment Agency, which is a branch of the Ministry of Agriculture and Environment and which primarily focuses on forecasting, analysing and monitoring natural phenomena, and mitigating damage and loss of life. Other sources included were the Acta Geographica Slovenica, the Administration for Civil Protection and Disaster Relief, and the mass media. Our main focus and goal was to investigate all the available factors of flood fatalities which contribute to an understanding of the circumstances and the level of influence. Gender and age, if available, were also included in the analysis to see which group tended to be more exposed.
Additionally, based on the story narrative of individual casualties, the circumstances of death were determined, through which types of flood fatalities were derived. In order to obtain more information on how people perceive floods and what seem to be the main problems when flood events happen, several structured interviews were conducted. Three were with people, who have been rescuers during flood events and five were with people, who have experienced floods.
Considering the lack of available information on casualties in flood events in Slovenia and the low emphasis that is put on collecting and storing data of this kind, a comprehensive analysis represents a step towards implementing a systematic data storing. The assessment of these influential parameters is a way to improve the understanding of human impacts and a contribution to flood managers when planning preventative measures. Flooded roads seem to have consistently posed a great threat over the years to drivers and have caused fatalities. As a result of numerous roads being flooded during every flood event, questions about the relationship between watercourses and roads arose. This issue itself is too complex to be analysed in this article but will be the subject of future work.
3. Results
3.1. Variability of Human Impacts in Flood Events from 1926–2014
Information regarding the number of flood fatalities in each individual year in Slovenia was collected and has been presented in
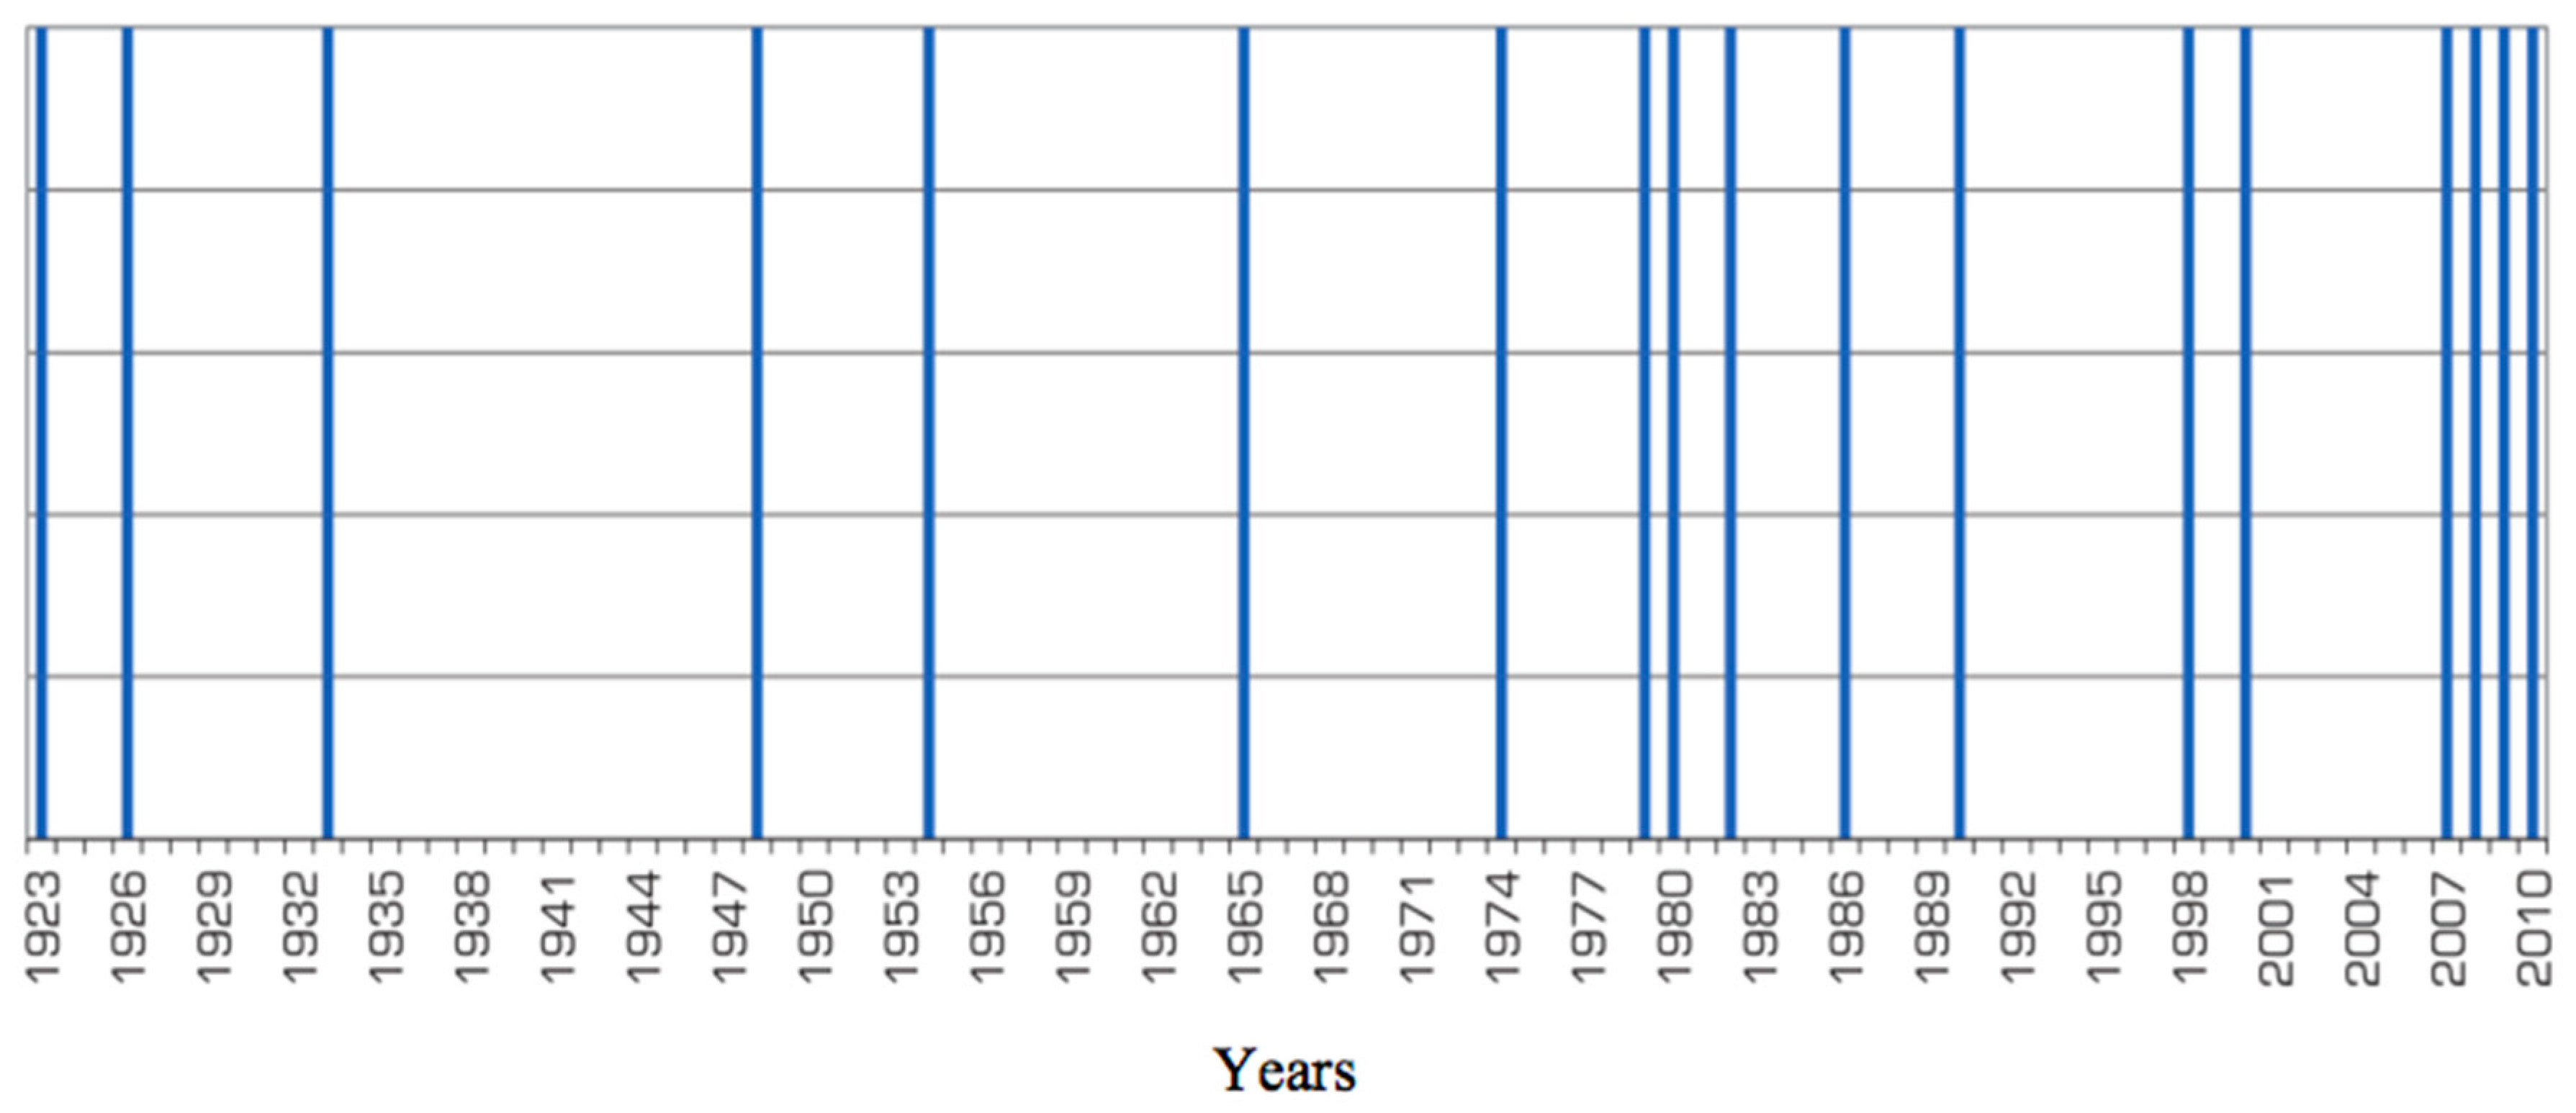
Figure 2. There are 10 flood events and 74 flood victims. It is important to point out that there were more flood events between the years 1926 and 2014 but that they did not cause loss of life. For a comparison, the total number of more extensive floods (return period >50 years in at least three river basins) between 1926 and 2010 was 17, as presented in
Figure 3 [
30]. Based on
Figure 2, there is a trend consisting of a decrease in flood victims through the years despite hydrological reports showing an increase in the frequency of extensive floods. There is a large contrast due to a higher number of flood fatalities in the years 1926, 1933, and 1954. The use of a long timeframe enables us to mark a threshold at the year 1954 for the purpose of data analysis. There is a trend of consistent increase in loss of life from 1926 to 1954 and fluctuations in loss of life after the year 1990. It is important to point out the 36 year period (between 1954 and 1990) in which no flood fatalities were recorded. As already mentioned, there were 17 extensive floods which occurred between 1926 and 2010, with eight of them causing loss of life and nine flood events occurring without fatalities which happened in the years 1948, 1965, 1974, 1979, 1980, 1982, 1986, 2008, and 2009 [
30].
Extensive data of maximum annual discharges were used for the period 1895 to 2013 for the river Sava. In the fourth quartile there were a total of 7 years with flood fatalities (1926, 1933, 1990, 1998, 2000, 2007, and 2010) and 4 years without victims (1965, 1979, 1982, and 2009). The flood event in the year 2010 ranks as one of the most extreme floods recorded, with discharges equal to those of a 100-year return period. The largest floods recorded are still from the year 1990 and they exceeded a 100-year return period. There are 5 years worth pointing out (1936, 1964, 1973, 1975, and 1985) in the fourth quartile which fall in the period 1954 to 1990 which had no documented flood events with fatalities. Furthermore, in the first quartile there were 8 years within the period 1954 to 1990 and 7 years falling within the period 1933 to 1954 in which there were no flood fatalities. Discharge data for the river Sava indicate a very dry season between 1940 and 1960 [
30]. Furthermore, data show a 50-year return period for the year 1998 and a close to 100-year return period for the year 1933.
Discharge data for the river Savinja point out a more than 100-year return period of the floods in the years 1990 and 1998 In the years 1933 and 1980 there was close to a 50-year return period. The river Krka approached a 1000-year return period, with floods in the year 1933 having a 200-return period and a 100-return period occurring in the year 1948. Discharge data for the river Ljubljanica exceeded a 100-year return period. After this, the highest recorded discharge rates were from the years 1975 and 1998 (a 50-year return period).
Lastly, the river Vipava showed discharges with a 1000-return period in the year 2010, a 100-return period in 2009, and a 50-year return period in 1965 [
30]. Information on the return period indicates some correlation with severity of flood event and human impacts, with the exception of the year 1954, which counts as the most fatal event in the entire period covered and does not coincide with a high return period.
3.2. Analysis of Demographic Information
Gender and age were used in the demographic segment in order to determine which groups are the most vulnerable in the case of flooding. From the total number of 74 fatalities, we were able to collect gender information for 43 people. The frequency of male fatalities (60%/26 people) was higher than that of female fatalities (40%/17 people).
Data regarding age were divided into three groups for the analysis. The Statistical Office of the Republic of Slovenia has two types of age classification. The first approach divides people by age into children (0–14), the working–age population (15–64), and the elderly (65 and over) while the second approach divides people by age into the young (0–19), adults (20–59), and the elderly (60 and over). For the purpose of this analysis we used the second approach of age classification. The age information sample included 21 people, making it a very small sample.
The distribution of fatalities shows that the most vulnerable groups are adults (10 people) and the elderly (8 people). Three people fell in the young people group.
3.3. Analysis of Loss of Life Circumstances
Many factors influence the degree of vulnerability of people in the affected areas. While the focus is too often solely targeted on compositional variables (hydrological parameters) it must be noted that contextual factors (situational and temporal parameters) also contribute significantly to the fluctuation of the distribution of human impacts and their scale. Apart from external influences, some authors [
8] believe that risk–taking behaviours should not be underestimated because a substantial proportion of flood fatalities are believed to be due to those unnecessary types of risk–taking behaviours. Based on the collection of flood fatalities and their activities across a long time scale, we were able to see how and if people’s activities changed throughout the years and if these activities are really attributable to unnecessary risk–taking behaviours. Contextual information helped us to determine how or if people’s behaviours reduce personal safety.
The most severe floods in terms of human impacts happened in the year 1926 (10 fatalities), 1933 (17 fatalities), and 1954, when 22 people lost their lives. The data revealed that three families were trapped and drowned in their own houses in the year 1954. Further analysis also showed that professional and volunteer rescuers lost their lives while trying to help others. People’s attachment to their personal belongings led them back to their houses and they lost their lives while attempting to salvage their belongings. Wrong judgement of their current situation and unnecessary exposure to danger resulted in several deaths.
For example, a male subject was trying to reach a piece of wood in the flood flow while a group of 13 people was standing on a wooden bridge, observing. The latter later collapsed and resulted in all the people drowning. Conformity behaviour is where a substantial number of observers cause new to join.
A few people also died in their vehicles, which at the time were most likely wagons pulled by horses. Moreover, in two cases people died at home during a flood event due to medical reasons. These medical circumstances could have been induced from the event but there was not enough information to make a final conclusion. There have been several reports of a high number of people with serious and minor injuries but unfortunately no definitive actual number was stated.
Furthermore, in the last two decades there has been a trend of an increase of landslides as a consequence of flash flooding, taking 7 lives in 2000 and 3 lives in 2007. The background of the event in 2000 shows a failure of non–structural measures. Inhabitants exposed to the hazard were evacuated but sent back in the evening, thinking the area was safe. During the night, an abrupt landslide destroyed several structures and killed 7 people. The flood event that happened in 2007 also triggered landslides that caused 3 fatalities. A couple was found dead in their house, which had been partly destroyed by a landslide. In this case, structural measures collapsed and caused fatalities since back in 1990 the area had not been properly restored and protected with barriers after the landslide had already happened. Another fatality happened when somebody tried to go back to their house to save personal belongings. The circumstances of three other fatalities that happened in the flood events in 2007 were related to drowning, electrocution (of a volunteer fire fighter), and an attempt to save a car. Five people lost their lives in the flood event in 2010.
Among these fatalities, two were vehicle-related. The first victim ignored a closed and marked flooded road and drove on. The second fatality happened while the victim lost control over their car on a flooded road and ended up in the stream. In addition, situations existed in which people exposed themselves unnecessarily, resulting in two more victims that were found on the side of the stream and railway underpass. Another victim died in a flooded house while sleeping.
The latest flood event that took place in September 2014 caused 2 vehicle-related fatalities which once again occurred due to a failure of structural measures and low visibility. There was a situation involving unmaintained stream crossing and poor road conditions in which high flow velocities led to destruction of the road surface, causing the car to slide into the stream.
3.4. Types of Flood Fatalities
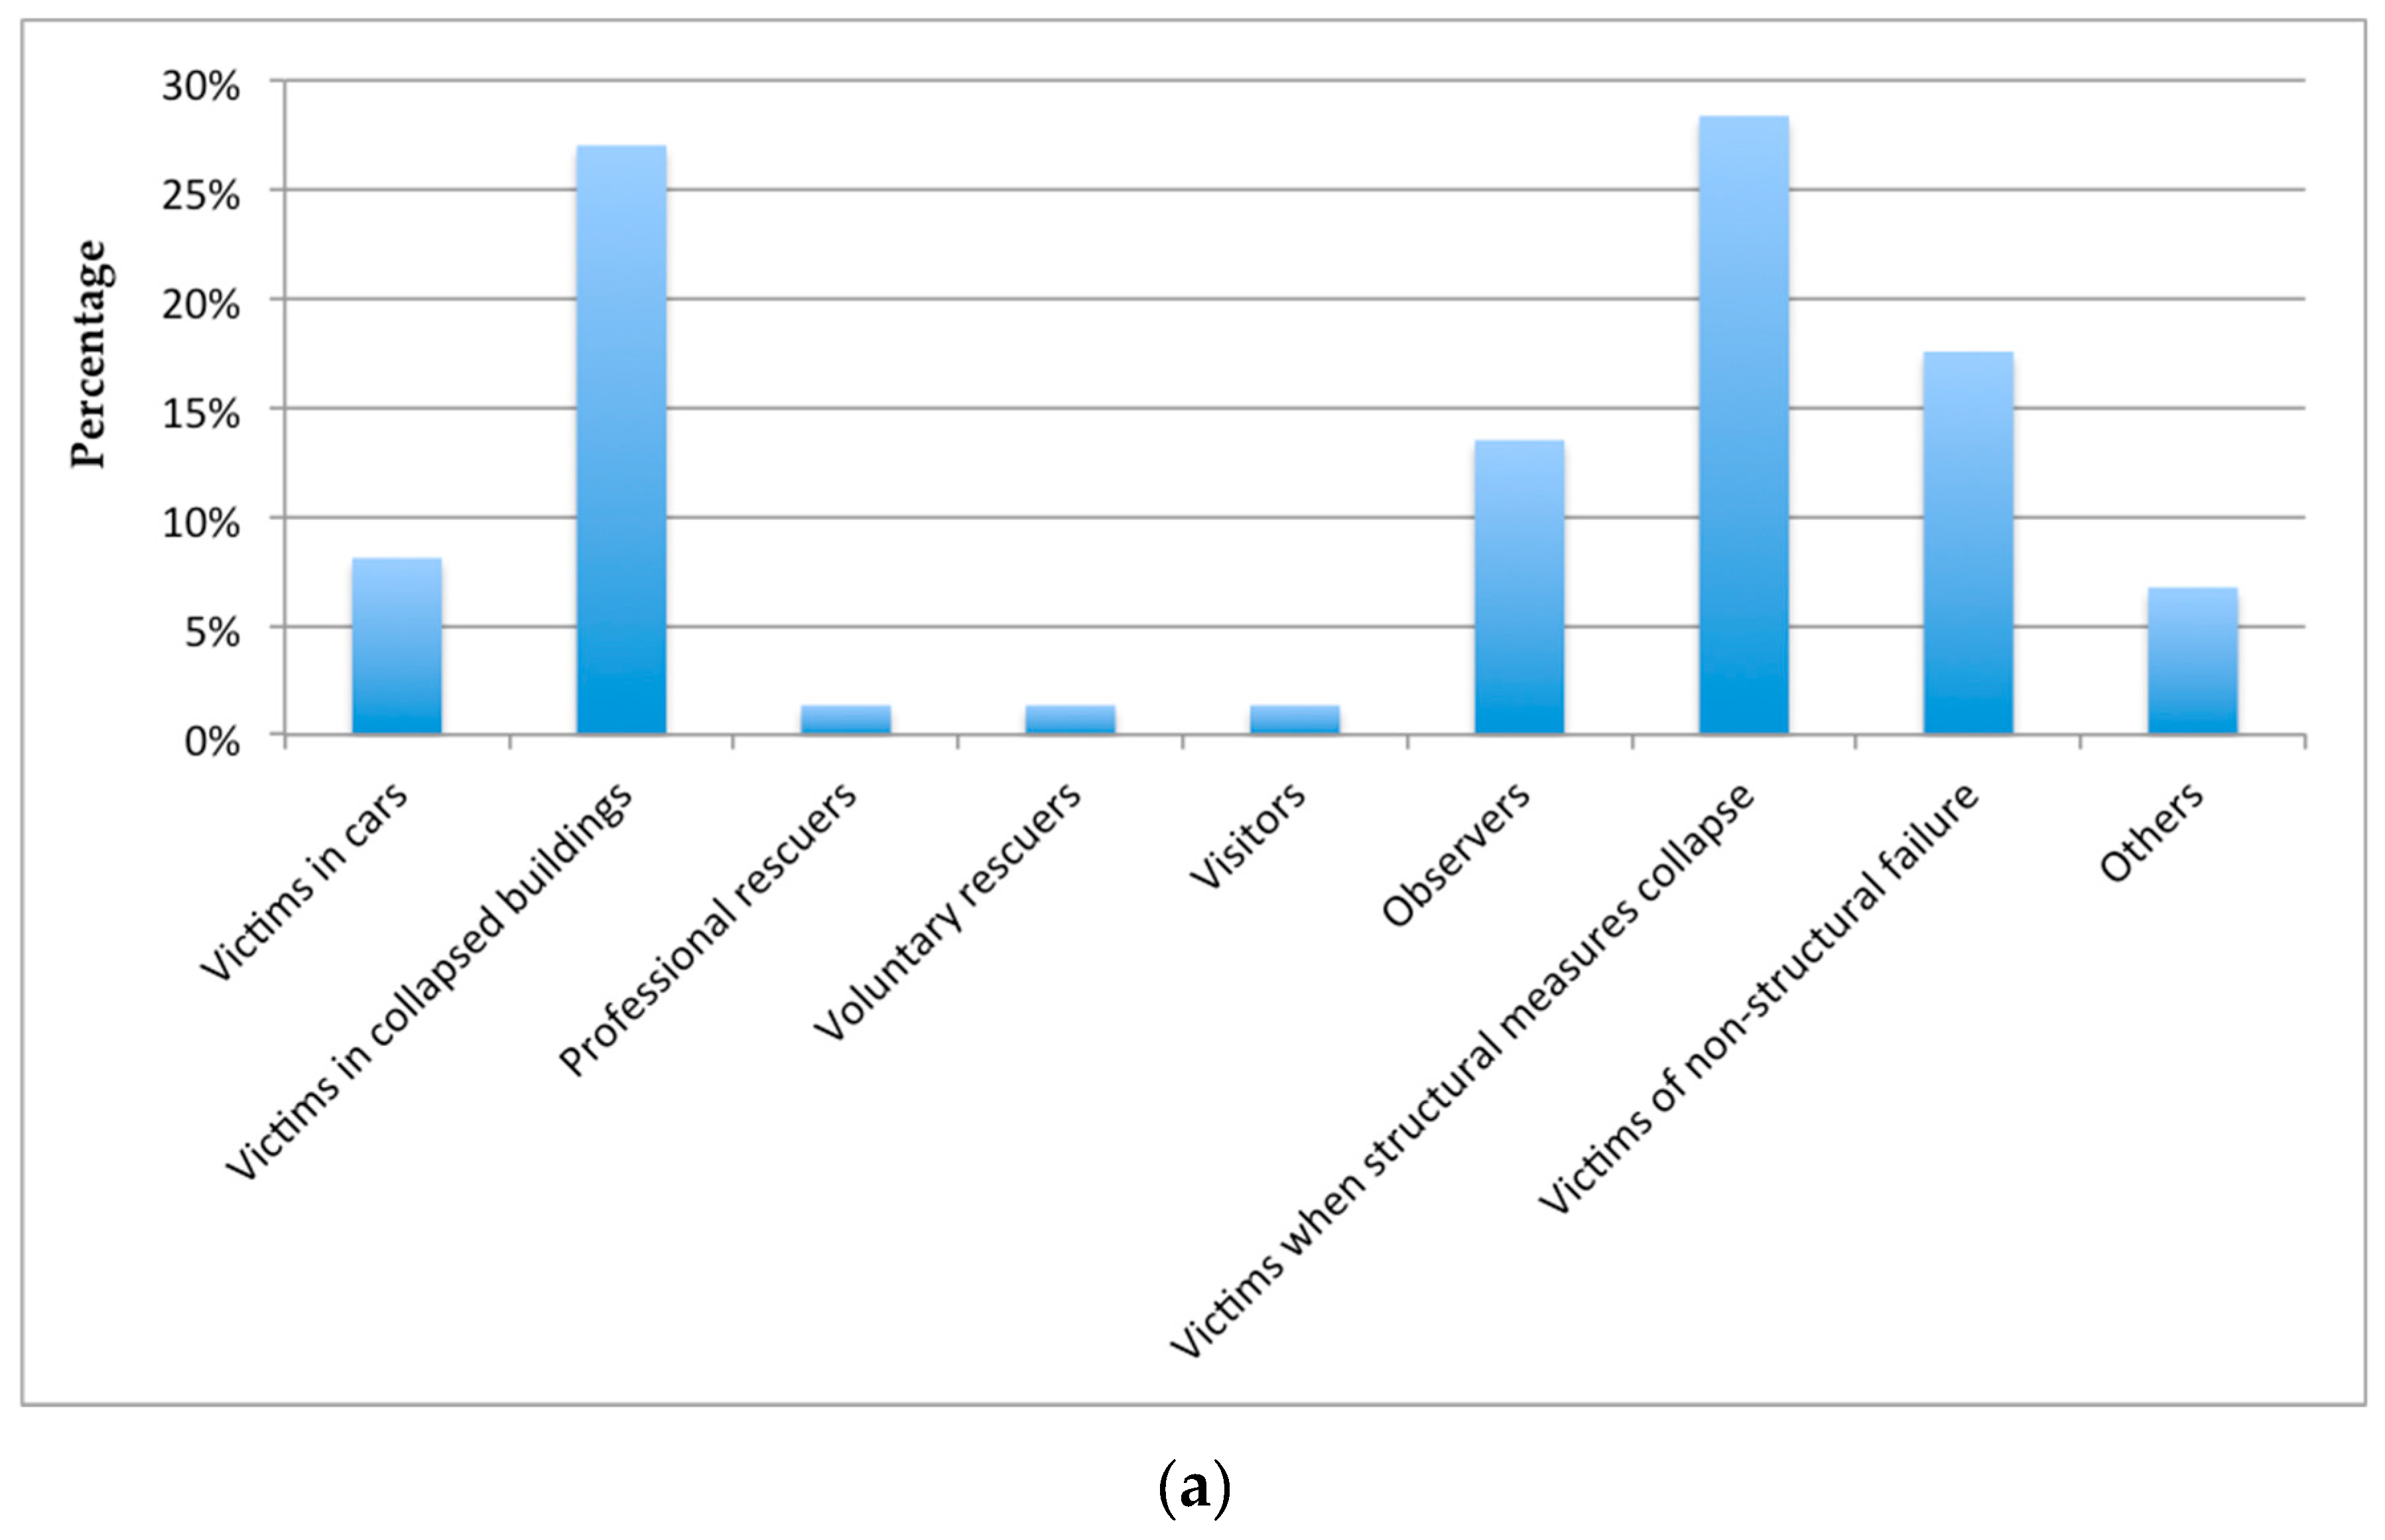
The story narratives of each individual fatality gave us an overview of the circumstances. Through our analysis, we started to see repetitive patterns that presented a basis for classification. The time frame of the data of human impacts in flood events we used was from 1926 to 2014. Based on information regarding flood casualties that occurred in Slovenia, flood fatality types (illustrated in
Figure 4) were constructed. Understanding the circumstances can be useful to several different areas, such as early warning systems, risk prevention, and preparedness, and to voluntary and professional rescuers as well. This kind of categorisation emphasises the most vulnerable groups of people in the case of flooding and should be considered by flood managers. Furthermore, some clarification of how these groups were formed is necessary. As shown in
Table 1, medical causes of death were taken into consideration but not as a main focus.
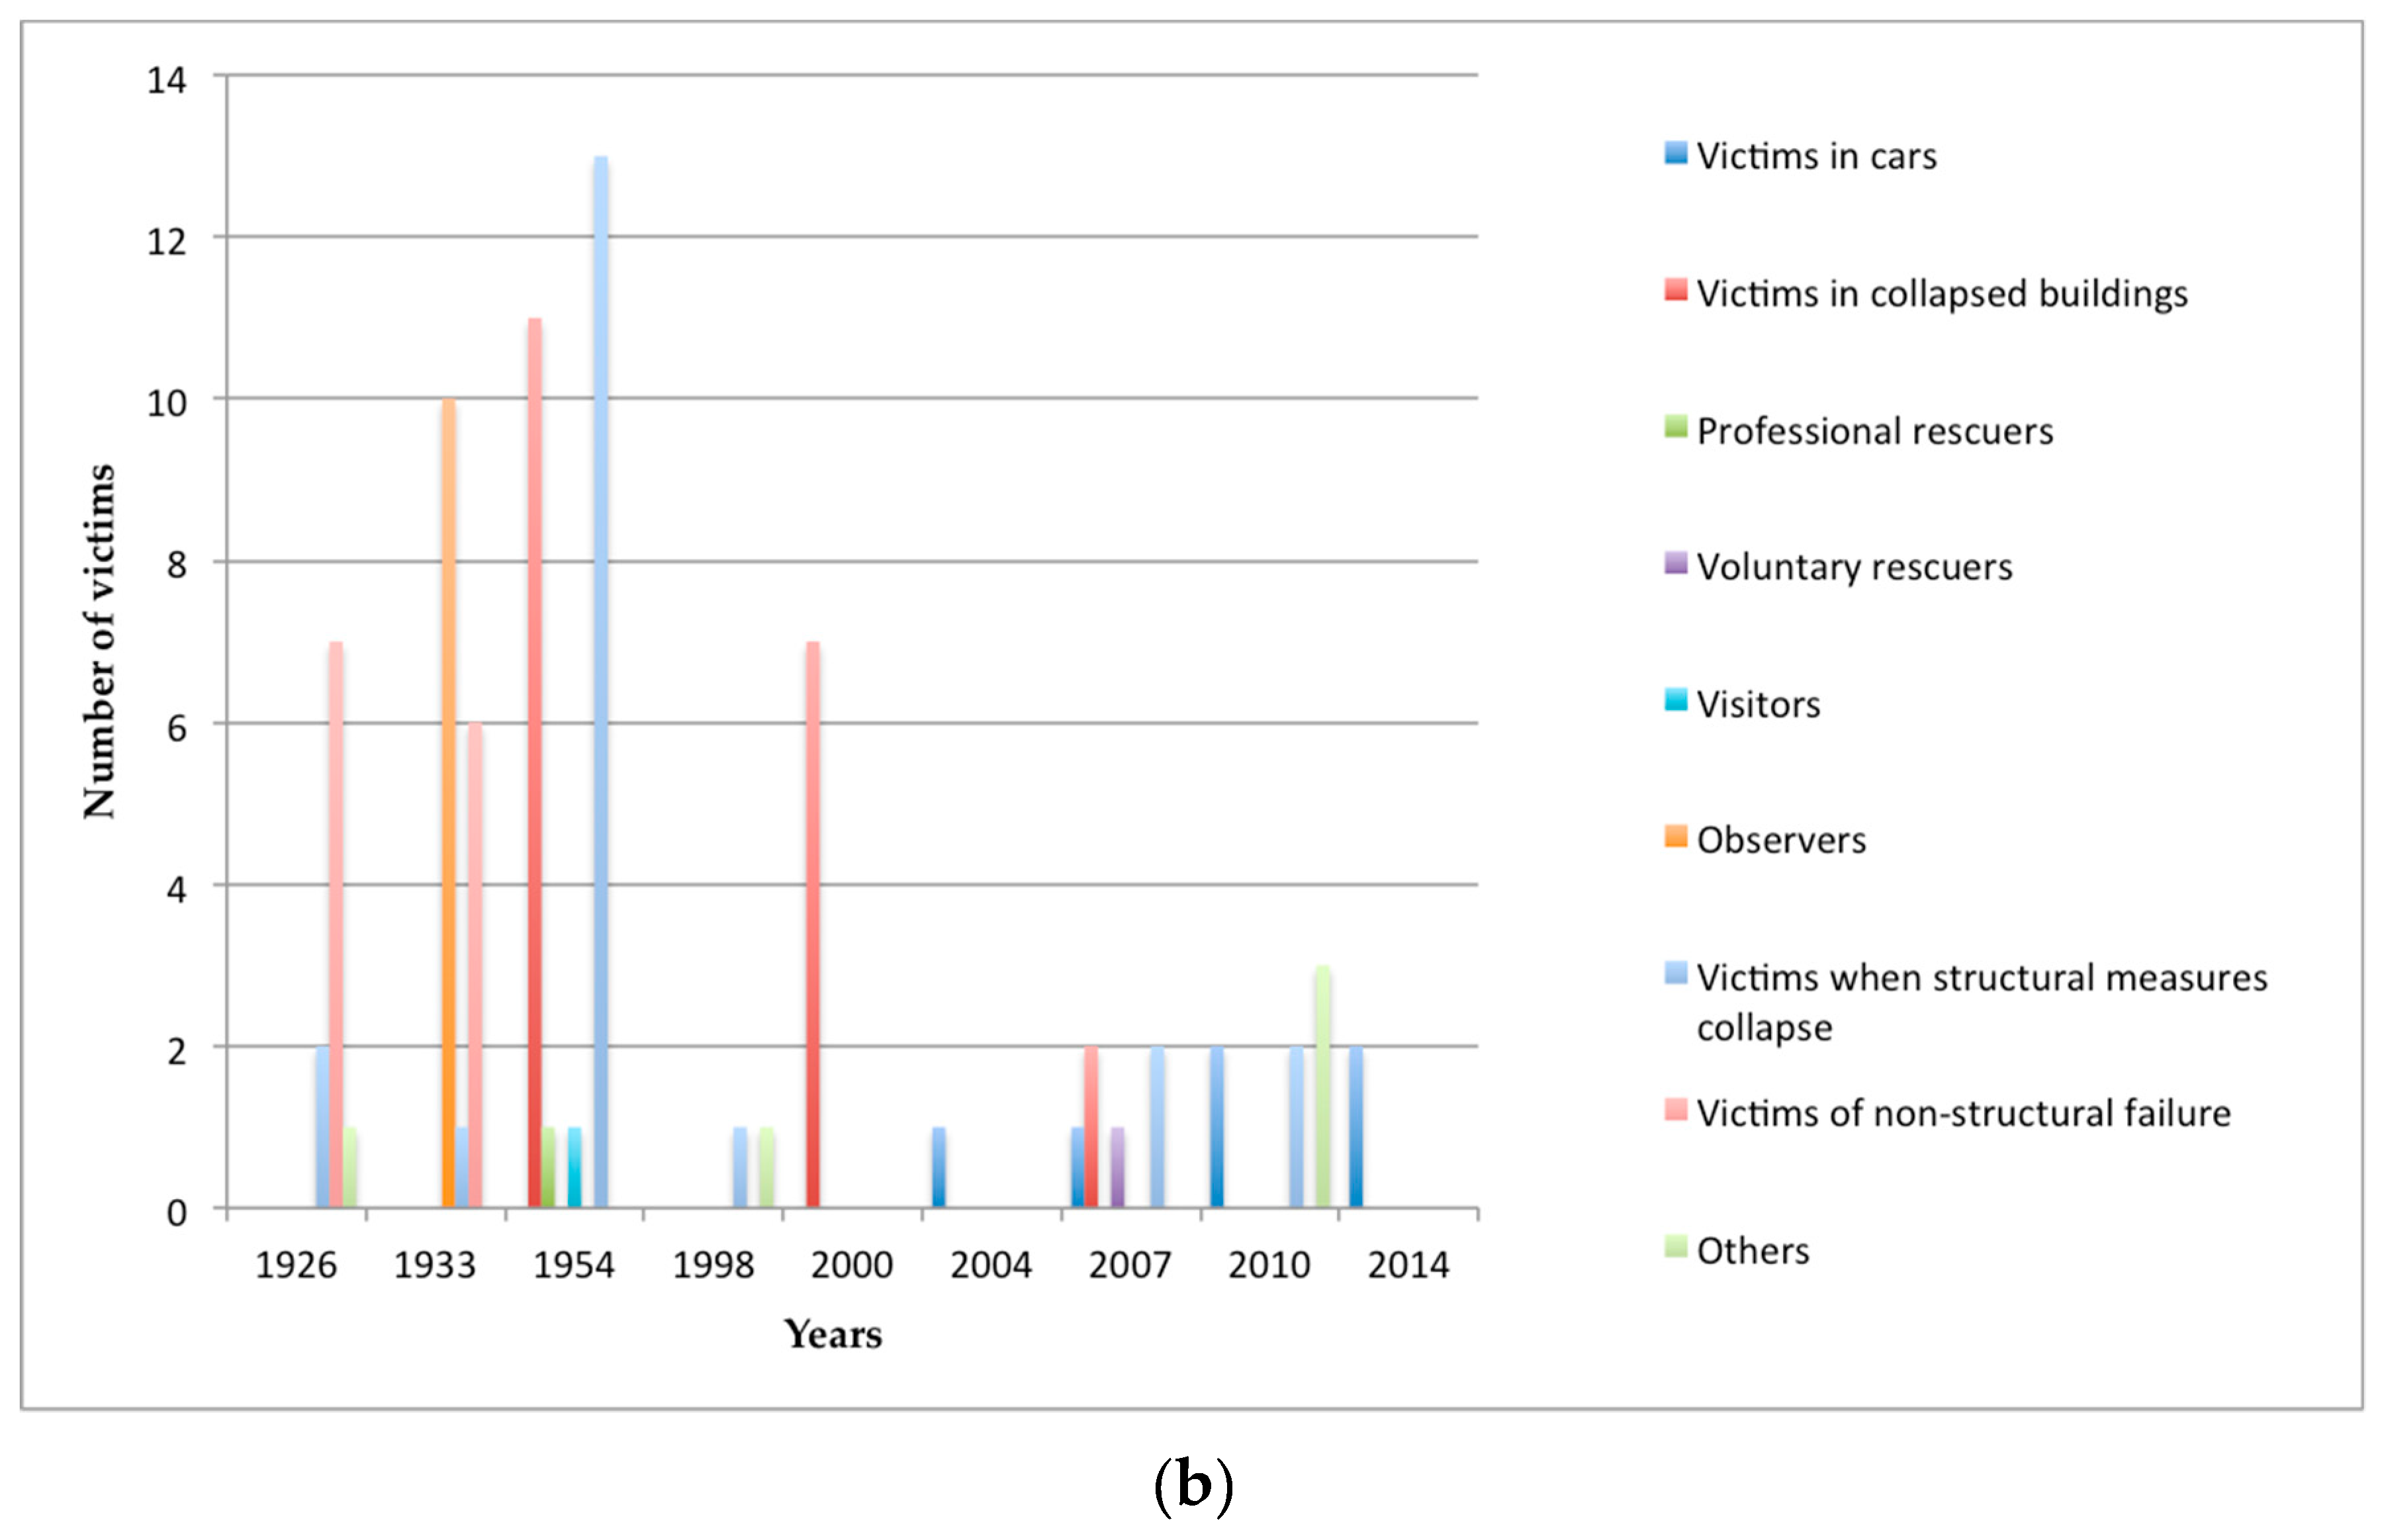
This is the reason for which these people were categorised as the group “Others”. Latter was created based on analysis of various situations: people involved of their own will, people on duty, or people being in the wrong place at the wrong time. This categorisation can also be applied with small alterations if needed to other hazardous events and countries. The sum of victims in Slovenia for each fatality type does not represent the total sample because with certain victims we did not have enough circumstantial information, which would enable us to classify them, and certain fatalities were placed in more than one group. The majority of loss of life in floods in Slovenia happened in collapsed buildings and due to the structural and non–structural failures (
Table 1,
Figure 4a). Each type per year is on the one hand cumulated with victims of non–structural failure, observers, victims in collapsed buildings, and victims when structural measures collapsed in the period 1926 to 1954; on the other hand, we see overrepresentation of car victims in the period 2004–2014 (
Figure 4b).
3.5. Findings from the Interviews
Two of the rescuers in the flood events were fire fighters and one was a member of the Administration of the Republic of Slovenia for civil protection and disaster relief. They were all male and between the ages of 27 and 51. People who had been affected by floods were of ages between 24 and 51; four were male and one was female. All the rescuers pointed out that no matter what the predictions were about the flooded area where they had to intervene, the situation with water was always worse when they arrived to the actual place. When the conditions were critical, the equipment with which they worked was useless. Fire fighters often face a lack of staff and equipment. Employment as a fire fighter in Slovenia is still, in the majority of cases, based on volunteering. When water quickly exceeds a certain level and starts flooding it causes a domino effect, meaning multiple disasters are experienced at the same time, including failure of the infrastructure (destroyed roads and collapsed bridges) and landslides, which can severely change the situation and make intervention more difficult or impossible. Decision-making and preventative measures (evacuations and sand bags) when the first warnings are received are crucial. Malfunctions of the Administration of the Republic of Slovenia for civil protection and disaster relief were also mentioned. People sometimes make situations much worse when they do not want to leave their homes and when they underestimate the power of the water. After the event, analysis of the intervention is performed. The latter is really important because this type of intervention is very specific and demands a lot of knowledge.
People that were affected by the floods all described how unimaginable the destruction of the water could be. Regardless, for them it was still a priority to take care of their personal belongings first over the safety of their own life. It was pointed out how little local authorities warned or taught them about the possible danger of floods in the area in which they live. Since they have experienced floods they pay much more attention to the weather news. All of them expressed disappointment over the poor preventative measures and insufficient restoration of the area after the flood event.
4. Discussion
There have been other studies that have shown males as the prevailing group among victims [
10,
11,
27]. This vulnerability could be explained in two ways: due to their nature, males are more willing to risk their lives, and also, there are more males than females in emergency and rescue teams. For the purposes of comparison, in the year 2019 49% of the population was male and 51% was female (Statistical Office of Slovenia), meaning there was not an overrepresentation of either group.
Trends in population development have been obtained by the Statistical Office of the Republic of Slovenia and these trends show a continuous growth of the elderly population and a decrease in the number of young people. This is an increasing problem in Slovenia [
31]. Furthermore, a constrictive pyramid serves as an important tool for flood manager to prioritise elderly in safety and evacuation measures.
Concerns over structural measures failing should be addressed with preventative measures. The reality of the danger posed that comes from insufficiently repaired damage of past flood events is continuously repeating and is shown during new flood hazards. This issue has not only caused fatalities but also increases the level of damage made from one flood event to another. A new approach in management is needed to efficiently repair damage and to find ways to mitigate watercourses that are prone to flooding. Mapping of the exposed areas is needed, as well as an assessment of the influential parameters that contribute to the areas’ flood exposure [
2]. Maps, as an informative tool, can contribute in an important manner to people’s awareness of danger and how powerful and destructive floods can be. We need to make sure of the availability of these maps to the public and that people understand and know how to read them. Furthermore, roads have been extensively affected in terms of damage by every flood event. In the last decade there were also 5 vehicle-related fatalities: 2 were due to risk-taking behaviour and 3 due to a collapse of structural measures. Each year there are more registered vehicles and in the year 2018 the number was as high as 1.143,150 registered vehicles [
31]. It is necessary to address the relationship between roads and watercourses and create a map of road flood hazards and adequate road flood preventions. There needs to be an emphasis on structural prevention, for example having building standards that can sustain floods with higher return period. This could mean that roads would sustain more and would get less flooded, which would enable evacuation on the road.
This review of the circumstances of loss of life through a longer time scale indicates a reduction in the number of casualties, different means of transportation, and fewer channels of warning. At the same time, it points out the ongoing existence of problems with the collapse of structural and non–structural measures. Slovenia has also faced various situations where landslides occurred in conjunction with flood events, which should be considered the rule rather than mere coincidence.
In the future, problems which arise could be victims in cars, people refusing evacuation, and/or people returning back to their homes to save their property, which is an unintentional risk–taking behaviour. Also, unsafe conditions for professional and volunteer rescuers are to be worried about as much as the issue of people not obtaining information about an upcoming danger (dying while sleeping at home). There is a growing importance of good communications channels [
3].
It is very difficult to compare Slovenia and the US due to geographical and cultural differences. For illustration purposes we want to point out some findings. There is a seasonality factor. Monthly variability of flood events in the US shows the domination of summer months [
21], whereas Slovenia has an autumn maximum. Based on information regarding the circumstances of death, we can see cultural differences. The US as an automotive society has more than 50% of its fatalities in vehicles [
21], even though data for Slovenia shows an increasing problem of victims in cars in recent years. For example, in the last ten years Slovenia had nearly 50% of vehicle-related fatalities among the total number of flood deaths.
The lifestyle of living in trailers is not so much present in Slovenia, and thus Slovenia does not have victims related to this circumstance. Rural areas have been shown to be more problematic, as structural measures collapse and more fatalities tend to happen in these areas in Slovenia. A similar trend has been pointed out for the US [
21].
Inconsistencies between flood plain areas and spatial planning (granted building permits) and a lack of preventative measures also result in fatalities. Analysis has shown that people do not learn from mistakes. For example, a comparison of flood damage between the years 1954 and 1990 has pointed out that certain buildings have been damaged in the same way.
Furthermore, newly constructed buildings have suffered more damage than older objects, indicating a lack of building standards for damage prevention in the case of natural disasters [
32]. Information on the return period of flood events gives a certain correlation between floods producing fatalities and events with no loss of life. Events with a high return period tend to result in casualties but there are certain exceptions with extreme events and no fatalities. It is interesting that the year 1990 accounts for the most extreme floods recorded and has one of the lowest numbers of fatalities. Comprehensive preventative measures can only be performed with sufficient and holistic data, and thus it is important to continue this systematic collection of information and link it with changes in education, warning signs, and systems and building standards that would sustain higher return periods.
5. Conclusions
In this work, historical analysis of casualties in flood events was performed for the 1926 to 2014, employing a dataset of 10 floods that ended in 74 fatalities. However, there were 21 severe floods in total that happened in this time frame and 48% of them caused loss of life. Despite a trend which shows a decrease in fatalities through the years, the percentages of floods with casualties and floods without casualties are similar, since 52% of the flood events occurred without any casualties. Data show a phenomenon of car victims in recent years.
The primary focus in this study was floods with fatalities, since there was a lack of a comprehensive view on human impacts in Slovenia. Loss of life was addressed through different angles. Through the collected data on flood victims, demographic, circumstantial, and temporal aspects were addressed. The main points for each aspect are summarised below.
The demographic distribution showed a higher vulnerability of males, which could be due to their being overrepresented as volunteer and professional rescuers and their nature of being willing to take more risks.
The age analysis of fatalities pointed out that adults and the elderly tend to be more vulnerable in the case of hazardous events. However, population development shows a growth of the elderly group and a decrease in the young population. This is important information for future mitigation strategies to make sure the elderly in hazardous areas have received warnings about upcoming dangers and if necessary have been evacuated from the affected areas.
Data collection and analysis of the circumstances of loss of life gave an important insight into the activities of individuals during flood events. Usage of a long time scale showed how circumstances have changed. We noticed a reduction in the number of people falling in the group of observers and an increase in victims in cars in the last decade.
Based on the types of loss of life (victims in cars, victims in collapsed buildings, professional rescuers, voluntary rescuers, visitors, observers, victims when structural measures collapsed, victims of non-structural measures, and others) which were derived from the circumstances, a platform for the vulnerable groups was established which could be a useful tool for flood managers, especially since the main indicated issues were structural and non–structural failures and people exhibiting risk behaviours.
Our analysis highlighted problems regarding small municipalities (rural areas) that lack mitigating structures, the severity of events with heavy precipitation, and high flows and high return periods. The severity of events was difficult to predict, and this opens up a new challenge on how to improve prediction systems, and, even further, make these specific to a location.
Furthermore, in two events (in the years 2010 and 2014) fatalities in cars happened early in the morning and in one event (2014) low visibility was crucial. There is also the importance of small catchment size (in flood events in the years 2007, 2010, and 2014), which is more unpredictable and usually causes more damage. Existing good practices such as “safety education”, including “Turn around, don’t drown”, as performed by the National Weather Service, could be implemented in Slovenia. This could include placing warning signs on frequently flooded roads, educating drivers on how dangerous flooded roads can be and how fast water can float vehicles. Social media could be used to educate people about the dangers of floodwater and as a channel for people to obtain information from.
In many emergencies, evacuations are obstructed due to people refusing to leave their homes. Residents are often unfamiliar with the flood dangers in their area. Investments need to be carried out in the equipment which rescuers work with. Evaluations have shown an increasing need for improvements in communication strategies between fire fighters and the Administration of the Republic of Slovenia for civil protection and disaster relief.
This study advances understanding of flood fatalities in Slovenia. It gives an overview of demographic, temporal, and circumstantial aspects of victims. By addressing the problem of loss of life from different angles, it advances understanding and highlights the mitigation and preventative measures that can be taken in the future and the remaining challenges regarding how to reduce vulnerability (delving deeper into social dimensions like perception) and improve mitigation structures and post-flood damage restoration.


