Investigation of Karst Spring Flow Cessation Using Grey System Models


Abstract
:1. Introduction
2. Study Area and Data Acquisition
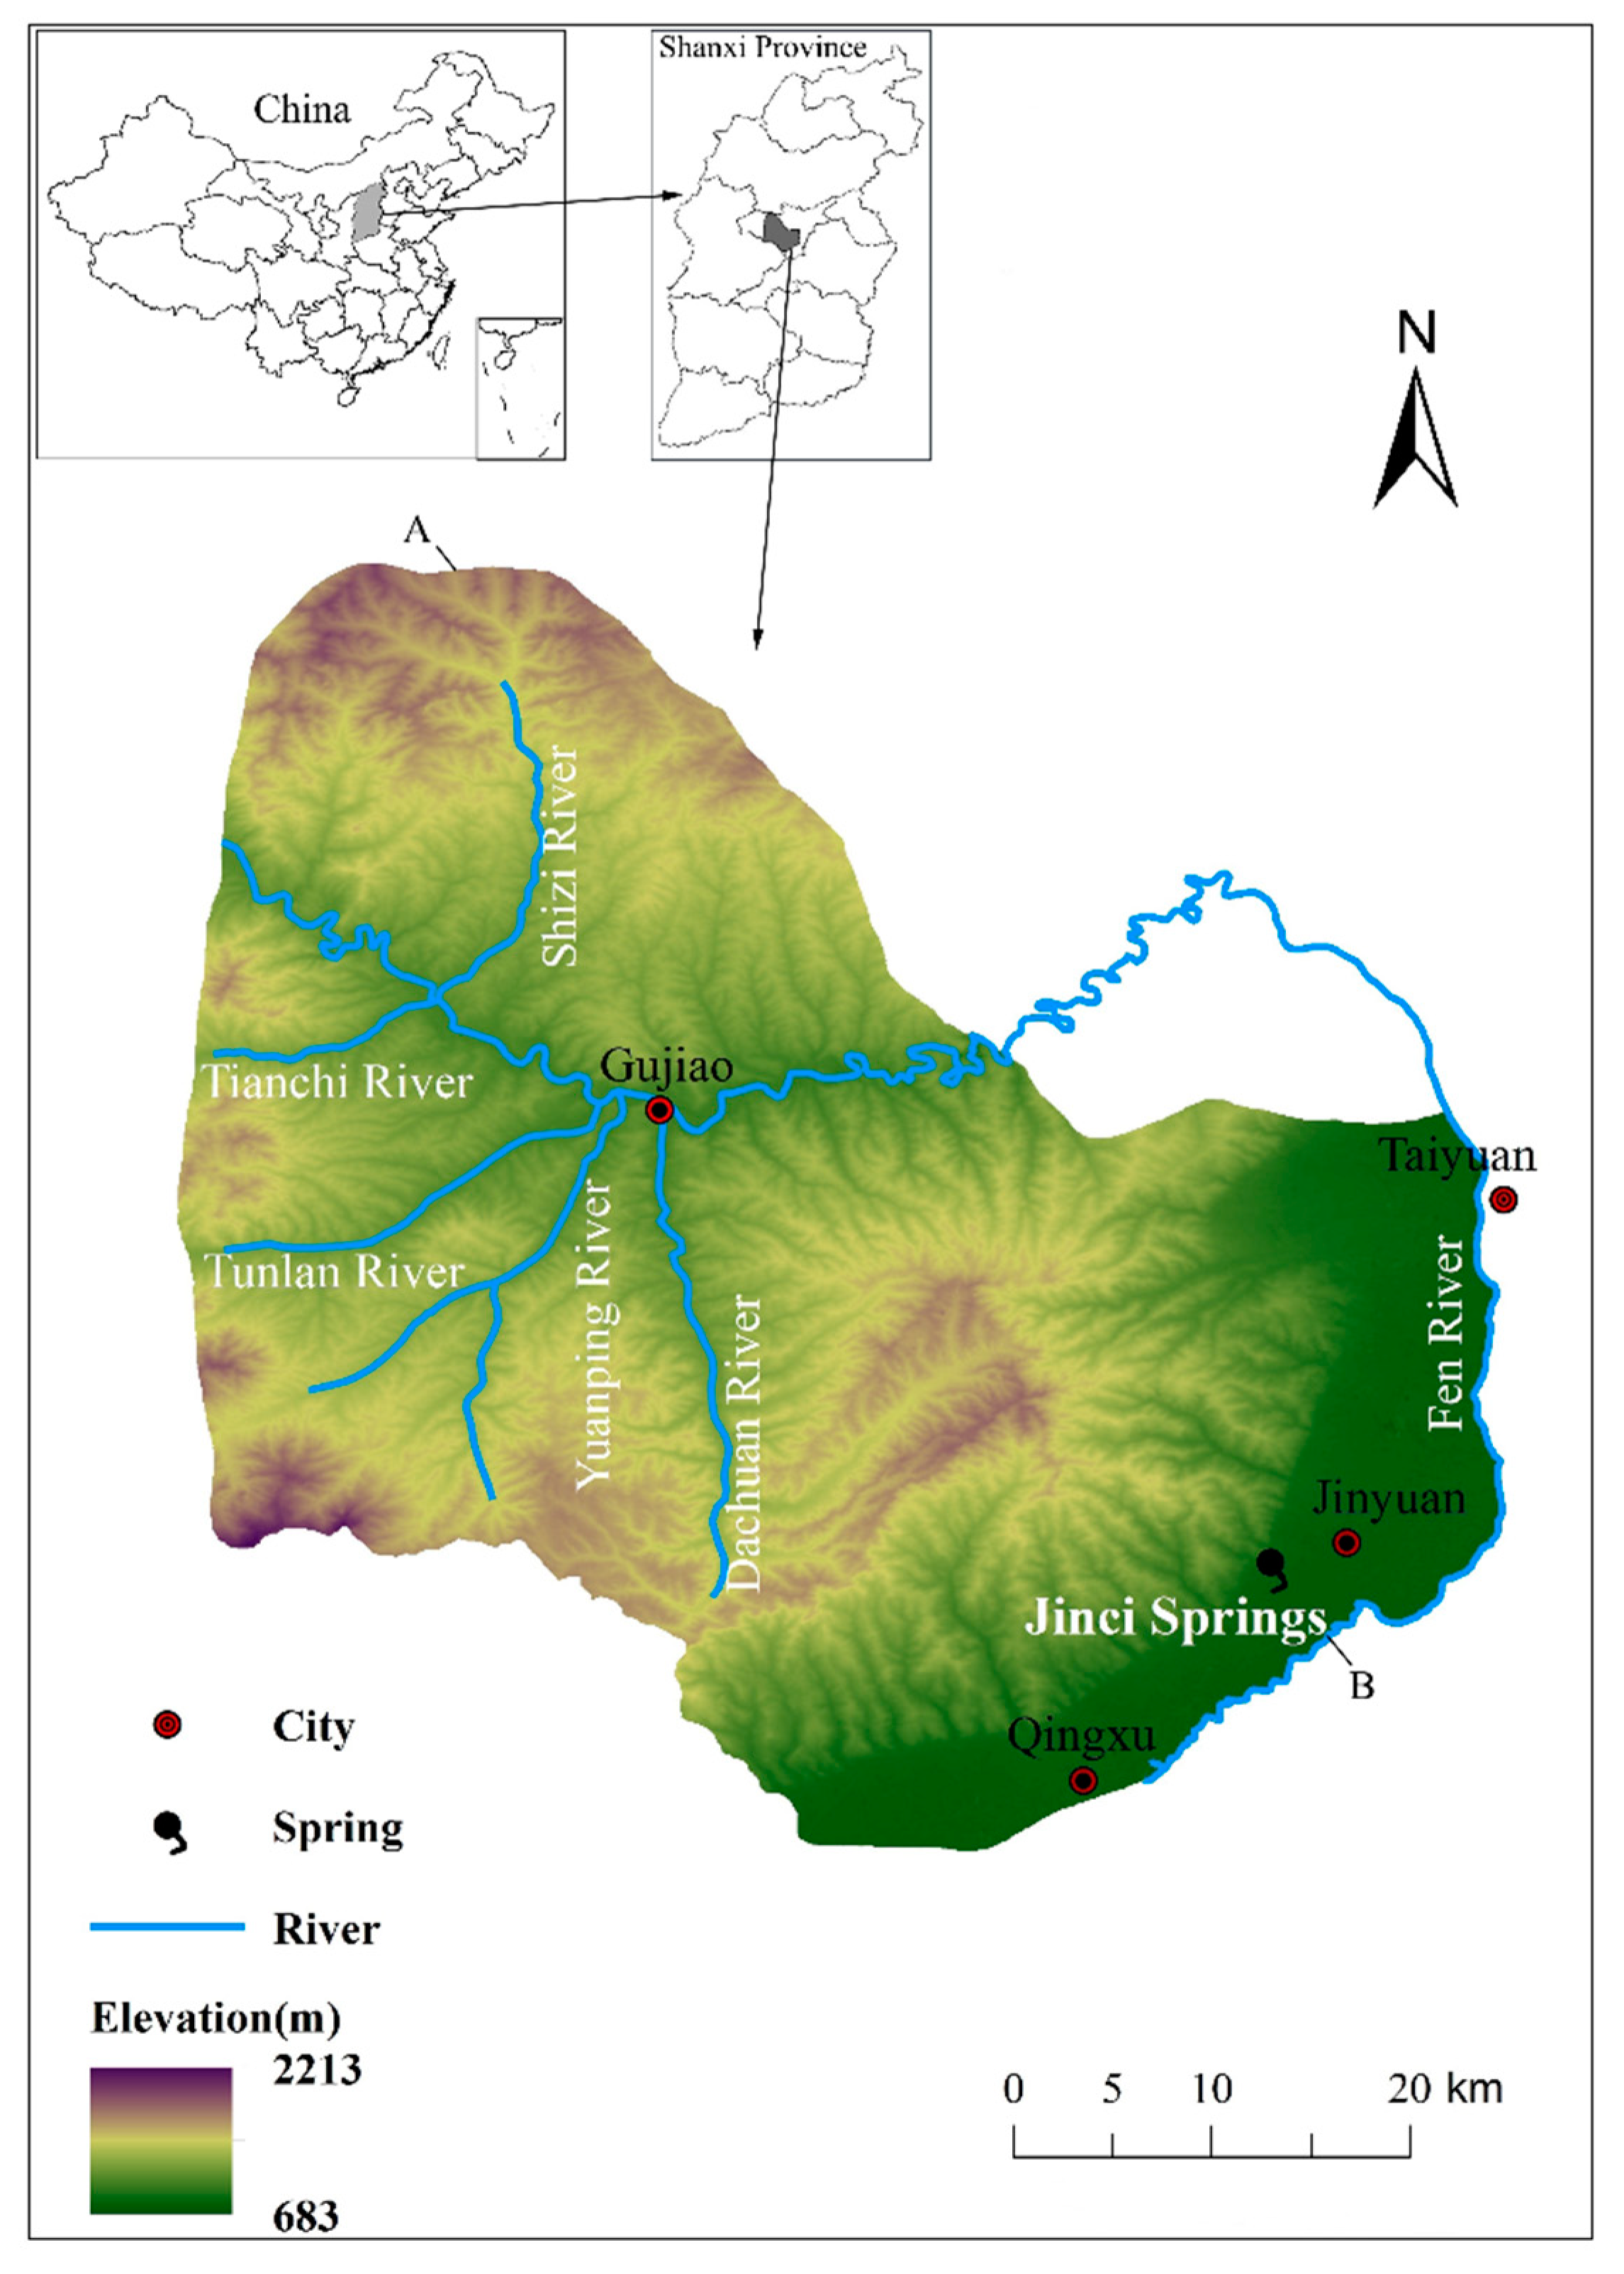
2.1. Geographical Location and Background of Jinci Springs
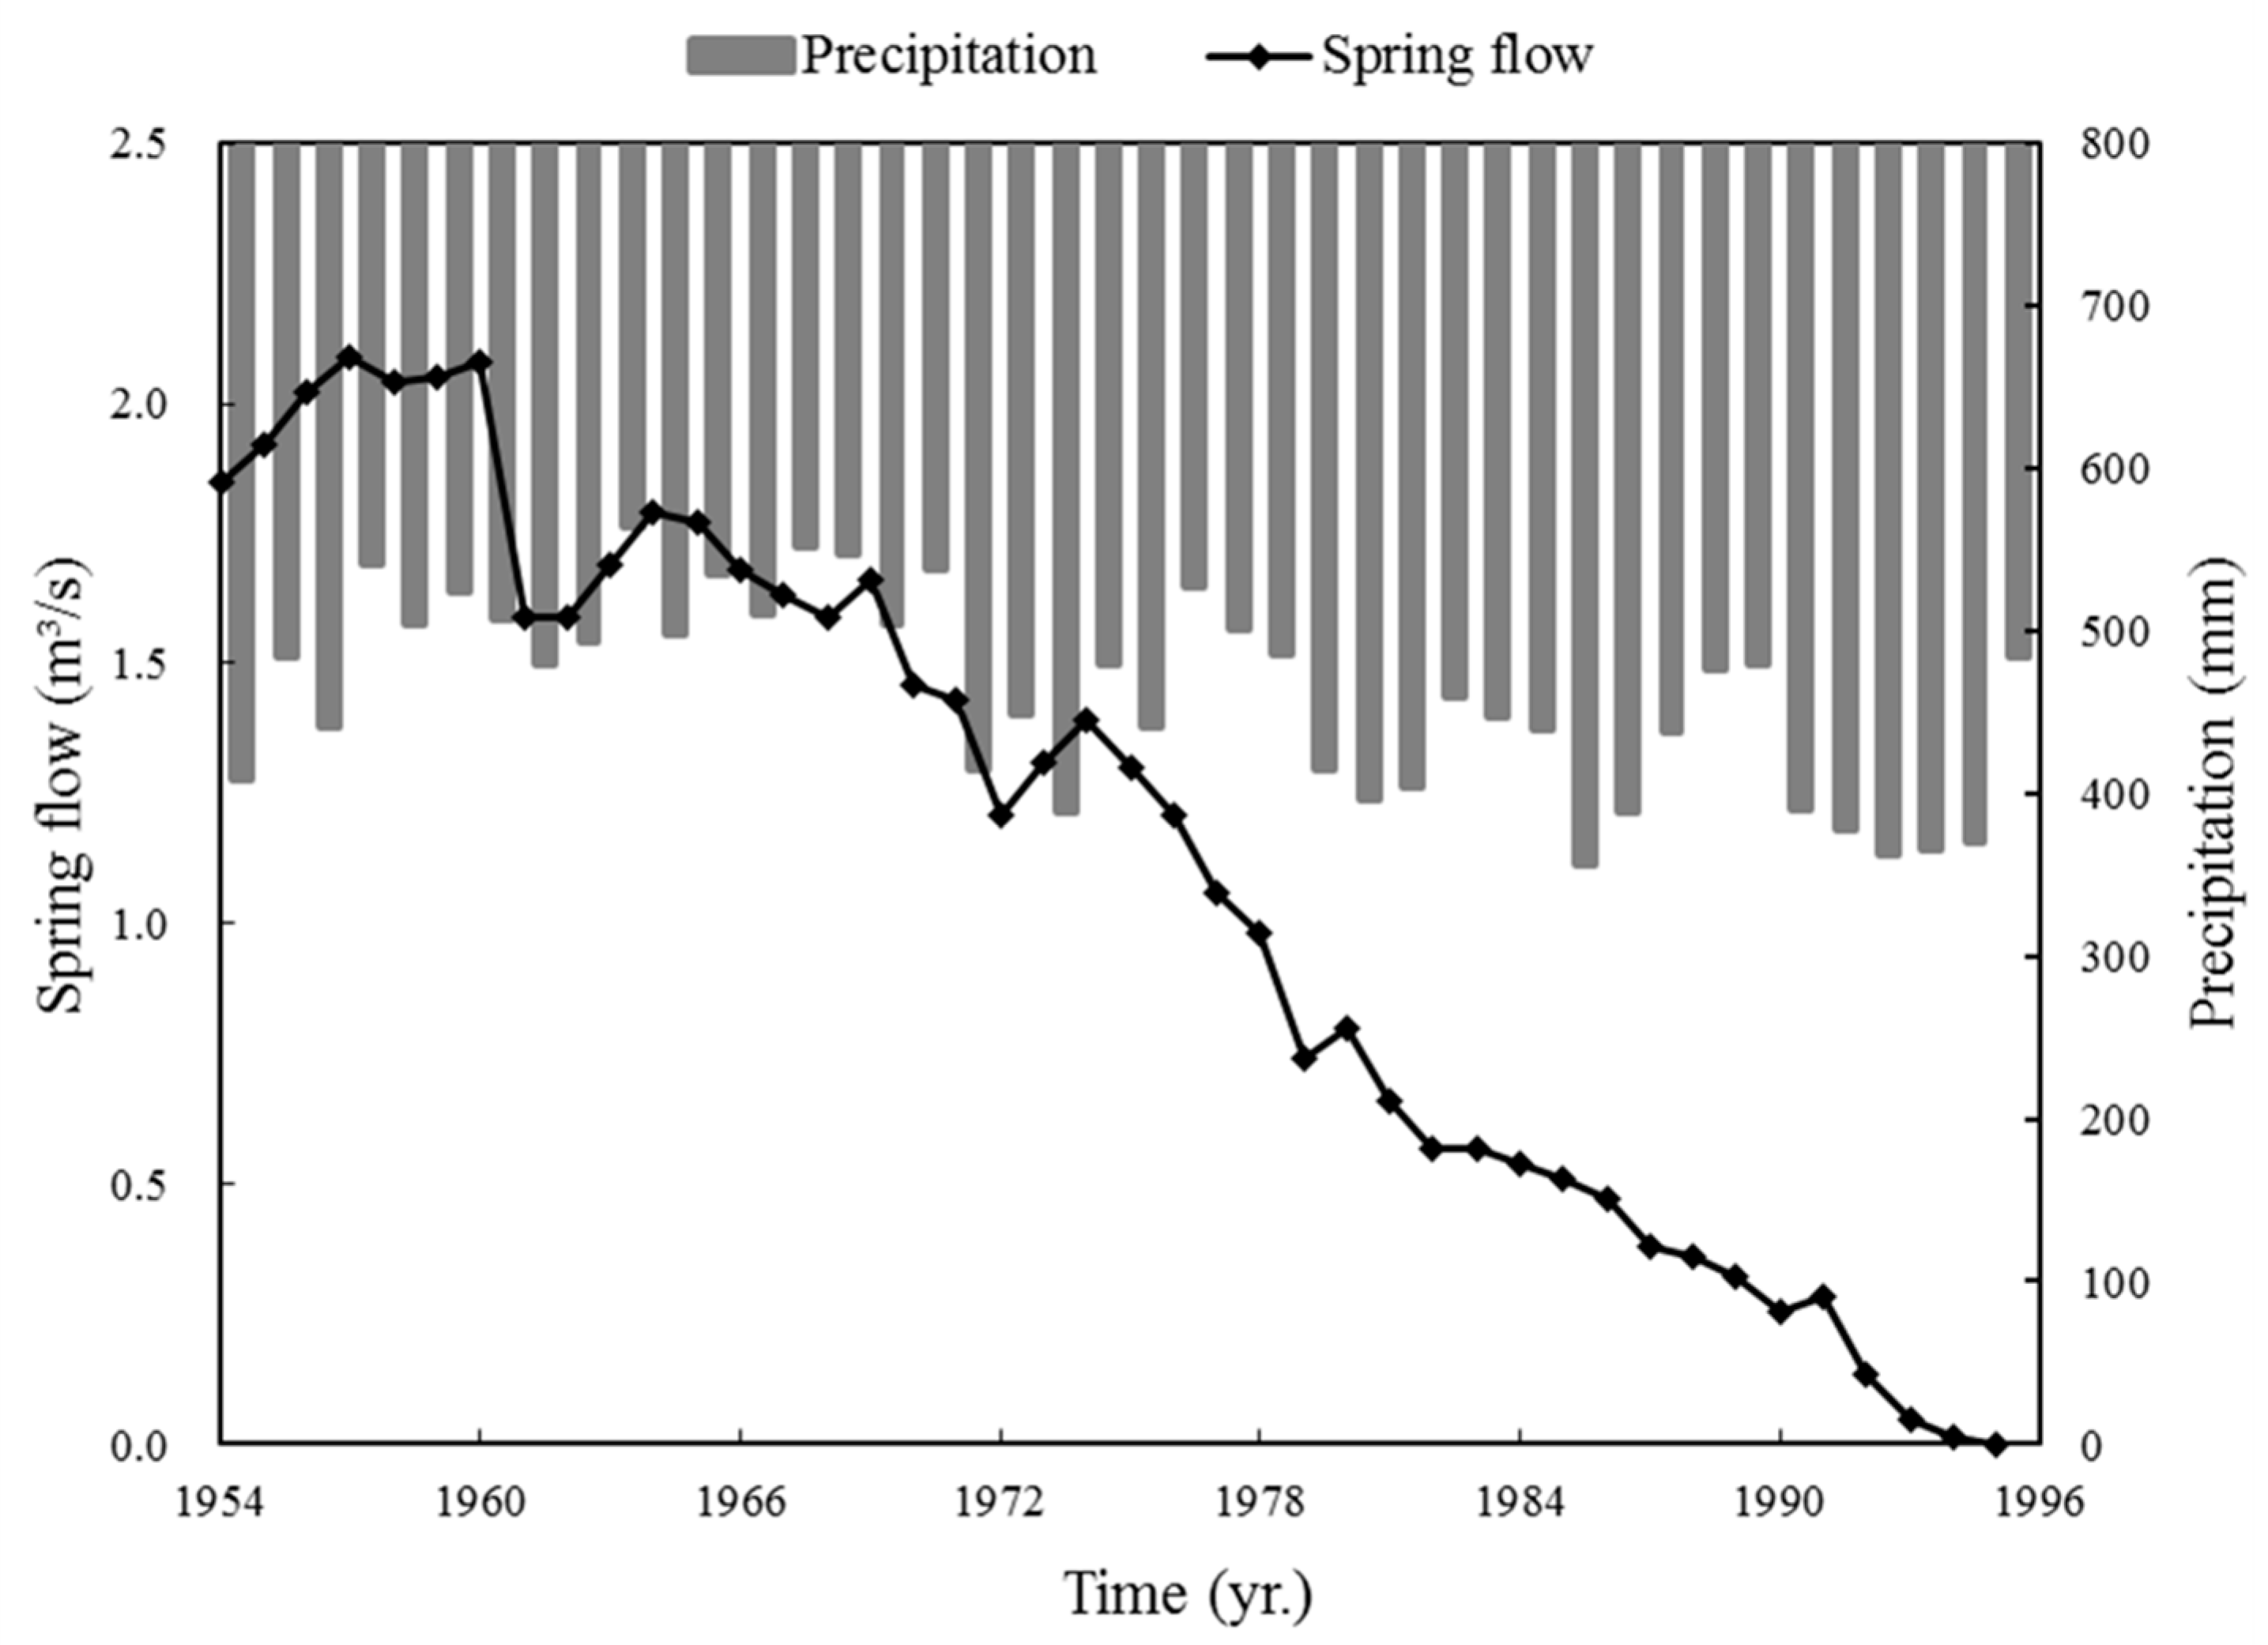
2.2. Climatic Conditions of Jinci Springs
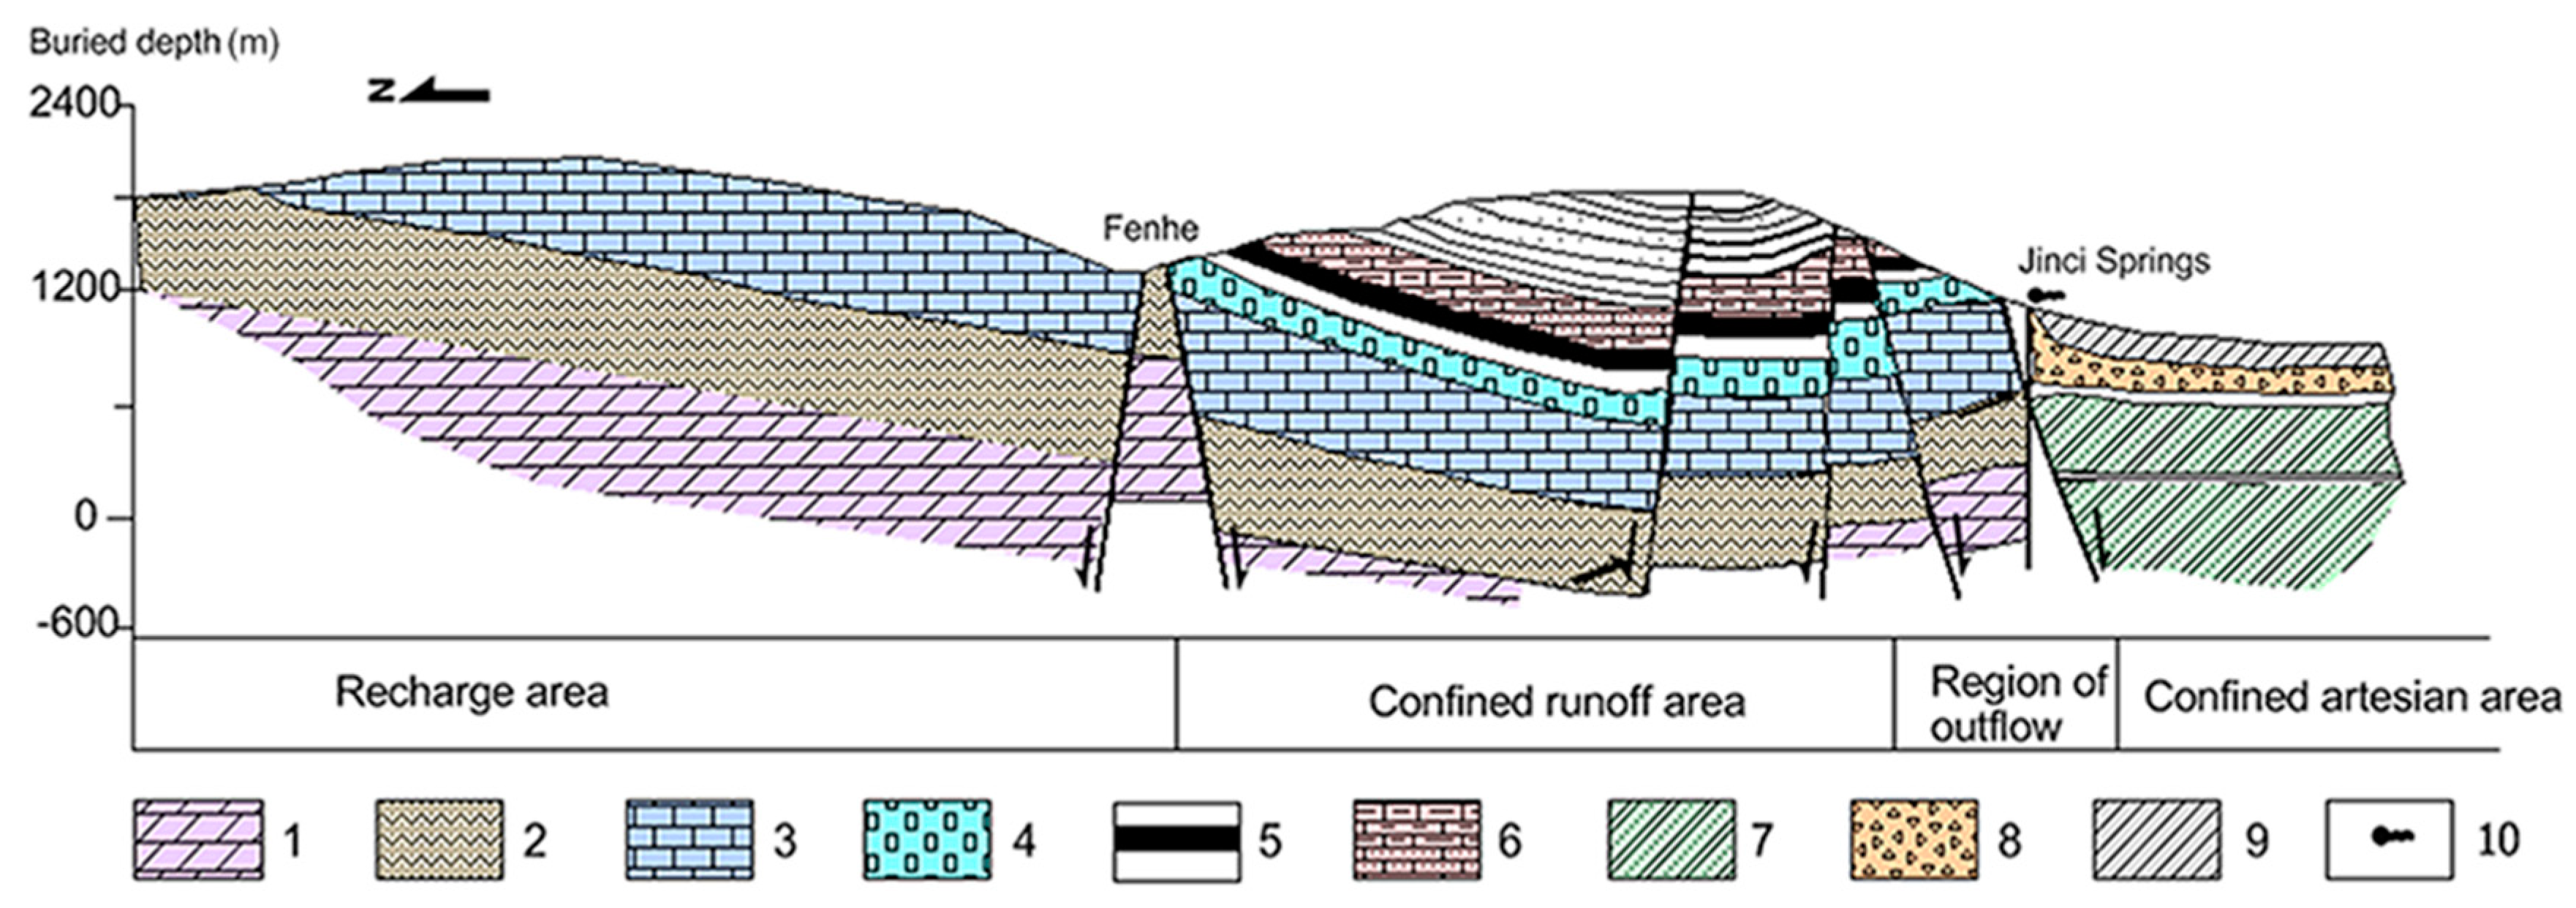
2.3. Hydrogeological Conditions of Jinci Springs
2.4. Data Acquisition
3. Methods
3.1. Grey Relational Analysis with Time Lag
3.2. Grey System GM (1,N) Model with Time Lag
4. Results
4.1. Piecewise Analysis of the Jinci Springs flow
4.2. Grey Relational Degrees with Time Lag
4.3. The Grey System GM (1,N) Model With Time Lag
4.3.1. Establishment of the GM (1,N) Model with Time Lag
4.3.2. Model Calibration
4.3.3. Simulation of Jinci Springs Flow in the Second Stage
5. Discussion
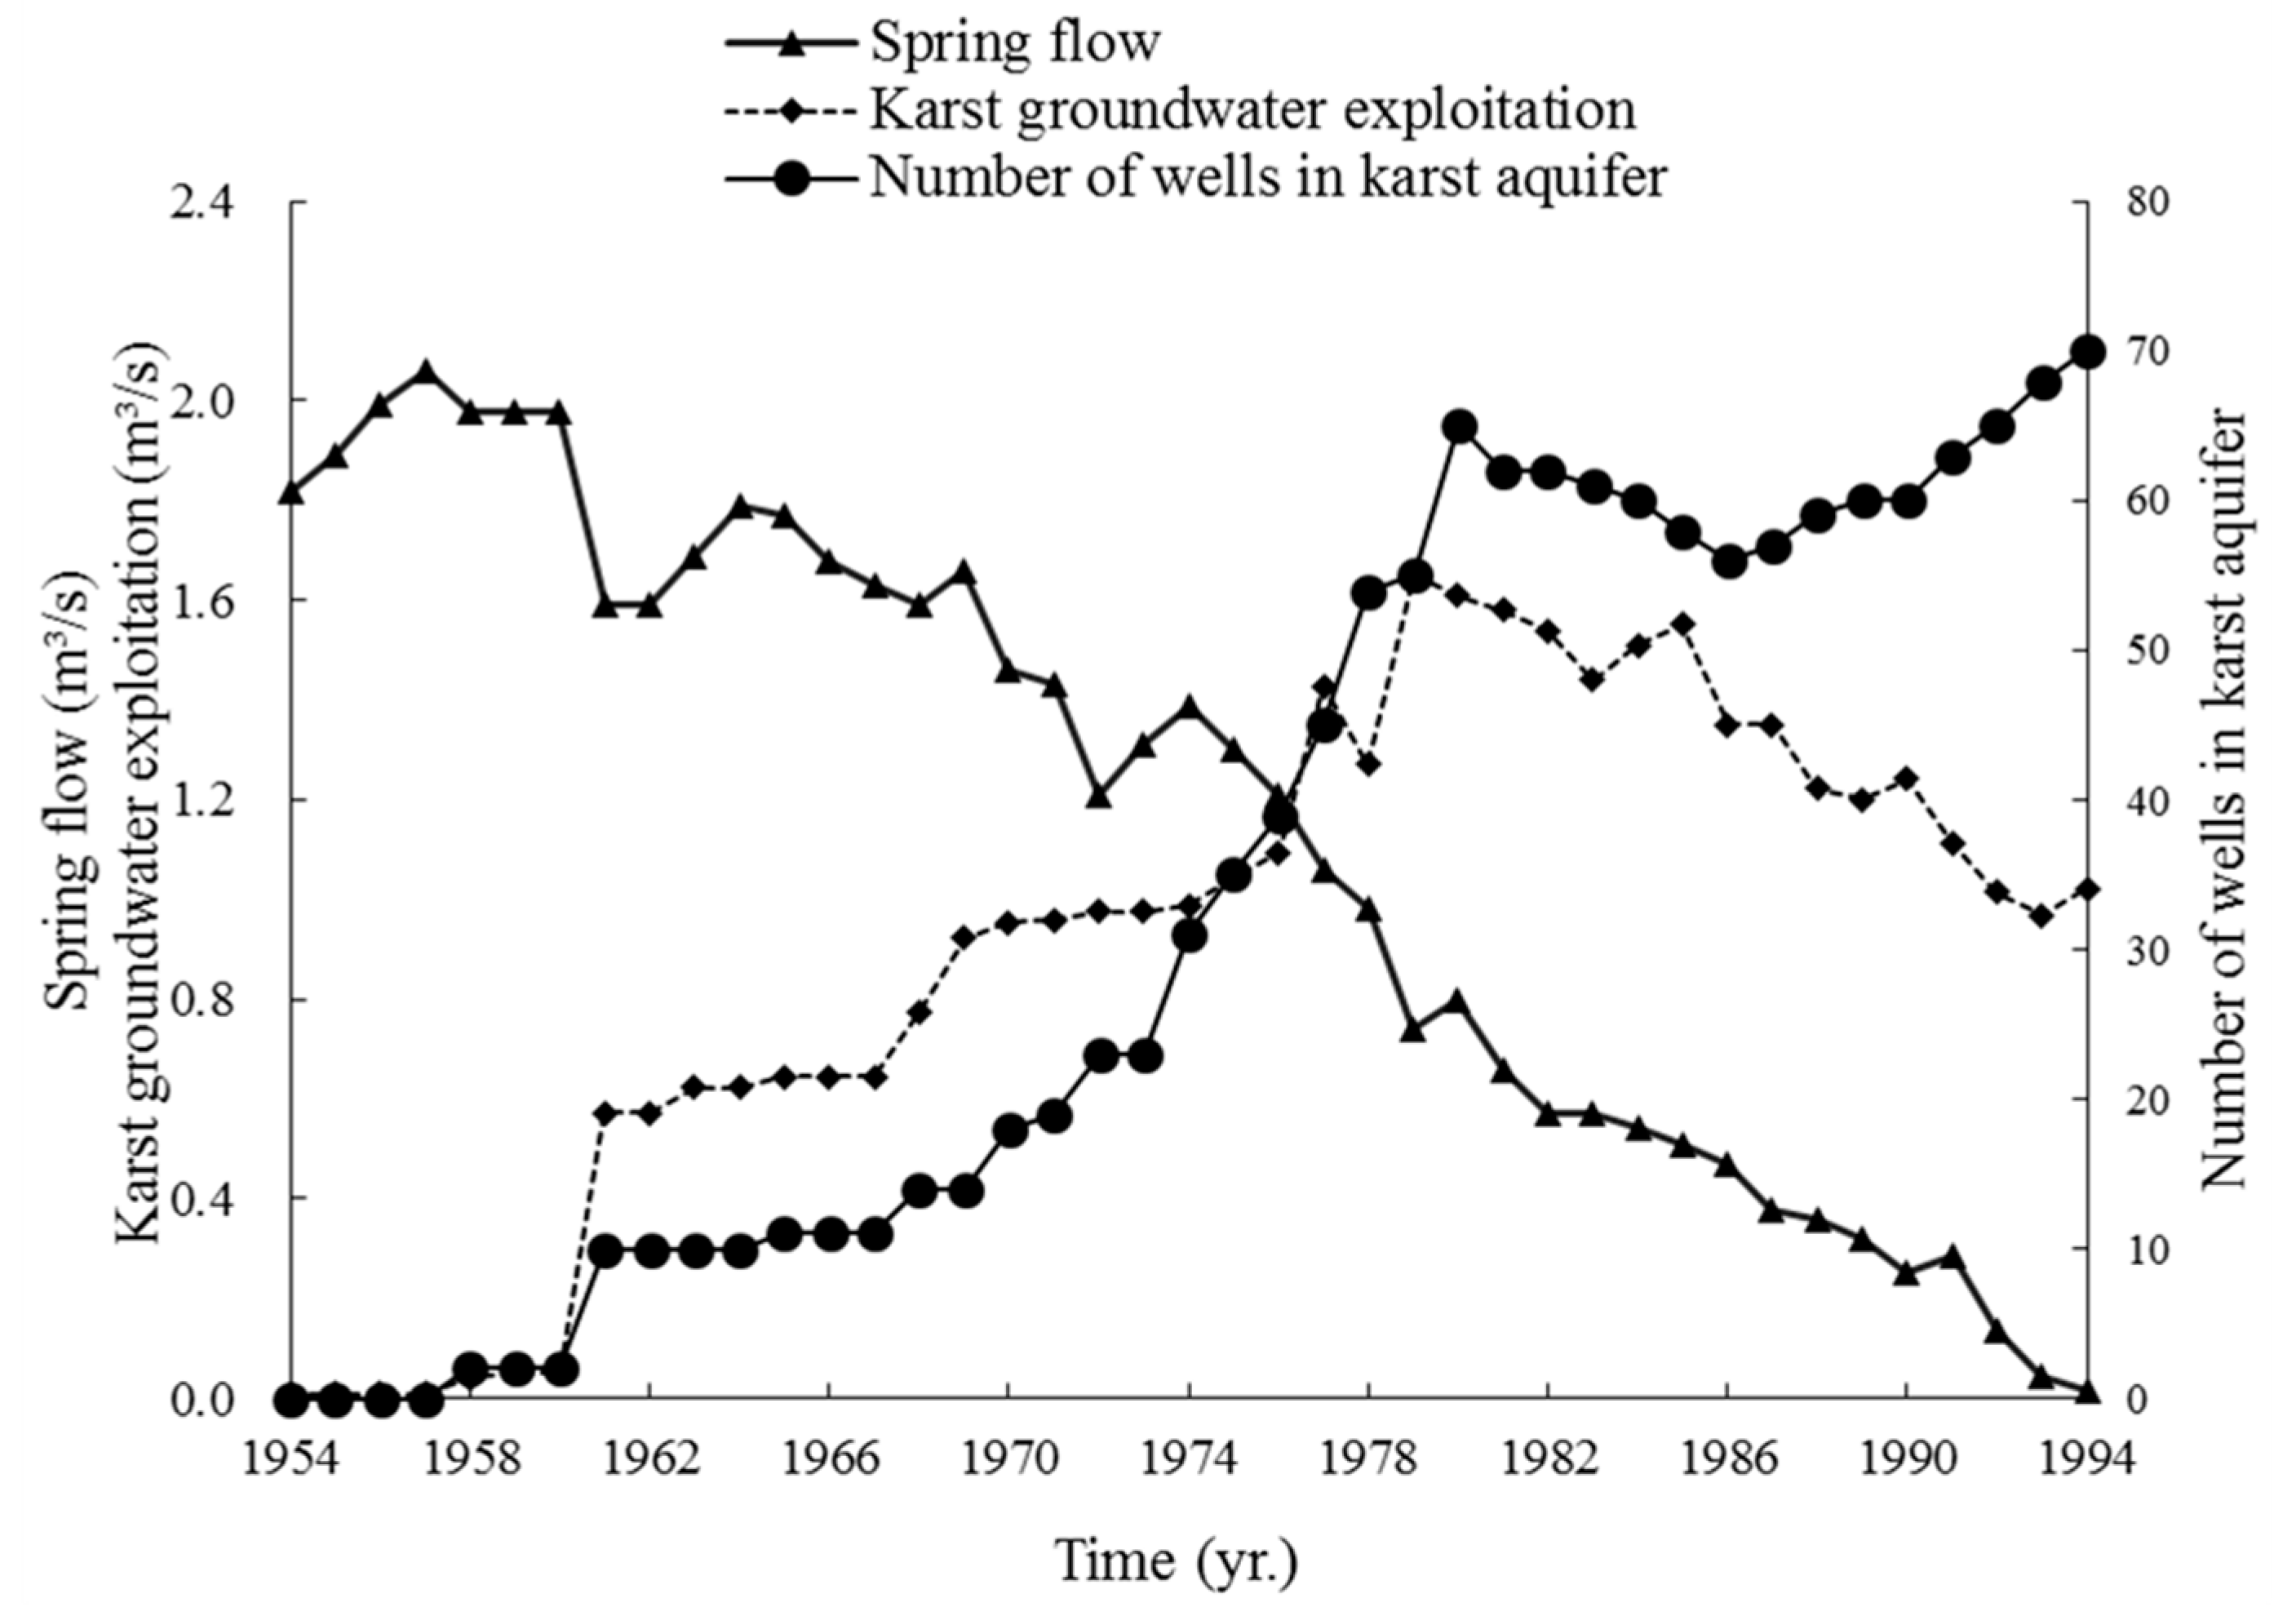
5.1. Karst Groundwater Exploitation
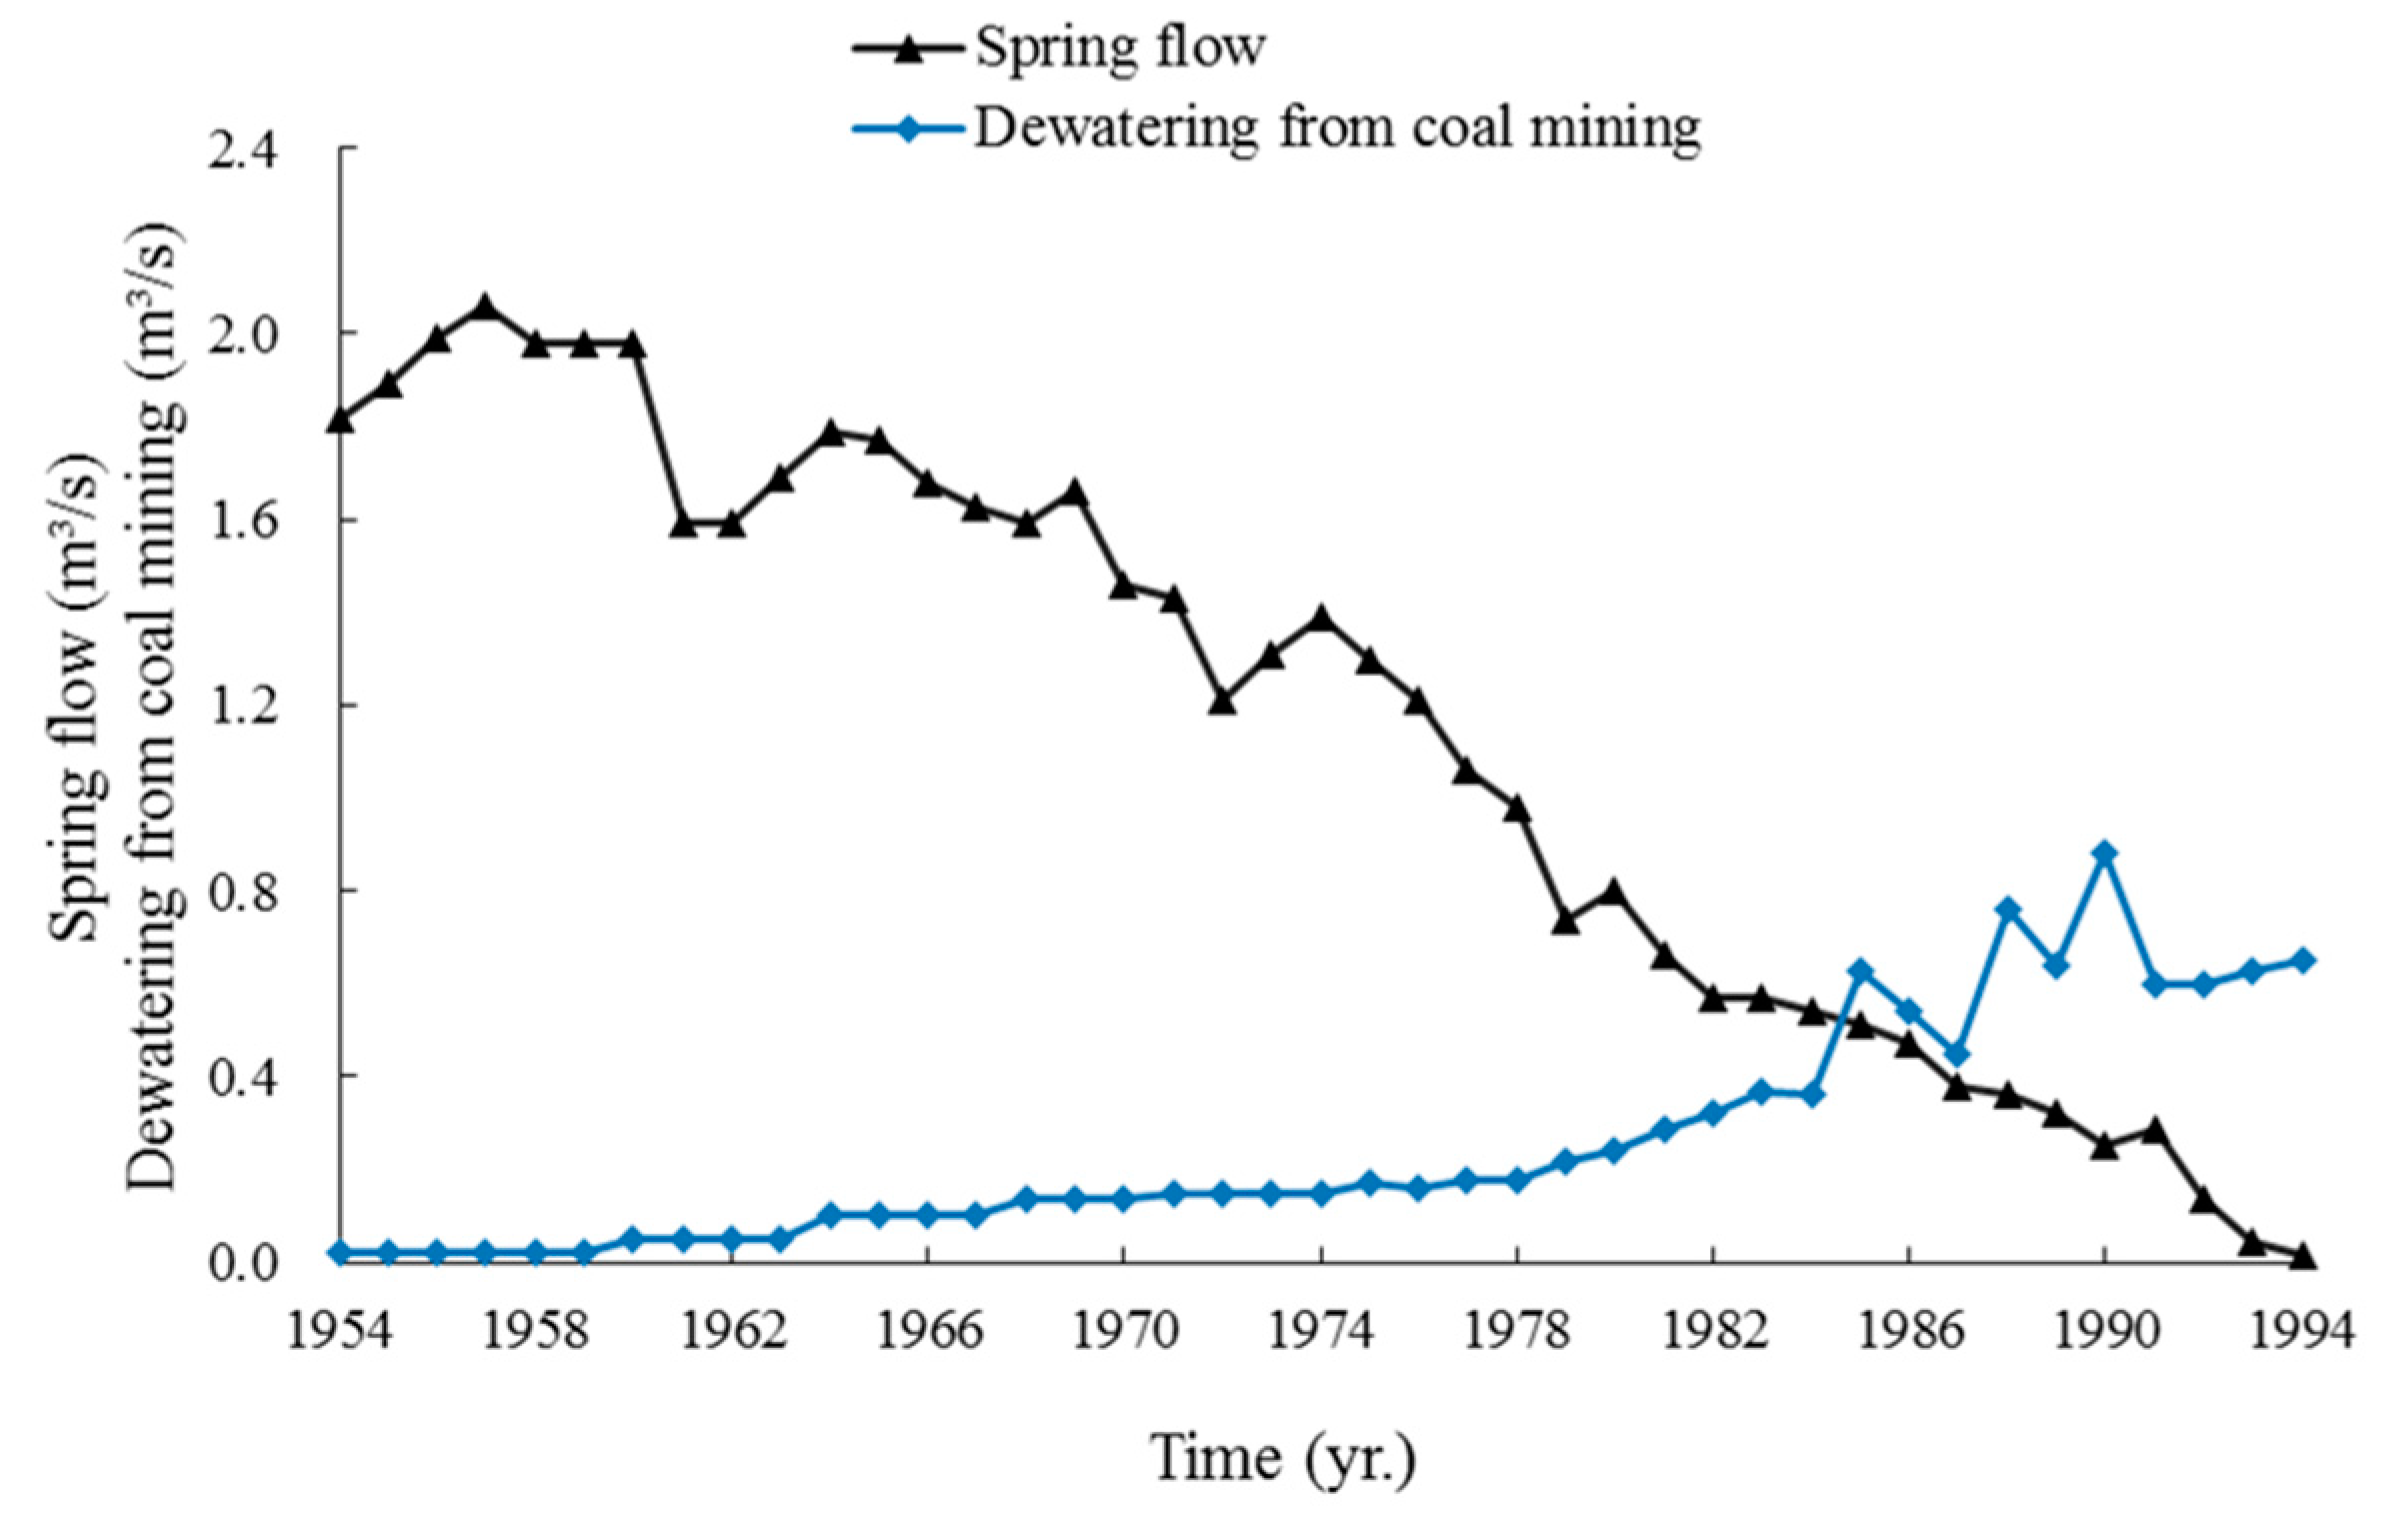
5.2. Dewatering from Coal Mining
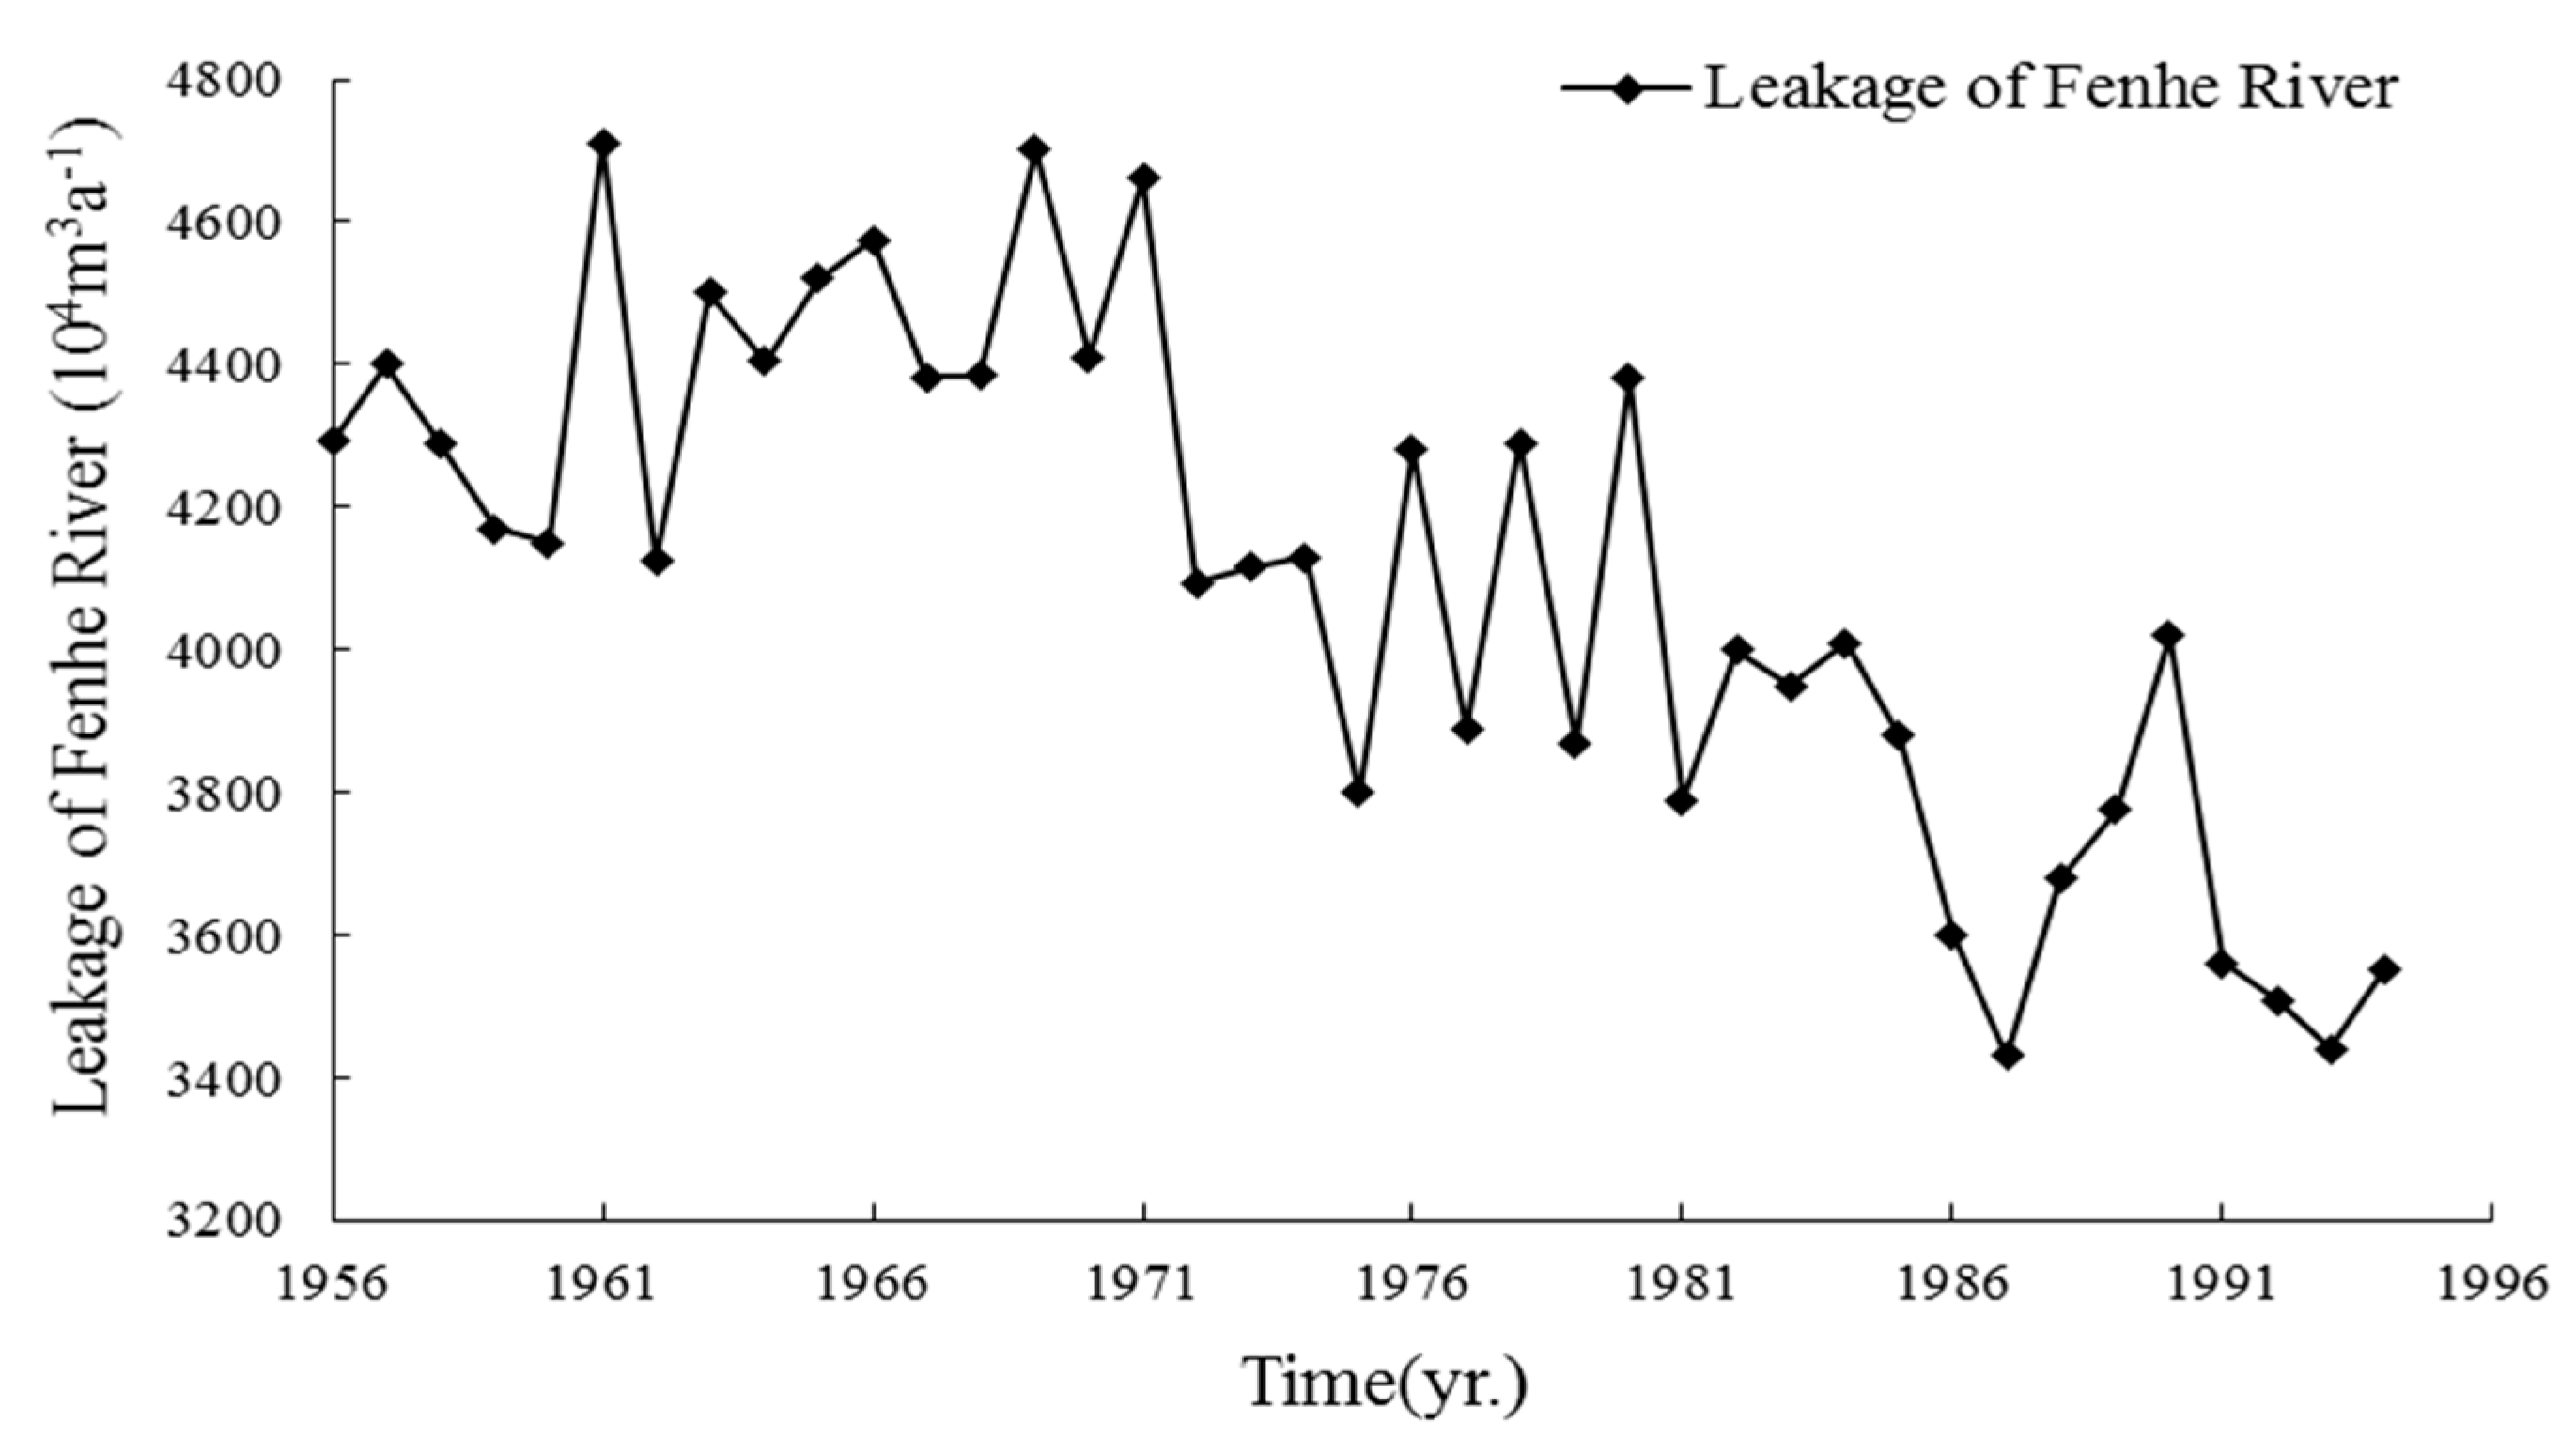
5.3. Construction of the Fenhe Reservoir
6. Conclusions
Author Contributions
Funding
Acknowledgments
Conflicts of Interest
References
- Civita, M.V. An improved method for delineating source protection zones for karst springs based on analysis of recession curve data. Hydrogeol. J. 2008, 16, 855–869. [Google Scholar] [CrossRef]
- Plagnes, V.; Bakalowicz, M. The protection of karst water resources: The example of the Larzac karst plateau (south of France). Environ. Earth Sci. 2001, 40, 349–358. [Google Scholar] [CrossRef]
- Mohammadi, Z.; Mahdavikia, H.; Raeisi, E.; Ford, D.C. Hydrogeological characterization of Dasht-e-Arjan Lake (Zagros Mountains, Iran): Clarifying a long-time question. Environ. Earth Sci. 2019, 78. [Google Scholar] [CrossRef]
- Hao, Y.H.; Liu, G.L.; Li, H.M.; Li, Z.T.; Zhao, J.J.; Yeh, T.J. Investigation of Karstic Hydrological Processes of Niangziguan Springs (North China) Using Wavelet Analysis. Hydrol. Process. 2012, 26, 3062–3069. [Google Scholar] [CrossRef]
- Zakhem, B.A.; Kattaa, B. Overexploitation and cumulative drought trend effect on Ras El Ain karstic spring discharge (Khabour Sub-basin, Syria). J. Earth Syst. Sci. 2017, 126. [Google Scholar] [CrossRef]
- Swart, C.J.U.; James, A.R.; Kleywegt, R.J.; Stoch, E.J. The future of the dolomitic springs after mine closure on the Far West Rand, Gauteng, RSA. Environ. Earth Sci. 2003, 44, 751–770. [Google Scholar] [CrossRef]
- Schrader, A.; Winde, F.; Erasmus, E. Using impacts of deep-level mining to research karst hydrology—A Darcy-based approach to predict the future of dried-up dolomitic springs in the Far West Rand goldfield (South Africa). Part 1: A conceptual model of recharge and inter-compartmental flow. Environ. Earth Sci. 2014, 72, 3549–3565. [Google Scholar] [CrossRef]
- Panilas, S.; Petalas, C.P.; Gemitzi, A. The possible hydrologic effects of the proposed lignite open-cast mining in Drama lignite field, Greece. Hydrol. Process. 2008, 22, 1604–1617. [Google Scholar] [CrossRef]
- Deb, P.; Kiem, A.S.; Willgoose, G. A linked surface water-groundwater modelling approach to more realistically simulate rainfall-runoff non-stationarity in semi-arid regions. J. Hydrol. 2019, 575, 273–291. [Google Scholar] [CrossRef]
- Deb, P.; Kiem, A.S.; Willgoose, G. Mechanisms influencing non-stationarity in rainfall-runoff relationships in southeast Australia. J. Hydrol. 2019, 571, 749–764. [Google Scholar] [CrossRef]
- Liang, Y.P.; Han, X.R.; Xue, F.H.; Li, L.X.; Zhang, W.Z. Water Resources Conservation for Karst Spring Basin of SHANXI Province; China Water and Power Press: Beijing, China, 2008. [Google Scholar]
- Ozdemir, A. Defining groundwater resource protection zones in aquifers using stable isotope analysis: A case study from the Namazgah Dam Basin in Turkey. Environ. Earth Sci. 2019, 78. [Google Scholar] [CrossRef]
- Sappa, G.; De Filippi, F.M.; Iacurto, S.; Grelle, G. Evaluation of Minimum Karst Spring Discharge Using a Simple Rainfall-Input Model: The Case Study of Capodacqua di Spigno Spring (Central Italy). Water 2019, 11, 807. [Google Scholar] [CrossRef]
- Guo, Z.Z.; Zhang, H.D.; Yu, K.N. Multi-factor attenuation of karst springs in Shanxi province. Geo. Investig. Surv. 2004, 2, 22–25. (In Chinese) [Google Scholar]
- Hao, Y.H.; Zhu, Y.; Zhao, Y.; Wang, W.; Du, X.; Yeh, T.J. The role of climate and human influences in the dry-up of the Jinci Springs, China. J. Am. Water Resour. Assoc. 2009, 45, 1228–1237. [Google Scholar] [CrossRef]
- Li, X.; Shu, L.C.; Liu, L.H.; Yin, D.; Wen, J.M. Sensitivity analysis of groundwater level in Jinci Spring Basin (China) based on artificial neural network modeling. Hydrogeol. J. 2012, 20, 727–738. [Google Scholar] [CrossRef]
- Sun, C.Z.; Wang, J.S.; Lin, X.Y. Research on the Jinci Spring’s recovery after the use of water from the yellow river as municipal water supply. Carsologica Sin. 2001, 20, 11–16. (In Chinese) [Google Scholar]
- Shi, H.J.; Qi, X.; Jin, H. Prediction of karst groundwater level based on R-language—Taking Jinci Spring Basin as an example. Appl. Mech. Mater. 2015, 730, 230–234. [Google Scholar] [CrossRef]
- Lv, C.M.; Ling, M.H.; Wu, Z.N.; Gu, P.; Guo, X.; Di, D.Y. Analysis of groundwater variation in the Jinci Spring area, Shanxi Province (China), under the influence of human activity. Environ. Geochem. Health 2019, 41, 921–928. [Google Scholar] [CrossRef]
- Zhao, Y.G.; Cai, Z.H. Research on the Karst-Water System: Case Study of Taiyuan Area; Science Press: Beijing, China, 1990. [Google Scholar]
- Liu, S.F.; Lin, Y. An Introduction to Grey Systems: Foundations, Methodology and Applications; IIGSS Academic Publisher: Slippery Rock, PA, USA, 1998. [Google Scholar]
- Liu, S.F.; Lin, Y. Grey Information: Theory and Practical Applications; Springer: London, UK, 2006. [Google Scholar]
- Hao, Y.H.; Yeh, T.J.; Gao, Z.Q.; Wang, Y.R.; Zhao, Y. A grey system model for studying the response to climatic change: The Liulin karst spring, China. J. Hydrol. 2006, 328, 668–676. [Google Scholar] [CrossRef]
- Hao, Y.H.; Yeh, T.J.; Wang, Y.R.; Zhao, Y. Analysis of karst aquifer spring flows with a grey system decomposition model. Groundwater 2007, 45, 45–56. [Google Scholar] [CrossRef]
- Hao, Y.H.; Wang, Y.J.; Zhu, Y.; Lin, Y.; Wen, J.C.; Yeh, T.J. Response of karst springs to climate change and anthropogenic activities: The Niangziguan Springs, China. Prog. Phys. Geogr. 2009, 33, 634–649. [Google Scholar] [CrossRef]
- Li, W.W. Applying grey system theory to evaluate the relationship between industrial characteristics and innovation capabilities within Chinese high-tech industries. Grey Syst. Theor. Appl. 2016, 6, 143–168. [Google Scholar] [CrossRef]
- Chen, J.J.; Zhang, R.; Liu, B. The empirical study of executive compensation in China port and shipping listed companies based on the grey relational analysis. Grey Syst. Theor. Appl. 2016, 6, 259–269. [Google Scholar] [CrossRef]
- Xie, C.Y.; Feng, J.C.; Zhang, K.; Zhou, H.W.; Xue, S. Water use efficiency and influencing factors in the Mekong River Basin Region based on grey relational analysis. J. Grey Syst. 2018, 2, 28–41. [Google Scholar]
- Liu, S.F. The Grey System Theory and Its Application, 8th ed.; Science Press: Beijing, China, 2017. [Google Scholar]
- Zhao, J.J. Analysis of the Influence of Human Activities on the Spring Discharge in Jinci Springs. Master’s Thesis, Tianjin Normal University, Tianjin, China, 2012. (In Chinese). [Google Scholar]
- Zhong, Y.Y. Numerical Simulation Research on Influence of Channel Leakage in Fenhe River Upstream on Karst Groundwater in Jinci Spring Catchment. Master’s Thesis, Taiyuan University of Technology, Taiyuan, China, 2017. (In Chinese). [Google Scholar]
- Jin, H.; Yang, S.L.; Zheng, X.Q.; Li, C.J. Analysis of the Reduction in Flow from Jinci Springs. J. Taiyuan Univ. Technol. 2005, 36, 488–490. (In Chinese) [Google Scholar]


| Time (year) | 1951 | 1952 | 1953 | 1954 | 1955 | 1956 | 1957 | 1958 | 1959 | 1960 |
| Spring flow (m³/s) | 2.02 | 2.09 | 2.04 | 2.05 | 2.08 | |||||
| Precipitation in advance of 0 to 5 years (mm) | 441.08 | 542.18 | 503.95 | 523.86 | 507.24 | |||||
| 485.26 | 441.08 | 542.18 | 503.95 | 523.86 | ||||||
| 409.67 | 485.26 | 441.08 | 542.18 | 503.95 | ||||||
| 452.27 | 409.67 | 485.26 | 441.08 | 542.18 | ||||||
| 602.92 | 452.27 | 409.67 | 485.26 | 441.08 | ||||||
| 685.92 | 602.92 | 452.27 | 409.67 | 485.26 |
| Time Lag (year) | 0 | 1 | 2 | 3 | 4 | 5 |
| Grey Relational Degree | 0.6621 | 0.7980 | 0.6507 | 0.7559 | 0.5442 | 0.5345 |
| Year | Observed Spring Flow (m3/s) | Simulated Spring Flow (m3/s) | Residual | Relative Error (%) |
|---|---|---|---|---|
| 1956 | 2.02 | 2.02 | 0 | 0 |
| 1957 | 2.09 | 1.60 | 0.49 | 23.46 |
| 1958 | 2.04 | 2.20 | −0.16 | 7.83 |
| 1959 | 2.05 | 1.99 | 0.06 | 2.74 |
| 1960 | 2.08 | 2.11 | −0.03 | 1.24 |
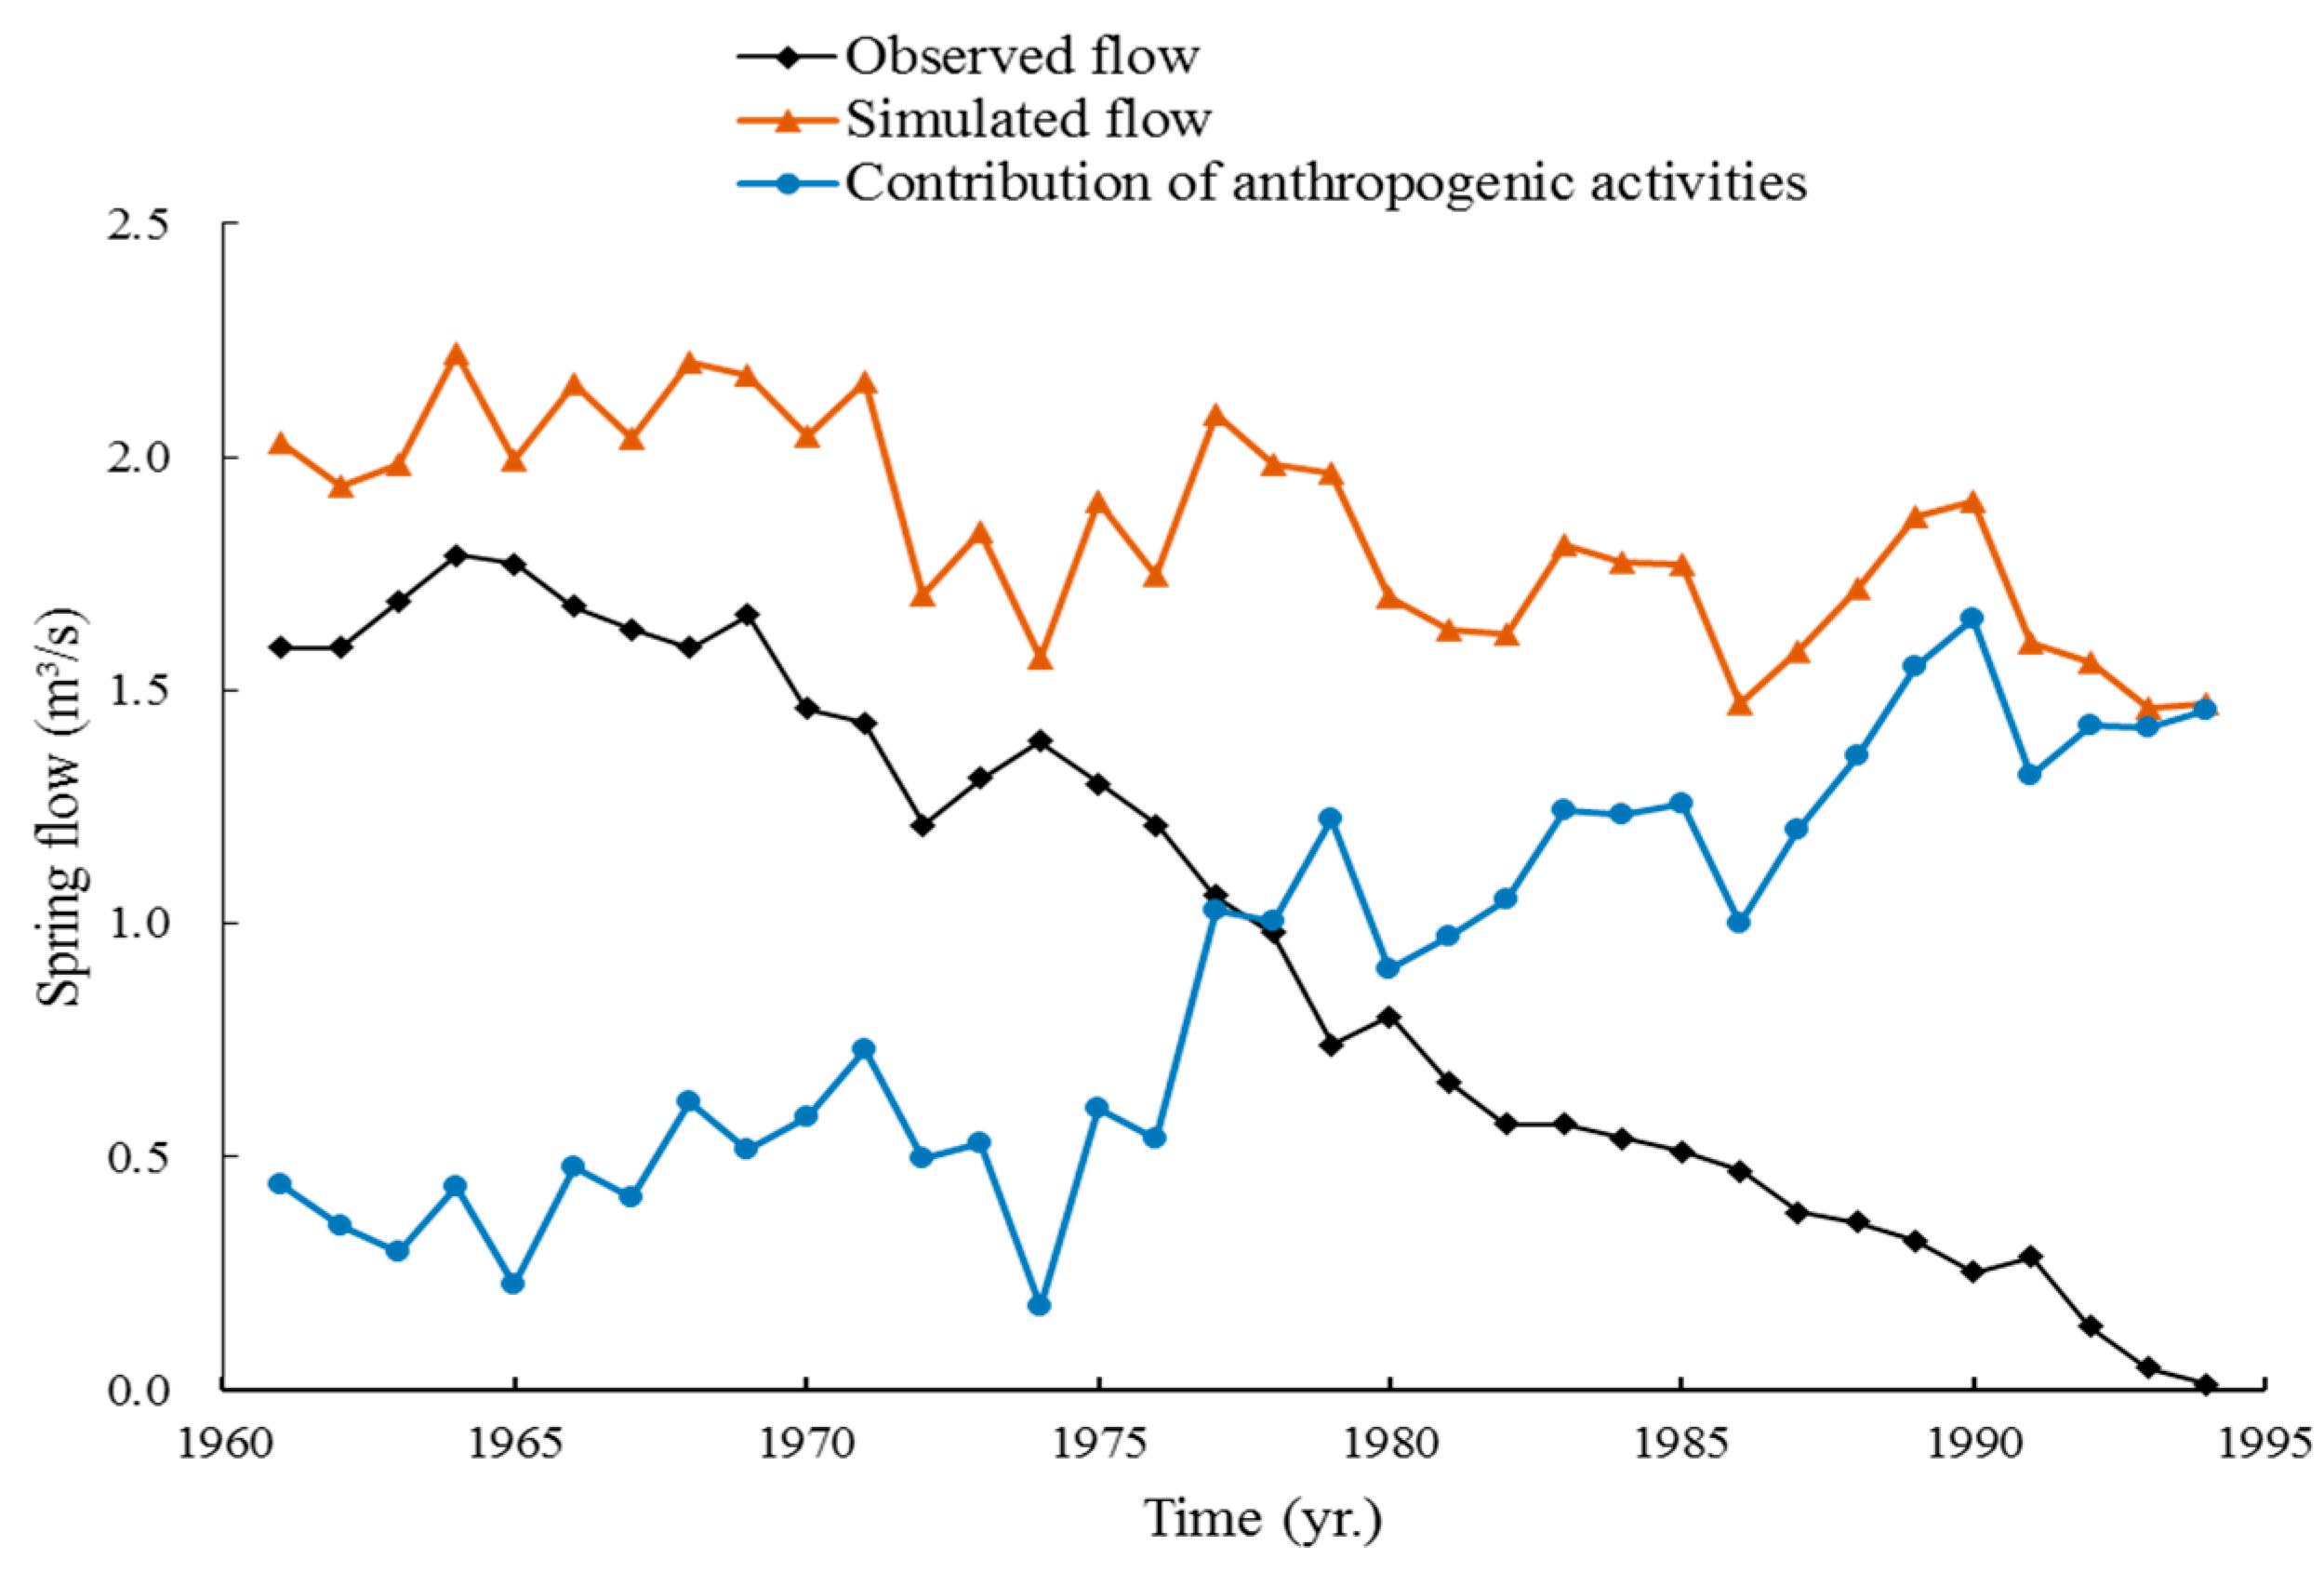
| Year | Observed Spring Flow (m3/s) | Simulated Spring Flow (m3/s) | Contribution of Anthropogenic Activities to Spring Flow Cessation (m3/s) |
|---|---|---|---|
| 1961 | 1.59 | 2.03 | 0.44 |
| 1962 | 1.59 | 1.94 | 0.35 |
| 1963 | 1.69 | 1.99 | 0.30 |
| 1964 | 1.79 | 2.22 | 0.43 |
| 1965 | 1.77 | 1.99 | 0.22 |
| 1966 | 1.68 | 2.16 | 0.48 |
| 1967 | 1.63 | 2.04 | 0.41 |
| 1968 | 1.59 | 2.21 | 0.62 |
| 1969 | 1.66 | 2.17 | 0.51 |
| 1970 | 1.46 | 2.04 | 0.58 |
| 1971 | 1.43 | 2.16 | 0.73 |
| 1972 | 1.21 | 1.70 | 0.49 |
| 1973 | 1.31 | 1.84 | 0.53 |
| 1974 | 1.39 | 1.57 | 0.18 |
| 1975 | 1.30 | 1.90 | 0.60 |
| 1976 | 1.21 | 1.75 | 0.54 |
| 1977 | 1.06 | 2.09 | 1.03 |
| 1978 | 0.98 | 1.98 | 1.00 |
| 1979 | 0.74 | 1.96 | 1.22 |
| 1980 | 0.80 | 1.70 | 0.90 |
| 1981 | 0.66 | 1.63 | 0.97 |
| 1982 | 0.57 | 1.62 | 1.05 |
| 1983 | 0.57 | 1.81 | 1.24 |
| 1984 | 0.54 | 1.77 | 1.23 |
| 1985 | 0.51 | 1.77 | 1.26 |
| 1986 | 0.47 | 1.47 | 1.00 |
| 1987 | 0.38 | 1.58 | 1.20 |
| 1988 | 0.36 | 1.72 | 1.36 |
| 1989 | 0.32 | 1.87 | 1.55 |
| 1990 | 0.25 | 1.90 | 1.65 |
| 1991 | 0.29 | 1.60 | 1.32 |
| 1992 | 0.14 | 1.56 | 1.43 |
| 1993 | 0.05 | 1.46 | 1.42 |
| 1994 | 0.01 | 1.47 | 1.46 |
© 2019 by the authors. Licensee MDPI, Basel, Switzerland. This article is an open access article distributed under the terms and conditions of the Creative Commons Attribution (CC BY) license (http://creativecommons.org/licenses/by/4.0/).
Share and Cite
Guo, Y.; Yeh, T.-C.J.; Hao, Y. Investigation of Karst Spring Flow Cessation Using Grey System Models. Water 2019, 11, 1927. https://doi.org/10.3390/w11091927
Guo Y, Yeh T-CJ, Hao Y. Investigation of Karst Spring Flow Cessation Using Grey System Models. Water. 2019; 11(9):1927. https://doi.org/10.3390/w11091927
Chicago/Turabian StyleGuo, Yaru, Tian-Chyi Jim Yeh, and Yonghong Hao. 2019. "Investigation of Karst Spring Flow Cessation Using Grey System Models" Water 11, no. 9: 1927. https://doi.org/10.3390/w11091927
APA StyleGuo, Y., Yeh, T.-C. J., & Hao, Y. (2019). Investigation of Karst Spring Flow Cessation Using Grey System Models. Water, 11(9), 1927. https://doi.org/10.3390/w11091927