1. Introduction
Scour is a main design concern for hydraulic structures such as bridge or wind turbine foundations [
1,
2,
3,
4], buried pipelines [
5,
6,
7], weirs and sills [
8,
9,
10,
11,
12], etc. The scour at instream structures can be classified into three types: general scour, constriction scour and local scour [
13,
14,
15]. The general scour is normally caused by the evolution of the river bed and is independent of the instream structure. The constriction scour occurs where an instream structure narrows the flow section. The local scour is caused directly by the change of flow pattern induced by the existence of the instream structure.
Bed degradation usually occurs when the bed erosion rate is greater than the upstream sediment replenishment rate. It can induce general scour at the foundations of instream structures and destabilize riverbanks, threatening the security of both the public and private properties [
16]. Grade control structures (GCSs) such as submerged weirs, bed sills and check dams are common countermeasures for bed degradation [
9,
10,
11,
17,
18,
19]. They can raise the upstream water level and reduce the flow capacity for sediment transport, preventing the upstream river bed from being excessively degraded. Properly designed GCSs play a role as a grade control datum (GCD) for the upstream river reach [
16,
20]. The GCD is usually the crest elevation of the GCS which is lower than the upstream bed level.
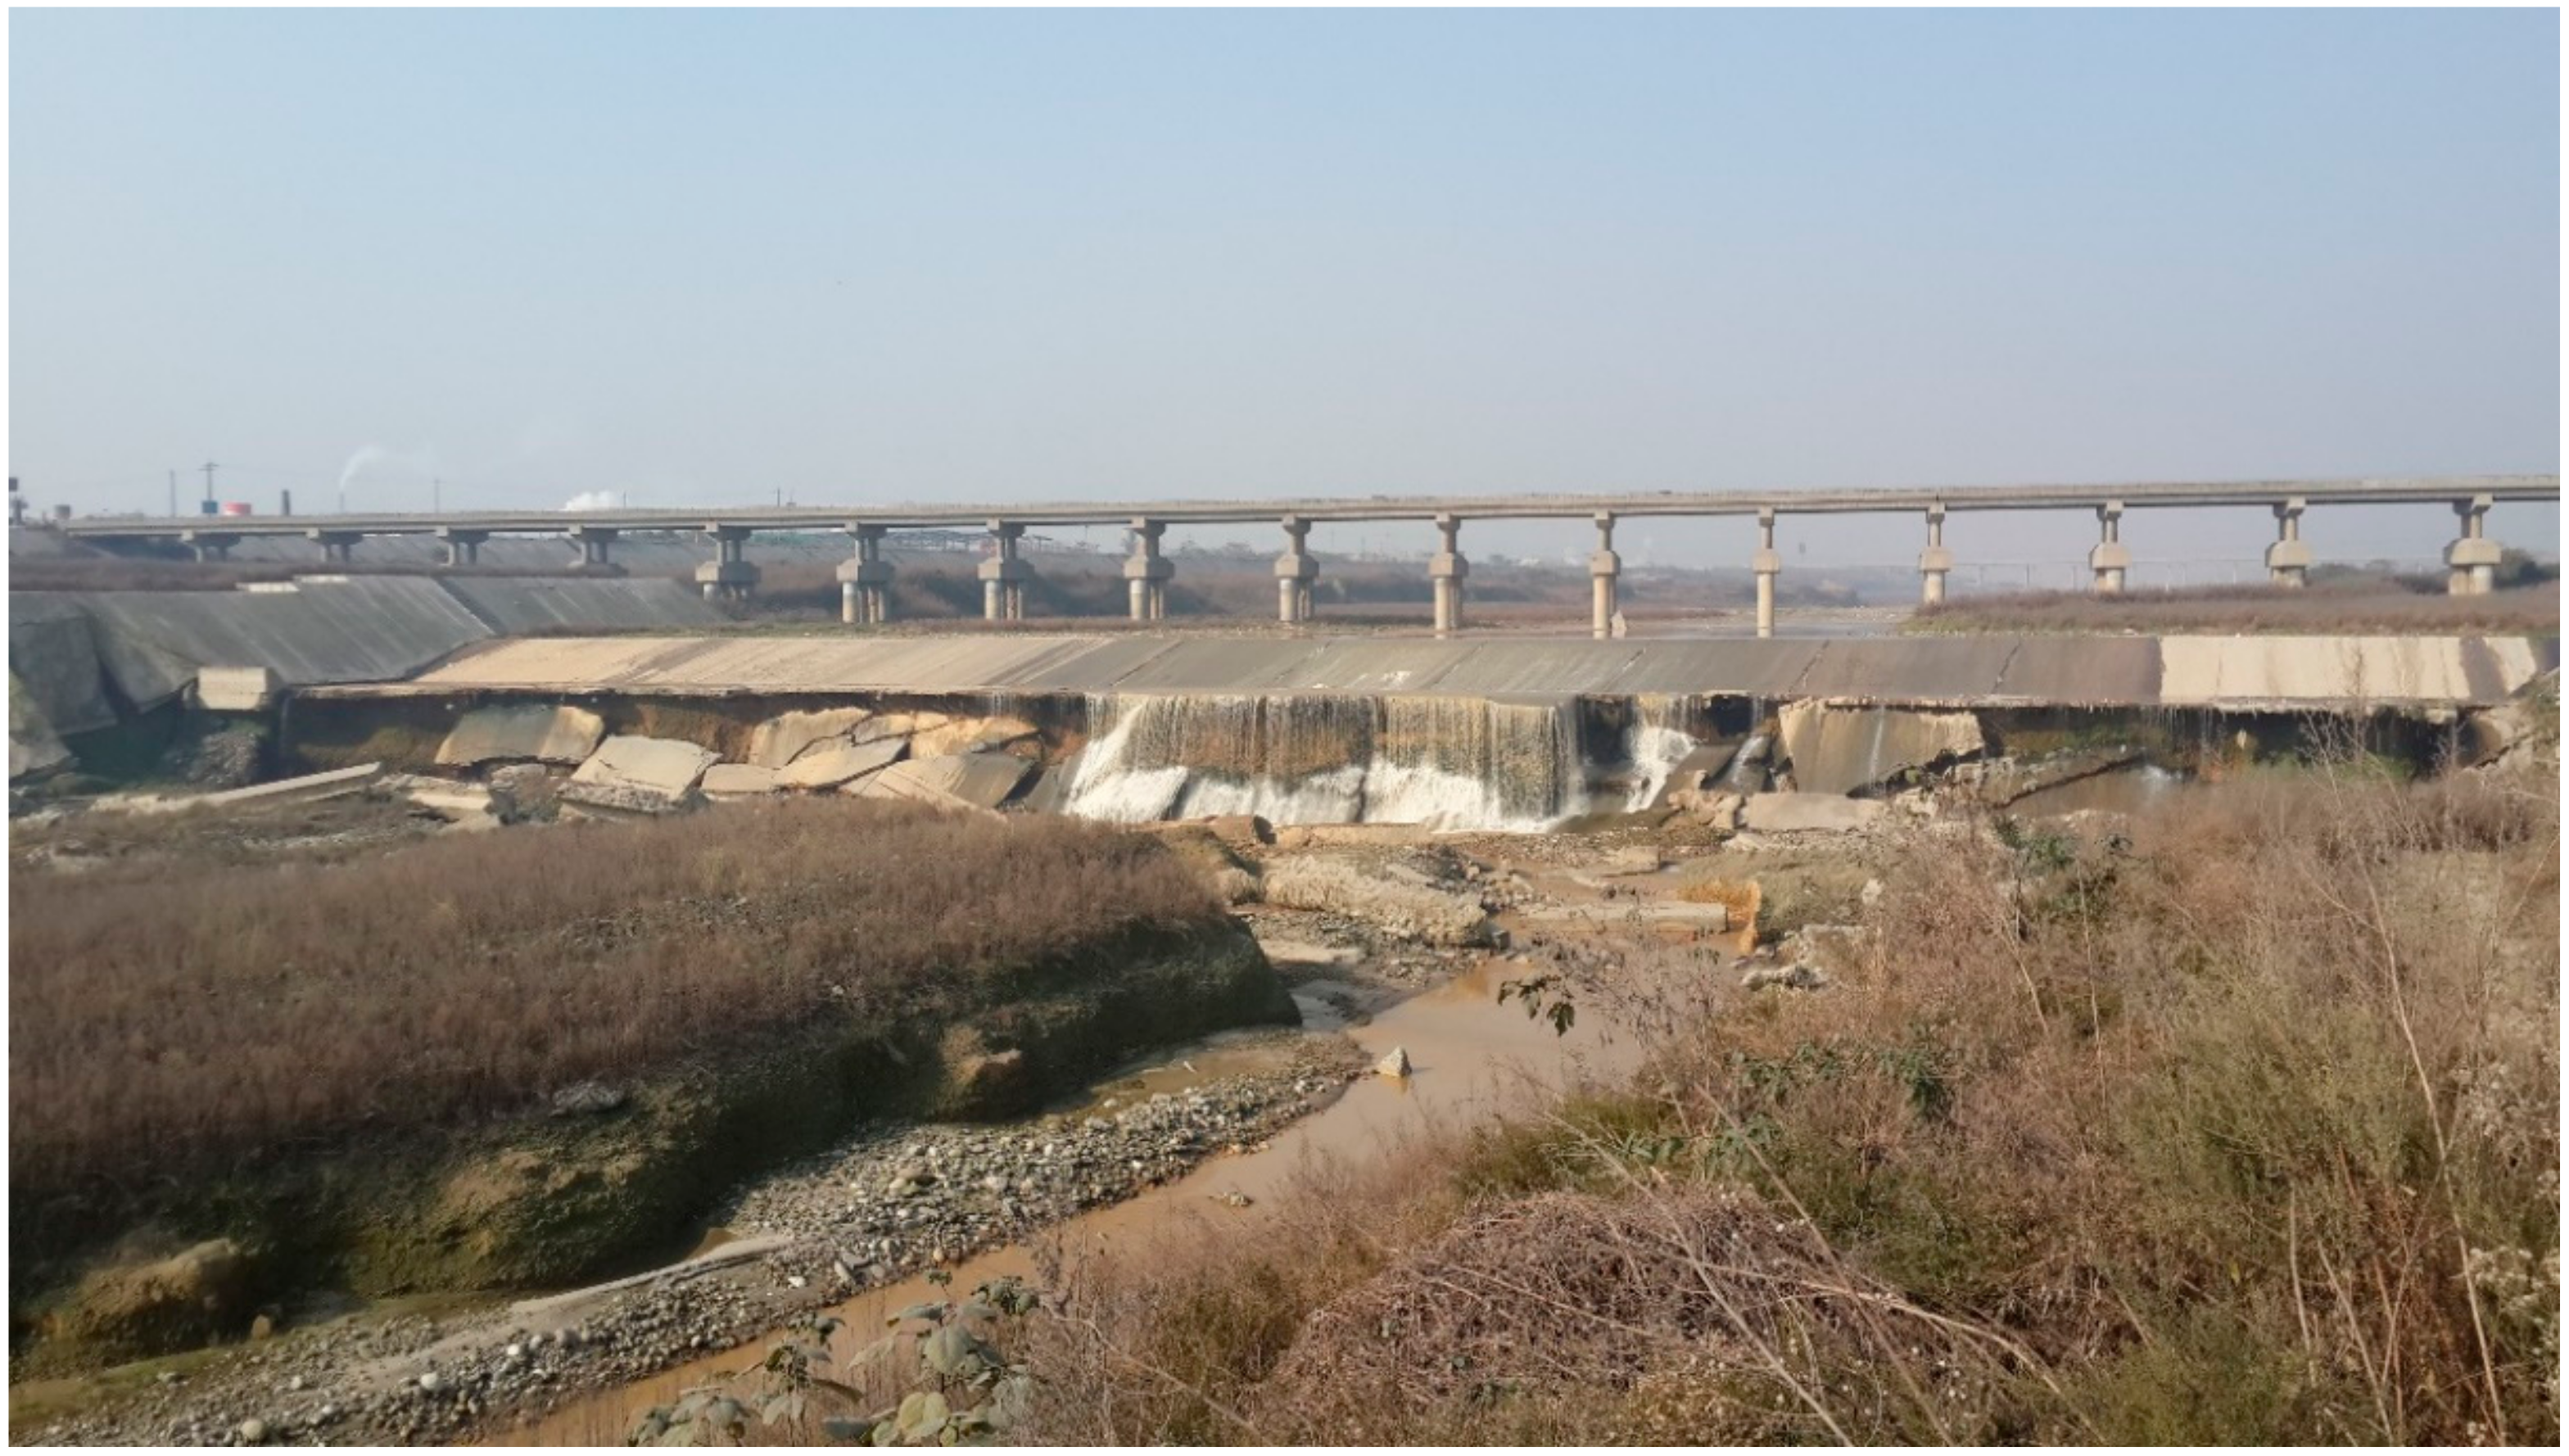
However, the flow over GCSs can cause local scour [
8,
9,
10,
11,
12], and the downstream general scour may continue if there are no further downstream GCSs, leading to structural damages or failures (
Figure 1). The failure of a GCS induces a drop in GCD, accelerating the adverse impacts they are initially built to prevent [
16]. Thus, it is important to understand the scour process at GCDs for safe design. Also, understanding the impacts of GCD drop on the upstream bed morphology can help to assess the stability of the upstream riverbanks and instream structures if the GCS fails.
The local scours at GCSs have been extensively studied and many empirical equations have been proposed [
8,
10,
11,
12,
21,
22,
23,
24,
25,
26,
27,
28,
29,
30,
31,
32,
33,
34,
35,
36,
37,
38]. Some studies also investigated the impacts of GCSs on the river bed profile [
17,
18]. Although very important, no studies have investigated the effects of GCS failure (i.e., GCD drop) on the upstream river reach. This paper conducted a scaled model test based on a 1.3 km-long river reach upstream of a GCS in Shiting River, China, investigating the effects of GCD drop on the upstream riverbed morphology.
2. Background
Shiting River is the first tributary of Tuo River. It originates from the Longmen mountain located in Sichuan Province, China, having a length of 131.7 km and a basin area of 1501 km
2. The mountainous reach (upstream reach) of the Shiting River is 61.1 km long with a gradient between 92.3–10.4‰. The gradient of the river reach downstream of the mountain decreases gradually and ranges between 12 and 2.5‰ before it joins the Tuo River. Since the Wenchuan Earthquake (Ms 8.0) in 2008, serious bed degradation occurred in the piedmont reach of Shiting River, significantly exposing and endangering the foundations of instream infrastructures [
39,
40]. Thus, grade control structures (GCSs) were extensively used in this river reach as countermeasures for bed degradation.
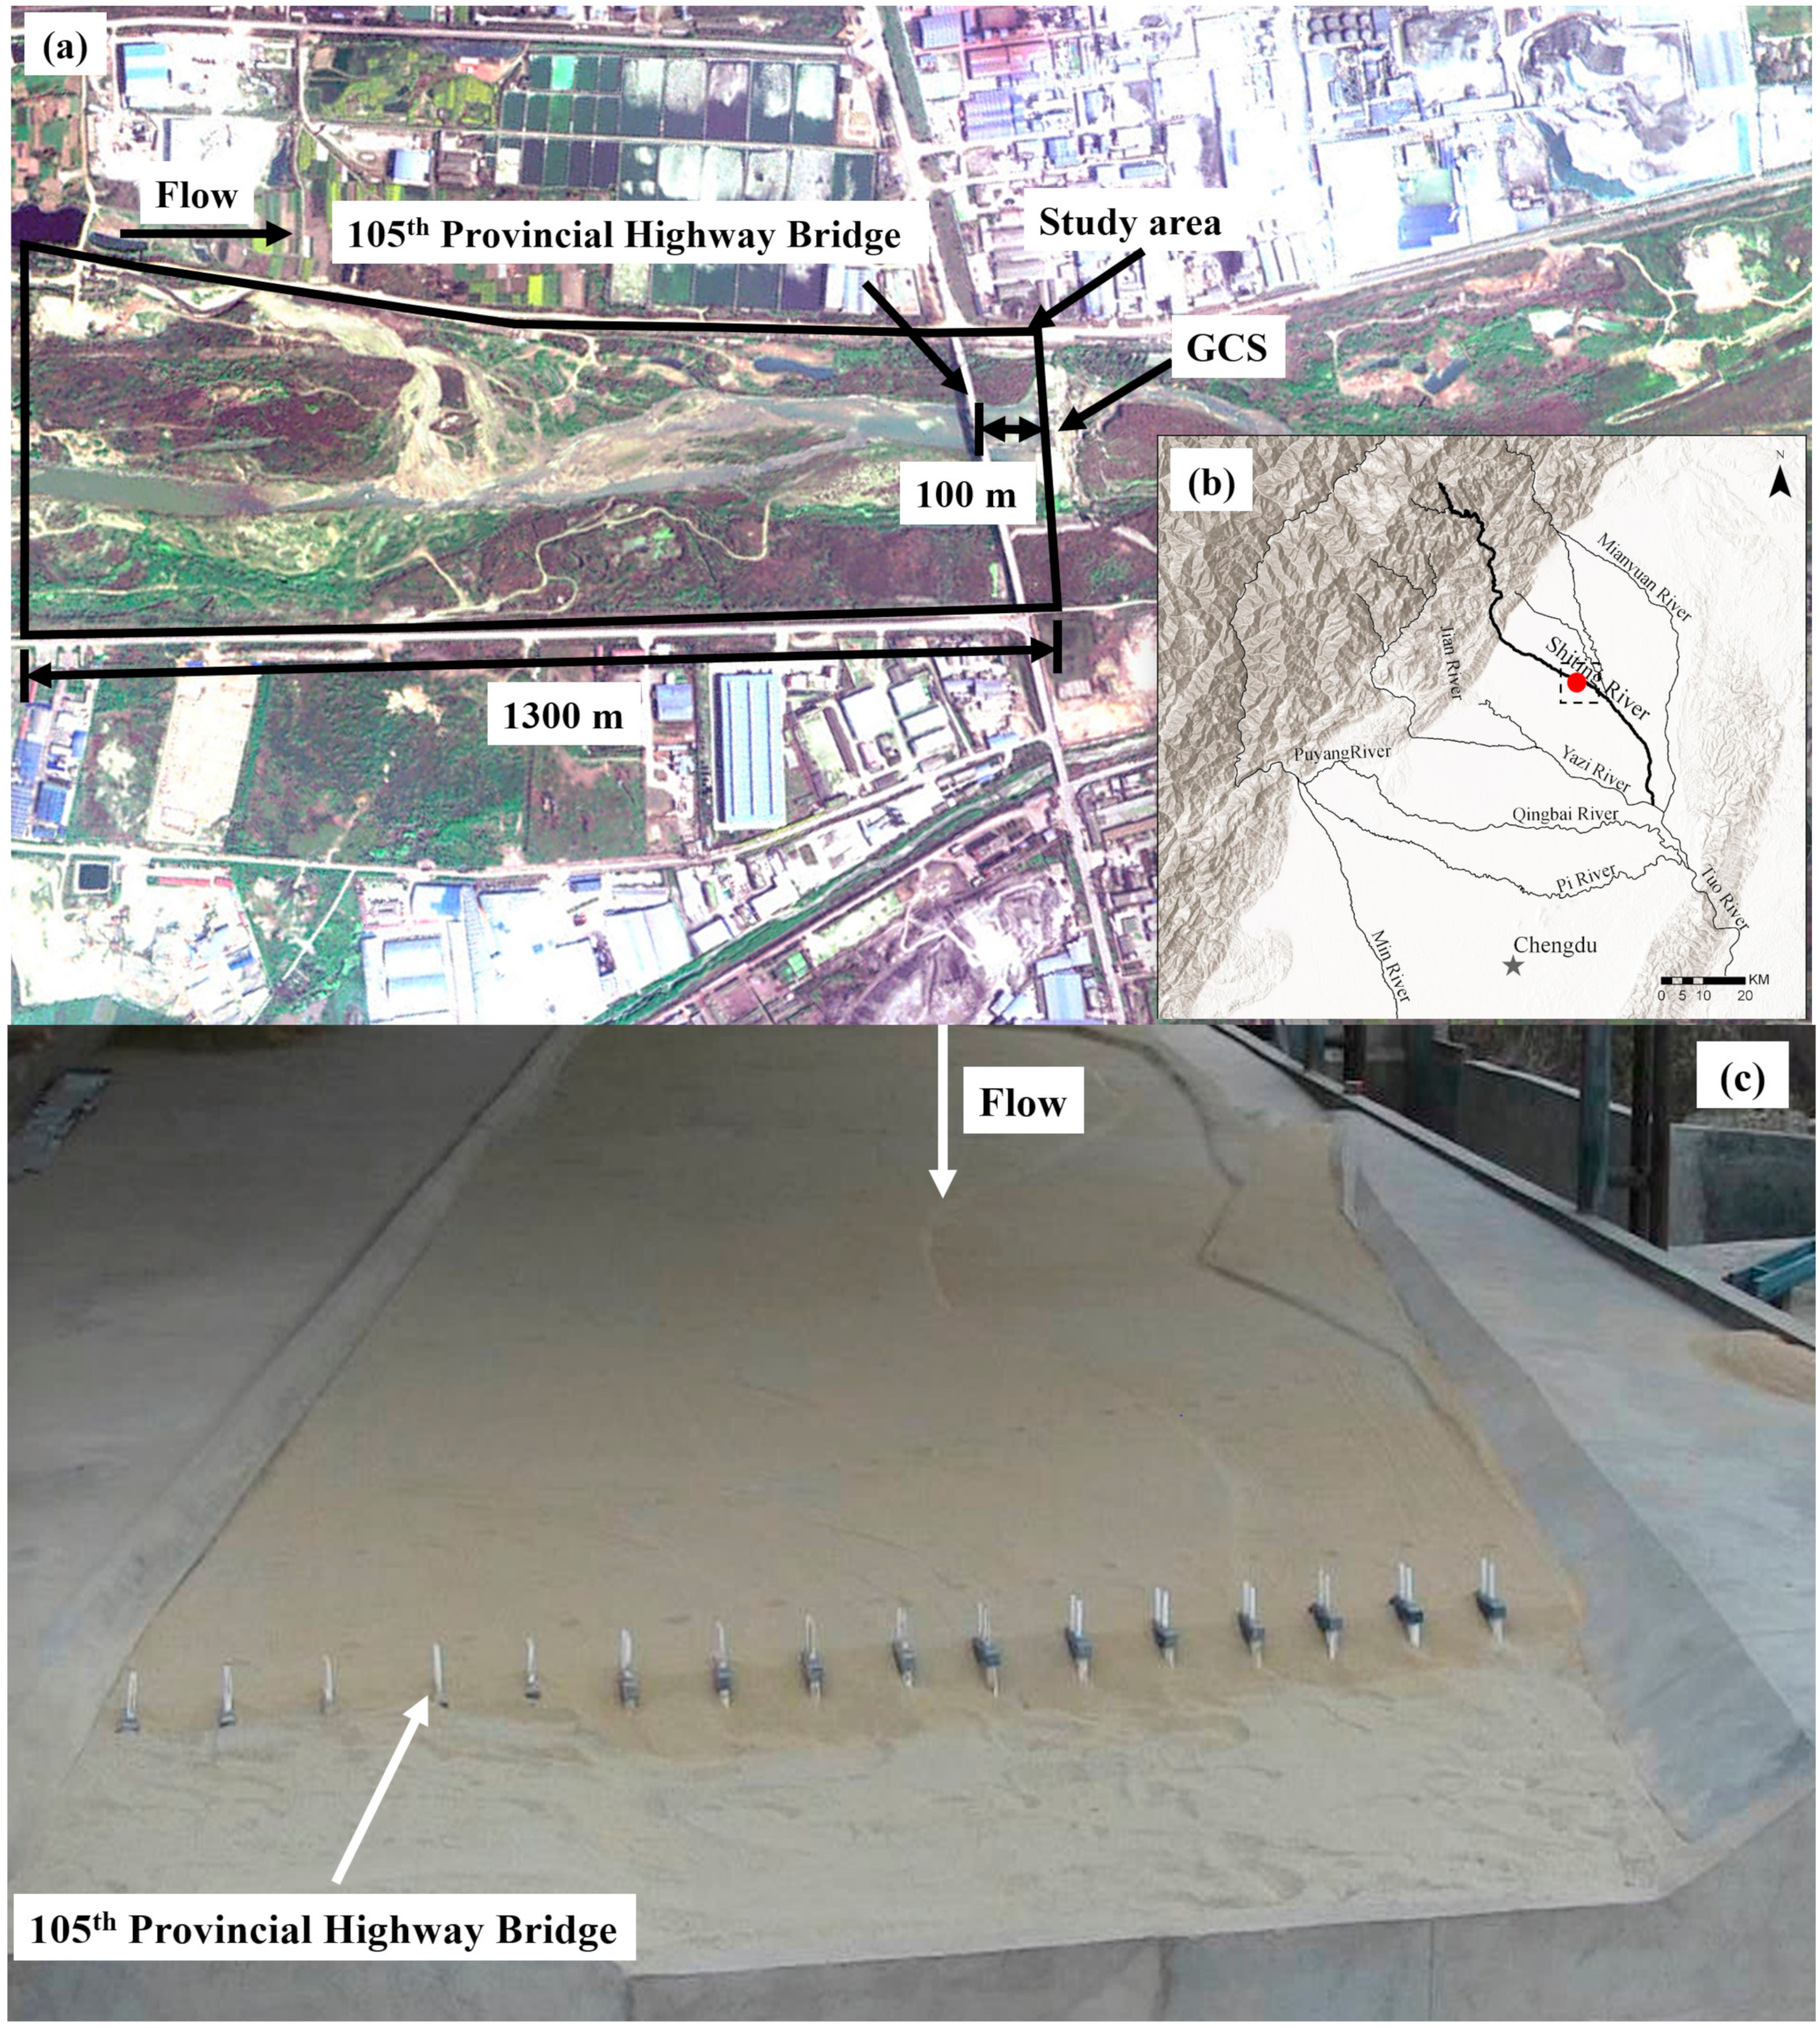
The studied reach is about 13 km downstream of the mountainous area with a gradient of around 4‰, in which the 105th Provincial Highway Bridge is located (
Figure 2). The studied reach is about 1.3 km upstream of the 105th Provincial Highway bridge, and has a channel width between 300–400 m. This reach is a quasi-straight channel and has no instream structures upstream of the 105th Provincial Highway Bridge. Thus, the impacts of stream curve and other instream structures on the bed morphology are negligible. As mentioned previously, significant bed degradation occurred in the piedmont reach of Shiting River after 2008 [
39,
40]. Thus, an 18 m high grade control structure was built upstream of the studied reach (2 km upstream of the 105th Provincial Highway Bridge) for stabilizing the upstream riverbed. The flood events during the period of 2009–2012 degraded the river bed at the 105th provincial Hyghway Bridge to an elevation of 539 m (544 m before the Wenchuan Earthquake). In 2012, for protecting the upstream river reach and the bridge, a grade control structure (GCS) with a downstream stilling basin (for minimizing the downstream local scour) was built downstream of the 105th Provincial Highway Bridge with a crest at
z = 539 m (i.e., grade control datum, GCD). However, as the bed degradation downstream of the GCS continued after the flood event in July 2013 (
Q = 2710 m
3/s), the bed elevation downstream of the GCS became 527 m, exposing the GCS foundation and causing structural failure (
Figure 1). In order to assess the impacts of GCD drop (or GCS failure) on the upstream bed morphology, as well as the general scour depth at the 105th Provincial Highway Bridge, a scaled model test is conducted in this study.
3. Experimental Setup
An undistorted model based on the prototype shown in
Figure 2 was built with a geometry scale
λL = 1:80 in the State Key Laboratory of Hydraulics and Mountain River Engineering, Sichuan University, China. The scaled model was implemented into a water-recirculating system. The bank revetments were built in concrete and had a 0.5 m-deep non-cohesive sediment bed. The flow passed through a triangular weir for flowrate measurement before entering the model, and exited the model through the concrete grade control datum as a free flow which is the same as that of the prototype.
Froude similitude [
41] was adopted for the flow motion. Thus, the velocity scale is
λU =
λL0.5 = 8.94, the discharge scale is
λQ =
λL2.5 = 1:57243 and the time scale is
λt =
λL0.5 = 8.94. In order to achieve the similitude of sediment motion,
U/
Uc in the prototype and model should be the same (
Uc is the critical velocity of the sediment entrainment). The Shamov formula (Equation (1)) is commonly used for calculating
Uc in a scale model test, as it is simple to use and can provide reliable estimations [
42].
where
g is gravity acceleration,
h is approach flow depth,
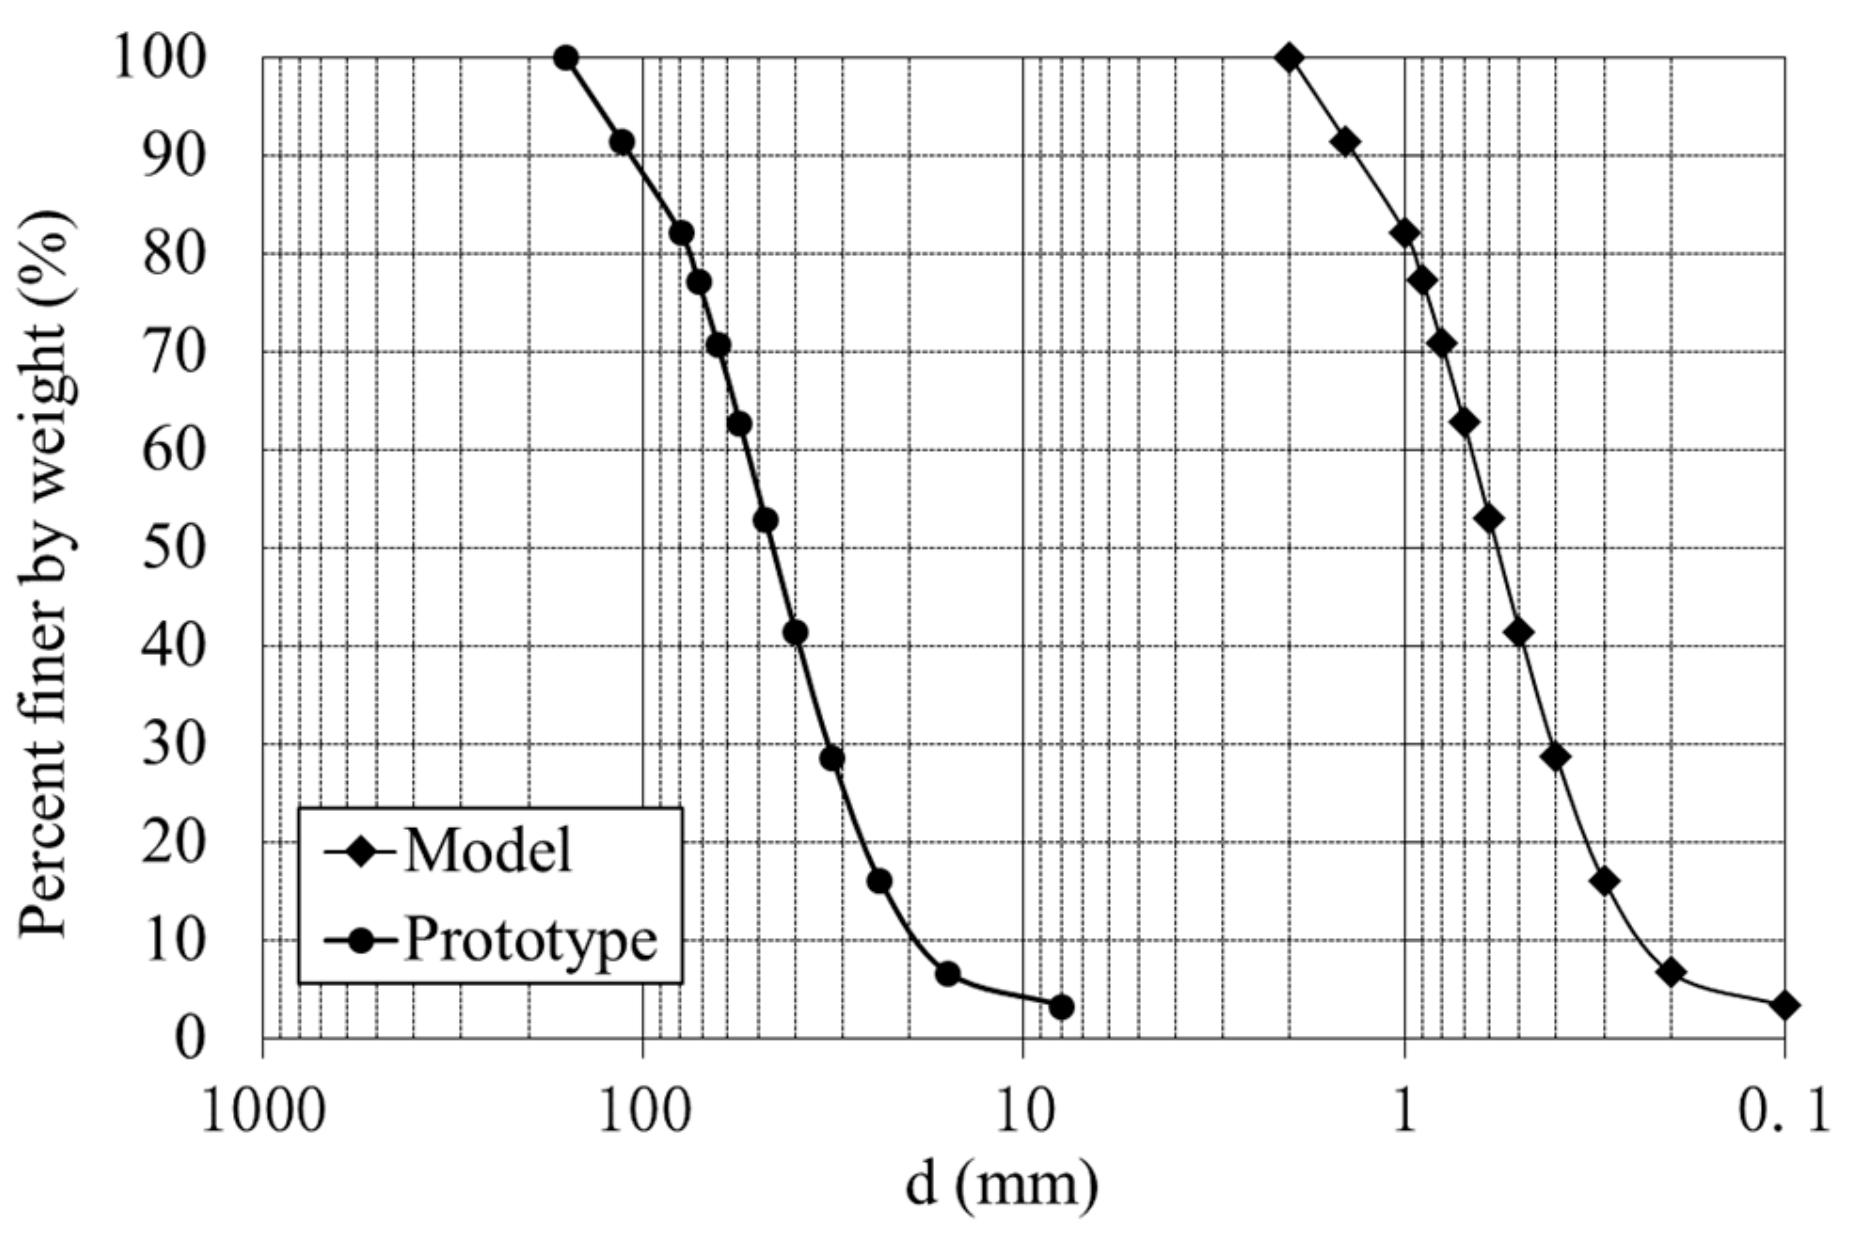
d is sediment size. Based on Equation (1), the sediment size scale is
λd =
λ2Uc =
λ2U = 1:80. The model sediment was scaled down by
λd = 1: 80 from the prototype sediment size distribution based on a field survey in the studied river reach (
Figure 3). As there is an 18 m-high grade control structure with a stilling basin (for minimizing the downstream local scour) located about 2 km upstream of the 105th Provincial Highway Bridge, the upstream sediment is blocked by the grade control structure from entering the studied river reach. Therefore, the upstream sediment replenish rate was considered as zero and no sediment was fed during the test.
Six flood events (discharge Q = 600–4039 m3/s, occurrence probability P = 1%–50%) were tested for three GCDs (z = 527 m, 533 m, 539 m). Among which, z = 539 m is the crest of the current GCS, z = 533 m is the crest elevation of the new GCS design plan, z = 527 m is the bed level downstream of the GCS after the flood event on 9 July 2013.
The tests of each z commenced with an initially flattened sediment bed and the smallest discharge Q. The gradient of the initial flat bed was set at 4‰, which is the average bed gradient of the studied reach after the flood event in July, 2013. The test stopped and the water dried gradually after the scaled flood duration t. Then, the bed profile was measured using a Total Station (Nikon, Japan, DTM-352C). The next test, with a higher discharge, commenced without flattening of the sediment bed.
Before the formal tests, a preliminary test based on the flood event on 9 July 2013 (Q = 2710 m3/s) was conducted for model calibration. As this model test is aimed to assess the impacts of GCD drop on the upstream bed morphology, only the bed profile upstream of the GCS was measured for calibration. Based on a field survey after the flood event on July 9 2013, the average gradient of the studied river reach was 4‰. The measured model talweg profile of the calibration test has an average gradient of 4.3‰ (multiple correlation coefficient R2 = 0.91), which is close to that of the prototype. The discrepancy of bed profile between the model and prototype is within ± 0.8 m (prototype vaule), which is acceptable for the large scale prototype of this study. As the scour design for instream structures normally adds a safe value greater than 1 m to the estimated scour depth, the model data is reliable for engineering use.
4. Results and Discussions
The experimental results and conditions are summarized in
Table 1. In
Table 1,
P is the probability of a flood event;
Q is the prototype flood event discharge;
t is the prototype flood event duration;
z is the prototype grade control datum elevation;
i is the measured average bed slope (model) upstream of the GCS;
dp is the maximum general scour depth at the site of 105th Provincial Highway Bridge in terms of
z = 544 m (i.e., the bed elevation before the Wenchuan Earthquake). In this study, as the detailed hydrograph is not available, the peak flood rate was applied during each flood event. As the flood in this area is caused by intense rain, the flood rising and recession periods are very short and can be neglected. In order to avoid the impacts of local scour and constriction scour on the bed profile, the general scour depth at bridge site was measured upstream of the scour area of the bridge foundation.
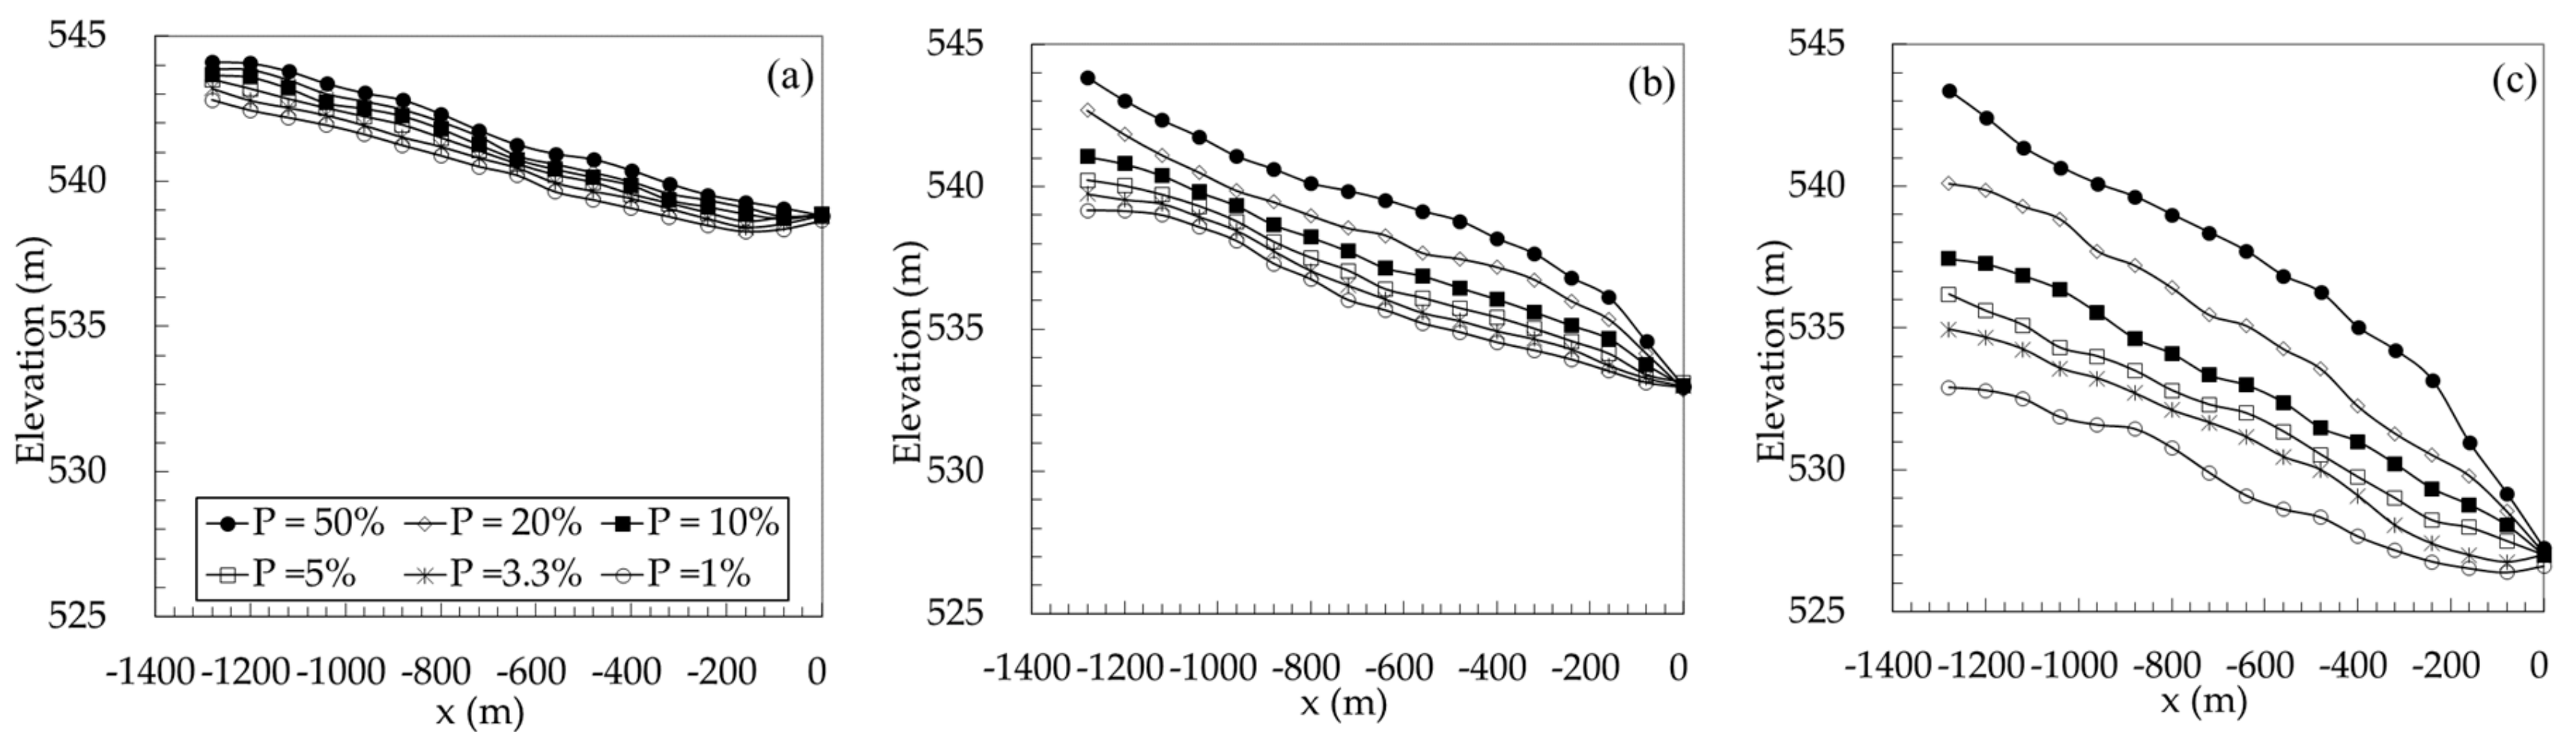
4.1. Talweg Profile Upstream of GCS
Figure 4 shows the talweg profile upstream of the GCS of each GCD
z for different flood events.
Figure 4 indicates that, for each test, the bed elevation immediately upstream of the GCS is approximately equal to the GCS crest (i.e., GCD). For each
z, the upstream talweg elevation is lower with a lower
P (higher discharge,
Q). This is because a higher flowrate has a greater capacity for sediment transport, causing more erosion on the bed. For
z = 539 m, the bed in −150 m <
x <0 is flatter with a higher
Q, as some of the sediment driven by the approach flow is blocked by the GCS, resulting in an aggraded bed near the GCS. For
z = 533 m and
z = 527 m, the aggradation in −150 m <
x < 0 disappears. This is because, for a lower GCD, the sediment above the GCD is flushed downstream over the GCS without any blockage.
Figure 4 also indicates that, for a lower
z, the difference in the talweg profile caused by increasing
Q is larger. The bed incision due to GCD drop can be affected by two factors: (i) the approach flow capacity for sediment transport; (ii) GCS blockage. The bed is stabilized when these two factors reach a balance. As the GCS only blocks the sediment when the GCD is above the bed, for a lower GCD, factors (i) and (ii) reach the balance at a lower bed level.
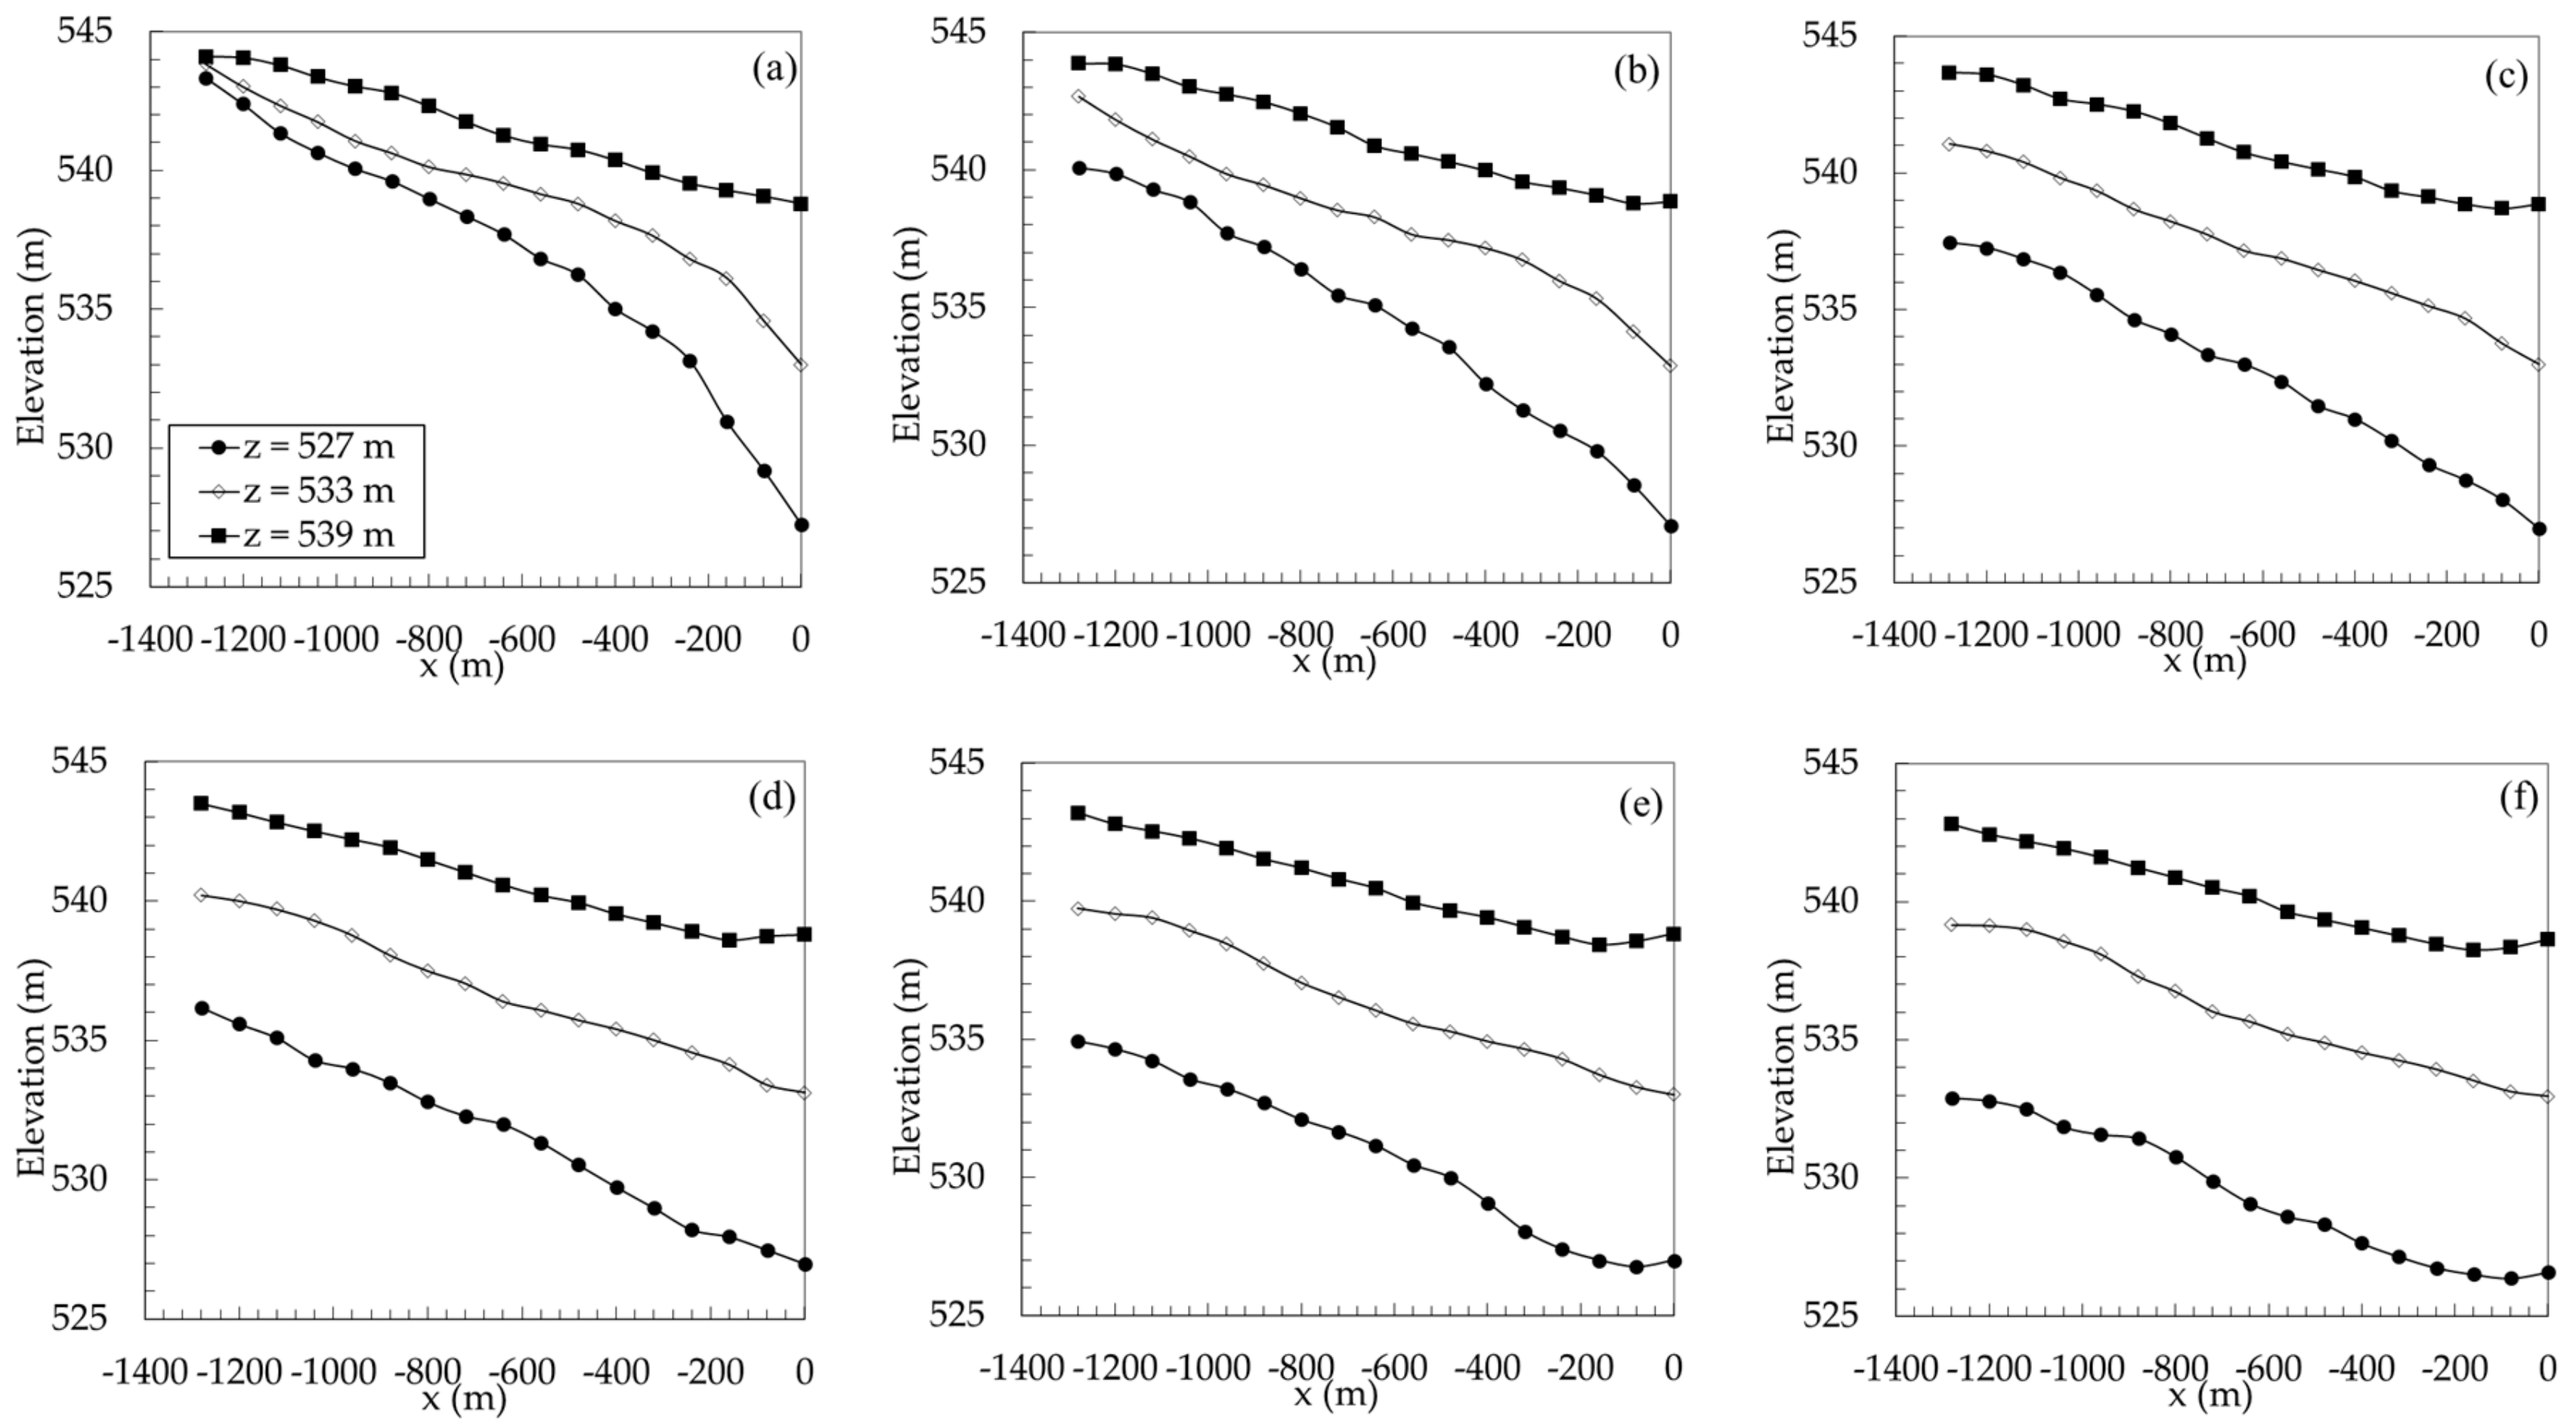
Figure 5 indicates that for each
Q, the upstream talweg elevation decreases with decreasing
z. For
P = 50%, there is an abrupt steepening in the talweg profile for
z = 533 m and 527 m at
x ≈ 200 m and
x ≈ 300 m, respectively. For
P ≤ 10%, the abrupt steepening in the talweg profile for
z = 533 m and 527 m disappears. This is because the bed degradation induced by the drop in GCD begins as a head cut erosion process from
x = 0. For small discharges (
P ≥ 20%), the sediment transport rate is slow and is unable to fill the head cut erosion area during the flood event. For high discharges (
P ≤ 10%), the upstream sediment transport rate is high enough to fill the head cut erosion area within the duration of the flood.
Figure 5 also indicates that for
P ≤ 3.3%, the talweg profile of −200 m <
x <0 is flatter than that of
x < −200 m for
z = 527 m. This is because the grade control datum protrudes high enough above the upstream river bed to block the sediment from the upstream, inducing an aggraded bed near the GCS.
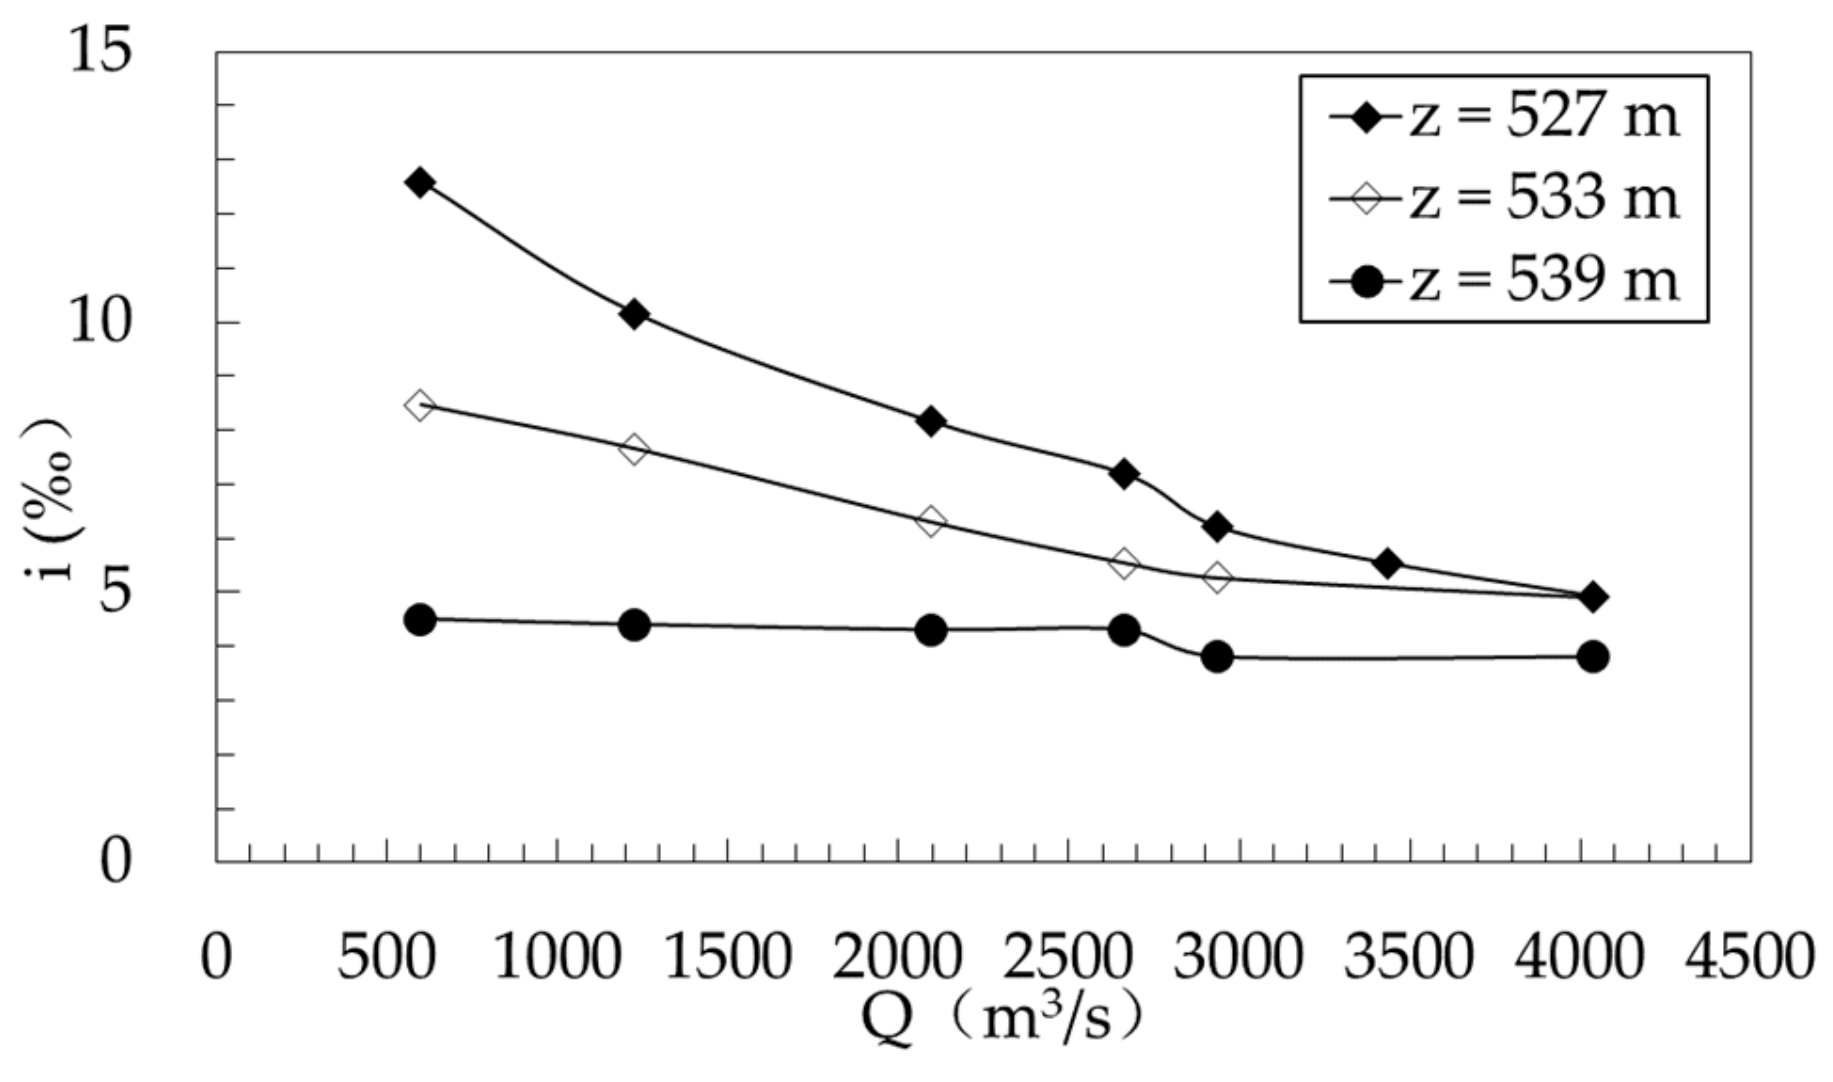
Figure 6 highlights the dependence of the average upstream bed gradient
i on the flood discharge
Q.
Figure 6 shows that
i is greater with a lower
z. As the GCD drop enlarges the elevation difference between
x = 1300 m and
x = 0, the bed tends to develop to be steeper.
Figure 6 also indicates that
i is approximately independent of
Q for
z = 539 m, but decreases with
Q for
z = 533 m and
z = 527 m. As shown in
Figure 4 and
Figure 5, the final bed elevation at
x = 0 is fixed at the GCD. Thus, the increasing
Q erodes more sediment from the upstream bed, resulting in a lower upstream bed level and a smaller average gradient.
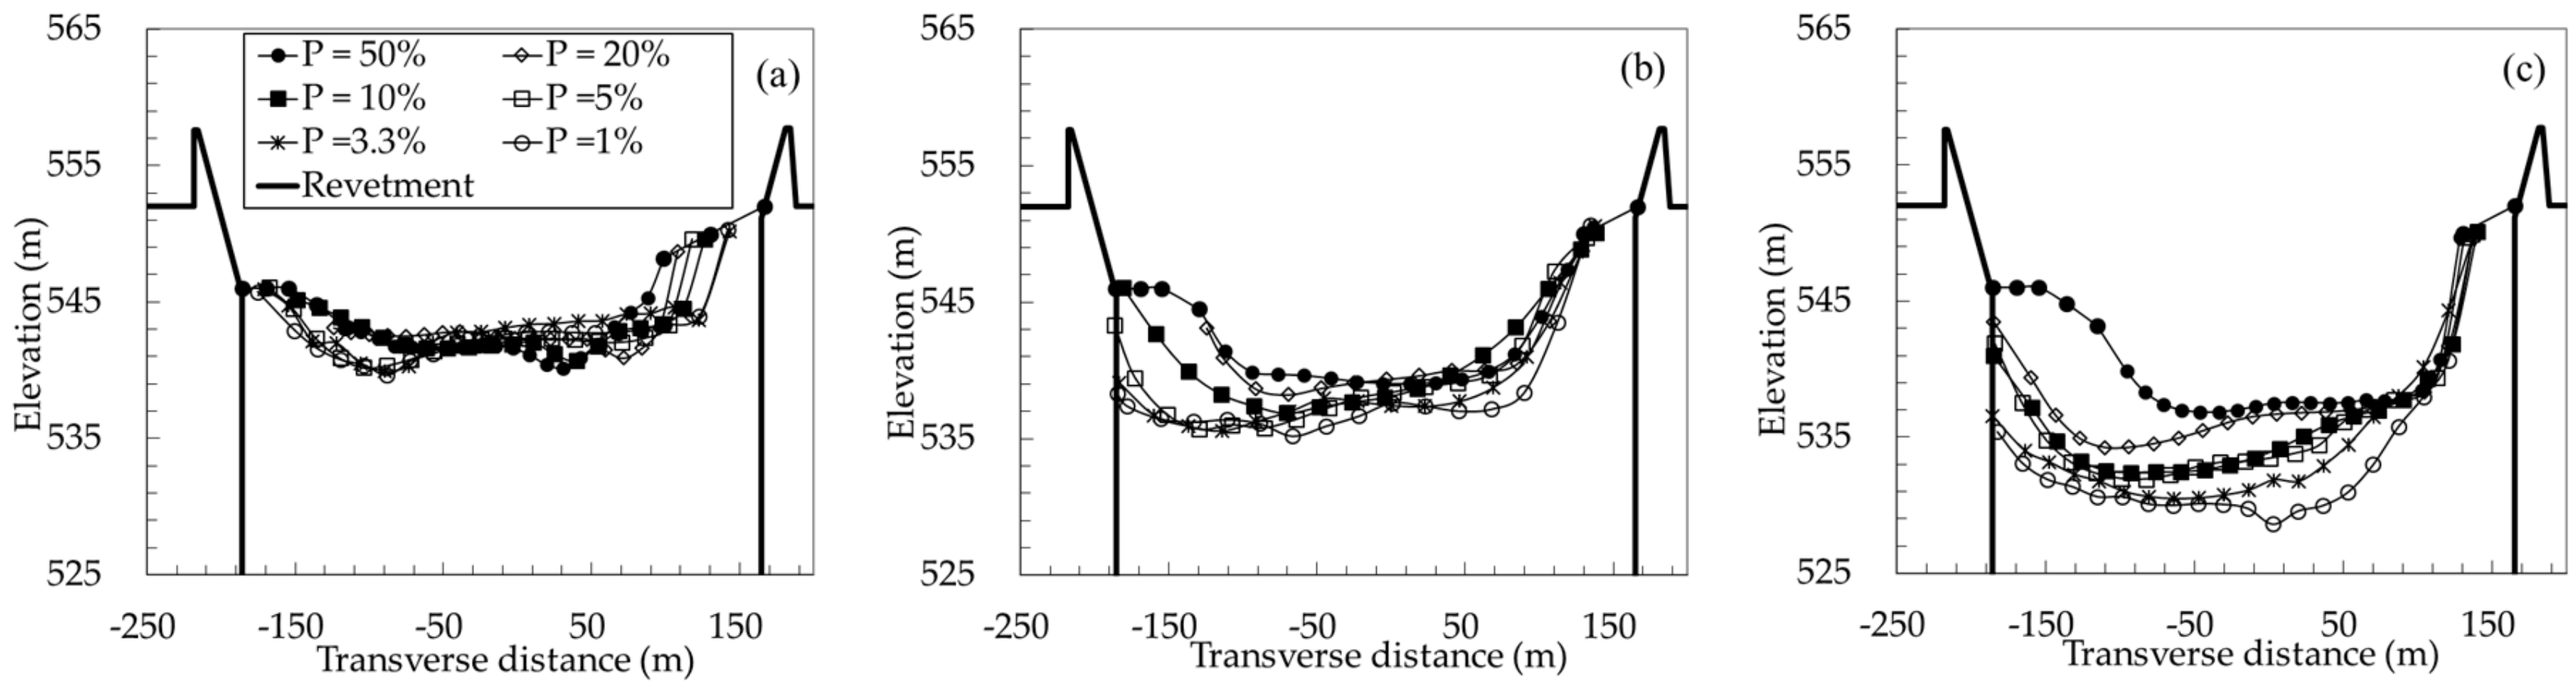
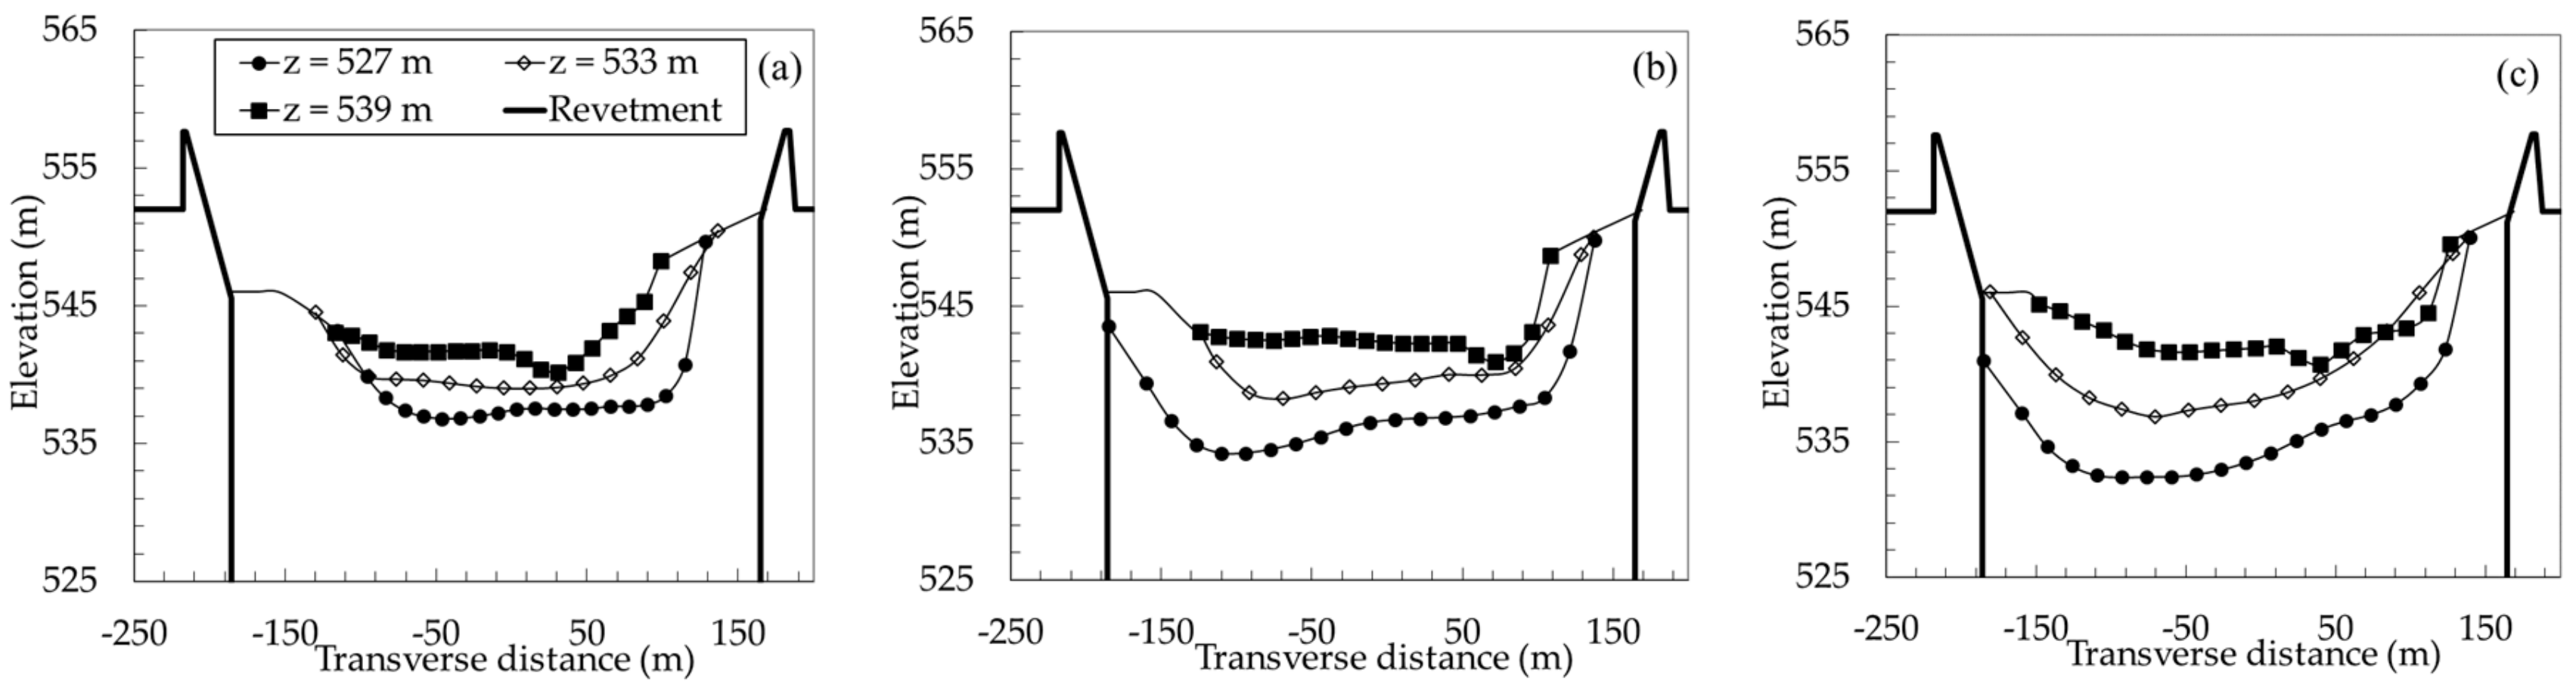
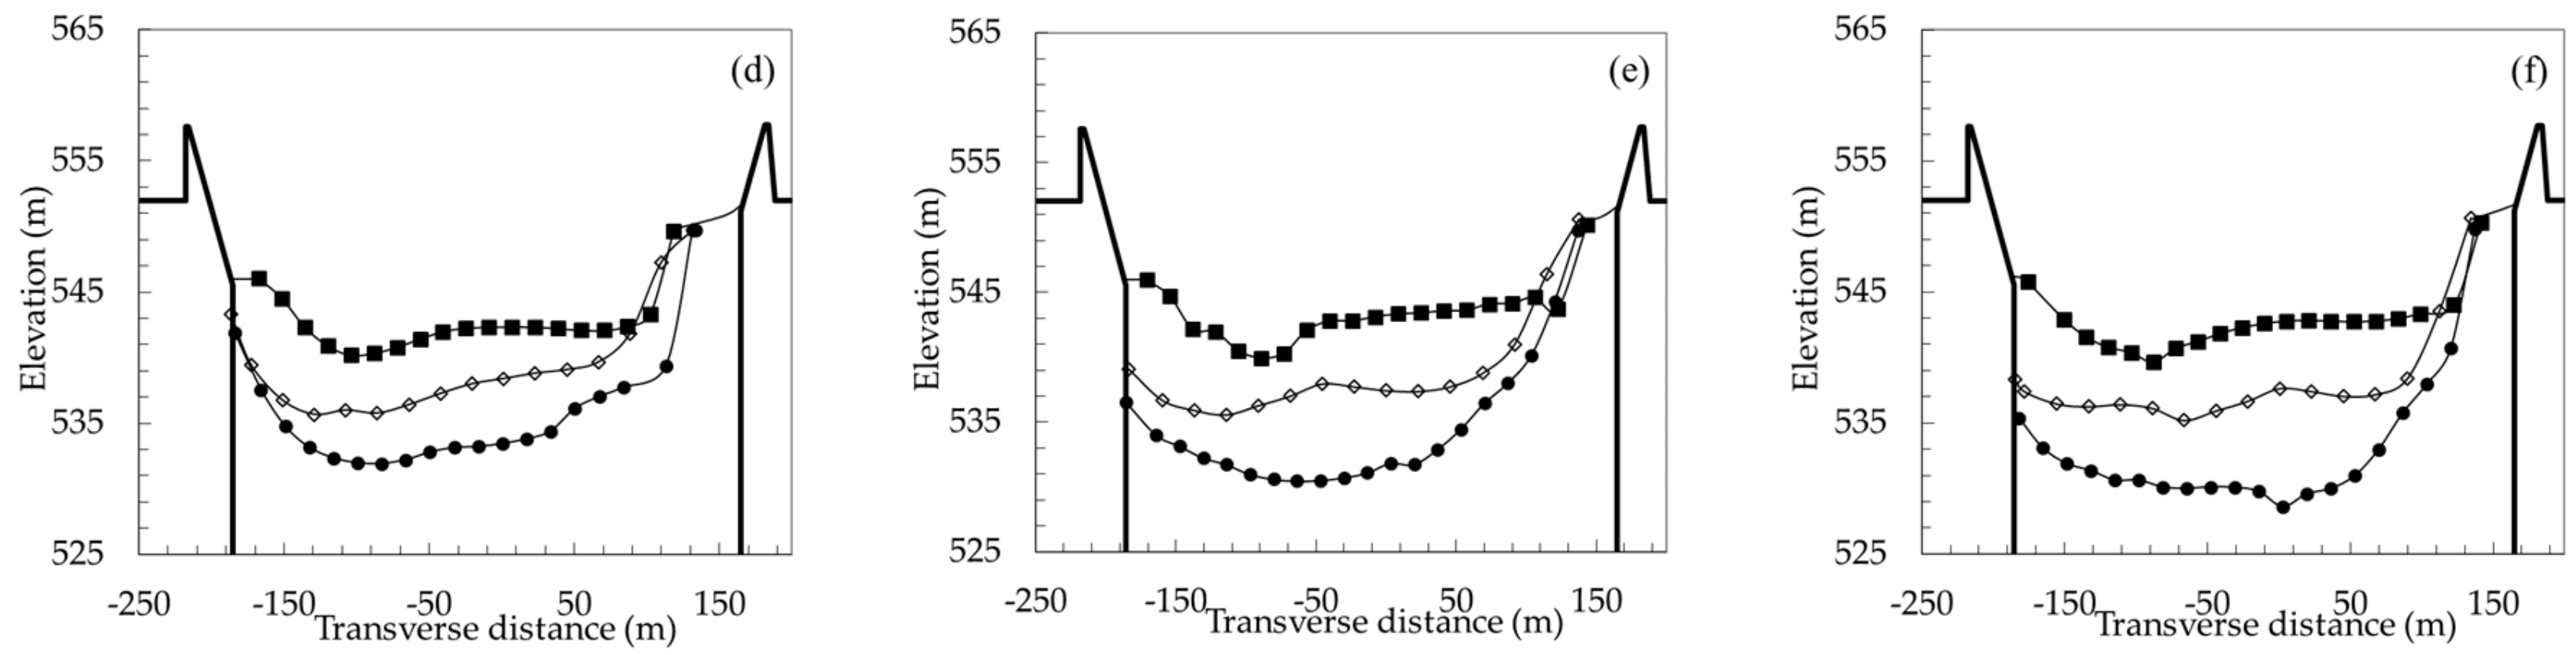
4.2. Transverse Profile Upstream of GCS
Figure 7 indicates that, for each
z, the channel cross-section is deeper and wider with a higher
Q. This is because the increase in
Q increases the sediment transport capacity of the flow, resulting in greater erosion of the riverbed and riverbanks.
Figure 7 also shows that, for a lower
z, the difference in the cross-section depth and width caused by increasing
Q is greater. More specifically, as shown in
Figure 8, the channel cross-section of each discharge is wider and deeper for a lower
z. The GCD drop can cause significant bed incision as shown in
Figure 4 and
Figure 5, inducing mass failures in the riverbank as the incised bed can not support the bank material. Our experimental observations also confirm that, for a lower GCD, more mass failure occurs in the bank.
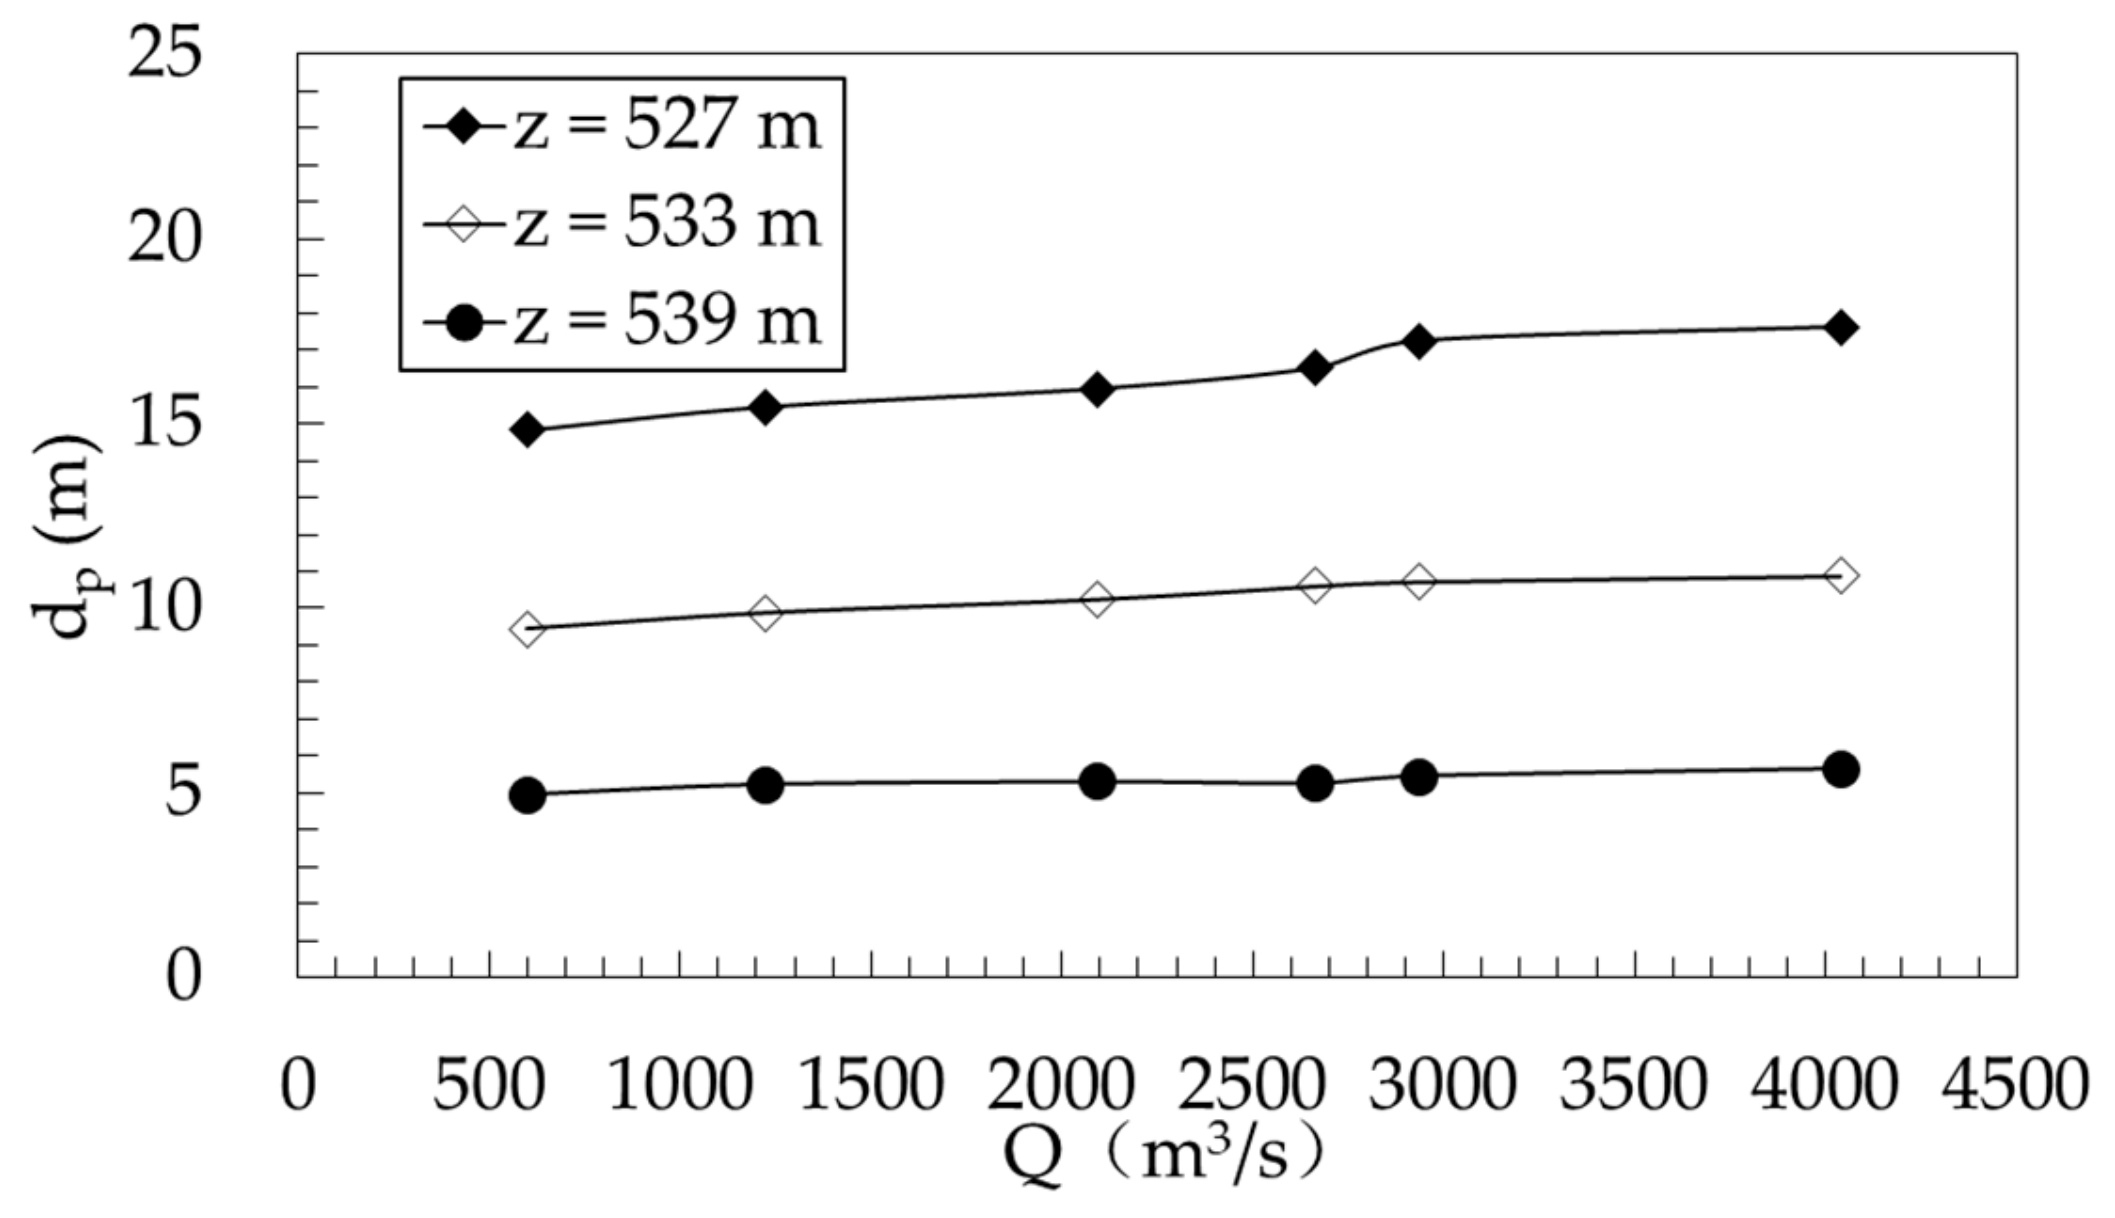
4.3. General Scour Depth at the 105th Provincial Highway Bridge
Figure 9 highlights the dependence of the maximum general scour depth
dp at the 105th Provincial Highway Bridge on the discharge
Q for different GCDs. In
Figure 9, for
z = 539 m, with the help of the GCS,
dp is approximately independent of
Q. For a lower
z, even very small
Q (
P = 50%) can cause serious general scour at the bridge site (
dp ≈ 9.4 m and 14.8 m). For
z = 527 m, i.e., the GCS is completely removed, the
dp can reach up to 17.6 m. For the new GCS design plan
z = 533 m, the minimum
dp is 9.4 m. Thus, this study suggests building a new GCS with
z ≥ 539 m or a new bridge with much deeper foundations.
5. Conclusions
Bed degradation is a common river process and can cause general scour depth at instream infrastructures, leading to structural damages or failures. Grade control structures (GCSs) are conventional countermeasures for the general scour at instream structures. However, improper scour design for the GCS can destabilize both the GCS and the upstream river reach. This study conducts a 1:80 scaled model test based on a 1.3 km-long reach of Shiting River, China, investigating the effects of GCS failure (drop in GCD) on the upstream river bed morphology.
The experimental results indicate that, for each GCD z, the upstream river bed elevation decreases with increasing discharge Q. For a lower z, the difference caused by increasing Q is greater. For z = 533 m and z = 527 m, a head cut erosion area exists upstream of the GCS for P ≥ 20%. For P ≤ 10%, the head cut erosion area of z = 533 m and z = 527 m vanishes. The average upstream bed gradient i is approximately independent of Q for z = 539 m; i decreases with increasing Q for z = 533 m and z = 527 m. The experimental results also indicate that, for each z, the increase in Q can widen and deepen the channel. The difference in the channel width and depth caused by increasing Q is greater for a lower z. For each Q, the decrease in z induces a wider and deeper channel.
The maximum general scour depths dp at the 105th Provincial Highway Bridge are analyzed. For z = 539 m, dp is approximately independent of Q. For a lower z, dp increases slightly with increasing Q. For the new GCS design plan (z = 533 m), the general scour depth at the bridge site is still significant (dp = 9.4–10.9 m). Thus, this study suggests building a GCS with z ≥ 539 m or a new bridge with much deeper foundations.
Author Contributions
X.M. did all the experiments, data process and part of result analysis. L.W. wrote the paper and did most of the results analysis. R.N., K.Y., X.L. proofread the paper, and provided a lot of valuable advice on experimental operation, result presentation and writing.
Funding
This research is supported by the National Key Research and Development Program of China (2016YFC0402302), the National Natural Scientific Foundation of China (51809187) and the Fundamental Research Funds for the Central Universities (YJ201935).
Acknowledgments
The authors would like to thank the editors of the Special Issue of “Experimental, Numerical and Field Approaches to Scour Research” for their invitations.
Conflicts of Interest
The authors declare no conflict of interest.
References
- Yang, Y.; Melville, B.W.; Sheppard, D.M.; Shamseldin, A.Y. Live-Bed Scour at Wide and Long-Skewed Bridge Piers in Comparatively Shallow Water. J. Hydraul. Eng. 2019, 145, 06019005. [Google Scholar] [CrossRef]
- Yang, Y.; Melville, B.W.; Sheppard, D.M.; Shamseldin, A.Y. Clear-Water Local Scour at Skewed Complex Bridge Piers. J. Hydraul. Eng. 2018, 144, 04018019. [Google Scholar] [CrossRef]
- Guan, D.; Chiew, Y.-M.; Melville, B.W.; Zheng, J. Current-induced scour at monopile foundations subjected to lateral vibrations. Coast. Eng. 2019, 144, 15–21. [Google Scholar] [CrossRef]
- Guan, D.; Chiew, Y.-M.; Wei, M.; Hsieh, S.-C. Characterization of horseshoe vortex in a developing scour hole at a cylindrical bridge pier. Int. J. Sediment Res. 2019, 34, 118–124. [Google Scholar] [CrossRef]
- Guan, D.; Hsieh, S.-C.; Chiew, Y.-M.; Low, Y.M. Experimental study of scour around a forced vibrating pipeline in quiescent water. Coast. Eng. 2019, 143, 1–11. [Google Scholar] [CrossRef]
- Chiew, Y.M. Mechanics of Local Scour Around Submarine Pipelines. J. Hydraul. Eng. 1990, 116, 515–529. [Google Scholar] [CrossRef]
- Wu, Y.; Chiew, Y.-M. Mechanics of Pipeline Scour Propagation in the Spanwise Direction. J. Waterw. Port Coast. Ocean Eng. 2015, 141, 04014045. [Google Scholar] [CrossRef]
- Guan, D.; Melville, B.W.; Friedrich, H. Local scour at submerged weirs in sand-bed channels. J. Hydraul. Res. 2016, 54, 172–184. [Google Scholar] [CrossRef]
- Wang, L.; Melville, B.W.; Whittaker, C.N.; Guan, D. Scour estimation downstream of submerged weirs. J. Hydraul. Eng. 2019. [Google Scholar] [CrossRef]
- Wang, L.; Melville, B.W.; Guan, D. Effects of Upstream Weir Slope on Local Scour at Submerged Weirs. J. Hydraul. Eng. 2018, 144, 04018002. [Google Scholar] [CrossRef]
- Wang, L.; Melville, B.W.; Guan, D.; Whittaker, C.N. Local Scour at Downstream Sloped Submerged Weirs. J. Hydraul. Eng. 2018, 144, 04018044. [Google Scholar] [CrossRef]
- Guan, D.; Melville, B.W.; Friedrich, H. Live-Bed Scour at Submerged Weirs. J. Hydraul. Eng. 2015, 141, 04014071. [Google Scholar] [CrossRef]
- Breusers, H.; Raudkivi, A.J. Scouring; A.A. Balkema: Rotterdam, The Netherlands, 1991. [Google Scholar]
- Hoffmans, G.J.; Verheij, H.J. Scour Manual; CRC Press: Boca Raton, FL, USA, 1997; Volume 96. [Google Scholar]
- Melville, B.W.; Coleman, S.E. Bridge Scour; Water Resources Publication: Highlands Ranch, CO, USA, 2000. [Google Scholar]
- Radspinner, R.; Diplas, P.; Lightbody, A.; Sotiropoulos, F. River Training and Ecological Enhancement Potential Using In-Stream Structures. J. Hydraul. Eng. 2010, 136, 967–980. [Google Scholar] [CrossRef]
- Martín-Vide, J.P.; Andreatta, A. Disturbance Caused by Bed Sills on the Slopes of Steep Streams. J. Hydraul. Eng. 2006, 132, 1186–1194. [Google Scholar] [CrossRef]
- Martín-Vide, J.P.; Andreatta, A. Channel degradation and slope adjustment in steep streams controlled through bed sills. Earth Surf. Process. Landf. 2009, 34, 38–47. [Google Scholar] [CrossRef]
- Wang, L.; Melville, B.W.; Whittaker, C.N.; Guan, D. Effects of a downstream submerged weir on local scour at bridge piers. J. Hydro Environ. Res. 2018, 20, 101–109. [Google Scholar] [CrossRef]
- Jeon, J.; Lee, J.Y.; Kang, S. Experimental Investigation of Three-Dimensional Flow Structure and Turbulent Flow Mechanisms Around a Nonsubmerged Spur Dike with a Low Length-to-Depth Ratio. Water Resour. Res. 2018, 54, 3530–3556. [Google Scholar] [CrossRef]
- Ben Meftah, M.; Mossa, M. Scour holes downstream of bed sills in low-gradient channels. J. Hydraul. Res. 2006, 44, 497–509. [Google Scholar] [CrossRef]
- Pagliara, S.; Kurdistani, S.M. Scour downstream of cross-vane structures. J. Hydro Environ. Res. 2013, 7, 236–242. [Google Scholar] [CrossRef]
- Pagliara, S.; Mahmoudi Kurdistani, S. Clear water scour at J-Hook Vanes in channel bends for stream restorations. Ecol. Eng. 2015, 83, 386–393. [Google Scholar] [CrossRef]
- Tregnaghi, M.; Marion, A.; Bottacin-Busolin, A.; Tait, S.J. Modelling time varying scouring at bed sills. Earth Surf. Process. Landf. 2011, 36, 1761–1769. [Google Scholar] [CrossRef]
- Tregnaghi, M.; Marion, A.; Coleman, S. Scouring at Bed Sills as a Response to Flash Floods. J. Hydraul. Eng. 2009, 135, 466–475. [Google Scholar] [CrossRef]
- Tregnaghi, M.; Marion, A.; Coleman, S.; Tait, S. Effect of Flood Recession on Scouring at Bed Sills. J. Hydraul. Eng. 2010, 136, 204–213. [Google Scholar] [CrossRef]
- Tregnaghi, M.; Marion, A.; Gaudio, R. Affinity and similarity of local scour holes at bed sills. Water Resour. Res. 2007, 43. [Google Scholar] [CrossRef]
- Bormann, N.E.; Julien, P.Y. Scour Downstream of Grade-Control Structures. J. Hydraul. Eng. 1991, 117, 579–594. [Google Scholar] [CrossRef]
- D’Agostino, V.; Ferro, V. Scour on Alluvial Bed Downstream of Grade-Control Structures. J. Hydraul. Eng. 2004, 130, 24–37. [Google Scholar] [CrossRef]
- Lenzi, M.A.; Marion, A.; Comiti, F. Local scouring at grade-control structures in alluvial mountain rivers. Water Resour. Res. 2003, 39, 1176. [Google Scholar] [CrossRef]
- Scurlock, S.M.; Thornton, C.I.; Abt, S.R. Equilibrium Scour Downstream of Three-Dimensional Grade-Control Structures. J. Hydraul. Eng. 2011, 138, 167–176. [Google Scholar] [CrossRef]
- Lenzi, M.A.; Marion, A.; Comiti, F.; Gaudio, R. Local scouring in low and high gradient streams at bed sills. J. Hydraul. Res. 2002, 40, 731–739. [Google Scholar] [CrossRef]
- Gaudio, R.; Marion, A.; Bovolin, V. Morphological effects of bed sills in degrading rivers. J. Hydraul. Res. 2000, 38, 89–96. [Google Scholar] [CrossRef]
- Marion, A.; Tregnaghi, M.; Tait, S. Sediment supply and local scouring at bed sills in high-gradient streams. Water Resour. Res. 2006, 42, W06416. [Google Scholar] [CrossRef]
- Marion, A.; Lenzi, M.A.; Comiti, F. Effect of sill spacing and sediment size grading on scouring at grade-control structures. Earth Surf. Process. Landf. 2004, 29, 983–993. [Google Scholar] [CrossRef]
- Lenzi, M.A.; Marion, A.; Comiti, F. Interference processes on scouring at bed sills. Earth Surf. Process. Landf. 2003, 28, 99–110. [Google Scholar] [CrossRef]
- Lu, J.-Y.; Hong, J.-H.; Chang, K.-P.; Lu, T.-F. Evolution of scouring process downstream of grade-control structures under steady and unsteady flows. Hydrol. Process. 2012, 27, 2699–2709. [Google Scholar] [CrossRef]
- Guan, D.; Melville, B.W.; Friedrich, H. Flow Patterns and Turbulence Structures in a Scour Hole Downstream of a Submerged Weir. J. Hydraul. Eng. 2014, 140, 68–76. [Google Scholar] [CrossRef]
- Fan, N.; Nie, R.; Wang, Q.; Liu, X. Dramatic undercutting of piedmont rivers after the 2008 Wenchuan Ms 8.0 Earthquake. Sci. Rep. 2016, 6, 37108. [Google Scholar] [CrossRef] [Green Version]
- Nie, R.; Wang, X.; Liu, F.; Wang, Q.; Fan, N.; Liu, X. Study on Fluvial Processes of Piedmont Rivers Damaged by Strong Earthquakes. Adv. Eng. Sci. 2018, 50, 105–111. [Google Scholar] [CrossRef]
- ASCE. Hydraulic Modeling: Concepts and Practices; ASCE: Reston, VA, USA, 2000. [Google Scholar] [CrossRef]
- Chien, N.; Wan, Z. Mechanics of Sediment Transport; ASCE Press: Reston, VA, USA, 1999. [Google Scholar] [CrossRef]
© 2019 by the authors. Licensee MDPI, Basel, Switzerland. This article is an open access article distributed under the terms and conditions of the Creative Commons Attribution (CC BY) license (http://creativecommons.org/licenses/by/4.0/).


