Spatiotemporal Water Quality Variations in Smaller Water Supply Systems: Using Modified CCME WQI from Groundwater Source to Distribution Networks

 ,
, 
 , ,
, , 
Abstract
1. Introduction
2. Materials and Methods
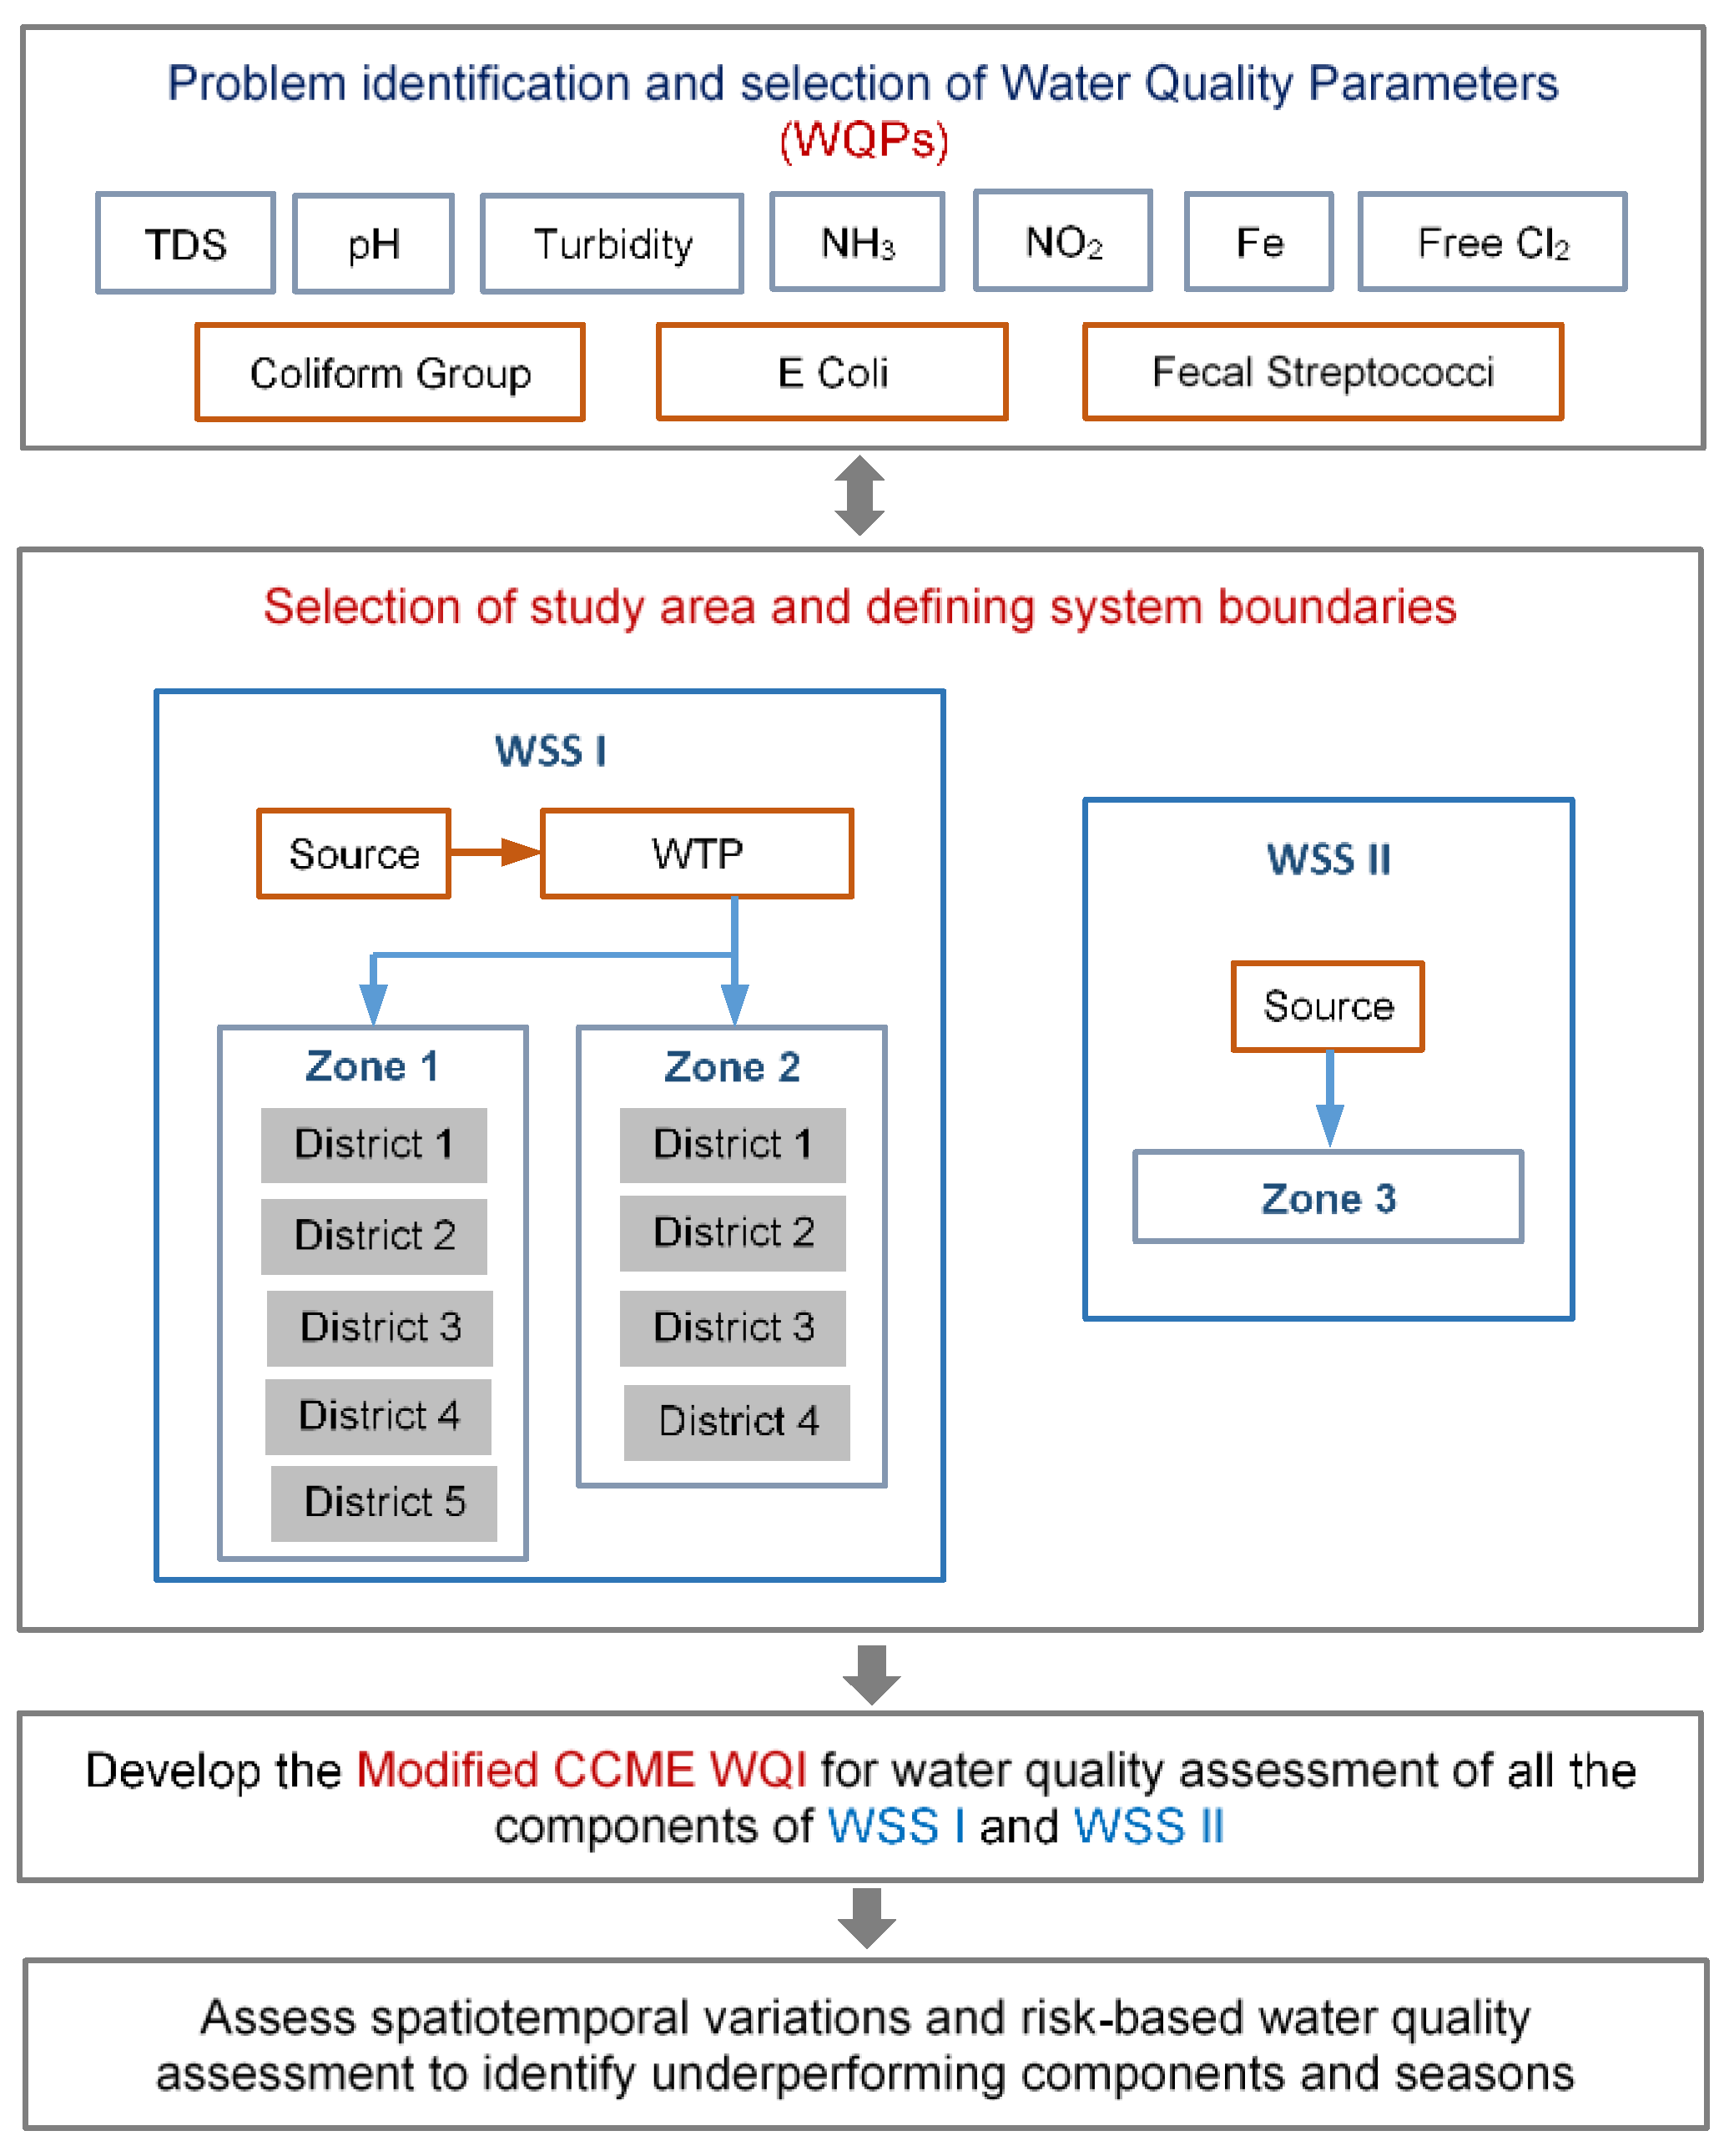
2.1. Water Quality Assessment Framework
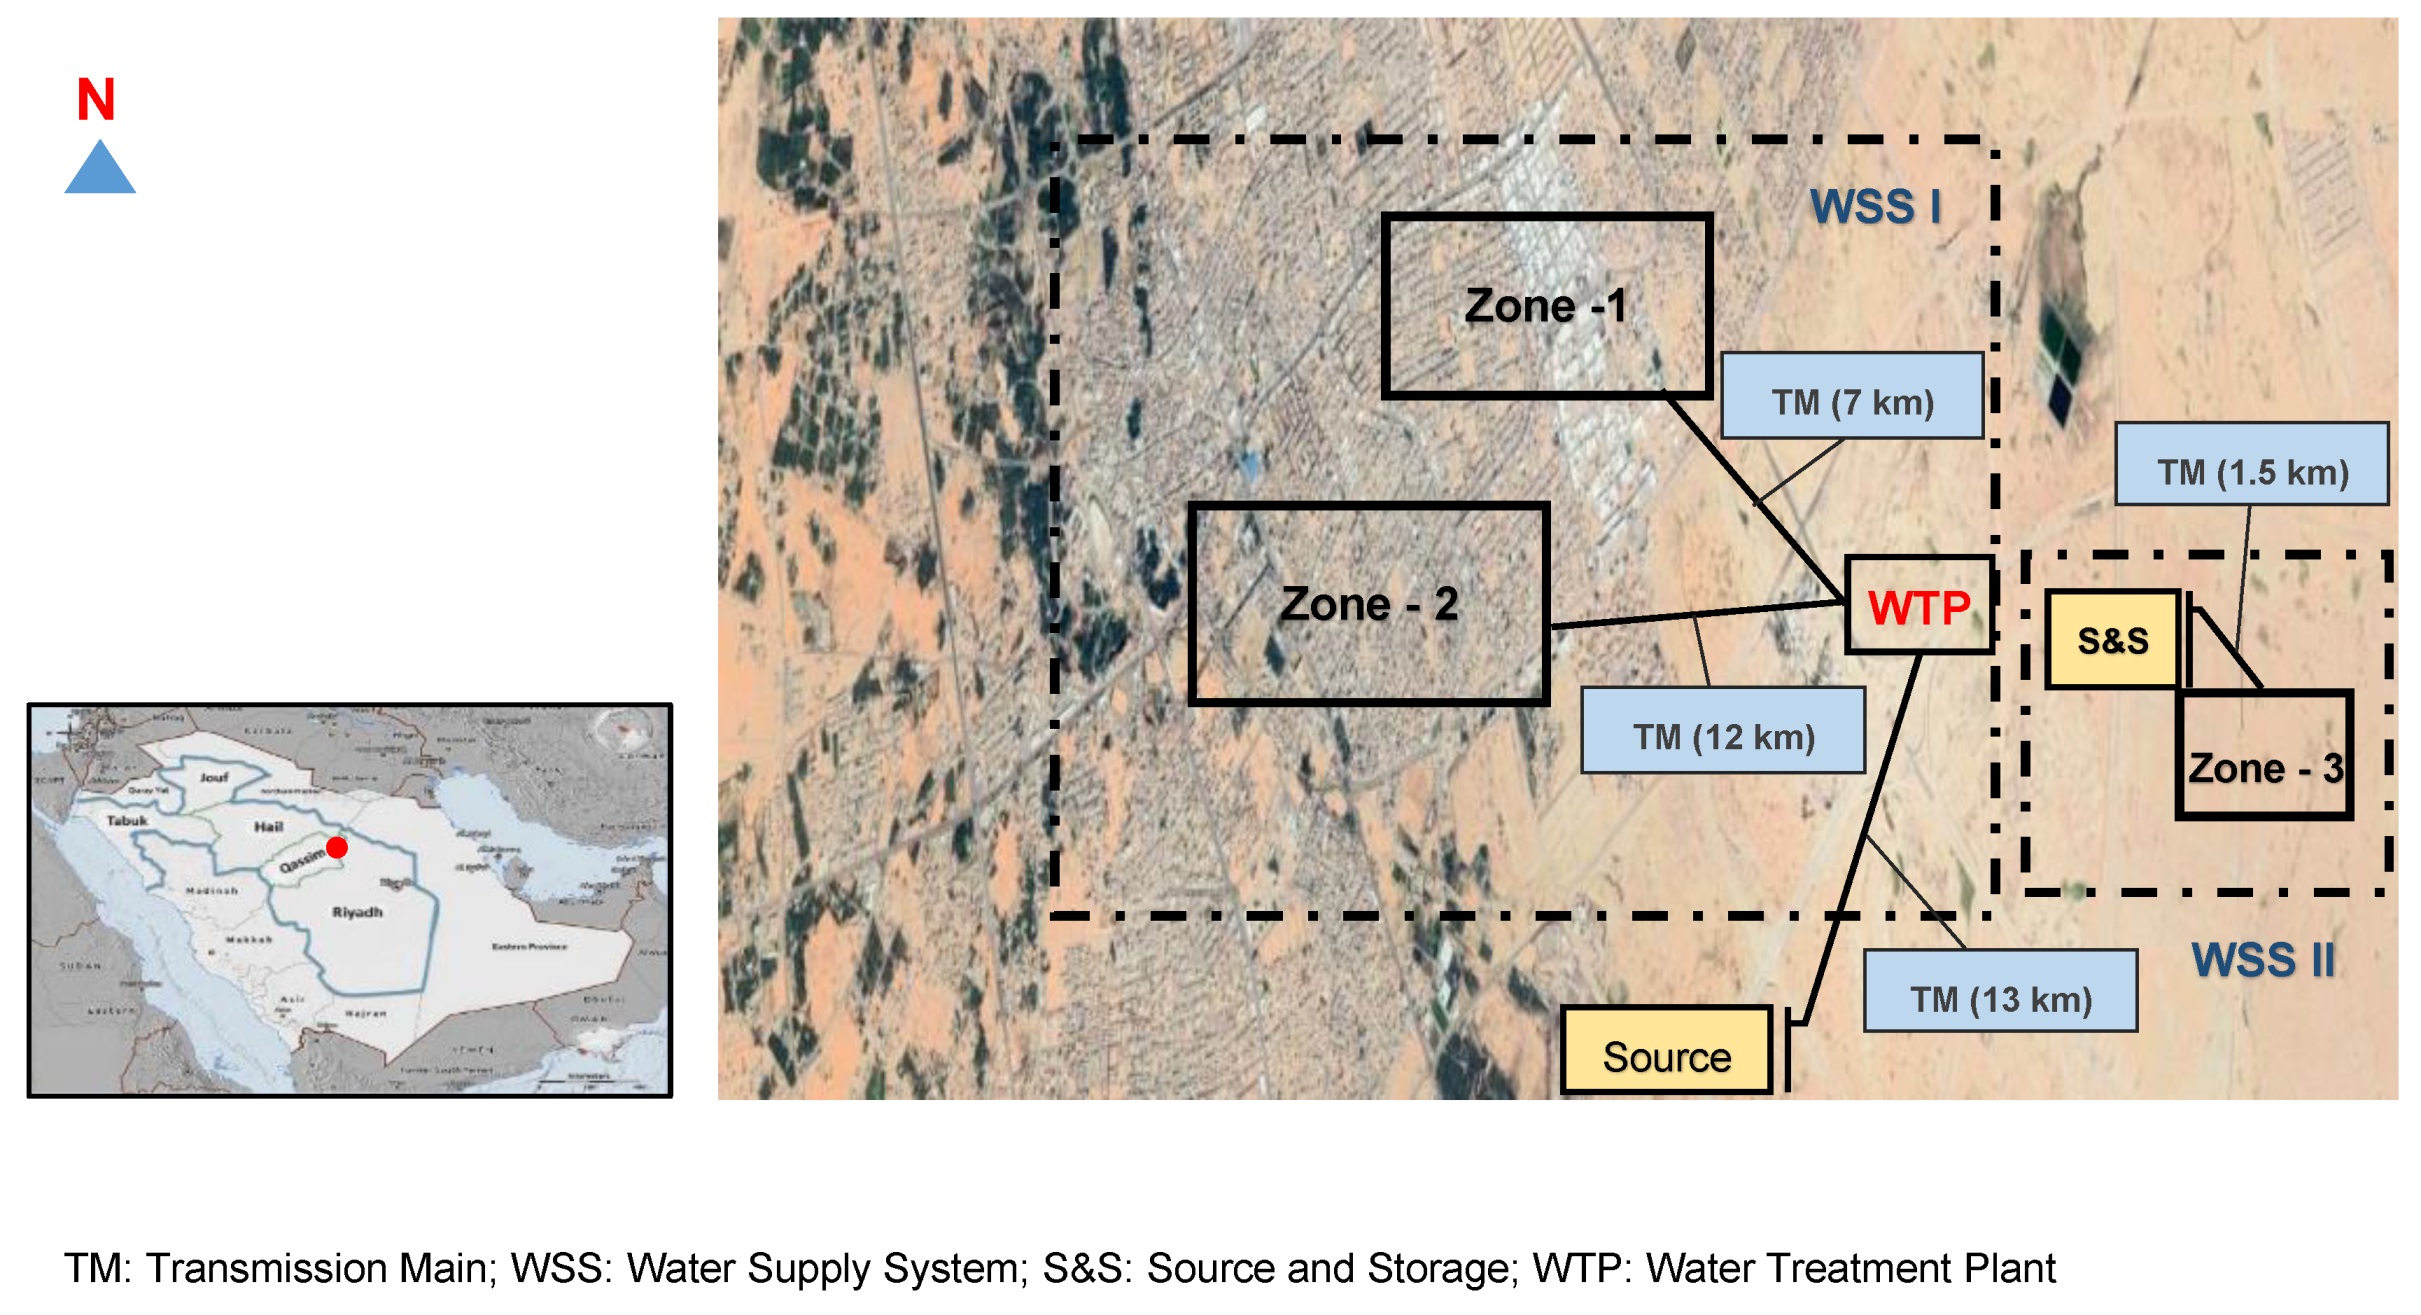
2.2. Study Area
2.3. Water Quality Parameters Selection and Target Values
2.4. Modified CCME WQI
- Step 1:
- Calculate excursion which represents the number of times an individual WQP was found greater than (or less than) the objective. In present research all the WQPs are desired to be less than the objective, so excursion is estimated as:In case of WQPs which are desired to be higher than the objective, e.g., residual chlorine, numerator and denominator in Equation (5) will be reversed as:
- Step 2:
- Calculate normalized sum of excursion (nse) using the following equation:
- Step 3:
- Finally calculate F3 using the following equation:Equation (7) is an asymptotic function that scales the nse between 0 and 100, so that F3 can be analogous to F1 and F2.Subsequently, (CCME WQI)PC can be calculated using Equation (2).
- Step 4:
- To include the impact of microbiological WQPs, the following index is proposed:where (WQI)MB is the microbiological water quality index.
- Step 5:
- Finally, the modified CCME WQI can be calculated as:where W1 and W2 are the relative importance weights for (CCME WQI)PC and (WQI)MB. As the importance of these indices varies for different components of a water supply system, a unique weighting scheme (based on expert opinion) is proposed in Table 1.
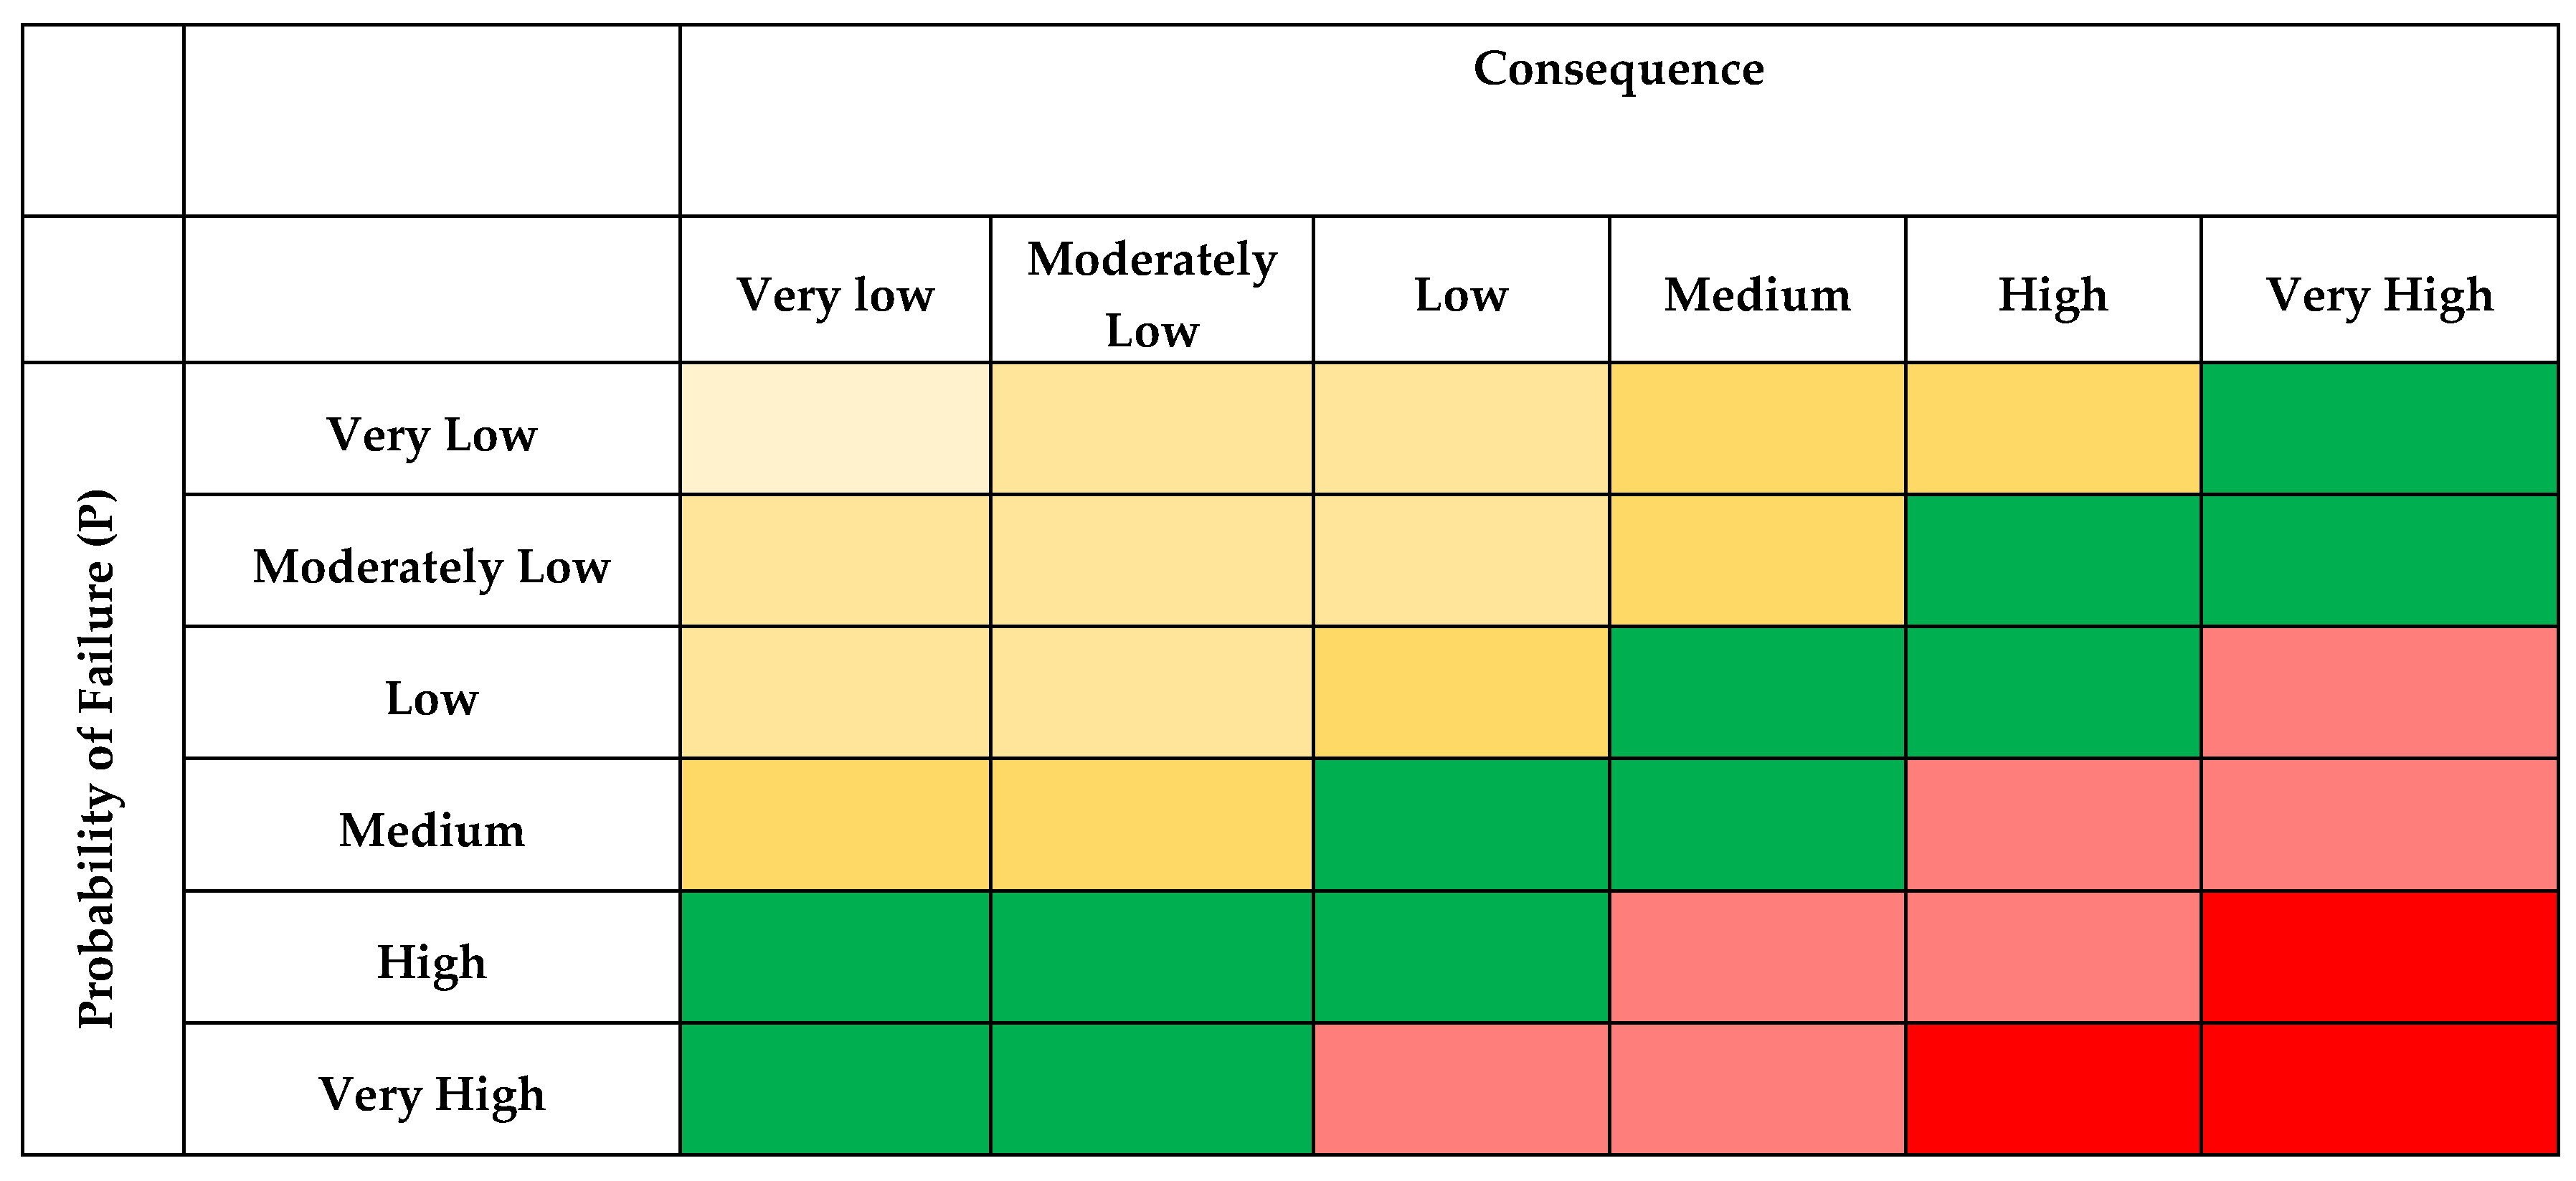
2.5. Risk-based Water Quality Assessment
3. Results and Discussion
3.1. Water Quality Monitoring
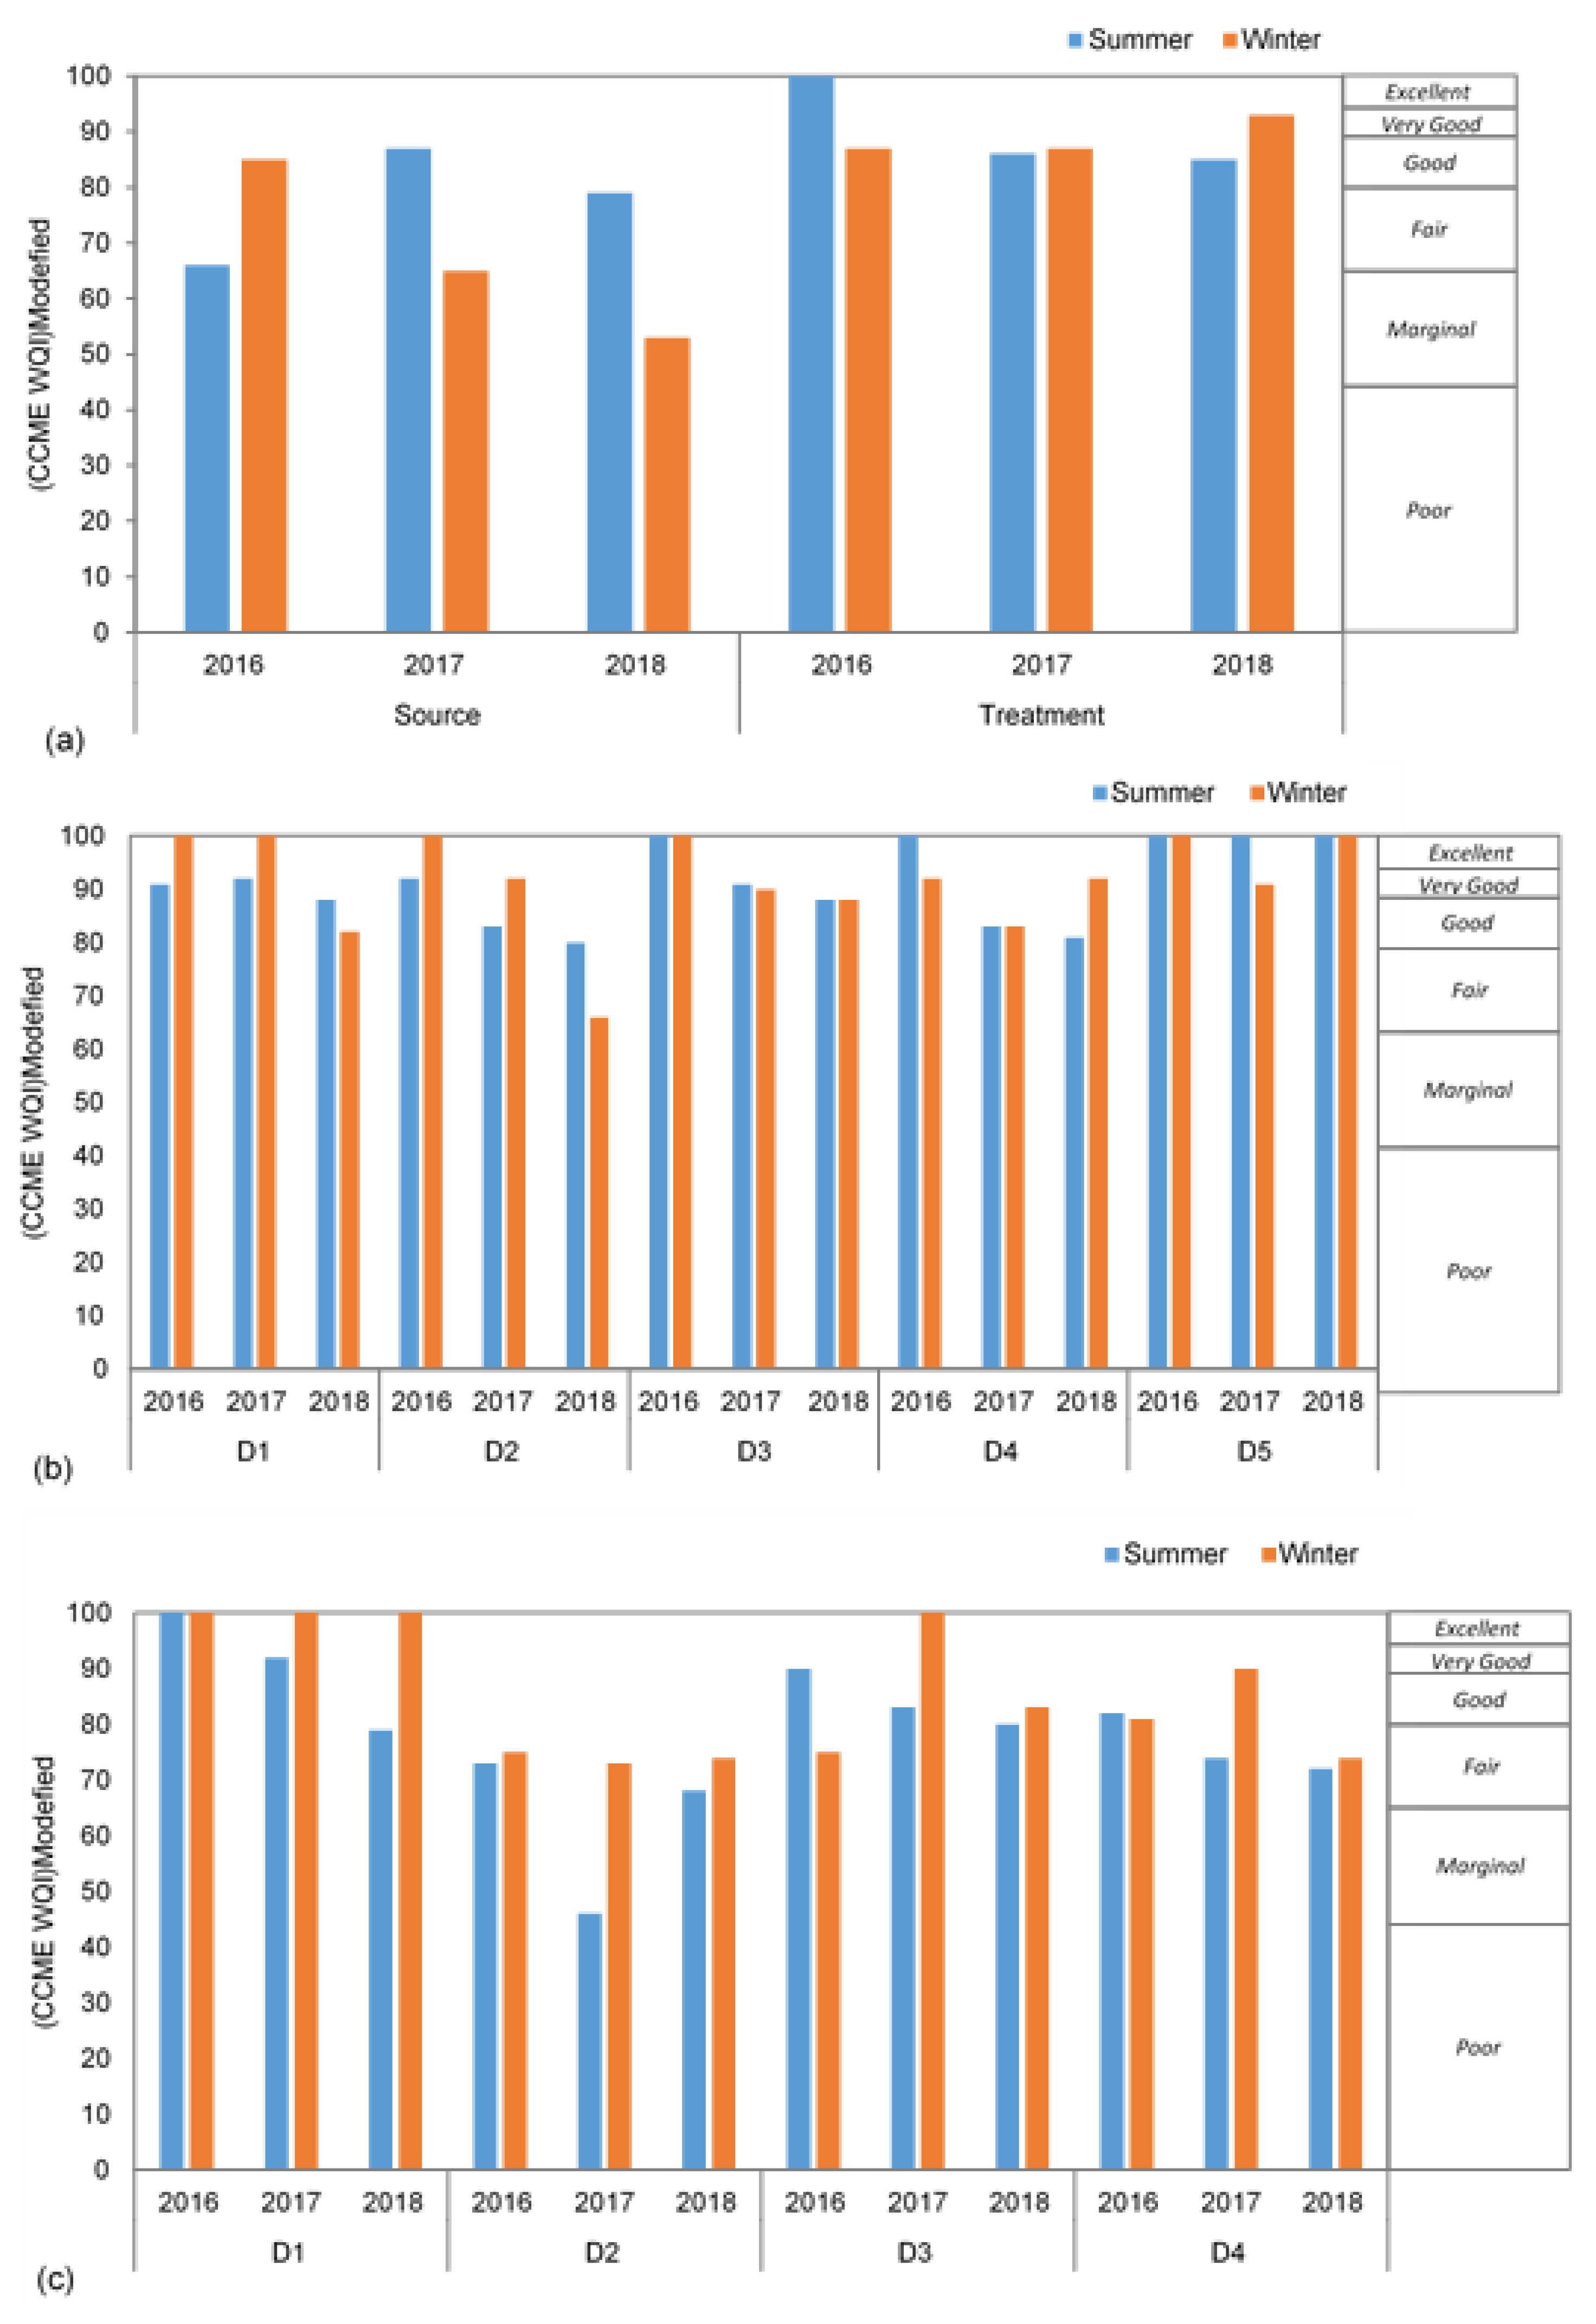
3.2. Temporal Water Quality Variations
3.3. Spatial Water Quality Variations
3.4. Risk-Based Water Quality Assessment
4. Conclusions and Recommendations
Author Contributions
Funding
Acknowledgments
Conflicts of Interest
References
- Haider, H.; Al-Salamah, I.S.; Ghumman, A.R. Development of Groundwater Quality Index using Fuzzy-based Multicriteria Analysis for Buraydah, Qassim, Saudi Arabia. Arab. J. Sci. Eng. 2017, 42, 4033–4051. [Google Scholar] [CrossRef] [Scilit]
- CCME. Canadian Water Quality Guidelines for the Protection of Aquatic Life, CCME Water Quality Index 1.0; Technical Report Canadian Environmental Quality Guidelines; Excerpt from Publication No. 1299; Canadian Council of Ministers of the Environment (CCME): Winnipeg, MB, Canada, 2001; ISBN 1-896997-34-1.
- Mahagamage, M.; Chinthaka, S.; Manage, P. Assessment of Water Quality Index for Groundwater in The Kelani River Basin, Sri Lanka. Int. J. Agric. Environ. Res. 2016, 2, 1158–1171. [Google Scholar]
- Magesh, N.S.; Chandrasekar, N.; Elango, L. Trace element concentrations in the groundwater of the Tamiraparani river basin, South India: Insights from human health risk and multivariate statistical techniques. Chemosphere 2017, 1, 468–479. [Google Scholar] [CrossRef] [Scilit] [PubMed]
- Nazeer, S.; Hashmi, M.Z.; Malik, R. Heavy metals distribution, risk assessment and water quality characterization by water quality index of the River Soan, Pakistan. Ecol. Indic. 2014, 1, 262–270. [Google Scholar] [CrossRef] [Scilit]
- Duan, M.; Du, X.; Peng, W.; Zhang, S.; Yan, L. A Revised Method of Surface Water Quality Evaluation Based on Background Values and Its Application to Samples Collected in Heilongjiang Province, China. Water 2019, 11, 1057. [Google Scholar] [CrossRef] [Scilit]
- Sidoruk, M.; Cymes, I. Effect of water management technology used in trout culture on water quality in fish ponds. Water 2018, 10, 1264. [Google Scholar] [CrossRef] [Scilit]
- Islam, N.; Sadiq, R.; Rodriguez, M.J.; Legay, C. Assessment of water quality in distribution networks through the lens of disinfection by-product rules. Water SA 2016, 42, 337–349. [Google Scholar] [CrossRef] [Scilit]
- Farzadkia, M.; Djahed, B.; Shahsavani, E.; Poureshg, Y. Spatio-temporal evaluation of Yamchi Dam basin water quality using Canadian water quality index. Environ. Monit. Assess. 2015, 187, 168. [Google Scholar] [CrossRef] [Scilit] [PubMed]
- Hurley, T.; Sadiq, R.; Mazumder, A. Adaptation and evaluation of the Canadian Council of Ministers of the Environment Water Quality Index (CCME WQI) for use as an effective tool to characterize drinking source water quality. Water Res. 2015, 46, 3544–3552. [Google Scholar] [CrossRef] [Scilit] [PubMed]
- Haider, H.; Sadiq, R.; Tesfamariam, S. Risk-Based Framework for Improving Customer Satisfaction through System Reliability in Small-Sized to Medium-Sized Water Utilities. J. Manag. Eng. 2016, 32, 04016008. [Google Scholar] [CrossRef] [Scilit]
- Haider, H. Performance Assessment Framework for Groundwater Treatment Plants in Arid Environments: A Case of Buraydah, Saudi Arabia. Environ. Monit. Assess. 2017, 189, 544. [Google Scholar] [CrossRef] [Scilit]
- Haider, H.; Haydar, S.; Sajid, M.; Tesfamariam, S.; Sadiq, R. Framework for optimizing chlorine dose in small-to medium-sized water distribution systems: A case of a residential neighbourhood in Lahore, Pakistan. Water SA 2015, 41, 614–623. [Google Scholar] [CrossRef] [Scilit]
- Khan, A.A.; Paterson, R.; Khan, H. Modification and application of the Canadian Council of Ministers of the Environment Water Quality Index (CCME WQI) for the communication of drinking water quality data in Newfoundland and Labrador. Water Qual. Res. J. 2004, 39, 285–293. [Google Scholar] [CrossRef] [Scilit]
- Haider, H.; Sadiq, R.; Tesfamariam, S. Performance indicators for small-and medium-sized water supply systems: A review. Environ. Rev. 2013, 22, 1–40. [Google Scholar] [CrossRef] [Scilit]
- Population. City. Available online: http://population.city/saudi-arabia/unayzah/ (accessed on 9 May 2019).
- Haider, H.; Al-Salamah, I.S.; Ghazaw, Y.M.; Abdel-Maguid, R.H.; Shafiquzzaman, M.; Ghumman, A.R. Framework to Establish Economic Level of Leakage for Intermittent Water Supplies in Arid Environments. J. Water Resour. Plan. Manag. 2019, 145, 05018018. [Google Scholar] [CrossRef] [Scilit]
- WHO. Guidelines for Drinking Water Quality, 4th ed.; World Health Organization (WHO) Press: Geneva, Switzerland, 2011; p. 228. [Google Scholar]
- Ginige, M.P.; Wylie, J.; Plumb, J. Influence of biofilms on iron and manganese deposition in drinking water distribution systems. Biofouling 2011, 27, 151–163. [Google Scholar] [CrossRef] [Scilit] [PubMed]
- Schullehner, J.; Stayner, L.; Hansen, B. Nitrate, nitrite, and ammonium variability in drinking water distribution systems. Int. J. Environ. Res. Public Health 2017, 14, 276. [Google Scholar] [CrossRef] [Scilit] [PubMed]
- UN HABITAT. Buraydah City Review Report; Ministry of Municipal and Rural Affairs: Riyadh, Saudi Arabia, 2015.
- Ministry of Health. Progress on the Action Plan for Safe Drinking Water in British Columbia; The Office of the Provincial Health Officer, Ministry of Health: Victoria, BC, USA, 2007.


| Component of Water Supply System (WSS) | Relative Weighs | Remarks/Rationale | |
|---|---|---|---|
| (CCME WQI)PC (W1) | (WQI)MB (W2) | ||
| Source Water | 0.7 | 0.3 | Due to the following reasons, relatively low weight is allocated to (WQI)MB.
|
| Effluent of water treatment plant (WTP) after storage and chlorination prior to supply OR Effluent from raw water storage with only chlorination prior to supply | 0.8 | 0.2 | Due to the following reasons, relatively low weight is allocated to (WQI)MB.
|
| Water distribution system (WDS) | 0.5 | 0.5 | Due to the following reasons, equal weights are allocated to both the indices.
|
| Modified CCME WQI | Performance Category | Description |
|---|---|---|
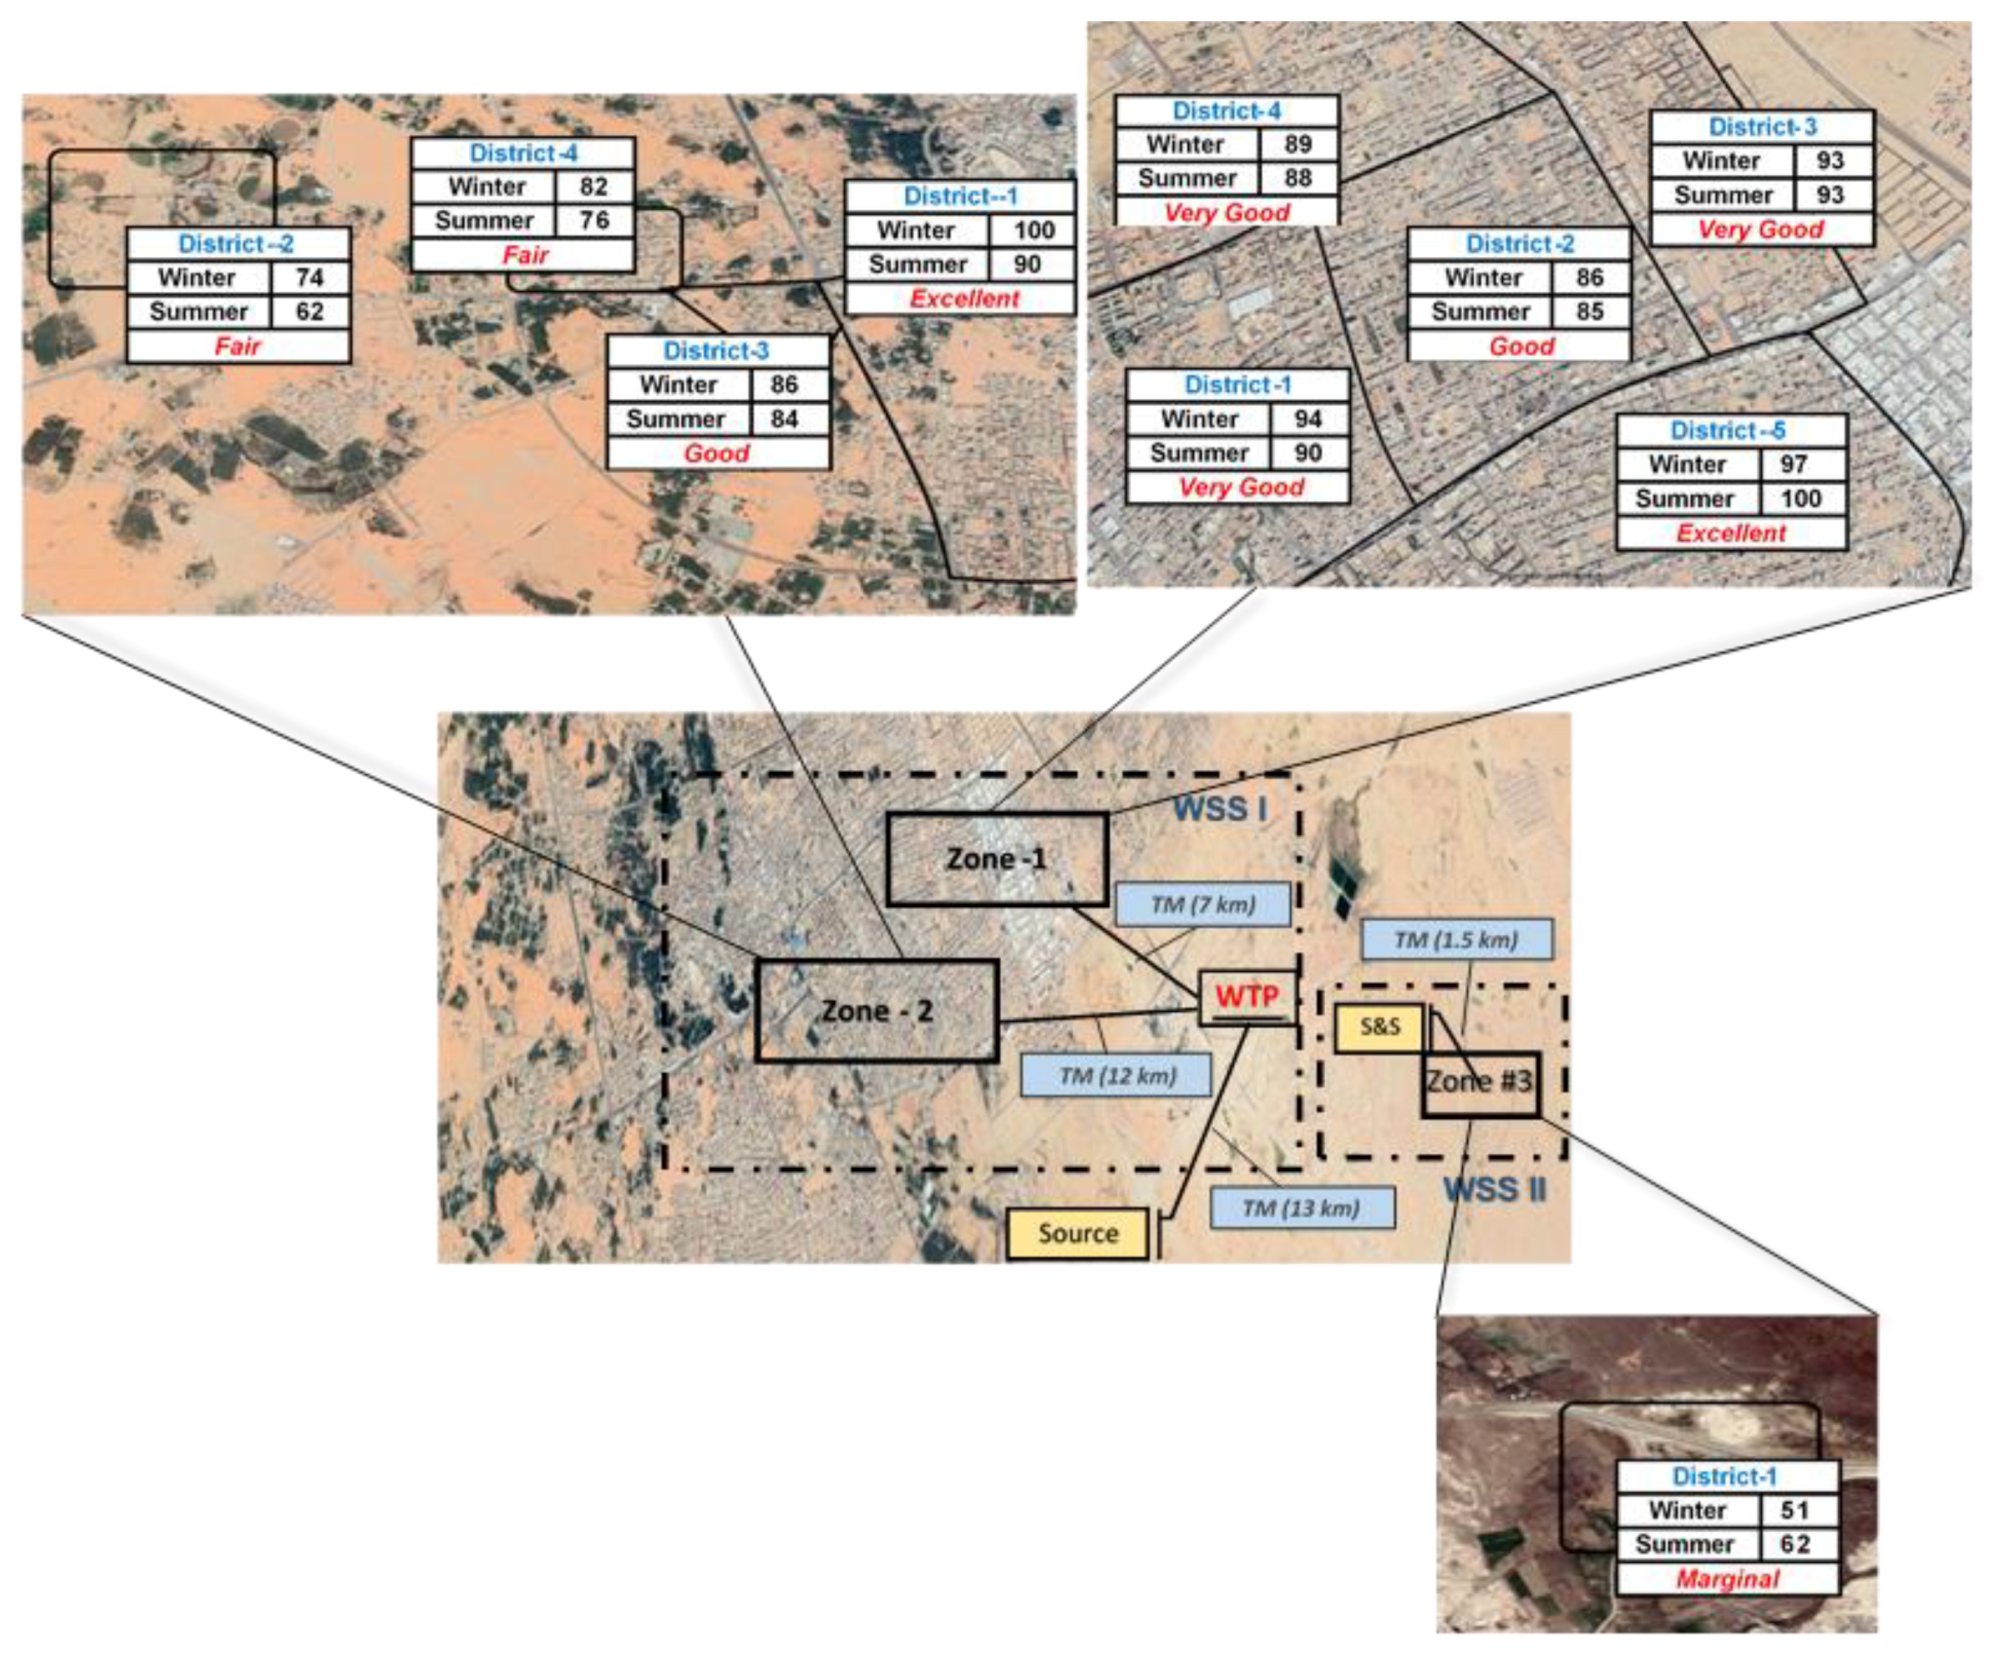
| 95–100 | Excellent | Water quality is protected with a virtual absence of impairment; conditions are very close to pristine levels; these index values can only be obtained if all measurements meet recommended guidelines virtually all of the time. |
| 89–94 | Very Good | Water quality is protected with a slight presence of impairment; conditions are close to pristine levels. |
| 80–88 | Good | Water quality is protected with only a minor degree of impairment; conditions rarely depart from desirable levels. |
| 65–79 | Fair | Water quality is usually protected but occasionally impaired; conditions sometimes depart from desirable levels. |
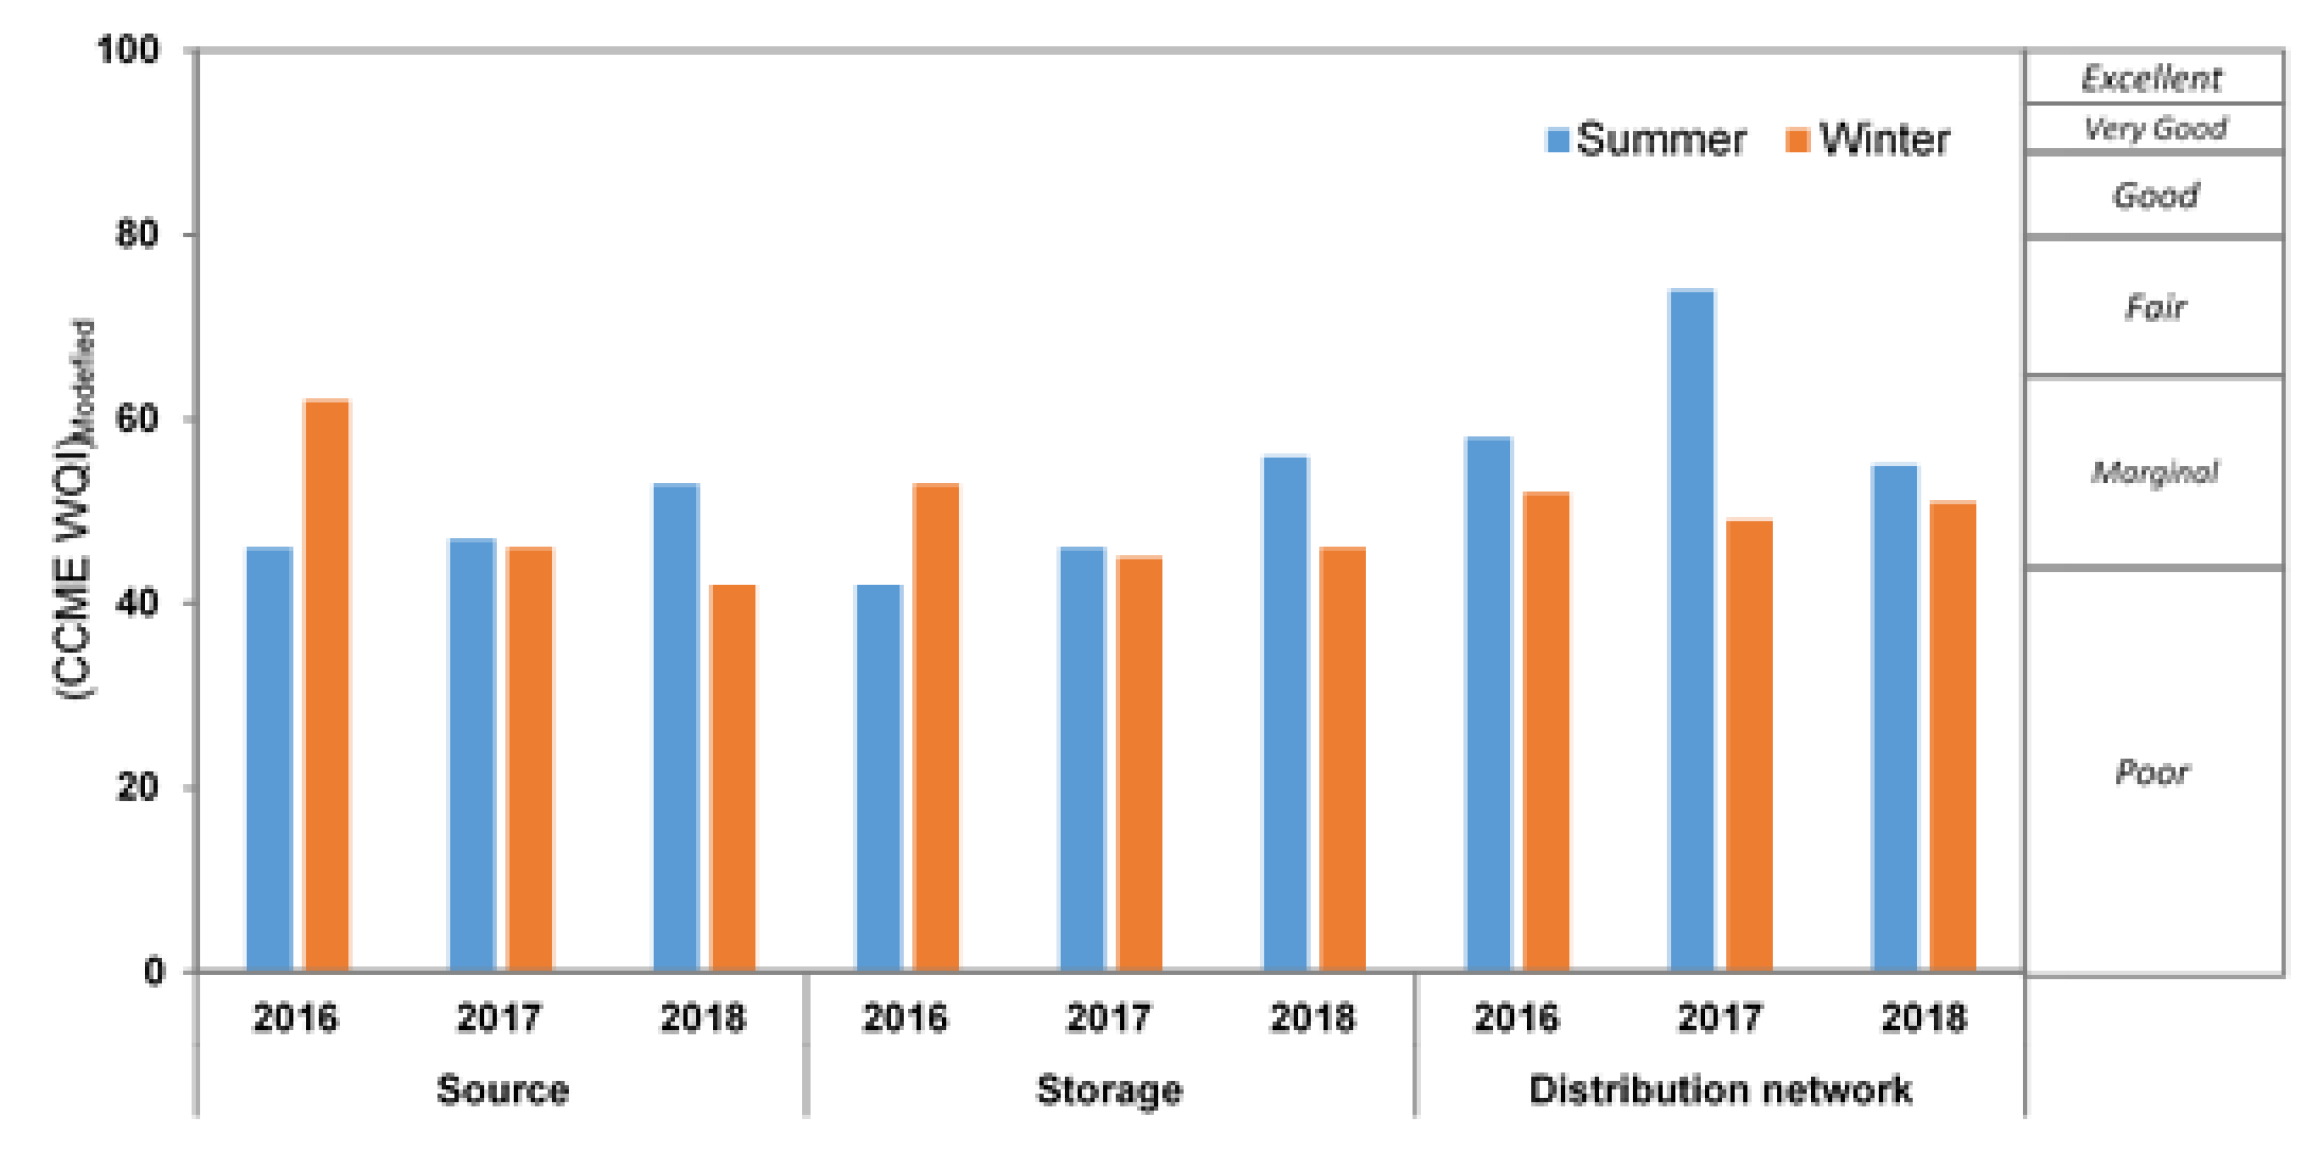
| 45–64 | Marginal | Water quality is frequently impaired; conditions often depart from desirable levels. |
| 0–44 | Poor | Water quality is almost always impaired; conditions usually depart from desirable levels. |
| Probability of Failure (P) | Consequence (C) | ||
|---|---|---|---|
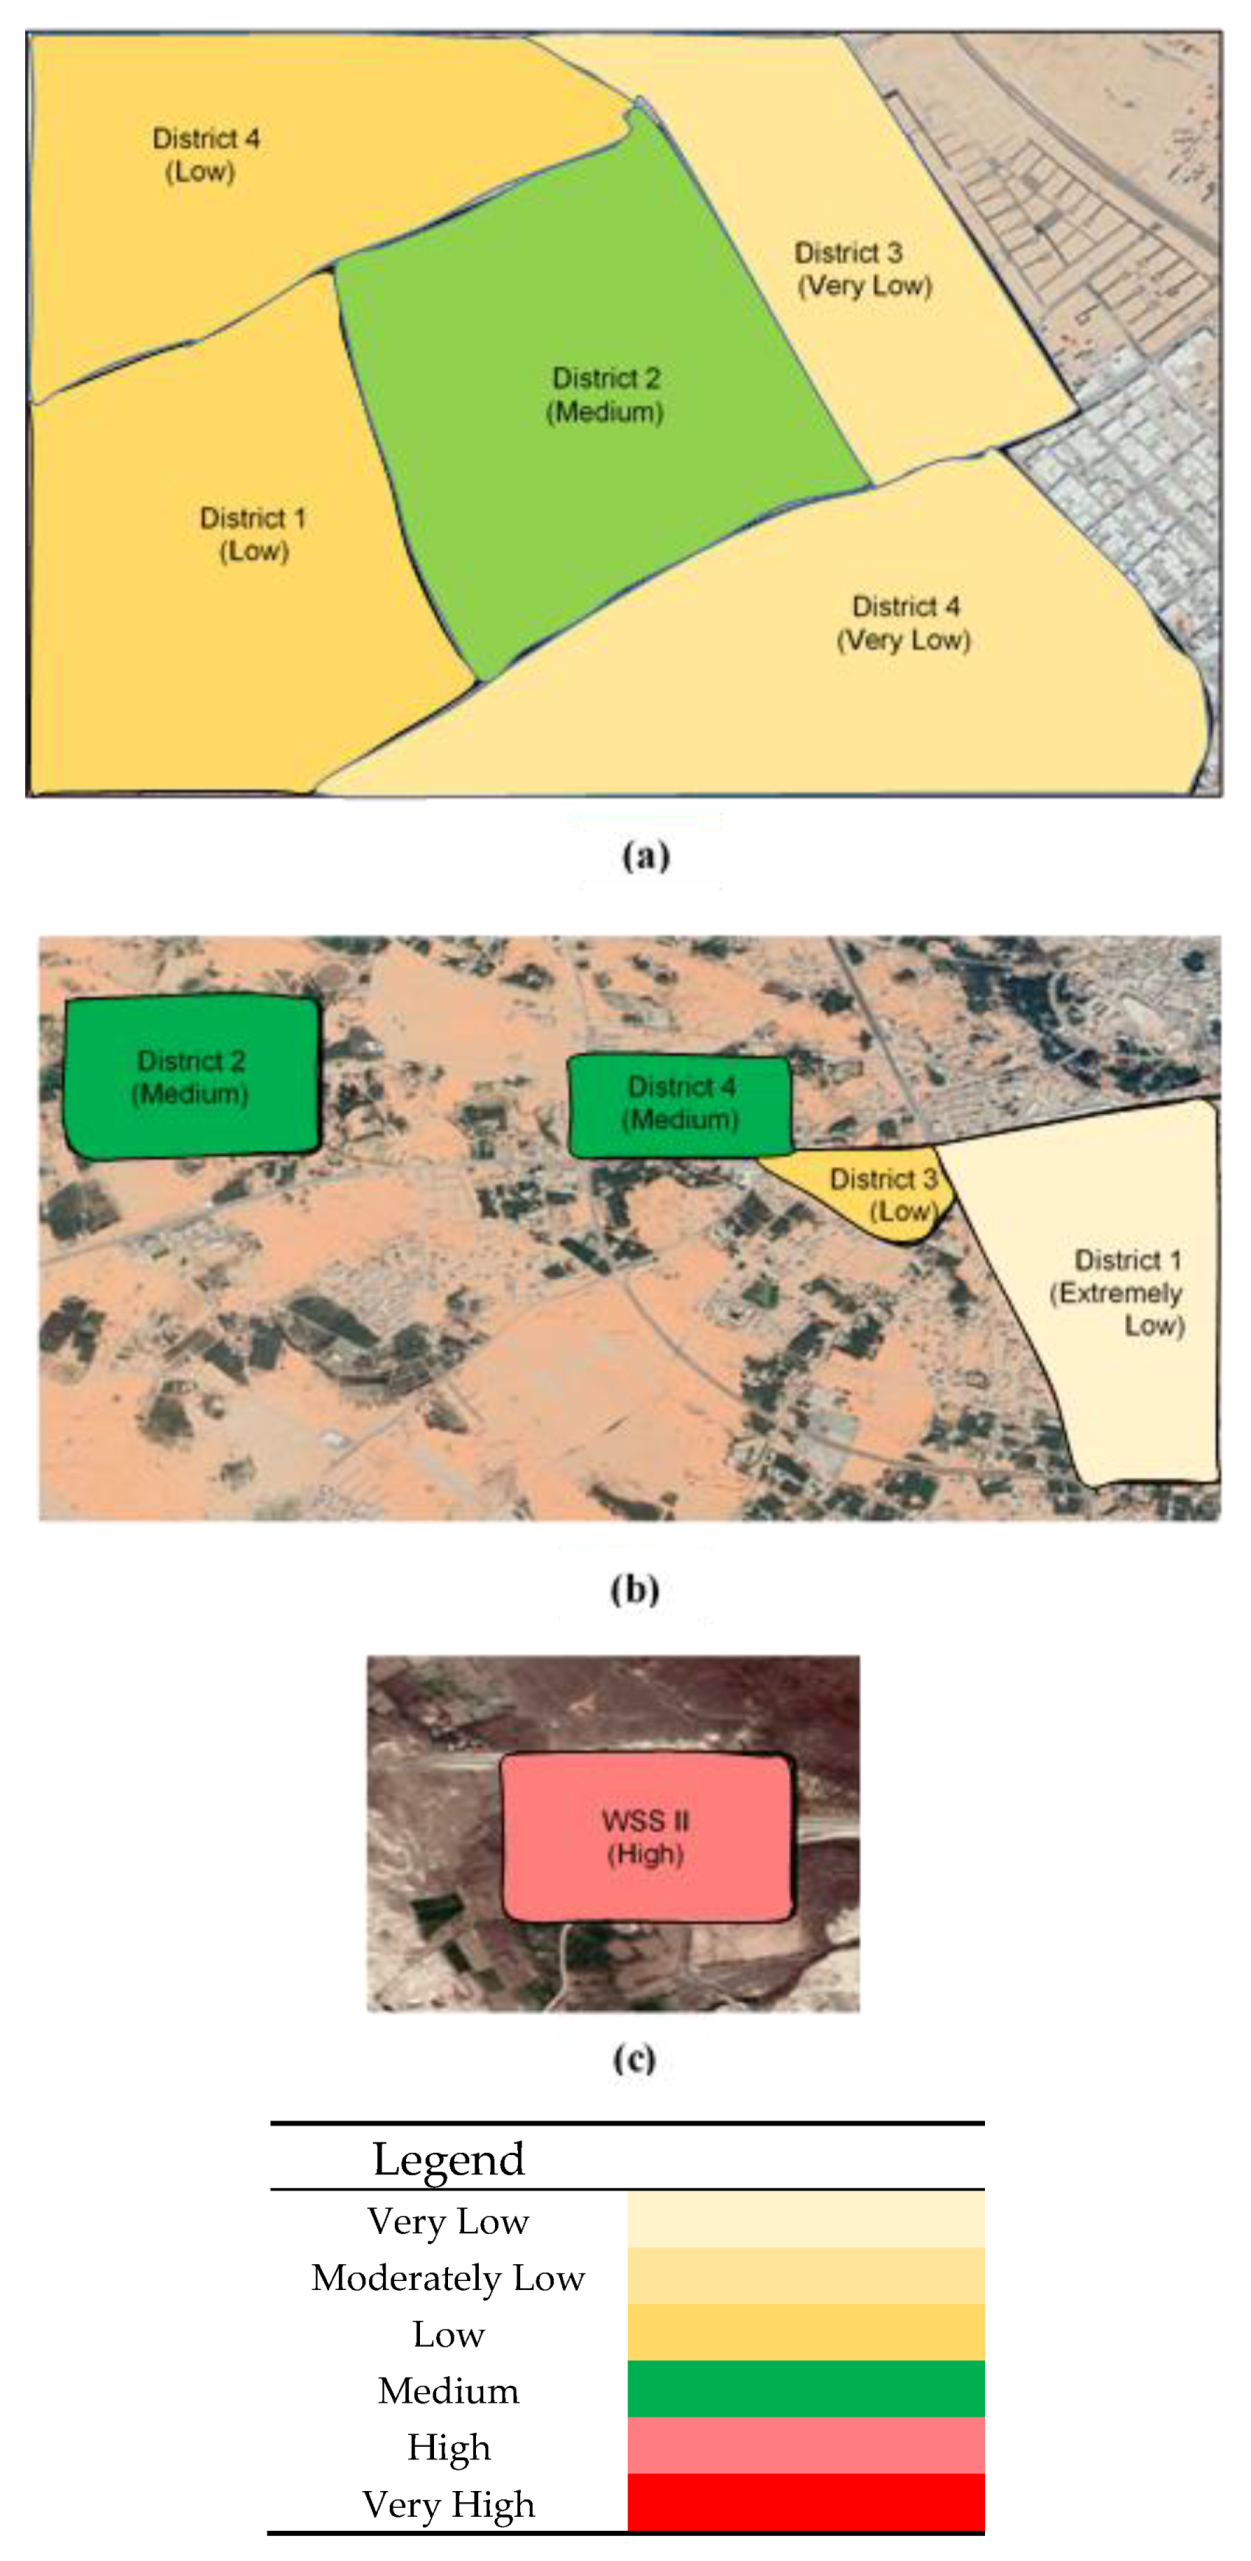
| Modified CCME WQI | Linguistic Scale | Number of Connections 1 | Linguistic Scale |
| 95–100 | Very Low | >1200 | Very High |
| 89–94 | Moderately Low | 800–1200 | High |
| 80–88 | Low | 500–800 | Medium |
| 65–79 | Medium | 200–500 | Low |
| 45–64 | High | 50–200 | Moderately Low |
| 0–44 | Very High | <50 | Very Low |
| Water Quality Parameter | Units | DWQS 1 | Concentration | Standard Deviation | CoV 5 (%) | ||
|---|---|---|---|---|---|---|---|
| MIN 2 | MEAN 3 | MAX 4 | |||||
| SOURCE WATER | |||||||
| Total dissolved solids (TDS) | mg/L | 500 | 408 | 871.9 ± 122.3 | 1304 | 265 | 30.4 |
| pH | - | 6.5–8.5 | 6.99 | 7.46 ± 0.12 | 8.11 | 0.26 | 3.5 |
| Ammonia (NH3) | mg/L | 0.01 | 0 | 0.002 ± 0.003 | 0.03 | 0.01 | 424 |
| Nitrite (NO2) | mg/L | 0.01 | 0 | 0.002 ± 0.003 | 0.03 | 0.01 | 424 |
| Iron (Fe) | mg/L | 0.3 | 0 | 0.0008 ± 0.011 | 0.1 | 0.02 | 320 |
| Turbidity | (NTU) | 1 | 0 | 0.504 ± 0.259 | 2.5 | 0.56 | 111 |
| Coliform Group | (MPN/100 mL) | Negative | Coliform group were found in 22.2% of the samples | ||||
| E.coli | (MPN/100 mL) | Negative | E coli were found in 22.2% of the samples | ||||
| Fecal Streptococci | (MPN/100 mL) | Negative | Fecal Streptococci were absent in all the samples | ||||
| WATER TREATMENT PLANT EFFLUENT | |||||||
| Total dissolved solids (TDS) | mg/L | 500 | 45.2 | 429.5 ± 11.78 | 1064 | 99.1 | 23.0 |
| pH | - | 6.5–8.5 | 6.46 | 7.215 ± 0.031 | 8.13 | 0.3 | 3.6 |
| Ammonia (NH3) | mg/L | 0.01 | 0 | 0.000 | 0 | 0.0 | 0.000 |
| Nitrite (NO2) | mg/L | 0.01 | 0 | 0.000 | 0 | 0.0 | 0.000 |
| Iron (Fe) | mg/L | 0.3 | 0 | 0.000 | 0 | 0.0 | 0.000 |
| Turbidity | (NTU) | 1 | 0 | 0.277 ± 0.037 | 2.94 | 0.26 | 92.4 |
| Free chlorine | mg/L | 0.2–0.5 | 0.1 | 0.313 ± 0.011 | 0.77 | 0.08 | 24.4 |
| Coliform Group | (MPN/100 mL) | Negative | Coliform group were absent in all the samples | ||||
| E.coli | (MPN/100 mL) | Negative | E coli were absent in all the samples | ||||
| Fecal Streptococci | (MPN/100 mL) | Negative | Fecal Streptococci were absent in all the samples | ||||
| DISTRIBUTION SYSTEM | |||||||
| Total dissolved solids (TDS) | mg/L | 500 | 175 | 525.8 ± 42.8 | 4511 | 360.47 | 68.6 |
| pH | - | 6.5–8.5 | 6.7 | 7.34 ± 0.031 | 8.27 | 0.26 | 3.59 |
| Ammonia (NH3) | mg/L | 0.01 | 0 | 0.000 | 0 | 0.00 | 0.000 |
| Nitrite (NO2) | mg/L | 0.01 | 0 | 0.0003 ± 0 | 0.04 | 0.00 | 1176 |
| Iron (Fe) | mg/L | 0.3 | 0 | 0.02 ± 0.01 | 0.88 | 0.08 | 402 |
| Turbidity | (NTU) | 1 | 0.08 | 0.501 ± 0.1 | 9.11 | 0.84 | 168 |
| Free chlorine | mg/L | 0.2–0.5 | 0 | 0.252 ± 0.012 | 0.43 | 0.10 | 38.4 |
| Water Quality Parameter | Units | Concentration | Standard Deviation | CoV 4 (%) | ||
|---|---|---|---|---|---|---|
| MIN 1 | MEAN 2 | MAX 3 | ||||
| SOURCE WATER | ||||||
| Total dissolved solids (TDS) | mg/L | 273 | 691.38 ± 55.68 | 868 | 139.18 | 20.131 |
| pH | - | 6.9 | 7.32 ± 0.09 | 7.77 | 0.22 | 3.072 |
| Ammonia (NH3) | mg/L | 0 | 0.03 ± 0.05 | 0.65 | 0.13 | 418.390 |
| Nitrite (NO2) | mg/L | 0 | 0.000 | 0 | 0.00 | 0.000 |
| Iron (Fe) | mg/L | 0 | 0.71 ± 0.12 | 1.04 | 0.30 | 42.992 |
| Turbidity | (NTU) | 0.49 | 5.14 ± 1.75 | 16 | 4.39 | 85.347 |
| Coliform Group | (MPN/100 mL) | Coliform group was found in 29.1% of the samples | ||||
| E.coli | (MPN/100 mL) | E coli was found in 29.1% of the samples | ||||
| Fecal Streptococci | (MPN/100 mL) | Fecal Streptococci was found in 29.1% of the samples | ||||
| STORAGE | ||||||
| Total dissolved solids (TDS) | mg/L | 484 | 674.96 ± 48.24 | 871 | 120.58 | 17.865 |
| pH | - | 6.99 | 7.32 ± 0.08 | 7.96 | 0.21 | 2.859 |
| Ammonia (NH3) | mg/L | 0 | 0.01 ± 0.01 | 0.09 | 0.02 | 261.634 |
| Nitrite (NO2) | mg/L | 0 | 0.000 | 0 | 0.00 | 0.000 |
| Iron (Fe) | mg/L | 0 | 0.77 ± 0.08 | 1.06 | 0.21 | 27.078 |
| Free chlorine | mg/L | 0.01 | 0.07 ± 0.08 | 0.93 | 0.19 | 284.944 |
| Turbidity | (NTU) | 0.73 | 4.02 ± 1.51 | 14.2 | 3.77 | 93.973 |
| Coliform Group | (MPN/100 mL) | Coliform group was found in 16.6% of the samples | ||||
| E.coli | (MPN/100 mL) | E coli was found in 16.6% of the samples | ||||
| Fecal Streptococci | (MPN/100 mL) | Fecal Streptococci was found in 16.6% of the samples | ||||
| DISTRIBUTION SYSTEM | ||||||
| Total dissolved solids (TDS) | mg/L | 500 | 689.29 ± 47.70 | 876 | 119.24 | 17.298 |
| pH | - | 7 | 7.35 ± 0.10 | 7.91 | 0.24 | 3.327 |
| Ammonia (NH3) | mg/L | 0 | 0.01 ± 0.01 | 0.13 | 0.03 | 489.898 |
| Nitrite (NO2) | mg/L | 0 | 0.000 | 0 | 0.00 | 0.000 |
| Iron (Fe) | mg/L | 0 | 0.62 ± 0.16 | 1.7 | 0.41 | 66.062 |
| Free chlorine | mg/L | 0.01 | 0.05 ± 0.05 | 0.48 | 0.11 | 210.625 |
| Turbidity | (NTU) | 0.7 | 1.83 ± 0.42 | 5.14 | 1.05 | 57.614 |
| Coliform Group | (MPN/100 mL) | Coliform group was found in 20.8% of the samples | ||||
| E.coli | (MPN/100 mL) | E coli was found in 20.8% of the samples | ||||
| Fecal Streptococci | (MPN/100 mL) | Fecal Streptococci was found in 20.8% of the samples | ||||
| District No. | Service Connections | Population | P 1 | C 2 | Risk | Potential Actions Required |
|---|---|---|---|---|---|---|
| Water Supply System I (Zone 1) | ||||||
| District 1 | 591 | 3723 | Moderately Low | Medium | Low |
|
| District 2 | 1289 | 8121 | Low | Very High | Medium |
|
| District 3 | 181 | 1140 | Moderately Low | Moderately Low | Very Low |
|
| District 4 | 1474 | 9286 | Moderately Low | Very High | Low |
|
| District 5 | 1300 | 8190 | Very Low | Very High | Low |
|
| Water Supply System I (Zone 2) | ||||||
| District 1 | 387 | 2438 | Very Low | Low | Extremely Low |
|
| District 2 | 150 | 945 | Medium | Moderately Low | Medium |
|
| District 3 | 342 | 2155 | Low | Low | Low |
|
| District 4 | 315 | 1985 | Medium | Low | Medium |
|
| Water Supply System II | ||||||
| - | 45 | 284 | High | Very Low | High |
|
© 2019 by the authors. Licensee MDPI, Basel, Switzerland. This article is an open access article distributed under the terms and conditions of the Creative Commons Attribution (CC BY) license (http://creativecommons.org/licenses/by/4.0/).
Share and Cite
Haider, H.; Alkhowaiter, M.H.; Shafiquzzaman, M.; AlSaleem, S.S.; Almoshaogeh, M.; Alharbi, F. Spatiotemporal Water Quality Variations in Smaller Water Supply Systems: Using Modified CCME WQI from Groundwater Source to Distribution Networks. Water 2019, 11, 1884. https://doi.org/10.3390/w11091884
Haider H, Alkhowaiter MH, Shafiquzzaman M, AlSaleem SS, Almoshaogeh M, Alharbi F. Spatiotemporal Water Quality Variations in Smaller Water Supply Systems: Using Modified CCME WQI from Groundwater Source to Distribution Networks. Water. 2019; 11(9):1884. https://doi.org/10.3390/w11091884
Chicago/Turabian StyleHaider, Husnain, Mohammed Hammed Alkhowaiter, Md. Shafiquzzaman, Saleem S. AlSaleem, Meshal Almoshaogeh, and Fawaz Alharbi. 2019. "Spatiotemporal Water Quality Variations in Smaller Water Supply Systems: Using Modified CCME WQI from Groundwater Source to Distribution Networks" Water 11, no. 9: 1884. https://doi.org/10.3390/w11091884
APA StyleHaider, H., Alkhowaiter, M. H., Shafiquzzaman, M., AlSaleem, S. S., Almoshaogeh, M., & Alharbi, F. (2019). Spatiotemporal Water Quality Variations in Smaller Water Supply Systems: Using Modified CCME WQI from Groundwater Source to Distribution Networks. Water, 11(9), 1884. https://doi.org/10.3390/w11091884