Article

Effect of Straw Mulch on Soil Evaporation during Freeze–Thaw Periods

1
College of Water Resources and Engineering, Taiyuan University of Technology, Taiyuan 030024, China
2
First Hydrogeology and Engineering Geology Team of Shanxi Province, Taiyuan 030024, China
3
Taigu Water Balance Experimental Field, Bureau of Hydrology and Water Resources Survey of Shanxi Province, Taigu 030800, China
4
Department of Earth Sciences, University of the Western Cape, Private Bag X17, Bellville, Cape Town 7535, South Africa
*
Author to whom correspondence should be addressed.
Water 2019, 11(8), 1689; https://doi.org/10.3390/w11081689
Submission received: 17 July 2019 / Revised: 8 August 2019 / Accepted: 12 August 2019 / Published: 15 August 2019
(This article belongs to the Section Water Resources Management, Policy and Governance)

Abstract

:
Reducing soil evaporation is important to alleviate water shortages in arid and semi-arid regions. The objective of this work was to reveal the effect of straw mulch on soil evaporation based on field experiments during a freeze–thaw period in Northern China. Four soil surface mulch treatment modes were investigated: Bare soil (BS), 1 cm thick straw mulch with 100% coverage rate (J1), 2 cm thick straw mulch with 100% coverage rate (J2), and 2 cm thick straw mulch with 50% coverage rate (J3). Principal component analysis was used to analyze the major factors influencing soil evaporation in three freeze–thaw stages. The results show that cumulative soil evaporation decreased with increased straw mulch thickness and coverage rate. The effect of straw mulching on soil evaporation was obvious during the stable freezing period, and soil evaporation with straw mulch treatments was reduced by 49.0% to 58.8% compared to BS treatment, while there was little difference for straw mulch treatments in the thawing stage. The relationship between cumulative soil evaporation under different straw mulch modes and time was well fitted by the power function. In the unstable freezing stage, the major factors for all treatments influencing soil evaporation were surface soil temperature and water surface evaporation; in the stable stage, they were solar radiation and relative humidity, and in the thawing stage, they were solar radiation and air temperature. The research results can provide a basis for addressing soil water storage and moisture conservation and restraining ineffective soil evaporation in arid and semi-arid areas.

1. Introduction

Soil evaporation is the main process in the consumption of soil moisture, changes of which directly affect the management of soil water and the improvement of the agricultural crop yield [1]. In arid and semi-arid areas, it is estimated that 50–70% of precipitation is lost by soil evaporation without any contribution to crop production [2,3]. Northern China is the main distribution area of seasonal frozen soil and is also a typical arid and semi-arid area [4]. In recent years, with increasing drought and water pollution, the development of agricultural production is seriously threatened by drought and water shortage. In order to reduce the ineffective loss of soil moisture caused by soil evaporation and improve crop water use efficiency, the method of soil surface mulching is often used in production.
As a well-established technique used worldwide, especially in arid and semi-arid areas, soil surface mulching has favorable effects in terms of improving soil temperature and reducing soil evaporation. Generally speaking, mulching materials are divided into organic materials such as straw [5], plastic film [6], pine bark, and vine residue [2], and inorganic materials such as tephra [7], gravel, and sand [8]. Straw mulch, as a kind of mulching material, mitigates drought due to its water-retention capacity and has been widely used because it is biodegradable and environmentally friendly [9]. Straw mulching can not only reduce latent heat flux [10], restrain soil evaporation [11,12,13], inhibit topsoil salt accumulation [14,15], reduce weed growth [16], and improve crop water use efficiency and crop yield [17,18], but it also improves soil fertility [19,20], coordinates the nutrient supply [21], regulates the soil temperature [9,10,22], increases the soil moisture [23,24], influences the soil infiltration capacity [25], and changes the natural freezing–thawing process of soil [26]. Moreover, under sufficient water conditions, straw mulching reduces the transpiration efficiency [27]. Given these positive effects, scholars have actively explored the effects of straw mulch on water storage, soil moisture conservation, and crop yield in recent years [28,29,30,31,32].
However, most previous research focused on the unfreezing period. During seasonal freeze–thaw periods, straw mulch has a positive effect, and the existence of straw mulch weakens the heat and water vapor transport between the ground and the air. However, it also has a certain negative effect, and the slow rise of ground temperature in spring under straw mulch is not conducive to the emergence of spring sown crops. Soil freezing and thawing are complex processes that may significantly influence the water and heat balance [33,34,35]. Straw mulching reduced the freezing depth of soil and changed the natural variation of soil water and heat during the freezing–thawing period [36]. Straw mulch delayed the thawing of the surface soil by 3 to 6 days, reduced cumulative evaporation and the range of soil evaporation [37]. Fu et al. [37] determined the effects of straw mulching on soil water evaporation in the Songnen Plain during the thawing period, while the effect of the freezing period was not shown. The resistance of soil evaporation is related to the thickness and coverage rate of the straw [38]. Therefore, an inadequate understanding of the effects of straw mulch modes on the resistance of soil evaporation and the main factors influencing soil evaporation during the freeze–thaw period promoted this study. This research could be significant for addressing soil water storage and moisture conservation and for restraining ineffective evaporation of soil water in arid and semi-arid areas.
The objectives of this study are to (1) quantify soil evaporation under different straw mulch modes during freeze–thaw periods, (2) identify the influences of straw mulch on soil evaporation during freeze–thaw periods; and (3) analyze the major factors that influence soil evaporation under different straw mulch modes in different freeze–thaw stages.

2. Materials and Methods
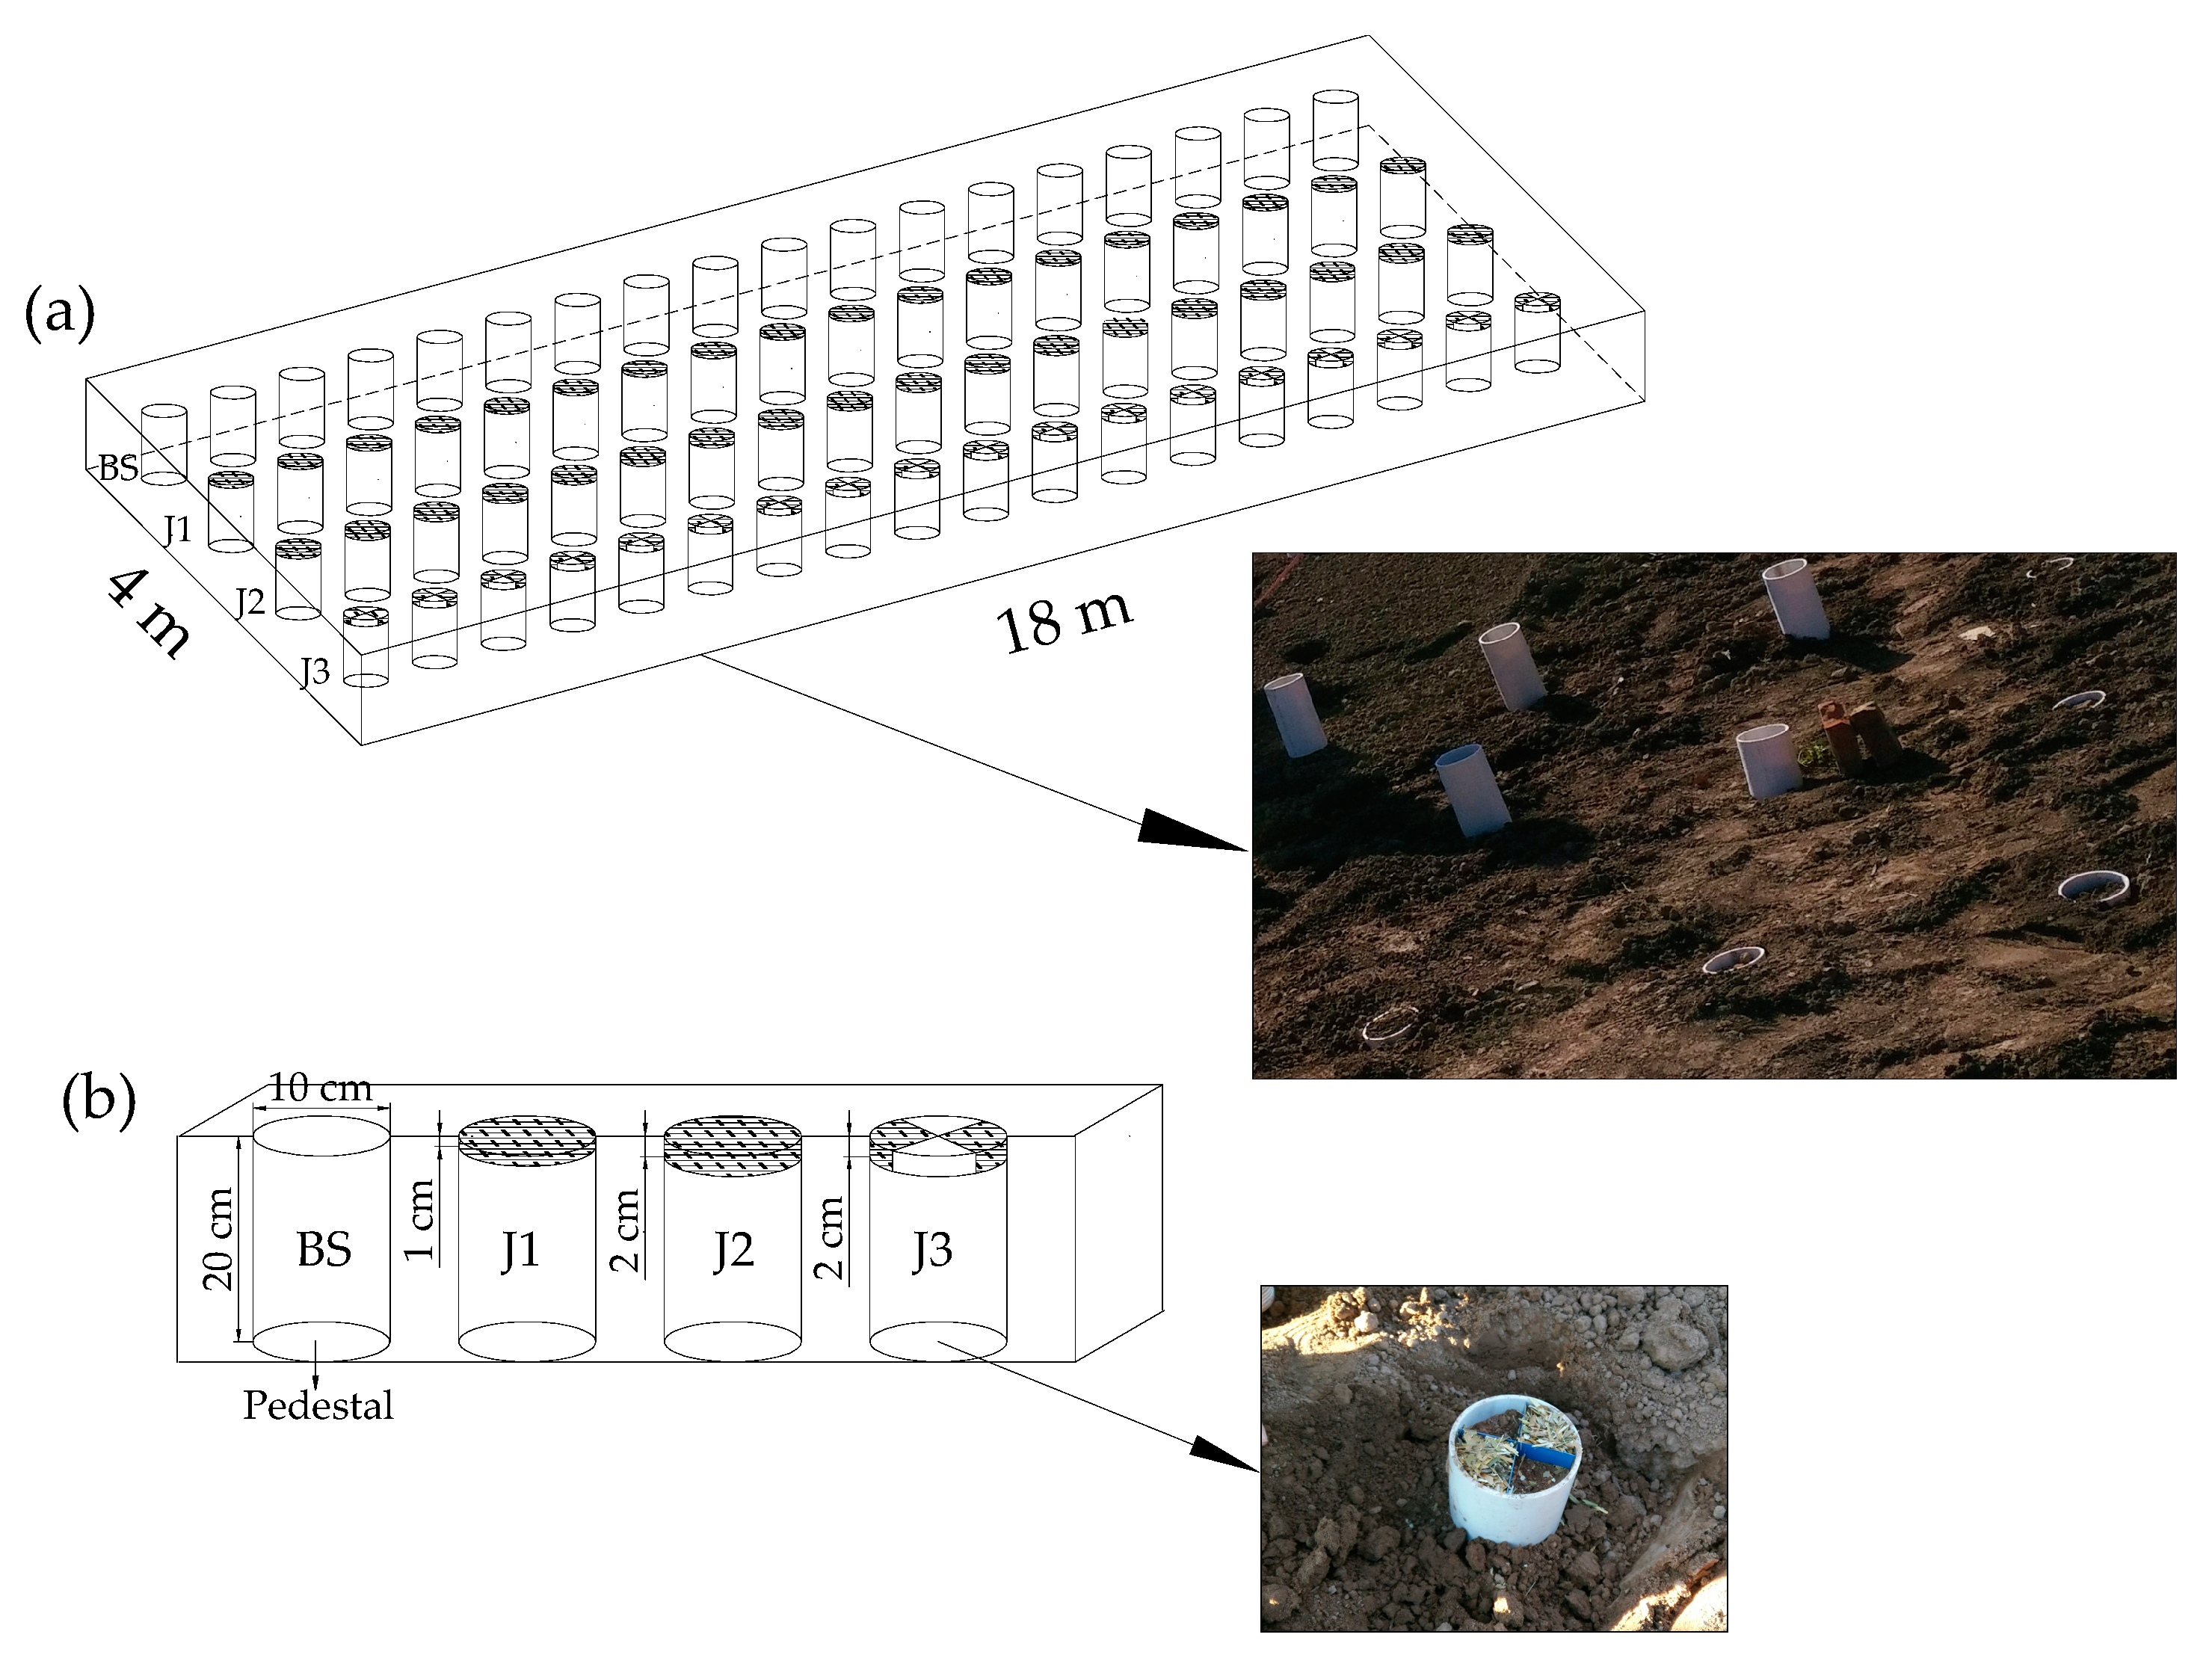
2.1. Field Station

The field experiment was conducted from November 2017 to March 2018 at the Taigu Water Balance Experimental Station in Shanxi, China (Figure 1). The station covers an area of 1 hm2, at an altitude of 777.0 m with ground slope gradient of 0.3% and is located in the east of Jinzhong Basin (37°26′ N, 112°30′ E) which is representative of Quaternary alluvial plain with groundwater table depth of 25.0 m. The region has a continental semi-arid climate, with mean annual temperature of 9.9 °C and annual average precipitation of 415.2 mm concentrated from June to September. The average annual potential evaporation of the water surface is 1642.4 mm; the average annual wind speed is 0.9 m·s−1, and the average annual relative humidity is 74%. The annual average frost-free period is about 200 days, and the maximum observed soil frost depth was 92 cm in 1960 [39,40]. The surface soils are mainly sandy loam, and the soil physical properties are presented in Table 1.

2.2. Experiment Design

Field experiments were conducted in a fallow plot (4 m × 18 m) with 4 treatments (18 groups) (Figure 2a): BS (control, bare soil), J1 (100% of soil surface mulched with crushed corn straw 1 cm thick, with 430 kg·hm−1), J2 (100% of soil surface mulched 2 cm thick, with 860 kg·hm−1), and J3 (50% of soil surface mulched 2 cm thick, with 430 kg·hm−1) (Figure 2b).
Soil evaporation was measured by weighing micro-lysimeters (MLs). The MLs were manufactured using white polyvinyl chloride with an inner diameter of 100 mm, a thickness of 4 mm, and length of 200 mm. Pedestals used to seal the bottoms of micro-lysimeters were also made from polyvinyl chloride, with a 100 mm inner diameter and 35 mm height. Before the experiment, the 72 MLs (4 treatments, 18 groups) were inserted into the experimental field at intervals of 1 m and filled with undisturbed soil. Among the 18 groups, one group was monitored the soil temperatures during the whole test period, and other 17 groups were used to measure the soil evaporation.
Soil evaporation was measured at 08:00–09:00 at intervals of approximately 7 days by an electronic balance with a range of 15 kg and a sensitivity of 0.1 g. The bottoms of the 4 MLs were sealed with pedestals for the first weighing and then buried in the previous position until the second weighing. Assuming that the moisture exchange quantity between the soil in the ML and the subsoil below the ML at the intervals of 2 weighing time was 0, the difference between the 2 weighing values was considered to be the soil evaporation in this period. After the second weighing, the 4 MLs for the first group were discarded and the 4 MLs for the second group were weighed, and so on.
Soil samples obtained from the 4 MLs at a depth of 0 to 2 cm after the second weighing were collected in an aluminum box to determine the surface soil water content by the oven-drying method (drying in an oven at 105 °C for 8 h). Meanwhile, the soil temperature for each treatment was measured by thermistors in surface soil below the straw mulch in the ML. The meteorological data—air temperature, frost depth, wind speed, precipitation, water surface evaporation, vapor pressure, and relative humidity—were obtained from the automatic weather station at the experimental site during the test period.

2.3. Calculation of Soil Evaporation

The cumulative soil evaporative capacity between 2 measurements was estimated by the following equation:
E = 10 × M 2 M 1 π r 2 ρ w
where E is the soil evaporation for a period (mm), M1 is the weight at the first weighing (g), M2 is the weight at the second weighing (g), r is the inside diameter of the micro-lysimeter (cm), and ρ w is the density of water (g·cm−3).
The evaporation rate for a certain period was calculated by the following equation:
e = E T
where e is the soil evaporation rate (mm·d−1) and T is the days corresponding to E (d).

3. Results

3.1. Soil Freezing and Thawing Process

The seasonal frozen soil went through two main physical processes (i.e., freezing and thawing) during the freeze–thaw period. With the gradually decreased air temperature (as shown in Figure 3) and solar radiation after November, the surface soils began to freeze on 10 November 2017. The freezing and thawing process could be divided into three stages according to the freezing and thawing characteristics [39]: Unstable freezing stage (P1: 10 November to 9 December 2017), stable freezing stage (P2: 10 December 2017 to 4 February 2018), and thawing stage (P3: 5 February to 21 March 2018).
The surface soil was thawing during the day and freezing at night in P1. The average freezing rate was 0.88 cm·d−1, and the maximum freezing rate was 2 cm·d−1. With lower air temperature and the accumulation of negative surface soil temperatures, the soil entered P2 on 10 December 2017, during which the ice ratio of the soil increased and the freezing front gradually developed downward. The maximum freezing rate was up to 3 cm·d−1. The depth of frozen soil reached a maximum of 49 cm in early February. In P3, as the air temperature rose, the frozen soil began to thaw downward from the surface and upward from the maximum frozen front [41]. The surface soil experienced several freeze–thaw cycles again, and the soil thawed totally by 21 March 2018 as shown in Figure 3.
There were 10 precipitation events, mostly in the form of a little snow during the test period, and the total precipitation was only 12.8 mm, with maximum precipitation of 6.5 mm on 17 March 2018. There was no precipitation in the unstable freezing stage.

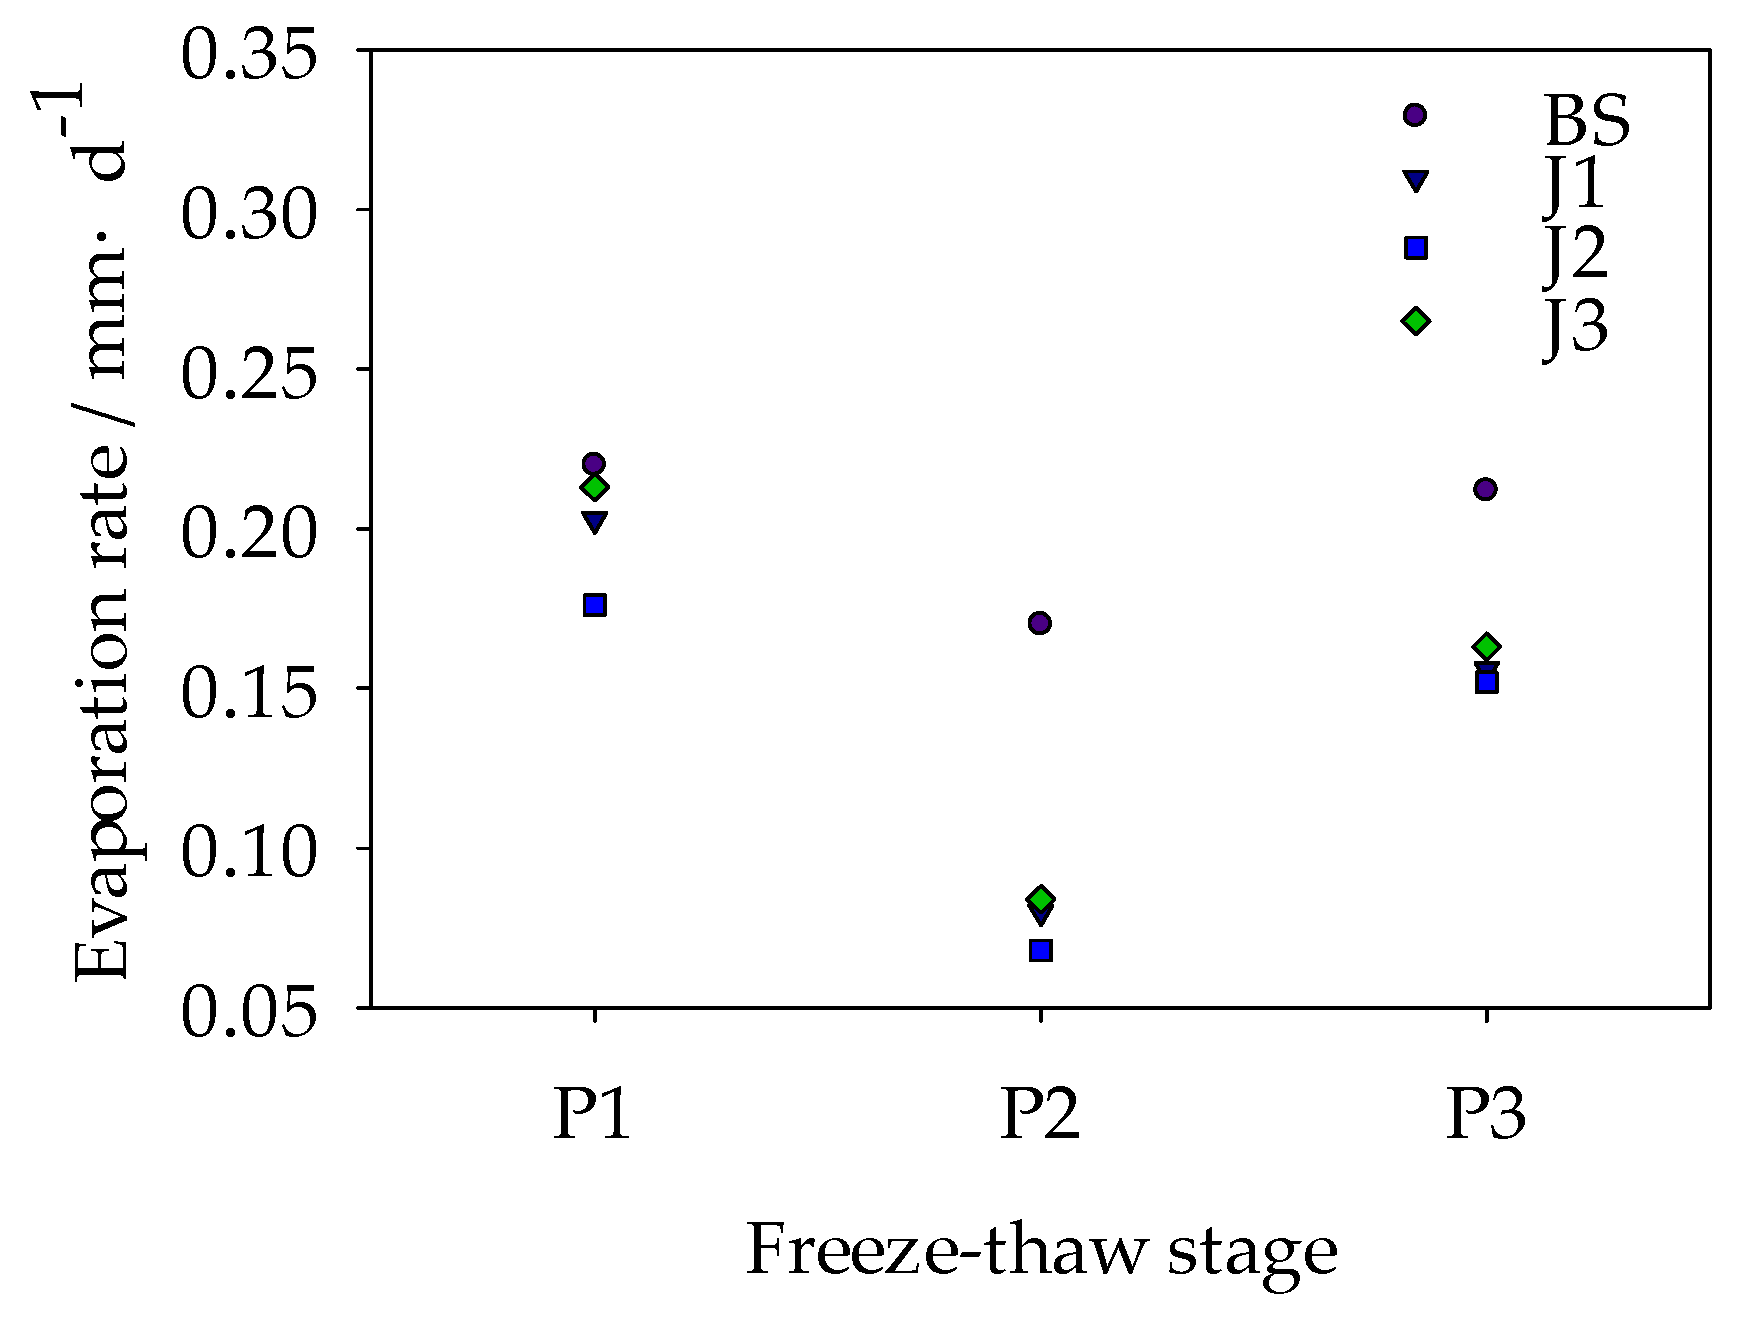
3.2. Soil Evaporation Characteristics during Three Freeze–Thaw Stages

Straw mulch can reduce soil evaporation effectively during the freeze–thaw periods. Cumulative soil evaporation (shown in Figure 4) and the soil evaporation rate (shown in Figure 5) of the straw mulching treatments in the three freeze–thaw stages were lower than those of BS treatment. However, the efficiency of different straw mulch modes for soil evaporation control in the three freeze-thaw stages was differed because of the different freeze–thaw characteristics.

3.2.1. Unstable Freezing Stage

In P1, straw mulch had weakened the direct absorption of solar radiation on the surface and further lowered the transport of thermal from solar radiation to the surface soil due to its lower thermal conductivity. Meanwhile, straw mulch also impeded partial long-wave radiation overnight and thereafter reduced the thermal loss on surface soil, which further effectively prevented a drop of surface soil temperature. Therefore, the daily change of the surface soil temperature with the straw mulch was smaller than that for BS. Average surface soil temperature for J1 and J2 treatments was reduced by 2.8 °C and 3.1 °C, respectively, compared with that for BS treatment. Thereafter, the availability of heat for soil evaporation decreased. Nevertheless, straw mulch can save water in the surface soil; the surface soil water content for J1 and J2 treatments was 9.7% and 16.4%, respectively, greater than that for BS treatment. However, straw mulch slowed the transport of water vapor to the atmosphere by lengthening the transport path and thereafter weakened the soil evaporation rate. In P1, the average soil evaporation rates for J1 and J2 treatments were 0.203 mm·d−1 and 0.176 mm·d−1, respectively, less than that for BS treatment (0.220 mm·d−1). The soil evaporation for J1 and J2 treatments was 5.67 mm and 4.93 mm, respectively, showing a reduction of 7.8% and 19.8% compared with BS treatment. The soil water content for J3 treatment was 6.5%, showing an increment of 2.1% over BS treatment, whereas surface soil temperature for J3 treatment was lower than that for BS treatment, with a reduction of 2.84 °C. The soil evaporation rate for J3 treatment was 0.213 mm·d−1, slightly smaller than that for BS treatment but higher than that for J1 and J2 treatments. Accordingly, the soil evaporation for J3 treatment was 5.97 mm, which showed a reduction of 2.9% compared with BS treatment and an increment of 5.29% and 21.10% compared with J1 and J2 treatments, respectively. It can be seen that the straw coverage rate was more important than the mulch thickness for soil evaporation suppression in the unstable freezing stage.

3.2.2. Stable Freezing Stage

In P2, the surface soil temperatures for J1 and J2 treatments were reduced by 1.26 °C and 0.62 °C, respectively, compared to the BS treatment. As the solar radiation and air temperature dropped below 0 °C, the surface soil water began to freeze, which resulted in limited available water for soil evaporation. Moreover, the downward-developing frozen layer broke up the capillary diffusion and blocked the movement of liquid water, and the soil moisture evaporated by vapor diffusion, which slowed the evaporation rate significantly. The average soil evaporation rates for BS, J1, J2, and J3 treatments were reduced by 22.7%, 60.6%, 61.4%, and 60.6%, respectively, compared with the unstable freezing stage. Because of the further hindrance of straw mulch, the soil evaporation rates for J1 and J2 treatments were 0.08 mm·d−1 and 0.068 mm·d−1, respectively, significantly smaller than that for BS treatment (0.17 mm·d−1). The soil evaporation for J1 and J2 treatments was 4.57 mm and 3.88 mm, respectively, showing a reduction of 51.4% and 58.8% compared to BS treatment. This indicates that straw mulch with two straw layer thicknesses was efficient for soil evaporation control, with little difference between the two. The soil evaporation rate for J3 treatment was 0.084 mm·d−1, lower than that for BS treatment but slightly higher than that for J1 and J2 treatment. Consequently, the soil evaporation for J3 treatment was reduced by 49.0% compared to BS treatment. It can be seen that soil evaporation capacity in P2 was the lowest among three freeze–thaw stages, and straw mulching had a good effect on inhibiting soil evaporation.

3.2.3. Thawing Stage

As the air temperature and solar radiation increased gradually in the thawing stage, the frozen layer began to thaw, with a corresponding increase in soil liquid water content. The surface soil water content for BS, J1, J2, and J3 treatments was increased by 14.0%, 33.3%, 15.5%, and 15.1%, respectively, compared with P2. Moreover, the surface soil water content for J1 and J2 treatments was higher than that for BS treatment. Nevertheless, the surface soil temperature for J1 and J2 treatments was reduced by 4.24 °C and 4.30 °C, respectively, compared to BS treatment due to the slow rise of soil temperature with straw mulch. The soil evaporation rate for J1 and J2 treatments was 0.156 mm·d−1 and 0.152 mm·d−1, less than that for BS treatment. The soil evaporation for J1 and J2 treatment was 7.01 mm and 6.82 mm, respectively, showing a reduction of 26.6% and 28.6% compared with BS treatment, which suggests that straw mulch thicknesses were efficient for soil evaporation control and with little difference in P3. The soil evaporation rate for J3 treatment was 0.163 mm·d−1, slightly higher than that for J1 and J2 treatment but significantly less than that for BS treatment. The soil evaporation was 7.34 mm, which was markedly reduced by 23.1% compared to BS treatment and increased by 4.7% and 7.6% compared to J1 and J2 treatment, respectively.

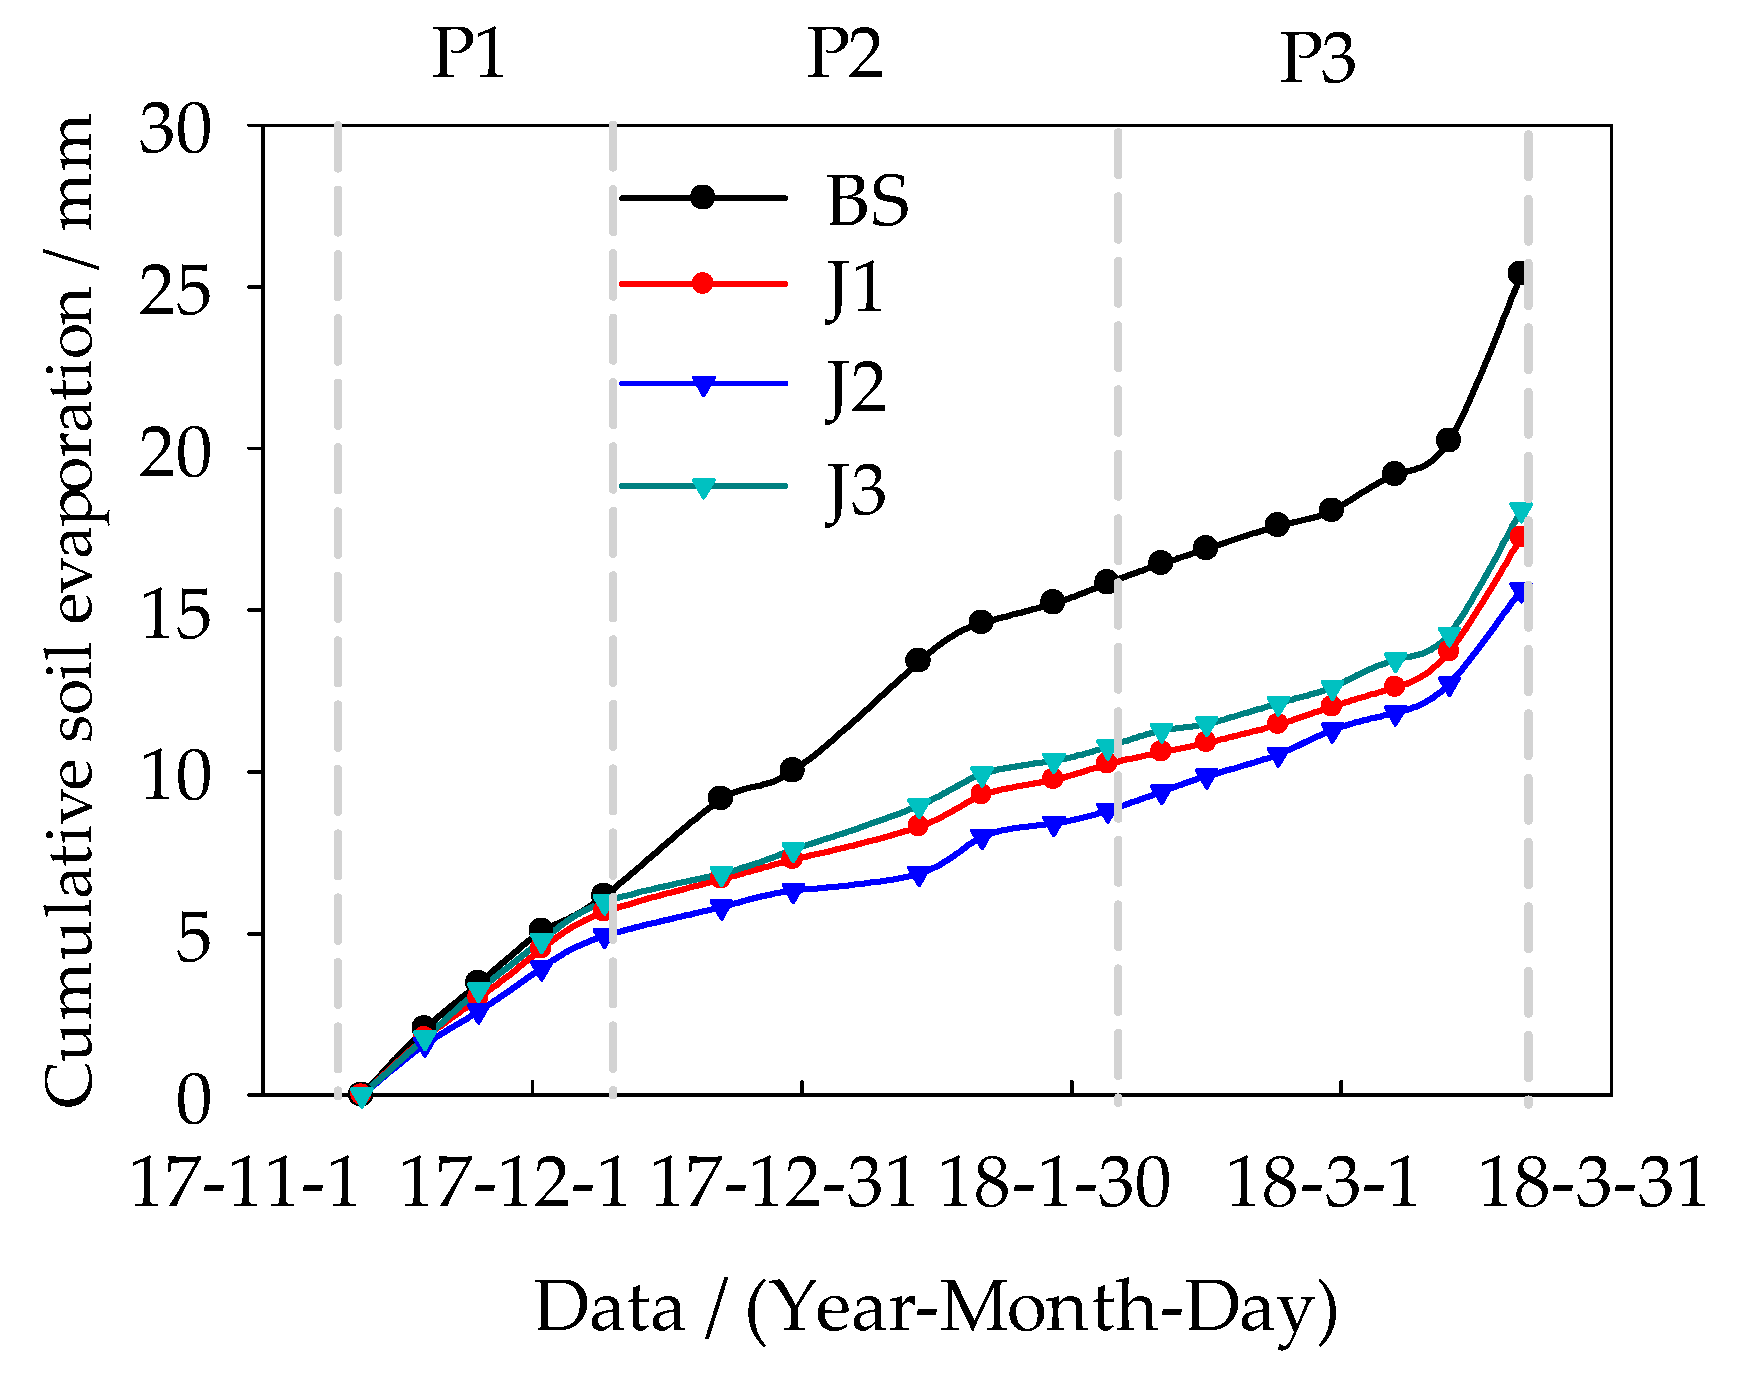
3.3. Cumulative Soil Evaporation during the Freeze–Thaw Period

Straw mulch impeded the heat exchange between the surface soil and the atmosphere, and therefore, less energy could be absorbed or released by the surface soil. Meanwhile, straw mulch altered the surface soil heat conductivity, heat reflectivity, and roughness, which further changed the soil thermal properties and affected the absorption, transfer, and conversion of heat in the surface soil. In addition, straw mulch affected the microclimatic conditions near the surface soil, including the air temperature, humidity, and wind speed and impacted the soil profile temperature, then further influenced the soil evaporation significantly.
The cumulative soil evaporation varied markedly, as shown in Figure 6. The cumulative soil evaporation for J1, J2, and J3 treatments was 17.25 mm, 15.63 mm, and 18.11 mm, showing a reduction of 32.1%, 38.4%, and 28.7%, respectively, compared with BS treatment. It can be concluded that the three mulching modes affected soil evaporation significantly, and cumulative evaporation decreased with increased straw mulching rate and thickness.
The relationship between cumulative soil evaporation and time under different mulch modes was fitted by the three equations (linear equation, exponential equation [42], power function) shown in Table 2. The coefficient of determination of the three equations was greater than 0.84, and the power function had an optimum fitting effect with a determination coefficient of 0.98 to 0.99, which could be better used to predict the cumulative soil evaporation under different mulch modes during the freeze–thaw period.

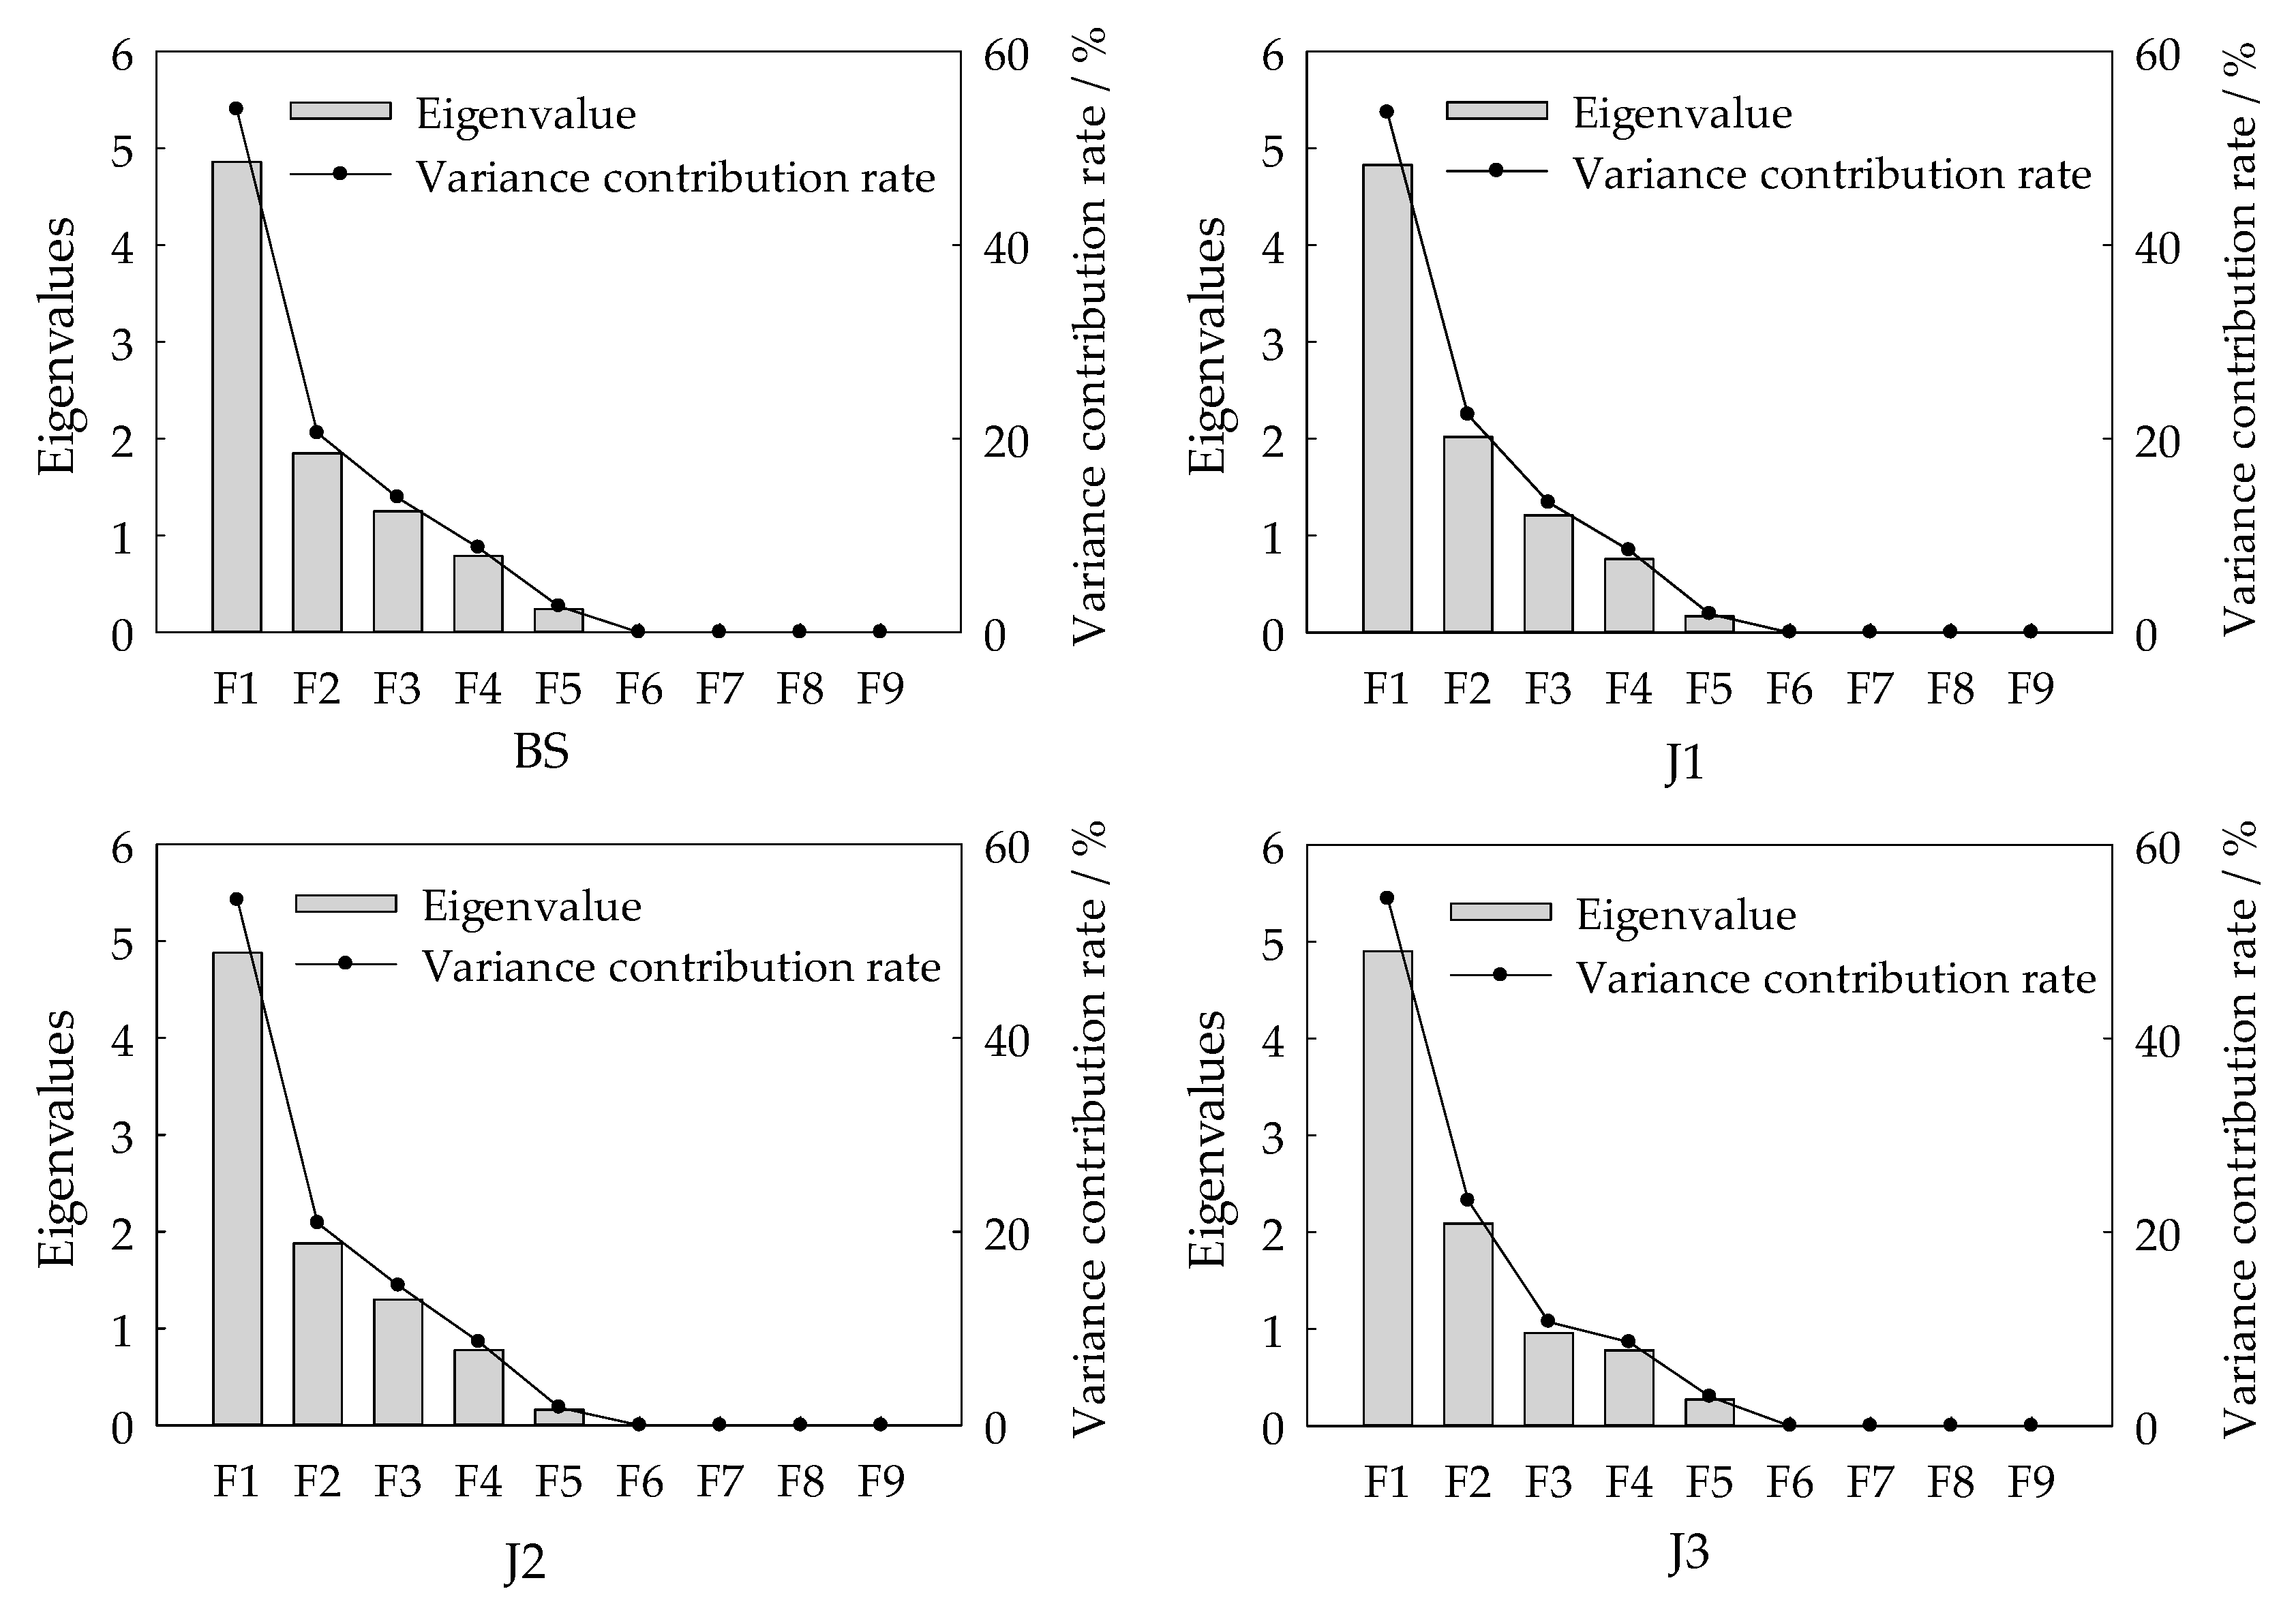
3.4. Major Factors Influencing Soil Evaporation in Different Freeze–Thaw Stages

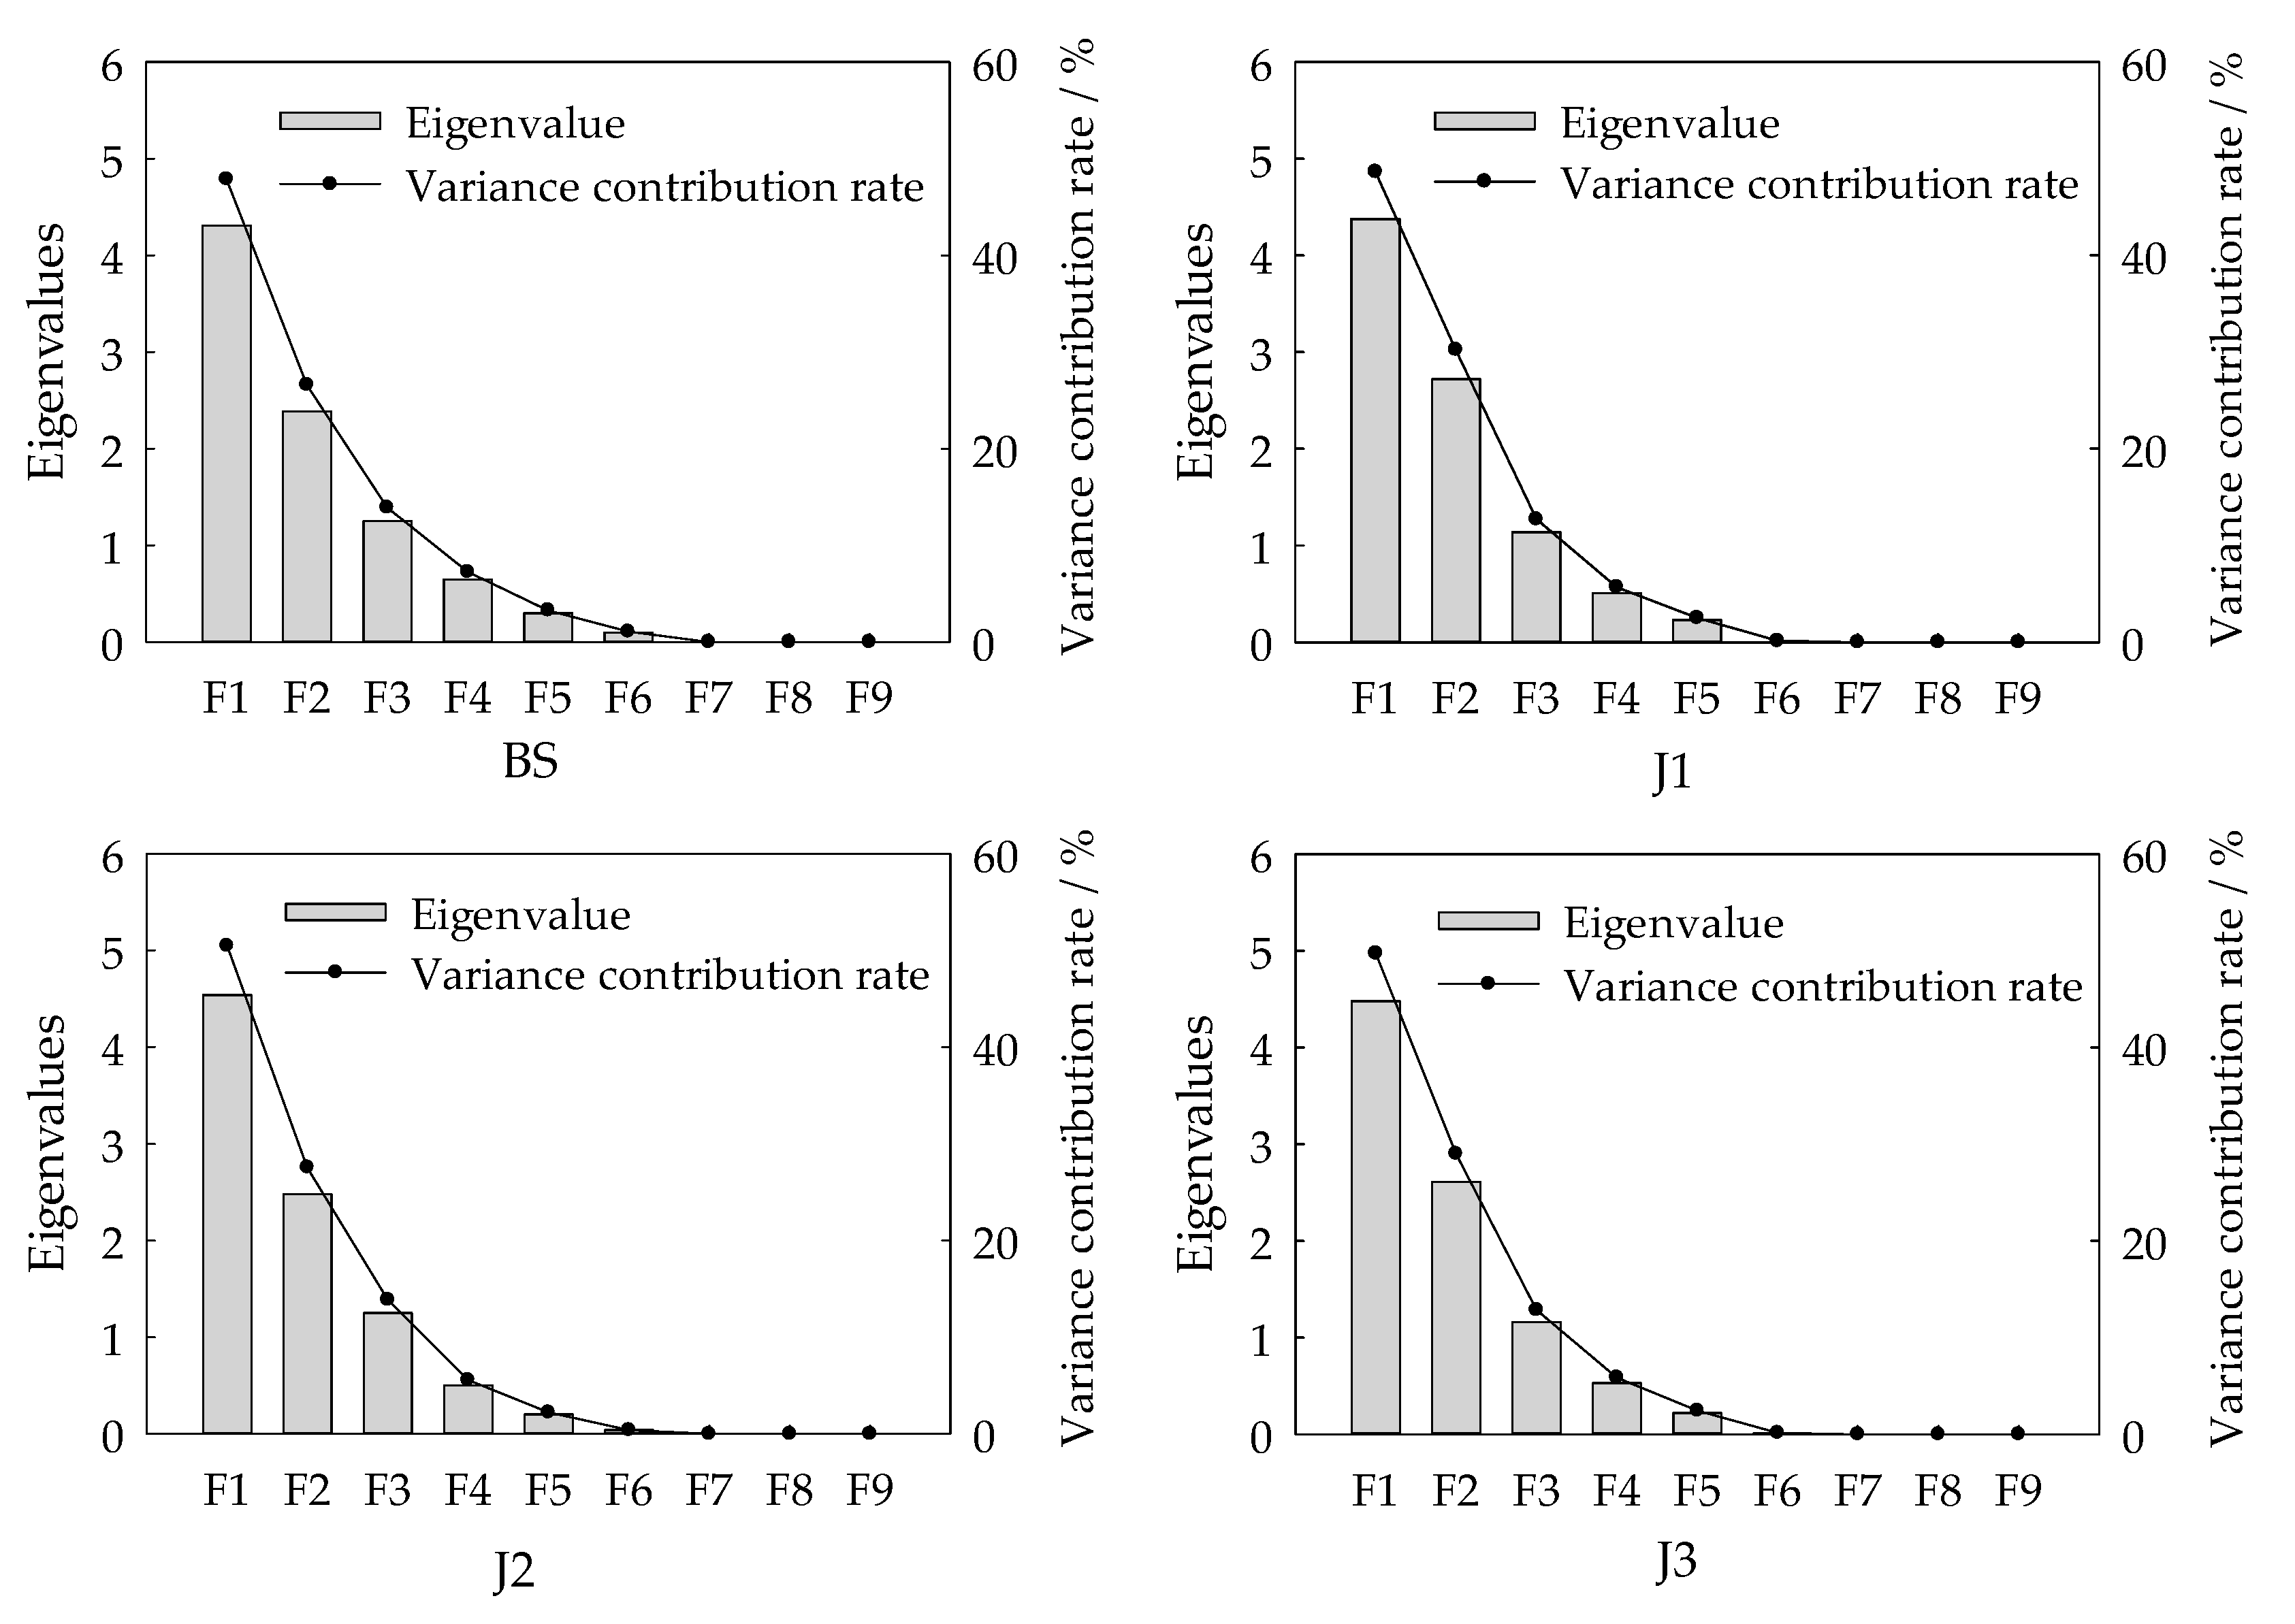
3.4.1. Principal Component Analysis

Principal component analysis (PCA) was used to study the major factors influencing soil evaporation under different mulch modes based on the field data during the freeze–thaw period using SPSS 19.0 [43,44]. PCA is a multivariate technique that can reduce the dimensions of factors for easy understanding and analysis of original data [45]. It transforms the original pieces of data, correlated with each other, into a set of values called principal components with minimal information loss [46]. Mathematically, PCA depends on eigenvector-based multivariate analysis, which can be done by eigenvalue decomposition of a data covariance matrix [47]. When the cumulative variance contribution is equal to or greater than 85% and the eigenvalue is more than 1, the former m principal components are selected to represent all information [39]. Meanwhile, the weight coefficient reveals the contribution of each factor to composing the principal component, and factors with large weight coefficients in the principal component are considered as the major factors.
During the seasonal freeze–thaw period, soil evaporation is affected by many factors, mainly solar radiation (x1), air temperature (x2), surface soil temperature (x3), surface soil water content (x4), wind speed (x5), vapor pressure (x6), relative humidity (x7), precipitation (x8), and water surface evaporation (x9). Thus, these nine factors were selected to analyze the level of influence on soil evaporation in this paper.

3.4.2. Unstable Freezing Stage

There was no precipitation in P1; therefore, eight factors were selected for PCA. The changes of eigenvalue and variance contribution rate are shown in Figure 7. For BS treatment, the former two principal components (F1 and F2), with a cumulative variance contribution rate of 88.87% (>85%) and eigenvalues greater than 1, could be used to replace all information. The principal component F1 for BS treatment explains 64.25% of the information of factors influencing soil evaporation, while F2 accounts for only 24.62%, significantly less than F1. Therefore, we chose F1 as the main principal component for BS treatment to analyze the major factors influencing soil evaporation. For J1, J2, and J3 treatments, analyzing in this manner, it was concluded that F1 could also be considered as the main principal component to represent all information of factors influencing soil evaporation in P1.
The weight coefficients of factors in F1 are shown in Table 3. The former three large coefficients of absolute values for BS treatment were surface soil temperature (x3), water surface evaporation (x9), and relative humidity (x7), which therefore could be considered as the major factors influencing soil evaporation for BS treatment in P1. Similarly, the major factors for J1 and J2 were surface soil temperature (x3), water surface evaporation (x9), and air temperature (x2); the major factors for J3 were surface soil temperature (x3), water surface evaporation (x9), and surface soil water content (x4).
It can be seen that the major factors for all treatments included both surface soil temperature and water surface evaporation. In P1, the soil began to freeze from the surface soil with lower soil temperature, and the transport of water vapor from the surface soil to the atmosphere was slowed, which further weakened the soil evaporation. In addition, the water surface evaporation indicated that in the environment for evaporation, the greater the water surface evaporation, the higher the soil evaporation rate. However, there were some differences in the major factors between straw mulch treatment and BS treatment. Relative humidity was the major factor for BS treatment, while it was not the major factor for straw-mulched soil. In addition, air temperature affected the heat flux changes directly, and together with the low thermal conductivity of straw mulch, less thermal energy could be absorbed or released by the surface soil under straw mulching with 100% coverage than that under mulching with 50% coverage or no mulching. The lower heat transfer decreased the thermal supply for soil evaporation directly. Thus air temperature was the other major factor for J1 and J2 treatments that influenced soil evaporation in P1, whereas air temperature was not a major factor for J3 treatment, and surface soil water content became the major factor.

3.4.3. Stable Freezing Stage

There was a little snow, which thawed the next day, during the stable freezing stage (P2); therefore, nine factors were selected for PCA. It can be noticed from Figure 8 that the former three principal components for BS treatment, with a cumulative contribution rate of 88.55% (>85%) and eigenvalues greater than 1, can represent all information of the factors influencing soil evaporation in P2. However, it is observed that F1 for BS treatment in P2 explained 54.02% of the information, while F2 and F3 accounted for only 20.60% and 13.93%, obtaining less information than F1. Therefore, we chose F1 as the main principal component for BS treatment to analyze the major factors influencing soil evaporation in P2. For J1, J2, and J3 treatments, analyzing in this way, F1 was found to also represent all information for analyzing the factors influencing soil evaporation.
The former three large coefficients of absolute values for BS treatment were the same with the J1 and J2 treatments, as shown in Table 4. It can be seen that the major factors influencing soil evaporation for BS, J1, and J2 treatments in P1 were solar radiation (x1), wind speed (x5), and relative humidity (x7), while for J3 treatment, the major factors were solar radiation (x1), relative humidity (x7), and water surface evaporation (x9).
The major factors for all treatments included both solar radiation and relative humidity. With reduced air temperature and increased cumulative surface soil negative temperature in P2, the concrete frozen layer hindered soil evaporation dramatically and became the main restriction of soil evaporation for all treatments; thus, solar radiation was the main source of soil heat absorption, and wind speed was the main driving force to promote heat transfer by convection at the near surface [48]. Therefore, solar radiation and wind speed were both important in influencing soil evaporation for all treatments in P2. Owing to the hindrance of the frozen layer in soil, the soil evaporated only in the form of water vapor. Under this circumstance, relative humidity became the major factor influencing soil evaporation externally, and the negative value indicates that relative humidity was negatively correlated with soil evaporation.

3.4.4. Thawing Stage

The changes of eigenvalues and variance contribution rates in P3 are presented in Figure 9. The former three components for BS treatment, with a cumulative variance contribution rate of 88.38% and eigenvalues greater than 1, represented all information of the factors influencing soil evaporation in P3. It can be also noticed that F1 for BS treatment explained 47.87% of all information, while F2 and F3 accounted for only 26.60% and 13.91%, obtaining less information than F1. Therefore, we chose F1 as the main principal component for BS treatment to analyze the major factors influencing soil evaporation in P3, and it was similar for J1, J2, and J3 treatments.
The former three factors with large coefficients of absolute values for BS treatment were solar radiation (x1), air temperature (x2), and vapor pressure (x6) as shown in Table 5, and for straw mulch treatments (J1, J2, and J3) they were solar radiation (x1), air temperature (x2), and surface soil temperature (x3).
The major factors for all treatments included solar radiation and air temperature. With rising solar radiation, the air temperature increased gradually and the frozen layer started to thaw, which facilitated the water exchange between surface soil and air environment, and further increased soil evaporation. Thus solar radiation and air temperature became the major factors influencing soil evaporation in P3 for all treatments. In P3, straw mulch delayed the thawing rate of surface soil because the soil temperature gradient and soil heat transfer under straw mulch were smaller than those for BS treatment [37]. The direct absorption of solar radiation by soil was hindered and the soil temperature rose slowly under straw mulching, so the surface soil temperature was the other major factor that influenced soil evaporation in J1, J2, and J3 treatments. For BS treatment, the decreased vapor pressure and increased saturation difference accelerated soil evaporation more than in mulching treatments, that is, the vapor pressure was the major factor, which was negatively correlated with soil evaporation.

4. Conclusions

This research explored the effects of different straw mulch modes on soil evaporation based on field experiments and analyzed the major factors influencing soil evaporation by the method of PCA during the freeze–thaw period.
Soil evaporation under different straw mulch modes was reduced effectively during the freeze–thaw period. The cumulative soil evaporation for J1, J2, and J3 treatments was 17.25 mm, 15.63 mm, and 18.11 mm, respectively, showing reductions of 32.1%, 38.4%, and 28.7% compared to the BS treatment. The effect of straw mulch on soil evaporation was obvious during the stable freezing period, and soil evaporation with straw mulch treatments was reduced by 49.0% to 58.8% compared to the BS treatment, while there was little difference in straw mulch treatments in the thawing stage. The relationship between cumulative soil evaporation under different straw mulch modes and time was well fitted by the power function.
There was a significant difference between the major factors influencing soil evaporation among the three freeze–thaw stages. In P1, the major factors influencing soil evaporation for all treatments were surface soil temperature and water surface evaporation, while in P2 they were solar radiation and relative humidity, and in P3 they were solar radiation and air temperature.
This study is of great significance for alleviating water shortages in arid and semi-arid regions during freeze–thaw periods. The effects of straw mulch on soil evaporation during freeze–thaw periods and the major influencing factors were recognized. The results are significant for addressing soil water storage and moisture conservation and for restraining the ineffective evaporation of soil water in arid and semi-arid areas.

Author Contributions

Conceptualization, J.C.; data curation, J.C.; formal analysis, J.C. and X.X.; investigation, J.X., C.M., and Q.D.; methodology, J.C. and X.Z.; resources, J.C. and X.Z.; supervision, X.Z.; writing—original draft, J.C., X.X., and C.M.; writing—review and editing, J.C., X.X., and Y.X.

Funding

This research was supported by the National Natural Science Foundation of China (Grant No. 41572239); the National Natural Youth Science Foundation of China (Grant No. 41502243), and the Natural Science Youth Foundation of Shanxi Province, China (Grant No. 2015021169).

Acknowledgments

Thanks Taigu Water Balance Experimental Station for supplying field experimental site and meteorological data.

Conflicts of Interest

The authors declare no conflicts of interest.

References

  1. Li, Y.; Liu, H.; Huang, G. Modeling resistance of soil evaporation and soil evaporation under straw mulching. Trans. Chin. Soc. Agric. Eng. 2015, 31, 98–106. [Google Scholar]
  2. Zribi, W.; Aragüés, R.; Medina, E.; Faci, J.M. Efficiency of inorganic and organic mulching materials for soil evaporation control. Soil Tillage Res. 2015, 148, 40–45. [Google Scholar] [CrossRef] [Green Version]
  3. Jalota, S.K. Evaporation through a soil mulch in relation to mulch characteristics and evaporativity. Aust. J. Soil Res. 1993, 31, 131–136. [Google Scholar] [CrossRef]
  4. Li, R.; Shi, H.; Flerchinger, G.N.; Akae, T.; Wang, C. Simulation of freezing and thawing soils in Inner Mongolia Hetao Irrigation District, China. Geoderma 2012, 173, 28–33. [Google Scholar] [CrossRef]
  5. Li, S.X.; Wang, Z.H.; Li, S.Q.; Gao, Y.J.; Tian, X.H. Effect of plastic sheet mulch, wheat straw mulch, and maize growth on water loss by evaporation in dry land areas of China. Agric. Water Manag. 2013, 116, 39–49. [Google Scholar] [CrossRef]
  6. Hou, X.; Wang, F.; Han, J.; Kang, S.; Feng, S. Duration of plastic mulch for potato growth under drip irrigation in an arid region of Northwest China. Agric. Meteorol. 2010, 150, 115–121. [Google Scholar] [CrossRef]
  7. Díaz, F.; Jiménez, C.C.; Tejedor, M. Influence of the thickness and grain size of tephra mulch on soil water evaporation. Agric. Water Manag. 2005, 74, 47–55. [Google Scholar] [CrossRef]
  8. Yuan, C.; Lei, T.; Mao, L.; Liu, H.; Wu, Y. Soil surface evaporation processes under mulches of different sized gravel. Catena 2009, 78, 117–121. [Google Scholar] [CrossRef]
  9. Chen, H.; Liu, J.; Zhang, A.; Chen, J.; Cheng, G.; Sun, B.; Pi, X.M.; Dyck, M.; Si, B.C.; Zhao, Y. Effects of straw and plastic film mulching on greenhouse gas emissions in Loess Plateau, China: A field study of 2 consecutive wheat-maize rotation cycles. Sci. Total Environ. 2016, 579, 814–824. [Google Scholar] [CrossRef]
  10. Li, Q.; Chen, Y.H.; Liu, M.Y.; Zhou, X.B.; Yu, S.L.; Dong, B.D. Effects of irrigation and straw mulching on microclimate characteristics and water use efficiency of winter wheat in north china. Plant Prod. Sci. 2008, 11, 161–170. [Google Scholar] [CrossRef]
  11. Unger, P.W. Evaporation reduction from soil with wheat, sorghum and cotton residue. Soil Sci. Soc. Am. J. 1976, 40, 938–942. [Google Scholar] [CrossRef]
  12. Jalota, S.K.; Prihar, S.S. Effect of straw mulch on evaporation reduction in relation to rates of mulching and evaporativity. J. Indian Soc. Soil Sci. 1990, 38, 728–730. [Google Scholar]
  13. Chen, S.; Chen, S.Y.; Zhang, X.Y.; Pei, D.; Sun, H.Y.; Chen, S.L. Effects of straw mulching on soil temperature, evaporation and yield of winter wheat: Field experiments on the North China Plain. Ann. Appl. Biol. 2010, 150, 261–268. [Google Scholar] [CrossRef]
  14. Lu, P.; Zhang, Z.; Feng, G.; Wan, C.; Shi, X. Effect of straw draining piece depth in soil on water-salt distribution in saline soil and its drainage-salt inhibiting performance. Trans. Chin. Soc. Agric. Eng. 2017, 33, 115–121. [Google Scholar]
  15. Zribi, W.; Faci, J.M.; Aragues, R. Mulching effects on moisture, temperature, structure and salinity of agricultural soils. Itea-Inf. Tec. Econ. Agrar. 2011, 107, 148–162. [Google Scholar]
  16. Doring, T.F.; Brandt, M.; Hes, J.; Finckh, M.R.; Saucke, H. Effects of straw mulch on soil nitrate dynamics, weeds, yield and soil erosion in organically grown potatoes. Field Crop. Res. 2005, 94, 238–249. [Google Scholar] [CrossRef]
  17. Huang, Y.; Chen, L.; Fu, B.; Huang, Z.; Gong, J. The wheat yields and water-use efficiency in the Loess Plateau: Straw mulch and irrigation effects. Agric. Water Manag. 2005, 72, 209–222. [Google Scholar] [CrossRef]
  18. Zhang, S.; Lovdahl, L.; Grip, H.; Jansson, P.; Tong, Y. Modelling the effects of mulching and fallow cropping on water balance in the Chinese Loess Plateau. Soil Tillage Res. 2007, 93, 283–298. [Google Scholar] [CrossRef]
  19. Chakraborty, D.; Garg, R.N.; Tomar, R.K.; Singh, R.; Sharma, S.K.; Singh, R.K.; Trivedi, S.M.; Mittal, R.B.; Sharma, P.K.; Kamble, K.H. Synthetic and organic mulching and nitrogen effect on winter wheat (Triticum aestivum L.) in a semi-arid environment. Agric. Water Manag. 2010, 97, 738–748. [Google Scholar] [CrossRef]
  20. Fu, X.; Wang, W.; Sainju, U.M.; Zhao, F.Z.; Liu, W.Z. Soil microbial community and carbon and nitrogen fractions responses to mulching under winter wheat. Appl. Soil Ecol. 2019, 139, 64–68. [Google Scholar] [CrossRef]
  21. Ram, H. Grain yield and water use efficiency of wheat (Triticum aestivum L.) in relation to irrigation levels and rice straw mulching in North West India. Agric. Water Manag. 2013, 128, 92–101. [Google Scholar] [CrossRef]
  22. Ramakrishna, A.; Tam, H.M.; Wani, S.P.; Long, T.D. Effect of mulch on soil temperature, moisture, weed infestation and yield of groundnut in northern Vietnam. Field Crop. Res. 2006, 95, 115–125. [Google Scholar] [CrossRef] [Green Version]
  23. Rahman, M.A.; Chikushi, J.; Saifizzaman, M.; Lauren, J.G. Rice straw mulching and nitrogen response of no-till wheat following rice in bangladesh. Field Crop. Res. 2005, 91, 71–81. [Google Scholar] [CrossRef]
  24. Singh, B.; Humphreys, E.; Eberbach, P.L.; Katupitiya, A.; Singh, Y.; Kukal, S.S. Growth, yield and water productivity of zero till wheat as affected by rice straw mulch and irrigation schedule. Field. Crop. Res. 2011, 121, 209–225. [Google Scholar] [CrossRef]
  25. Cao, J.; Liu, C.; Zhang, W.; Guo, Y. Effect of integrating straw into agricultural soils on soil infiltration and evaporation. Water Sci. Technol. 2012, 65, 2213–2218. [Google Scholar] [CrossRef] [PubMed]
  26. Chen, J.F.; Zheng, X.Q.; Zang, H.F. Effects of irrigation on soil temperature and soil freeze-thaw characteristics during seasonal freeze-thaw period. Trans. Chin. Soc. Agric. Mach. 2013, 44, 104–109. [Google Scholar]
  27. Singh, B.; Eberbach, P.L.; Humphreys, E.; Kukal, S.S. The effect of rice straw mulch on evapotranspiration, transpiration and soil evaporation of irrigated wheat in punjab, India. Agric. Water Manag. 2011, 98, 1847–1855. [Google Scholar] [CrossRef]
  28. Cai, T.; Zhang, C.; Huang, Y.; Huang, H.; Jia, Z. Effects of different straw mulch modes on soil water storage and water use efficiency of spring maize (Zea mays L.) in the Loess Plateau of China. Plant. Soil Environ. 2015, 61, 253–259. [Google Scholar] [CrossRef]
  29. Zhang, S.; Yang, X.; Lovdahl, L. Soil management practice effect on water balance of a dry land soil during fallow period on the Loess Plateau of China. Soil Water Res. 2016, 11, 64–73. [Google Scholar] [CrossRef]
  30. Li, S.; Li, Y.; Lin, H.; Feng, H.; Dyck, M. Effects of different mulching technologies on evapotranspiration and summer maize growth. Agric. Water Manag. 2017, 201, 309–318. [Google Scholar] [CrossRef]
  31. Zhao, H.B.; Liu, J.F.; Chen, X.W.; Wang, Z.H. Straw mulch as an alternative to plastic film mulch: Positive evidence from dryland wheat production on the Loess Plateau. Sci. Total Environ. 2019, 676, 782–791. [Google Scholar] [CrossRef] [PubMed]
  32. Bunna, S.; Sinath, P.; Makara, O.; Mitchell, J.; Fukai, S. Effects of straw mulch on mungbean yield in rice fields with strongly compacted soils. Field Crop. Res. 2011, 124, 295–301. [Google Scholar] [CrossRef]
  33. Xu, X.Z.; Wang, J.C.; Zhang, L.X. Frozen Soil Physics; Science Press: Beijing, China, 2001. [Google Scholar]
  34. Yi, J.; Zhao, Y.; Shao, M.A.; Zhang, J.; Cui, L.; Si, B. Soil freezing and thawing processes affected by the different landscapes in the middle reaches of Heihe River Basin, Gansu, China. J. Hydrol. 2014, 519, 1328–1338. [Google Scholar] [CrossRef]
  35. Zhao, Y.; Huang, M.; Horton, R.; Liu, F.; Peth, S.; Horn, R. Influence of winter grazing on water and heat flow in seasonally frozen soil of Inner Mongolia. Vadose Zone J. 2013, 12, 1–11. [Google Scholar] [CrossRef]
  36. Chen, J.F.; Zheng, X.Q.; Qin, Z.D.; Liu, P.; Zang, H.F.; Sun, M. Effects of maize straw mulch on spatiotemporal variation of soil profile moisture and temperature during freeze-thaw period. Trans. Chin. Soc. Agric. Eng. 2013, 29, 102–110. [Google Scholar]
  37. Fu, Q.; Yan, P.R.; Li, T.X.; Cui, S.; Peng, L. Effects of straw mulching on soil evaporation during the soil thawing period in a cold region in northeastern China. J. Earth Syst. Sci. 2018, 127, 33. [Google Scholar] [CrossRef] [Green Version]
  38. Fuchs, M.; Hadas, A. Mulch resistance to water vapor transport. Agric. Manag. Water 2011, 98, 990–998. [Google Scholar] [CrossRef]
  39. Feng, H.; Chen, J.; Zheng, X.; Xue, J.; Miao, C.; Du, Q.; Xu, Y. Effect of sand mulches of different particle sizes on soil evaporation during the freeze–thaw period. Water 2018, 10, 536. [Google Scholar] [CrossRef]
  40. Chen, J.F.; Gao, X.G.; Zheng, X.Q.; Miao, C.Y.; Liu, P.; Du, Q.; Xu, Y.X. Transformation between phreatic water and soil water during freeze–thaw periods. Water 2018, 10, 376. [Google Scholar] [CrossRef]
  41. Miao, C.Y.; Chen, J.F.; Zheng, X.Q.; Zhang, Y.B.; Xu, Y.X.; Du, Q. Soil Water and phreatic evaporation in shallow groundwater during a freeze–thaw period. Water 2017, 9, 396. [Google Scholar] [CrossRef]
  42. Longobardi, A.; Khaertdinova, E. Relating soil moisture and air temperature to evapotranspiration fluxes during inter-storm periods at a Mediterranean experimental site. J. Arid Land 2015, 7, 27–36. [Google Scholar] [CrossRef]
  43. Santos, J.S.; Oliveira, E.; Bruns, R.E.; Gennari, R.F. Evaluation of the salt accumulation process during inundation in water resource of Contas river basin (Bahia–Brazil) applying principal component analysis. Water Res. 2004, 38, 1579–1585. [Google Scholar] [CrossRef] [PubMed]
  44. Cadavid, A.C.; Lawrence, J.K.; Ruzmaikin, A. Principal Components and independent component analysis of solar and space data. Sol. Phys. 2008, 248, 247–261. [Google Scholar] [CrossRef]
  45. Meng, L.; Zuo, R.; Wang, J.S.; Yang, J.; Teng, Y.G.; Shi, R.T.; Zhai, Y.Z. Apportionment and evolution of pollution sources in a typical riverside groundwater resource area using PCA-APCS-MLR model. J. Contam. Hydrol. 2018, 218, 70–83. [Google Scholar] [CrossRef] [PubMed]
  46. Garcia, D.P.; Caraschi, J.C.; Ventorim, G.; Vieira, F.H.; Protasio, T.D. Assessment of plant biomass for pellet production using multivariate statistics (PCA and HCA). Renew. Energy 2019, 139, 796–805. [Google Scholar] [CrossRef]
  47. Uddin, M.N.; Islam, A.K.; Bala, S.K.; Islam, G.M.; Adhikary, S.; Saha, D.; Akter, R. Mapping of climate vulnerability of the coastal region of Bangladesh using principal component analysis. Appl. Geogr. 2019, 102, 47–57. [Google Scholar] [CrossRef]
  48. Davarzani, H.; Smits, K.; Tolene, R.M.; Illangasekare, T. Study of the effect of wind speed on evaporation from soil through integrated modeling of the atmospheric boundary layer and shallow subsurface. Water Resour. Res. 2014, 50, 661–680. [Google Scholar] [CrossRef] [Green Version]
Figure 1. Location of Taigu Water Balance Experimental Station (a) Taigu experimental station; (b) automatic weather station.
Water 11 01689 g001
Figure 2. Schematic diagram of experimental design: (a) experimental layout; (b) surface treatments of micro-lysimeters. BS, bare soil.
Water 11 01689 g002
Figure 3. Soil freezing and thawing process from November 2017 to March 2018.
Water 11 01689 g003
Figure 4. Soil evaporation with different straw mulch modes in three freeze–thaw stages.
Water 11 01689 g004
Figure 5. Soil evaporation rate with different straw mulch modes in three freeze–thaw stages.
Water 11 01689 g005
Figure 6. Cumulative soil evaporation during the freeze–thaw period.
Water 11 01689 g006
Figure 7. Variance contribution rate and eigenvalues in P1.
Water 11 01689 g007
Figure 8. Variance contribution rate and eigenvalues in P2.
Water 11 01689 g008
Figure 9. Variance contribution rates and eigenvalues in P3.
Water 11 01689 g009
Table 1. Properties of soils in micro-lysimeters.
Soil Depth (cm)Bulk Density (g·cm−3)Particle Size Distribution
Clay (%)Silt (%)Sand (%)
0–301.410.829.0791.22
30–601.411.2714.8486.61
60–801.410.8813.4690.55
80–1001.410.417.0695.57
Table 2. Fitting equation analysis of cumulative evaporation and time for different straw mulch modes.
TreatmentE = a + btE = aebtE = atb
abR2abR2AbR2
BS1.7650.1620.973.4870.0160.870.3780.8410.99
J11.9890.0990.963.0010.0130.860.4730.7000.98
J21.4330.0930.972.5490.0140.880.3880.7190.98
J32.1010.1040.963.1410.0130.840.4840.7070.98
Table 3. Weight coefficients of factors in F1 during the unstable freezing stage (P1).
FactorsTreatment
BSJ1J2J3
solar radiation (x1)0.270.250.30.25
air temperature (x2)0.370.390.390.35
surface soil temperature (x3)0.430.440.420.41
surface soil water content (x4)−0.290.20.340.38
wind speed (x5)0.30.270.250.29
vapor pressure (x6)0.350.390.370.34
relative humidity (x7)−0.38−0.38−0.35−0.37
precipitation (x8)////
water surface evaporation (x9)0.410.430.390.4
Table 4. Weight coefficient of factors in F1 during the stable freezing stage (P2).
FactorsTreatment
BSJ1J2J3
solar radiation (x1)0.410.410.430.4
air temperature (x2)−0.23−0.22−0.26−0.19
surface soil temperature (x3)0.190.190.160.22
surface soil water content (x4)−0.33−0.34−0.36−0.35
wind speed (x5)0.420.40.410.4
vapor pressure (x6)0.320.30.340.3
relative humidity (x7)−0.42−0.42−0.40−0.42
precipitation (x8)−0.18−0.21−0.16−0.20
water surface evaporation (x9)0.390.40.370.41
Table 5. Weight coefficient of factors in F1 during the thawing stage (P3).
FactorsTreatment
BSJ1J2J3
solar radiation (x1)0.450.450.420.43
air temperature (x2)0.470.470.460.46
surface soil temperature (x3)0.380.420.40.39
surface soil water content (x4)0.170.150.270.25
wind speed (x5)0.20.160.120.15
vapor pressure (x6)−0.39−0.37−0.34−0.35
relative humidity (x7)0.280.250.260.26
precipitation (x8)0.160.190.230.21
water surface evaporation (x9)0.330.350.360.35

