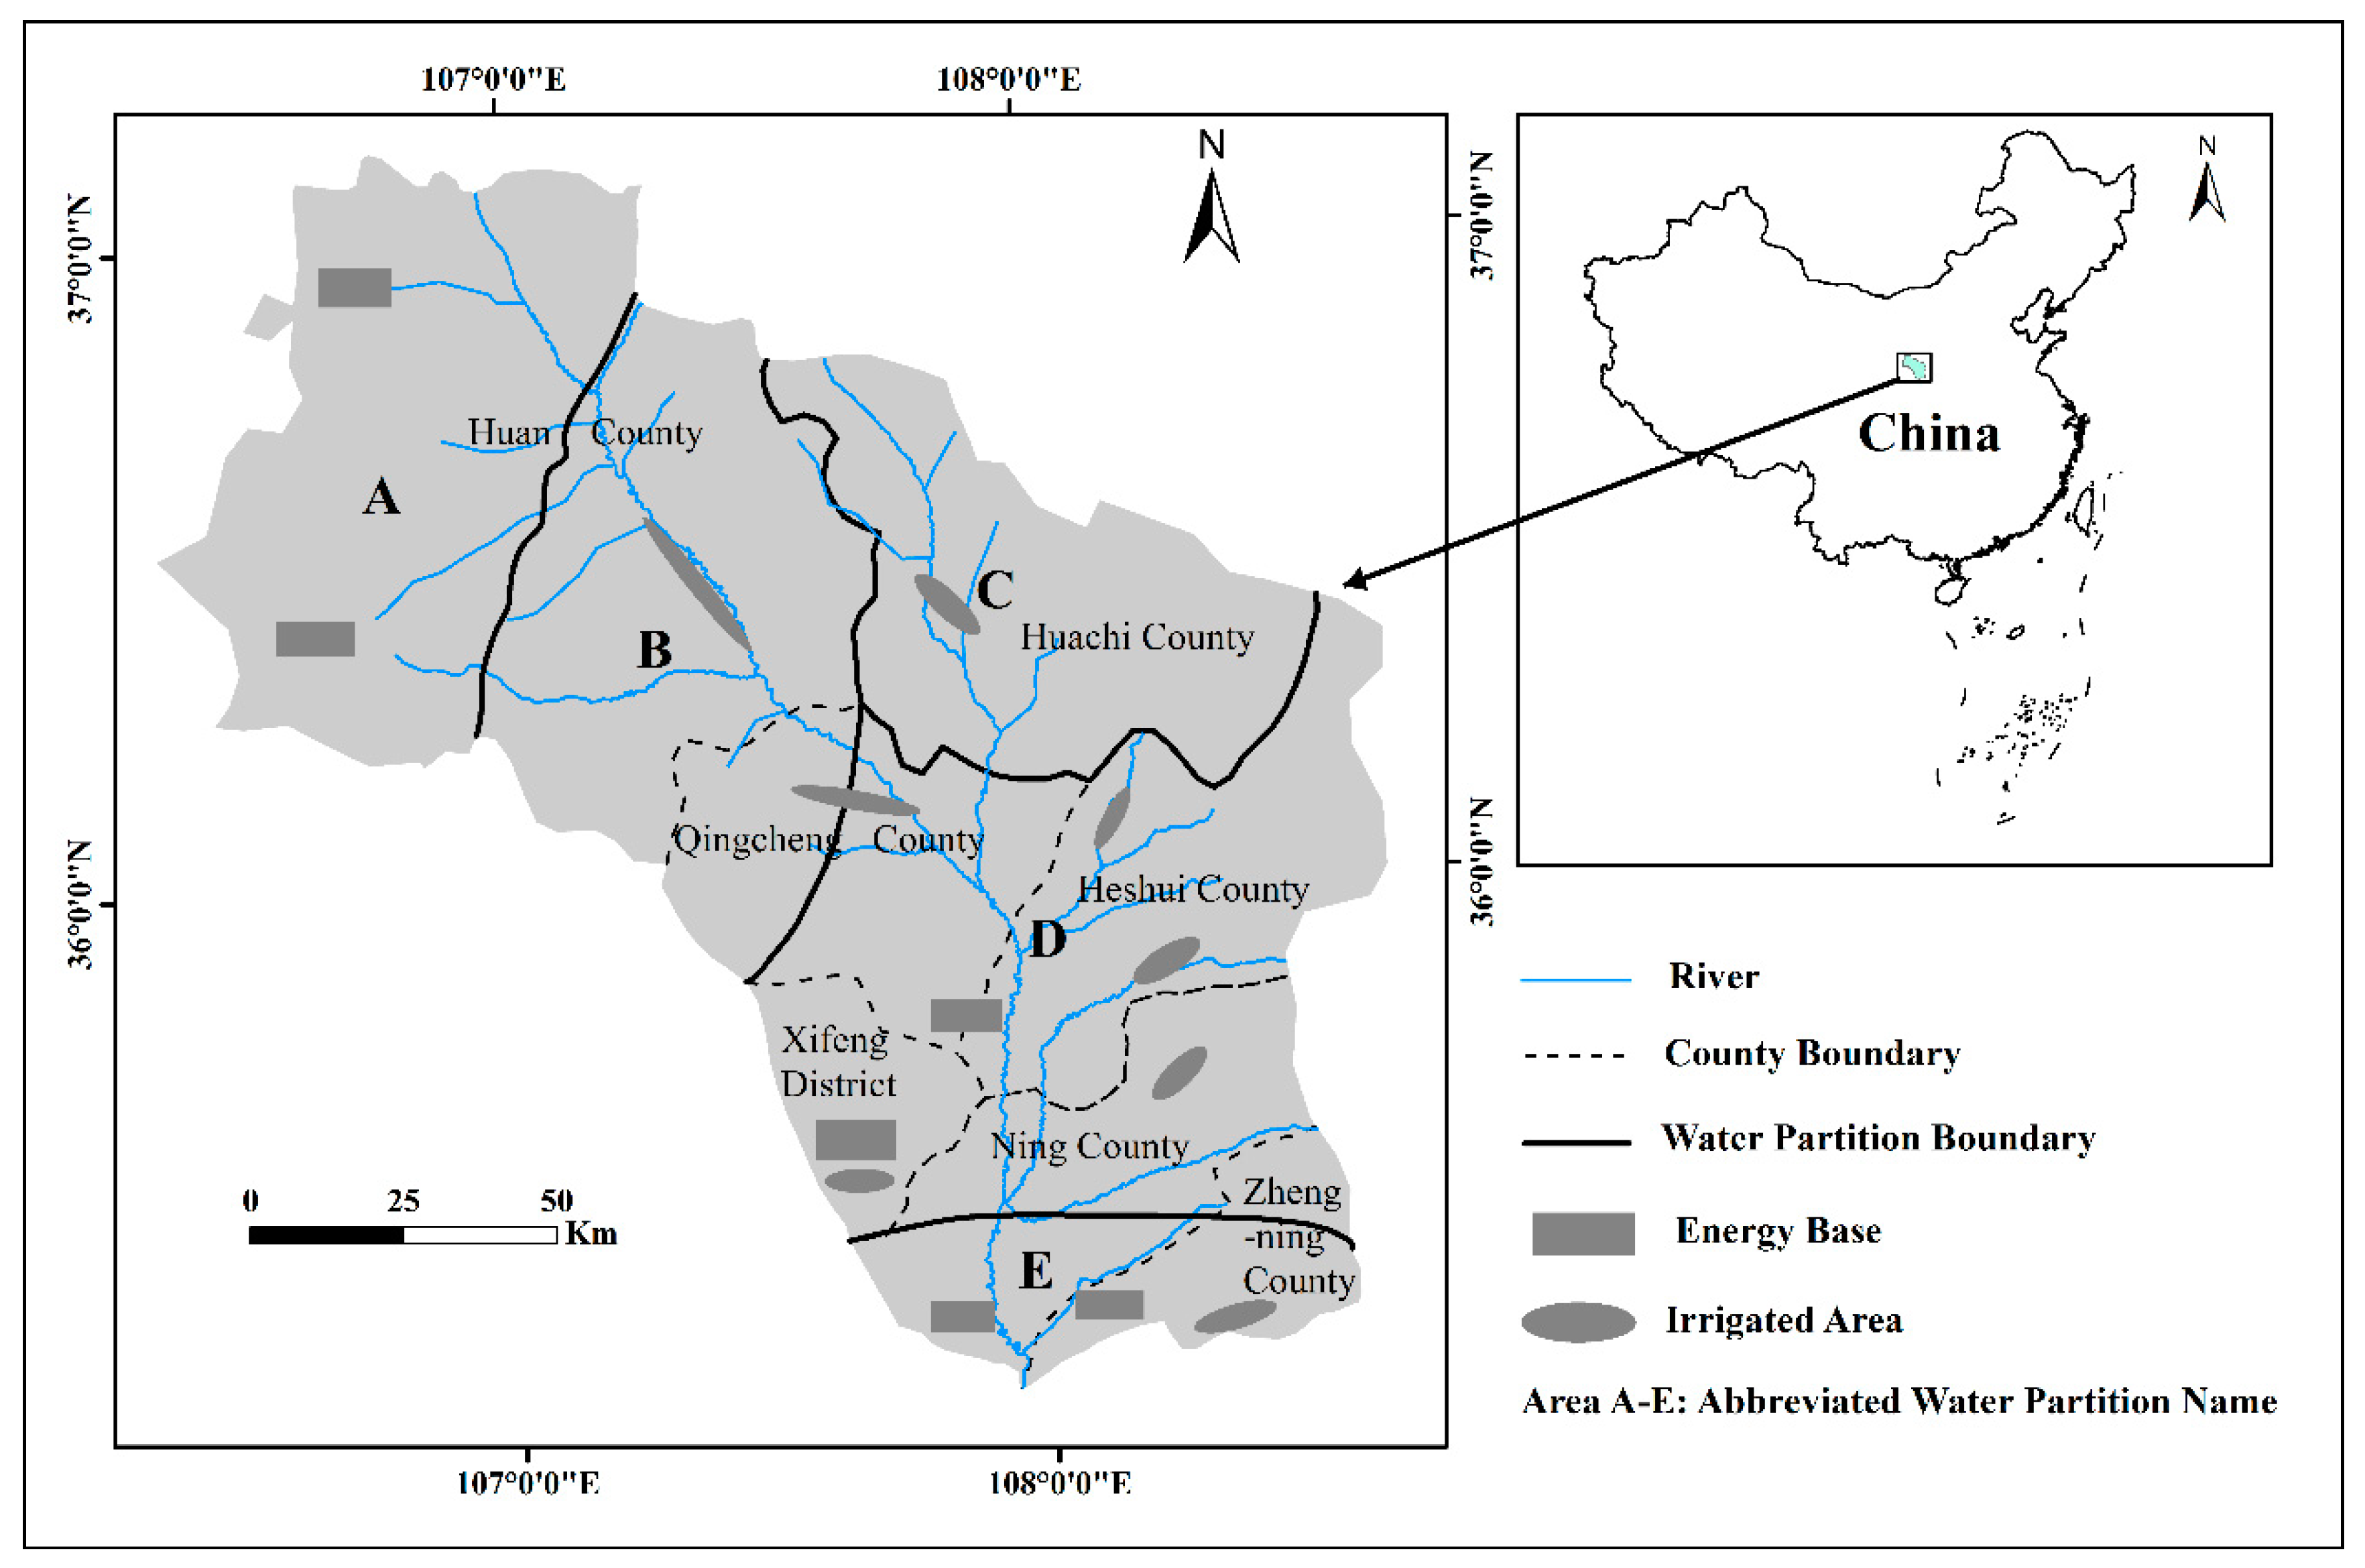
Figure 1.
Water resource partitions and locations in Malian River Basin (Pastoral Energy Industry Partition, Farming-Pastoral Industrial Development Partition, Ecological Agriculture Preserved Partition, Sustainable Development for Petroleum and Coal Industry Partition, and Preserved Partition for Ecological Agriculture and Sustainable Coal Industry Development Partition were abbreviated as A–E in the figure).
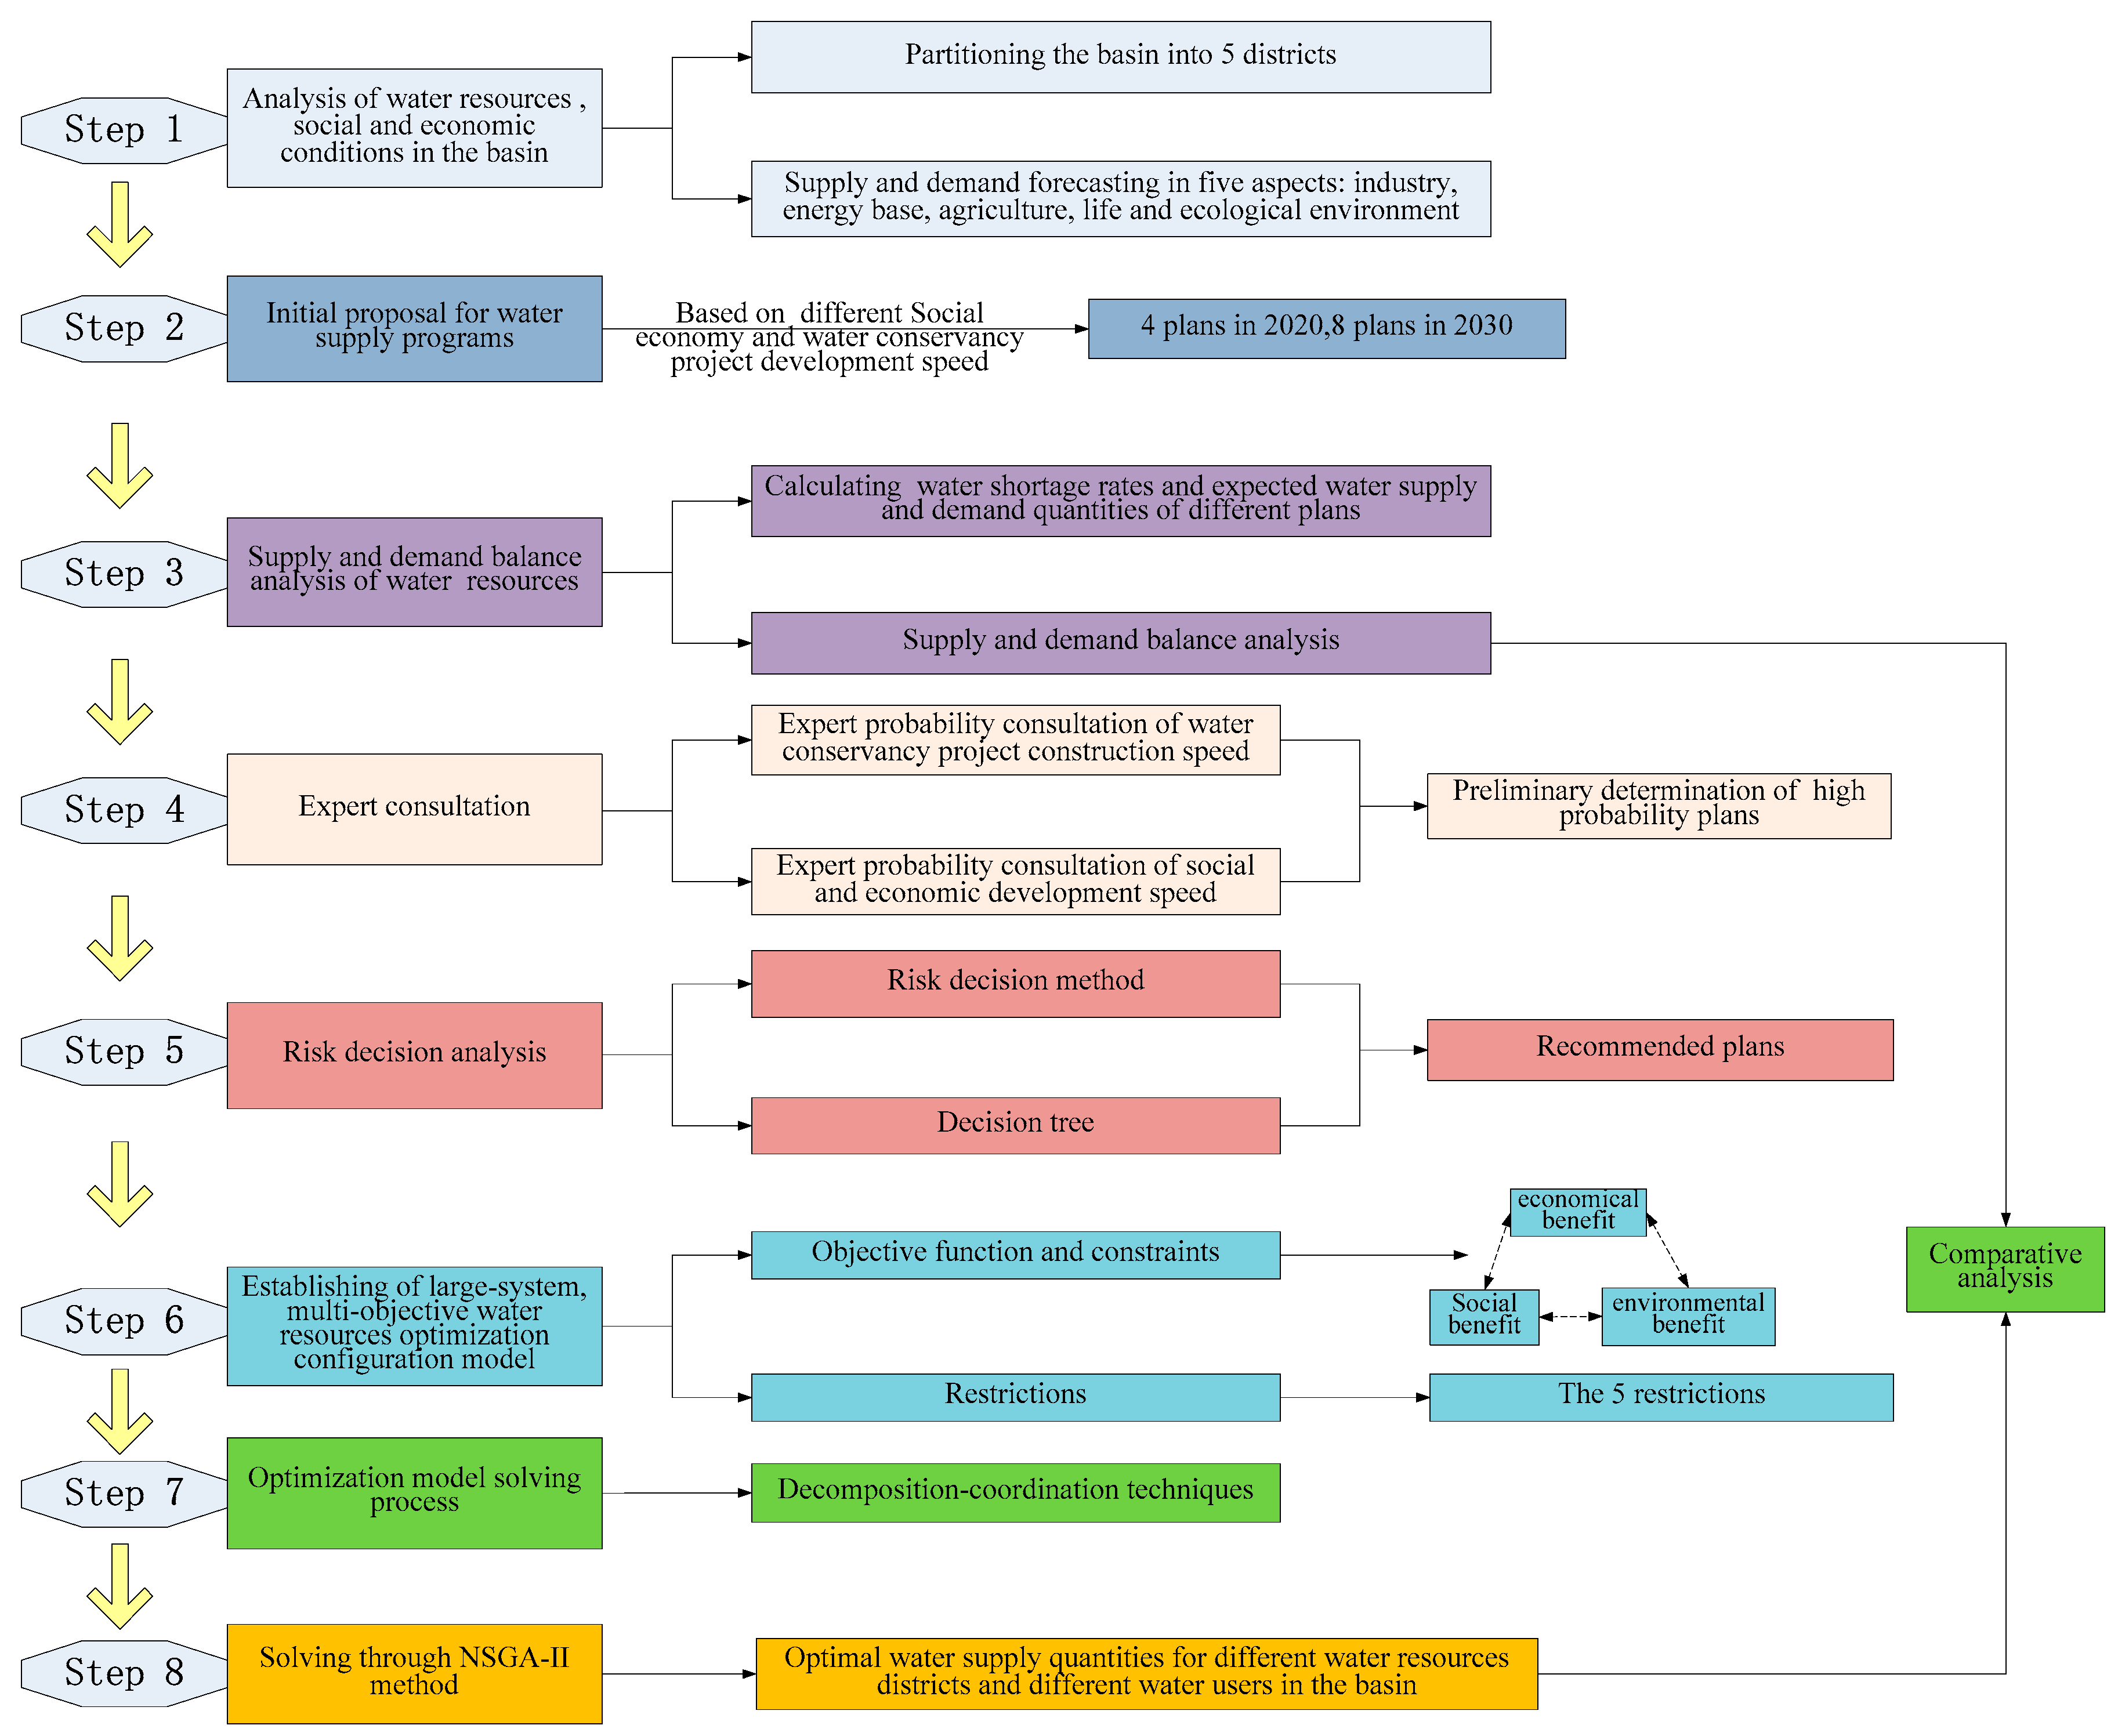
Figure 2.
Research steps and framework.
Figure 2.
Research steps and framework.
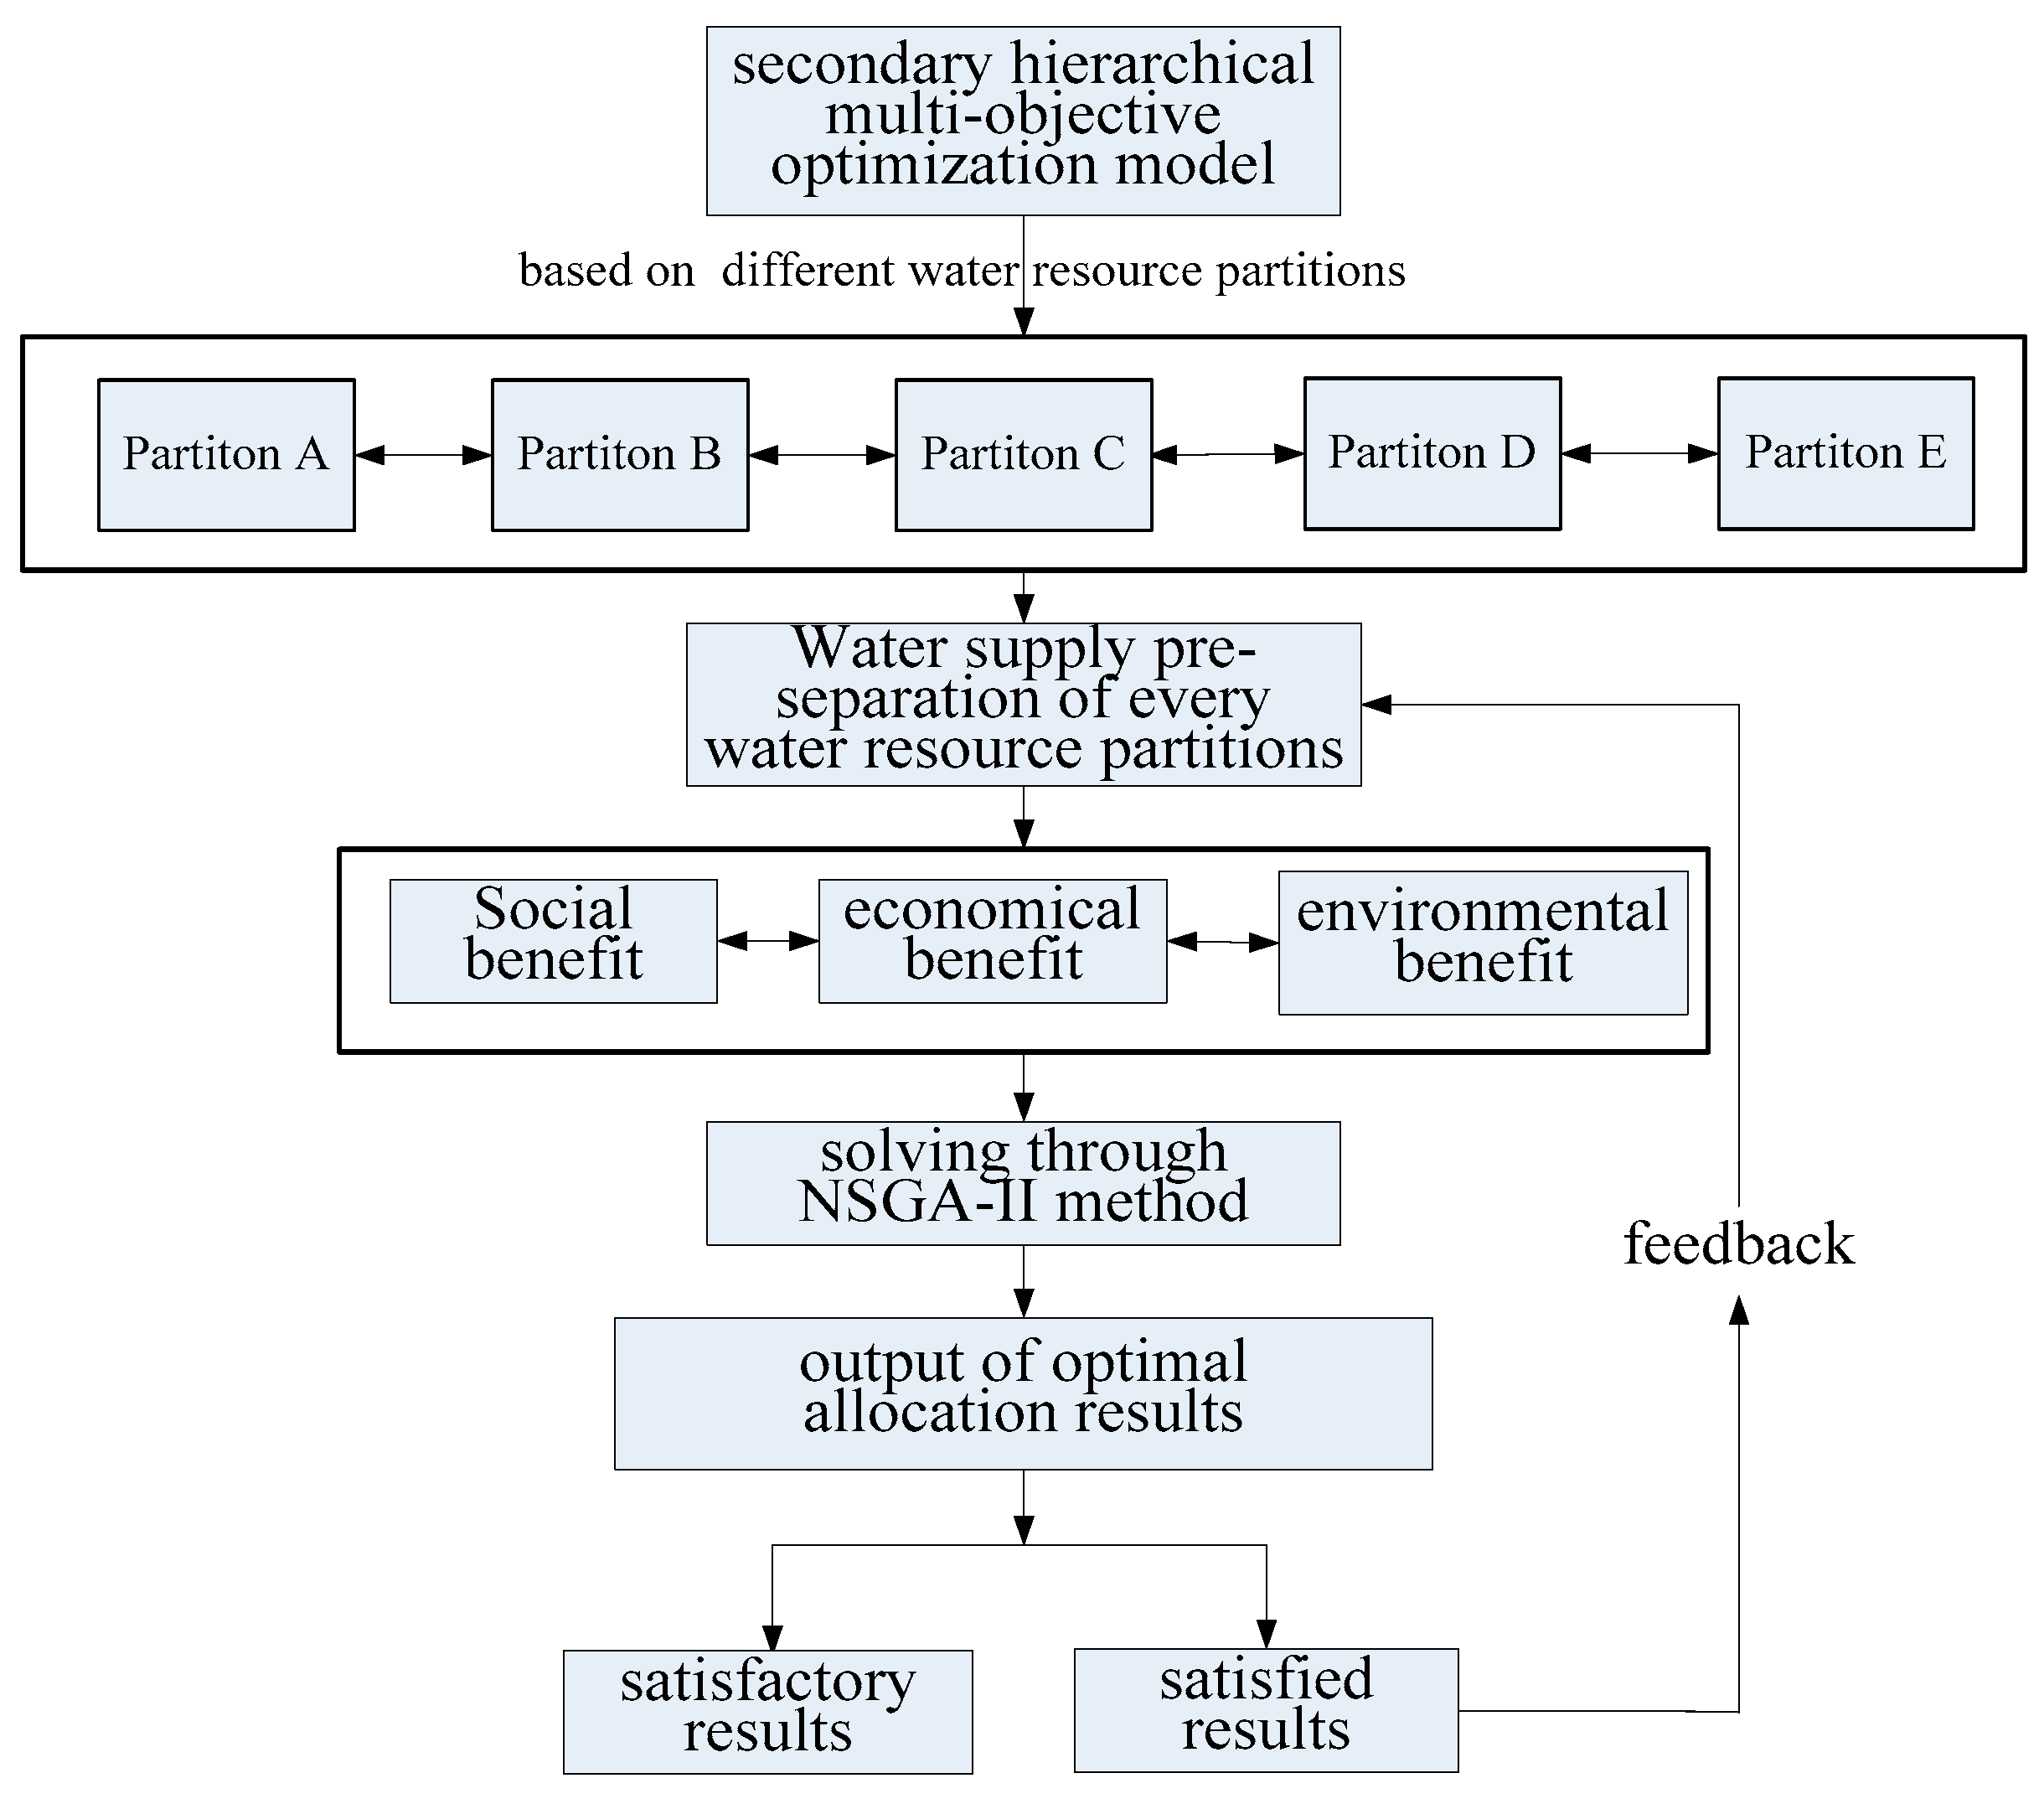
Figure 3.
Model optimization and solution process (In the figure, Pastoral Energy Industry Partition, Farming-Pastoral Industrial Development Partition, Ecological Agriculture Preserved Partition, Sustainable Development for Petroleum and Coal Industry Partition and Preserved Partition for Ecological Agriculture and Sustainable Coal Industry Development Partition are abbreviated as A–E).
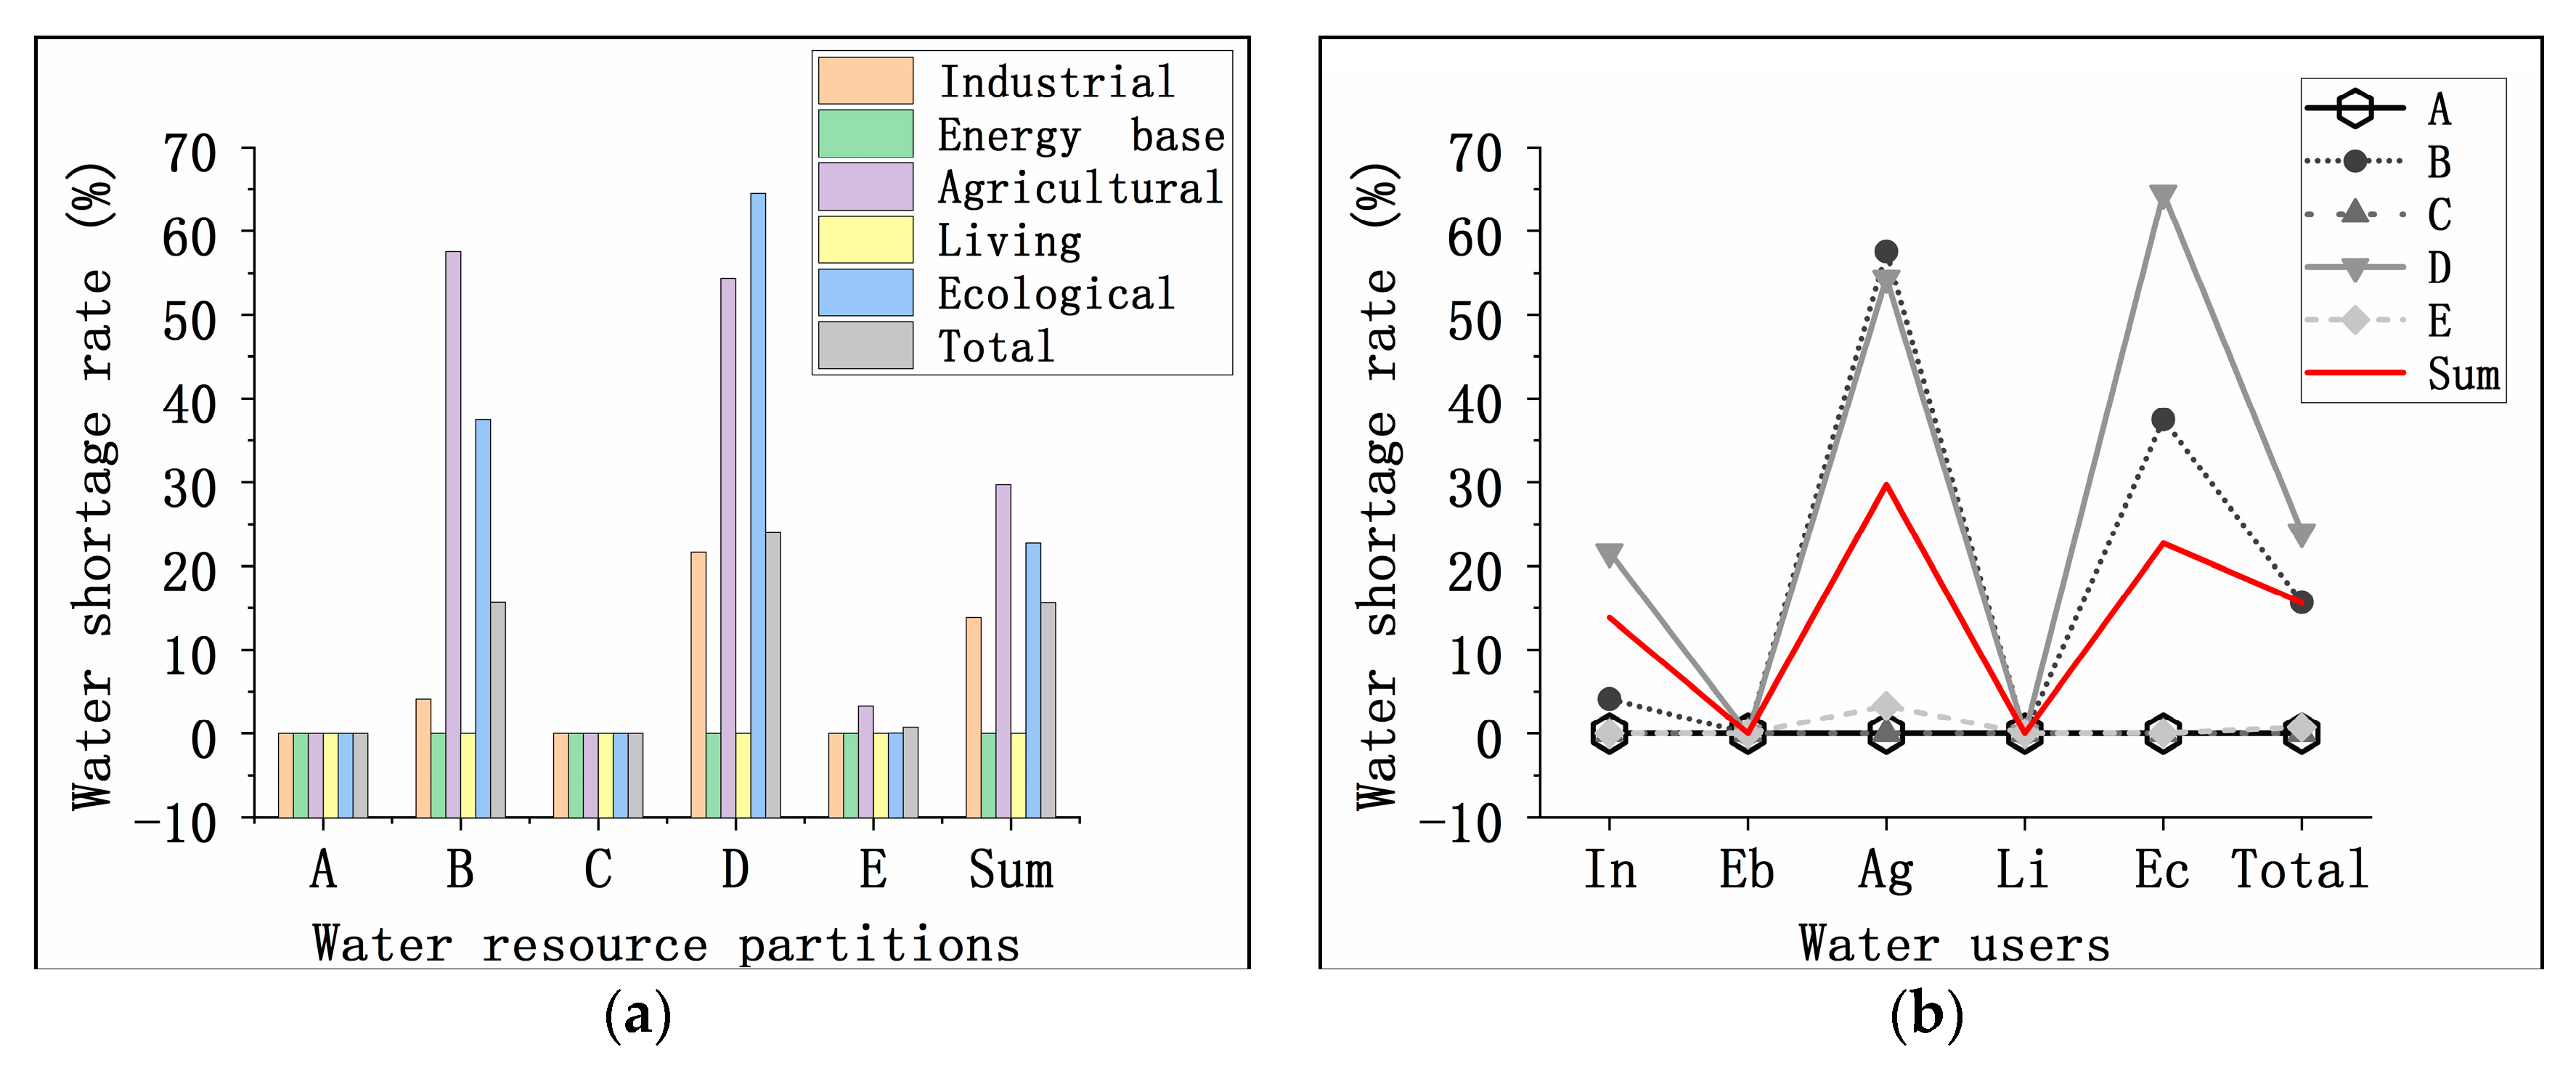
Figure 4.
(a) Different water resource partitions, (b) different water users’ water shortage rate analysis chart of weights distribution method (In the figure, Pastoral Energy Industry Partition, Farming-Pastoral Industrial Development Partition, Ecological Agriculture Preserved Partition, Sustainable Development for Petroleum and Coal Industry Partition, and Preserved Partition for Ecological Agriculture and Sustainable Coal Industry Development Partition were abbreviated as A–E; Industrial, Energy base, Agricultural, Living and Ecological were abbreviated as In, Eb, Ag, Li, and Ec).
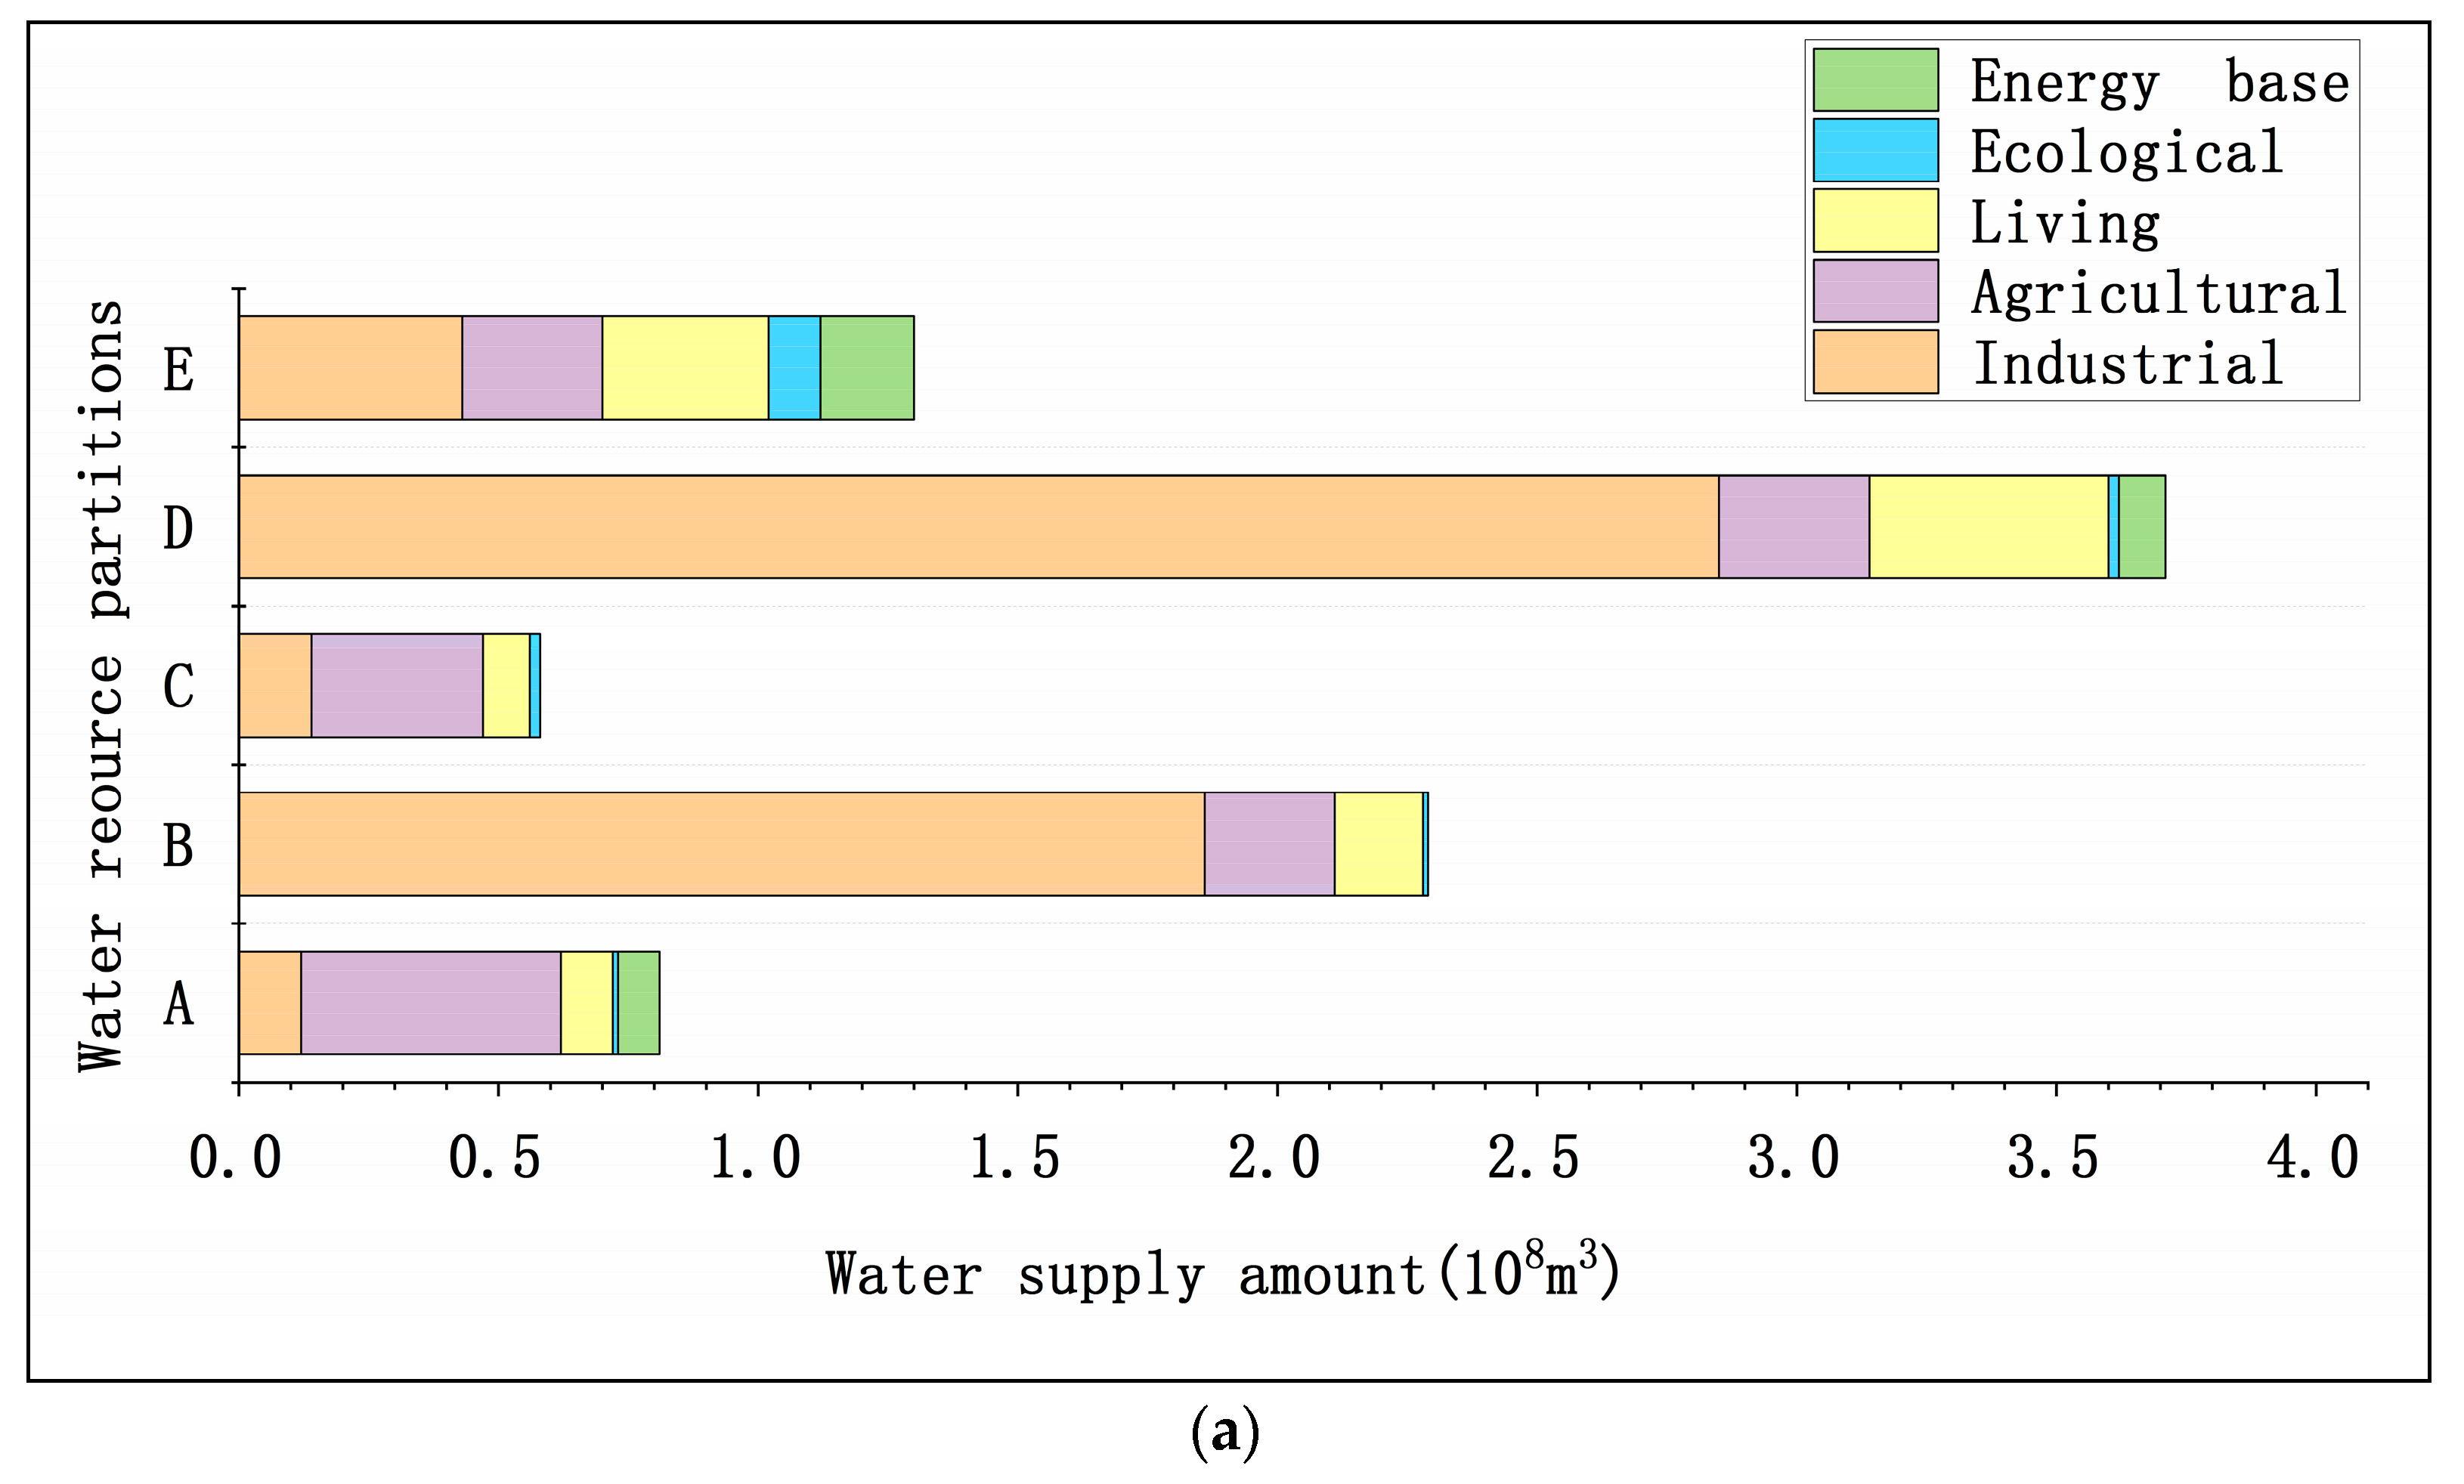
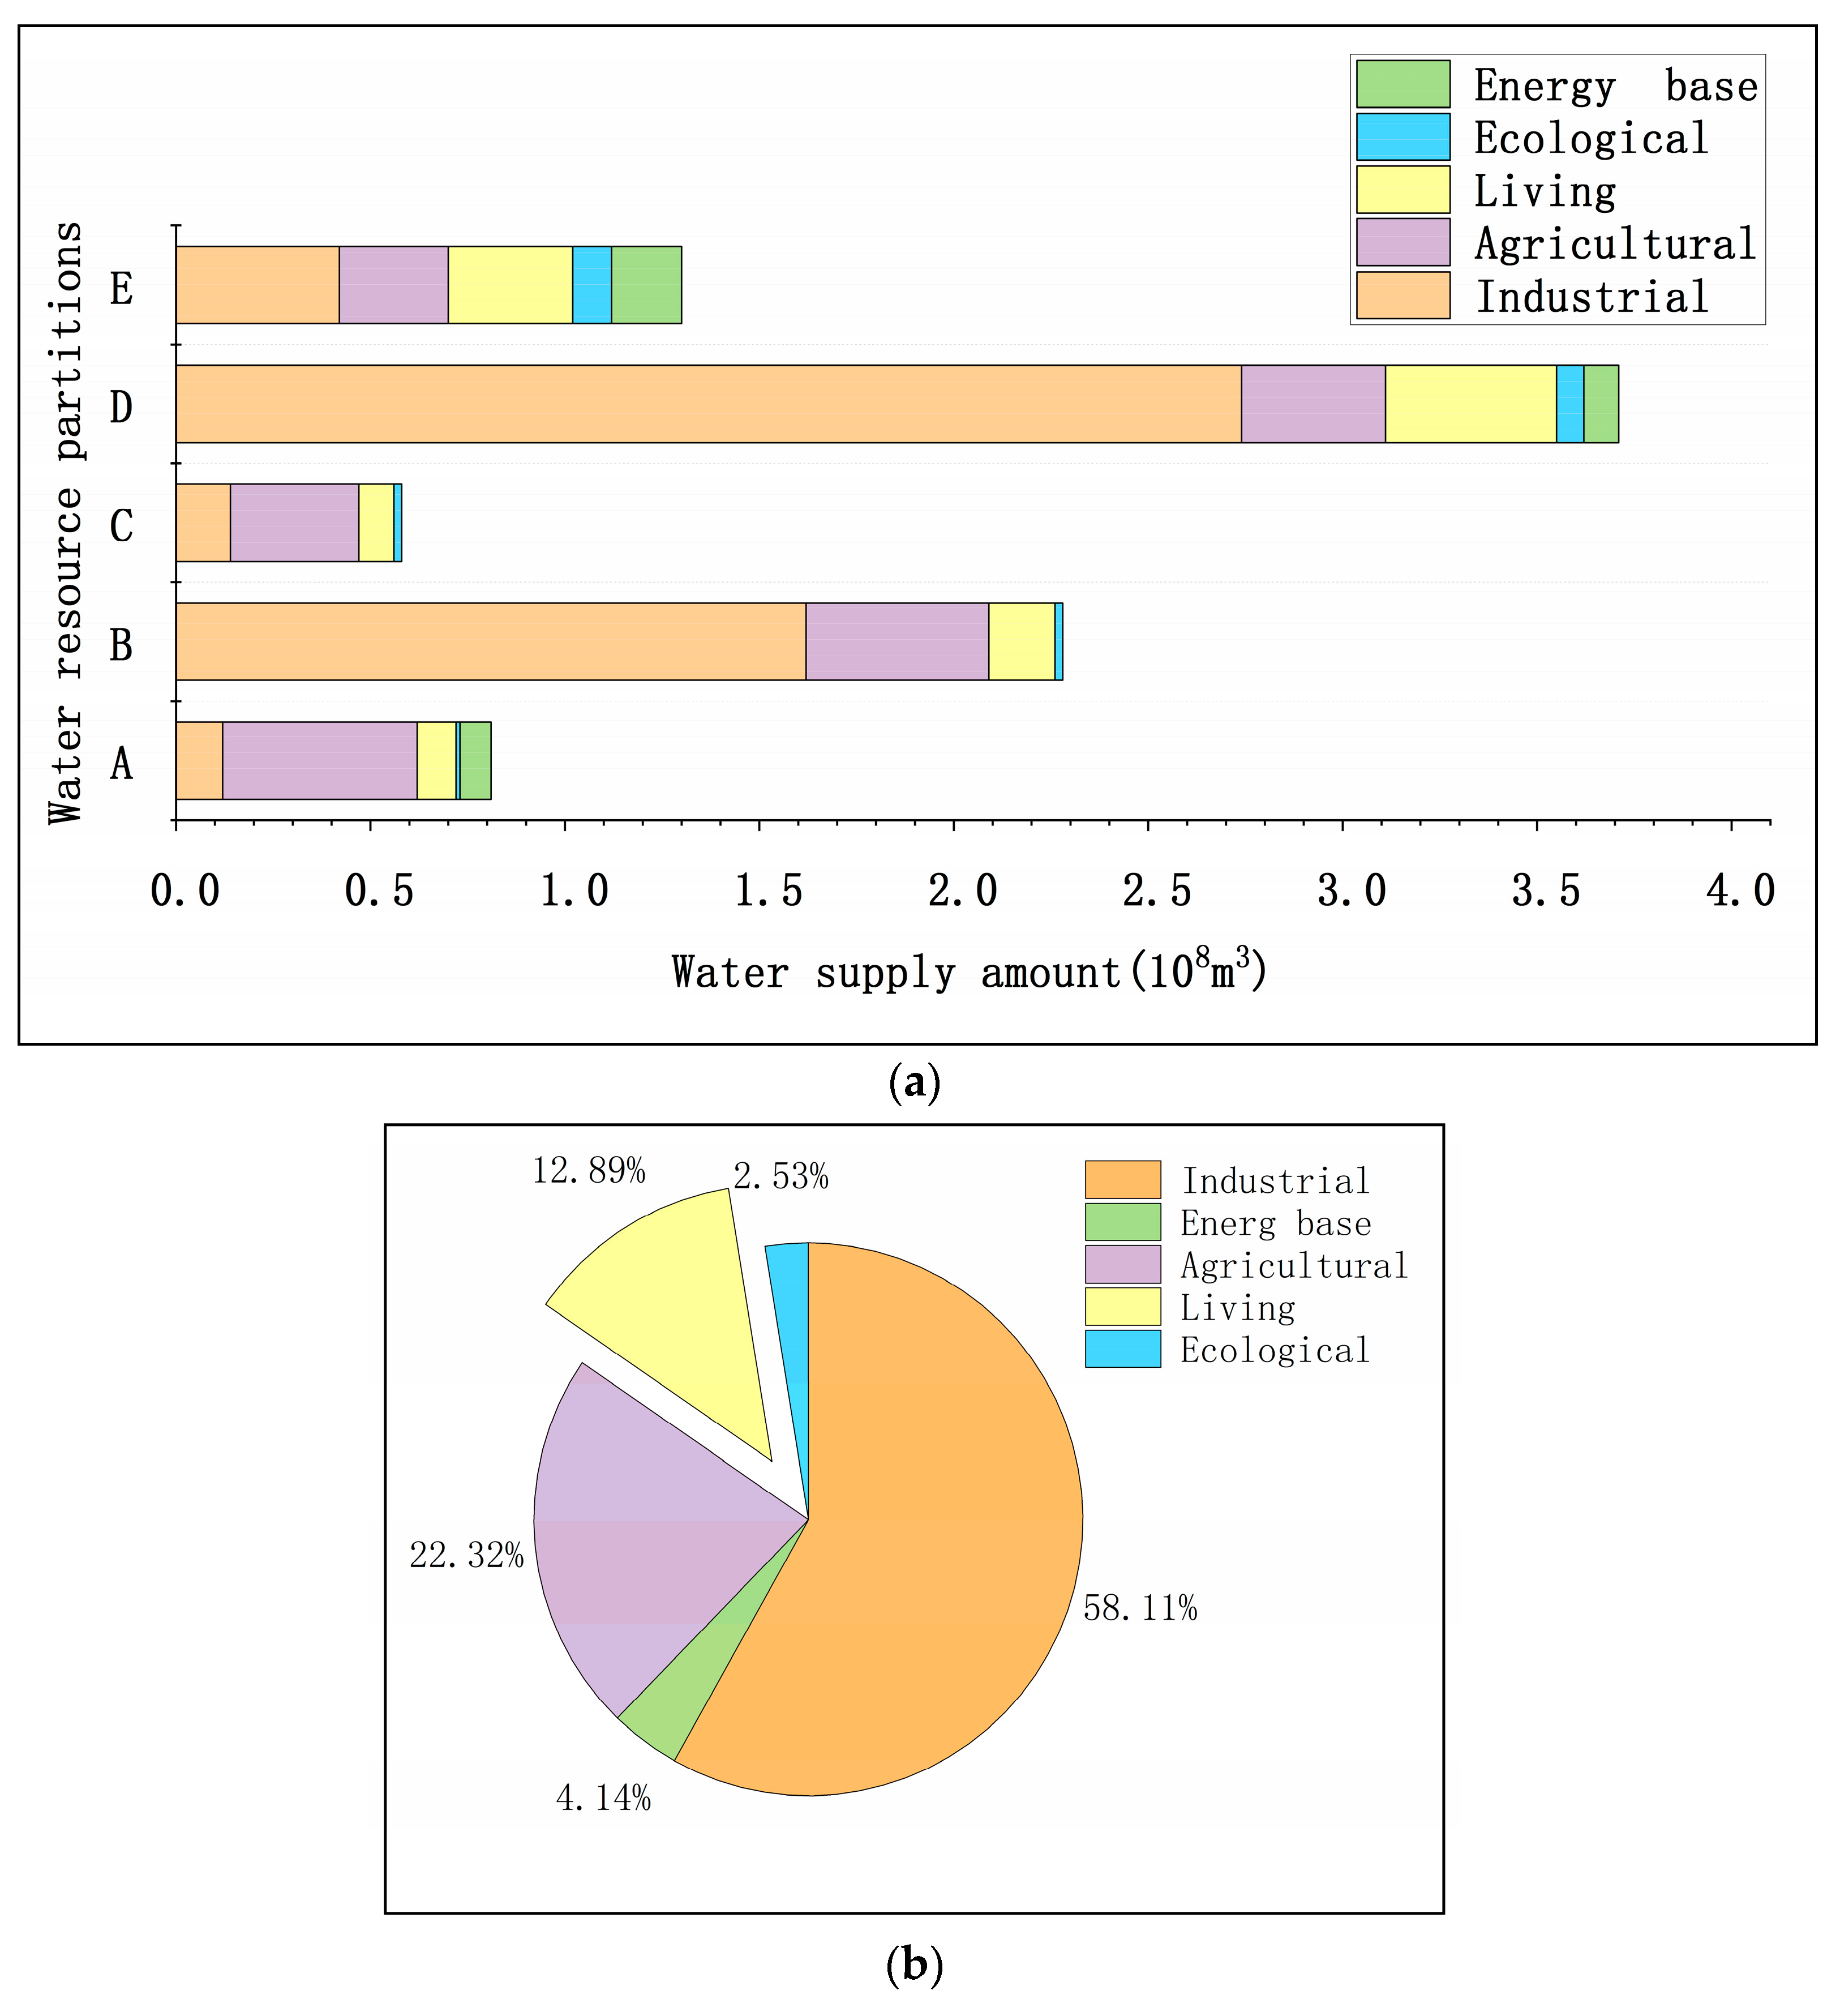
Figure 5.
(a) Water supply analysis chart of weights distribution method (In the figure, Pastoral Energy Industry Partition, Farming-Pastoral Industrial Development Partition, Ecological Agriculture Preserved Partition, Sustainable Development for Petroleum and Coal Industry Partition and Preserved Partition for Ecological Agriculture, and Sustainable Coal Industry Development Partition were abbreviated as A–E). (b) Water supply analysis ratio chart of weights distribution method.
Figure 6.
Decision tree method of socio-economic development and water conservancy projects construction for 2020.
Figure 6.
Decision tree method of socio-economic development and water conservancy projects construction for 2020.
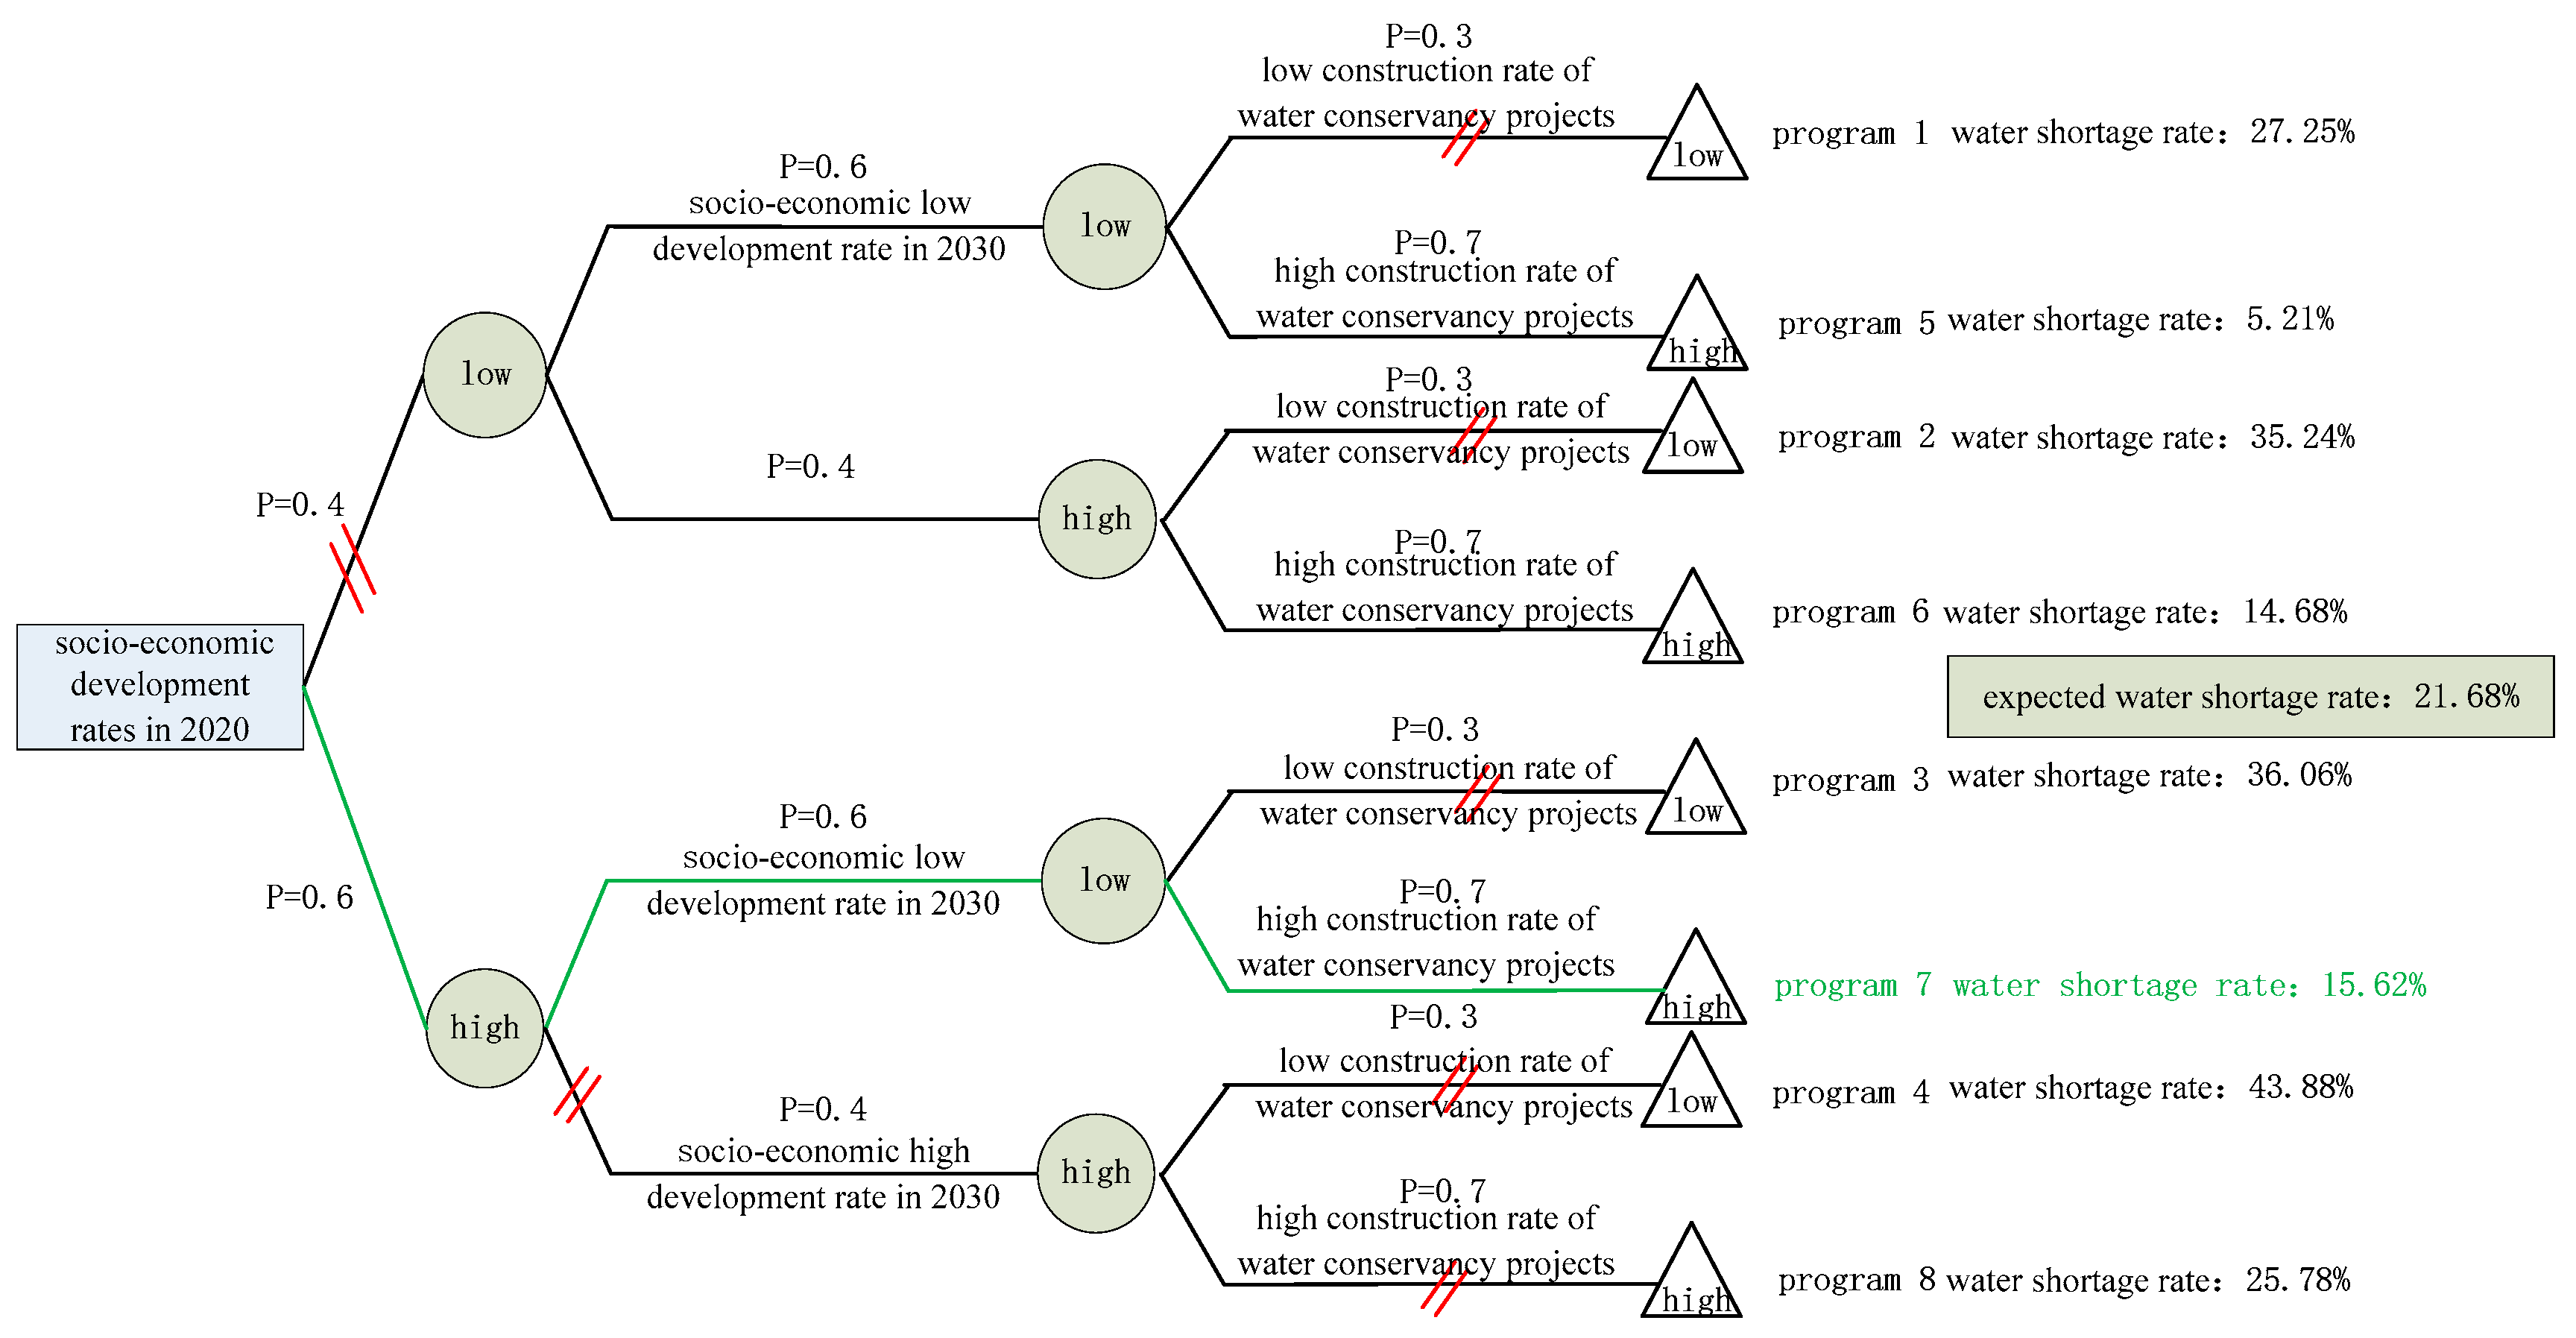
Figure 7.
Decision tree method of socio-economic development and water conservancy projects construction for 2030.
Figure 7.
Decision tree method of socio-economic development and water conservancy projects construction for 2030.
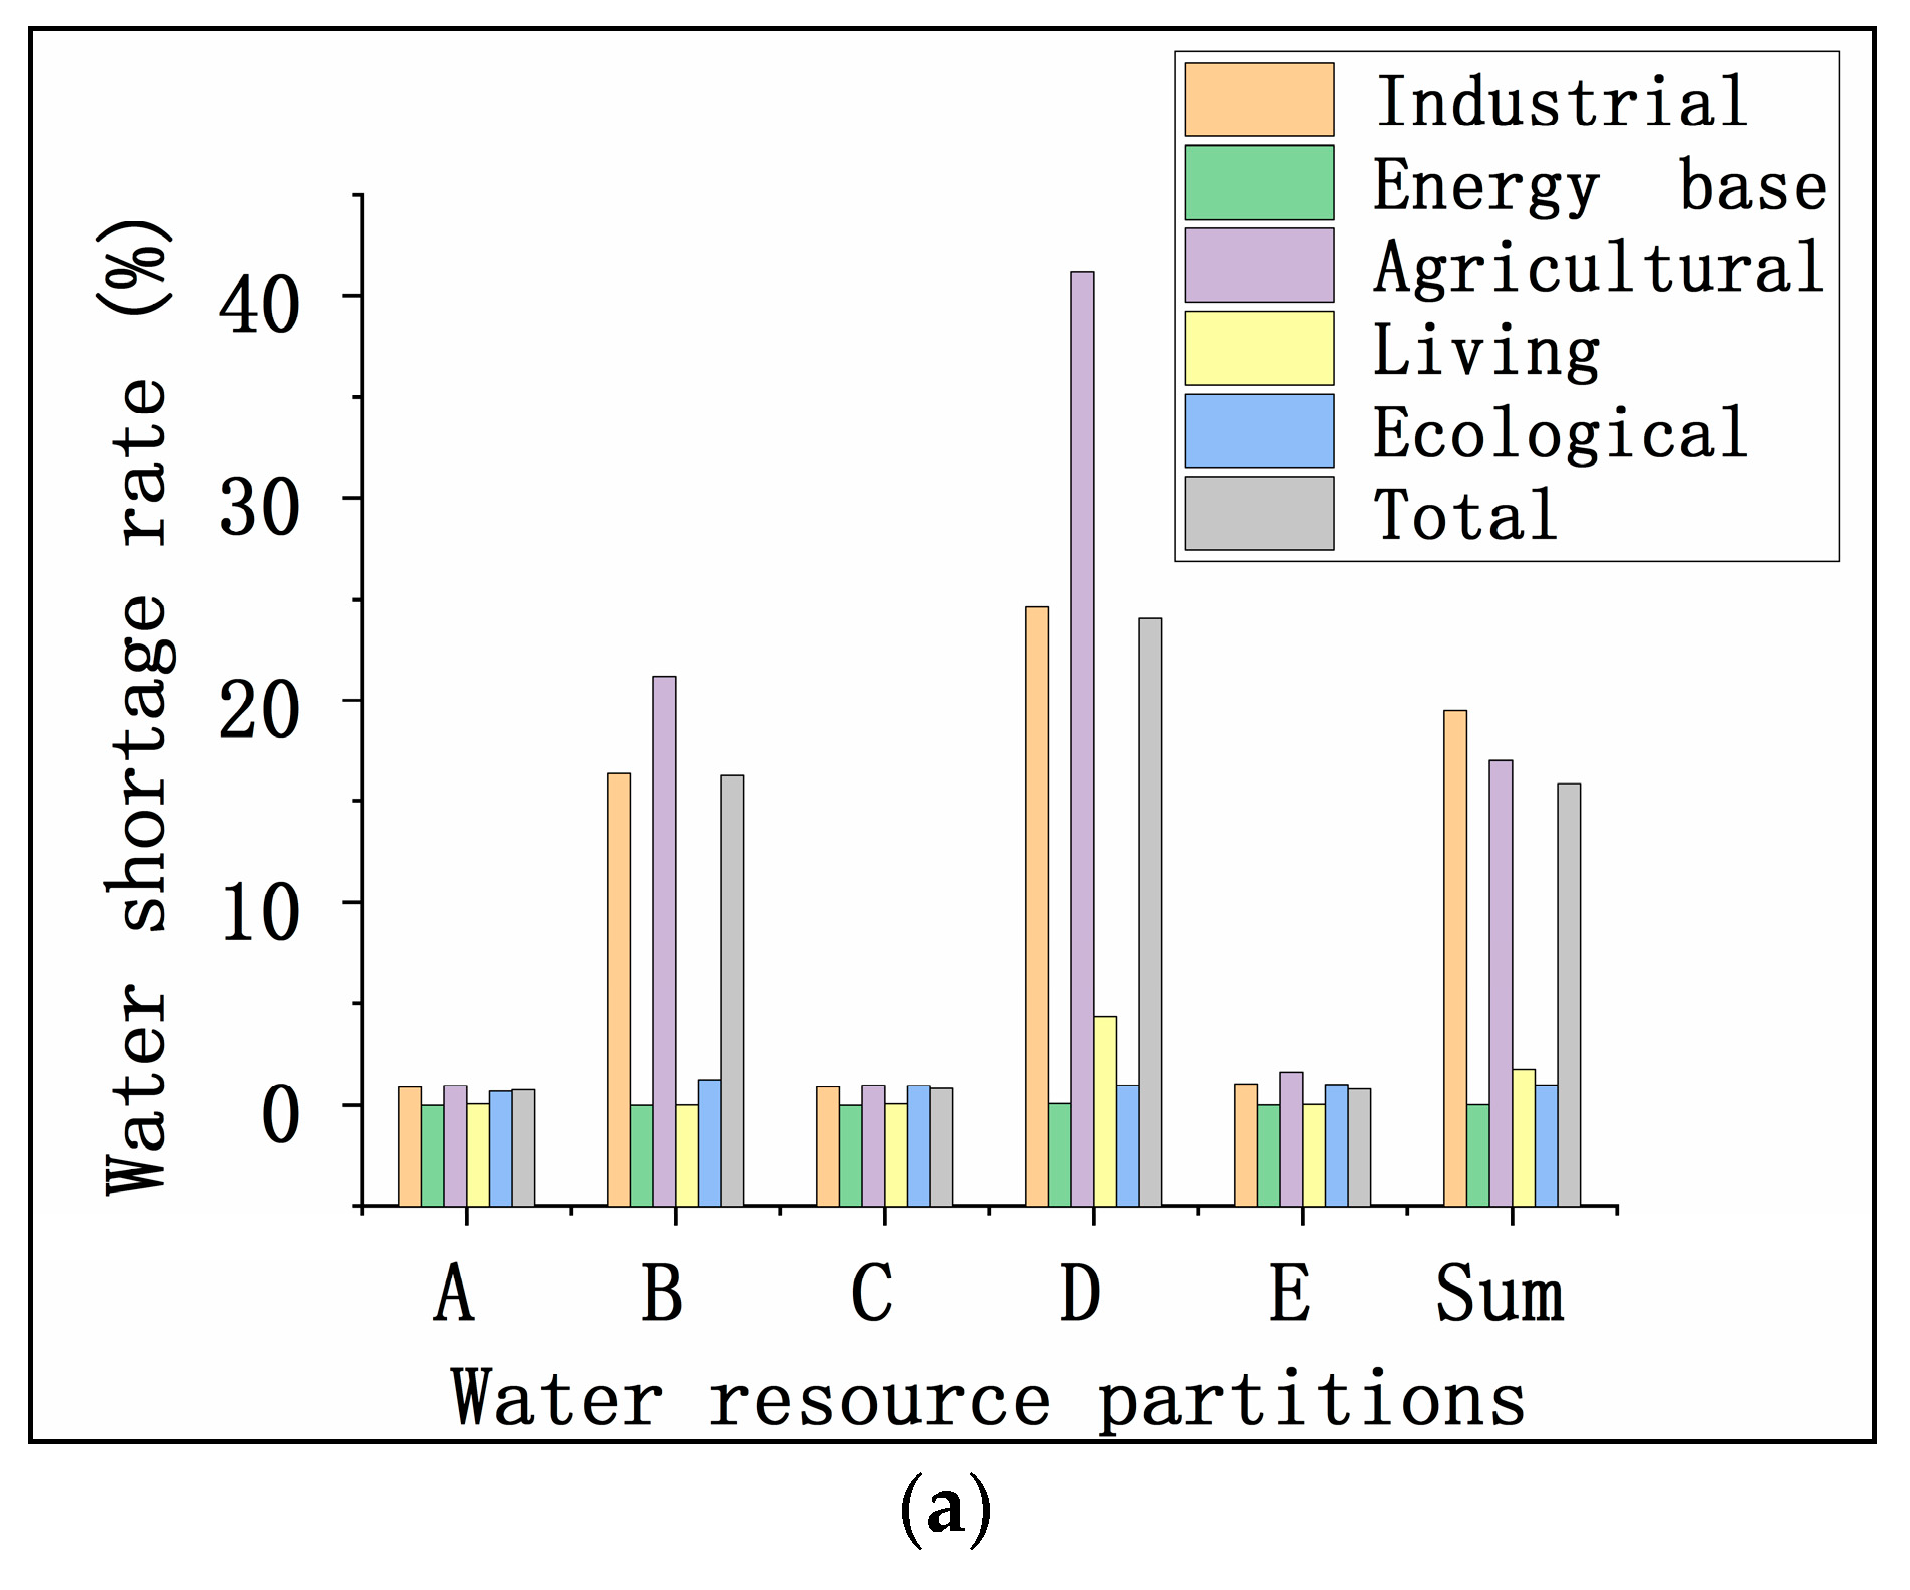
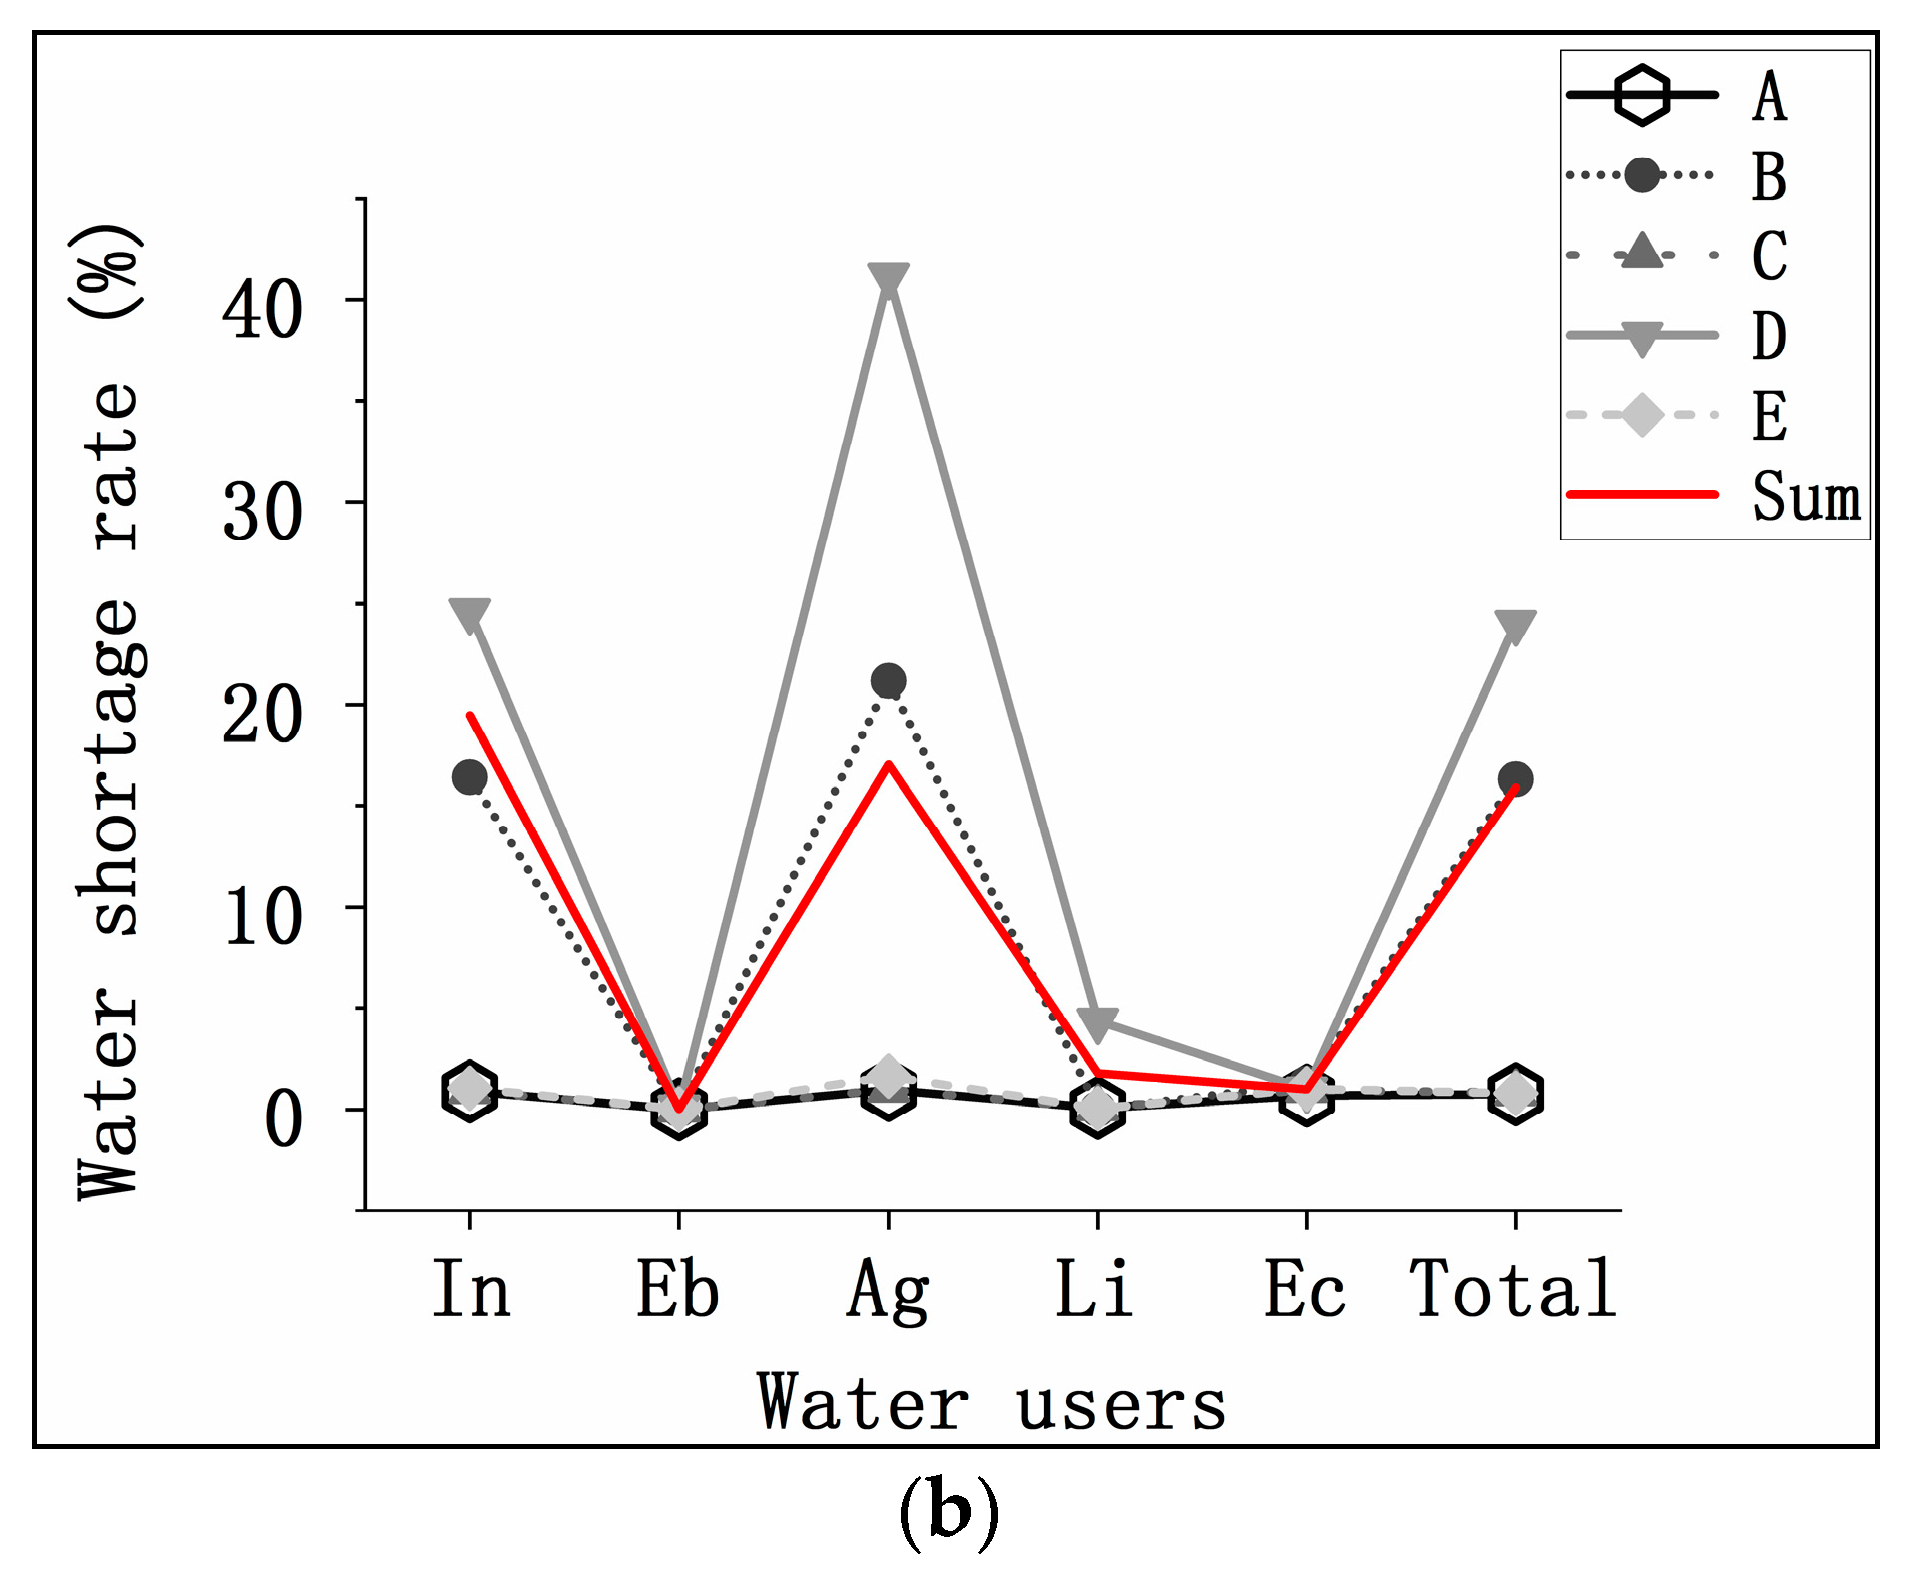
Figure 8.
(a) Different water resource partitions, (b) different water users. Water shortage rate analysis chart of model method (In the figure, Pastoral Energy Industry Partition, Farming-Pastoral Industrial Development Partition, Ecological Agriculture Preserved Partition, Sustainable Development for Petroleum and Coal Industry Partition, and Preserved Partition for Ecological Agriculture and Sustainable Coal Industry Development Partition were abbreviated as A–E; Industrial, Energy base, Agricultural, Living and Ecological were abbreviated as In, Eb, Ag, Li and Ec).
Figure 9.
(a) Water supply analysis chart of model method (In the figure, Pastoral Energy Industry Partition, Farming-Pastoral Industrial Development Partition, Ecological Agriculture Preserved Partition, Sustainable Development for Petroleum and Coal Industry Partition and Preserved Partition for Ecological Agriculture and Sustainable Coal Industry Development Partition were abbreviated as A–E). (b) Water supply analysis ratio chart of model method.
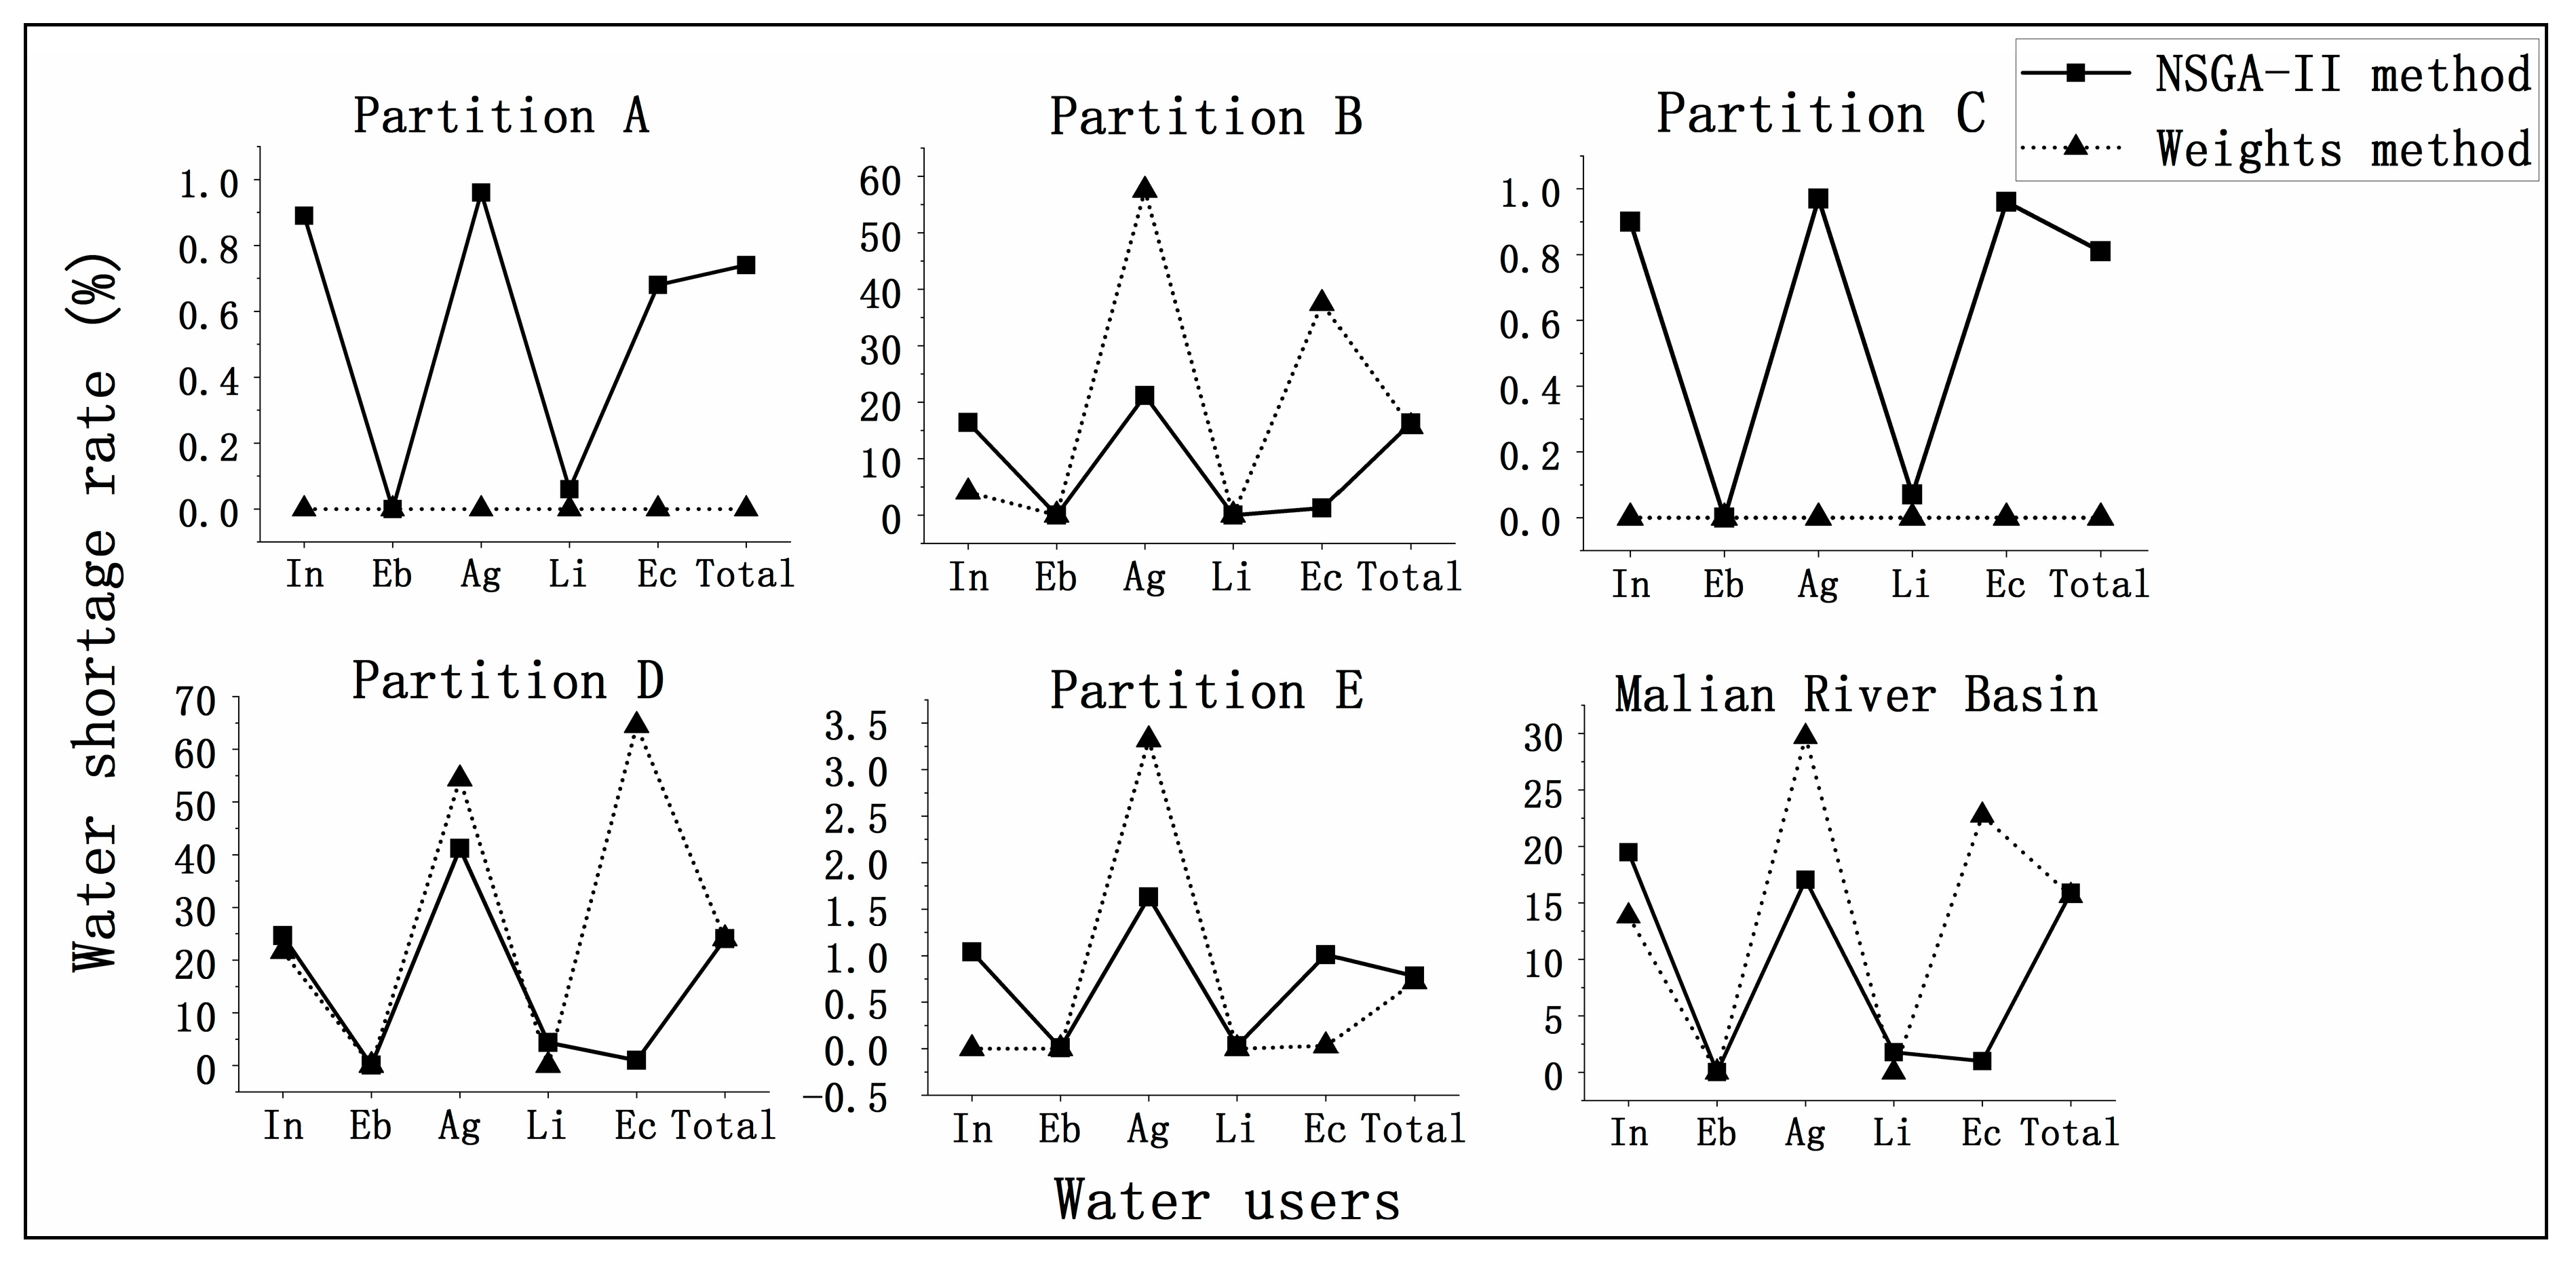
Figure 10.
Comparative analysis chart of the model method and weights distribution method (In the figure, Pastoral Energy Industry Partition, Farming-Pastoral Industrial Development Partition, Ecological Agriculture Preserved Partition, Sustainable Development for Petroleum and Coal Industry Partition and Preserved Partition for Ecological Agriculture and Sustainable Coal Industry Development Partition were abbreviated as A–E; Industrial, Energy base, Agricultural, Living and Ecological were abbreviated as In, Eb, Ag, Li, and Ec).
Table 1.
Forecast of social and economic development speed in different planning levels. Population growth rate (PGR, %), urbanization rate (UR, %), coal mine (CM, 104 ton), petrochemical (PC, 108 ton), power plant (PP, 104 KW), industrial increased (Ii, %), tertiary industry increased (TII, %), ecological area increased (EAI, %), and irrigation area increased (IAI, %), were selected to measure the development of social economy.
| Development Speed | Year | PGR | UR | CM | PC | PP | Ii | TII | EAI | IAI |
|---|
| Low | 2020 | 3 | 34 | 8588 | 1015 | 2520 | 13.5 | 11 | 3 | 0.3 |
| 2030 | 3 | 44 | 9160 | 1538 | 2688 | 12 | 10 | 2 | 0.9 |
| High | 2020 | 3 | 44 | 11,450 | 1353 | 3360 | 16 | 13 | 3 | 0.6 |
| 2030 | 3 | 54 | 11,450 | 1923 | 3360 | 14 | 12 | 2 | 1.2 |
Table 2.
Water quota forecast in 2020 and 2030. Rural green space (RGS, L/m2), urban green space (UGS, L/m2), artificial plantation irrigation (API, m3/ha), urban roads area (URA, L/m2), farmland irrigation (FI, m3/ha), urban population (UP, L/person·day), rural population (RP, L/person·day), industry (Indus, m3/104 yuan added value), construction industry (CI, m3/104 yuan added value), tertiary industry (TI, m3/104 yuan added value), livestock (Liv, L/day), coal mine comprehensive (CMC, m3/t), petrochemical water demand (PWD, m3/t), and water demand of thermal power and coal gangue power plant (WDT, m3/s·GW) were selected as the basis for predicting water demand.
| Contents | 2020 | 2030 | Contents | 2020 | 2030 | Contents | 2020 | 2030 |
|---|
| RGS | 90 | 90 | UP | 157 | 160 | Liv | 45 | 45 |
| UGS | 90 | 90 | RP | 116 | 136 | CMC | 0.30 | 0.25 |
| API | 3000 | 3000 | Indus | 30 | 25 | PWD | 0.57 | 0.55 |
| URA | 75 | 75 | CI | 9.5 | 9.5 | WDT | 0.18 | 0.16 |
| FI | 4290 | 3630 | TI | 16 | 16 | | | |
Table 3.
Water supply forecast table in 2030. The water supple capacity (WPC, 108 m3) in the table refers to increased water supply capacity.
Table 3.
Water supply forecast table in 2030. The water supple capacity (WPC, 108 m3) in the table refers to increased water supply capacity.
| High Speed | Low Speed |
|---|
| Water Project | WPC | Water Project | WPC |
|---|
| Si Lang River Water Diversion Pivot Project *** | 0.06 | Si Lang River Water Diversion Pivot Project *** | 0.06 |
| Xiao Pan River Reservoir *** | 0.30 | Xiao Pan River Reservoir *** | 0.30 |
| Xiao Pan River Water Diversion Project *** | 0.20 | Xiao Pan River Water Diversion Project *** | 0.20 |
| Water Storage Project with the Use of Yellow River in Huan Country *** | 0.25 | Water Storage Project with the Use of Yellow River in Huan Country *** | 0.25 |
| Jin River Water Transfer Project *** | 0.30 | Jin River Water Transfer Project *** | 0.30 |
| Wuri Tiangou Diversion Pivot Project *** | 0.03 | Wuri Tiangou Diversion Pivot Project *** | 0.03 |
| Zhi Dang River Water Supply Project *** | 0.05 | Zhi Dang River Water Supply Project *** | 0.05 |
| Sum | 1.14 | Sum | 1.14 |
| San Li Qiao Reservoir ** | 0.20 | San Li Qiao Reservoir * | 0.20 |
| Water quality renovation project in the upper reaches of Malian River *** | 0.17 | Water quality renovation project in the upper reaches of Malian River * | 0.17 |
| Er Jiangchuang Water Diversion Project ** | 0.04 | Er Jiangchuang Water Diversion Project * | 0.04 |
| Malian River Reservoir ** | 1.70 | Malian River Reservoir * | 1.70 |
| Bailong River Water Transfer Project ** | 2.00 | / | / |
| Sum | 4.11 | Sum | 2.11 |
| Urban Qianchi Baihu Project | 0.04 | City Qianchi Baihu Project | 0.04 |
| Urban Wastewater Treatment and Utilization Project | 0.31 | Urban Wastewater Treatment and Utilization Project | 0.27 |
| Rural Rainwater Harvesting and Utilization Project | 0.13 | Rural Rainwater Harvesting and Utilization Project | 0.12 |
| Sum | 0.49 | Sum | 0.42 |
| Total | 5.78 | Total | 3.65 |
Table 4.
Social economic development speed expert recommendation probability statistics table in 2020 and 2030. Please check the column that you think is possible.
Table 4.
Social economic development speed expert recommendation probability statistics table in 2020 and 2030. Please check the column that you think is possible.
| Year | Development Speed | Very Likely Possible | Larger Possible | Lesser Possibility | Impossible Possibility |
|---|
| 2020 | High | | √ | | |
| Low | * | * | * | * |
| 2030 | High | | | √ | |
| Low | * | * | * | * |
Table 5.
Expert probability consultation results of water conservancy project construction plan in 2030. Very likely possible, expressed by a, is 0.8, larger possible, expressed by b, is 0.6, lesser possibility, expressed by c, is 0.4, and impossible possibility, expressed by d, is 0.2.
Table 5.
Expert probability consultation results of water conservancy project construction plan in 2030. Very likely possible, expressed by a, is 0.8, larger possible, expressed by b, is 0.6, lesser possibility, expressed by c, is 0.4, and impossible possibility, expressed by d, is 0.2.
| Water Project | Water Supply Amount | Expert Recommendation Probability |
|---|
| San Li Qiao Reservoir | 2000 | a |
| Water quality renovation project in the upper reaches of Malian River | 1724 | a |
| Er Jiangchuang Water Diversion Project | 350 | a |
| Malian River Reservoir | 17,000 | b |
| Urban Qianchi Baihu Project | 400 | a |
| Urban Wastewater Treatment and Utilization Project | 2666 | b |
| 3124 | c |
| Rural Rainwater Harvesting and Utilization Project | 1344 | b |
| 1152 | c |
Table 6.
Expert advice probability results table of different supply and demand programs in 2020.
Table 6.
Expert advice probability results table of different supply and demand programs in 2020.
| Programs | 1 | 2 | 3 | 4 |
|---|
| DR | PS | DR | PS | DR | PS | DR | PS |
|---|
| Socio-economic development | low | 0.400 | low | 0.400 | low | 0.600 | low | 0.600 |
| Water conservancy construction | high | 0.344 | high | 0.656 | high | 0.344 | high | 0.656 |
| Programs probability | 0.138 | 0.262 | 0.206 | 0.394 |
Table 7.
Expert advice probability results table of different supply and demand programs in 2030.
Table 7.
Expert advice probability results table of different supply and demand programs in 2030.
| Programs | 1 | 2 | 3 | 4 | 5 | 6 | 7 | 8 |
|---|
| Low (2020) | High (2020) | Low (2020) | High (2020) |
|---|
| development rate | low (2030) | high (2030) | low (2030) | high (2030) | low (2030) | high (2030) | low (2030) | high (2030) |
| 0.240 | 0.160 | 0.360 | 0.240 | 0.240 | 0.160 | 0.360 | 0.240 |
| water conservancy construction | low | low | low | low | high | high | high | high |
| probability possibility | 0.088 | 0.059 | 0.132 | 0.088 | 0.152 | 0.101 | 0.228 | 0.152 |
Table 8.
Optimization model method result table in 2030.
Table 8.
Optimization model method result table in 2030.
| Water Resource Partitions | Item (108 × m3/%) | Industrial | Energy Base | Agricultural | Living | Ecological Water | Total |
|---|
| Pastoral Energy Industry Partition | water supply | 0.12 | 0.08 | 0.50 | 0.10 | 0.01 | 0.82 |
| shortage rate | 0.89 | 0.00 | 0.96 | 0.06 | 0.68 | 0.74 |
| Farming-Pastoral Industrial Development Partition | water supply | 1.62 | 0.00 | 0.47 | 0.17 | 0.02 | 2.28 |
| shortage rate | 16.40 | 0.00 | 21.18 | 0.01 | 1.25 | 16.31 |
| Ecological Agriculture Preserved Partition | water supply | 0.14 | 0.00 | 0.33 | 0.09 | 0.02 | 0.58 |
| shortage rate | 0.90 | 0.00 | 0.97 | 0.07 | 0.96 | 0.81 |
| Sustainable Development for Petroleum and Coal Industry Partition | water supply | 2.74 | 0.09 | 0.37 | 0.44 | 0.07 | 3.72 |
| shortage rate | 24.61 | 0.08 | 41.17 | 4.37 | 0.97 | 24.05 |
| Preserved Partition for Ecological Agriculture and Sustainable Coal Industry Development Partition | water supply | 0.42 | 0.18 | 0.28 | 0.32 | 0.10 | 1.30 |
| shortage rate | 1.04 | 0.01 | 1.63 | 0.03 | 1.01 | 0.78 |
| Malian River Basin | water supply | 5.05 | 0.36 | 1.94 | 1.12 | 0.22 | 8.69 |
| shortage rate | 19.48 | 0.02 | 17.05 | 1.77 | 0.99 | 15.90 |


