Analysis of Long-Term Trends of Annual and Seasonal Rainfall in the Awash River Basin, Ethiopia


Abstract
1. Introduction
2. Materials and Methods
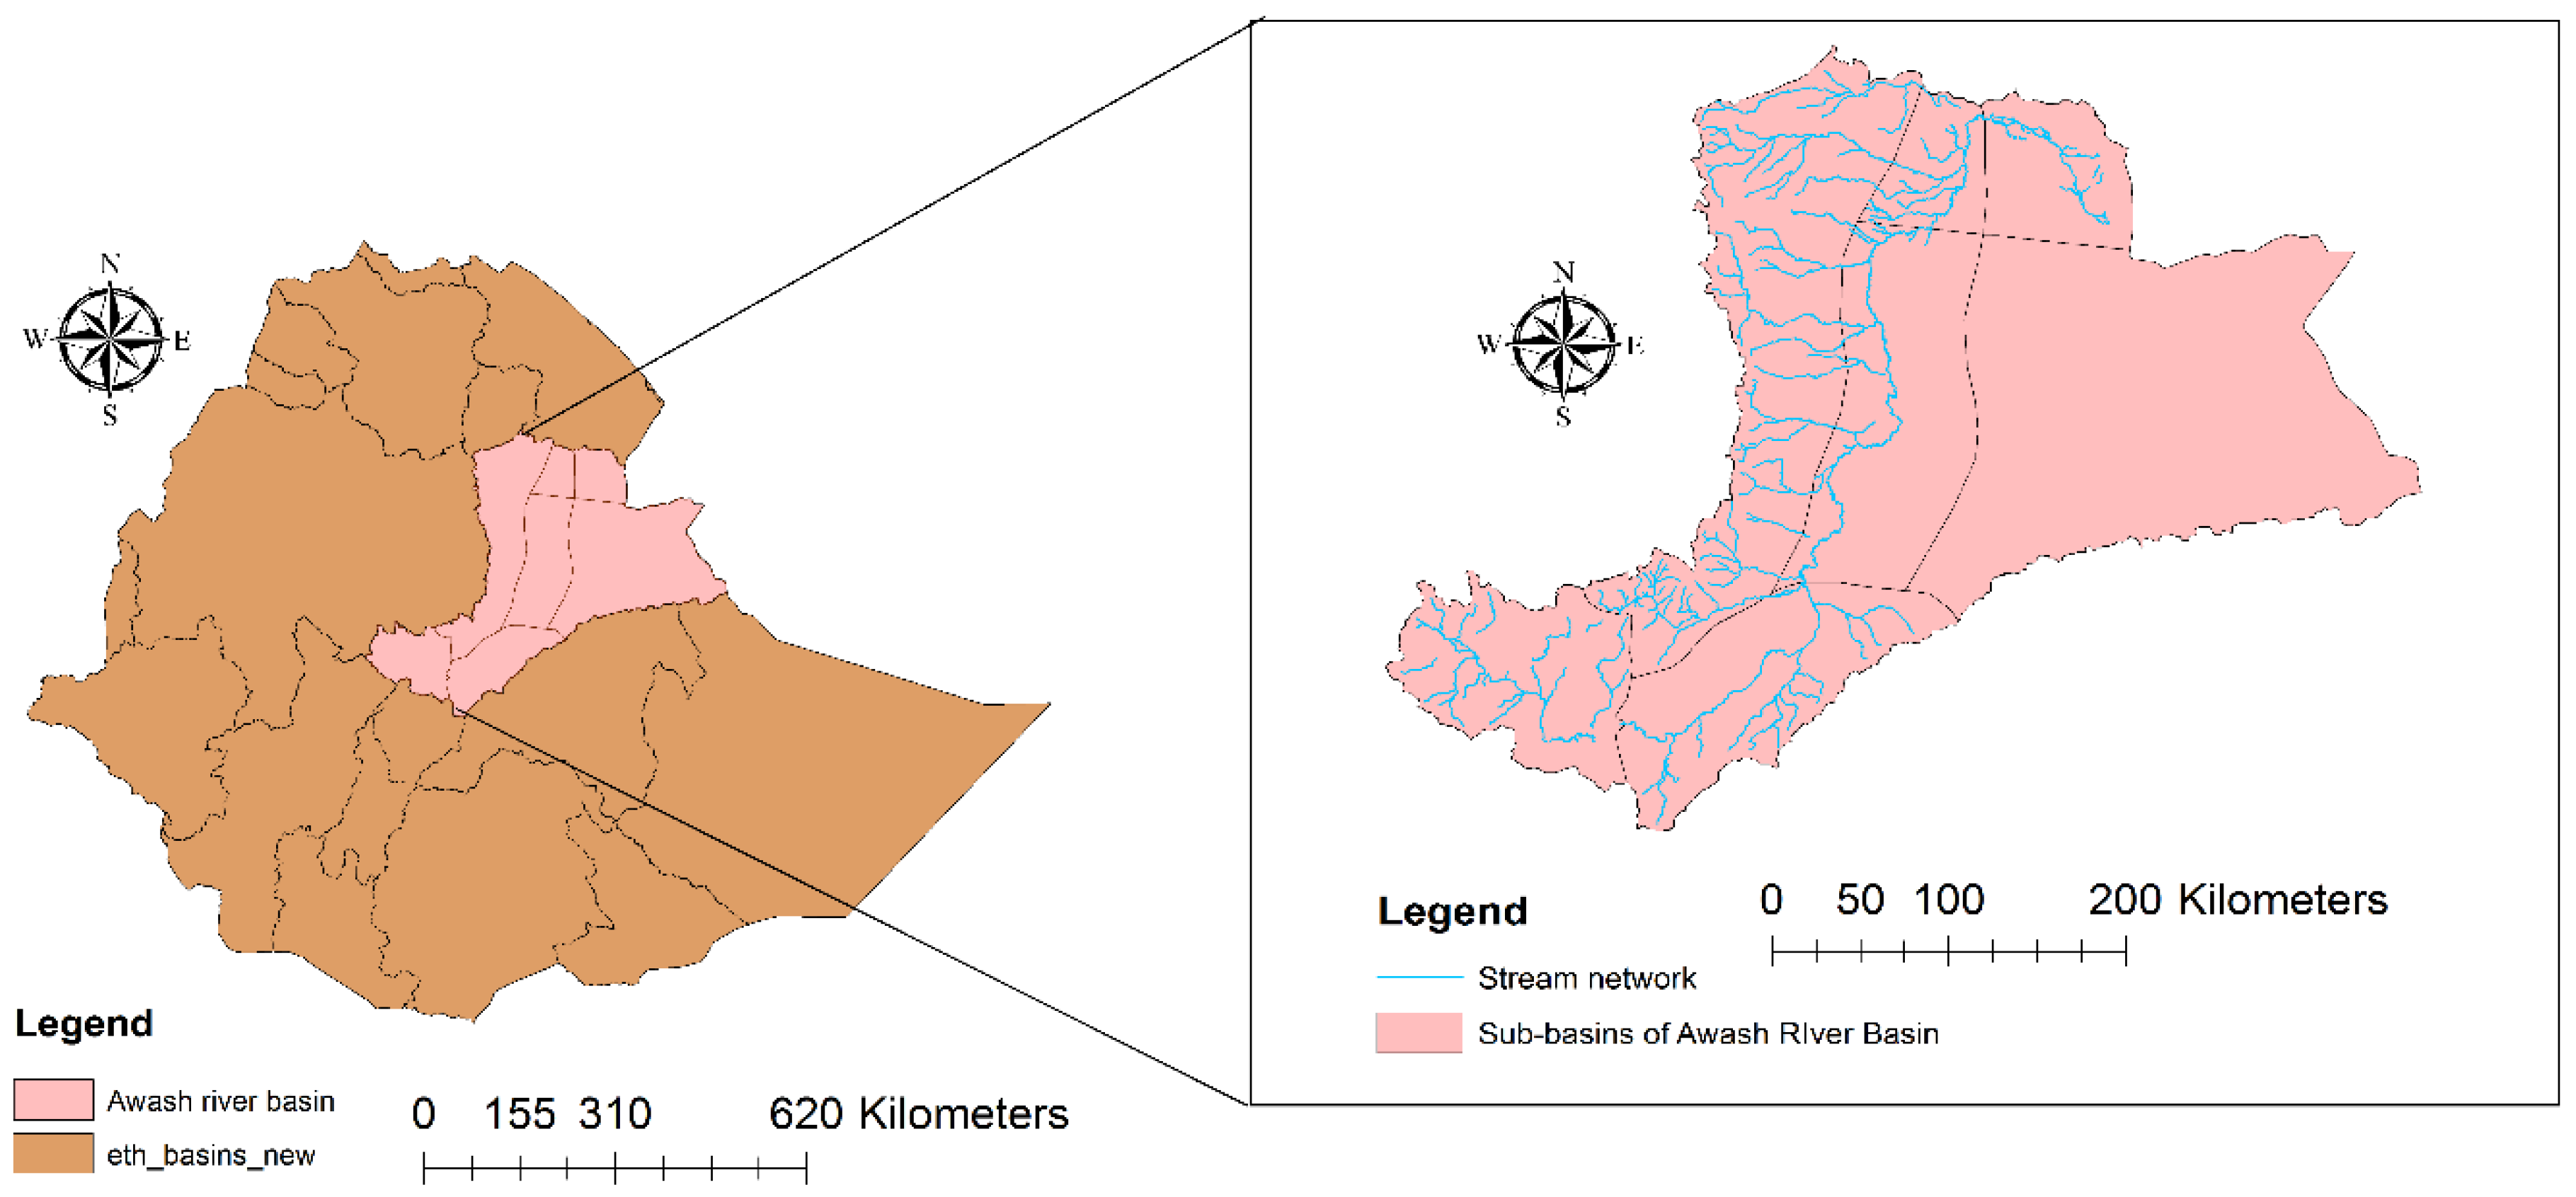
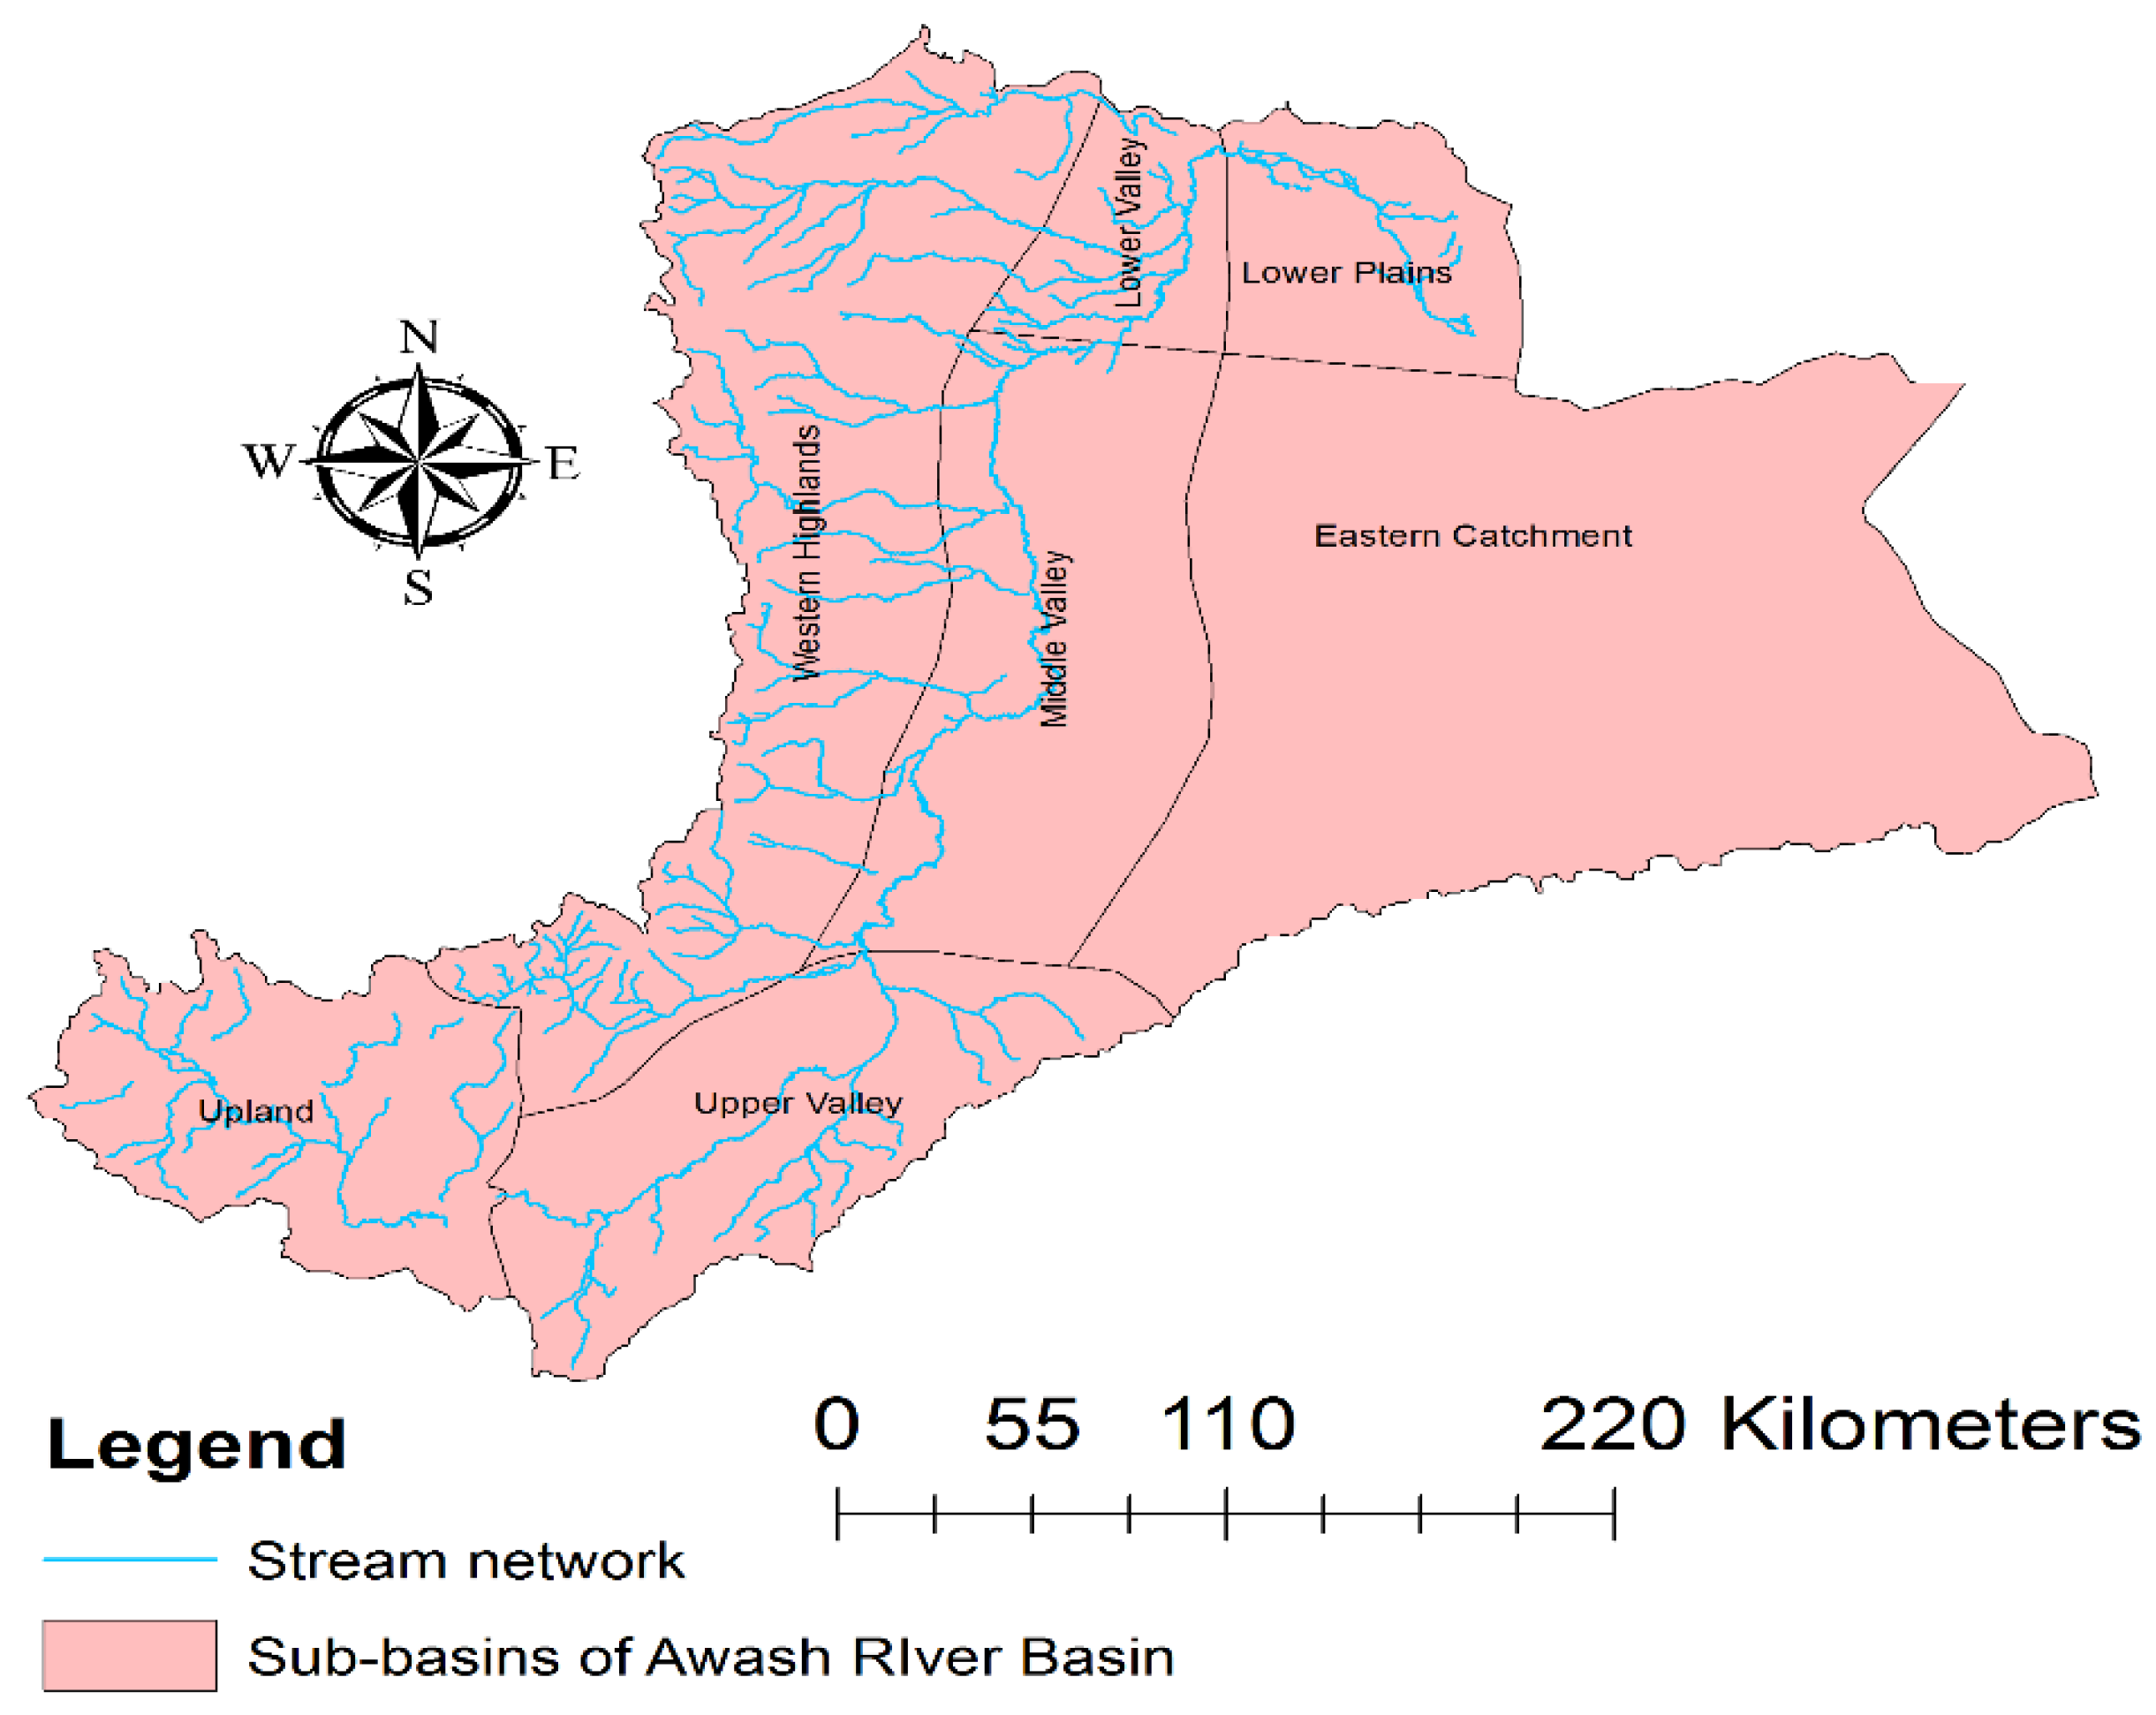
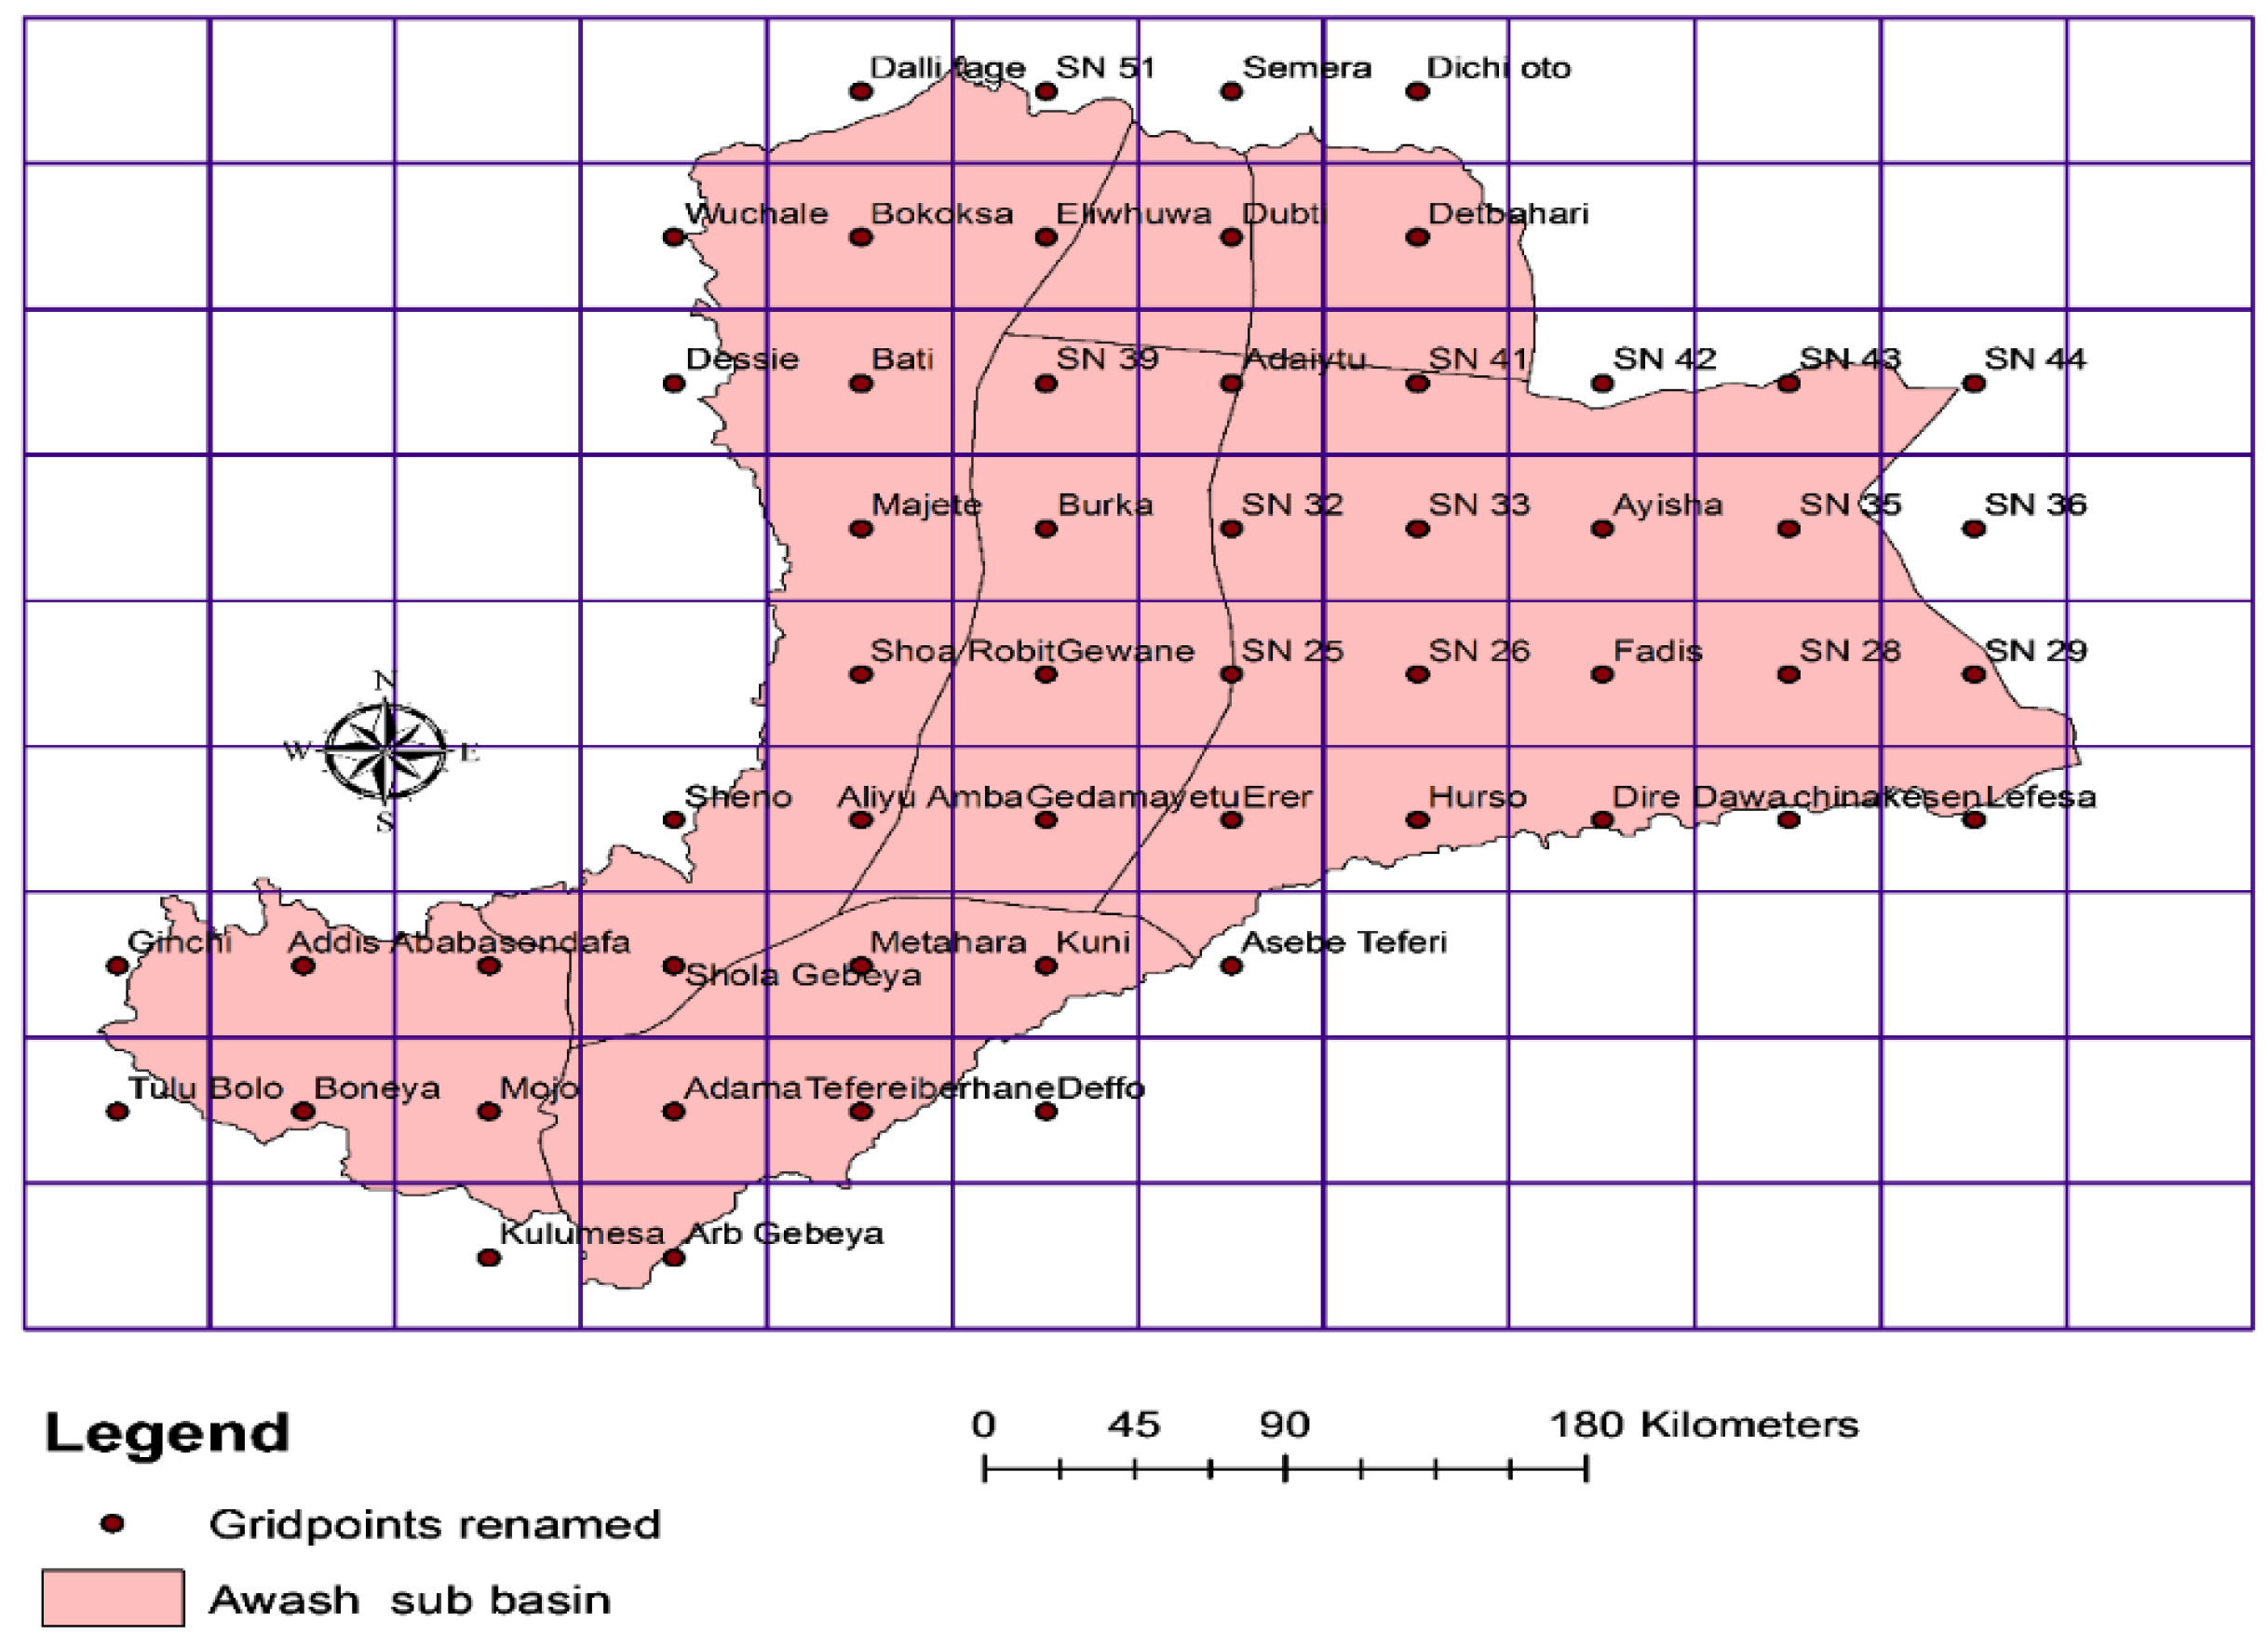
2.1. Description of the Study Area
2.2. Data Collection and Preprocessing
2.3. Data Analysis
- ➢
- Null hypothesis: samples come from same distribution
- ➢
- Alternative hypothesis: samples do not come from same distribution
- ➢
- Null Hypothesis (H0): There is no monotonic trend in the data series
- ➢
- Alternative hypothesis (HA): There is a monotonic trend in the data series (Two tail)
3. Results
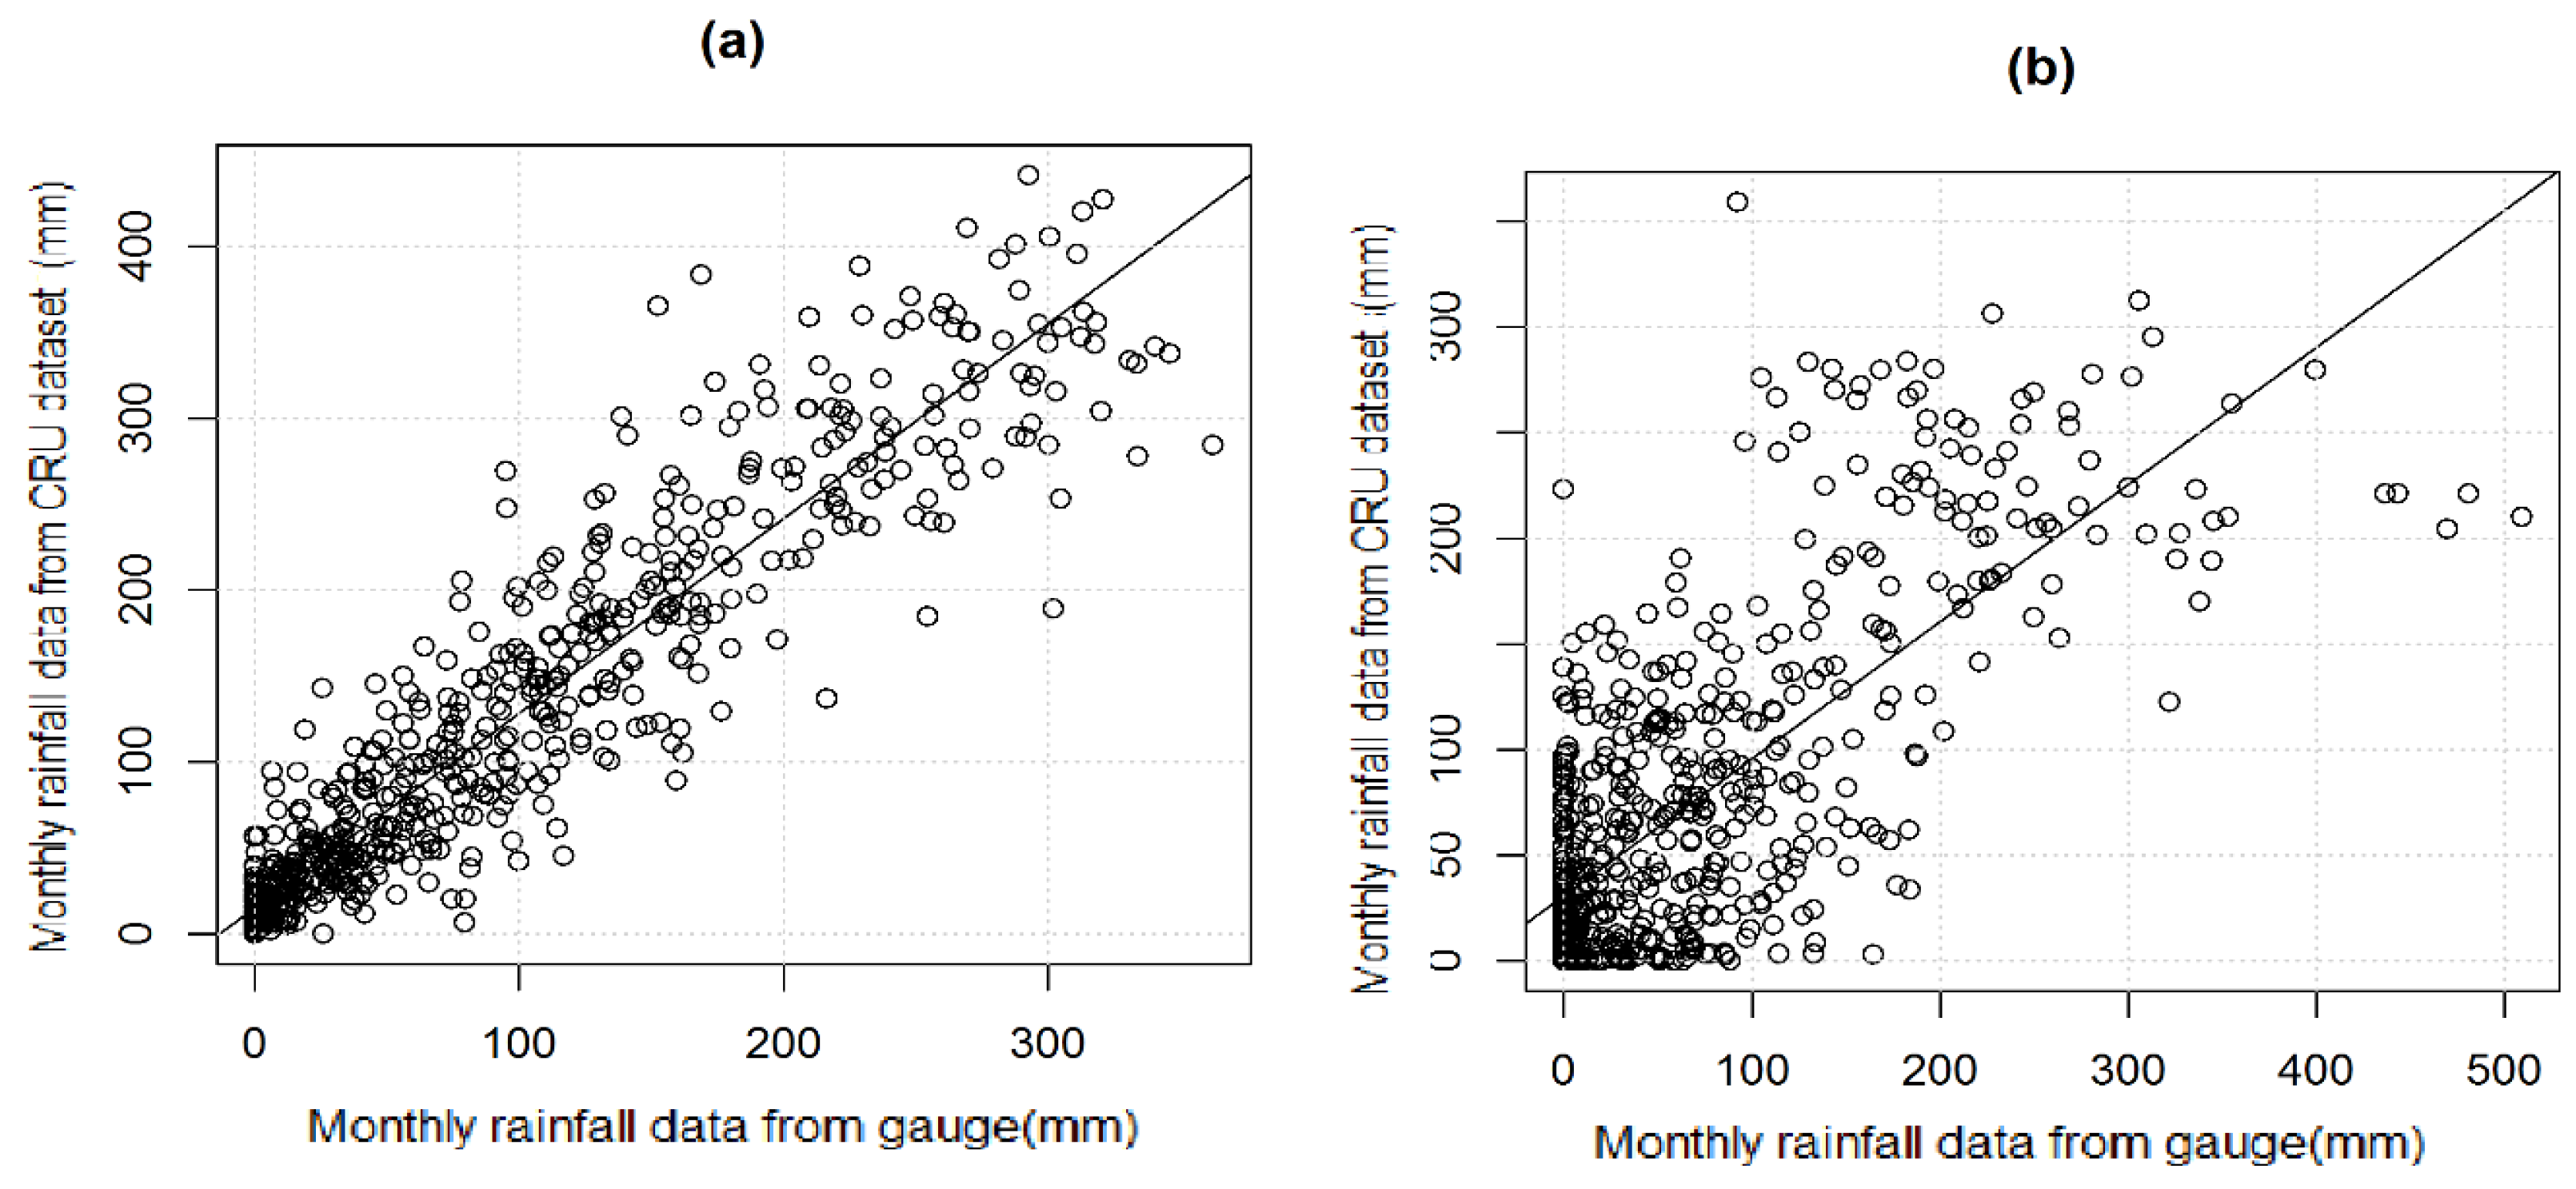
3.1. Validation of Gridded Climate Dataset
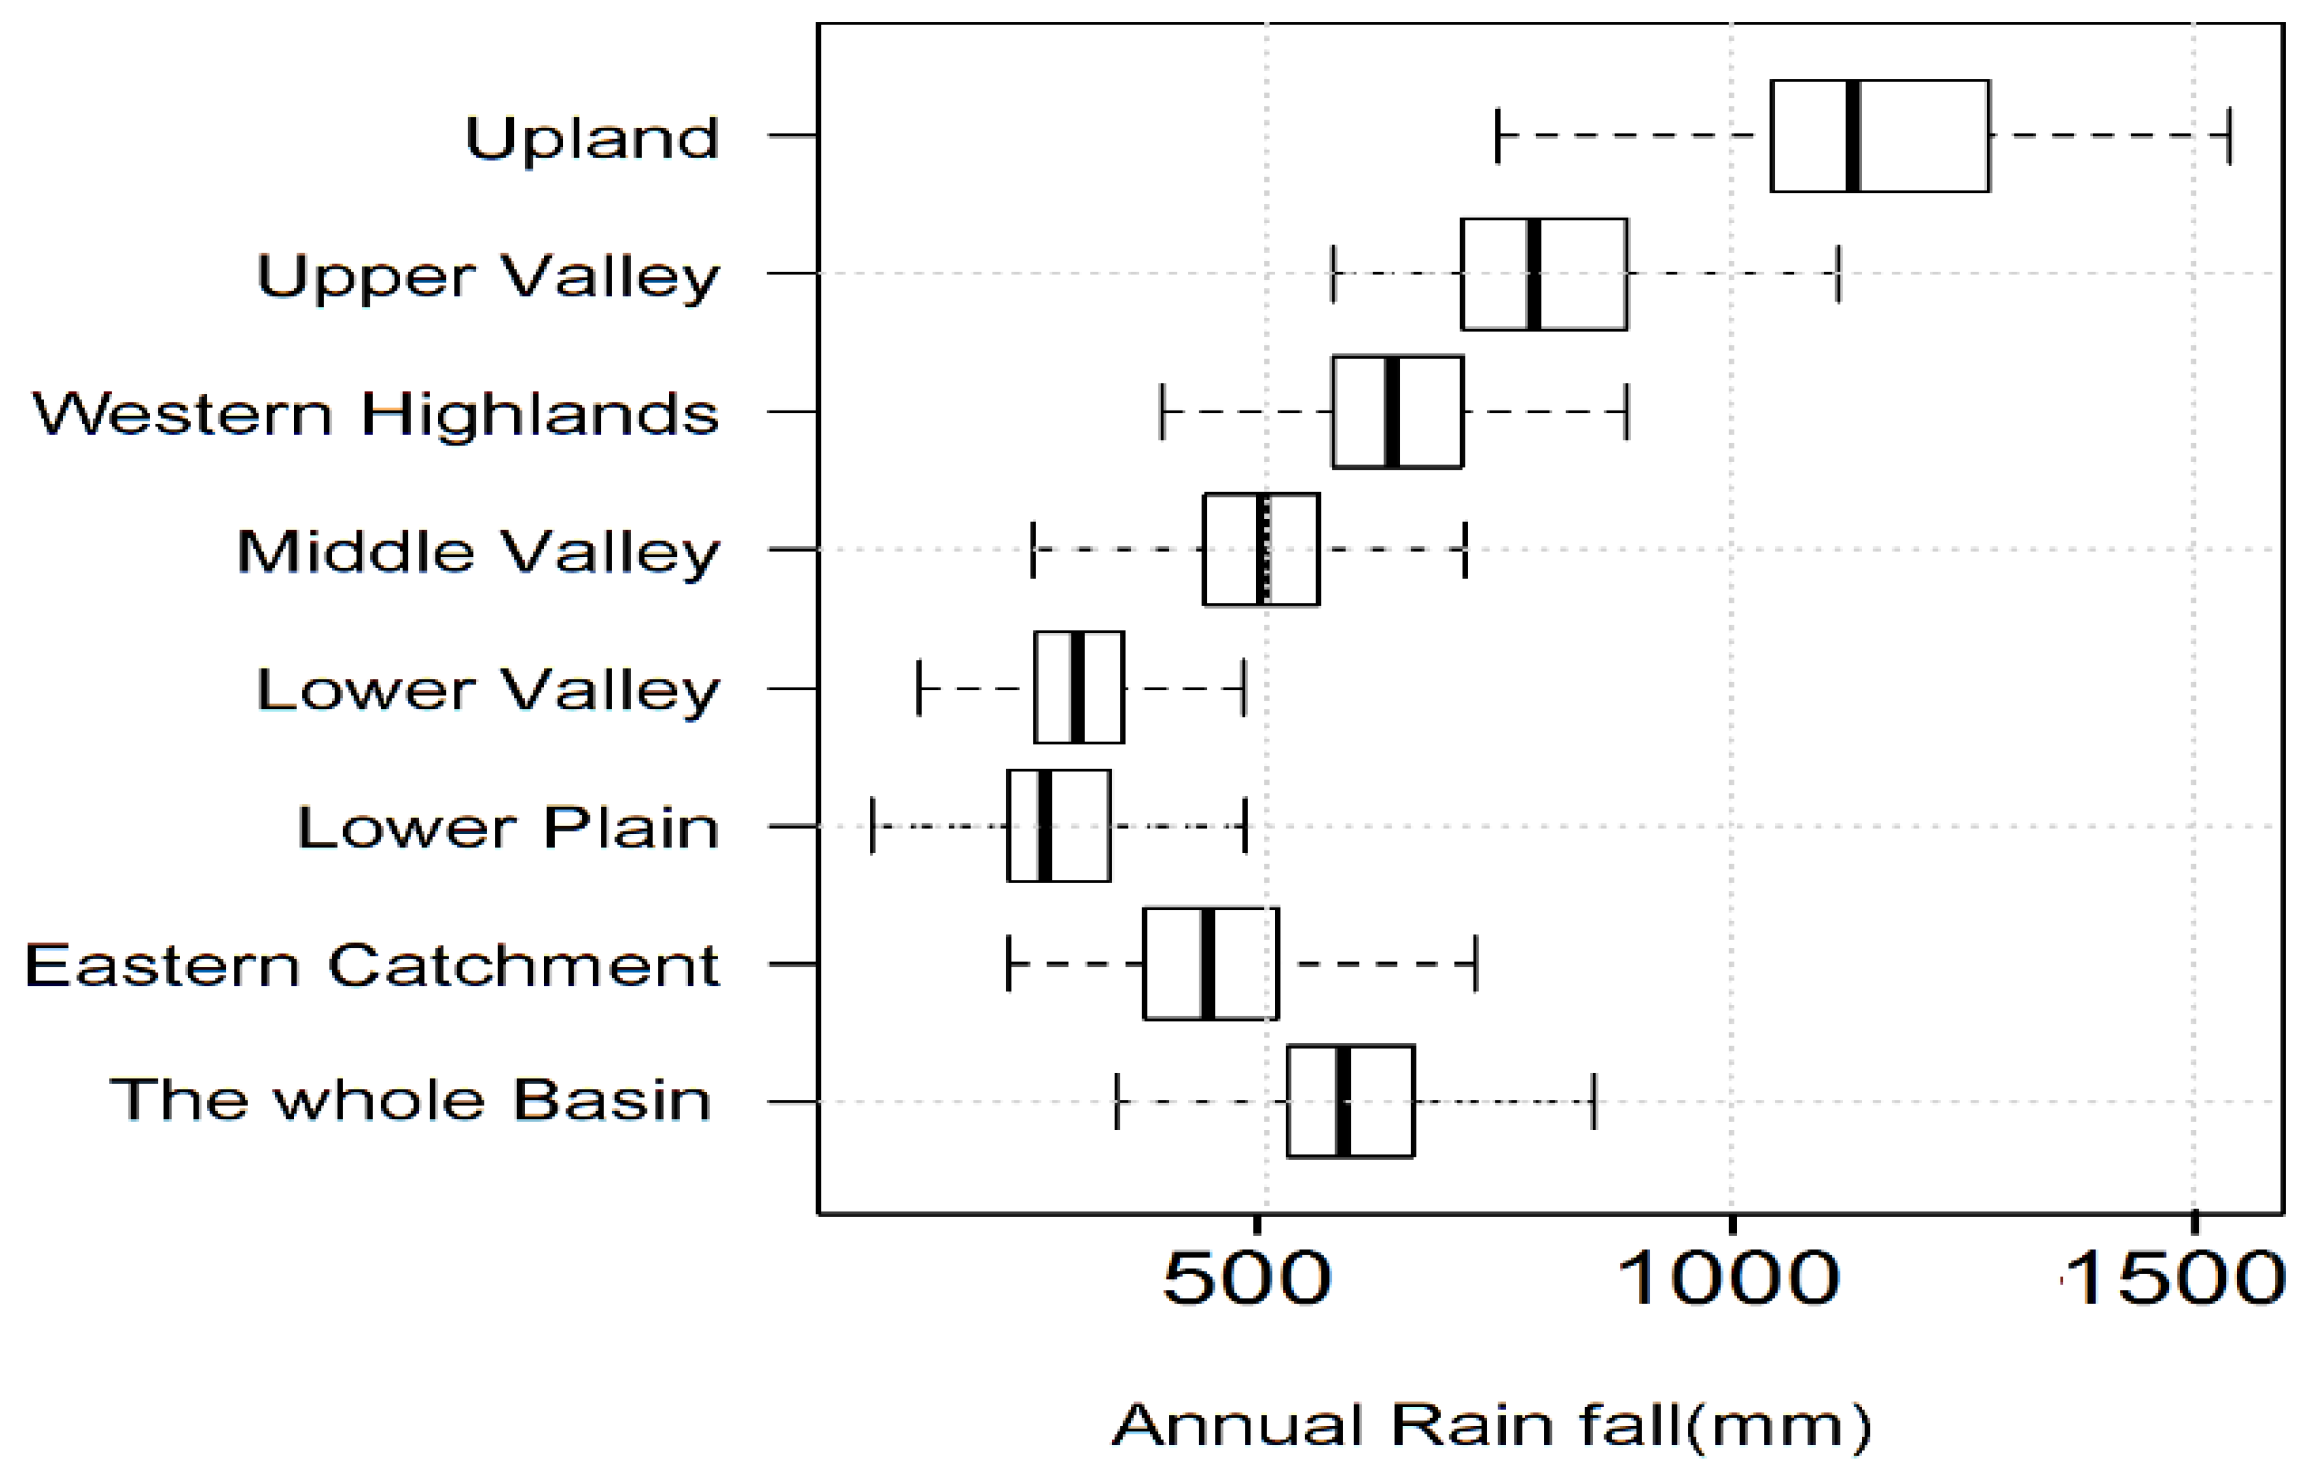
3.2. Trends of Annual Rainfall in the Awash River Basin
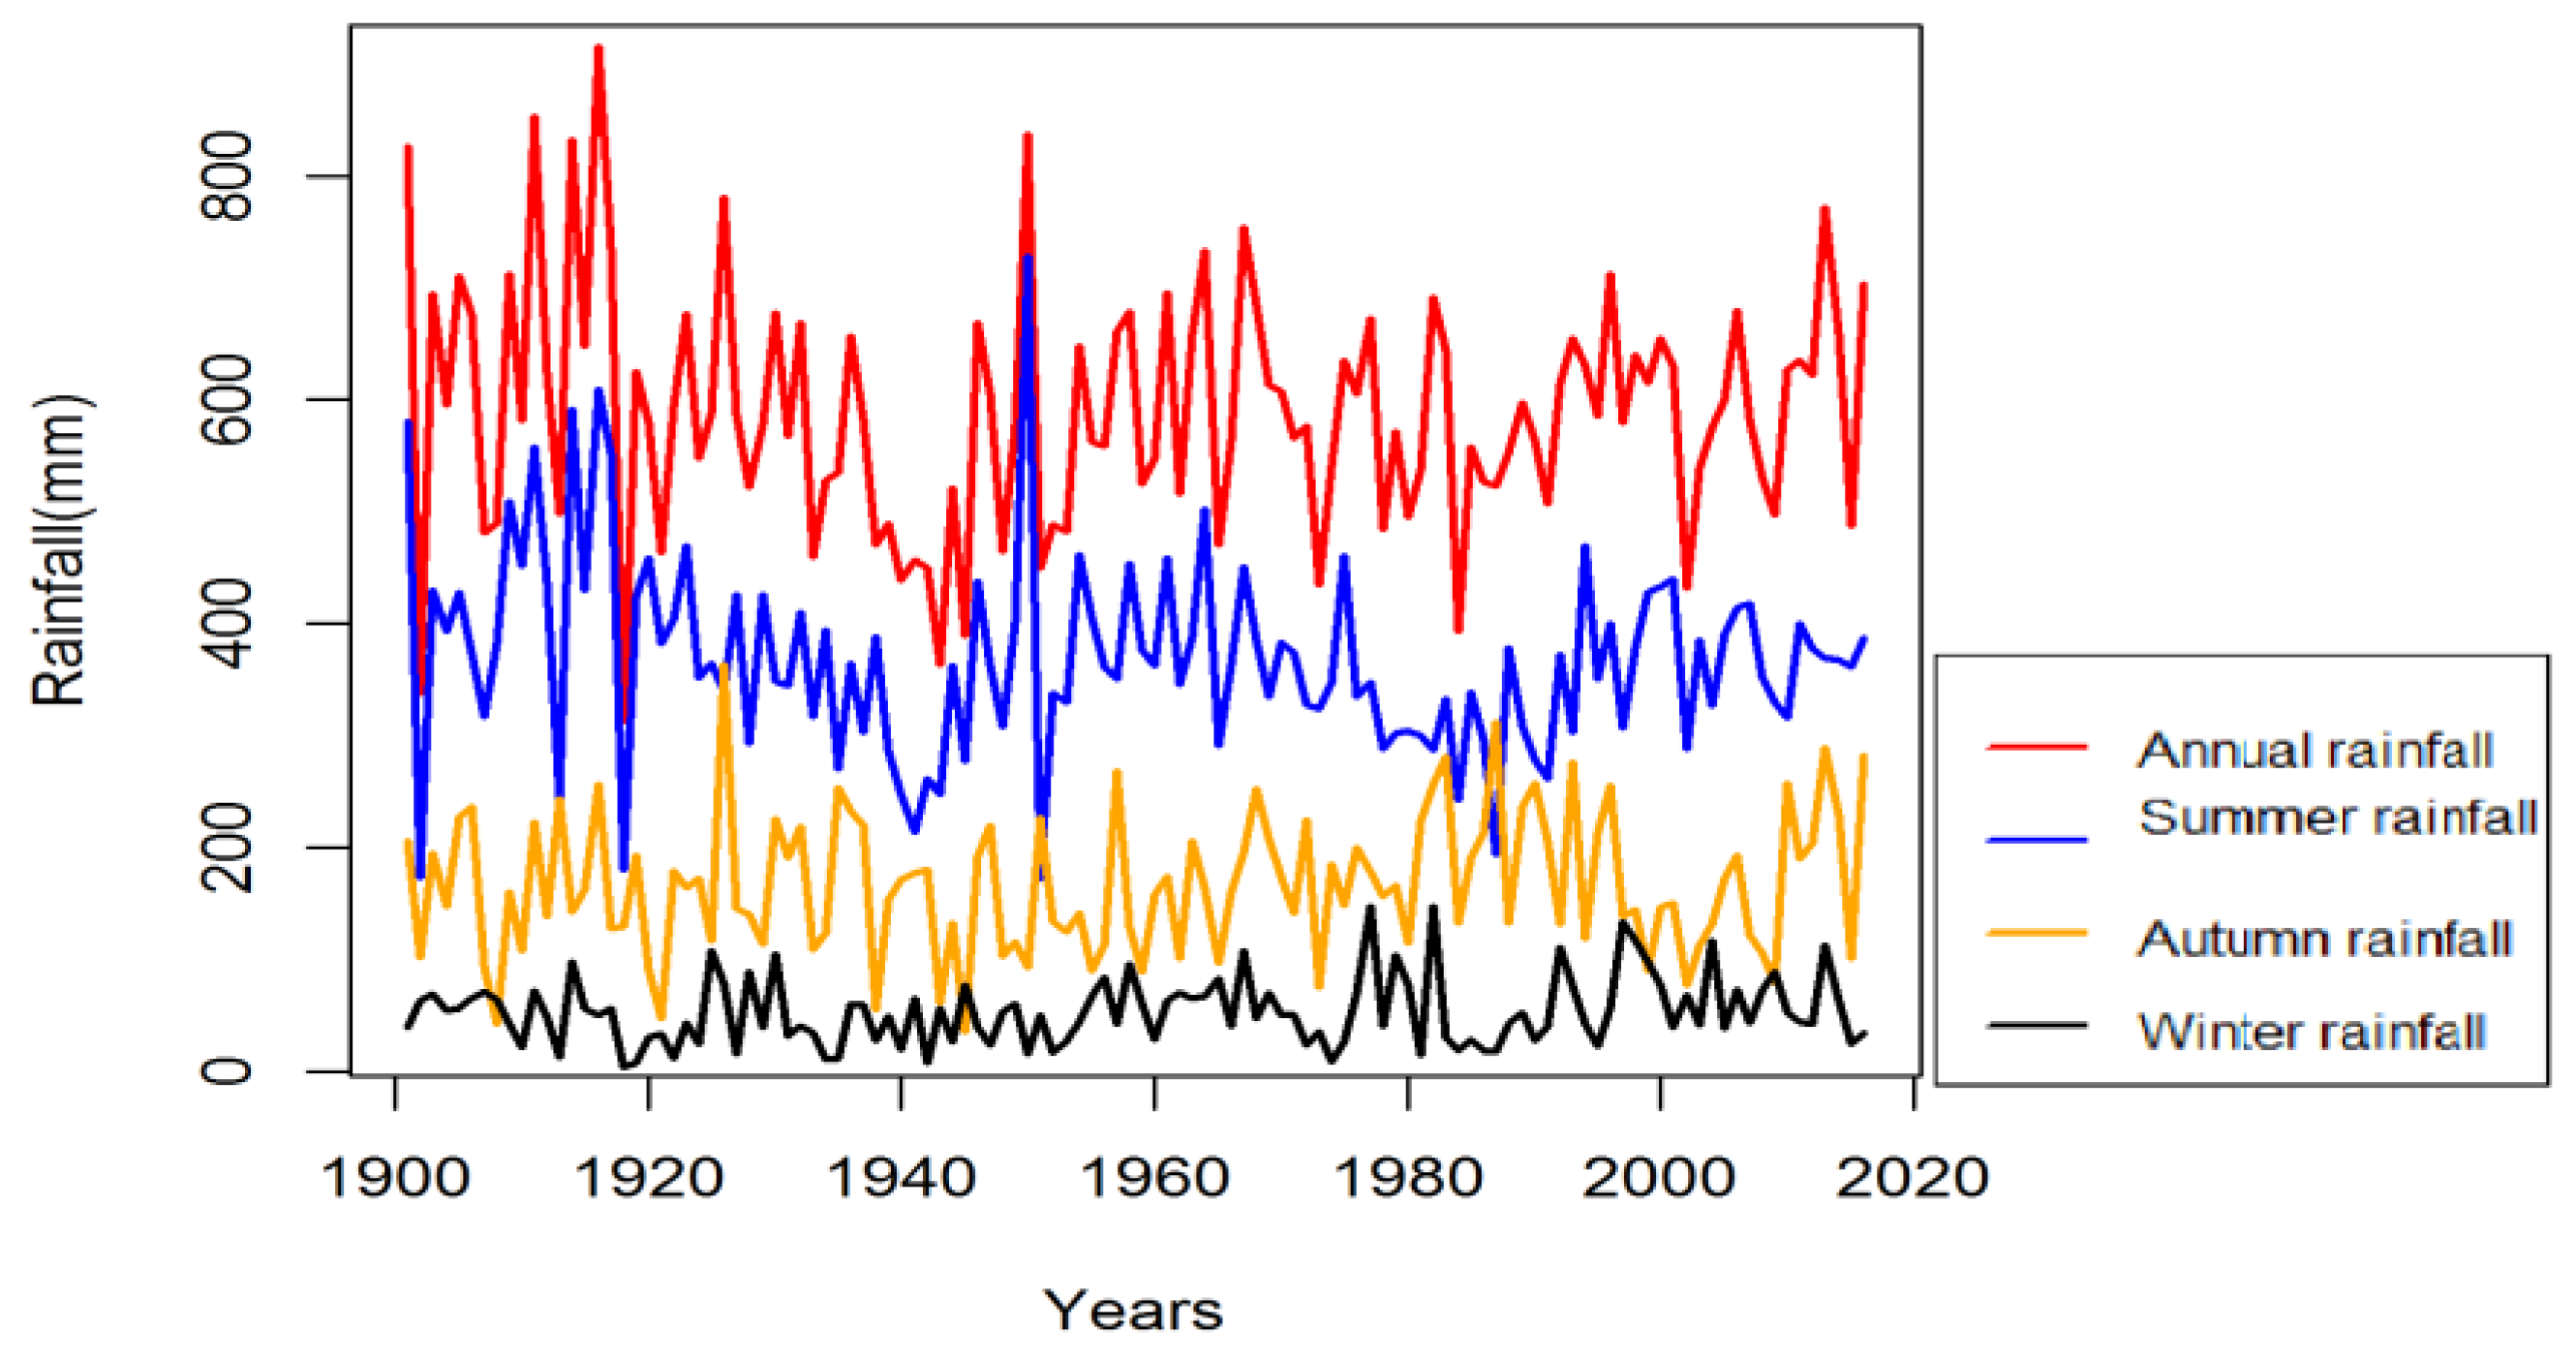
3.3. Trend of Seasonal Rainfall in the Awash River Basin
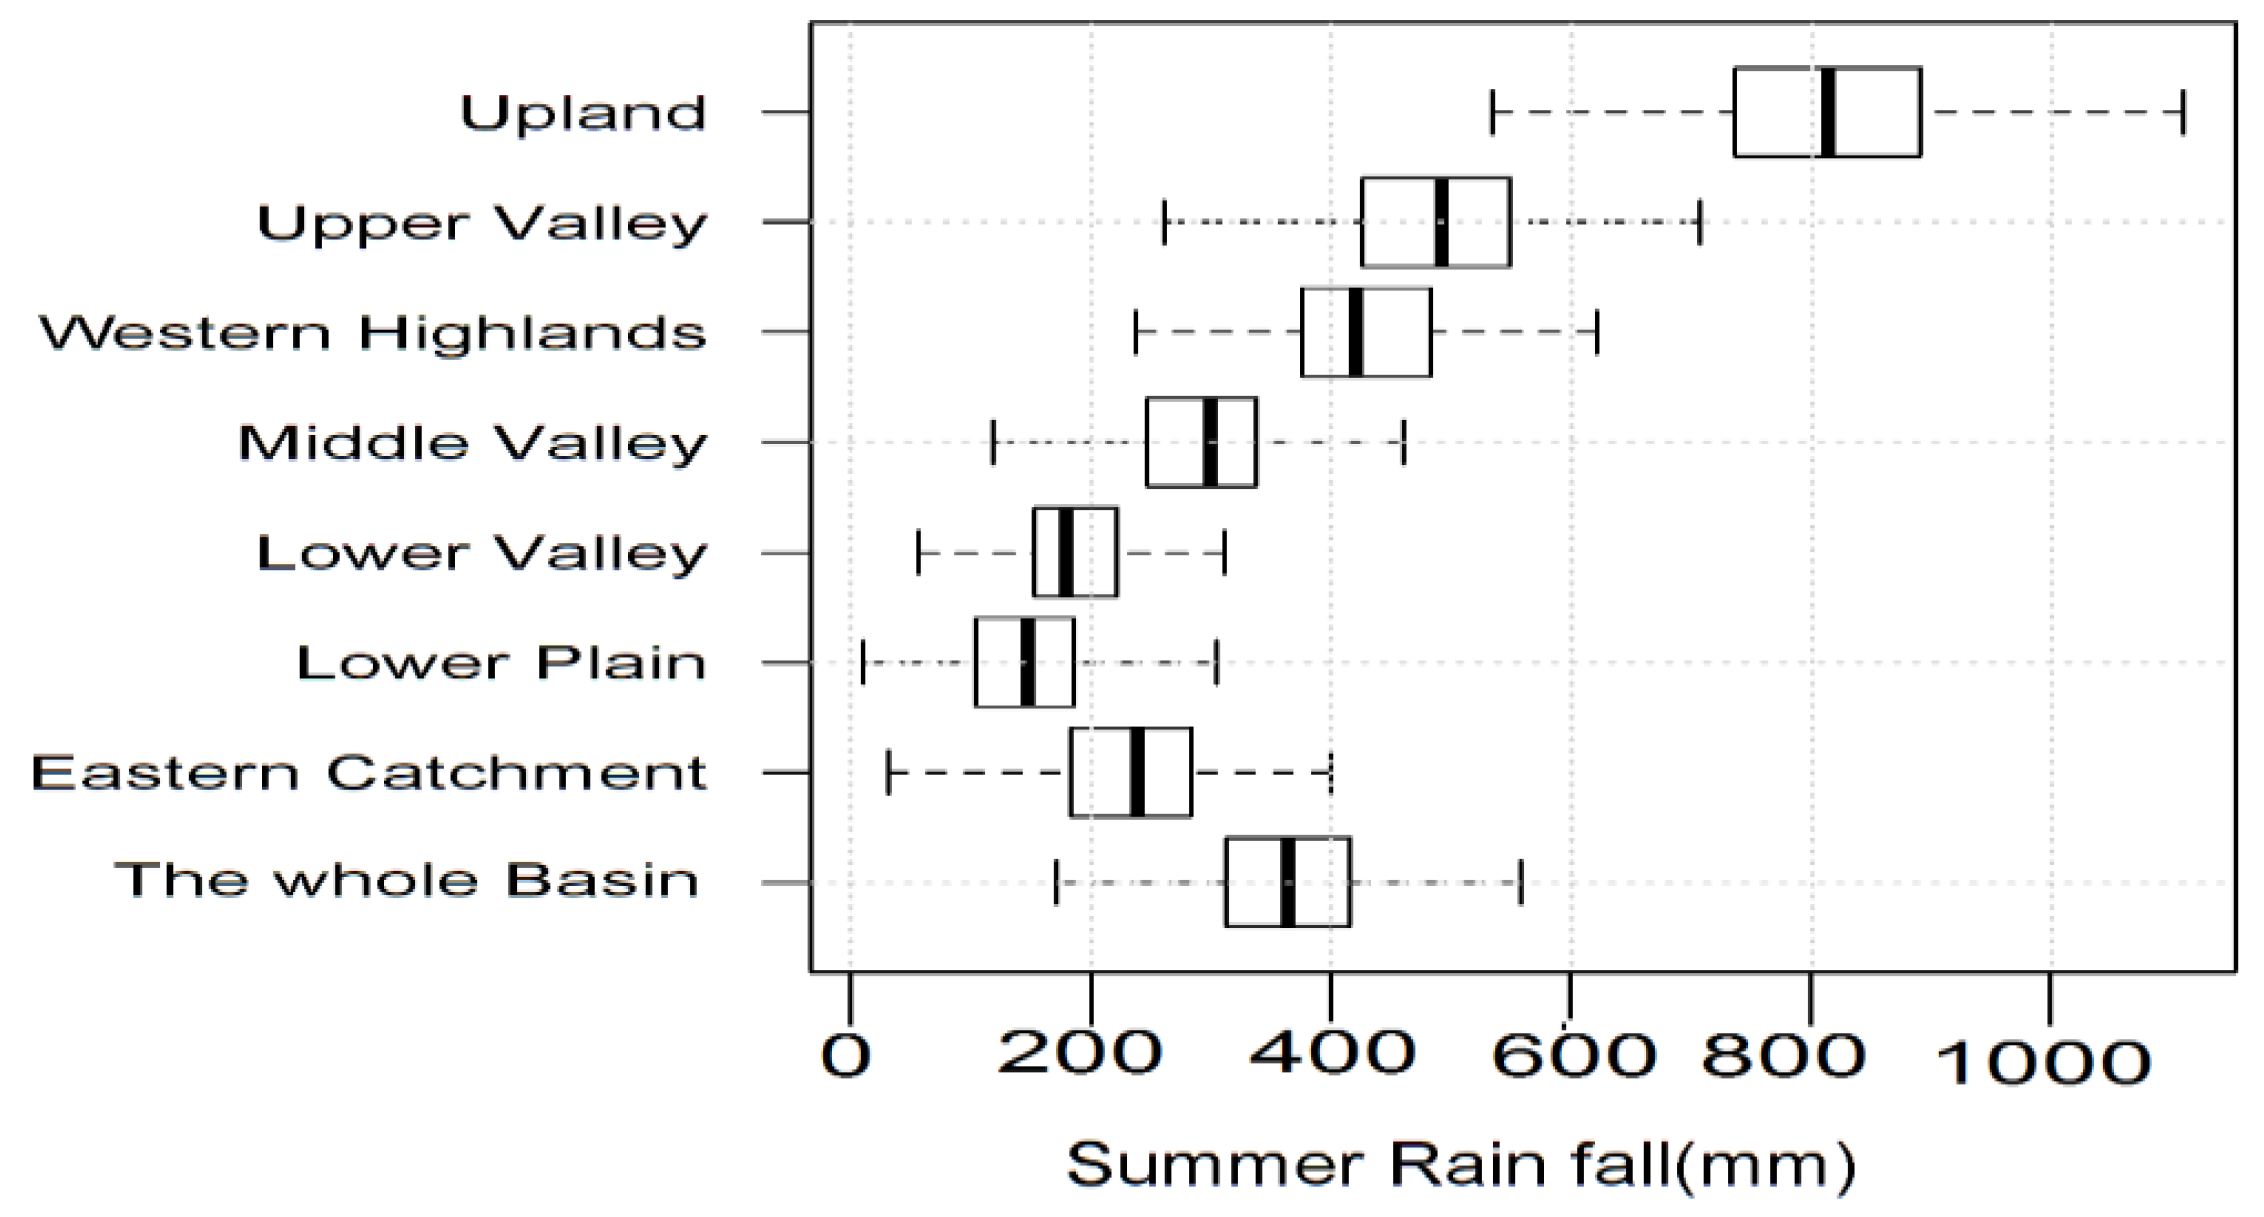
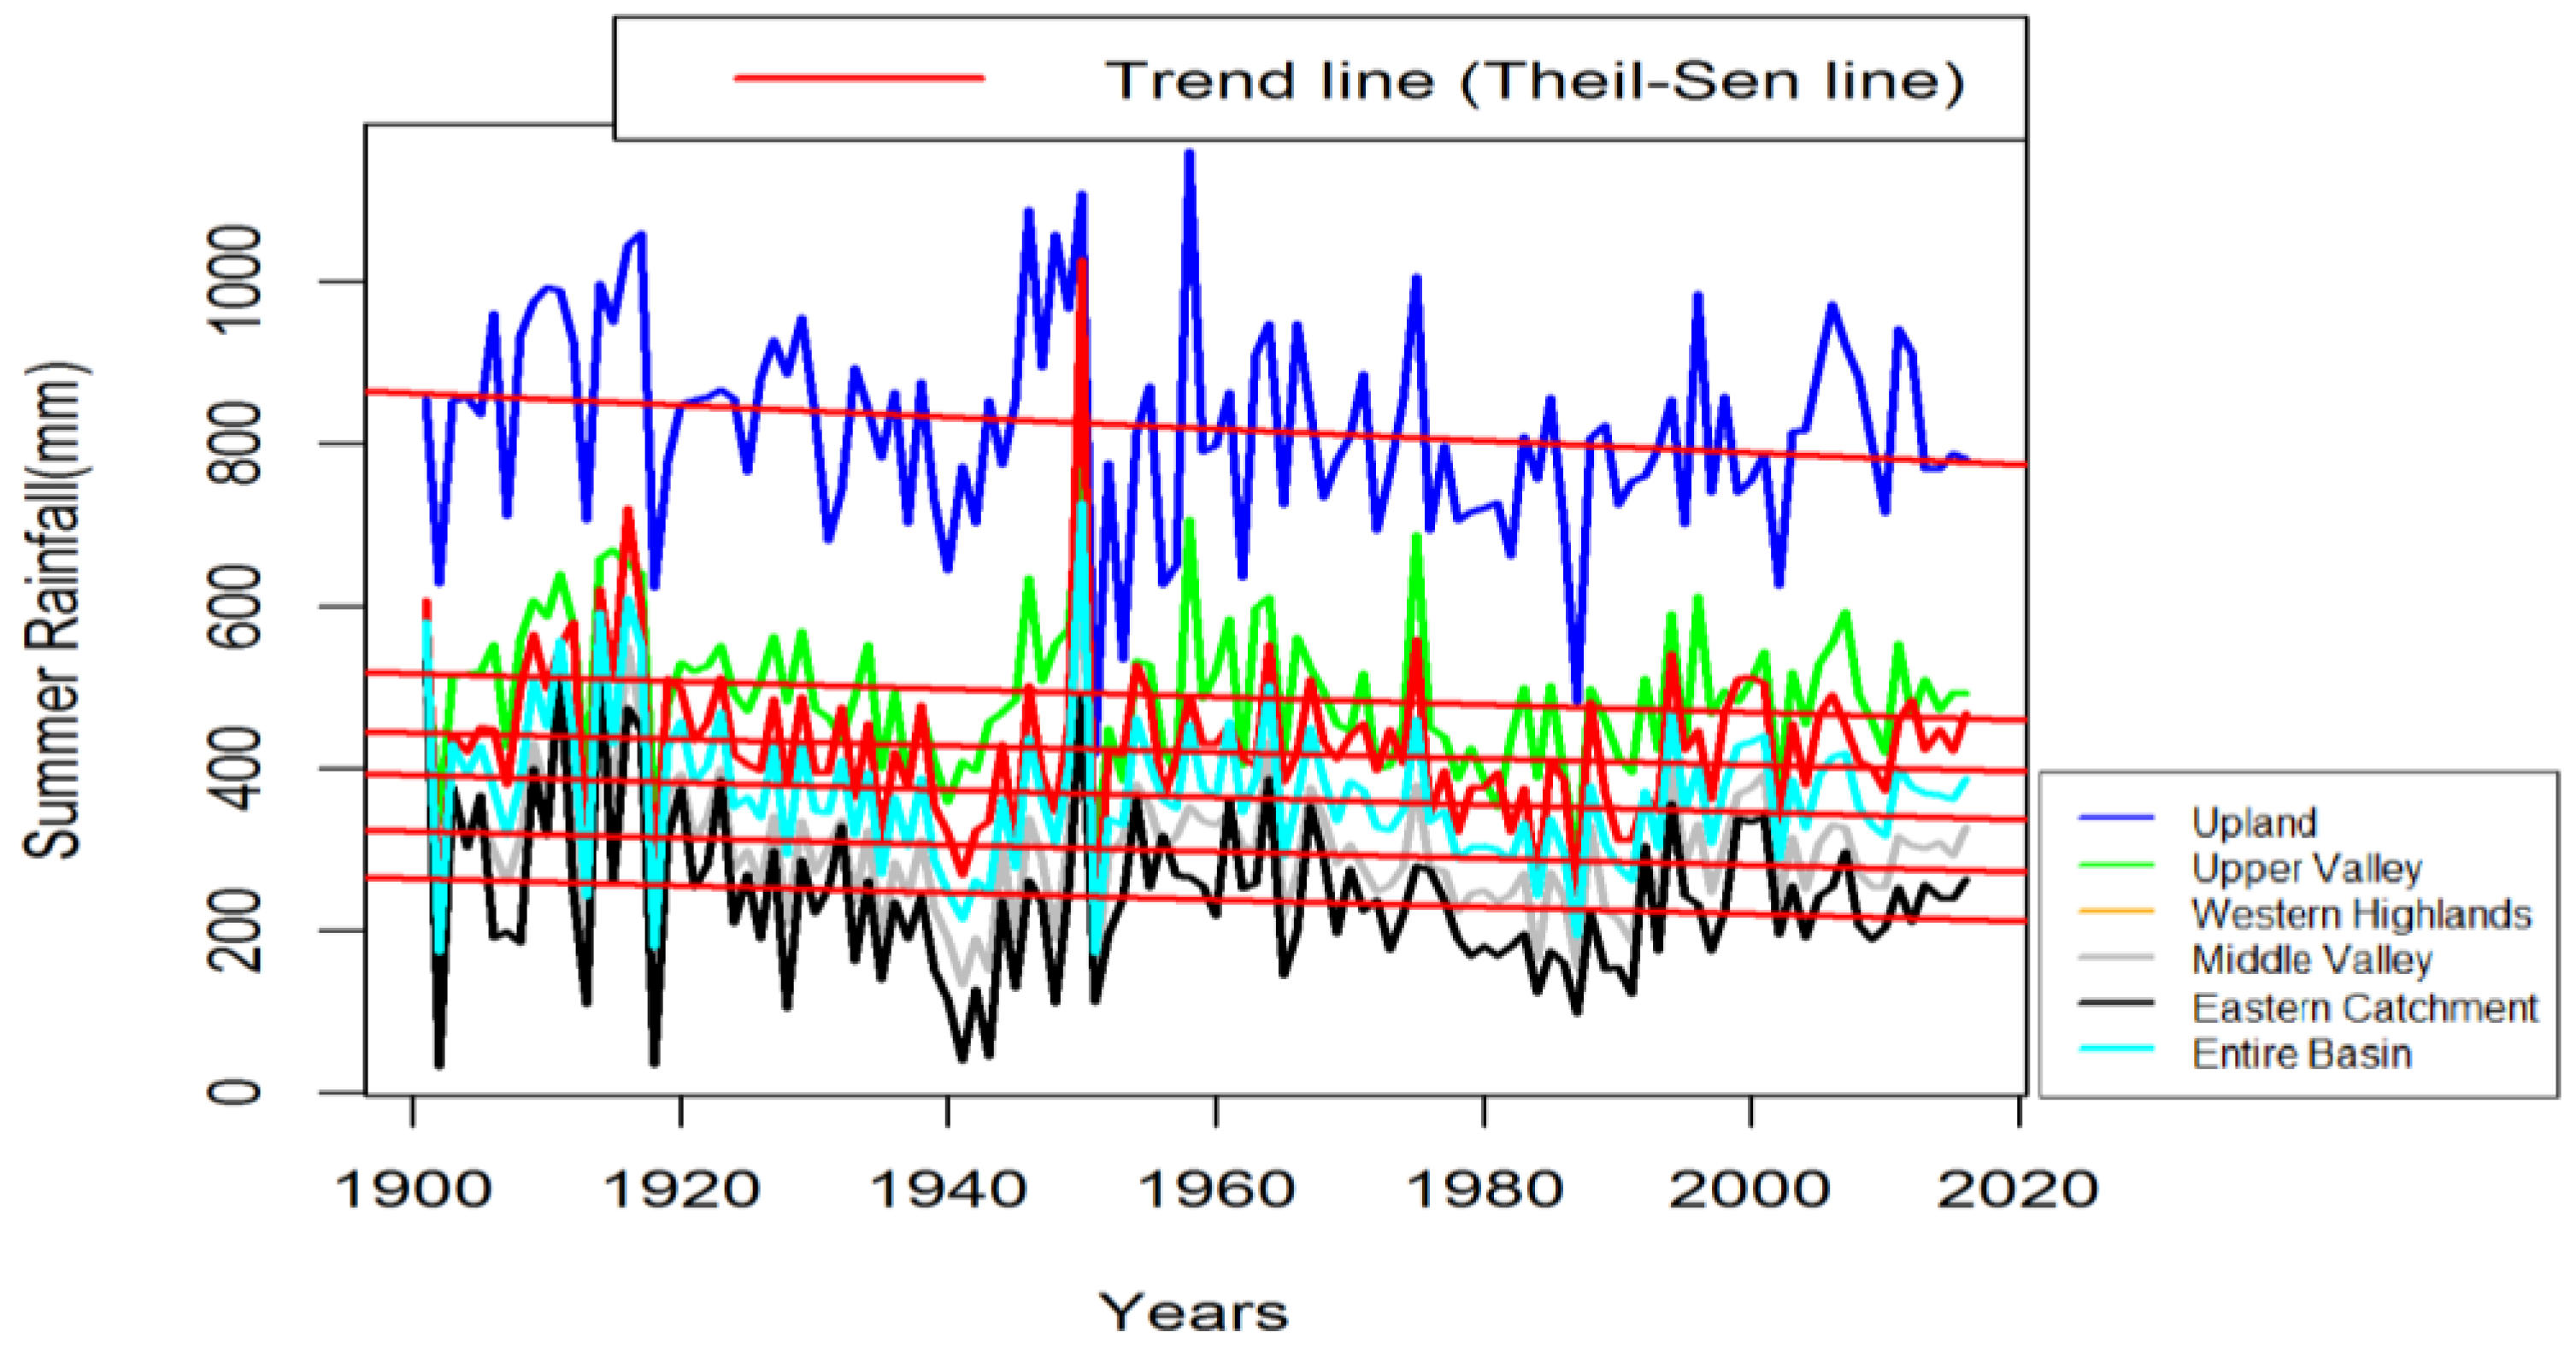
3.3.1. Trends of Summer Rainfall
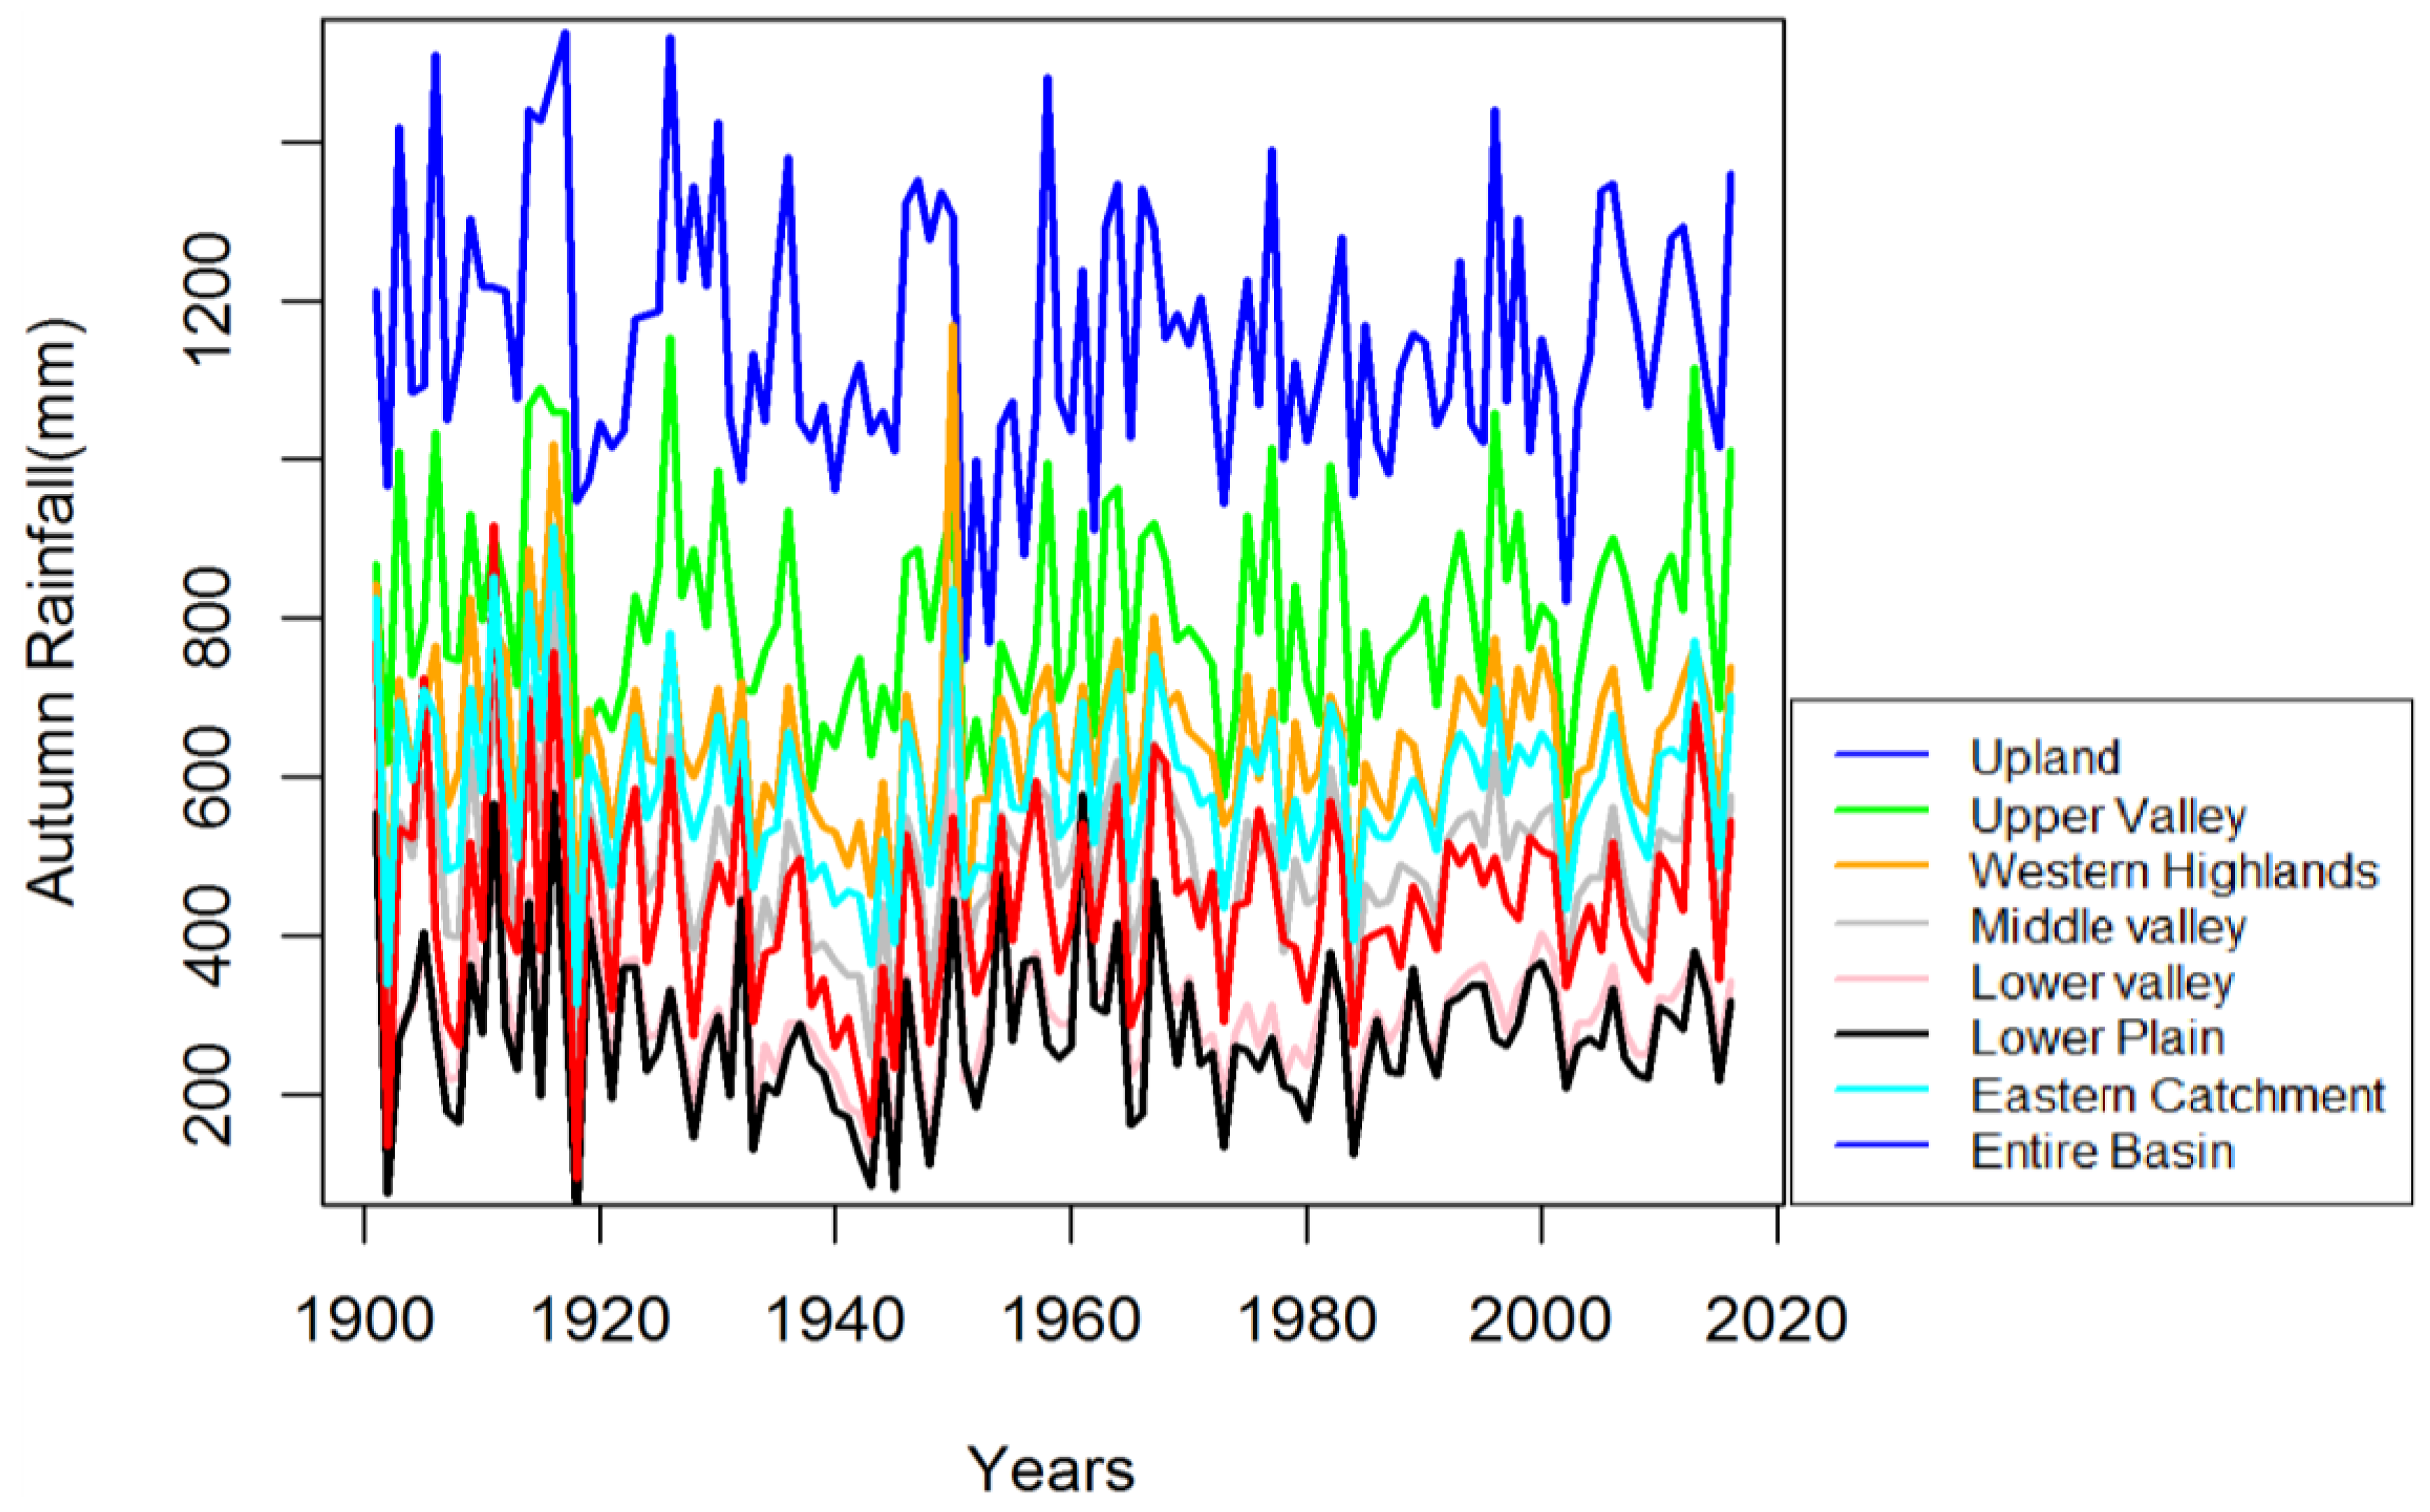
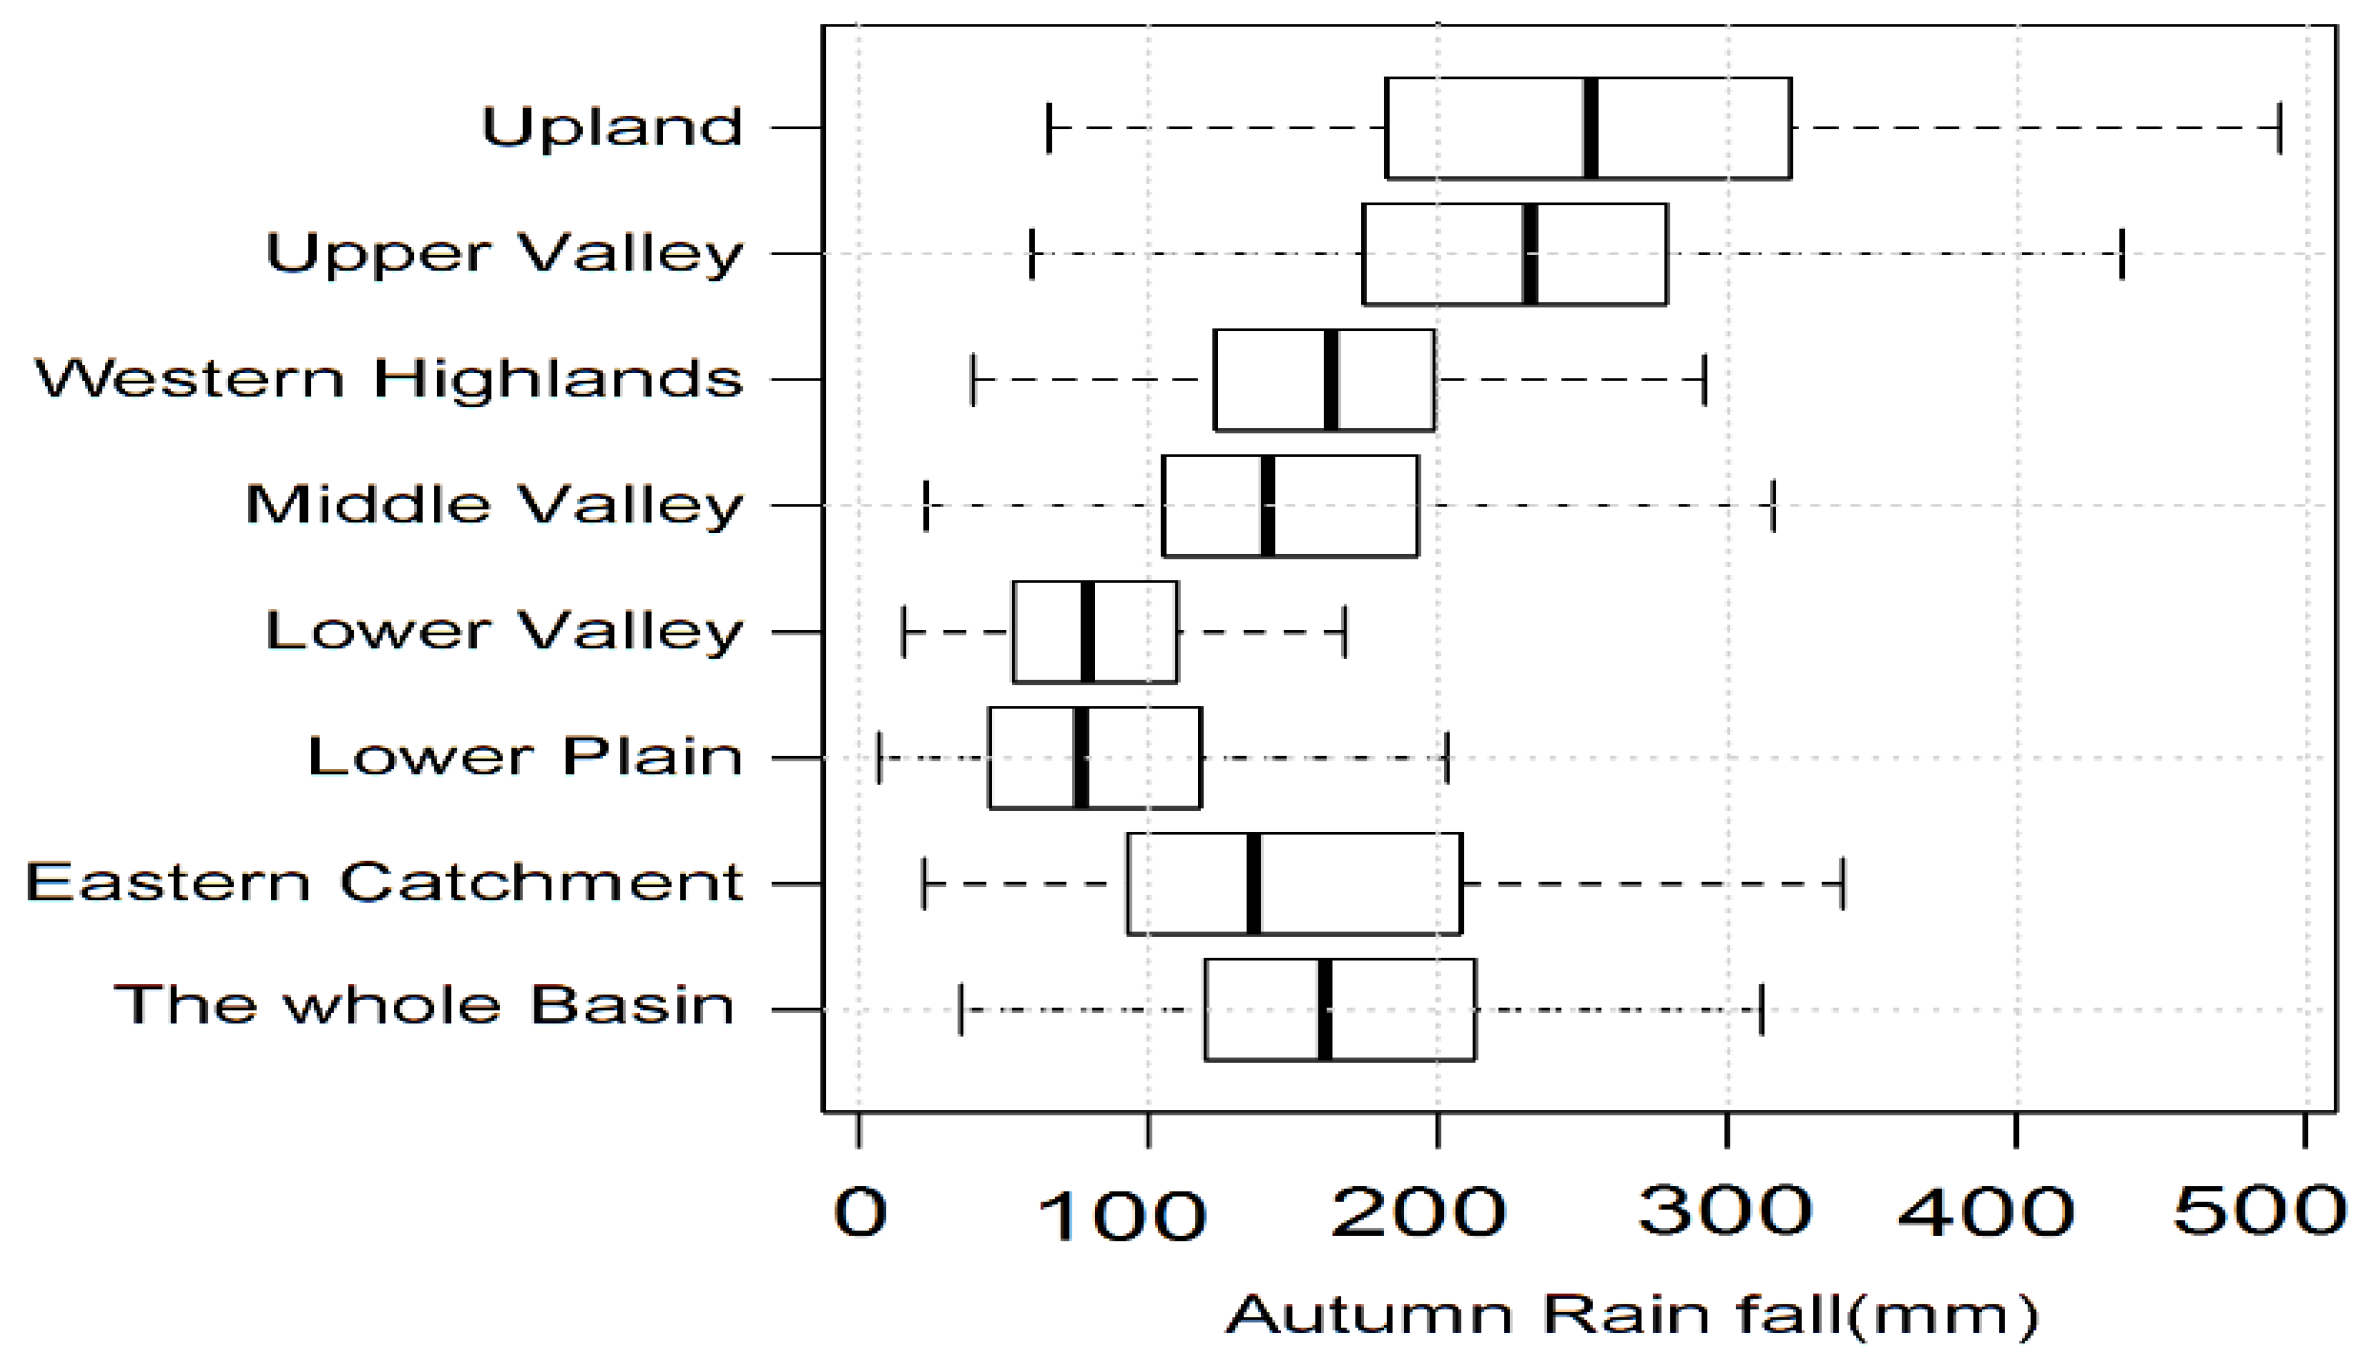
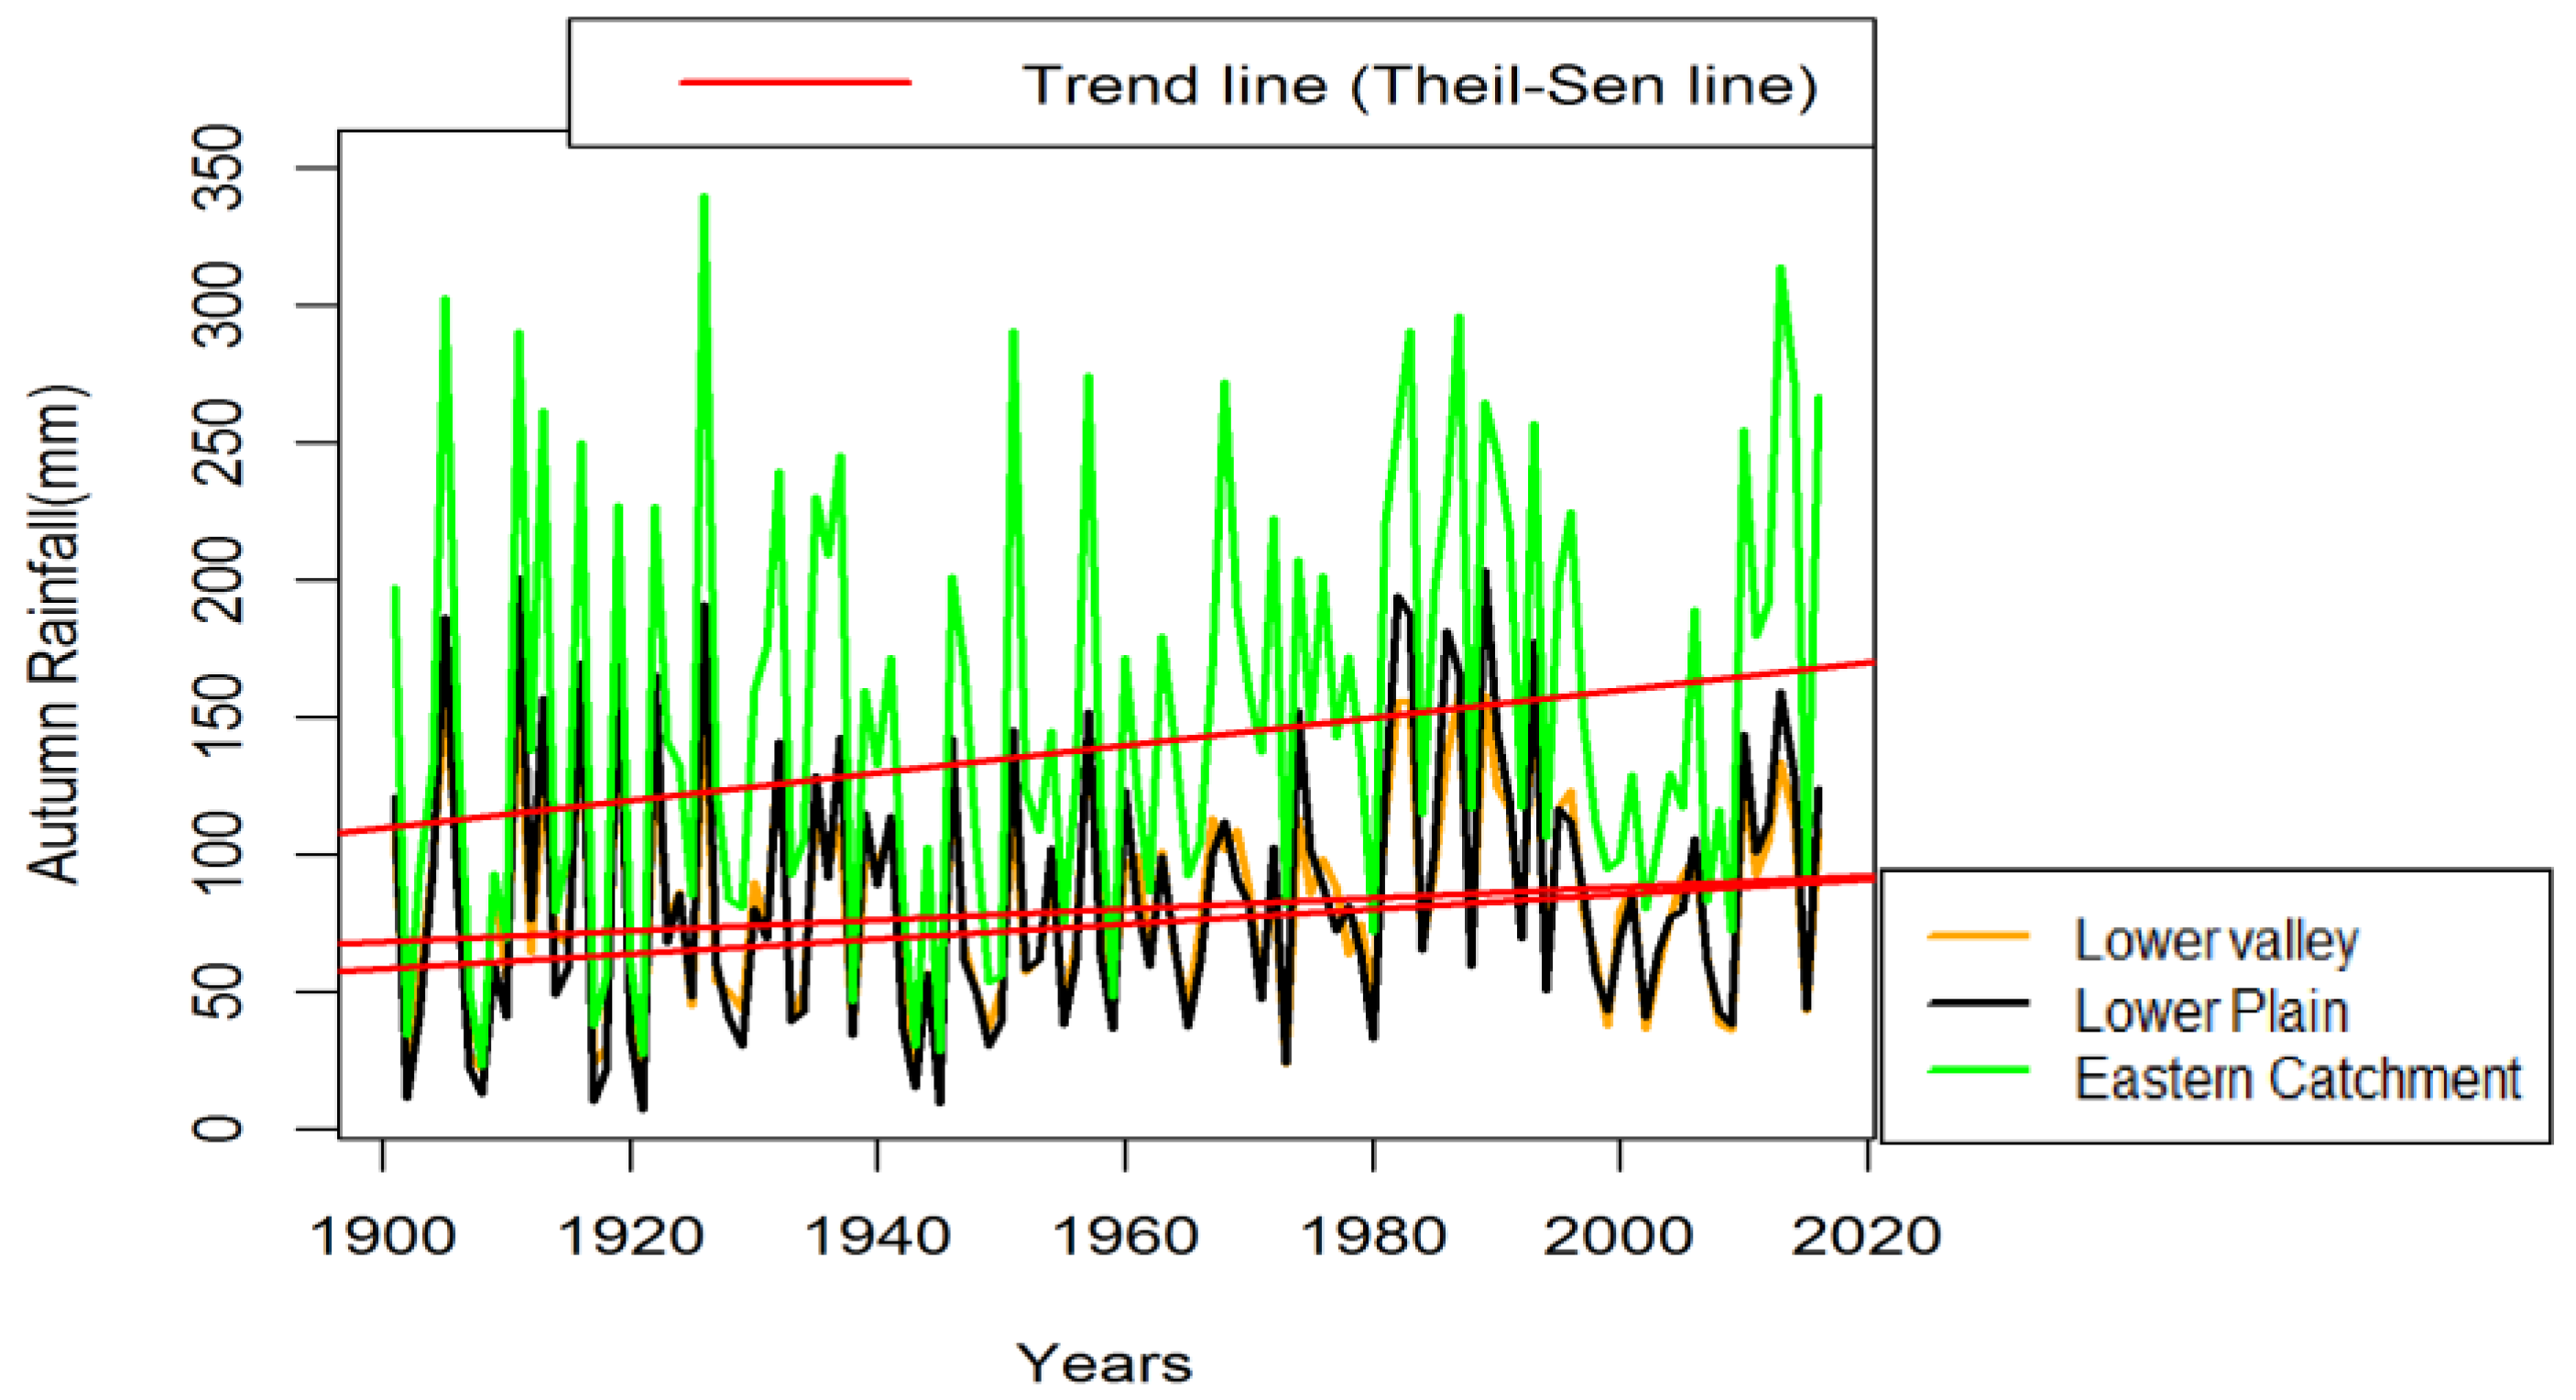
3.3.2. Trends of Autumn Rainfall
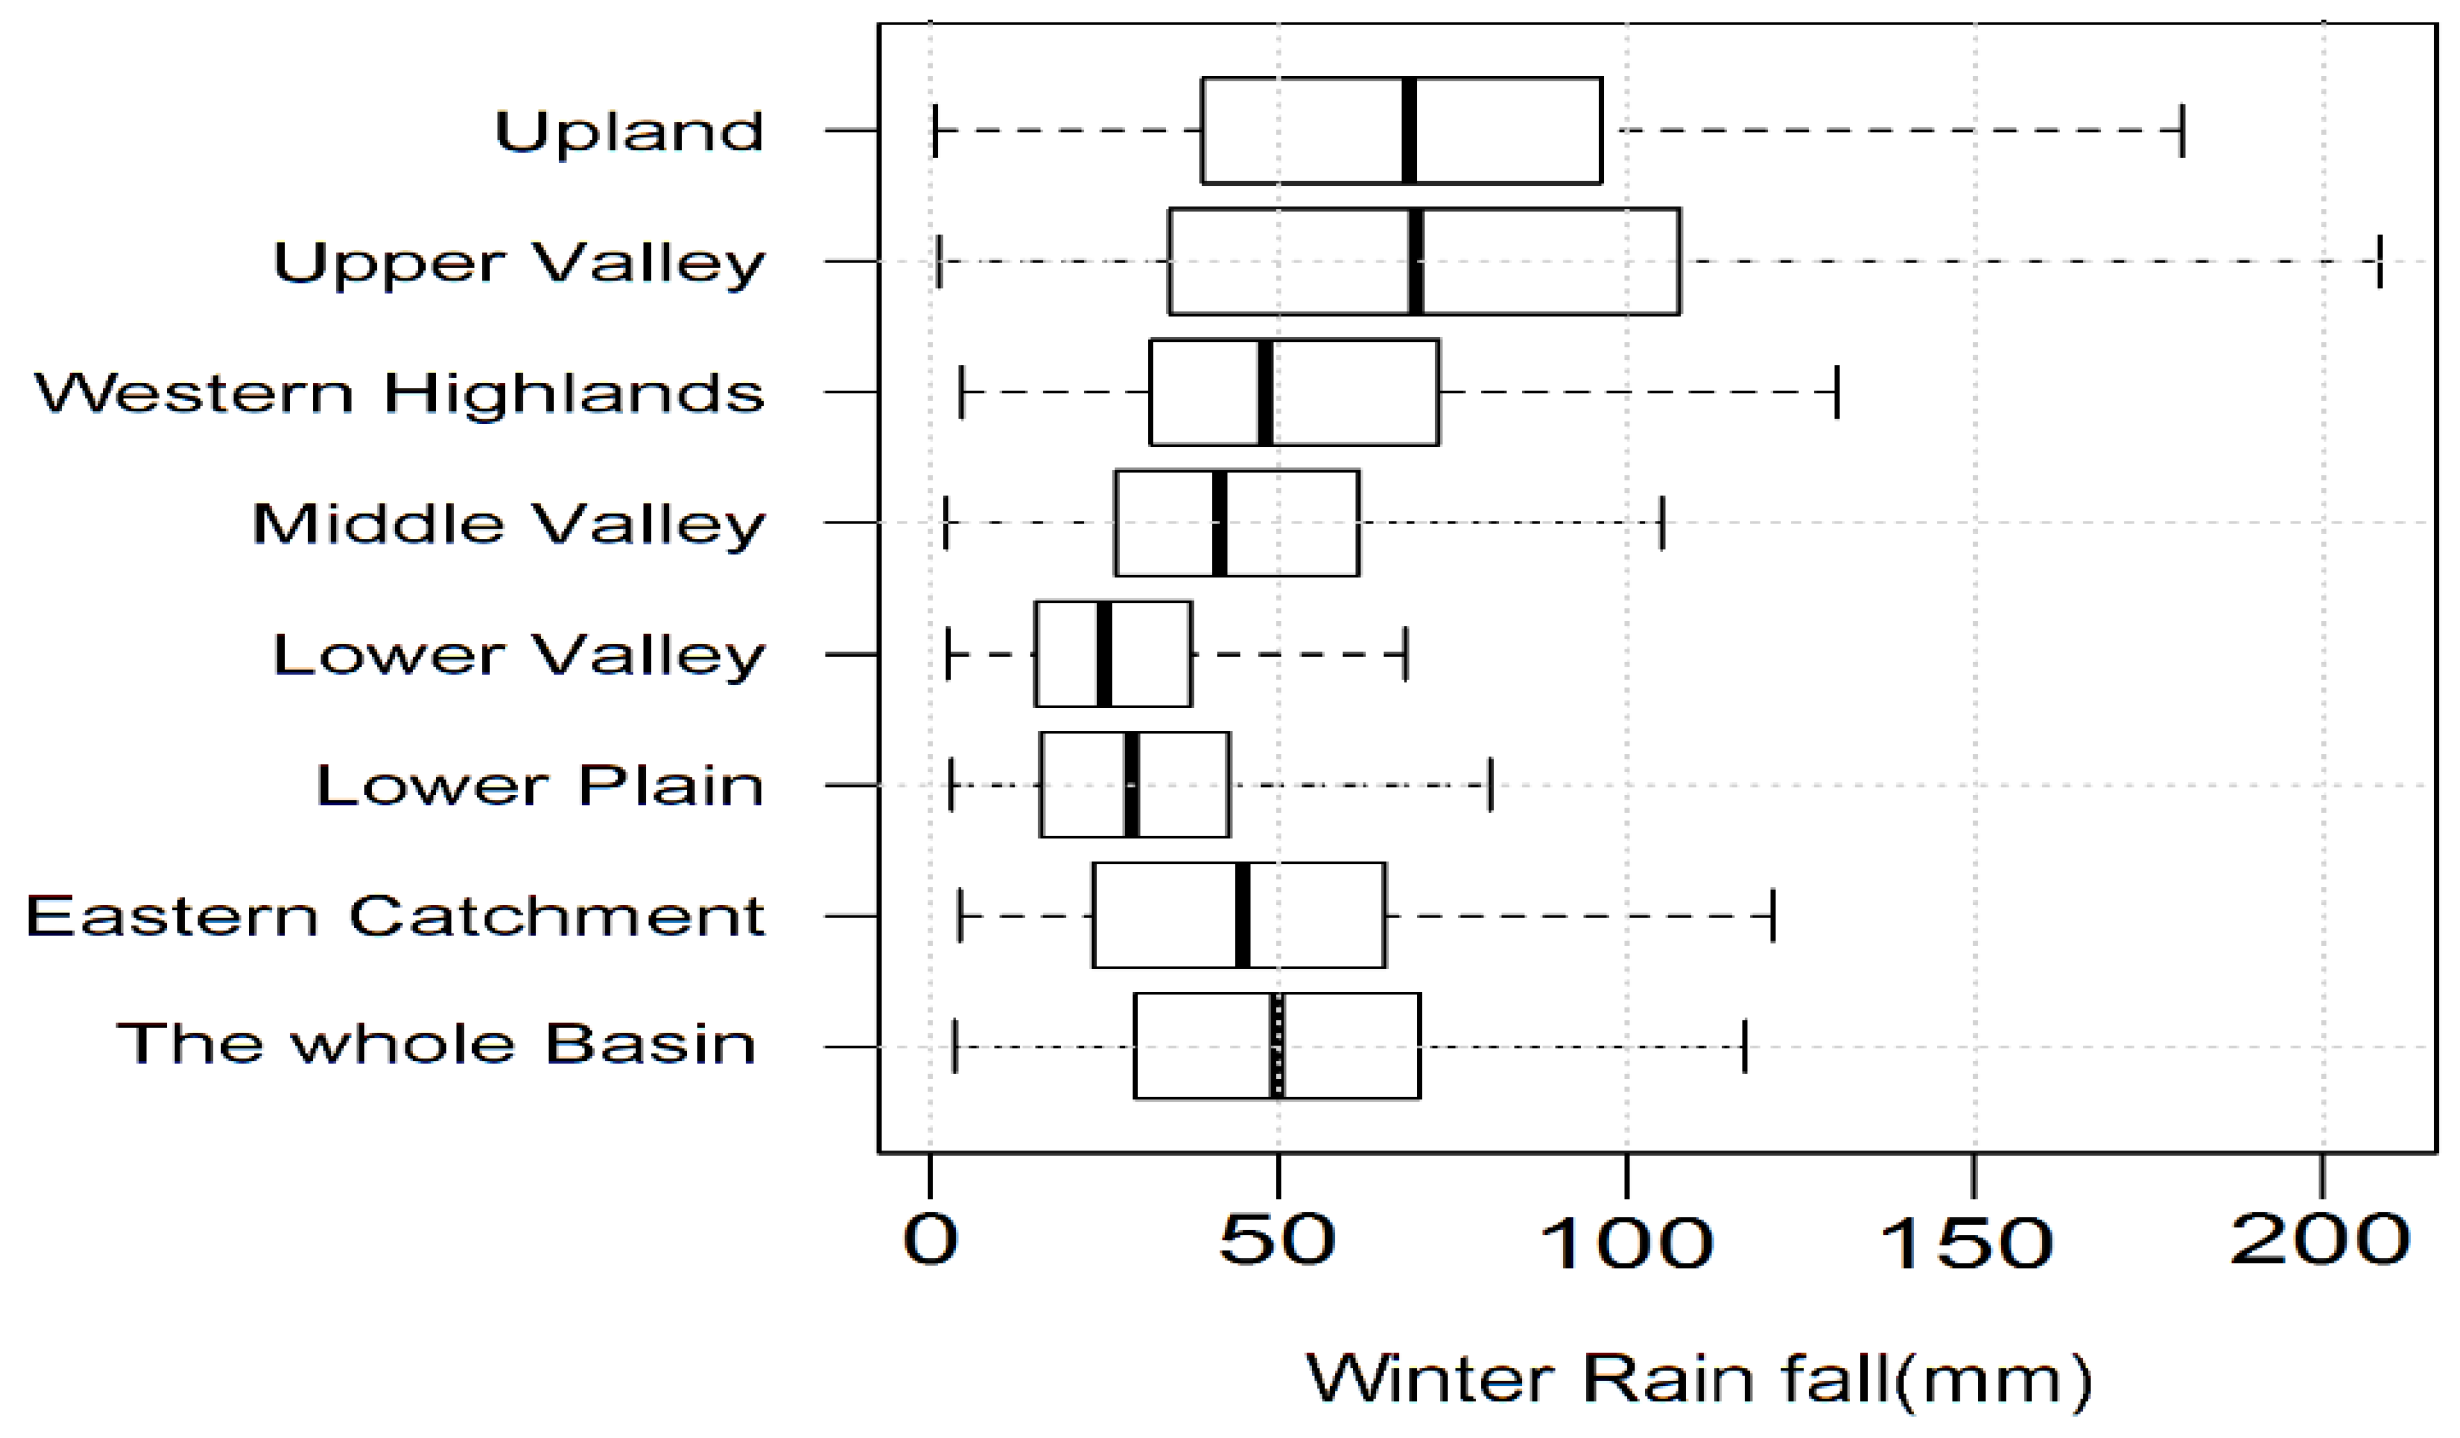
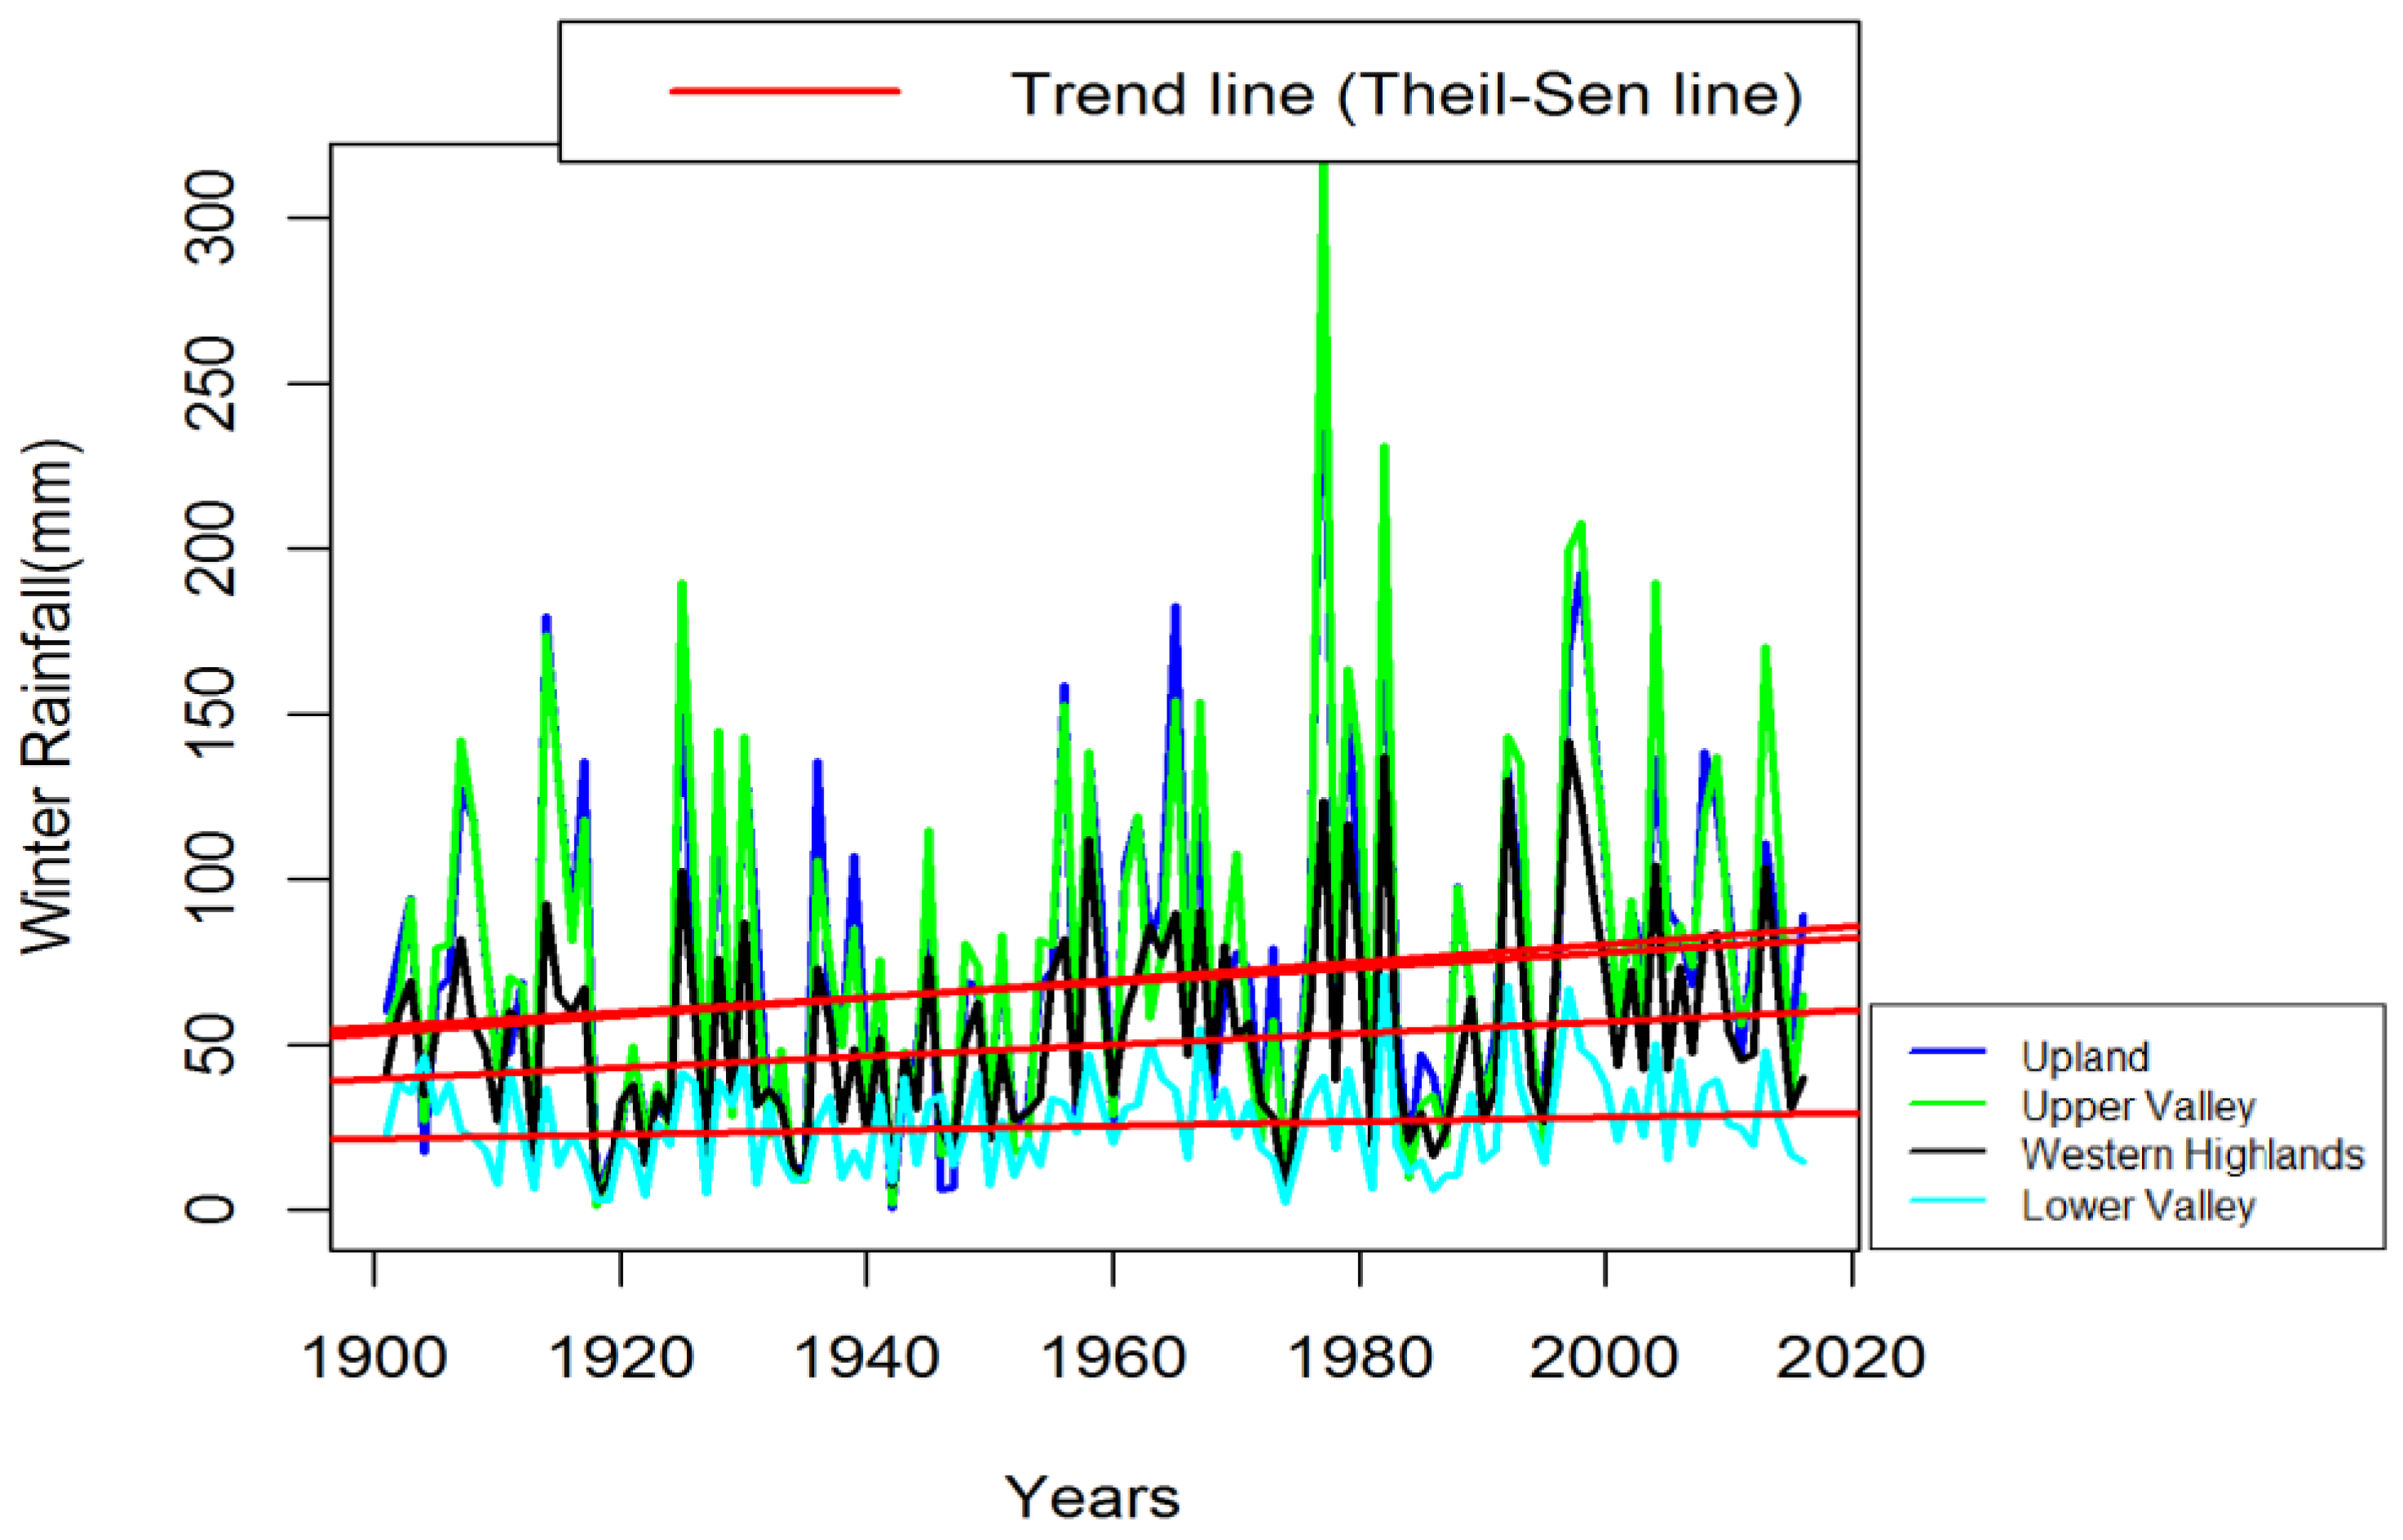
3.3.3. Trends of Winter Rainfall
4. Discussion
5. Conclusions
Author Contributions
Funding
Acknowledgments
Conflicts of Interest
References
- Cheung, W.H.; Senay, G.B.; Singh, A. Trends and spatial distribution of annual and seasonal rainfall in Ethiopia. Int. J. Climatol. 2008, 28. [Google Scholar] [CrossRef]
- Awlachew, S.B. Irrigation Potential in Ethiopia; International Water Management Institute: Colombo, Sri Lanka, 2010; p. 60. [Google Scholar]
- Kerim, T.; Abebe, A.; Hussen, B. Study of Water Allocation for Existing and Future Demands under Changing Climate Condition: Case of Upper Awash Sub River Basin. J. Environ. Earth Sci. 2016, 6, 14. [Google Scholar]
- Edossa, D.C.; Babel, M.S.; Das Gupta, A. Drought Analysis in the Awash River Basin, Ethiopia. Water Resour. Manag. 2010, 24, 1441–1460. [Google Scholar] [CrossRef]
- Vivid Economics. Water Resources and Extreme Events in the Awash Basin: Economic Effects and Policy Implications—Vivid Economics—Putting Economics to Good Use; Vivid Economics: London, UK, 2016. [Google Scholar]
- Adeba, D.; Kansal, M.L.; Sen, S. Assessment of water scarcity and its impacts on sustainable development in Awash basin, Ethiopia. Sustain. Water Resour. Manag. 2015, 1, 71–87. [Google Scholar] [CrossRef]
- IPCC. Climate Change 2007: Synthesis Report. Contribution of Working Groups I, II and III to the Fourth Assessment Report of the Intergovernmental Panel on Climate Change; Pachauri, R.K., Reisinger, A., Eds.; IPCC: Geneva, Switzerland, 2007. [Google Scholar]
- Bates, B.; Kundzewicz, Z.W. Climate Change and Water; IPCC Technical Paper; IPCC: Geneva, Switzerland, 2008; Volume 6, ISBN 978-92-9169-123-4. [Google Scholar]
- IPCC. Climate Change 2014: Synthesis Report. Contribution of Working Groups I, II and III to the Fifth Assessment Report of the Intergovernmental Panel on Climate Change; Pachauri, R.K., Meyer, L.A., Eds.; IPCC: Geneva, Switzerland, 2014. [Google Scholar]
- IPCC. Climate Change 2007: The Physical Science Basis. Contribution of Working Group I to the Fourth Assessment Report of the Intergovernmental Panel on Climate Change; Solomon, S., Qin, D., Manning, M., Chen, Z., Marquis, M., Averyt, K.B., Tignor, M., Miller, H.L., Eds.; Cambridge University Press: Cambridge, UK, 2007. [Google Scholar]
- Kennedy, C. Does “Global Warming” Mean It’s Warming Everywhere? Available online: https://www.climate.gov/news-features/climate-qa/does-global-warming-mean-it%E2%80%99s-warming-everywhere (accessed on 28 March 2019).
- Basistha, A.; Arya, D.S.; Goel, N.K. Analysis of historical changes in rainfall in the Indian Himalayas. Int. J. Climatol. 2009, 29, 555–572. [Google Scholar] [CrossRef]
- Tadege, A. Climate Change National Adaptation Programme of Action (NAPA) of Ethiopia; National Meteorological Services Agency, Ministry of Water Resources, Federal Democratic Republic of Ethiopia: Addis, Ababa, 2007; p. 96.
- Seleshi, Y.; Zanke, U. Recent changes in rainfall and rainy days in Ethiopia. Int. J. Climatol. 2004, 24, 973–983. [Google Scholar] [CrossRef]
- Viste, E.; Korecha, D.; Sorteberg, A. Recent drought and precipitation tendencies in Ethiopia. Theor. Appl. Climatol. 2013, 112, 535–551. [Google Scholar] [CrossRef]
- Teyso, T.; Anjulo, A. Spatio-temporal Variability and Trends of Rainfall and Temperature over Gamo Gofa Zone, Ethiopia. J. Sci. Res. Rep. 2016, 12, 1–11. [Google Scholar] [CrossRef]
- Alemayehu, A.; Bewket, W. Local spatiotemporal variability and trends in rainfall and temperature in the central highlands of Ethiopia. Geogr. Ann. Ser. A Phys. Geogr. 2017, 99, 85–101. [Google Scholar] [CrossRef]
- Bekele, D.; Alamirew, T.; Kebede, A.; Zeleke, G.; Melese, A.M. Analysis of rainfall trend and variability for agricultural water management in Awash River Basin, Ethiopia. J. Water Clim. Chang. 2017, 8, 127–141. [Google Scholar] [CrossRef]
- Mohammed, Y. Variability and trends of rainfall extreme events in north east highlands of Ethiopia. Int. J. Hydrol. 2018, 2, 594–605. [Google Scholar]
- Rosell, S. Regional perspective on rainfall change and variability in the central highlands of Ethiopia, 1978–2007. Appl. Geogr. 2011, 31, 329–338. [Google Scholar] [CrossRef]
- Asfaw, A.; Simane, B.; Hassen, A.; Bantider, A. Variability and time series trend analysis of rainfall and temperature in northcentral Ethiopia: A case study in Woleka sub-basin. Weather Clim. Extrem. 2018, 19, 29–41. [Google Scholar] [CrossRef]
- Chebana, F.; Ouarda, T.B.M.J.; Duong, T.C. Testing for multivariate trends in hydrologic frequency analysis. J. Hydrol. 2013, 486, 519–530. [Google Scholar] [CrossRef]
- Degefu, M.A.; Bewket, W. Variability and trends in rainfall amount and extreme event indices in the Omo-Ghibe River Basin, Ethiopia. Reg. Environ. Chang. 2014, 14, 799–810. [Google Scholar] [CrossRef]
- He, M.; Gautam, M. Variability and Trends in Precipitation, Temperature and Drought Indices in the State of California. Hydrology 2016, 3, 14. [Google Scholar] [CrossRef]
- Collins, J.M. Temperature Variability over Africa. J. Clim. 2011, 24, 3649–3666. [Google Scholar] [CrossRef]
- Jury, M.R.; Funk, C. Climatic trends over Ethiopia: Regional signals and drivers. Int. J. Climatol. 2013, 33, 1924–1935. [Google Scholar] [CrossRef]
- Marshall, M.; Funk, C.; Michaelsen, J. Examining evapotranspiration trends in Africa. Clim. Dyn. 2012, 38, 1849–1865. [Google Scholar] [CrossRef]
- Mengistu, D.; Bewket, W.; Lal, R. Recent spatiotemporal temperature and rainfall variability and trends over the Upper Blue Nile River Basin, Ethiopia. Int. J. Climatol. 2013, 34, 2278–2292. [Google Scholar] [CrossRef]
- Tesemma, Z.K.; Mohamed, Y.A.; Steenhuis, T.S. Trends in Rainfall and Runoff in the Blue Nile Basin: 1964–2003. Available online: https://onlinelibrary.wiley.com/doi/abs/10.1002/hyp.7893 (accessed on 5 March 2019).
- Ye, L.; Zhou, J.; Zeng, X.; Tayyab, M. Hydrological Mann-Kendal Multivariate Trends Analysis in the Upper Yangtze River Basin. J. Geosci. Environ. Prot. 2015, 3, 34–39. [Google Scholar] [CrossRef]
- Wagesho, N.; Goel, N.K.; Jain, M.K. Temporal and spatial variability of annual and seasonal rainfall over Ethiopia. Hydrol. Sci. J. 2013, 58, 354–373. [Google Scholar] [CrossRef]
- Rao, P.; Solomon, A. Trend analysis and adaptation strategies of climate change in north central Ethiopia. Int. J. Agric. Sci. Res. 2013, 3, 253–262. [Google Scholar]
- KHalili, K.; Ahmadi, F.; Dinpashoh, Y.; Fard, A.F. Determination of Climate Changes on Streamflow Process in the West of Lake Urmia with Used to Trend and Stationarity Analysis. Int. J. Adv. Biol. Biomed. Res. 2013, 1, 1220–1235. [Google Scholar]
- Mellander, P.-E.; Gebrehiwot, S.G.; Gärdenäs, A.I.; Bewket, W.; Bishop, K. Summer Rains and Dry Seasons in the Upper Blue Nile Basin: The Predictability of Half a Century of Past and Future Spatiotemporal Patterns. PLoS ONE 2013, 8, e68461. [Google Scholar] [CrossRef]
- Awulachew, S.B.; Yilma, A.D.; Loulseged, M.; Ayana, M.; Alamirew, T. Water Resources and Irrigation Development in Ethiopia; International Water Management Institute: Colombo, Sri Lanka, 2007; ISBN 978-92-9090-680-3. [Google Scholar]
- Dost, R.; Obando, E.B.; Bastiaanssen, W.; Hoogeveen, J. Coping with Water Scarcity—Developing National Water Audits Africa; Water Watch: Addis Ababa, Ethiopia, 2013; p. 56. [Google Scholar]
- Karimi, P.; Bastiaanssen, W.G.M.; Sood, A.; Hoogeveen, J.; Peiser, L.; Bastidas-Obando, E.; Dost, R.J. Spatial evapotranspiration, rainfall and land use data in water accounting—Part 2: Reliability of water acounting results for policy decisions in the Awash Basin. Hydrol. Earth Syst. Sci. 2015, 19, 533–550. [Google Scholar] [CrossRef]
- Addisu, S.; Selassie, Y.G.; Fissha, G.; Gedif, B. Time series trend analysis of temperature and rainfall in lake Tana Sub-basin, Ethiopia. Environ. Syst. Res. 2015, 4, 25. [Google Scholar] [CrossRef]
- Pingale, S.M.; Khare, D.; Jat, M.K.; Adamowski, J. Trend analysis of climatic variables in an arid and semi-arid region of the Ajmer District, Rajasthan, India. J. Water Land Dev. 2016, 28, 3–18. [Google Scholar] [CrossRef]
- Steffen, M. CRAN-Package imputeTS. R J. 2019, 1, 207–218. [Google Scholar]
- National Meteorological Agency National Meteorology Agency: Other Forecasts. Available online: http://www.ethiomet.gov.et/other_forecasts/seasonal_forecast (accessed on 3 March 2019).
- Seleshi, Y.; Camberlin, P. Recent changes in dry spell and extreme rainfall events in Ethiopia. Theor. Appl. Climatol. 2006, 83, 181–191. [Google Scholar] [CrossRef]
- Walker, B. Seasonal Weather Assessment for Ethiopia during March–July 2016—Ethiopia; Met office: Exeter, UK, 2016. [Google Scholar]
- Pohlert, T. Trend: Non-Parametric Trend Tests and Change-Point Detection 2018; The R Project for Statistical Computing: Vienna, Austria, 2018. [Google Scholar]
- Abeysingha, N.S.; Singh, M.; Sehgal, V.K.; Khanna, M.; Pathak, H. Analysis of trends in streamflow and its linkages with rainfall and anthropogenic factors in Gomti River basin of North India. Theor. Appl. Climatol. 2016, 123, 785–799. [Google Scholar] [CrossRef]
- Blain, G.C. The modified Mann-Kendall test: On the performance of three variance correction approaches. Bragantia 2013, 72, 416–425. [Google Scholar] [CrossRef]
- Patakamuri, S.K.; O’Brien, N. Modifiedmk: Modified Versions of Mann Kendall and Spearman’s Rho Trend Tests 2019; The R Project for Statistical Computing: Vienna, Austria, 2019. [Google Scholar]
- Khaliq, M.N.; Ouarda, T.B.M.J.; Gachon, P.; Sushama, L.; St-Hilaire, A. Identification of hydrological trends in the presence of serial and cross correlations: A review of selected methods and their application to annual flow regimes of Canadian rivers. J. Hydrol. 2009, 368, 117–130. [Google Scholar] [CrossRef]
- Hamed, K.H. Exact distribution of the Mann–Kendall trend test statistic for persistent data. J. Hydrol. 2009, 365, 86–94. [Google Scholar] [CrossRef]
- Dinku, T.; Connor, S.J.; Ceccato, P.; Ropelewski, C.F. Comparison of global gridded precipitation products over a mountainous region of Africa. Int. J. Climatol. 2008, 28, 1627–1638. [Google Scholar] [CrossRef]
- Ahmed, K.; Shahid, S.; Wang, X.; Nawaz, N.; Khan, N. Evaluation of Gridded Precipitation Datasets over Arid Regions of Pakistan. Water 2019, 11, 210. [Google Scholar] [CrossRef]
- Nashwan, M.S.; Shahid, S.; Wang, X. Uncertainty in Estimated Trends Using Gridded Rainfall Data: A Case Study of Bangladesh. Water 2019, 11, 349. [Google Scholar] [CrossRef]
- Tozer, C.R.; Kiem, A.S.; Verdon-Kidd, D.C. On the uncertainties associated with using gridded rainfall data as a proxy for observed. Hydrol. Earth Syst. Sci. 2012, 16, 1481–1499. [Google Scholar] [CrossRef]
- Urgessa, G. Spatial and Temporal Uncertainty of Rainfall in Arid and Semi-Arid Areas of Ethiopia. Sci. Technol. Arts Res. J. 2014, 2, 106–113. [Google Scholar] [CrossRef]
- Liebmann, B.; Hoerling, M.P.; Funk, C.; Bladé, I.; Dole, R.M.; Allured, D.; Quan, X.; Pegion, P.; Eischeid, J.K. Understanding Recent Eastern Horn of Africa Rainfall Variability and Change. J. Clim. 2014, 27, 8630–8645. [Google Scholar] [CrossRef]


| SN | Gauge Station | Latitude (N) | Longitude (E) | Data Period | % Missing Data |
|---|---|---|---|---|---|
| 1 | Addis Ababa | 9.0 | 38.5 | 1960–2015 | 2.6 |
| 2 | Debre Zeit | 10.4 | 38.9 | 1960–2013 | 13.1 |
| 3 | Dire Dawa | 9.6 | 41.9 | 1960–2015 | 2.1 |
| 4 | Mehal Meda | 10.2 | 39.7 | 1974–2015 | 13.1 |
| 5 | Melkasa | 8.4 | 39.3 | 1977–2013 | 0.67 |
| 6 | Metahara | 8.9 | 39.9 | 1994–2015 | 7.2 |
| 7 | Mezezo | 10.0 | 40.0 | 1986–2015 | 16.4 |
| 8 | Adama | 8.6 | 39.3 | 1980–2015 | 14.3 |
| 9 | Shola Gebeya | 9.2 | 39.4 | 2006–2015 | 4.1 |
| SN | Gauge Stations | Pearson Correlation Coefficient | Kolmogorov-Smirnov Test Statistics | D Critical (Dc) | RMSE |
|---|---|---|---|---|---|
| 1. | Adama (1960–2015) | 0.733 | Dn = 0.151, p-value = 1.186 × 10⁻⁶ | 0.076 | 62.842 |
| 2. | Addis Ababa (1960–2015) | 0.935 | Dn = 0.137, p-value = 7.958 × 10⁻⁶ | 0.074 | 49.049 |
| 3. | Dire Dawa (1960–2015) | 0.871 | Dn = 0.147, p-value = 9.587 × 10⁻⁷ | 0.074 | 27.844 |
| 4. | Bishoftu (1960–2015) | 0.804 | Dn = 0.211, p-value = 2.078 × 10⁻¹² | 0.077 | 67.901 |
| 5. | Melkasa (1960–2015) | 0.864 | Dn = 0.128, p-value = 3.172 × 10⁻⁴ | 0.083 | 41.432 |
| 6. | Metahara (1960–2015) | 0.791 | Dn = 0.166, p-value = 4.516 × 10⁻⁶ | 0.089 | 39.466 |
| 7. | Mehal Meda (1960–2015) | 0.814 | Dn = 0.218, p-value = 1.399 × 10⁻¹¹ | 0.083 | 68.669 |
| 8. | Mezezo (1960–2015) | 0.824 | Dn = 0.124, p-value = 3.13 × 10⁻³ | 0.094 | 97.660 |
| 9. | Shola Gebeya (1960–2015) | 0.895 | Dn = 0.209, p-value = 3.238 × 10⁻⁴ | 0.136 | 56.124 |
| Sub/Basin | Z | Two Tail p-Value | Trend (α = 0.05) | Sen Slope (mm/year) |
|---|---|---|---|---|
| Upland | −0.7 | 0.50 | No trend | −0.2679 |
| Upper Valley | 0.3 | 0.75 | No trend | 0.1420 |
| Western Highlands | 0.0 | 1.00 | No trend | 9 × 10⁻⁴ |
| Middle Valley | −0.1 | 0.93 | No trend | −0.0307 |
| Lower Valley | 0.9 | 0.37 | No trend | 0.2101 |
| Lower Plain | 0.5 | 0.59 | No trend | 0.1638 |
| Eastern Catchment | 0.5 | 0.65 | No trend | 0.1678 |
| Basin average | 0.0 | 0.99 | No trend | −7.00 × 10⁻⁴ |
| Sub/Basin | Z | Two Tail p-Value | Trend (α = 0.05) | Sen Slope (mm/year) |
|---|---|---|---|---|
| Upland | −2.2 | 0.03 | Decreasing | −0.74 |
| Upper Valley | −1.9 | 0.06 | Decreasing | −0.48 |
| Western Highlands | −1.6 | 0.11 | No trend | −0.40 |
| Middle Valley | −1.9 | 0.05 | Decreasing | −0.41 |
| Lower Valley | −0.6 | 0.57 | No trend | −0.10 |
| Lower Plain | −0.7 | 0.47 | No trend | −0.16 |
| Eastern Catchment | −1.7 | 0.08 | No trend | −0.44 |
| Basin average | −2 | 0.05 | Decreasing | −0.46 |
| Sub/Basin | Z | Two Tail p-Value | Trend (α = 0.05) | Sen Slope (mm/year) |
|---|---|---|---|---|
| Upland | 0 | 0.99 | No trend | 0.00 |
| Upper Valley | 0.3 | 0.75 | No trend | 0.11 |
| Western Highlands | 0.6 | 0.54 | No trend | 0.10 |
| Middle Valley | 1.1 | 0.28 | No trend | 0.19 |
| Lower Valley | 1.7 | 0.09 | No trend | 0.20 |
| Lower Plain | 2.1 | 0.03 | Increasing | 0.27 |
| Eastern Catchment | 2.3 | 0.02 | Increasing | 0.50 |
| Basin average | 1.1 | 0.26 | No trend | 0.21 |
| Sub/Basin | Z | Two Tail p-Value | Trend (α = 0.05) | Sen Slope (mm/year) |
|---|---|---|---|---|
| Upland | 2.2 | 0.03 | Increasing | 0.27 |
| Upper Valley | 1.7 | 0.09 | No trend | 0.22 |
| Western Highlands | 2.1 | 0.04 | Increasing | 0.17 |
| Middle Valley | 1.4 | 0.18 | No trend | 0.10 |
| Lower Valley | 1.6 | 0.12 | No trend | 0.06 |
| Lower Plain | 0.9 | 0.35 | No trend | 0.06 |
| Eastern Catchment | 0.8 | 0.41 | No trend | 0.08 |
| Basin average | 1.5 | 0.12 | No trend | 0.12 |
© 2019 by the authors. Licensee MDPI, Basel, Switzerland. This article is an open access article distributed under the terms and conditions of the Creative Commons Attribution (CC BY) license (http://creativecommons.org/licenses/by/4.0/).
Share and Cite
Mulugeta, S.; Fedler, C.; Ayana, M. Analysis of Long-Term Trends of Annual and Seasonal Rainfall in the Awash River Basin, Ethiopia. Water 2019, 11, 1498. https://doi.org/10.3390/w11071498
Mulugeta S, Fedler C, Ayana M. Analysis of Long-Term Trends of Annual and Seasonal Rainfall in the Awash River Basin, Ethiopia. Water. 2019; 11(7):1498. https://doi.org/10.3390/w11071498
Chicago/Turabian StyleMulugeta, Solomon, Clifford Fedler, and Mekonen Ayana. 2019. "Analysis of Long-Term Trends of Annual and Seasonal Rainfall in the Awash River Basin, Ethiopia" Water 11, no. 7: 1498. https://doi.org/10.3390/w11071498
APA StyleMulugeta, S., Fedler, C., & Ayana, M. (2019). Analysis of Long-Term Trends of Annual and Seasonal Rainfall in the Awash River Basin, Ethiopia. Water, 11(7), 1498. https://doi.org/10.3390/w11071498