Article

Sources and Mechanisms of Low-Flow River Phosphorus Elevations: A Repeated Synoptic Survey Approach

1
Agricultural Catchments Programme, Teagasc, Johnstown Castle, Co., Wexford Y35 Y521, Ireland
2
Environmental Research Centre, Teagasc, Johnstown Castle, Co., Wexford Y35 Y521, Ireland
3
Geography and Environmental Science, School of Social Sciences, University of Dundee, Dundee DD1 4HN, UK
*
Author to whom correspondence should be addressed.
Water 2019, 11(7), 1497; https://doi.org/10.3390/w11071497
Submission received: 19 June 2019 / Revised: 5 July 2019 / Accepted: 11 July 2019 / Published: 18 July 2019

Abstract

:
High-resolution water quality monitoring indicates recurring elevation of stream phosphorus concentrations during low-flow periods. These increased concentrations may exceed Water Framework Directive (WFD) environmental quality standards during ecologically sensitive periods. The objective of this research was to identify source, mobilization, and pathway factors controlling in-stream total reactive phosphorus (TRP) concentrations during low-flow periods. Synoptic surveys were conducted in three agricultural catchments during spring, summer, and autumn. Up to 50 water samples were obtained across each watercourse per sampling round. Samples were analysed for TRP and total phosphorus (TP), along with supplementary parameters (temperature, conductivity, dissolved oxygen, and oxidation reduction potential). Bed sediment was analysed at a subset of locations for Mehlich P, Al, Ca, and Fe. The greatest percentages of water sampling points exceeding WFD threshold of 0.035 mg L−1 TRP occurred during summer (57%, 11%, and 71% for well-drained, well-drained arable, and poorly drained grassland catchments, respectively). These percentages declined during autumn but did not return to spring concentrations, as winter flushing had not yet occurred. Different controls were elucidated for each catchment: diffuse transport through groundwater and lack of dilution in the well-drained grassland, in-stream mobilization in the well-drained arable, and a combination of point sources and cumulative loading in the poorly drained grassland. Diversity in controlling factors necessitates investigative protocols beyond low-spatial and temporal resolution water sampling and must incorporate both repeated survey and complementary understanding of sediment chemistry and anthropogenic phosphorus sources. Despite similarities in elevation of P at low-flow, catchments will require custom solutions depending on their typology, and both legislative deadlines and target baselines standards must acknowledge these inherent differences.

1. Introduction

The qualitative status of European waterbodies under the Water Framework Directive (WFD) [1] is determined relative to fixed quantitative thresholds of chemical concentration and physical/ecological status. Monitoring at the outlets of agricultural catchments has revealed that concentrations of nutrients, particularly phosphorus (P), in stream water become elevated during low-flow conditions and may exceed legislated thresholds [2,3]. Such elevated concentrations, while not necessarily reflective of the mean quality of the stream over the entire course of the year, may occur at critical times affecting the ecological health of indicator species such as macroinvertebrates and diatoms [2,4]. It has been observed that low temporal resolution monitoring can lead to ambiguity in status classification [5] and in load estimation [6,7]. Similarly, observations taken during low-flow conditions may lead to misattribution of poor water quality status than is actually true for much of the year. Although high temporal resolution monitoring provides insights into the seasonal dynamics of water quality [8], as this is typically done at a single point in the river, its outlet, it reflects the sum of all nutrient sources, hydrological pathways, and biogeochemical processes throughout its entire catchment [9,10]. The reasons for observed concentrations can be difficult to disentangle. Multiple sources and pathways can operate simultaneously, and the driving factors of either elevated or suppressed concentrations likely differ depending on flow regime.
In six intensive agricultural sites in Ireland, [2] elevated reactive phosphorus at the catchment outlets during baseflow conditions have been reported. Although the load of P export was typically low under these conditions (≤ 7% of annual total), the concentrations exceeded the environmental quality standard (EQS) of 0.035 mg l-1 for all but one catchment (which was underlain by karst geology) greater than 32% of baseflow duration. Relative to P loss by overland flow during rainfall events, the sources and pathways controlling low-flow concentrations may be comparatively subtle: i) subsurface pathways [11], ii) decreased or lack of dilution [12], iii) instream mobilization [13], and iv) persistent point sources [12] or combinations of several such factors. Critically, these may maintain the stream in poor status between high-flow events [14], which dominate the overall annual loads exported from the catchment. In the Irish agricultural catchments discussed above, groundwater P concentrations were not sufficient to account for the increases in reactive phosphorus (TRP) observed during low-flow conditions [2]. Coupled with the capacity of two of the catchments in that study to retain P [15] it was evident that some other factor(s) must contribute to low-flow concentrations, in addition to groundwater transport, such as point sources and mobilization factors [16].

1.1. Persistent Point Sources

Storm-independent response point sources remain constant over time and, hence, lead to greater concentrations when dilution is low [17]. These sources may include cattle access points, poorly maintained farm infrastructure (yards and roadways), septic tanks, and wastewater treatment facilities [18]. Episodic or recurring runoff from impervious surfaces such as farmyards and roadways may also contribute to stream concentrations [19] and may exhibit relatively low rainfall dependency as yard washing and animal handling may generate surface flow. In relation to the latter, septic tanks in rural areas may contribute a small proportion of the total annual P load of a catchment but may significantly affect low-flow concentrations. This may be a result of aged or defective tanks, a high density of tanks within an area, poor maintenance, poor positioning within the landscape, and exceedance of tank capacity. The response in water quality to strategic replacement of tanks has been examined in three subcatchments [18]. Stream low-flow concentrations decreased by 0.032 mg L−1 TP and 0.018 mg L−1 TRP in one catchment; however, improvements in the other two catchments were offset by increases in septic tank density. Faecal indicator studies, conceptual models, and tracer analyses have all attributed similarly significant contributions of septic tank discharge to surface water P concentrations [20,21,22,23]. Given the reliance of many rural areas on this form of waste management, this may represent a relatively unaddressed contaminant source whose contribution cannot be overcome by agricultural mitigation measures. Nutrient concentrations arising from these sources may be accompanied by elevated fecal coliforms [24], which pose a risk to human health, amenity use of waterbodies, and additional water treatment burdens.

1.2. Mobilization

Bed sediments have the potential to attenuate or mobilize P into the water column depending on the biochemical composition of the substrate [15,25,26]. Characterization of drain and ditch sediments in agricultural subcatchments indicated elevated P buffering capacity and increased sorption capacity relative to adjacent field soils, and also suggested lower sediment aggregation lower sediment aggregation [15]. This suggests that these areas may delay soluble P losses to watercourses, but during periods of high precipitation they may transmit particulate P. There may be significant variability in retention and release across the stream network itself as a result of spatial characteristics such as sediment minerology [26,27], particle size [28], and rural/urban land use [29]. Exploring the provenance and characteristics of bed sediments in agricultural catchments may be a useful tool to understand P transport and mobilization. Differences in sediment characteristics across the watercourse may reveal reaches which have stores of P within the streambed and, depending on the ratio of Fe and Al to P, may release those stores under suitable in-stream conditions. Sediment analyses, therefore, may aid in understanding stream P elevations, where other sources (e.g., chemical fertilisers, manures, domestic wastewater) and pathways (e.g., overland flow, lateral subsurface transport) are eliminated. Seasonal retention and release patterns have previously been reported [30] with P maxima observed during summer as a result of in-stream processes. In such cases, P concentrations will vary not only longitudinally across river systems but also over the course of the year, irrespective of sources and transport within the catchment.

1.3. Objectives

The objective of the present study was to identify source, mobilization, and pathway factors that controlled in-stream total reactive phosphorus (TRP) and total phosphorus (TP) concentrations during low-flow periods across entire stream networks. This was addressed in three catchments by (1) investigating the along-stream variations in TRP and TP concentration across both main stream and tributaries, and (2) by locating and identifying potential low-flow or persistent point sources of TRP and TP. Synoptic, longitudinal surveys were conducted in each catchment during spring, summer, and autumn during low-flow conditions.

2. Materials and Methods
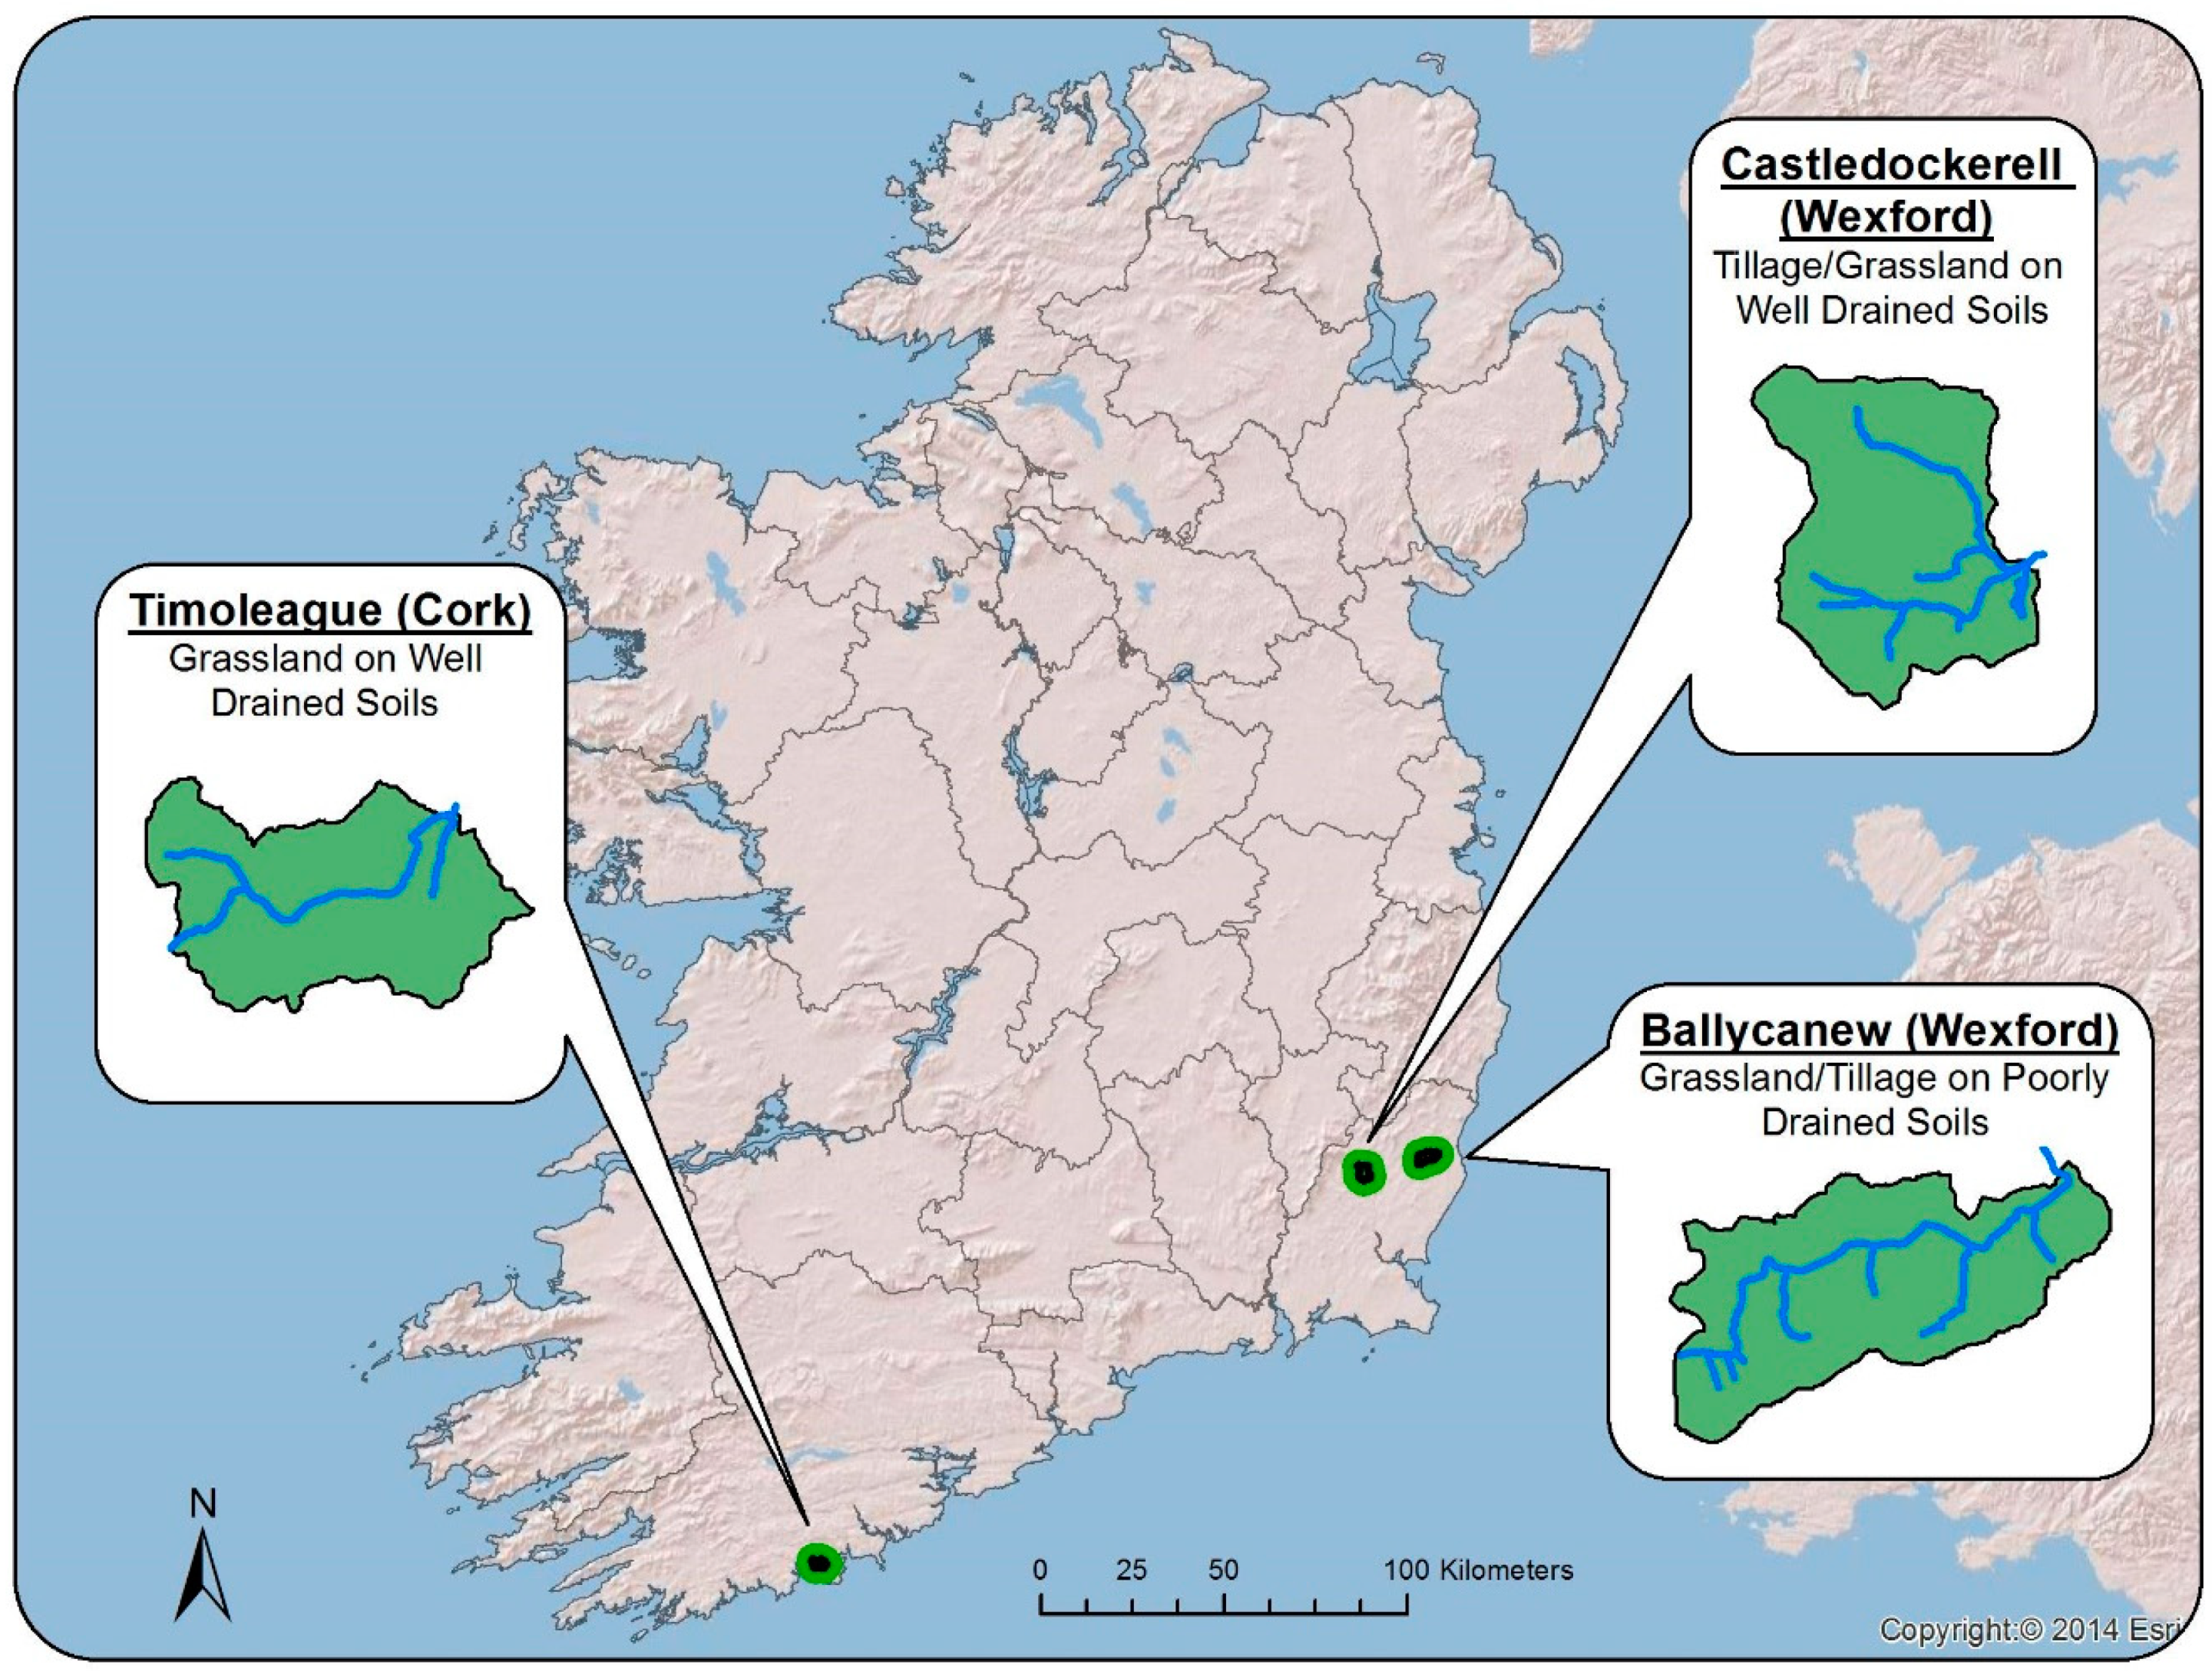
In summary, the methods employed in this study involved targeted sampling of stream water and bed sediment across entire stream networks in three agricultural catchments during low-flow conditions, accompanied by analysis of in situ physical parameters and phosphorus concentrations (water samples) as well as aluminium/phosphorus and iron/phosphorus ratios (sediment).

2.1. Study Sites

Locations of the study catchments are displayed in Figure 1, and their characteristics are presented in Table 1. Three catchments (<12 km2) of differing production systems and drainage classes were used in this study. The well-drained arable catchment (Castledockrell, Co. Wexford) is predominantly under spring barley production and consists of acid brown earth soils over highly permeable, undulating weathered rock. The hydrologic pathways in this catchment are mostly subsurface, with overland flow restricted to storm events. The poorly drained grassland (Ballycanew, Co. Wexford) catchment is only 25 km from the well-drained arable; however, it consists of groundwater gley soils dominated by marine clay, leading to prolonged saturation and overland flow pathways. The well-drained grassland catchment (Timoleague, Co. Cork) is dominated by intensive dairy (average stocking rate of 165 kg N ha-1, although up to 250 kg N ha−1 on some farms) production. The catchment consists of freely draining brown earths (87%) and a smaller amount of gley (10%) and alluvial and peat soils (3%). Subsurface flow within the shallow bedrock is considered to be the main hydrologic pathway.

2.2. Background Data

Water quality parameters have been measured on a ten-minute interval at each catchment outlet since 2009/2010 using bankside analyzers (Hach-Lange Sigmatax and Phosphax). These devices report total P (TP) and total reactive P (TRP). Water levels at the catchment outlets were recorded on a ten-minute interval using an OTT Orpheus Mini sensor (OTT Hydrometn GMBH, Germany) in stilling wells adjacent to Corbett flat-V nonstandard weirs (custom made, Corbett Concrete, Ireland). Stream flow (discharge—Q) was calculated using stage–discharge rating curves developed using OTT Acoustic Doppler Current Metres (OTT Hydromet GMBH, Germany) and Wiski-SKED (Kisters) software. Each catchment was also equipped with a meteorological station that recorded precipitation, air and soil temperature, humidity, and windspeed at a ten-minute interval.

2.3. Synoptic Survey

Water sampling of the main stream, tributaries, and selected (flowing) ditches was conducted during targeted low-flow conditions determined from the hydrograph. Three low-flow periods were targeted: spring, summer, and autumn. For the purposes of the survey, low-flow was considered as the 70th percentile of discharge and no antecedent rainfall in the preceding 48 h. Sampling dates and conditions are shown in Table 2. Sampling locations were predetermined based on visual inspection of the catchments (including access to the stream, livestock drinking points, and field drains), targeted distribution of samples across the entire watercourse, and particular areas of interest determined from previous studies at these sites [11,15,31,32]. Mainstream sampling points begin with the letter M, tributary points with T, and ditches with D. A target of 50 samples per catchment was determined, permitting a sample density of about 5–6 samples per km stream length. A high spatial density was targeted in order to capture the effects of localized point sources, although it cannot be assured that every point source can be accounted for thusly.
At each sample point, 500 ml of stream water was collected using sterile PVC bottles. Samples were transported in coolboxes to the laboratory and analyzed within 48 h for total phosphorus (TP), total reactive phosphorus (TRP), total dissolved phosphorus (TDP), and dissolved reactive phosphorus (DRP). Calibrated handheld probes (Aquaread) were used to record temperature, pH, electrical conductivity (EC), dissolved oxygen (DO) (both percentage saturation and mg L−1), and oxidation reduction potential (ORP) instream at the time of sampling. These parameters were measured to facilitate interpretation of the phosphorus concentrations, which were the primary focus of this study. At the time of sampling at each site, observations were also recorded such as the presence of a cattle access point, clarity of the water, any odours, etc. Sampling was conducted moving upstream through the catchment so that any disturbance at a particular sampling point would not be reflected in subsequent samples.
Bed sediment samples were collected, as per [2], from a subset of seven sample points per catchment during the summer and autumn sampling rounds. In summary, after the water samples and probe reading had been taken, fine sediment was removed to a depth of 5 cm using a marked trowel. These sediments were air dried and sieved to 2 mm. Extractions were conducted according to the Mehlich 3 protocol and analyzed for P, Al, Ca, and Fe using inductively coupled plasma (ICP-MS) mass spectroscopy.
Bed sediment samples were further sieved to 125 µm and analyzed for geochemical, radionuclide, particle size, and organic carbon for sediment fingerprinting [33]. Physico-chemical characterization of potential sediment source groups, field topsoils (comprising arable and grassland fields), channel banks (comprising channel and ditch bank sediments), and road verges (comprising road verges and tracks) in the well-drained arable and poorly drained grassland catchments [33] were utilized here for comparison with bed sediment samples. In summary, raw values for geochemical elements Cd, Co, Cr, Cu, Mn, Ni, Pb, Zn, and radionuclides 234Th, 235U, 228Ac, 137Cs, 40K, and 210Pbunsupported were corrected for specific surface area and organic carbon variability. Tracer selection for sediment fingerprinting firstly retained tracers that could statistically differentiate at least two potential sources (Kruskal–Wallis, p < 0.05). For individual bed sediment samples, tracers were further retained where corrected concentrations did not exceed the range of source sample concentrations. The ability of resulting tracer groups to cumulatively assign source samples to correct groups was assessed using multiple discriminant analysis. The estimated proportion of sediment from each source group was calculated by an uncertainty inclusive unmixing model, FR2000 [34].

3. Results and Discussion

3.1. Patterns Between Catchments—Outlet Data

Flows at the 70th percentile for each catchment are shown in Table 1. Values were higher in both well-drained catchments compared to the poorly drained grassland reflecting the differences in size, hydrology, and elevation as would occur in assessments of the total flow range. Low-flow typically occurred for the longest durations in summer (May/June/July), although briefer low-flow periods were observed in both spring and autumn. Rising and persistently elevated RP concentrations at the outlets during periods of low-flow (Table 1) were observed. If the cause of elevated TRP originated solely from a lack of dilution at low-flow, it could be expected that some linearity between Q and RP concentrations would be observed. However, the correlation between total daily discharge (Q) and TRP concentration was weak in all catchments during low-flow conditions (R2 = 0.055 well-drained grassland, R2 = 0.197 well-drained arable, R2 = 0.002 poorly drained grassland).
Considering all flow periods, the well-drained arable catchment exhibited the lowest average TRP concentration, followed by the well-drained grassland and the poorly drained grassland. This is consistent with previous characterization of these catchments [11]. The well-drained arable catchment is considered to be at low risk for P loss due to attenuation by aluminium-rich and predominantly well-drained soils, which typically minimize runoff events [2]. Although its typically low soil saturation limits P transport via overland pathways, the well-drained grassland catchment is vulnerable to P transport through the subsurface as low soil aluminium content precludes attenuation and facilitates leaching. As a result, P arrives to the stream in this catchment via groundwater pathways [11], which is in contrast to a commonly held assumption of P transport as occurring primarily through surface pathways. The poorly drained grassland catchment has the greatest risk of overland P transfer due to flashy hydrology and high propensity for runoff [11,31]. The same ranking of catchments was observed when the low-flow periods were isolated, although the well-drained grassland catchment did not exhibit greater average TRP at low-flow than when all flow periods were accounted for.

3.2. General Quality—Minimum/Mean/Maximum

Summary concentrations across each watercourse and sampling period are shown in Table 2. Mean RP concentrations in water samples across the entire watercourse were greatest in the (poorly drained) grassland catchment, which also exhibited the greatest percentage of sampling points exceeding the WFD’s EQS (0.035 mg L−1 TRP) in each season: 14%, 71%, and 53% in spring, summer, and autumn, respectively. However, both well-drained catchments exhibited maximum concentrations (0.139 mg L−1 well-drained arable and 0.184 mg L−1 well-drained grassland) at a limited number of sampling points, which exceeded the maximum values measured in poorly drained grassland. Typically, the lowest TRP concentrations were observed in the well-drained arable catchment, followed by well-drained grassland. The poorest water quality (according to TRP concentration) was observed in the poorly drained grassland.
In each of the three catchments, mean TRP concentrations were lowest during the spring sampling period, highest during summer, and had begun to decline again by autumn, although they typically did not reduce to spring concentrations by that time. This is in agreement with [33].

3.2.1. Within-Catchment Patterns of TRP

The within-catchment patterns of TRP across each sampling period are displayed in Figure 2, Figure 3 and Figure 4 according to the WFD environmental quality thresholds for TRP: high < 0.025, good 0.025–0.035, and poor > 0.035 mg L−1.

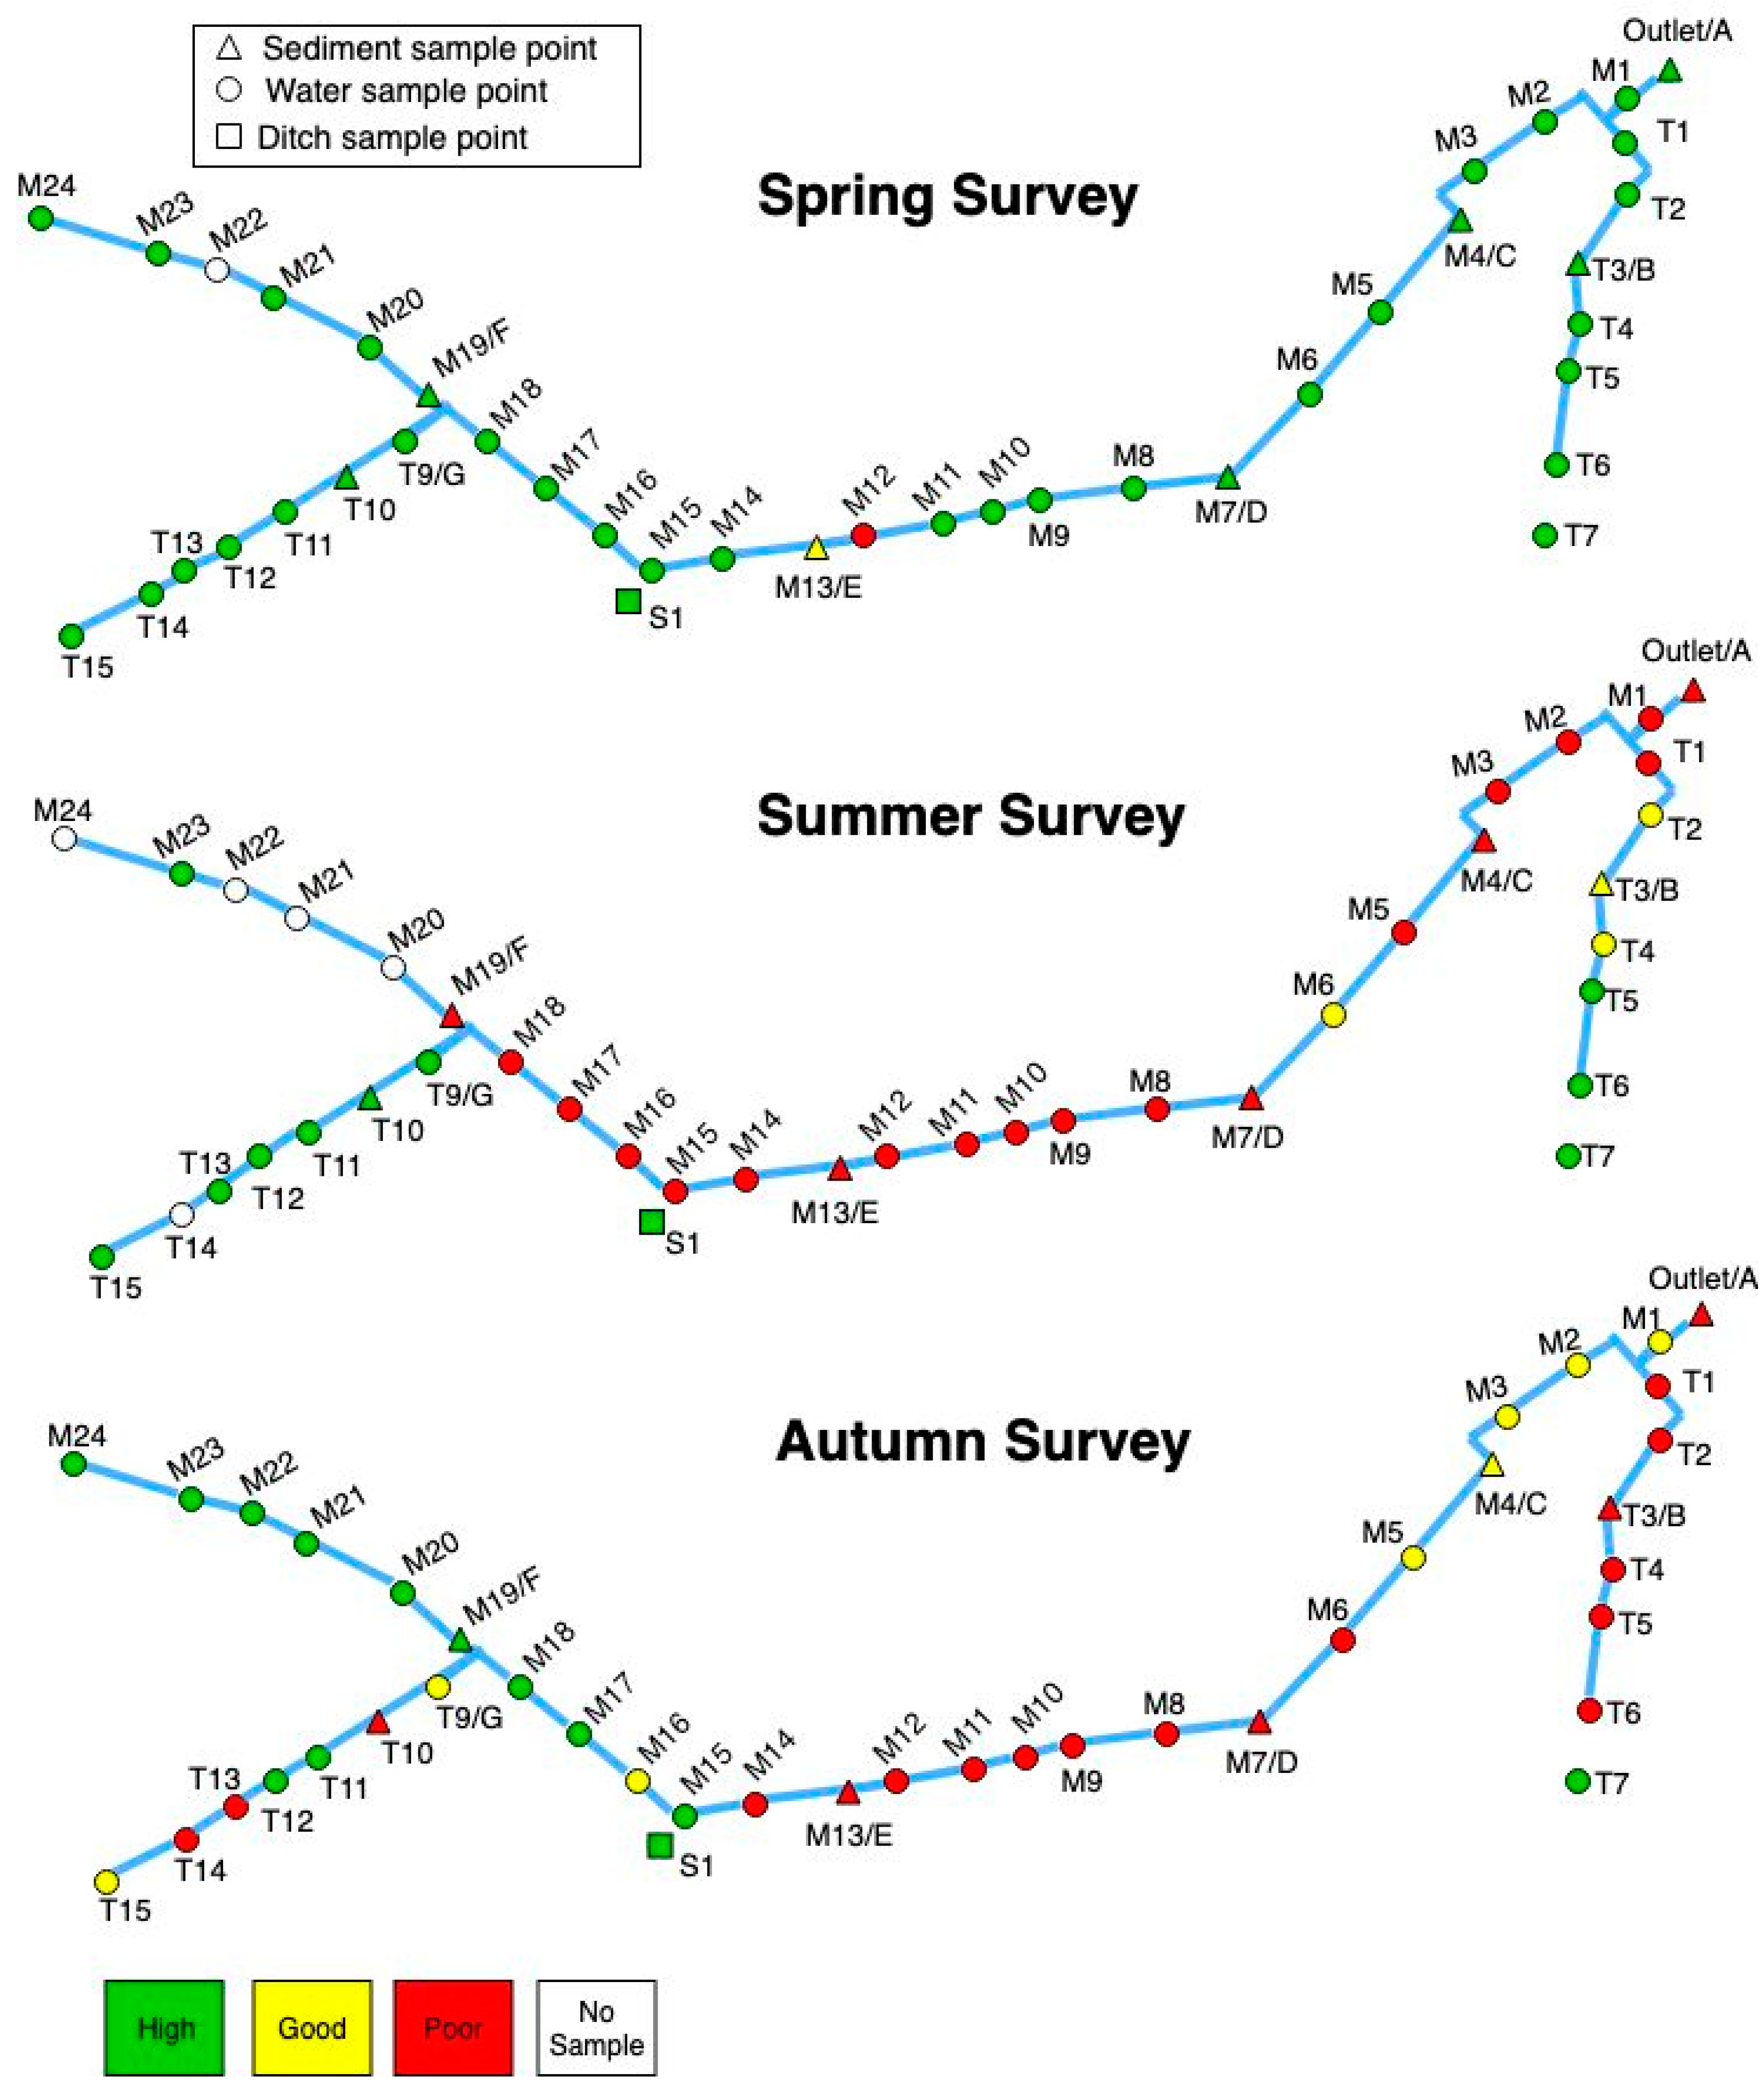
3.2.2. Well-Drained Grassland

The well-drained grassland catchment exhibited largely consistent behavior across the main stream (Figure 2). TRP was elevated during summer and autumn compared to spring, with most sampling points across the area elevated by similar concentrations, suggesting a generally diffuse delivery pathway, consistent with groundwater P transport, and limited point sources or mobilization from the streambed. This is consistent with [11], which suggested dispersion of colloidal P from the soil matrix and, hence, leaching to groundwater due to the nature of soil P in this catchment associated with amorphous forms of Fe, which are mobile and liable to translocate downward through the soil profile toward groundwater. This has particular implications for best management practices. P loss mitigation is often focused on intercepting the overland flow component to facilitate deposition (e.g., sediment traps); however, in the case of subsurface transport, improved nutrient efficiency is required to reduce the overall P load percolating through the unsaturated zone and, hence, to groundwater. Time lags of 15–20 years beyond the initial WFD deadline of 2015 are projected for P in Irish surface soils to reach the optimum index [35]. Promisingly, the soil P index in the well-drained grassland is trending towards an agronomic optimum thanks to improved nutrient use efficacy supported by field-scale soil sampling and site-specific nutrient recommendations [32,36]. This trend should decrease P entering the subsurface pathway and curtail future leaching losses, subject to a biogeochemical and hydrological time lag. Patience is required in order for the full efficacy of improved nutrient management practices to be observed in catchments like this.
Aluminium in soil has a strong affinity for P, and high concentrations of Al have been known to fix P into insoluble forms. For Irish soils, a broken-line regression between the ratio of Mehlich3 extractable Al to P, with soluble and available P, was used to establish threshold values of Al:P of 11.7, above which P is fixed or attenuated by Al, and below this value P is released in more soluble and available forms into solution [37]. Whilst these ratios were established for Irish topsoils, its use as an indicator of sediment P solubility has yet to be explored, and in this current study this indicator was used for streambed sediments in the study catchments to examine P attenuation/solubility. In this work, sediments showed low Al:P ratios across all sample points and sampling dates (Table 3). These values were below the 11.7 change point, which has been identified as a threshold where P is likely to be strongly fixed/released [37]. This indicates that P is not strongly attenuated in the stream sediments and may be liable to release under suitable stream conditions (temperature, pH [32,38]). Hence, the processes of in-stream mobilization are unlikely to contribute to low-flow P concentrations in water samples in this catchment. Al:P ratios were mostly consistent between the summer and autumn sampling periods, with the ratios of each point changing by less than 1.2 and staying below the change point. This suggests a lack of physical disruption of the sediment within the stream and, potentially, limited quantities of sediment arriving from adjacent fields. The larger deviation observed in sample point F, in which the Al:P ratio changed by 3.05, resulted from an increase in Mehlich P of 14 mg/kg measured in autumn, while Al remained constant. This upstream point is in a forested area, and incidental sediment and P losses are liable to occur subject to harvesting, planting, and other forestry operations. It should be noted that the stream sediment at this location still remained below the 11.7 change point, and so was unlikely to strongly attenuate P arriving to the watercourse.
An exception to this diffuse-pattern behavior in TRP in water samples was observed in the centre of the main stream (points M13 to M17) during the summer survey. These points showed far greater elevation in RP than elsewhere throughout the catchment (0.06 to 0.187 mg L−1). No distinct corresponding changes in biophysical parameters (temperature, pH, redox potential) were observed, with the exception of a reduction in dissolved oxygen (range 71.9%–90.4%) relative to the rest of the main stream (average 93%). The stability of supplementary parameters argues against in-stream mobilization, which would be expected to occur subject to some change in stream conditions. However, at sample point 17, TP increased to 0.207 mg L−1, ammonium to 0.377 mg L−1, and TOC to 3.337 mg L−1. These were the highest values for these parameters throughout the catchment during this sampling period. This step-change in nutrient concentrations suggests loss corresponding to an incidental point source such as slurry application, which also seems likely considering the mainly improved grassland land use type and relatively steeper slopes surrounding that section of the stream.

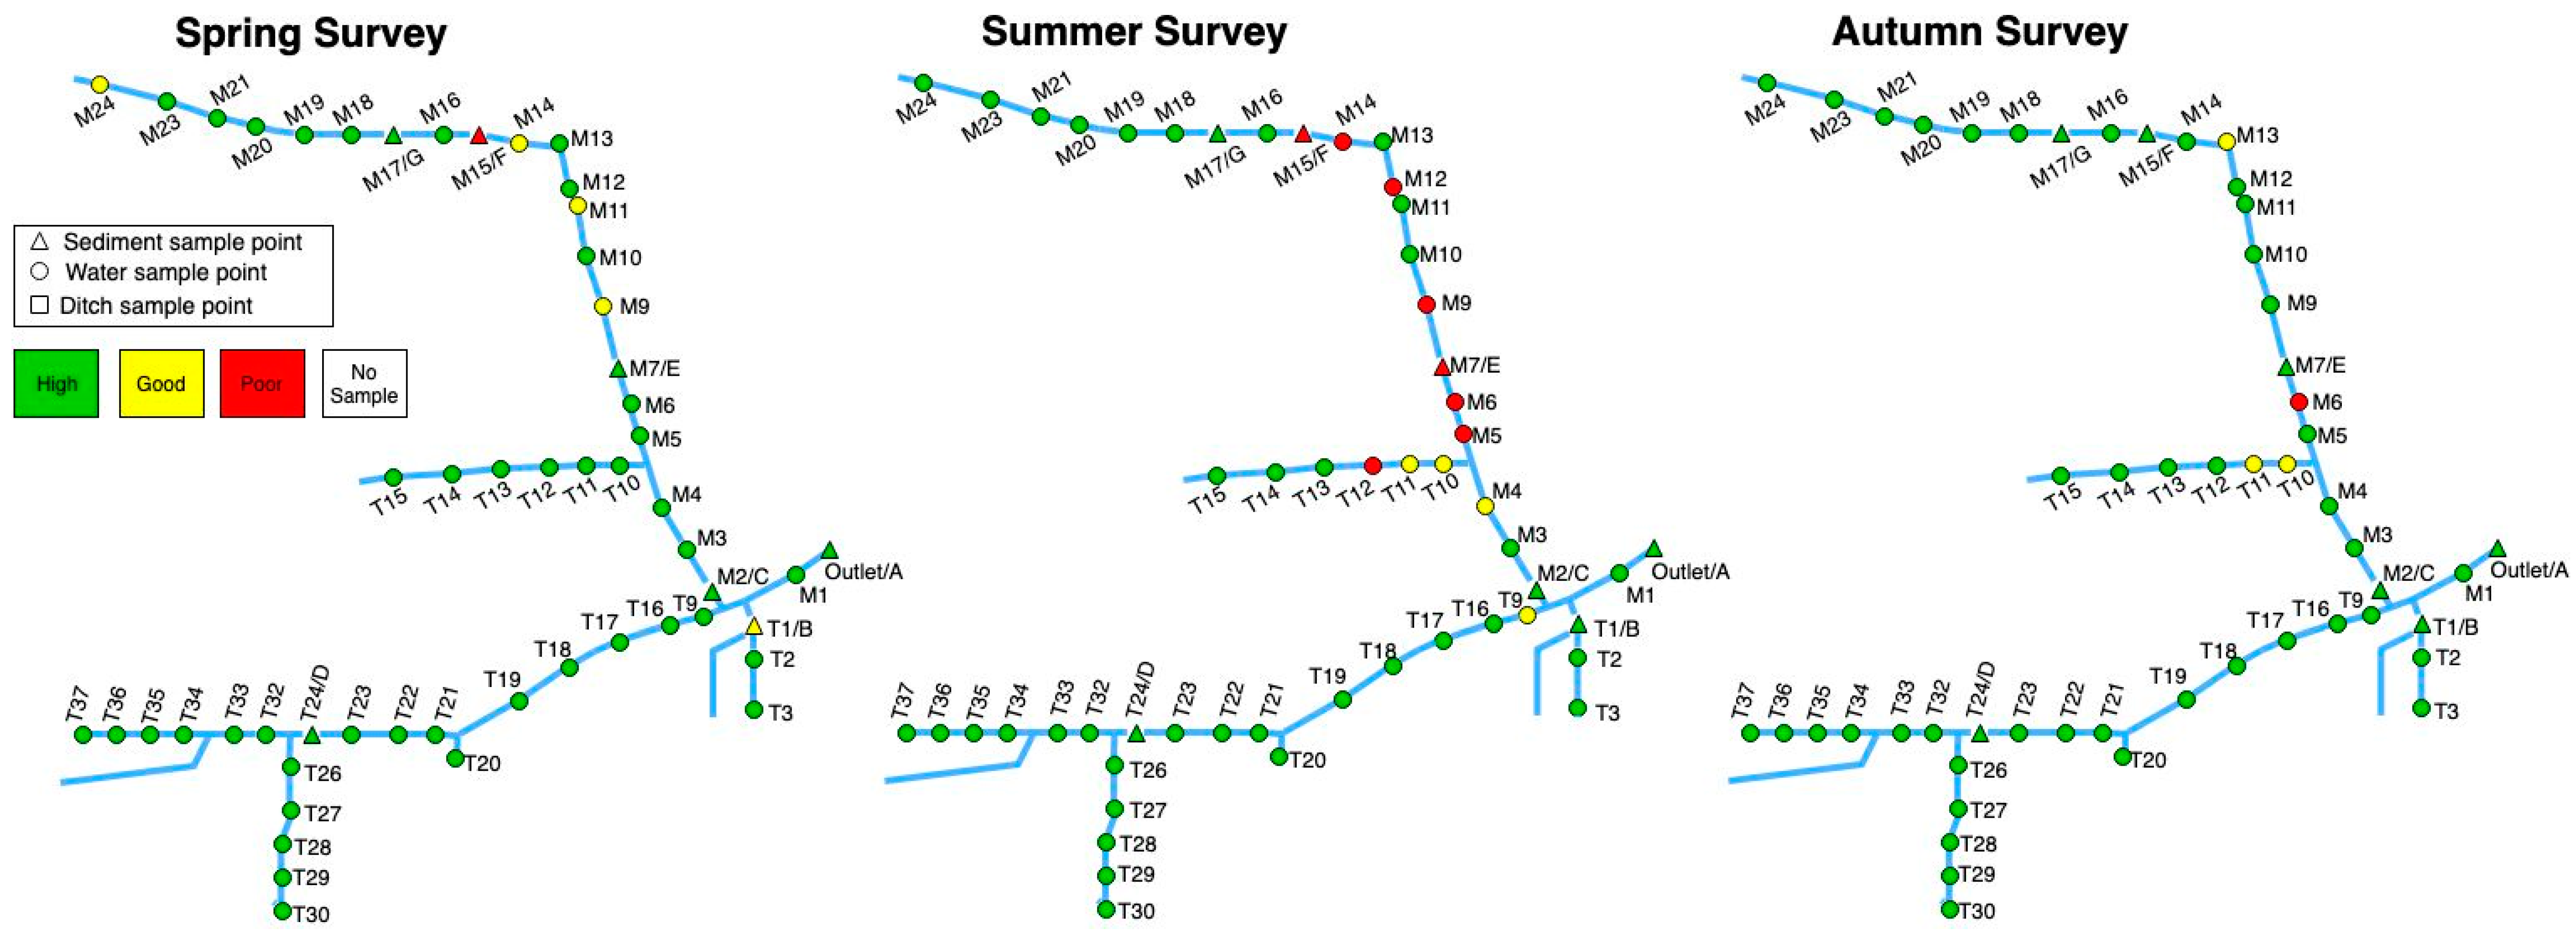
3.2.3. Well-Drained Arable

Patterns of TRP in the well-drained arable during each sampling period are shown in Figure 3. This catchment exhibited the lowest TRP across the entire stream network of all the studied catchments. This is consistent with its characterization as a predominantly nitrate-rather than phosphorus-risky catchment for agricultural pollutants [39]. High attenuation potential in the soils, as indicated by low water-soluble phosphorus (WSP), means that this catchment has a greater capacity to attenuate and bind P in soils rather than lose it to groundwater (as in the well-drained grassland) or via overland flow (as in the poorly drained grassland).
Elevated summer concentrations were observed across the entire mainstream and tributaries, and interestingly, almost all sampling points showed a return to baseline or spring concentrations by autumn (Table 2). This cannot reasonably be attributed to flushing, as there had been minimal precipitation within that period (about 33 mm effective rainfall). It seems likely that the elevations observed during the summer sampling period occurred as a result of mobilization from within the stream itself, which is supported by Al:P ratio data in bed sediments, and an increase in temperature of about 2°C was observed across the entire watercourse during this period, which may indicate potential mobilization [38]. Five of the seven sediment sampling points exhibited Al:P ratios below the 11.7 change point, indicating that they were unlikely to strongly attenuate P in-stream at that time. However, a seasonal shift was observed; during the autumn period only three points were below the change point, with the remaining four now > 11.7, and the seasonal deviation of ratio values were the highest of the three study catchments.
Across both sediment sampling periods, fingerprinting data show a negative correlation between field topsoil contribution and the Al:P ratio (Table 3). This suggests that P derived from topsoil sediments may be attenuated within channel banks that possess greater concentrations of attenuating elements (Al, Ca, and Fe) relative to P and increases the likelihood of further TRP attenuation from the water column (Supplementary Materials). At sites B, C, and G, where the Al:P ratio increased >1.0 between summer and autumn, the field topsoil contributions showed reductions accordingly. Decrease in Al:P between summer and autumn at site M7/E corresponded to increased topsoil sediment contributions. The isolated increase in topsoil contributions here is consistent with time-integrated suspended sediment fingerprinting at this location across similar time periods, and it is attributed to greater soil erosion risk immediately upstream due to steep slopes and a narrow, relatively featureless riparian corridor [33].
A known point source exists within this catchment, the wastewater treatment plant (WWTP) at point M15/F, and this location exhibited elevated P at both up and downstream sampling points throughout the year. As such, it is a typical example of the nesting of domestic point sources within predominantly agricultural catchments [18]. The corresponding 2 mm sediment samples exhibited the highest Al, Ca, S, and Zn observed in the catchment as well as the highest sediment P (both Morgans and Mehlich) and TRP in water samples. The sediment chemistry here reflects effluent from WWTP, and as such, any inherent capacity for attenuation is overcome by the very high P inputs.
While such persistent point sources are neither symptomatic of agriculturally driven P-loss nor addressed by agricultural mitigation measures, they do contribute to both the concentrations and overall loads observed and reported upon in monitoring campaigns. It is critical, therefore, that the presence of these and of similar sources such as dense, faulty, or strained septic tank systems are acknowledged so that the performance of agricultural measures may be correctly ascertained.
Sample point T1/B was located at the base of a short, seasonal tributary with high connectivity to farmyards but relatively low and intermittent flow. The sediment at this point exhibited high Morgans P (13.6 mg L−1) in summer, which declined to a more typical value (3.64 mg L−1) by autumn. This water chemistry of this short tributary likely reflects transient changes, with a high influence of point sources; however, its overall contribution to the quality of the stream is minimal as it flows only during very high rainfall. Seasonally dry watercourses and ditches may thus offer opportunity for attenuation of nutrients coming from hard surfaces such as farmyards and roadways; however, examination of this hypothesis is needed. Site A/Outlet showed a considerable shift in sediment sources, but a small alteration in Al:P across sampling periods, from primarily channel- to road-derived, was likely due to the lower P associated with these sources compared to topsoil sediments. Autumn samples overall had greater road contributions than summer, likely reflecting greater agricultural activity during harvest and deposition of sediment on high-risk impermeable surfaces. Intersections between the road and river networks in the vicinity of sites D and G validate particularly high proportions here. As a cumulative signature of activity within the whole catchment, site A/Outlet is likely to reflect a temporally and spatially aggregated signature of sediments (according to the relevant particulate time lag through the catchment). Seasonal bed sediment concentrations have been observed to be largely consistent in this catchment [40]; however, that study did not account for the rate of flux (only the net bed sediment storage at the time of sampling).
Previous research [2] in this catchment indicated that the ditch sediments had similarly low WSP as the soils and overall low risk of P mobilization. However, that study showed sediments from the stream banks as having far lower Ca levels (221.8 mg/kg), relative to field and drain sediments (1443 and 1075.9 mg/kg), and also organic matter (4.5 mg/kg vs. 12.5 and 9.4 mg/kg) and lower pH (4.4 vs. 6.2 and 5.6) (Supplementary Materials). It should be noted that the sediments in the present study all originated from the streambeds. Contrasting P sorption behaviors in surface vs. subsurface soils have been identified [26]; similarly, streambed sediments may not necessarily closely reflect field soils, and attenuation/mobilization hotspots may occur across the watercourse as it intersects varying horizons depending on erosion and loading of the channel. Sample points M5–M9 exhibited elevated TRP in summer (0.035–0.04 mg L−1), which declined to baseline concentrations by autumn (except point M6).

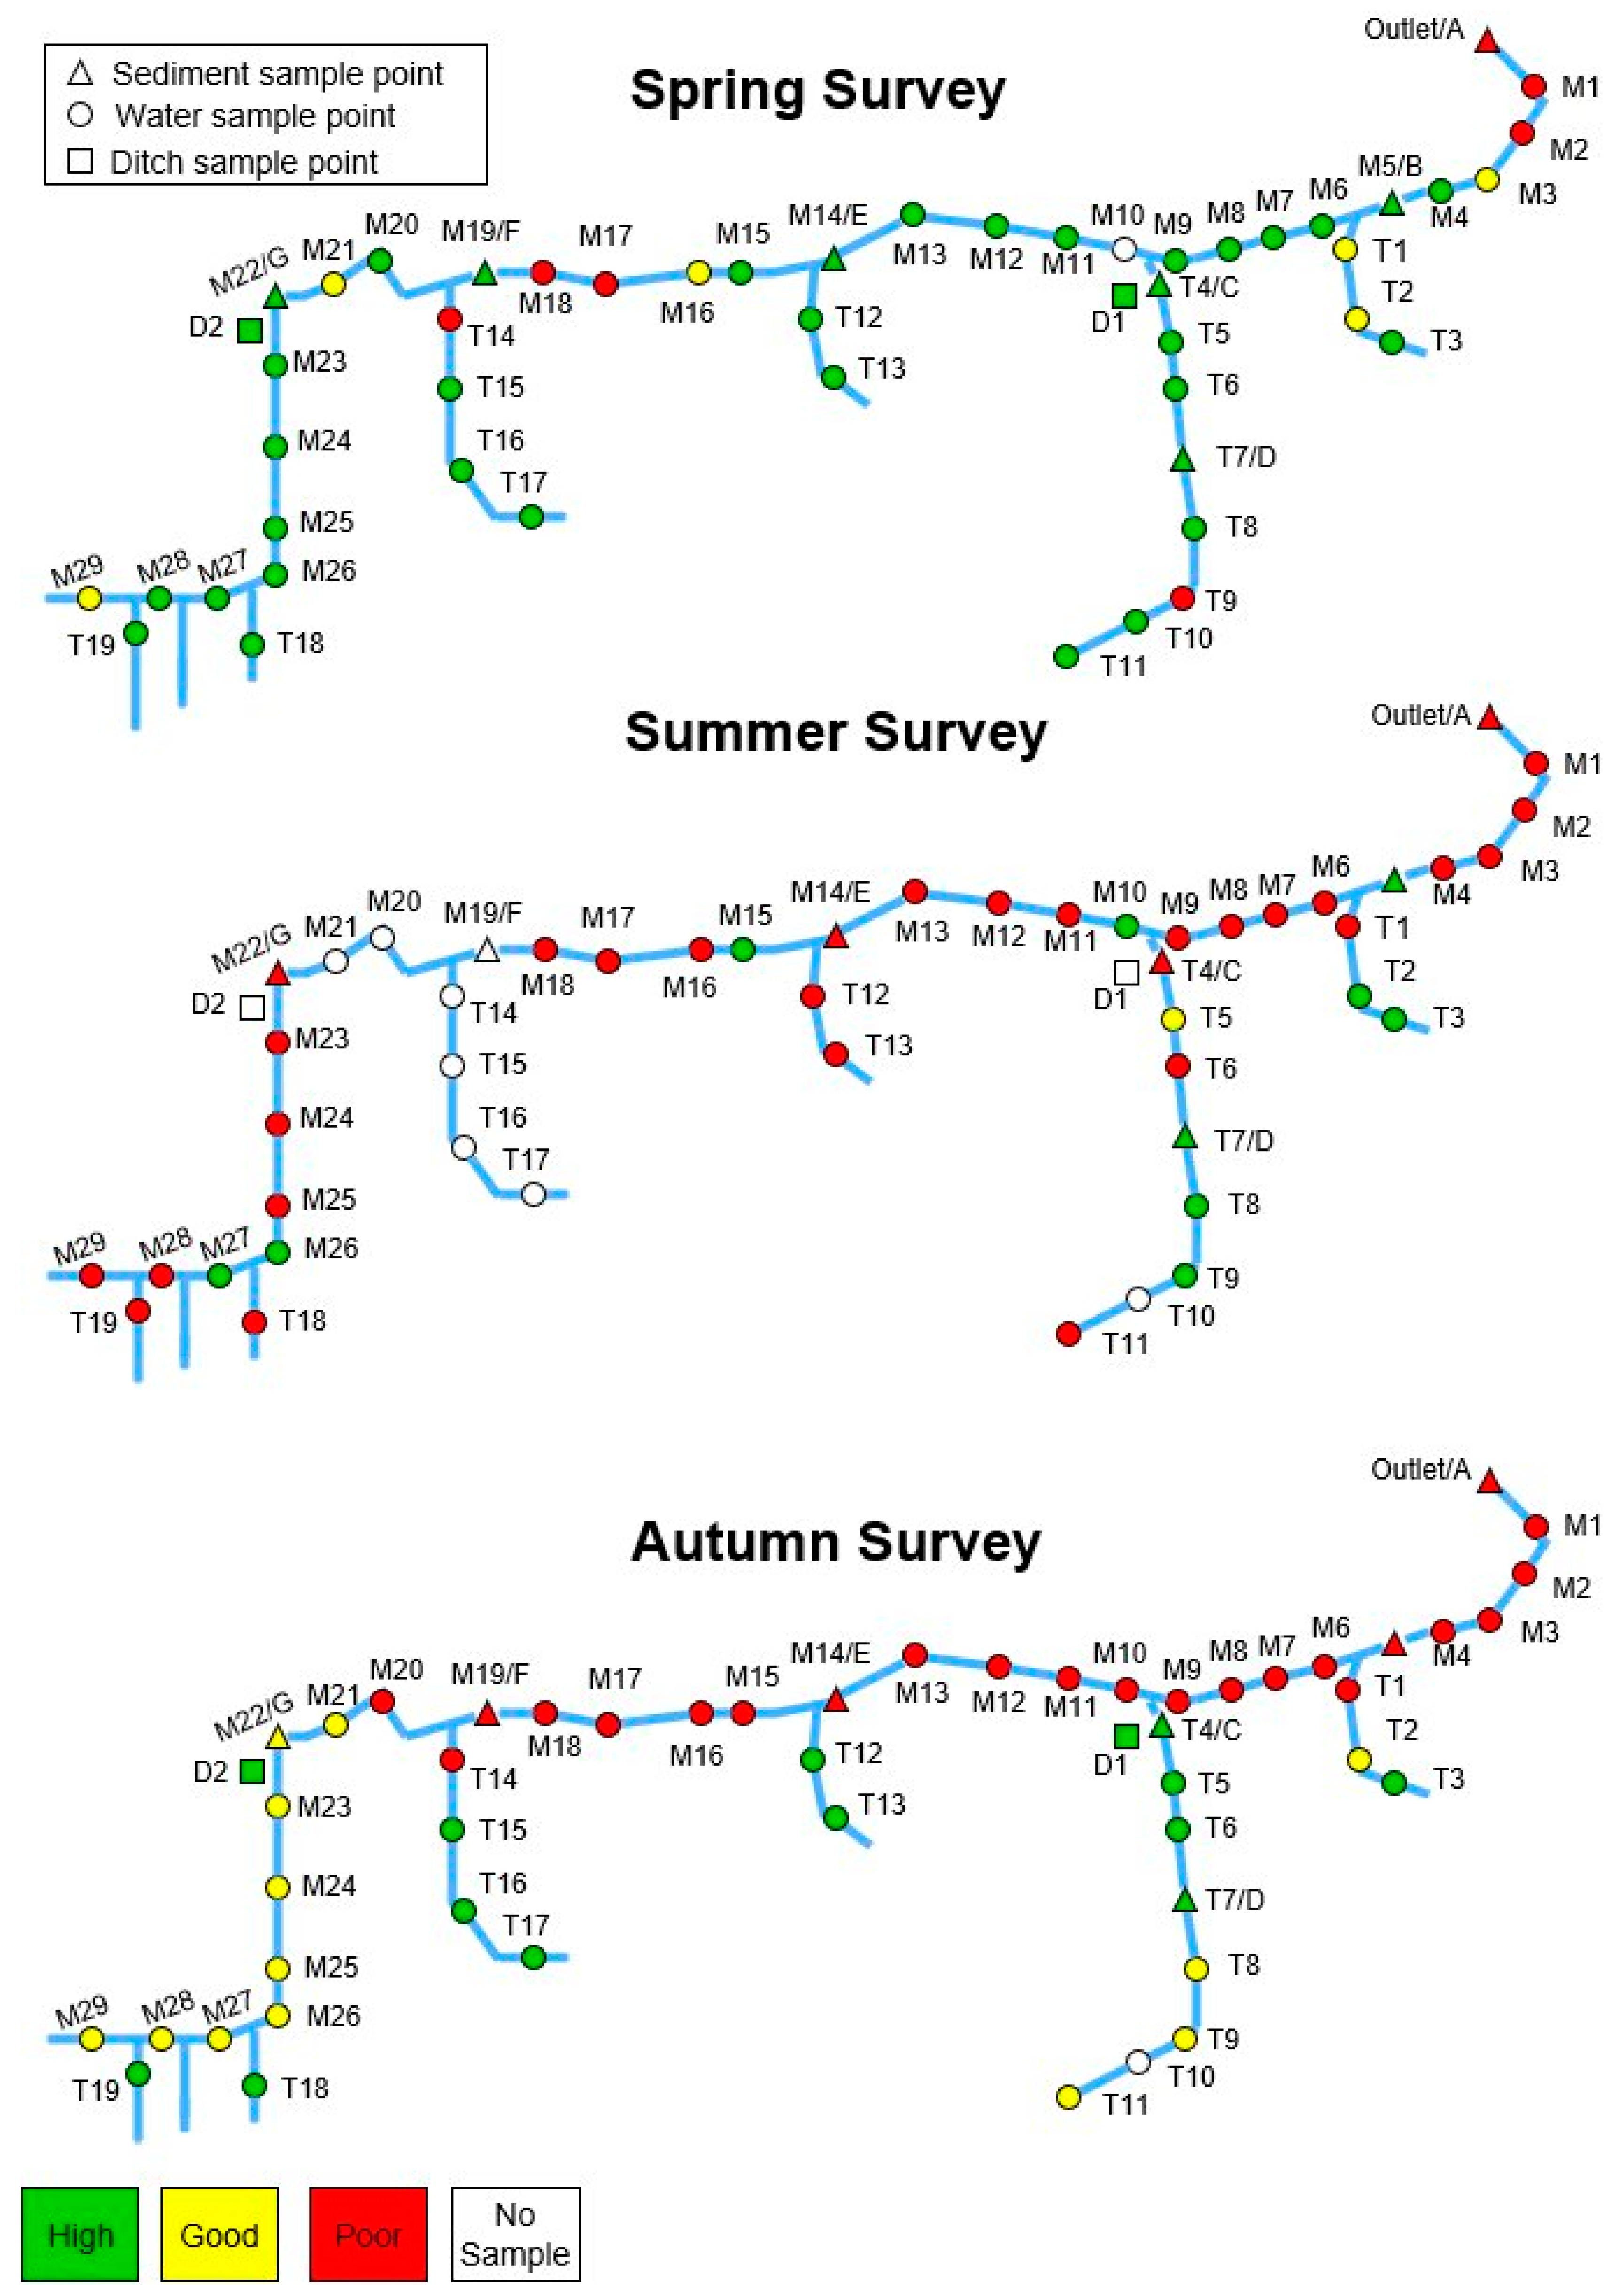
3.2.4. Poorly Drained Grassland

TRP concentrations in the poorly drained grassland catchment during each sampling round are shown in Figure 4. This catchment presents a much flashier hydrology than the others, resulting in predominantly surface-driven P losses [41]. A high percentage of critical source areas have been identified in this catchment (5.6% and 4.1% across two years) [31]; this indicates the combined influence of both P availability and surface transport pathways. Although the catchment does have the potential to attenuate P in its soils due to its high Al and Fe content, the high propensity for runoff means that P bound to sediment particles can be physically disaggregated from the soil surface and transported to the watercourse, and from there they may also be remobilized under suitable conditions [40]. However, the relative proportion of P to Al in the dominant bed sediment source, channel banks, is lower than in the well-drained arable catchment. The opportunity for attenuation of P is thereby diminished as reflected by the consistently low Al:P ratios and resulting high TRP in stream water samples. The streambed sediments were consistently below 11.7 Al:P, and the P content of bed sediments was substantially lower at all sampling points than within the well-drained grassland catchment. This suggests that in-stream mobilization is unlikely to significantly elevate P concentrations, unlike the nearby well-drained arable catchment. At sediment sample locations with consistent seasonal Al:P values (A, B, E, and G), sediment sources were relatively stable and dominated by channel-derived sediment despite changes in TRP concentrations (Table 3). This suggests that the particulate and dissolved phosphorus systems are relatively decoupled at low-flows; therefore, the fluctuating seasonal influence of water point source inputs and accumulating load towards the outlet can be validated.
Unlike the other catchments, we see the highest concentrations near the outlet (sample point O), suggesting a cumulative loading of the watercourse along the stream length. The other factor to be considered in this catchment is the presence of frequent potential persistent point sources such as septic tanks, livestock yards, and cattle access points. While some of the effects of these may be flushed out over winter leading to lowered spring concentrations, their presence, combined with prolonged low-flow conditions/limited dilution and low attenuation, could facilitate the elevated summer and autumn TRP concentrations. While autumn sees reduction at some sampling points, it is not as marked as in the other two catchments. Those points which exceed summer values during the autumn (e.g., T2, T8, T9) may be indicative of point sources. Also, during spring, cattle are not likely to be in the fields as frequently due to poor soil conditions; thus, potential point sources are reduced). Conversely, in summer/autumn, cattle are at grass for longer and move in and out the yard more regularly causing more soiling on roads tracks, which may influence the concentration of TRP in runoff to the watercourse.

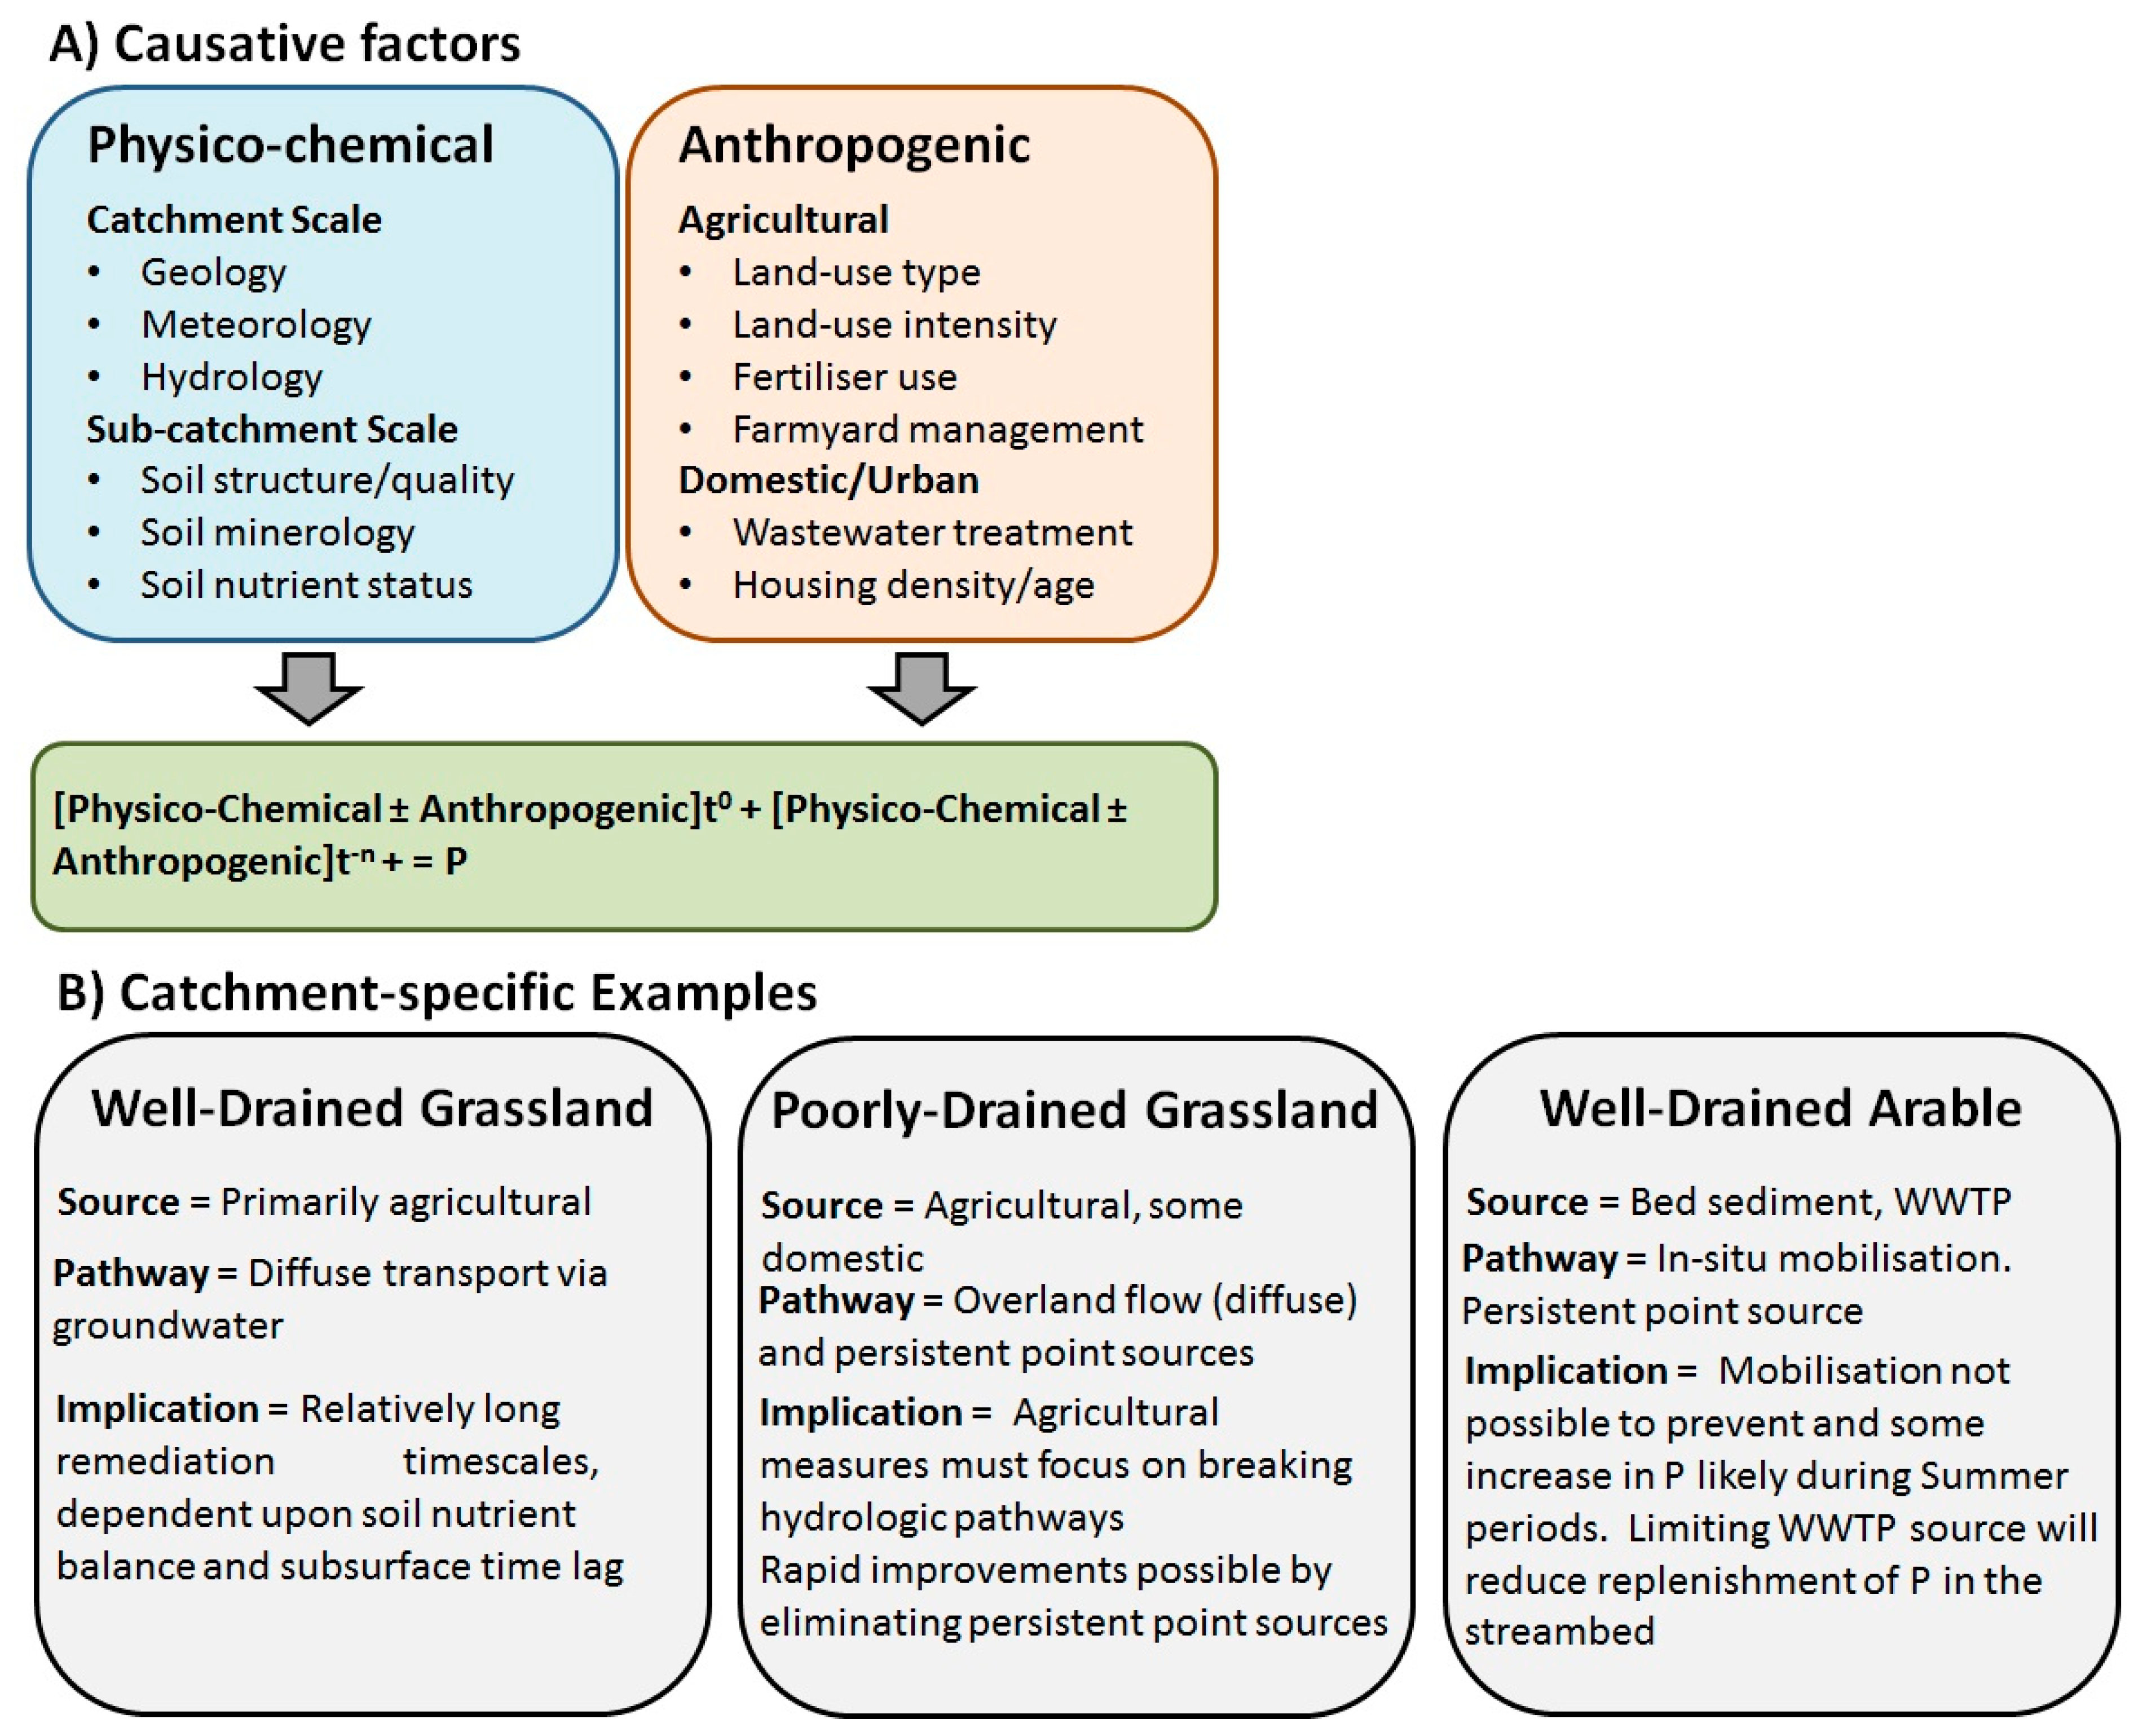
3.2.5. Catchment-Specific Controls and Implications for Management

The results of these repeated surveys reveal different controls on low-flow P concentrations that are dependent upon catchment-specific characteristics and their interactions. These characteristics include both inherent physico-chemical factors and anthropogenic elements (Figure 5A). Crucially, despite the similarity in observations (elevated low-flow P) across all three catchments, the causative factors are unique. While high temporal resolution data at the outlets allows such elevations to be detected, it does not readily indicate the type or location of sources or quantification of the pathways involved. Investigative assessments at catchment scale incorporating sufficient sampling points may improve interpretation. However, when the source is transient or, as in the well-drained arable catchment, when in-stream mobilization of particulate P inputs occurs, a single iteration of the survey may not reveal the nature of the pressure. This is particularly true if water samples are exclusively relied upon, without supplementary soil/sediment chemical analyses. As an example, consider the summer survey of the well-drained arable catchment. The land-use of this catchment is 93% agricultural (54% tillage, 39% grassland), highly productive and highly permeable. Based on a single round of water sampling conducted during summer, it might be reasonable to assume that some leaching through the subsurface is responsible—it is a well-drained catchment with reasonably high agricultural intensity. However, observation of the return to baseline and confirmation of mobilization potential based on sediment chemistry illustrates that this is not the case. The reality in this catchment is more complicated than the common typology. Both in-stream mobilization and domestic wastewater treatment (septic tanks) could be considered as ‘invisible’ sources where they are nested within agricultural landscapes. The interpretation of these repeated surveys is further supported by extensive prior research in these catchments.
From a land management perspective, effective strategies for mitigation of low-flow P concentration will differ greatly, as will the timescales required for observation of any improvement (Figure 5B). Management of low-flow P may require extended timeframes where diffuse groundwater transport is the dominant contributing factor, as in the well-drained grassland. Where mixed diffuse and point sources are responsible, a strategy incorporating multiple tools over a short and long timeframe will be most effective (poorly drained grassland). Diffuse overland pathways must be intercepted at appropriate locations, and rapid improvements are likely by rigorously eliminating both agricultural (yard runoff, cattle access points) and domestic/urban (wastewater treatment) sources. For catchments in which in-stream mobilization is likely (such as the well-drained arable catchment), two key conclusions can be drawn from the present study:
(A) Water sampling without supplementary soil and sediment data may mask the influence of mobilization and in-stream processes leading to the misattribution of sources and pathways within the soil, landscape, farm, or domestic domains. Where these sources or pathways cannot be conclusively identified, bed and bank sediment should be re-examined.
(B) If sediment contributes to the seasonal release of bound P, the standard WFD thresholds may be unachievable for certain stretches of the watercourse, irrespective of mitigation measures imposed outside of the stream. In such cases, natural biogeochemical processes need to be accounted for where in-stream mobilization occurs, mitigation measures focused on limiting the growth of stream algae and macrophytes, despite the presence of nutrients, may have potential benefits. One such example is the provision of shade by maintaining trees in the immediate riparian area [42].

4. Conclusions

Concentrations of reactive phosphorus monitored at high temporal resolution at catchment outlets are elevated recurrently during low-flow periods. These elevations may exceed WFD water quality thresholds and may coincide with ecologically sensitive periods, as was the case in the study catchments examined herein. The results of this repeated synoptic indicate seasonal changes in reactive phosphorus concentrations, with summer concentrations typically exceeding those in spring or autumn during similar low-flows. These elevations derive from a combination of limited dilution/flushing, both point and diffuse sources, and potential in-stream mobilization in some catchments. The surveys also revealed spatial variability in phosphorus concentrations across entire watercourses. Three broad scenarios were identified: a diffuse/groundwater pathway control demonstrating similar concentration changes across most sampling points; an in-stream and persistent point-source control indicated by discrepancies in water and sediment chemistry at specific locations within the catchment; and a mixed control scenario in which point-sources are visibly identified, and increasing concentrations along the main waterbody indicate cumulative loading. Assessment of stream quality as regards phosphorus concentration must take into account the flow of the waterbody, as observations at low-flow are likely to reflect poorer water quality status than is characteristic, and assignment of water quality status should incorporate measurements taken at a range of flow periods. Furthermore, determination of the controls on water quality across the entire watercourse should acknowledge in-stream factors.

Supplementary Materials

The following are available online at https://www.mdpi.com/2073-4441/11/7/1497/s1, Table S1: Chemical composition of soils from potential catchment sources (sieved to 125 microns).

Author Contributions

Conceptualisation: S.E.V., P-E.M., S.L. and N.T.M. Sampling: S.E.V., N.T.M., S.C.S. and S.L., Analysis: S.E.V., N.T.M., K.D., S.C.S. and P-E.M. Manuscript Preparation: S.E.V., P-E.M., K.D., S.C.S., S.L. and N.T.M.

Funding

This research is a part of the Agricultural Catchments Programme, funded by the Department of Agriculture, Food and the Marine.

Acknowledgments

The Agricultural Catchments Programme is funded by the Irish Department of Agriculture, Food and the Marine. The authors thank Michael Fleming, Dermot Leahy, and John Kennedy for their assistance in field sampling and Denis Brennan for laboratory analysis of water samples.

Conflicts of Interest

The authors declare no conflict of interests.

References

  1. European Commission. Council Directive (2000/60/EC): EC Directive of the European Parliament and of the Council 200/60/EC Establishing a Framework for Community Action in the Field of Water Policy; European Commission: Brussels, Belgium, 2000; p. 72. [Google Scholar]
  2. Shore, M.M.; Murphy, S.; Mellander, P.-E.; Shortle, G.; Melland, A.R.; Crockford, L.; O’Flaherty, V.; Williams, L.; Morgan, G.; Jordan, P. Influence of stormflow and baseflow phosphorus pressures on stream ecology in agricultural catchments. Sci. Total Environ. 2017, 590–591, 469–483. [Google Scholar] [CrossRef]
  3. Mellander, P.-E.; Jordan, P.; Bechmann, M.; Fovett, O.; Shore, M.M.; McDonald, N.T.; Gascuel-odoux, C. Integrated climate-chemical indicators of diffuse pollution from land to water. Sci. Rep. 2018, 8, 944. [Google Scholar] [CrossRef]
  4. Davis, S.J.; Ó hUallacháin, D.; Mellander, P.-E.; Kelly, A.-M.; Matthaei, C.D.; Piggott, J.J.; Kelly-Quinn, M. Multiple-stressor effect of sediment, phosphorus and nitrogen on stream macroinvertebrate communities. Sci. Total Environ. 2018, 637–638, 577–587. [Google Scholar] [CrossRef] [PubMed]
  5. Skeffington, R.A.; Halliday, S.J.; Wade, A.J.; Bowes, M.J.; Loewenthal, M. Using high-frequency water quality data to assess sampling strategies for the EU Water Framework Directive. Hydrol. Earth Syst. Sci. 2015, 19, 2491–2504. [Google Scholar] [CrossRef] [Green Version]
  6. Bowes, M.J.; Smith, J.T.; Neal, C. The value of high-resolution nutrient monitoring: A case study of the River Frome, Dorset, UK. J. Hydrol. 2009, 378, 82–96. [Google Scholar] [CrossRef]
  7. Cassidy, R.; Jordan, P. Limitations of instantaneous water quality sampling in surface-water catchments: Comparison with near-continuous phosphorus time-series data. J. Hydrol. 2011, 405, 182–193. [Google Scholar] [CrossRef]
  8. Rode, M.; Wade, A.J.; Cohen, M.J.; Hensley, R.T.; Bowes, M.J.; Kirchner, J.W.; Arhonitsis, G.B.; Jordan, P.; Kronvang, B.; Halliday, S.J.; et al. Sensors in the stream: The high-frequency wave of the present. Environ. Sci. Technol. 2016, 50, 10297–10307. [Google Scholar] [CrossRef] [PubMed]
  9. Grayson, R.B.; Gippel, C.J.; Finlayson, B.L.; Hart, B.T. Catchment-wide impacts on water quality: The use of ‘snapshot’ sampling during stable flow. J. Hydrol. 1997, 199, 121–134. [Google Scholar] [CrossRef]
  10. Edwards, A.C.; Cook, Y.; Smart, R.; Wade, A.J. Concentrations of nitrogen and phosphorus in streams draining the mixed land-use Dee catchment, north-east Scotland. J. Appl. Ecol. 2000, 37, 159–170. [Google Scholar] [CrossRef]
  11. Mellander, P.-E.; Jordan, P.; Shore, M.; McDonald, N.T.; Wall, D.P.; Shortle, G.; Daly, K. Identifying contrasting influences and surface water signals for specific groundwater phosphorus vulnerability. Sci. Total Environ. 2016, 541, 292–302. [Google Scholar] [CrossRef]
  12. Bowes, M.J.; Smith, J.T.; Jarvie, H.P.; Neal, C.; Barden, R. Changes in point and diffuse source phosphorus inputs to the River Frome (Dorset, UK) from 1966 to 2006. Sci. Total Environ. 2009, 407, 1954–1966. [Google Scholar] [CrossRef] [PubMed]
  13. Dupas, R.; Mellander, P.-E.; Gascuel-Odoux, C.; Fovet, O.; McAleer, E.B.; McDonald, N.T.; Shore, M.; Jordan, P. The role of mobilization and delivery processes on contrasting dissolved nitrogen and phosphorus exports in groundwater fed catchments. Sci. Total Environ. 2017, 599–600, 1275–1287. [Google Scholar] [CrossRef] [PubMed]
  14. Jordan, P.; Arnscheidt, A.; McGrogan, H.; McCormick, S. High-resolution phosphorus transfers at the catchment scale: The hidden importance of non-storm transfers. Hydrol. Earth Syst. Sci. 2005, 9, 685–691. [Google Scholar] [CrossRef]
  15. Shore, M.M.; Jordan, P.; Mellander, P.-E.; Kelly-Quinn, M.; Daly, K.; Sims, J.T.; Wall, D.P.; Melland, A.R. Characterisation of agricultural drainage ditch sediments along the phosphorus transfer continuum in two contrasting headwater catchments. J. Soils Sediments 2016, 16, 1643–1654. [Google Scholar] [CrossRef]
  16. Jordan, P.; Arnscheidt, A.; McGrogan, H.; McCormick, S. Characterising phosphorus transfers in rural catchments using a continuous bank-side analyser. Hydrol. Earth Syst. Sci. Discuss. 2007, 11, 372–381. [Google Scholar] [CrossRef] [Green Version]
  17. Neal, C.; Jarvie, H.P.; Withers, P.J.A.; Whitton, B.A.; Neal, M. The strategic significance of wastewater sources to pollutant phosphorus levels in English rivers and to environmental management for rural, agricultural and urban catchments. Sci. Total Environ. 2010, 408, 1485–1500. [Google Scholar] [CrossRef] [PubMed]
  18. Macintosh, K.A.; Jordan, P.; Cassidy, R.; Arnscheidt, J.; Ward, C. Low flow water quality in rivers; septic tank systems and high-resolution phosphorus signals. Sci. Total Environ. 2011, 412–413, 58–65. [Google Scholar] [CrossRef] [PubMed]
  19. Edwards, A.C.; Withers, P. Transport and delivery of suspended solids, nitrogen and phosphorus from various sources to freshwaters in the UK. J. Hydrol. 2008, 350, 144–153. [Google Scholar] [CrossRef]
  20. Arnscheidt, J.; Jordan, P.; Li, S.; McCormick, S.; McFaul, R.; McGrogan, H.J.; Neal, M.; Sims, J.T. Defining the sources of low-flow phosphorus transfers in complex catchments. Sci. Total Environ. 2007, 382, 1–13. [Google Scholar] [CrossRef] [PubMed]
  21. Dudley, D.; May, L. Estimating the Phosphorus Load to Waterbodies from Septic Tanks (C03273, C01352); Centre for Ecology and Hydrology: Edinburgh, UK, 2007; p. 45. [Google Scholar]
  22. Withers, P.J.A.; Jarvie, H.P.; Stoate, C. Quantifying the impact of septic tank systems on eutrophication risk in rural headwaters. Environ. Int. 2011, 37, 64–653. [Google Scholar] [CrossRef] [PubMed]
  23. Mockler, E.M.; Deakin, J.; Archbold, M.; Gill, L.; Daly, D.; Bruen, M. Sources of nitrogen and phosphorus emissions to Irish rivers and coastal waters: Estimates from a nutrient load apportionment framework. Sci. Total Environ. 2017, 601–602, 326–339. [Google Scholar] [CrossRef] [PubMed]
  24. Richards, S.; Paterson, E.; Withers, P.J.A.; Sutter, M. Septic tank discharges as multi-pollutant hotspots in catchments. Sci. Total Environ. 2016, 542, 854–863. [Google Scholar] [CrossRef] [PubMed]
  25. Ensign, S.H.; Doyle, M.W. Nutrient spiralling in streams and river networks. J. Geophys. Res. 2006, 111, G04009. [Google Scholar] [CrossRef]
  26. Daly, K.; Tuohy, P.; Peyton, D.; Wall, D.P.; Fenton, O. Field soil and ditch sediment phosphorus dynamics from two artificially drained fields on poorly drained soils. Agric. Water Manag. 2017, 192, 115–125. [Google Scholar] [CrossRef]
  27. Agudelo, S.C.; Nelson, N.O.; Barnes, P.L.; Keane, T.D.; Pierzynski, G.M. Phosphorus adsorption and desorption potential of stream sediments and field soils in agricultural watersheds. J. Environ. Qual. 2011, 40, 144–152. [Google Scholar] [CrossRef] [PubMed]
  28. Su, J.; van Bochove, J.; Auclair, J.-C.; Thériault, G.; Denault, J.-T.; Bossé, C.; Li, X.; Hu, C. Phosphorus algal availability and release potential in suspended and streambed sediments in relation to sediment and catchment characteristics. Agric. Ecosyst. Environ. 2014, 188, 169–179. [Google Scholar] [CrossRef]
  29. Duan, S.; Kaushal, S.S.; Groffman, P.M.; Band, L.E.; Belt, K.J. Phosphorus export across an urban to rural gradient in the Chesapeake Bay river watershed. J. Geophys. Res. 2012, 117, G01025. [Google Scholar] [CrossRef]
  30. Mulholland, P.J. Regulation of nutrient concentrations in a temperate forest stream: Roles of upland, riparian and instream processes. Limnol. Oceanogr. 1992, 37, 1512–1526. [Google Scholar] [CrossRef]
  31. Thomas, I.A.; Mellander, P.-E.; Murphy, P.N.C.; Fenton, O.; Shine, O.; Djodjic, F.; Dunlop, P.; Jordan, P. A sub-field scale critical source area index for legacy phosphorus management using high resolution data. Agric. Ecosyst. Environ. 2016, 233, 238–252. [Google Scholar] [CrossRef] [Green Version]
  32. McDonald, N.T.; Wall, D.P.; Mellander, P.-E.; Buckley, C.; Shore, M.; Shortle, G.; Leach, S.; Burgess, E.; O’Connell, T.; Jordan, P. Field scale phosphorus balances and legacy soil pressures in mixed-land use catchments. Agric. Ecosyst. Environ. 2019, 274, 14–23. [Google Scholar] [CrossRef]
  33. Sherriff, S.C.; Rowan, J.S.; Fenton, O.; Jordan, P.; Ó hUallacháin, D. Sediment fingerprinting as a tool to identify temporal and spatial variability of sediment sources and transport pathways in agricultural catchments. Agric. Ecosyst. Environ. 2018, 267, 188–200. [Google Scholar] [CrossRef]
  34. Franks, S.W.; Rowan, J.S. Multi-parameter fingerprinting of sediment sources: Uncertainty estimation and tracer selection. Comput. Methods Water Resour. 2000, 13, 1067–1074. [Google Scholar]
  35. Schulte, R.P.O.; Melland, A.R.; Fenton, O.; Herlihy, M.; Richards, K.; Jordan, P. Modelling soil phosphorus decline: Expectations of Water Framework Directive policies. Environ. Sci. Policy 2010, 13, 472–484. [Google Scholar] [CrossRef]
  36. Murphy, P.N.C.; Mellander, P.-E.; Melland, A.R.; Buckley, C.; Shore, M.; Shortle, G.; Wall, D.P.; Treacy, M.; Shine, O.; Mechan, S.; et al. Variable response to phosphorus mitigation measures across the nutrient transfer continuum in a dairy grassland catchment. Agric. Ecosyst. Environ. 2015, 207, 192–202. [Google Scholar] [CrossRef] [Green Version]
  37. Daly, K.; Styles, D.; Lalor, S.T.J.; Wall, D.P. Phosphorus sorption, supply potential and availability in soils with contrasting parent material and soil chemical properties. Eur. J. Soil Sci. 2015, 66, 792–801. [Google Scholar] [CrossRef]
  38. Upreti, K.; Joshi, S.R.; McGrath, J.; Jaisi, D.P. Factors controlling phosphorus mobilization in a coastal plain tributary to the Chesapeake Bay. Soil Sci. Soc. Am. J. 2015, 79, 826–837. [Google Scholar] [CrossRef]
  39. McAleer, E.B.; Coxon, C.E.; Richards, K.G.; Jahangir, M.M.R.; Grant, J.; Mellander, P.-E. Groundwater nitrate reduction versus dissolved gas production: A tale of two catchments. Sci. Total Environ. 2017, 586, 372–389. [Google Scholar] [CrossRef] [PubMed] [Green Version]
  40. Sherriff, S.C.; Rowan, J.S.; Fenton, O.; Jordan, P.; Melland, A.; Mellander, P.-E.; Ó hUallacháin, D. Storm event suspended sediment-discharge hysteresis and controls in agricultural watersheds: Implications for watershed scale sediment management. Environ. Sci. Technol. 2016, 50, 1769–1778. [Google Scholar] [CrossRef] [PubMed]
  41. Mellander, P.-E.; Jordan, P.; Shore, M.; Melland, A.R.; Shortle, G. Flow paths and phosphorus transfer pathways in two agricultural streams with contrasting flow controls. Hydrol. Process. 2015, 29, 3504–3518. [Google Scholar] [CrossRef]
  42. Burrell, T.K.; O’Brien, J.M.; Graham, S.E.; Simon, K.S.; Harding, J.S.; McIntosh, A.R. Riparian shading mitigates stream eutrophication in agricultural catchments. Freshw. Sci. 2014, 33, 73–84. [Google Scholar] [CrossRef]
Figure 1. Locations of the three study catchments.
Water 11 01497 g001
Figure 2. Water Framework Directive (WFD) status (according to TRP thresholds) for synoptic sampling points in the well-drained grassland (Timoleague) catchment. M = Main stream sample points, T = Tributary sample points, and D = Ditch sample points.
Water 11 01497 g002
Figure 3. WFD status (according to TRP thresholds) for synoptic sampling points in the well-Drained Arable (Castledockrell) catchment. M = Main stream sample points, T = Tributary sample points, and D = Ditch sample points.
Water 11 01497 g003
Figure 4. WFD status (according to TRP thresholds) for synoptic sampling points in the poorly drained grassland (Ballycanew) catchment. M = Main stream sample points, T = Tributary sample points, and D = Ditch sample points.
Water 11 01497 g004
Figure 5. Conceptual diagram of controls on P influences in different catchments. Physico-chemical and anthropogenic controlling factors are displayed in section (A). Examples from the present study and the implications for management are shown in section (B). t0 indicates controls on day of observation, t−n indicates antecedent controls, and P indicates in-stream phosphorus.
Water 11 01497 g005
Table 1. Catchment characterization and summary of high temporal resolution data monitored at the outlets (2010–2016).
Well-Drained GrasslandWell-Drained ArablePoorly Drained Grassland
Area7.6 km211.2 km211.9 km2
Dominant Soil Drainage ClassWell-drainedWell-drainedPoorly drained
Average Annual Rainfall (mm)112110141043
70th Percentile Discharge≤ 4441 m3/s≤ 3871 m3/s≤ 1790 m3/s
Average Low-flow total reactive phosphorus (TRP) Conc. (mg L−1)0.0630.0450.084
Average Annual TRP Conc. (mg L−1)0.0630.0290.076
Average Annual total phosphorus (TP) Load (kg)198311723646
Average Annual TP Load (kg/ha)261105306
Trends at the outlet—Total Reactive Phosphorus (TRP) vs. discharge.
Table 2. Summary of total reactive phosphorus (TRP) concentrations across the main stream and tributaries.
Well-Drained GrasslandWell-Drained ArablePoorly Drained Grassland
SeasonSpringSummerAutumnSpringSummerAutumnSpringSummerAutumn
Sampling Date19 April 20175 July 201726 November 20173 May 20173 July 201711 November 201725 April 201711 July 201720 November 2017
Daily Discharge (m3)9605310071384290468410508378620683647
Mean Outlet TRP (mg L−1)0.03460.04740.04970.01070.02450.02150.05660.09670.0787
Full Watercourse
TRP (mg L−1)Min.0.0000.0030.0020.0030.0060.0040.0080.0100.009
Mean0.0100.0400.0320.0110.0190.0150.0240.0460.037
Max0.0590.1870.0510.0340.0590.1430.0540.0930.090
Range0.0590.1840.0490.0310.0530.1390.0460.0830.081
≥ 0.0353%57%50%0%11%2%14%71%53%
Main Stream
TRP (mg L−1)Min.0.0000.0040.0020.0070.0080.0040.0170.0100.025
Mean0.0120.0540.0300.0150.0210.0200.0260.0520.044
Max0.0590.1870.0510.0310.0450.1430.0490.0930.090
Range0.0590.1830.0490.0240.0370.1390.0320.0830.065
≥ 0.0354%90%43%0%24%5%17%85%76%
Tributaries
TRP (mg L−1)Min.0.0000.0030.0090.0030.0060.0050.0080.0160.009
Mean0.0070.0200.0340.0090.0130.0090.0200.0340.026
Max0.0130.0390.0490.0340.0170.0120.0540.0680.067
Range0.0130.0360.0400.0310.0110.0070.0460.0520.058
≥ 0.0350%7%60%0%3%0%10%43%20%
Table 3. Al:P ratios in bed sediment samples during summer and autumn surveys. Shading indicates ratios above the threshold 11.7 threshold suggesting potential attenuation.
Al:P Ratio
Sample PointABCDEFG
Well-Drained GrasslandSummer4.094.564.134.846.279.755.36
Autumn4.204.764.256.036.176.706.41
Well-Drained ArableSummer11.163.7810.6616.3410.903.7712.60
Autumn12.098.4817.5915.978.894.2313.84
Poorly Drained GrasslandSummer6.876.0714.488.318.675.485.40
Autumn7.856.345.9911.329.189.825.64

