1. Introduction
Rapid and intensive urbanisation in the developing world has contributed to an increase in the problems their populations face. Flooding is one such problem, with hazardous social, economic and environmental implications that are exacerbated, both in terms of frequency and intensity, by climate change [
1]. The impact is particularly significant for the urban low-income communities whose livelihood recovery may take much longer, thus further increasing their vulnerability [
2]. Blue–Green Infrastructure (BGI) is a general term that involves ecological engineering and green infrastructure implementation in terrestrial and freshwater systems, and increasingly, in marine environments [
3,
4]. In this paper, BGI broadly refers to an innovative approach to flood risk management (FRM) that brings water management and green infrastructure together to maintain natural water cycles [
5]. BGI includes green spaces, and natural and man-made water features, which combined form a network in urban space, and can deliver environmental, economic and social benefits [
6,
7].
This research focuses on BGI strategies, few examples of which already exist in the general Semarang area and which are feasible within the local space and resource constraints. In the urban context, these include BGI strategies that can accommodate and/or retain floodwater (e.g., biopores, infiltration wells, retention ponds/artificial lakes, permeable pavements, bio-swales, rain gardens, green roofs and rainwater harvesting systems), in contrast to grey infrastructure that is designed to remove stormwater (e.g., drainpipes, culverts) as quickly as possible from urban settlements [
6] (p. 1). Biopores, infiltration wells, green roofs, permeable pavements and rainwater harvesting systems could be implemented at the household level, whereas bioswales, retention ponds and rain gardens are typically found in housing estates.
At urban scale, BGI adoption has the potential to alleviate the risk of urban flooding and climate change impacts, by increasing the capacity of urban drainage and complementing grey infrastructure’s ability to cope with an extreme surge of water in the event of flooding [
8]. BGI provides adaptation strategies to manage surface water while increasing green spaces and delivering multiple socio-economic benefits [
9]. In the UK, the term is often used interchangeably with Green Infrastructure (GI), Sustainable Urban Drainage Systems (SUDS) and Water Sensitive Urban Design (WSUD), while in the USA it is also known as Low Impact Development (LID) [
10] and stormwater Best Management Practices (BMPs) [
11]. There are, however, subtle differences amongst these terms [
10].
BGI implementation has, in recent years, gained traction [
12] due to increasing evidence of its potential environmental, social and health benefits [
13]. Lawson et al. [
14] evaluate its benefits for natural flood risk management strategies; Ghofrani et al. [
3] provide a recent review of BGI concepts identifying the Netherlands as the country where BGI is most widely implemented, although case studies from the UK [
8], Australia [
15], the USA [
16], China [
17] and Singapore [
18] have also been researched. BGI is also recognised as having other benefits to the urban environment [
3,
19,
20], such as improving air quality and aesthetics [
21] to name a few, and is increasingly considered to be a sustainable approach for FRM [
22].
However, widespread adoption of BGI is hampered by various challenges, ranging from scientific uncertainty and lack of awareness about BGI, to its omission from planning processes and low confidence in its benefits. Barriers to BGI adoption [
23] can be broadly classified into two distinct types—biophysical and socio-political [
8,
24]. The focus of this paper is on the latter. For wider adoption of BGI, Young et al. [
25] maintain the need to consider socio-economic and cultural aspects alongside ecological and technical issues. This is due to their influence being key to the successful adoption of BGI concepts in urban development planning policies that aim to enhance community resilience to flooding. Based on the case study of Semarang, Indonesia, this paper discusses the socio-economic, political and cultural barriers influencing BGI adoption, which are important to take into account when implementing BGI in fast-growing cities of low- and middle-income countries, facing similar environmental hazards.
1.1. Overview of Requisites for Effective BGI Adoption
Successful BGI adoption requires an FRM approach that is
inclusive, embracing “bottom-up” community participation;
proactive, engaging multiple stakeholders to take action; and
appropriate, implementing BGI solutions suited to the local context [
26]. An inclusive approach ideally involves all citizens regarded at risk as a result of socio-demographic status (such as disability, cultural, ethnic, religion), socio-economic and psychological circumstances that contribute to increased vulnerability as well as exposure to a hazard [
26]. A “bottom-up” approach requiring community participation can be the key to adoption and could be considered alongside the predominantly “top-down” approaches to managing urban flooding risk.
A multi-stakeholder approach is required to proactively embrace a collaborative attitude and willingness to take action in the planning, development and maintenance stages. Hence, the community members’, water practitioners’ and policymakers’ pro-activeness to take action is viewed as a requisite for effective BGI adoption. Moreover, BGI solutions need to be technically desirable and culturally feasible within the local context that is characterised by resource constraints, high level of urbanisation, and concentrations of vulnerable low-income populations living in high risk areas. Thus, solutions need to be tailored to local needs and capacities, and to be affordable for the community and local government to adopt.
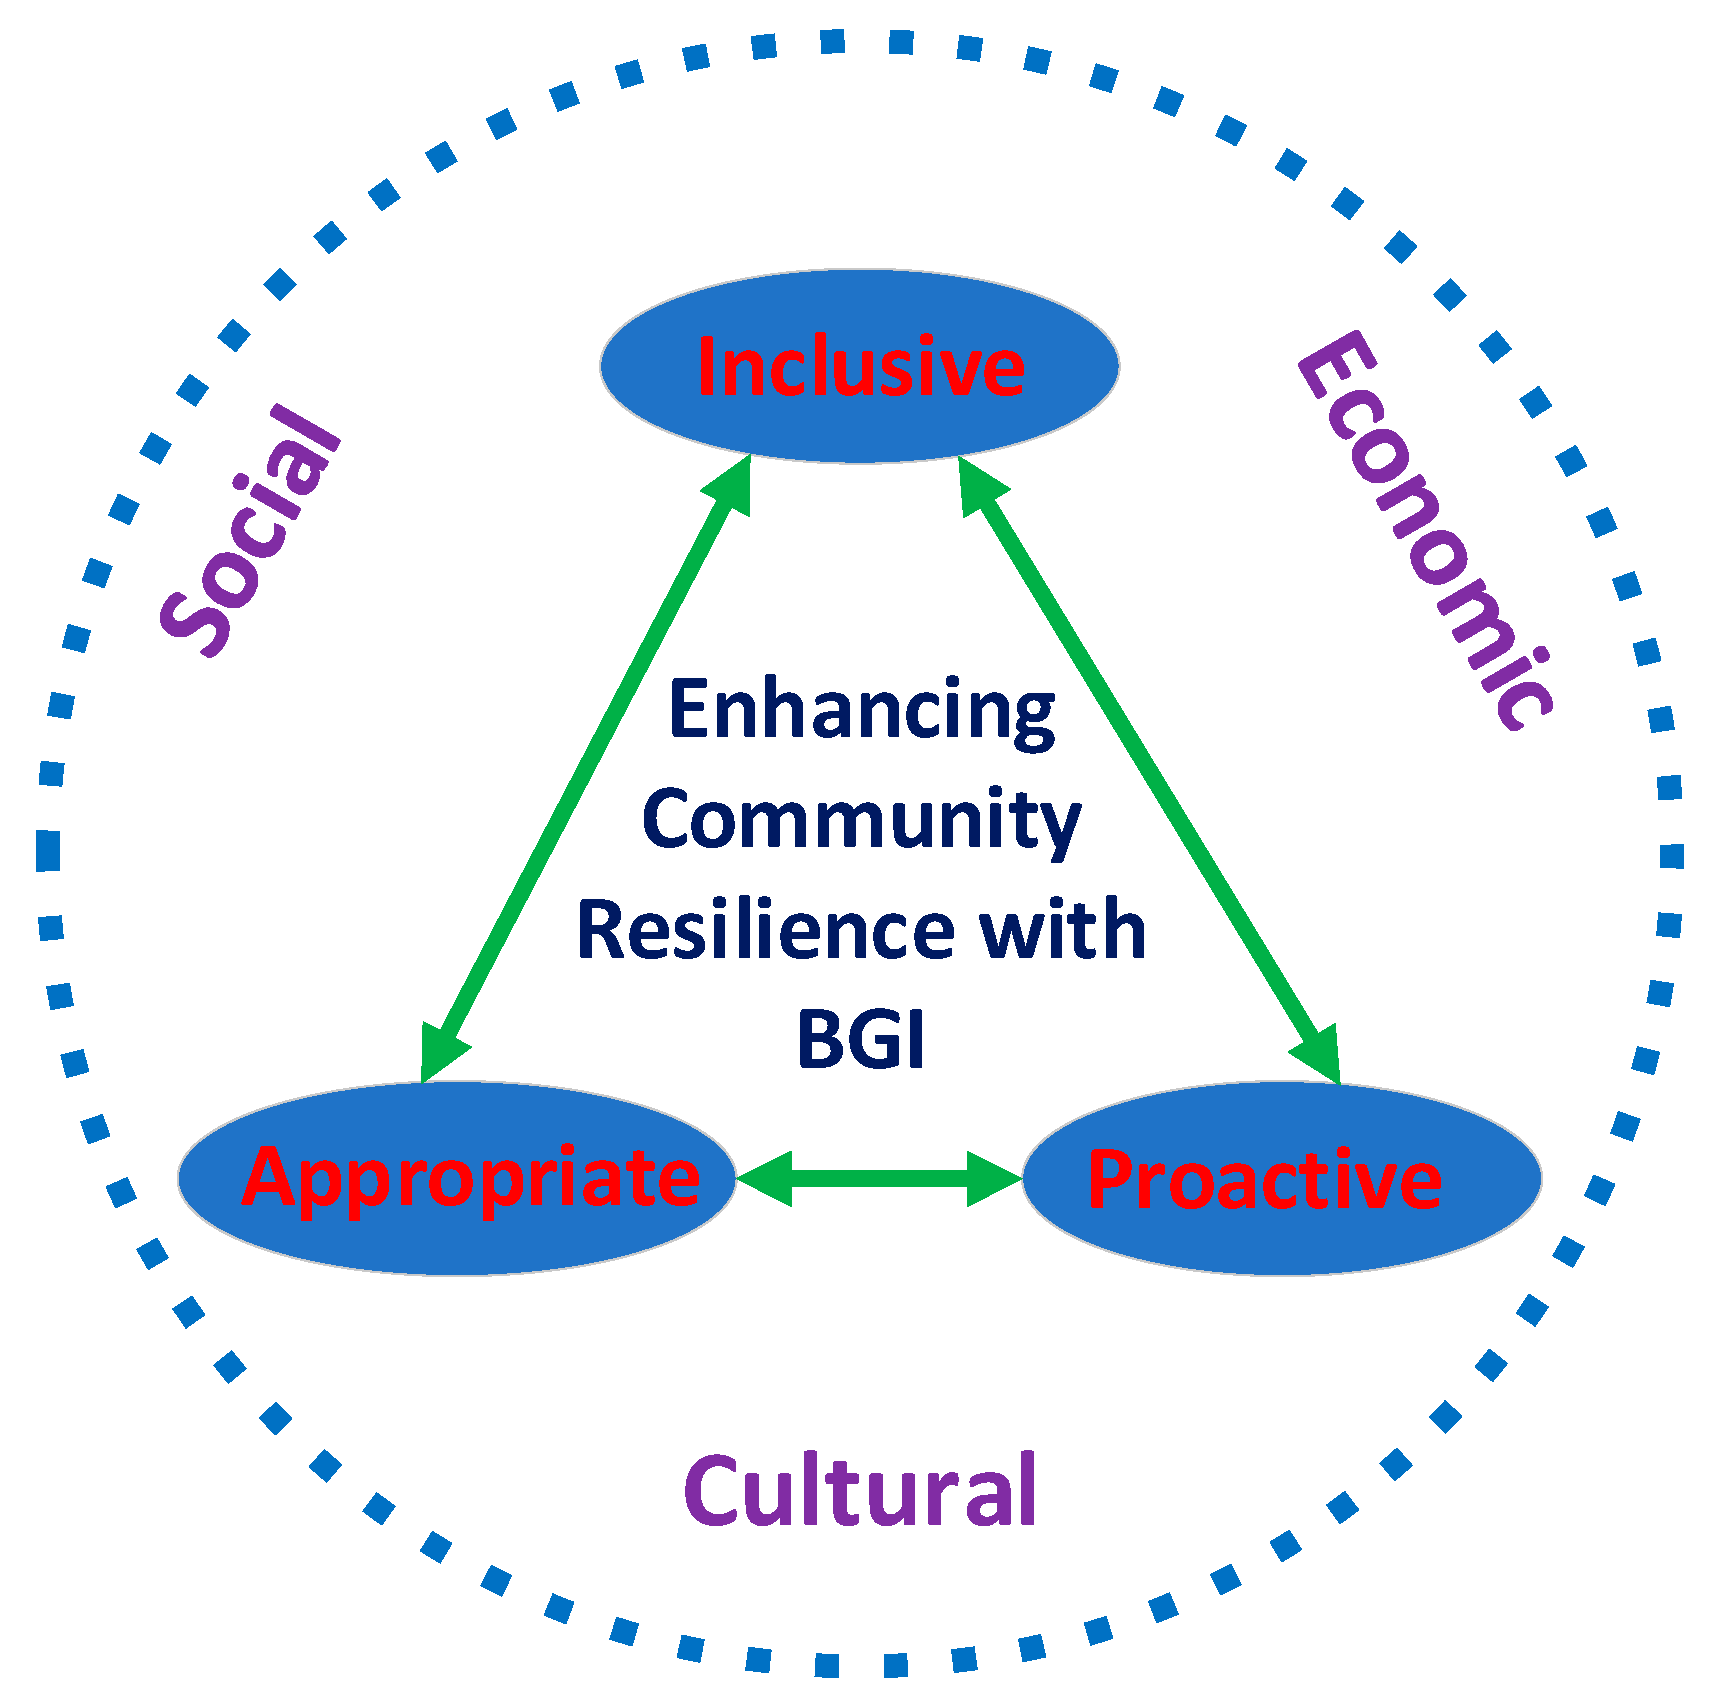
Figure 1 depicts a simple representation of these three key inter-related requisites that need to be addressed in order to achieve the aim of enhancing community resilience to flooding with BGI. These requisites can be enabled or hindered by socio-economic and cultural issues that provide the local context of BGI adoption. The dotted circle alludes to an open system and the dynamic nature of the conceptual idea, where factors such as current political imperatives could influence the importance and priority of the three requisites. Greater understanding of socio-economic and cultural issues facilitates the development of policies that support
inclusive,
proactive and
appropriate BGI solutions to be implemented and adopted by communities at grass-root level.
1.2. The Case Study of Semarang, Indonesia
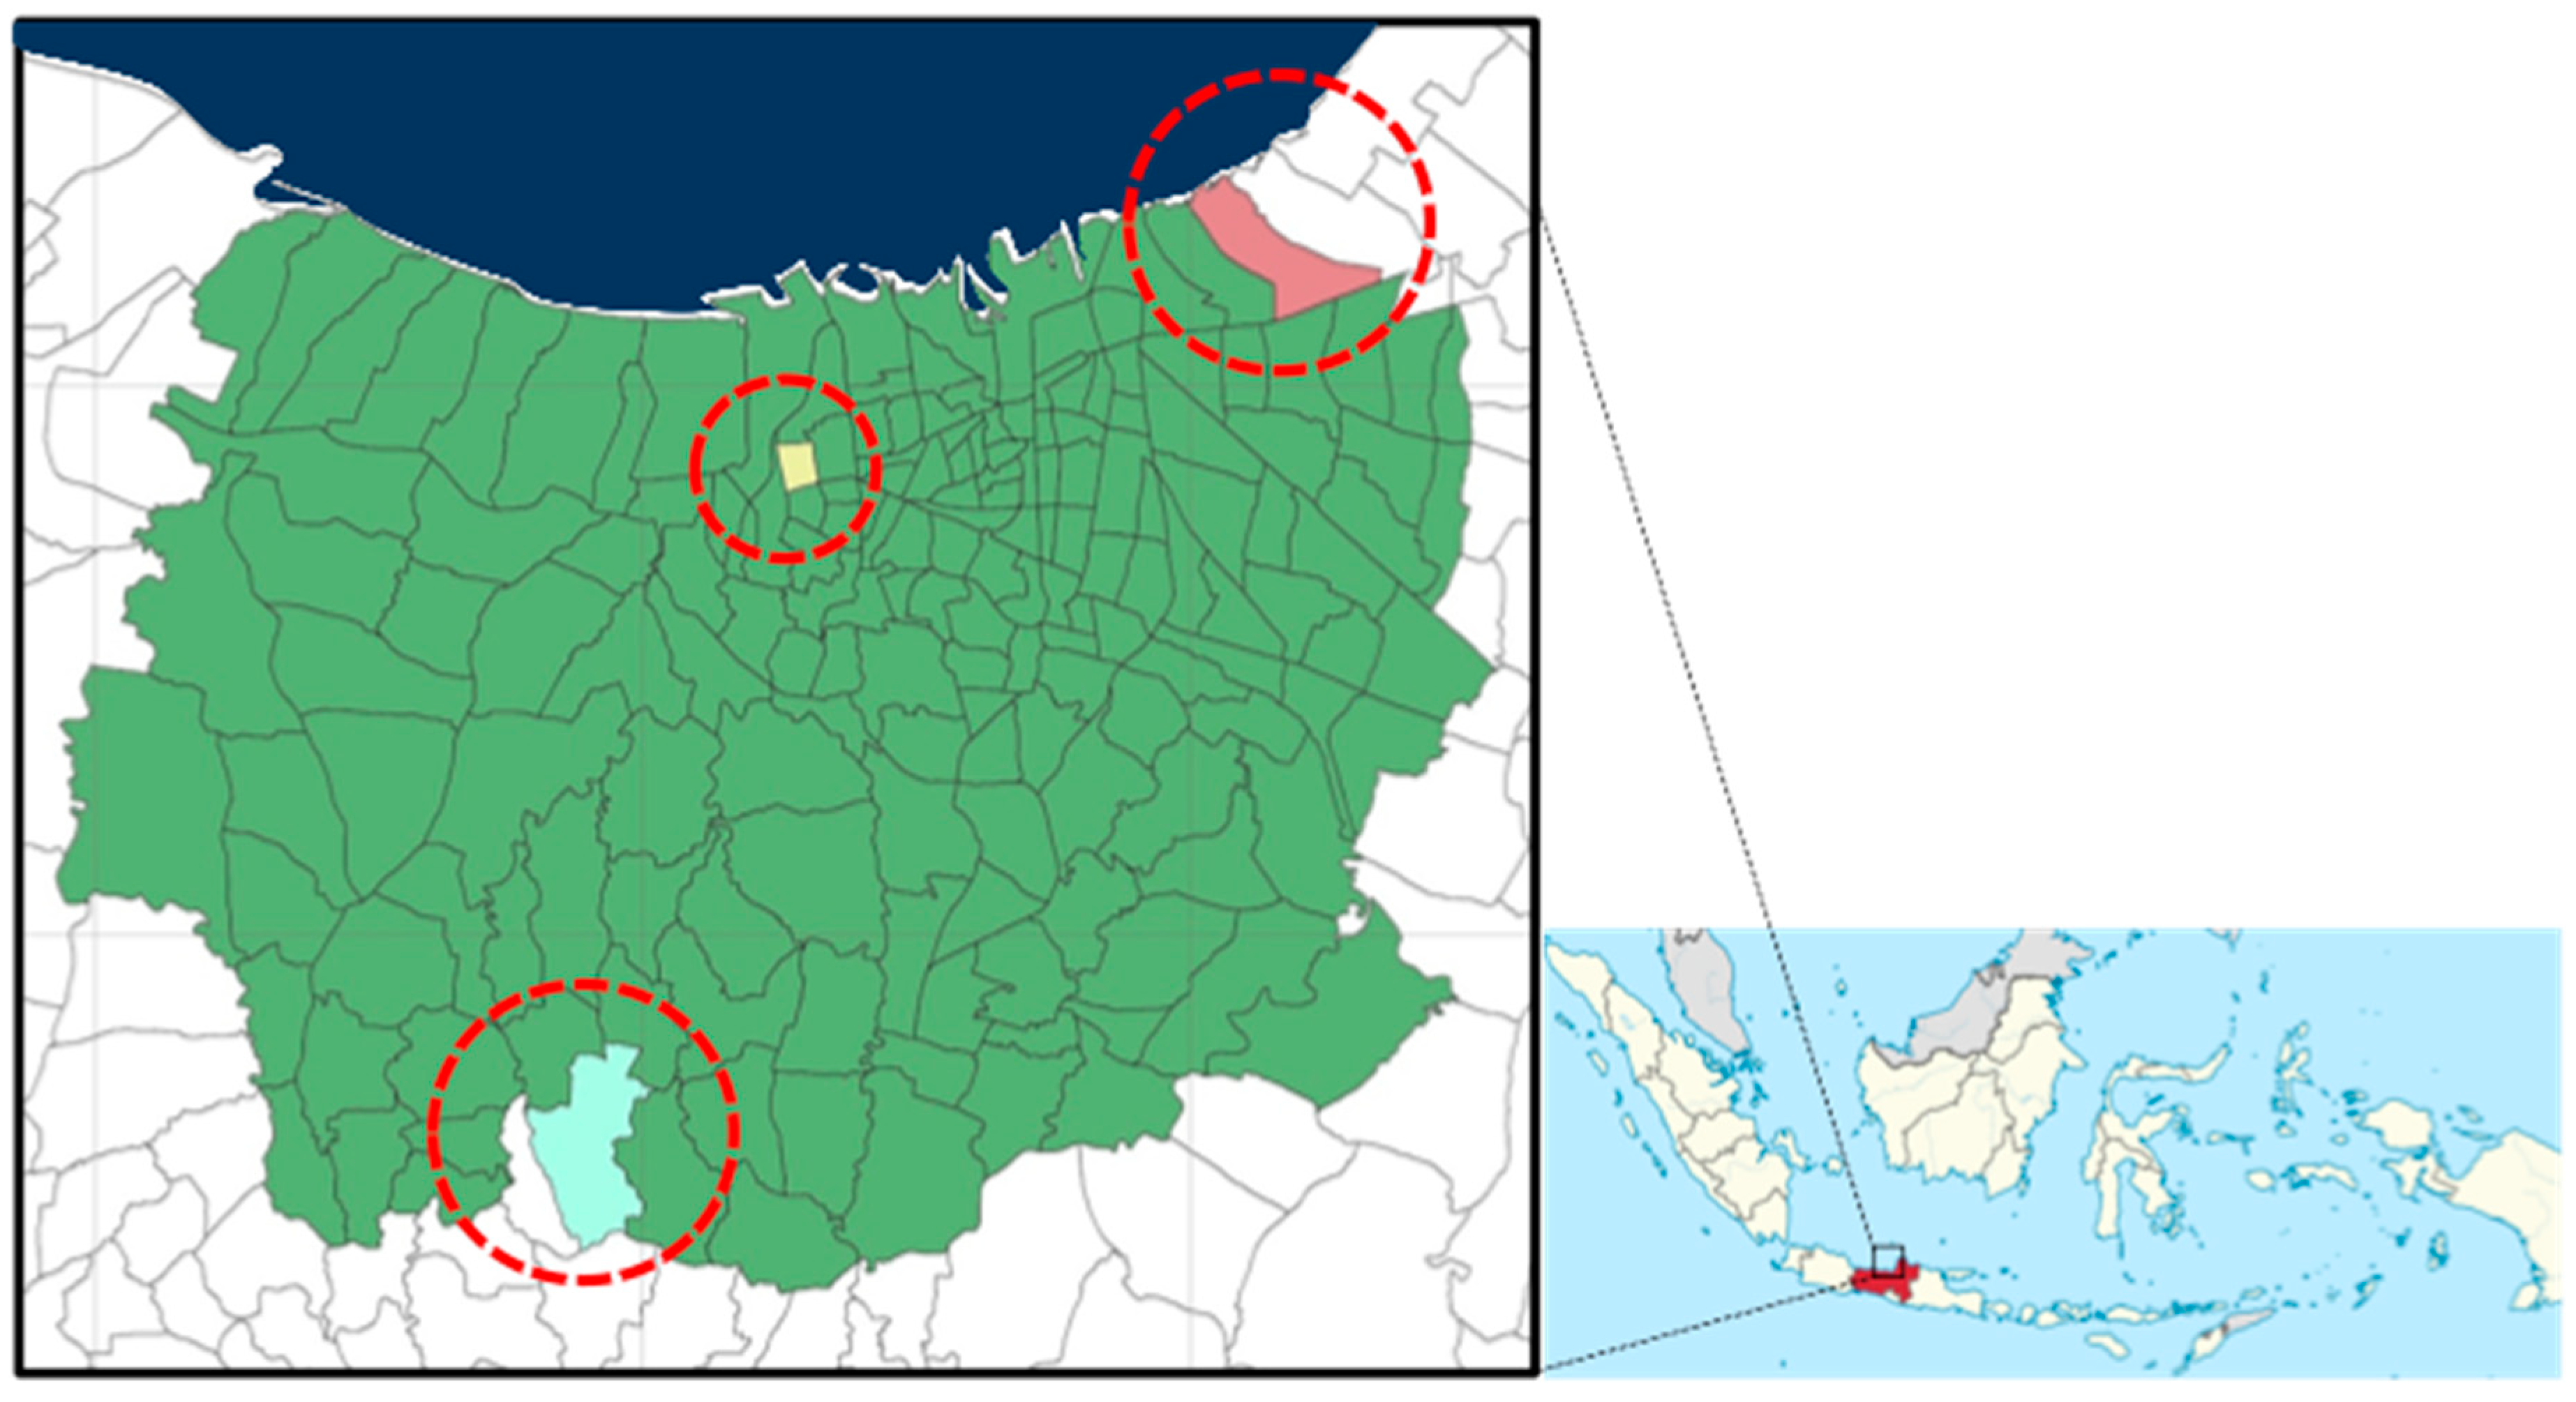
Semarang is the provincial capital of Central Java (
Figure 2) and the fifth largest city of Indonesia, with a population of about 1.6 million and the population density 4547/km
2 (2015 census). It is a coastal city that connects two large Indonesian hubs, Jakarta and Surabaya, in terms of transportation, economy and culture. The climate is tropical with rainfall exceeding 50 mm most months of the year (particularly during the rainy season from November to March) [
27]. Semarang’s geographical characteristics include a largely flat coastal plain that comprises the north part of the city, river valleys and a series of hills to the South.
Semarang is exposed to coastal and fluvial floods [
28]. In a pattern that is common across Southeast Asian cities, the city has experienced rapid urbanisation since 1990 [
29], which has contributed to high rates of land subsidence that reach up to 19 cm/year, particularly in areas that are coastal, industrialised and built post-2003 [
30]. The main contributor to the problem is poorly regulated ground water extraction [
28,
31,
32,
33,
34]. The impact of climate change is also significant as sea level rise and rainfall of increased frequency and intensity, particularly in low-lying areas, has enhanced land subsidence [
32,
33,
34]. In recent years, the existing drainage system has struggled to cope with the increasing volumes of water, leading to major flooding events [
35,
36,
37,
38]. Addressing the issue of flooding is thus a high priority in the municipal government’s agenda.
However, not all areas of the city are affected equally.
Figure 2 shows Karangayu and Trimulyo, which lie on the flat coastal plane and are largely populated by low-income citizens (see
Table 1). These areas are among those that have, in recent years, regularly experienced flooding. An example of an area that has not is Gunung Pati, which is on an elevation and adjacent to the hilly South. Although still a low-income area, it is mostly populated by farmers and armed forces civil servants [
39] who enjoy a slightly more affluent livelihood than industrial workers and small-scale traders.
Jarvie et al. [
40] argue that the greatest challenge of climate change adaptation in Semarang is related to “clumsy” governance, lack of transparency, and the dominance of technical solutions, failing to recognise governance gaps that prevent mainstreaming resilience into policies. Further, Hellman [
41] suggests that disconnection between government policies and the socio-economic and cultural context has adversely affected communities, including failure of resilience building.
Since 2009, Semarang has been part of the Asian Cities Climate Change Resilience Network [
42]. In 2013, the city also joined 100 Resilient Cities [
43]. As the first city in Indonesia to launch a Resilience Strategy [
43], Semarang’s climate change adaptation could become an exemplar for many developing cities facing similar socio-economic issues and environmental hazards.
2. Methodology
Qualitative and quantitative data were collected between September 2017 and October 2018 from the three case study areas within the city of Semarang (
Figure 2). Data collection methods included resident and policymaker interviews, a resident survey, and focus groups with representatives of the three communities and local authorities. Bahasa Indonesia was used throughout the data collection.
2.1. Case Study Approach
The case study approach was applied, as it is the most appropriate method for providing answers to the “why” and “how” of specific research issues [
44] and investigating their underlying dynamics [
45]. It led to a deeper understanding of i) different resident flooding experiences within the city; ii) the spectrum of diversity in opinions concerning who is responsible for flood management; iii) actions taken for coping with and preventing floods.
The selection of case study areas among Semarang neighbourhoods offered the opportunity to compare findings from locations that were prone to frequent flooding (Karangayu and Trimulyo) with an area that was not flood prone (Gunung Pati). Factors that influenced the selection of flood-prone areas were as follows: featuring in flood-related news multiple times within the past 8 years; and different types of flooding (i.e., tidal vs. flash floods). Care was taken to select three areas with similar socio-economic characteristics, such as dwelling type; population density; age and education distribution.
Site visits were conducted, as they helped to obtain valuable insight [
46] into the environment and the context in which the research was taking place. These also contributed to the selection of interview and survey participants through the observation of neighbourhood environment and street conditions, the comparison of dwelling types and the identification of locales closest to the source of flood that had affected the case study areas in recent years.
2.2. Interviews
Semi-structured interviews were conducted in person, at the homes of residents. Only participants from the two flood-prone case study areas were interviewed (nres = 30, 15 from each). The selection was based on specific neighbourhoods and streets known for major flooding events in recent years. Residents of these particular streets were randomly selected. The purpose of the interviews was to gain first-hand information on the flood experience of stakeholders whose lives were impacted by flooding. This led to an understanding of i) flooding experience and resident awareness concerning the reasons for flooding; ii) preparedness measures; iii) resident perceptions of the roles of local authorities, community groups and the individual in flood mitigation; iv) residents’ awareness of BGI strategies and willingness to adopt BGI measures.
In parallel, face-to-face semi-structured interviews were also conducted with a range of key government and local authority representatives from the greater Semarang area (nl.a. = 8). The aim of these interviews was two-fold: to obtain a bigger picture of how flood-related issues were dealt with by government agencies and map out the policy framework of Semarang by identifying the role of various government departments and current legislation.
All interviews were audio recorded, transcribed and translated into English. The eight key government and local authority interviews were translated by the same person, while the 30 resident interviews were translated by three people. The interview transcripts were analysed using thematic analysis. This method was chosen due to the need for a flexible analytical process to provide a structure [
47] for the combination of findings from different qualitative subsets. The coding framework that was developed contained nodes (15 nodes in the case of the resident interviews and 16 in the case of the policymaker interviews) based on themes from the research questions, observation data and literature. Examples of these themes are worst flooding event description; sources of flooding assistance; flood preparation; barriers/incentives for flood preparation; flood awareness; BGI knowledge; willingness to learn about BGI; perceived responsibility for flooding and willingness to relocate. The code definitions were checked for clarity of meaning and consistency by having two researchers independently code each interview and comparing the results. Atlas.ti 8, a qualitative analysis software with the capacity to process textual, graphical, audio and video data was used as thematic analysis tool.
2.3. Resident Questionnaire Survey
Data resulting from the resident interviews shaped a questionnaire survey (
Supplementary S1) that followed during the rainy season at the start of 2018 and which was more widely distributed to residents of all three case study areas (n = 180; 60 per case study area). In the flood-prone areas, participant selection was based on the same criteria used for interview participants. Participants who had participated in the interviews were excluded. The participants were long-time residents of each area, with the average number of years (amongst all case study areas) living in the dwelling they were being questioned about being 29 years.
The survey was conducted in person at each participant’s home, and informal and accessible wording was deliberately used for the 2-page survey form. Furthermore, the researchers were able to assist with clarifications on occasions where reading or writing was only possible in the local dialect. The survey contained a mix of demographic, multiple choice and open-ended questions to capture the participants’ valuable written explanations in addition to quantitative data about flooding experience (in their dwelling and the street) and awareness of flooding (cause, preparation, responsibility). Moreover, graphic bipolar rating scales were used for participants to indicate perceived responsibility between different stakeholders (i.e., government vs community). The choices provided for the multiple-choice questions were sourced from data collected during the resident interviews.
2.4. Focus Group Discussions
Further data was provided by means of eight focus group discussions that took place over three workshops held between January and October 2018. The aim was to facilitate round table discussions on the potential of BGI adoption in Semarang amongst community members from the case study areas, local authority and government representatives. There was a total of 41 participants (22% community representatives, 54% local authorities, 24% government representatives) and focus group size ranged between 4 and 9 participants. The first six focus groups contained a mixture of participants from different backgrounds, while in the final two government representatives were separated from the other types of participants in order to encourage more open discussions on the government’s positions.
The sessions followed the same format, starting with a short introduction to BGI concepts and followed by facilitated discussions on drivers and barriers of BGI adoption locally. Topics of discussion included BGI examples; advantages and disadvantages of different BGI typologies; adoption challenges and opportunities; adoption and implementation responsibility; expectations with regard to the role of the government. Similar to the interviews, all focus group discussions were audio recorded, transcribed, translated into English and then thematically analysed using Atlas.ti 8 (Atlas.ti Qualitative Data Analysis v8, Cologne, Germany).
3. Results
This section presents information on BGI efforts already in place within Semarang and their scale. Moreover, it describes the flooding experience and preparedness of the study participants and provides insight regarding their perception of flooding causes and the responsibility they carry concerning prevention of such events. The section ends with the comparison of community and policymaker responses to questions relating to BGI adoption.
3.1. Existing BGI Efforts in Semarang
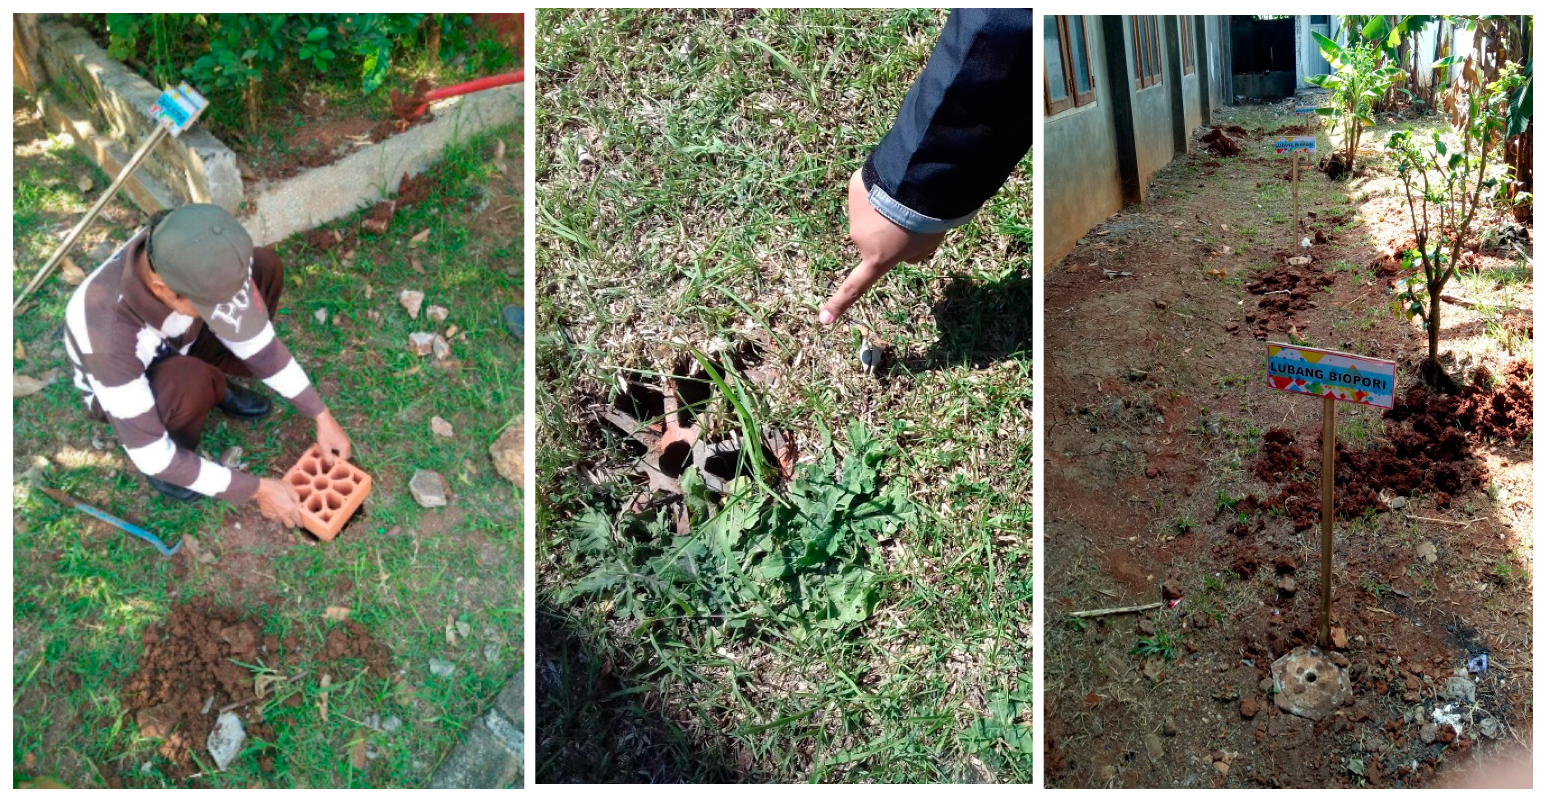
Analysing data from the policymaker interviews and site visits, indicated that small-scale BGI adoption had taken place in the form of bioretention strategies such as biopores and rainwater harvesting. Biopores are vertical holes, shown in
Figure 3, created in the ground and filled with organic material. They were developed in Indonesia as a means to improve ground water recharge [
48] and have been applied in Malang city [
49] and Bandung city, where they were coupled with rainwater harvesting at the household level [
50].
Biopores were found in Gedawang and Padangsari, which are areas adjacent to mountains and are moderately prone to flooding. In Gedawang, the creation of biopores was the responsibility of the Department of Environment, with implementation overseen by the local village officer. Local village is the lowest level in ‘formal’ government hierarchy and comprises a number of community neighborhoods. No new biopore holes had been created since 2015 and the majority of existing ones were located in the vicinity of the village office. Some did not appear to be well maintained. Local authorities believed that the failed uptake of biopores was due to the existence of a large number of vacant lots and fields in the village, which contributed to a lack of urgency to improve water absorption in the residents’ perception.
Padangsari village, on the other hand, was reported to have 40 biopore hole-making devices, which were used annually. In this area, the community proactively participated in making biopore holes together with the Forum Kesehatan Kelurahan (FKK/ Village Health Forum) and Pendidikan dan Kesejahteraan Keluarga (PKK/ Family Welfare Education) activist groups. Biopore uptake here was generally deemed successful. It was driven by the increased need of residents of the housing complex contained within the village for an effective infiltration mechanism. However, a number of biopores were found abandoned, increasing their potential to become mosquito breeding grounds. A clear consensus on who had the responsibility of biopore maintenance did not exist. In addition, the village used combined drainage and infiltration wells to redirect runoff before it reached the city drainage system.
In 2011, the Dinas Lingkungan Hidup (Department of Environment) of Semarang took advantage of a 2009 regulation stating that state-owned land could be used for rainwater harvesting. Until 2016, with the collaboration of NGOs, the Department provided a harvesting unit to each of seven public schools in the city. Maintaining this BGI strategy was the responsibility of the students, who by doing so benefited by learning first-hand about the importance and methods of water harvesting. Although the original intention was that the community would also be involved, it was reported that the response was low and without a lasting effect.
3.2. Flooding Experience and Preparedness
Flooding experience was investigated, as shown in
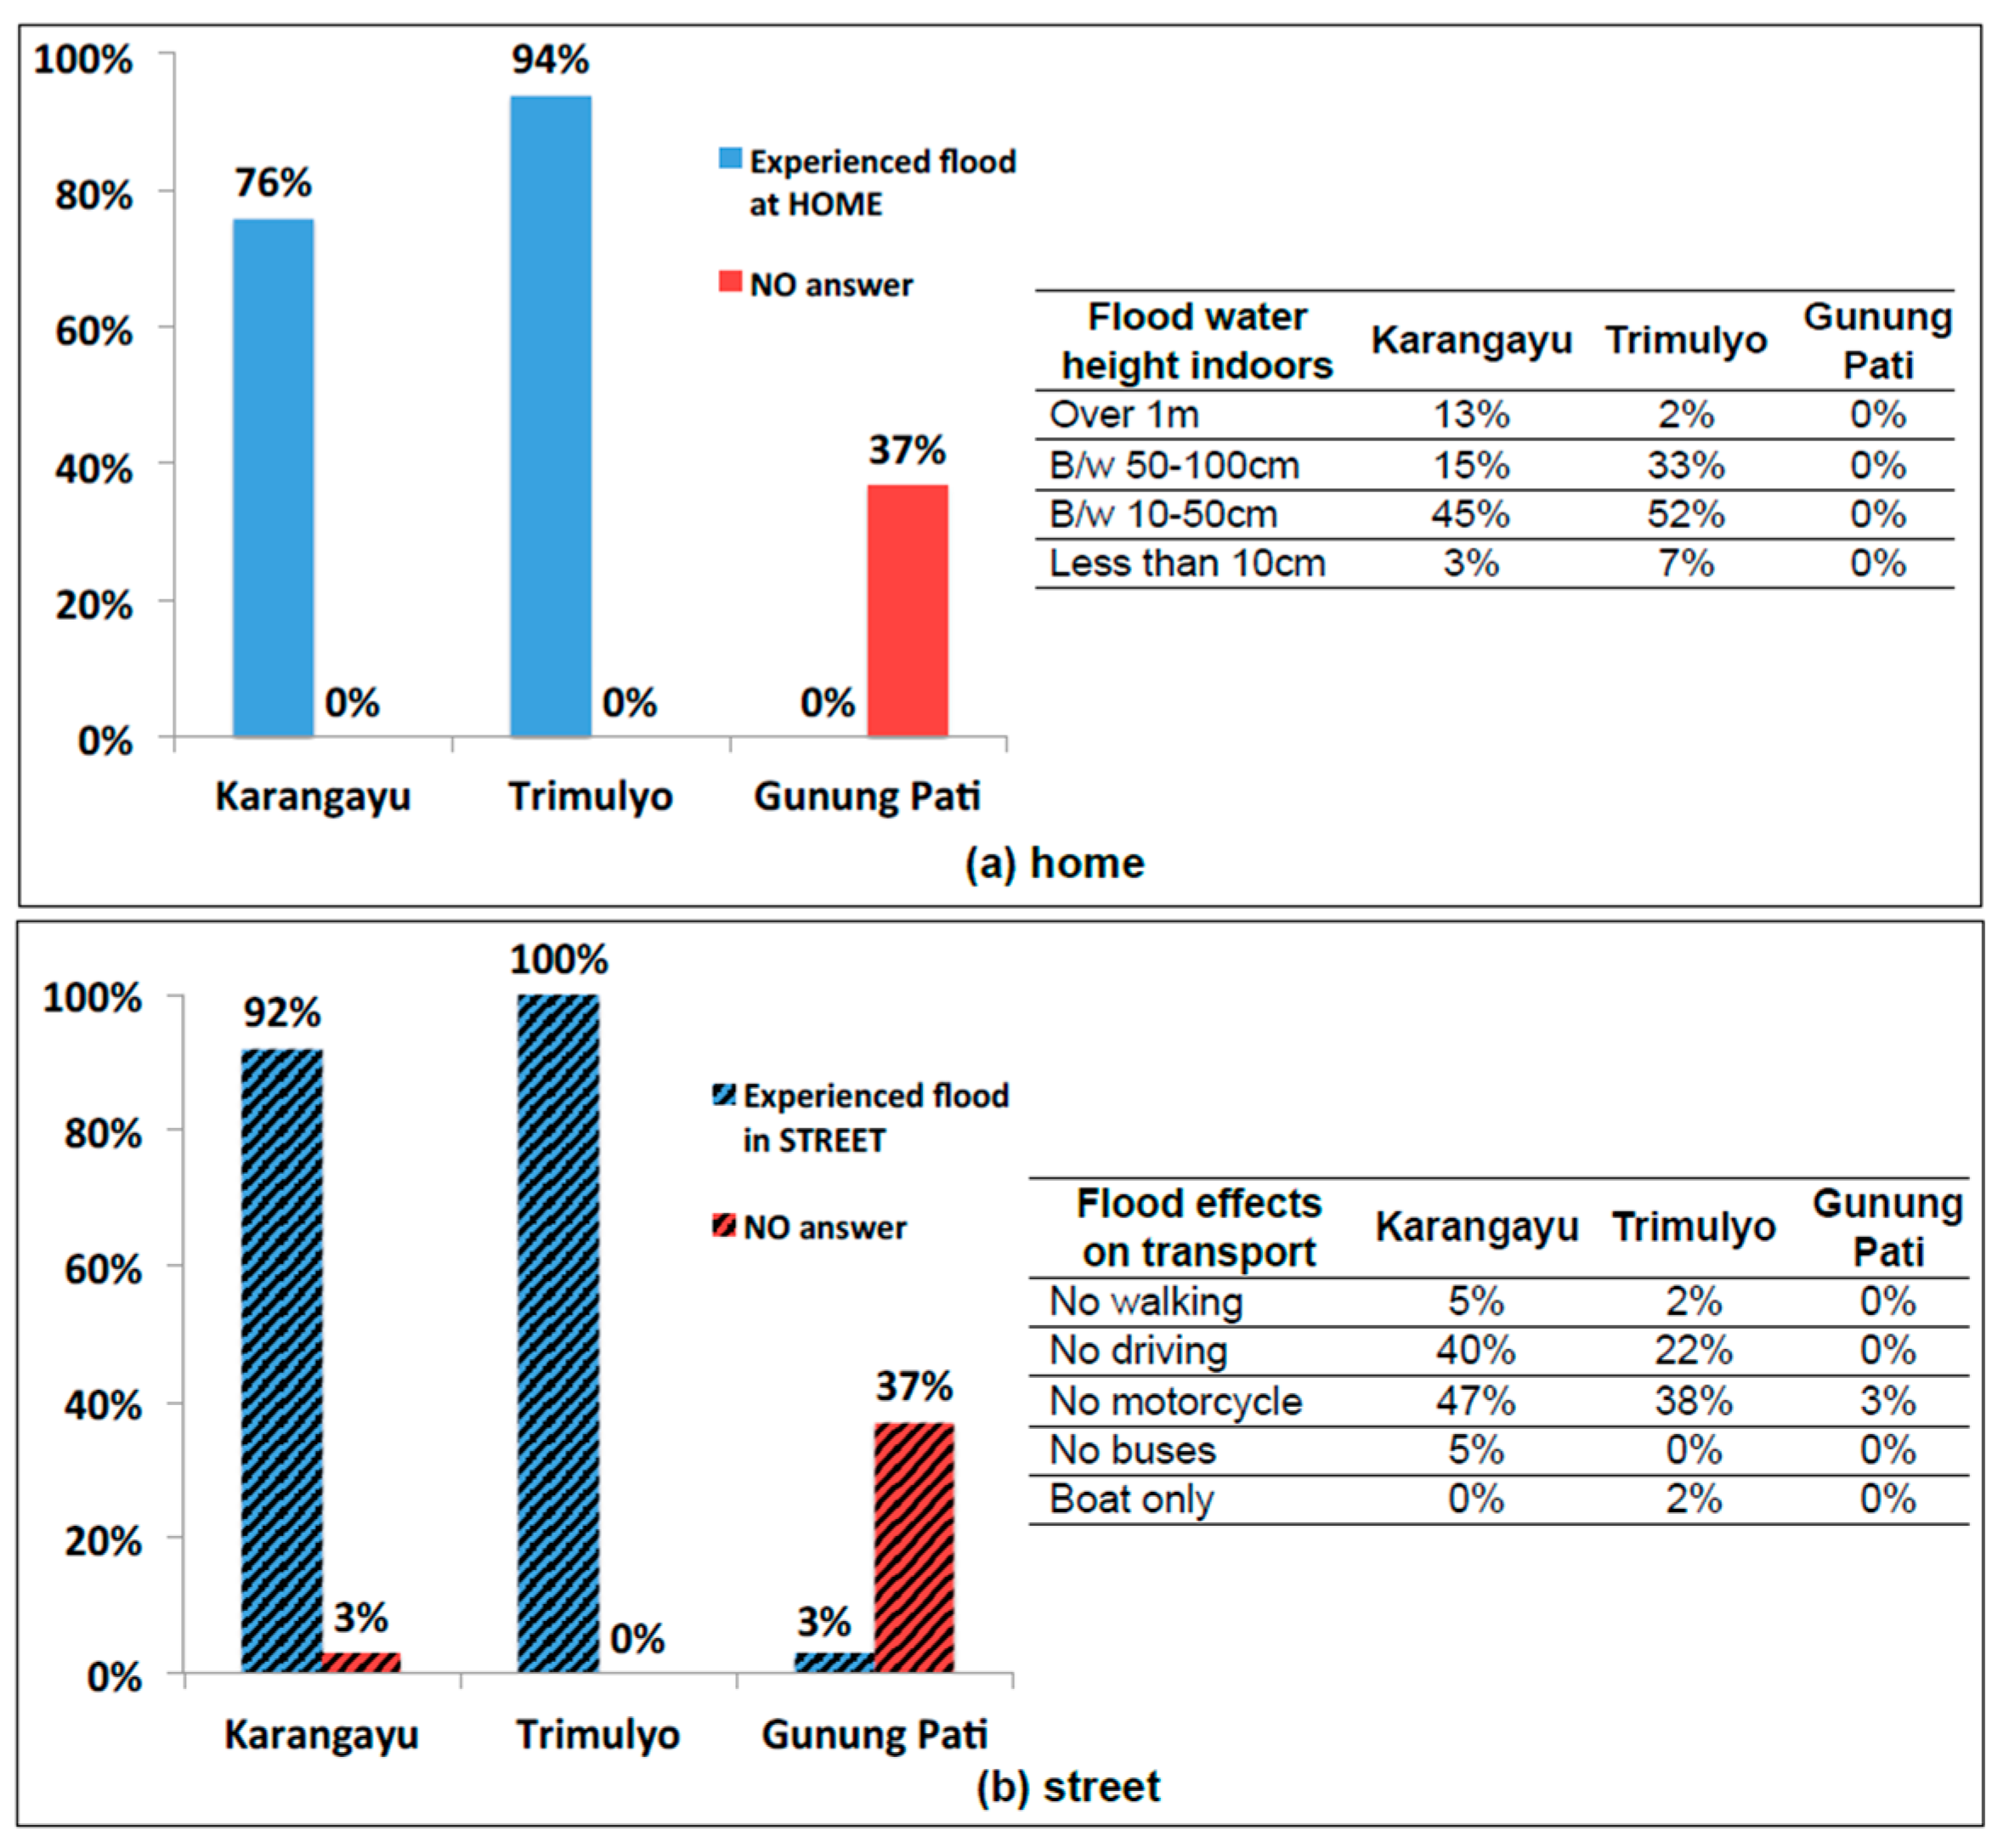
Figure 4, to identify a) maximum floodwater height reached indoors during the worst flood event in the current dwelling, and b) street conditions nearby, in terms of ease and mode of transport during the worse experienced flood event. Combining the answers for the three highest indoor floodwater depths (
Supplementary S1 Question 1:”over 1 m”; “between 50 and 100 cm”; “between 10 and 50 cm”) leads to the majority (73% in Karangayu and 87% in Trimulyo) of participants in flood-prone areas suffering from indoor floodwater that exceeded 10 cm (
Figure 4a). The percentages of participants who stated they never experienced flooding are the remaining percentages that add up to 100 in each graph (not illustrated). Thus, at least 63% of Gunung Pati participants never experienced floodwater in their dwelling, and at least 60% never did in the neighbourhood streets (
Figure 4b). The number of Gunung Pati participants who provided no answers to the two questions is notably large compared to the other two Semarang areas (37% vs 3% and 0%). This could imply that due to the lack of any flood experience, some participants may have felt they were not qualified to tackle flood experience questions at all.
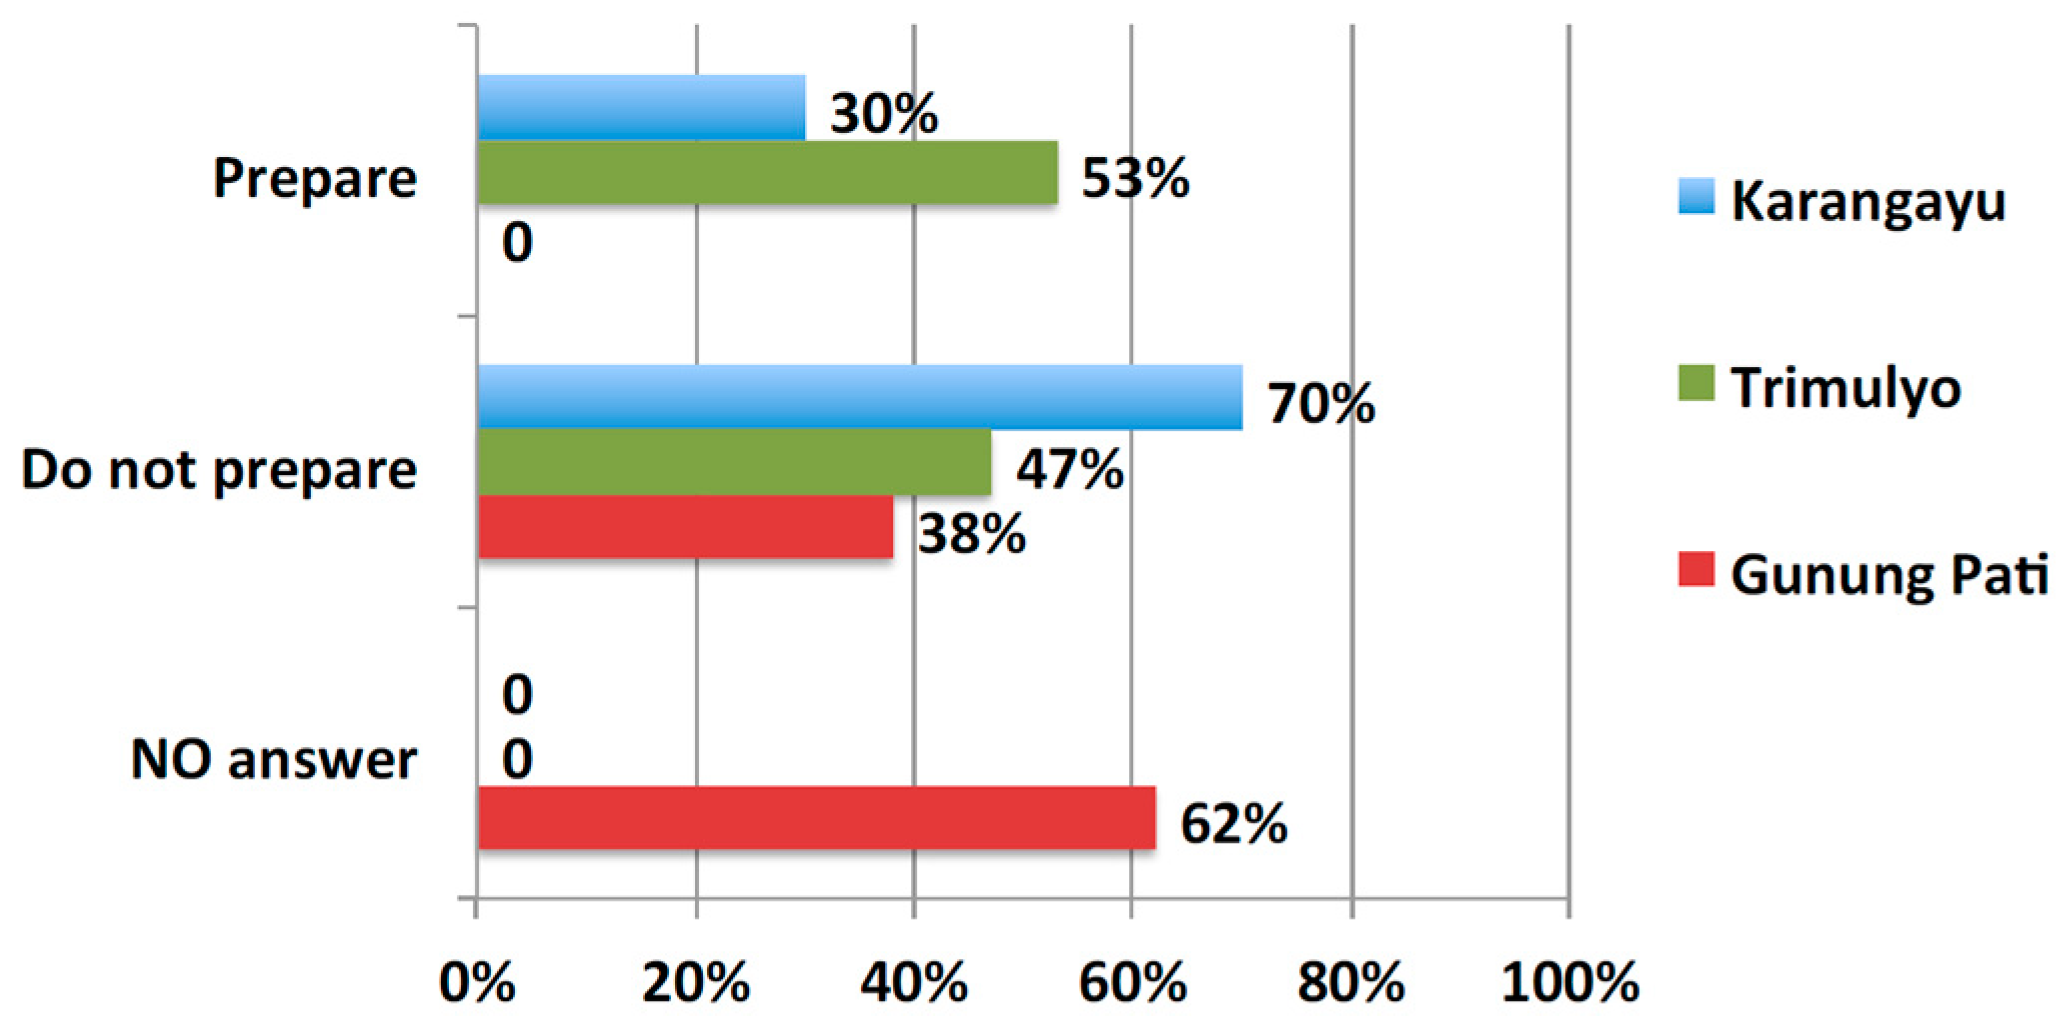
Figure 5 shows the levels of preparedness to flooding (
Supplementary S1 Question 2): over two-thirds in Karangayu and about half in Trimulyo took no preventive measures, even though almost everyone in these areas experienced flood at least in their neighbouring streets (
Figure 4b). Flood preparations mentioned by participants who did prepare included repositioning electronics and other goods to higher ground; elevating the beds or the whole house; creating sand dikes at the house entrance and evacuating.
3.3. Perceived Causes of Flooding and Responsibility
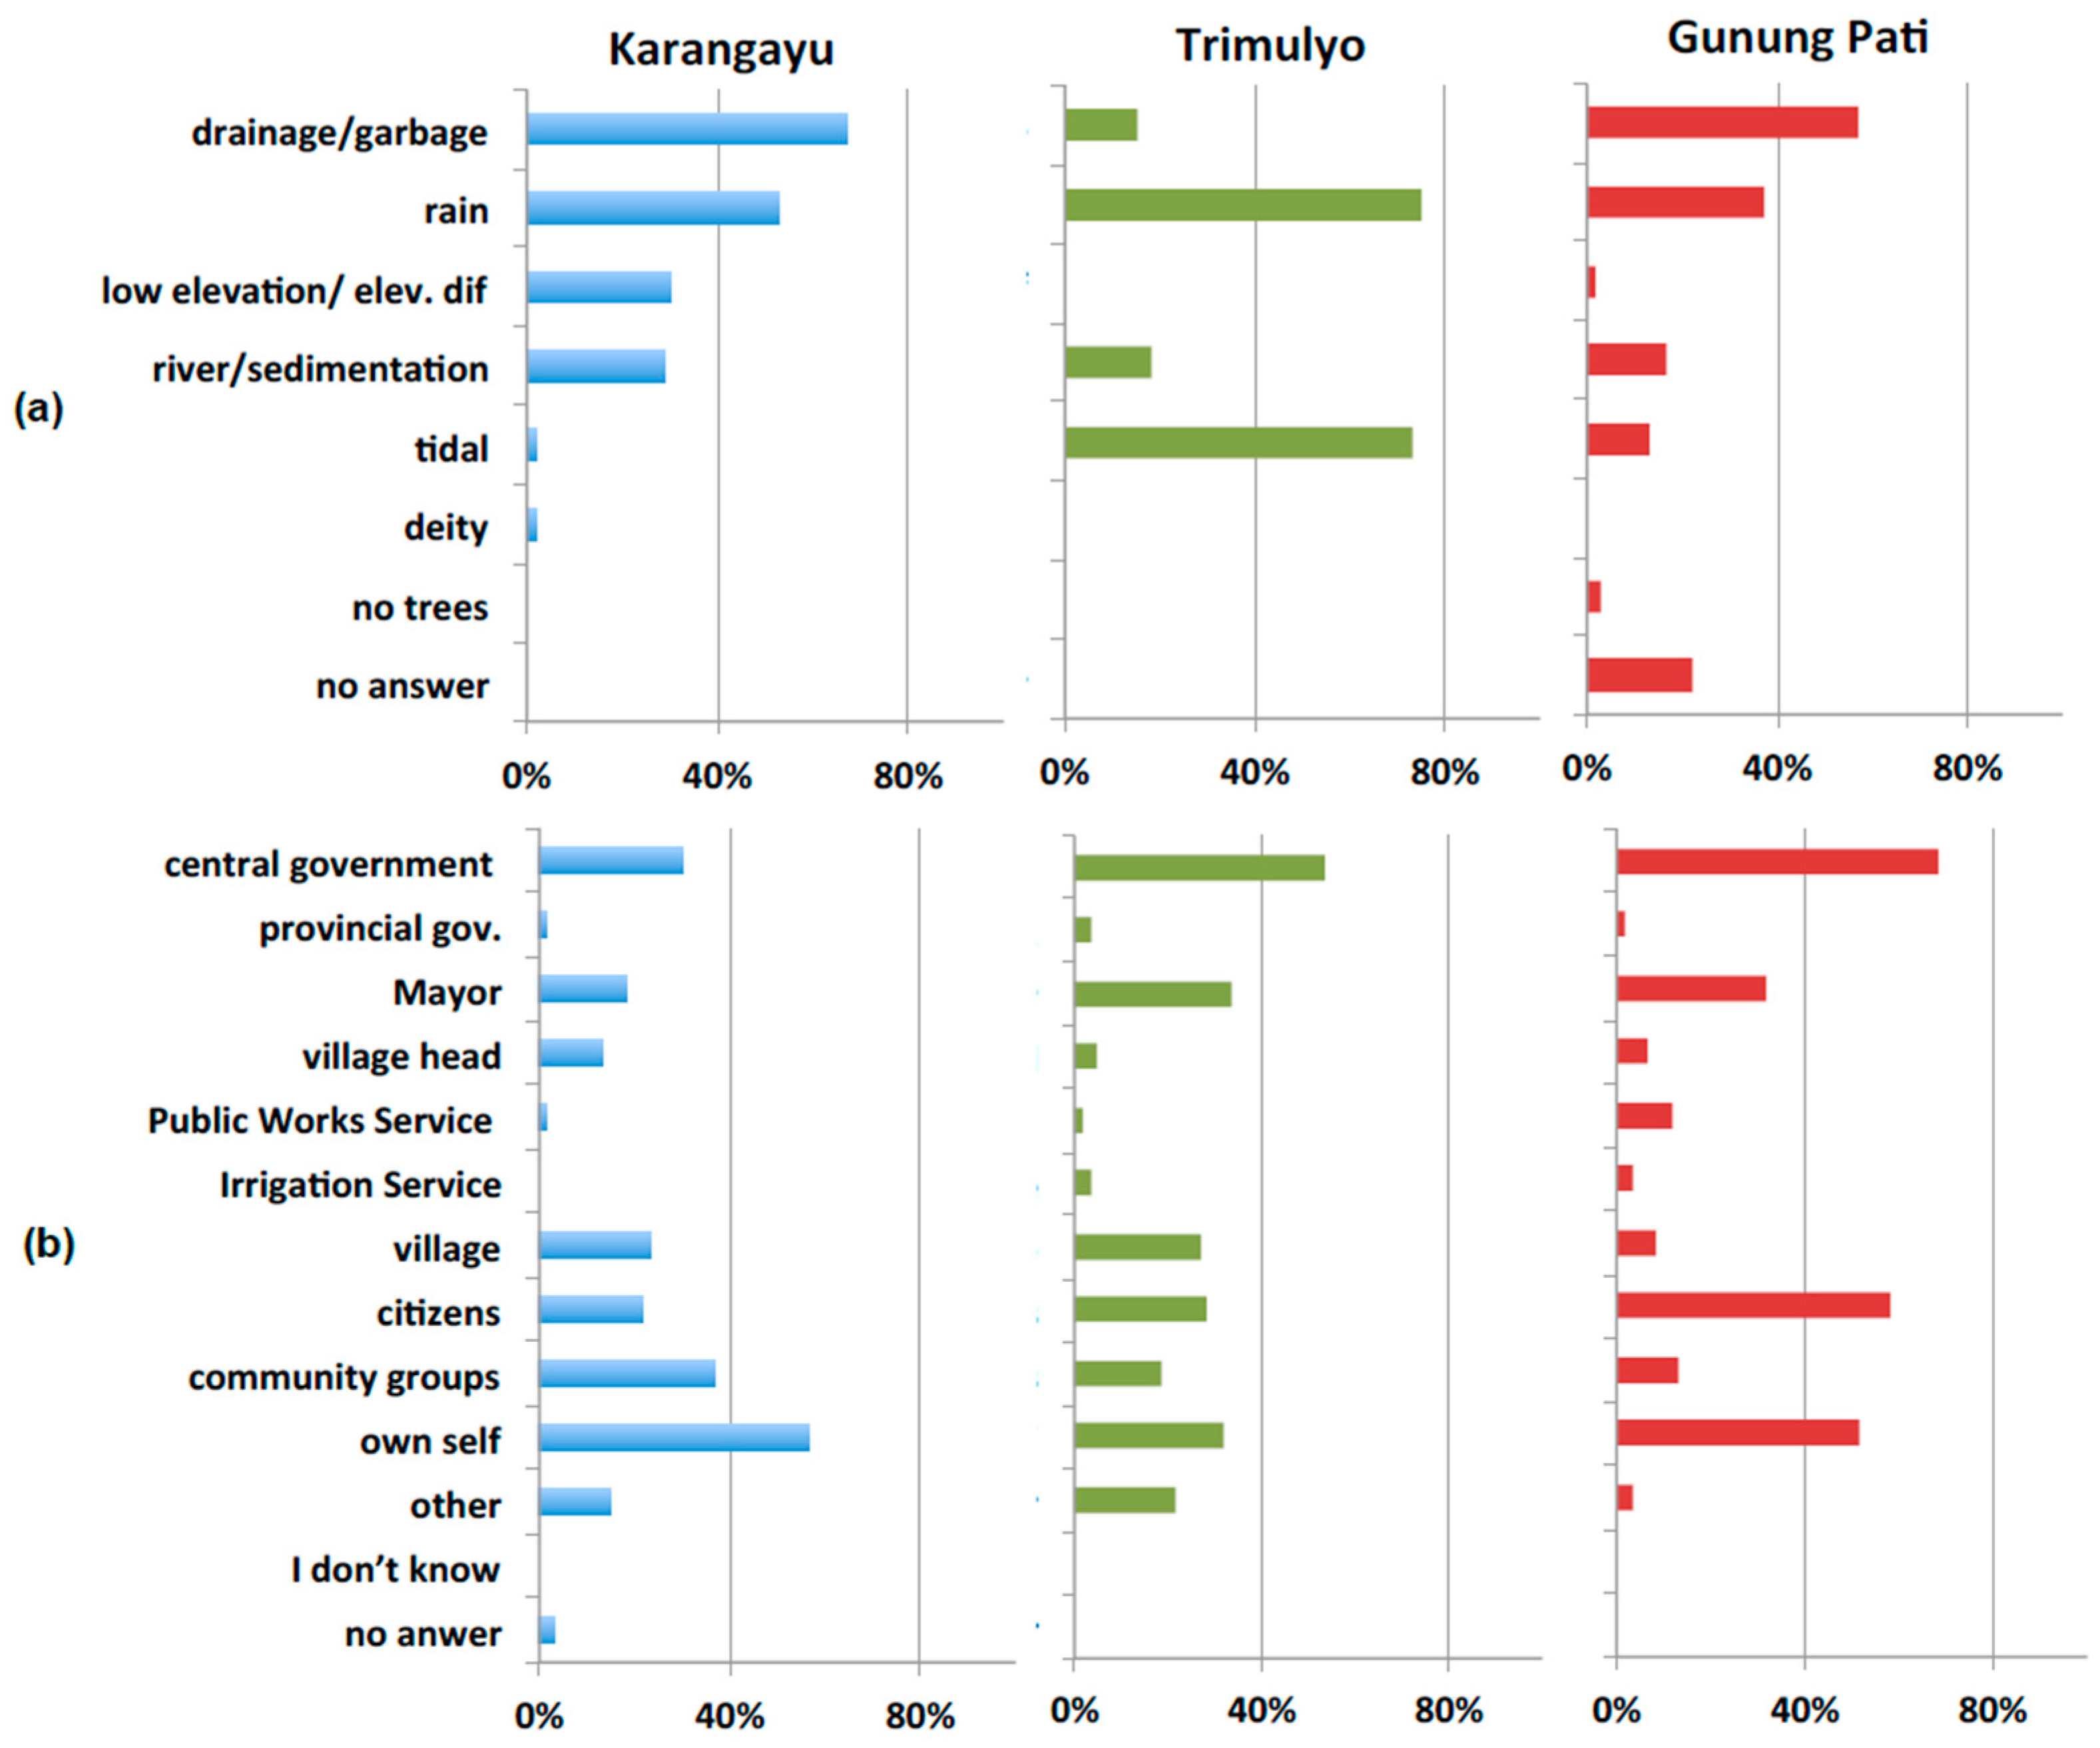
The perceptions of the causes of flooding (
Supplementary S1 Question 3) can be grouped into seven main categories: drainage/garbage (as waterways blockage); rain; low elevation/ elevation difference; river/sedimentation; tidal; deity; and absence of trees. These categories were based on data from the resident interviews.
Figure 6a shows that among questionnaire respondents there was no consensus among the three areas investigated. Drainage- and garbage-related issues appeared more often as causes of flooding in the case of the flood-prone Karangayu (67%) and in the low flood risk Gunung Pati area (57%). In the case of coastal Trimulyo, the most prominent perceived causes were rain (75%) and tidal floods (73%).
Residents’ perceptions regarding FRM responsibility (
Supplementary S1 Question 4) varied between two main actors—the individual and the government (
Figure 6b). The actor options were based on data from the semi-structured resident interviews. Further research is needed to clarify exactly how the residents of Semarang perceive and use these terms and whether there are exclusion boundaries and/or interdependencies among them. Responsibility was mainly (57%) allocated to the individual (“own self”) in the case of Karangayu, while in flood-free Gunung Pati the individual was also selected by over half of the participants (52%), but it was surpassed by the choice of “government” (68%) and “citizens” (58%). The government was also perceived to have the main (53%) responsibility of FRM in Trimulyo, with the Mayor, Village Leaders (Lurah), the citizens and the individual all being chosen by 27–33% of participants.
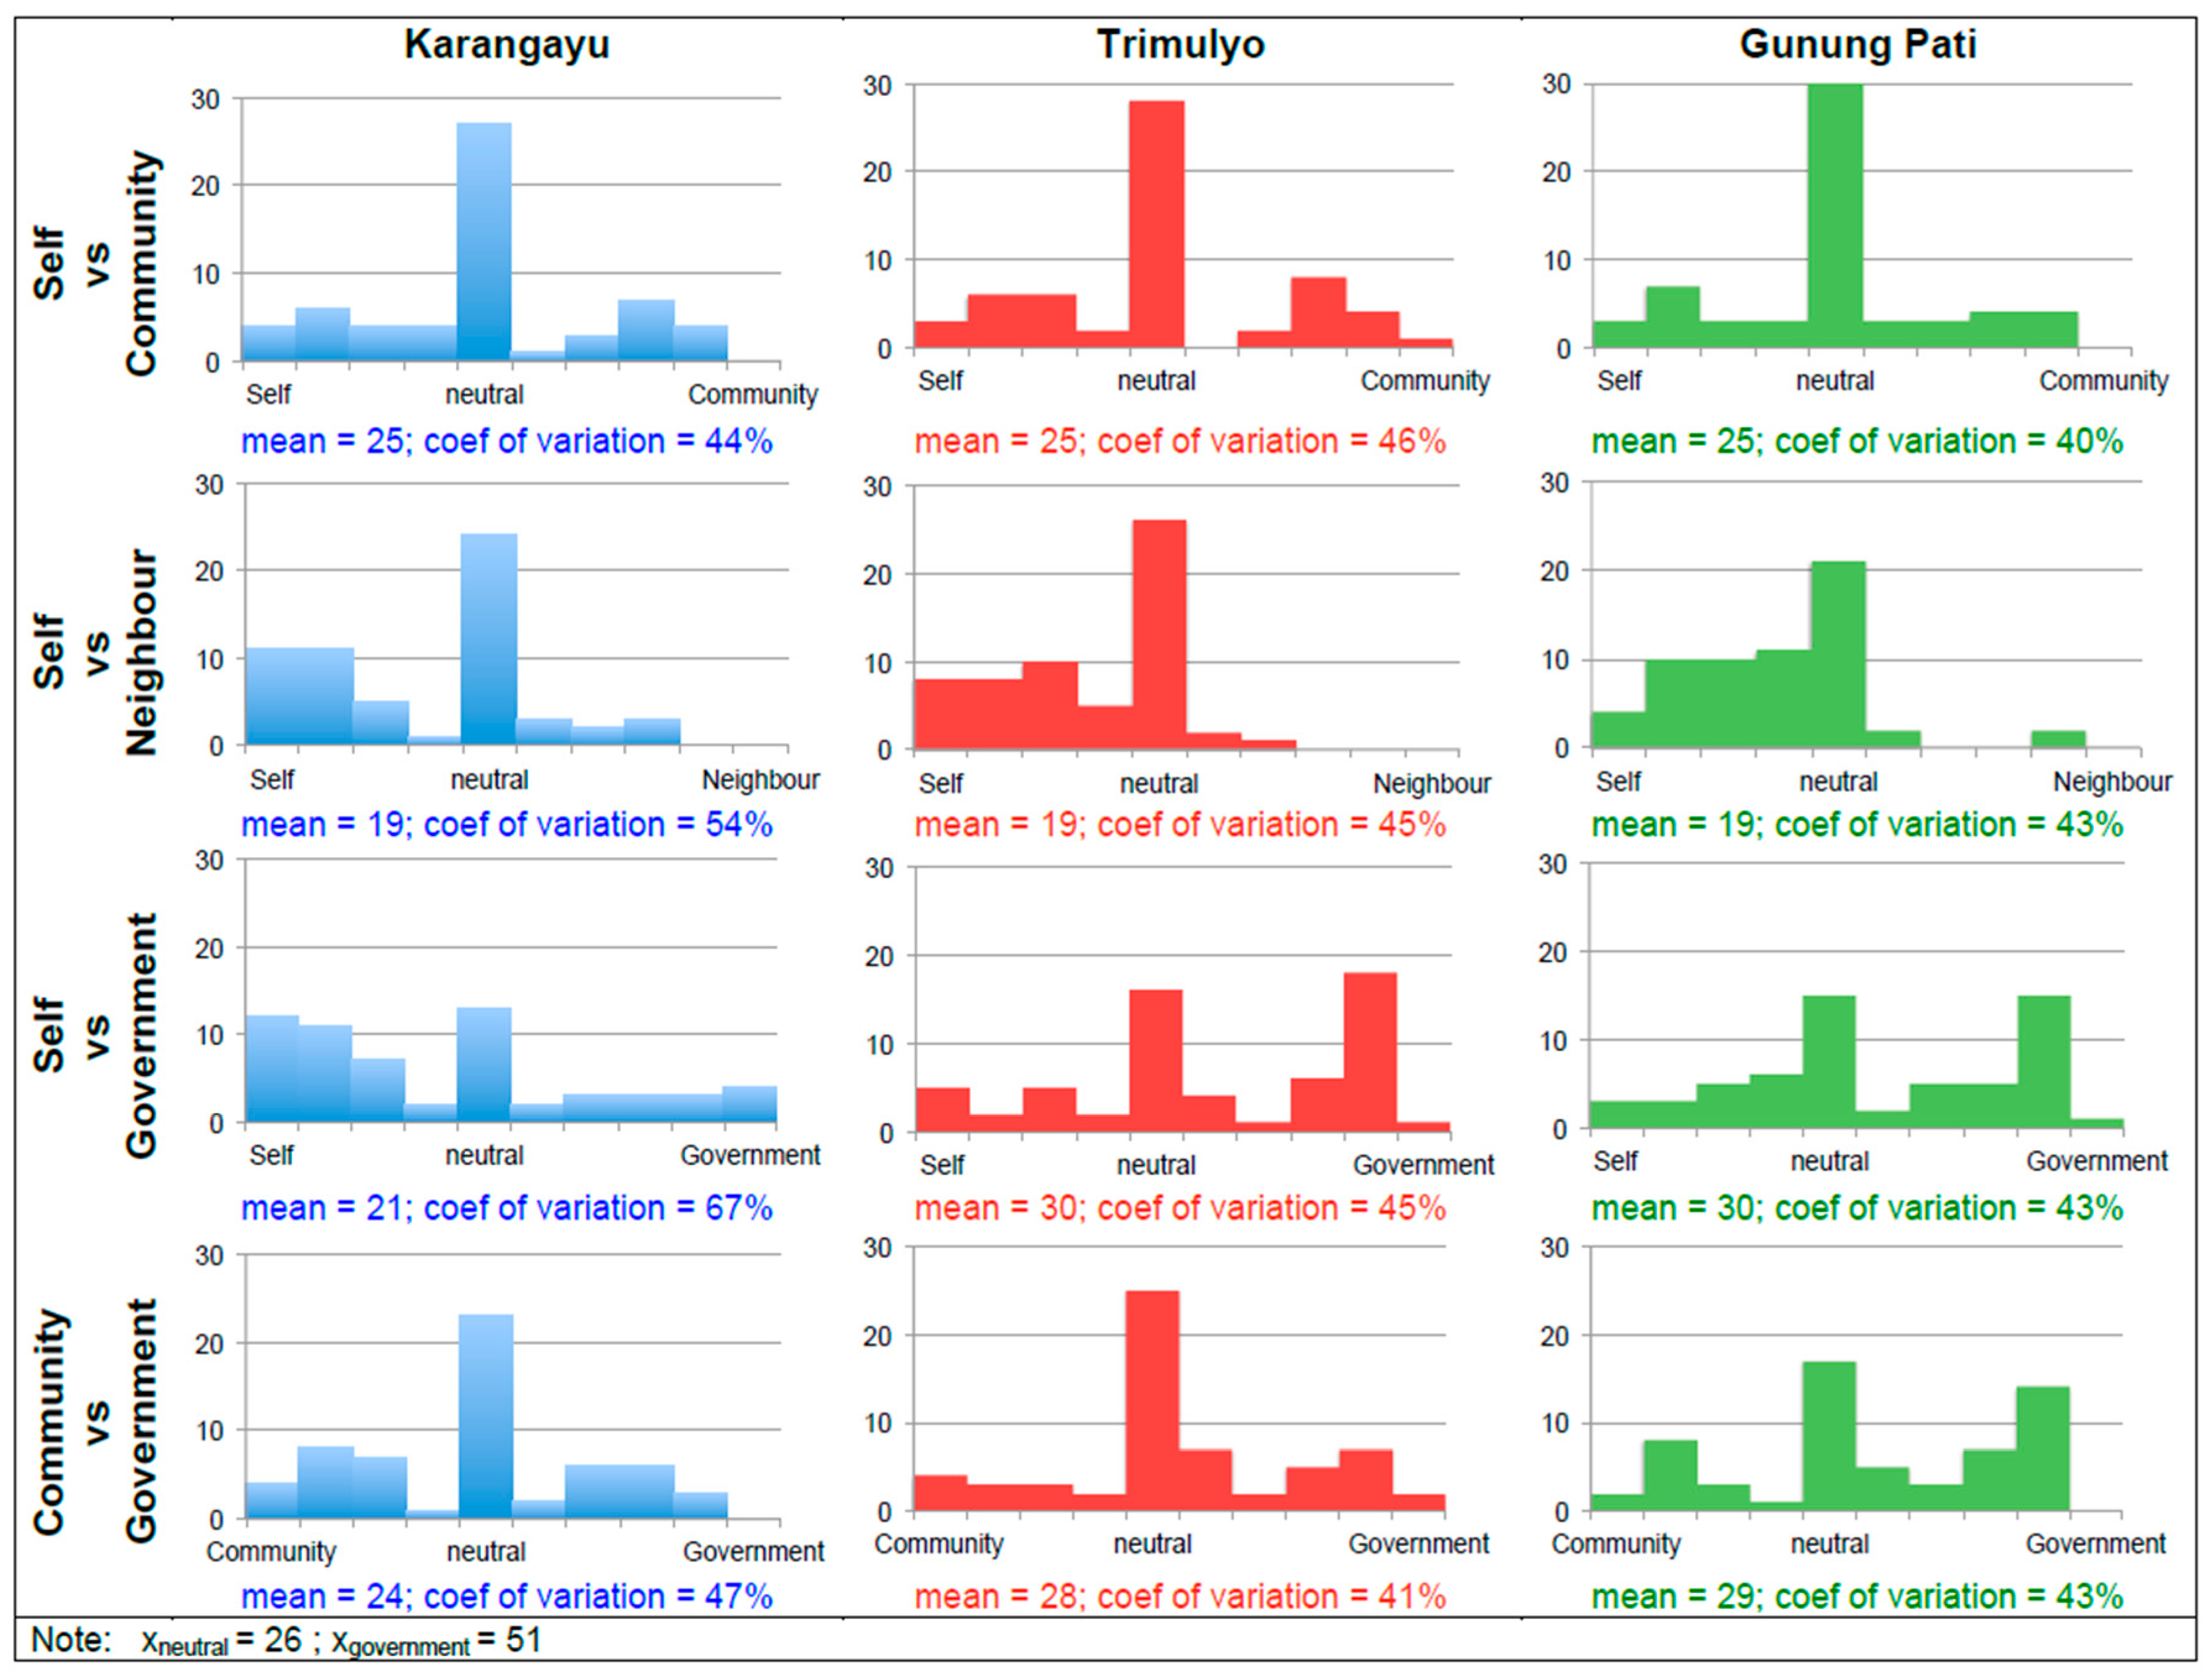
In marking their opinion of where flood prevention responsibility lies along a 51-point continuum connecting pairs of stakeholders (
Supplementary S1 Question 5), the same questionnaire respondents generally favoured taking a neutral stance (x = 26) with a variation in responses varying between 40 and 67% (
Figure 7). In choosing between the “self” and the “community”, the mean was common across the three case study areas (mean = 25), indicating a bias toward the “self” and variation in responses between 40 and 46%. In comparing flood responsibility of the “self” against “neighbour”, there was also consensus on responsibility being allocated toward the “self” (mean = 19), but with greater variation between the three case study areas (43–54%). With regard to “self” vs. “government” and “community” vs. “government”, there was no consensus between the three case study areas. In Karangayu, the weight of responsibility was mainly allocated toward the “self” (mean = 21) with a large variation coefficient of 67% and a slight bias toward the ‘community’ (mean = 24) with a variation coefficient of 47%, respectively. In the cases of Trimulyo and Gunung Pati, there was a bias toward the “government” regarding both stakeholder pairs (means between 28 and 30) with comparable variation coefficients (between 41 and 45%).
3.4. Comparing Community and Policymakers Responses
Community respondents and policymakers agreed (44% and 67% respectively) that BGI adoption was suited to a medium-term timescale of 1–5 years, although in the view of 28% of community members it suited long-term timescales of over five years.
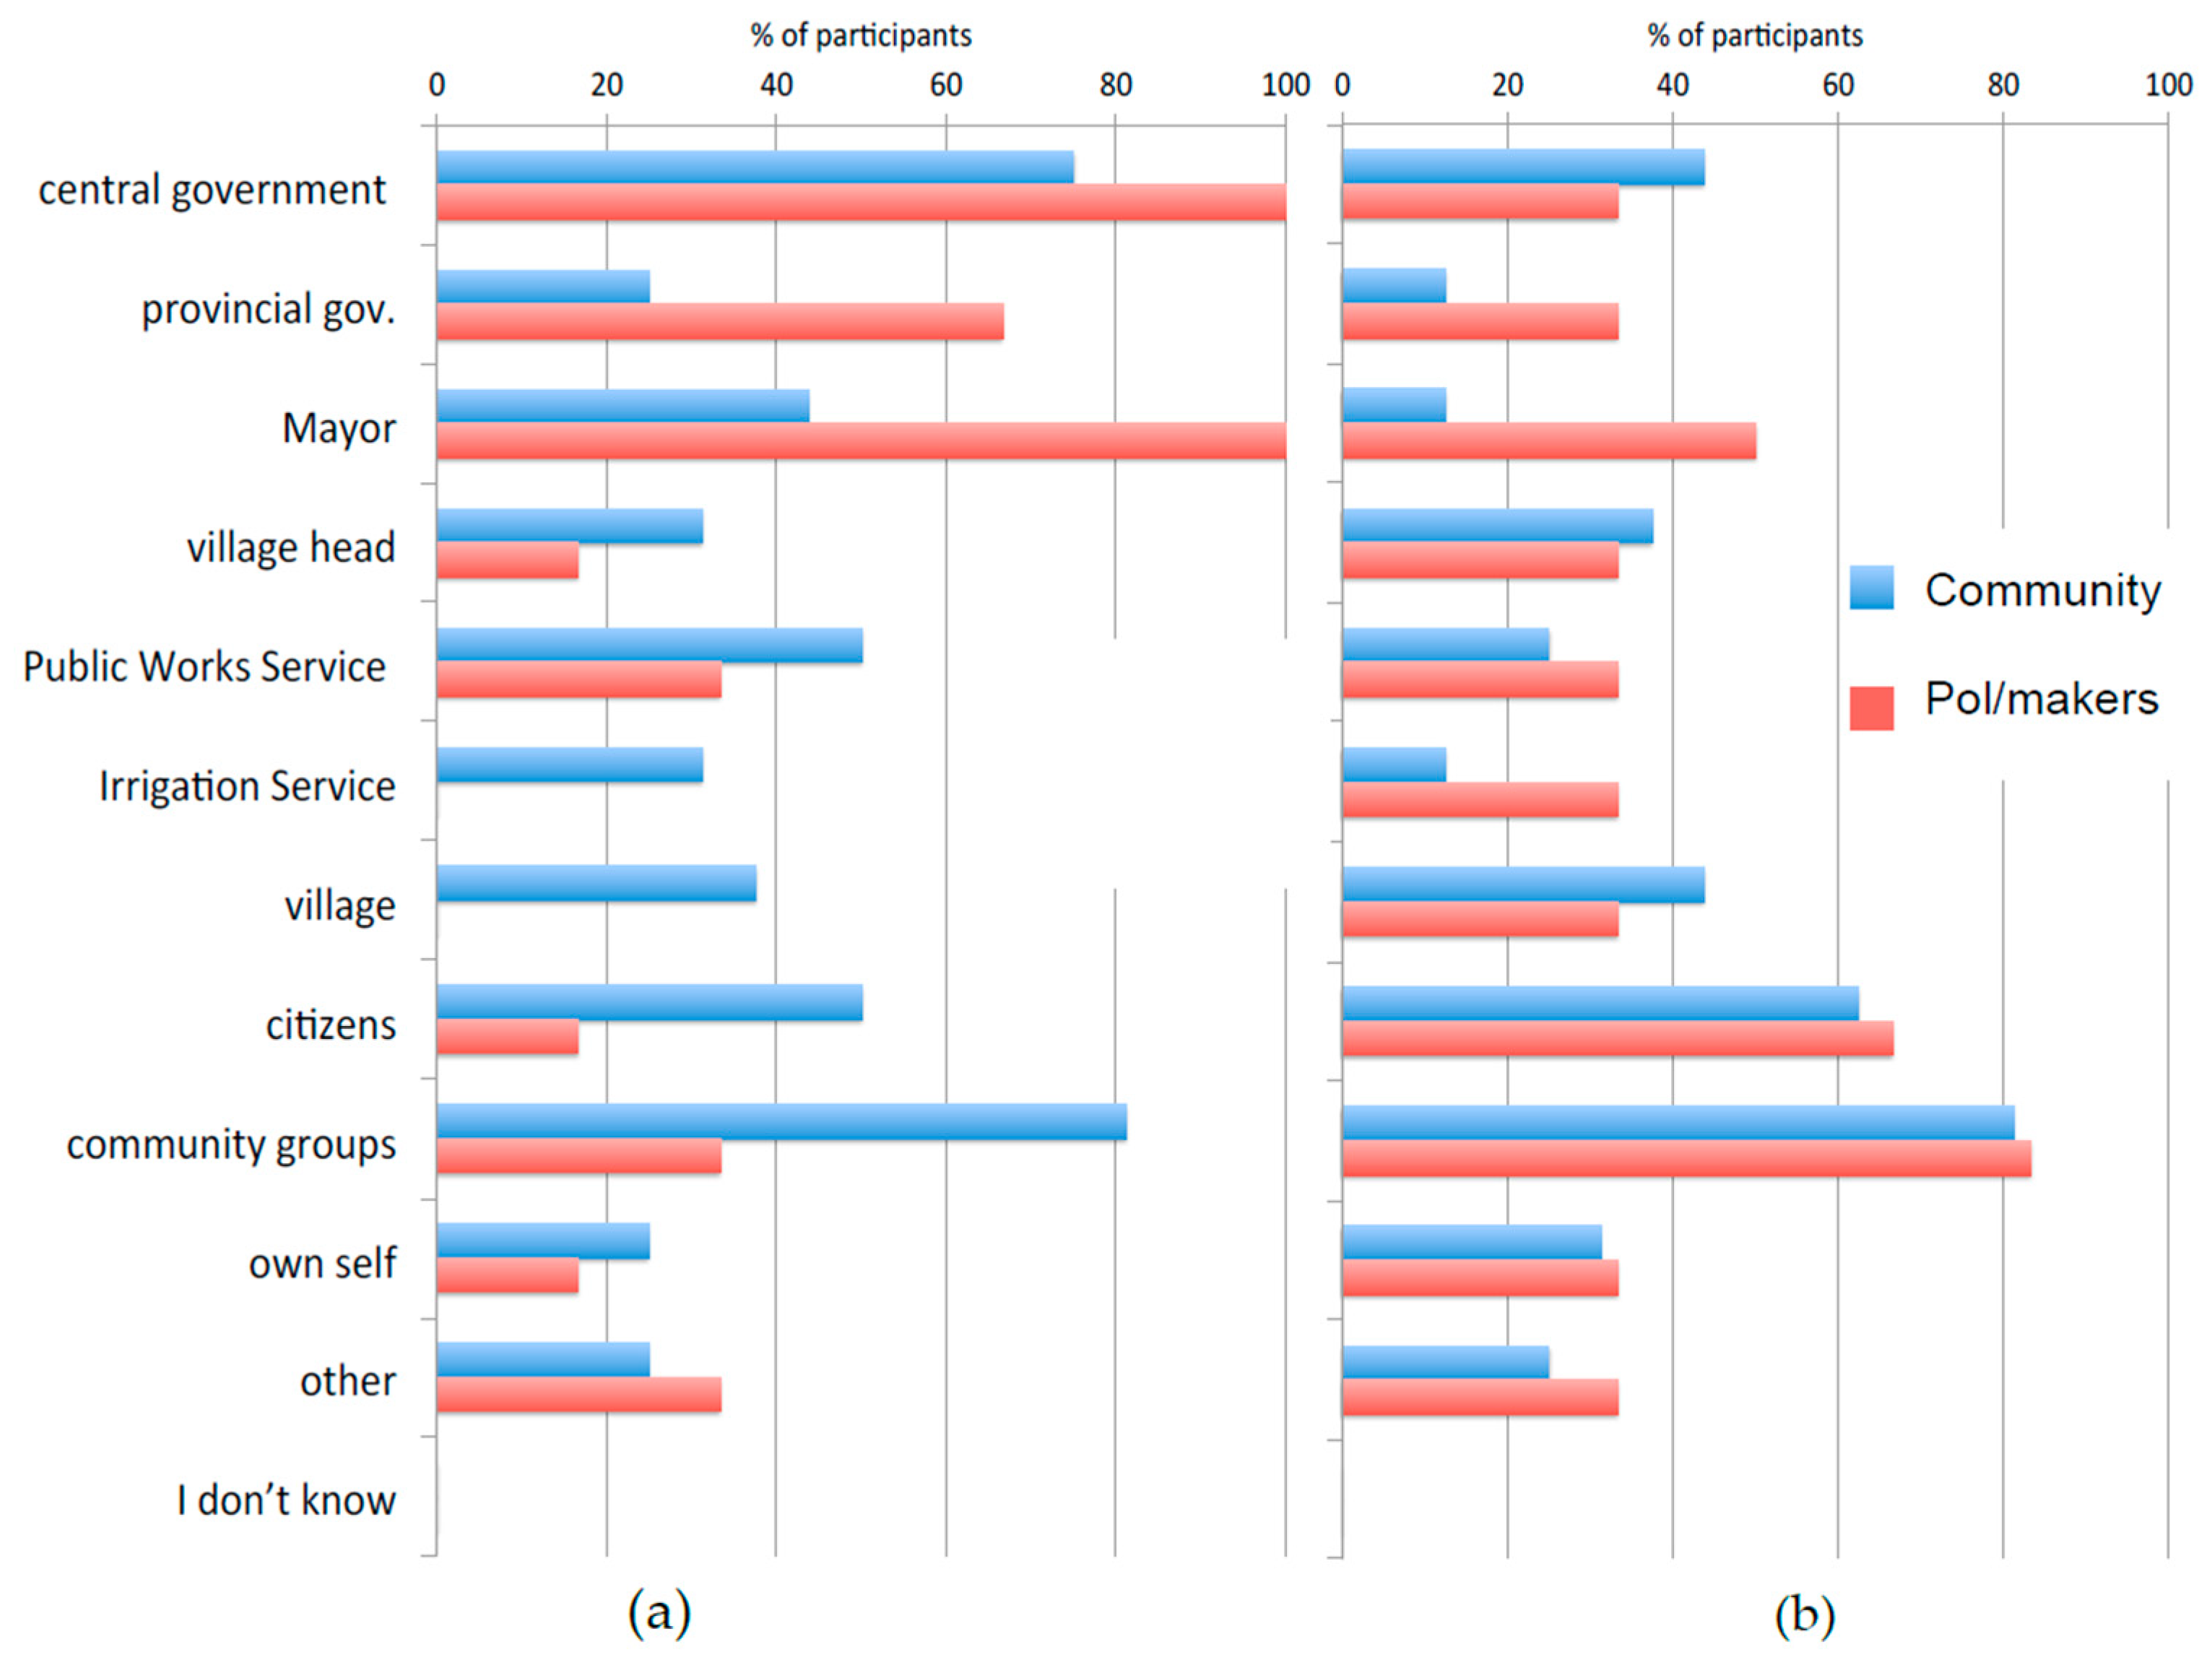
Their views, however, differed when it came to the choice of a BGI champion (
Figure 8a): most prominent answers for policymakers were the “Mayor” and “government”, while for community members most answers indicated “community groups” and the “government”. There was consensus, however, that “community groups” or “citizens” should take supporting BGI adoption roles (
Figure 8b). Although “provincial government”, “Mayor” and “irrigation service” were less popular, they were favoured more by policymakers. The BGI actor options were the same as the options for allocation of FRM responsibility (
Figure 6b).
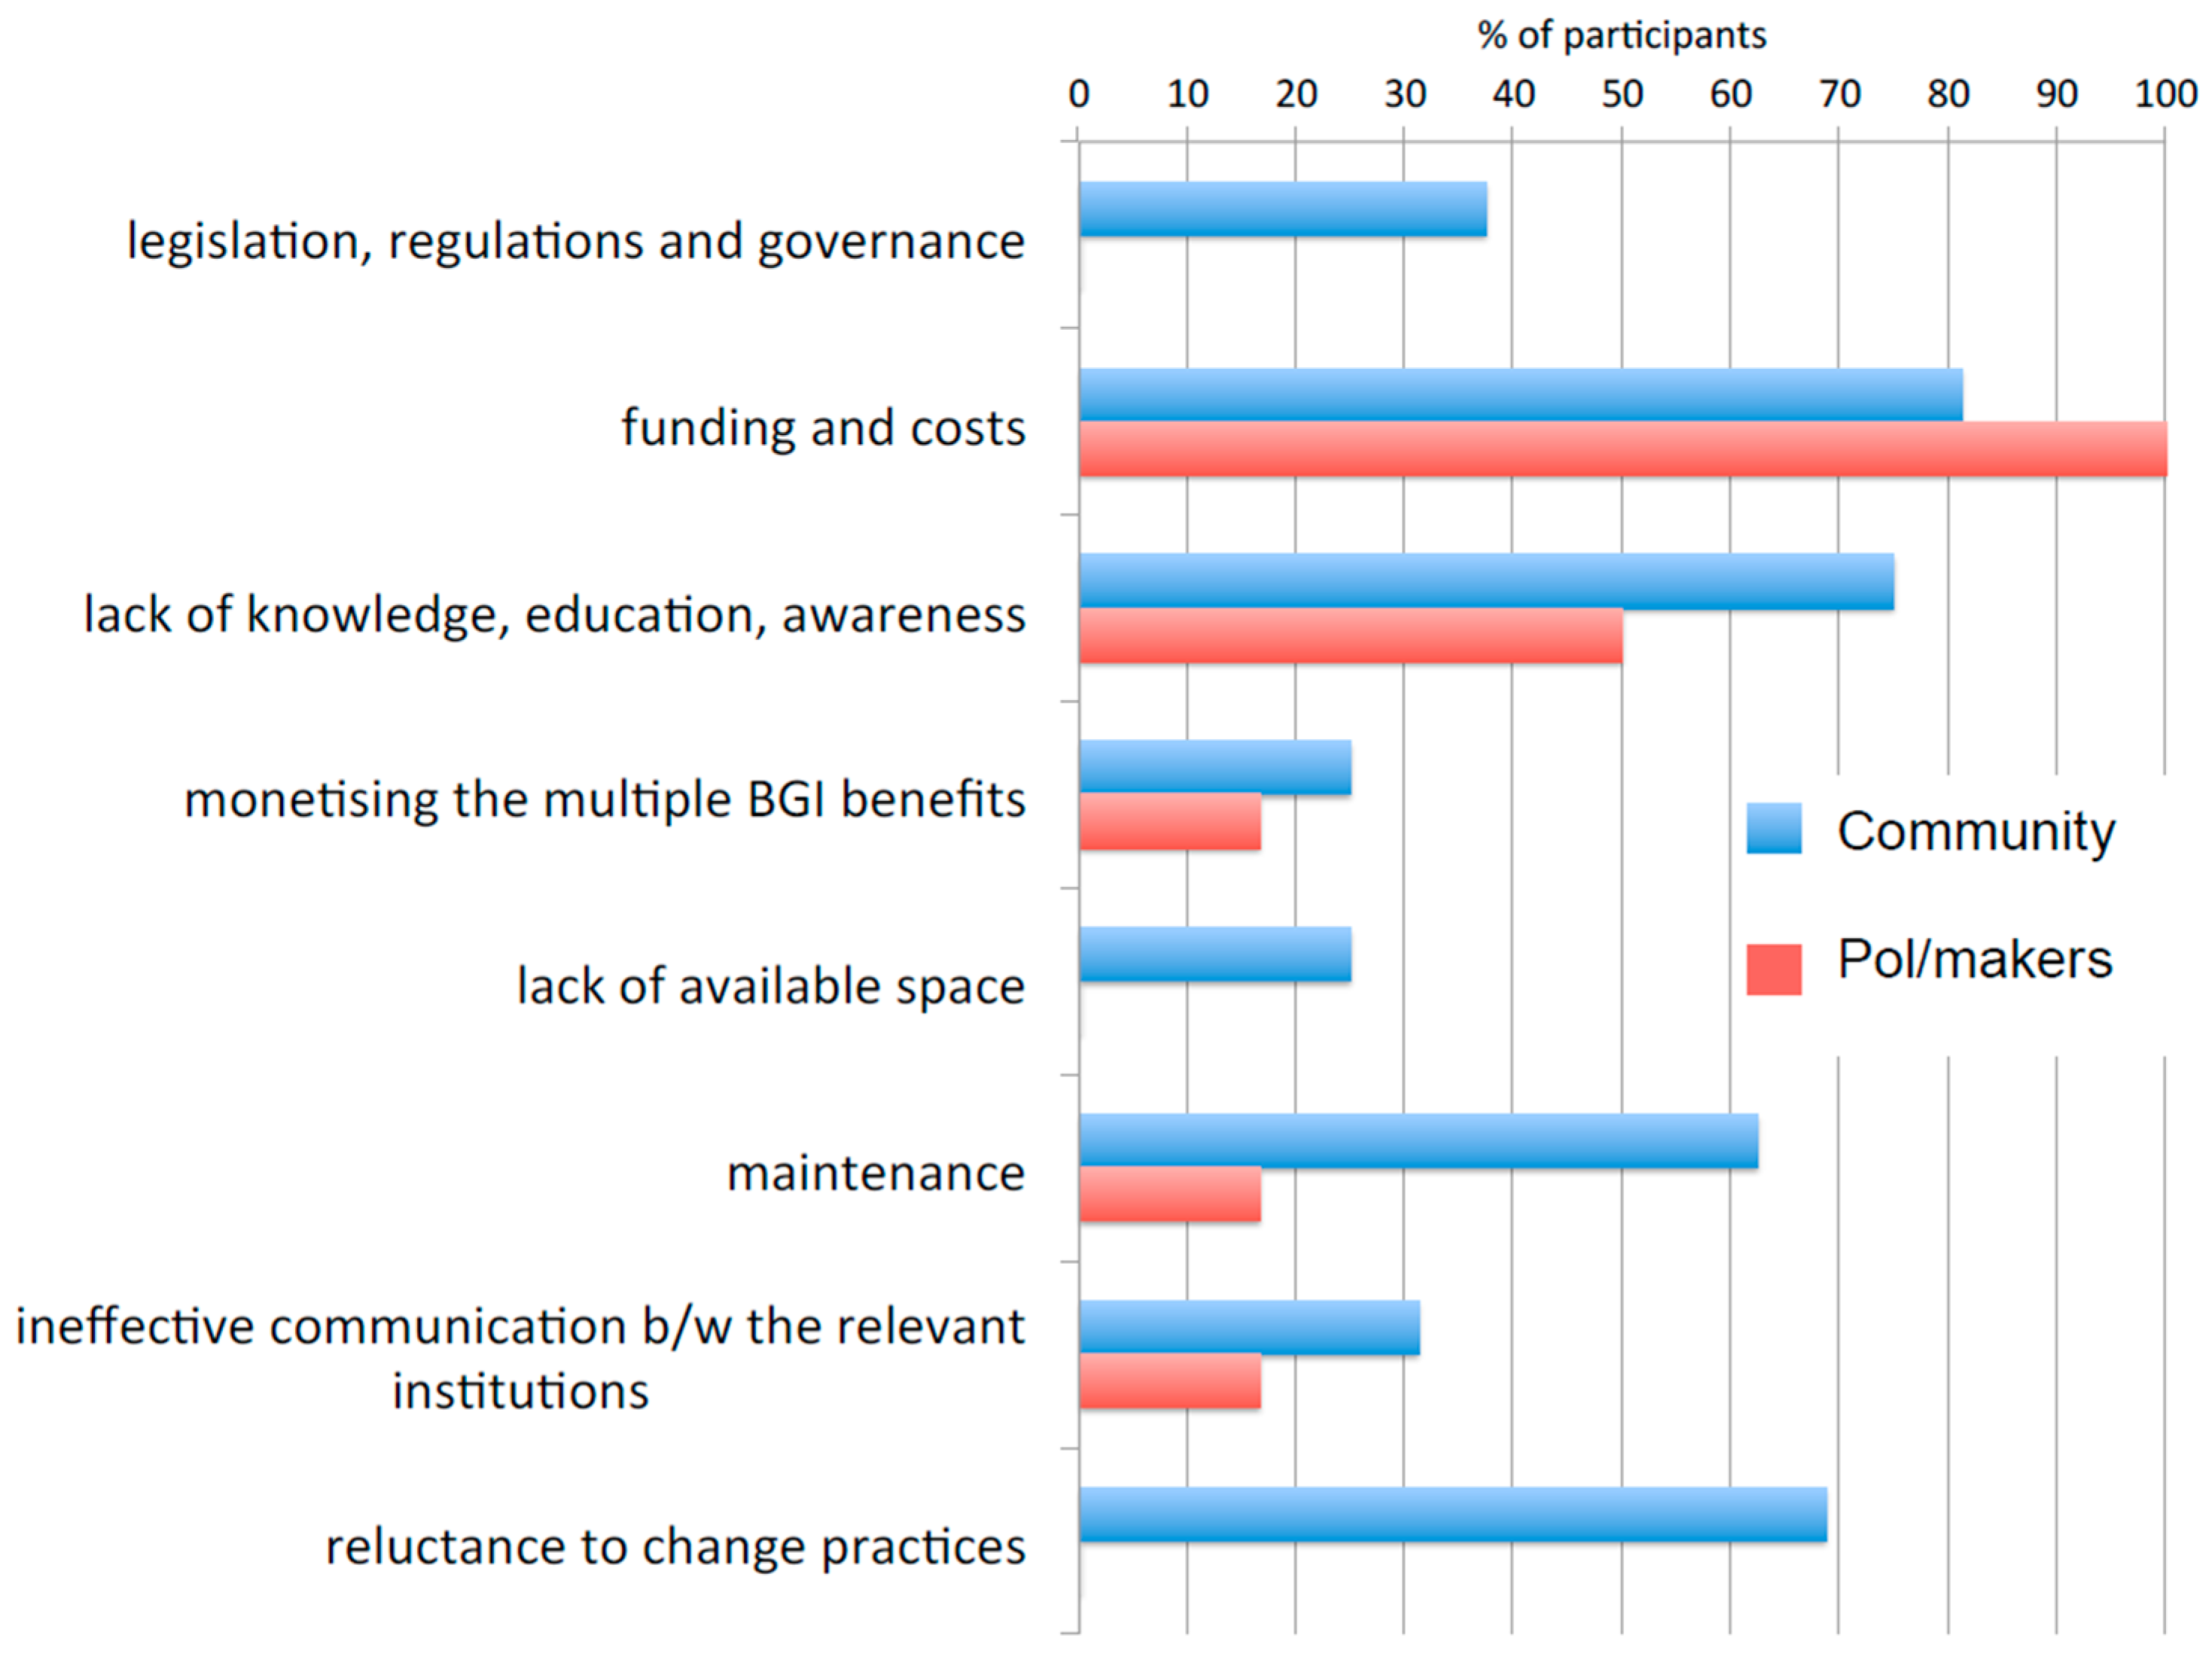
Community members and policymakers alike found that limited funding and high costs were the primary challenge in adopting BGI concepts in Semarang, as shown in
Figure 9. The former elaborated on this in relation to the lack of land, and funds for acquiring necessary land, for large-scale BGI schemes. The economic strain already experienced by flood-affected residents was also added as an obstacle for financially contributing to bottom-up approaches. The latter brought forward the issue in terms of limited local government budgets that do not have the financial capacity to fund large-scale and multi-sector projects.
4. Discussion
This section discusses BGI challenges with respect to the three requisites for effective BGI adoption [
26] and presents examples of how
inclusive,
appropriate and
proactive requisites may be represented in the context of Semarang when it comes to the adoption of BGI measures.
4.1. Funding Challenges
Funding and high costs of initial BGI implementation is a challenge that is not unique to Semarang: O’Donnell [
24] found funding and costs related barriers prominent in a Newcastle (UK) case study. Ramboll [
51] identified this as one of the main reasons for project success or failure. The Asian Development Bank (ADB) report [
52] specific to Indonesia and water resource management, included fluctuating funding coming from multiple sources as a major challenge. A suggestion for overcoming the problem was the “establishment of cost recovery mechanisms for the provision of water” as “an incentive for beneficiaries and water users to utilize water more efficiently and/or contribute in kind or in cash to the delivery of an adequate quantity and quality of water” [
52] (p. xxi).
An added concern brought forth by policymakers was the great degree of uncertainty regarding exact costs and benefits of implementing strategies that deviate from the standard grey infrastructure projects, which have been tried and tested before. The importance of a cost–benefit analysis was highlighted in a report by the European Environment Agency [
53], with the additional suggestion that this involves the wider basin or catchment area, rather than just the local area. Jones et al. [
54] argue for assessing BGI projects on non-traditional criteria used in grey infrastructure assessment and introducing a philosophical approach focused on contribution to social and environmental values rather than just economic efficiency. This includes considering the benefits with respect to the individual, community and institutional levels and asking two questions: “What is the value of doing this now as compared to later?” and “Which of the options on the table provides the best return over time?” [
54] (p. v).
More evidence of long-term BGI benefits is needed before such an approach prevails at the institutional level of Semarang. In an analogy used by a government official during a focus group discussion, investing in BGI was viewed as “buying healthy organic rice” when “people are starving and are penniless“. This led to the statement “Do not mention green infrastructure, when we cannot run the grey infrastructure” and “BGI is still a luxury” (policymakers’ focus group participant). It makes sense to come across such a view in other Southeast Asian cities too. Based on the argument that eco-social systems cannot be studied in isolation [
55], the particular socio-economic environment of such urban centres calls for a different BGI research approach that considers the unique social and cultural issues of developing cities in a comprehensive manner.
4.2. Lack of BGI Public Awareness
Lack of BGI awareness among the public was highly featured as a challenge in the results of this research project as it does in the literature. O’Donnell [
24] notes this as one of the major barriers that hinders people from adopting even the easily available BGI options that can be applied in one’s home. Semarang policymakers highlighted the need for strong promotional campaigns that increase public awareness on environment and BGI issues, by attaching currently trending issues (e.g., climate change, gender equality) to keep up interest and momentum for action. The data traces a large number of residents who—despite experiencing flood impacts often and quite intensely—do not prepare for the next time they are affected (
Figure 5). Perhaps the awareness-raising approach suggested by policymakers could change the perception around flooding from an unavoidable fact of life, especially in the most flood-prone neighbourhoods of Semarang, to an event that is preventable.
Additional to flood awareness, Semarang representatives from the Environment Department believe it is necessary to increase solid waste awareness among the public, stating that “The basic problem comes from public awareness, we from the government already provide facilities and infrastructure”, alluding to the general misconception that “final landfill is … a place to throw waste” and not “a final processing place”. In Semarang, the responsibility for solid waste management is split between three regional departments according to the type of land classification: the District Government has the overview of the district area, parks and small canals under the Housing and Settlement Department, while rivers and roads under the Public Work Department. This complexity makes it difficult for residents and communities to gain an understanding of solid waste procedures and their purpose and benefits; much less to follow them in the long-term.
However, it is not only the residents that lack awareness of BGI. Policymakers do not always see the benefits of participating in research that would enhance the uptake and effectiveness of BGI in the city. Semarang city’s participation in the Asian Cities Climate Change Resilience Network and the 100 Resilient Cities has increased visibility of the FRM issues the city faces within the international research community and has led to a number of research projects engaging local policymakers. During the focus groups, it became apparent that their feedback was not encouraging in regard to their experience of these research projects and their perceived benefits. They viewed the lack of cooperation across multiple research groups, the limited scope of each project and the small scale of BGI application rather discouraging. Research contribution was found to be at a pace which is slower than that required for making decisions, resulting in a loss of momentum shown in a policymaker’s statement “people will finally get bored”.
However, the value of research projects was appreciated as a tool for promoting the benefits of BGI, increasing public awareness and building capacity by educating students and researchers about them. This is in line with ADB [
52] who identify the shortage of “specialists with knowledge and skills to formulate plans, as well as apply the innovative tools and methodologies” as a major challenge in Indonesia. It thus becomes clear that decision makers often lack an evidenced-based understanding of the benefits of BGI, particularly regarding short-term benefits.
4.3. Governance Challenges
The fragmentation of policy and regulatory frameworks is viewed in the literature as one of the biggest challenges inhibiting BGI implementation even within the EU [
53]. The ADB [
52] report for Indonesia describes the local setting as a “regulatory and institutional framework that is fragmented and has gaps”, which is based on different sectors (i.e., water, agriculture, forest, energy, etc.); on different aspects of water resources management (i.e., irrigation, rivers, swamps, etc.) and on distributing the responsibility and financing of natural resources “over multiple sectors, ministries, and levels of government” [
52] (p. xx).
Based on regulations literature and policymakers’ interviews, it was found that BGI-relevant policy involves six different policy frameworks (solid waste management, ground water management, borehole management, road management, drainage system management, disaster mitigation and prevention) each containing laws that take effect at a national (Ministries), provincial (Central Java) and city level (Local Government). At the city level, the local government of Semarang employs a 2011–2031 spatial plan [
56], a 2011–2031 drainage master plan [
57] and a 2011–2021 mid-term development plan [
58], as well as the Mayor’s regulations of 2016. Although Constitution No 32/2019 [
59] provides a framework regarding Environmental Protection and Management, its influence in the context of BGI remains challenging.
The implementation responsibility was found to lie in the Housing and Settlement Department of Semarang City (known as the Public Works Department until 2017) in the case of borehole management, road management and drainage system management. Solid waste management was under the responsibility of the Environment Department of Semarang, which also held shared responsibility for the implementation of ground water management (with the Housing and Settlement Department of Semarang City, the Environment and Forestry of Central Java Province and the local water company PDAM), as well as disaster mitigation and prevention (with the Social Services of Semarang and the Regional Disaster Management Agency). Such fragmentation creates additional complexity.
According to policymakers, the “Mayor”, the “government” and “provincial government” featured highly as being responsible for FRM (
Figure 8). Interestingly though, they did not view the role of “legislation, regulations and governance” (0%) as a potential source of barriers to BGI adoption (
Figure 9), while this was an issue of considerable importance (38%) for community members. The focus group discussion data supported the view of the latter, revealing problems in cooperation amongst stakeholders due to the complexity of the regulatory framework and blurred lines of responsibility that lead to no action. This holds particularly true for the completion of long-term projects or those that exceed the political term of the Mayor, Minister or Party that set the plan: “Not every authority that substitutes the old Mayor has the same vision, especially if the activity involves inter-local leadership. The political condition defines this. So we cannot say we ensure that in 2038 we will be free from flood, if the political system is still like this” (community focus group participant).
An example of the system’s inefficiency was given during a focus group and involved the development of mangrove tourism by Semarang City with national government funds. Planning the project and engaging the communities spanned two years between 2014 and 2016, however the project did not materialise. A community representative pointed out that in 2016 “Suddenly, this activity became overwhelming… that was because of the different levels [of government involved]”. The same participant went on to comment that even the government officials find it difficult to navigate the system: “It turns out that when we want a deal to be seen (through) sometimes the government itself is not thorough enough. Apparently, the land designation was different. What it was for? It was yellow, (so it was) for settlements.”
In a setting where political elements constrain the implementation of top-down approaches, bottom-up approaches are a viable alternative. The combined findings on allocation of perceived FRM responsibility (
Figure 6b,
Figure 7 and
Figure 8) indicate that community members recognise the individual (“self”), the community as a whole (“citizens”) and forms of local community governance (“community groups”) as powerful stakeholders with major roles to play in implementing solutions to their flooding problems. In an interview with a Karangayu resident, the role of the local District Head mobilising the whole community was viewed positively: “Photographs were immediately sent to the District Head. This is why the District head has just asked if it rains and there is a puddle of water in the area, just take photo and send it. The current District head is actually good”.
The policymakers’ opinion on the potential of community-led approaches is summed up here: “I agree with the bottom up approach. Bottom up is fine, theoretically… Because the community capacity cannot handle it. They do only the problems that are within their capacity limits. They can hold a community meeting or whatever the challenge is. In Trimulyo, where the flood comes from the sea, residents would not solve it even with 1000 meetings”. A reluctance to shift from existing practices and approaches is noted in the literature as one of the main challenges to BGI implementation [
24], as is the lack of incentives and common goals and priorities for inter-sector collaboration and coordination of adoption actions with a synergy of stakeholders [
52]. ‘Reluctance to change practices’ also featured highly (69%) as a barrier in the opinion of community members (
Figure 9).
4.4. Inclusive
Community leaders expressed frustration in coordinating flood management actions involving residents of coastal areas specifically stating that “It is flooded area, and they were given instruction to deal with flooding, but they don’t do it. Hassle. So the challenge lies precisely in the community themselves. Habits that are hard to remove.” Such attitude is common as the coast is where the most economically disadvantaged people in Semarang reside. It is thus important that BGI approaches are more inclusive. Perhaps even within whole Semarang areas there is a need to address the particular needs of the poorest in order to understand the hierarchy of their priorities that shape their habits. On the other hand, it would also be beneficial to improve the education of these residents on flood risk matters and how to contribute to flood preparation and mitigation efforts. This could be achieved with community outreach programmes.
Existing and popular family welfare education groups (PKK) could be a good vehicle to promote the adoption of BGI, while harnessing the role of women in the communities. Feedback from leaders of such groups indicated that group members actively share household data to the point that data becomes too large for the group administrators to process. Women can play a significant role as data gatherers in enhancing the understanding of flood-related social and financial issues. If appropriately coordinated even at only local authority level, they could enable a large and rather uniform collection of data for mapping out variations in flooding experience according to location and socio-economic factors. An opportunity to tie this with existing activities is through women empowerment schemes in place since 2017.
4.5. Appropriate
Semarang community members identified challenges in the adoption of certain typologies of BGI that were not suitable to the local setting. Safety issues (danger of children drowning) were brought up in relation to lakes and retention ponds. Green roofs were also deemed unfit as it was felt that they attract mosquitoes. A different aspect of appropriateness surfaced with a community representative bringing up tension between the residents’ commercial interests and environmental priorities. It was explained that a BGI strategy would be deemed appropriate if it improved the commercial interests of residents (e.g., those who are run shops from their homes) besides its environmental benefits.
Negative previous experience with wells and seawater penetration was a limiting factor for the residents of the coastal Trimulyo area to support an infiltration well, as described by local community representative: “Actually, every community has a well. The well is used for daily needs, not to absorb rainwater. However before it rained, the well was full of seawater (…) Salty. So because of that, in Trimulyo an infiltration well was not supported.” Although in this case incomplete knowledge surrounding BGI strategies was a factor that deterred the community from adopting a BGI strategy for their needs, this example demonstrates that it is imperative for BGI strategies to be appropriately selected, scaled-up and implemented, because their success or failure will affect their adoption in the future.
4.6. Proactive
A wide range of proactively engaged stakeholders are important for the adoption of any project, particularly BGI projects where maintenance is crucial for long-term success and widespread benefits. Maintenance is prominent in the literature as a factor that contributes to long-term impact and to changing the uncertainty concerning BGI outcomes [
55]. This study found that as a challenge for BGI adoption it concerned over half of community participants (63%) (
Figure 9), but scored low by policymakers. However, a proactive behaviour is a requirement from all stakeholders regardless of whether a bottom-up or top-down approach is followed regarding BGI adoption: “So if the community has a good initiative and supports beneficial activities, the key is in the community leaders” (community focus group participant).
Proactive leaders inspire and could become key to the success of an implemented BGI project, which in turn could serve as evidence of BGI benefits. However, social and cultural criteria that characterise an action as proactive are different. A community member provided information of what kind of approach would be suitable for the cultural context of Semarang: “For example, if we want a programme … if there is a socialization from heart-to-heart approach, it seems to be more effective than that of just a notification or letter. Thus, socialisation approach will yield more maximum results.” (community focus group participant). Nevertheless, the sustainable adoption of BGI among local communities would require the transformation of behaviour from reactive, with short-term solutions typically offered by grey infrastructure to remove storm water as soon as possible, to longer-term solutions provided by BGI that adapt to and mitigate flood risk.
5. Conclusions
This paper discussed the challenges of adopting BGI as viewed by different stakeholder groups from areas facing different flood risks, and explored how local socio-economic and cultural issues influence BGI adoption in Semarang, Indonesia. The juxtaposition of challenges perceived by community members and policymakers enhances the understanding of the local context and promotes a better informed holistic approach in planning and implementing effective BGI projects.
Three requisites were presented in order to enhance flood resilience with BGI using a community-centred approach. These are inclusive, appropriate and proactive, which are inter-woven within the socio-economic and cultural fabric of Semarang. Socio-economic and cultural issues can enable or hinder the successful adoption of BGI, and therefore, should be considered within the development of policies that promote BGI.
A combined top-down and bottom-up approach is recommended in order to manage flood risk and build community resilience against future flooding in a manner that is sustainable for urban environments and benefits their populations. To encourage bottom-up participation, there is a need to clarify the roles and the responsibilities of stakeholders involved, and to make progress in the integration of departments and policies that promote a sustainable approach to FRM.
Finally, a change in the mind-set and behaviour of all stakeholders involved is viewed as vital in overcoming the challenges and adopting the proactive and sustainable solutions offered by BGI. Semarang’s climate change adaptation could become an exemplar for developing cities in low- and middle-income countries facing similar environmental hazards.
