Article

A Comparison Study of Runoff Characteristics of Non-Point Source Pollution from Three Watersheds in South Korea

1
Han River Environment Research Center, National Institute of Environmental Research, Gyeonggi-do 12585, Korea
2
Rural Research Institute, Korea Rural Community Corporation, Gyeonggi-do 15634, Korea
3
Department of Rural Systems Engineering, Research Institute of Agriculture and Life Sciences, Seoul National University, Seoul 08826, Korea
4
Department of Environmental Health Science, Konkuk University, Seoul 05029, Korea
5
Agriculture and Life Sciences Research Institute, Kangwon National University, Gangwon 24341, Korea
*
Author to whom correspondence should be addressed.
Water 2019, 11(5), 966; https://doi.org/10.3390/w11050966
Submission received: 16 April 2019 / Revised: 2 May 2019 / Accepted: 4 May 2019 / Published: 8 May 2019
(This article belongs to the Special Issue GIS-Based Hydrology and Water Quality Modeling)

Abstract

:
Three watersheds in Korea (Dochoncheon, Gongjicheon, Seolseongcheon) with different land cover characteristics were selected for non-point source pollution monitoring. Event mean concentration (EMC) was calculated, and runoff characteristics were compared through first-flushing and statistical analyses. The mean of the water quality parameters was the highest in Seolseongcheon during dry days among the three watersheds. EMCs of biochemical oxygen demand (BOD) and total nitrogen (TN) were higher in Dochoncheon and Gongjicheon during rainy days, respectively. The upper Seolseongchun watershed showed overall greater values of chemical oxygen demand (COD), suspended solids (SS), total organic carbon (TOC), and total phosphorus (TP). First-flush analyses indicated that SS had the strongest and TN had the weakest effects on the first flush. BOD was the highest in Dochoncheon (urban watershed) and increased with increased number of antecedent dry days. Rainfall intensity appeared to affect SS runoff strongly in Gongjicheon and Seolseongcheon. COD showed strong correlation with SS and TOC in all watersheds, and organic matter (COD and TOC) demonstrated high factor loads during dry and rainy days. Thus, organic matter–related factors were classified as the major factors in pollutant loads. TP and TN were separately classified during dry days in Gongjicheon and Seolseongcheon, whereas these were the secondary factors during rainfall when the influence of non-point pollution was substantial. Cluster analyses showed that the monitoring sites in Dochoncheon and Gongjicheon watersheds were closer than Seolseongcheon. As a result of the comparison of non-point source pollution runoff in the three watersheds, it was difficult to explain the non-point source pollution runoff by specific characteristics such as land cover. For science-based management of non-point pollution, it is necessary to obtain additional survey data considering the climatic, geographical and major industries.

1. Introduction

Water pollution sources can be classified into point and non-point sources [1]. The former is relatively simple to manage, because pollutants are discharged at a specific point through a pipe or watercourse. However, non-point source pollution from agriculture, urban and mountainous areas is difficult to collect and manage data from the sources [2]. For this reason, point source pollution has mainly been managed by sewage treatment plants and stricter emission standards, and thus point pollutant loads have been steadily decreased in Korea. However, the contribution of non-point source pollution has been continuously increased primarily due to the expansion of impervious areas resulting from urbanization [3]. Thus, there have been a number of studies on the management of non-point pollution sources because point source pollution management is insufficient for further improvement in water quality.
According to Xiang et al. [4], many studies related to non-point source pollution have been conducted, including research on pollution characteristics, modeling, and management. Other studies have identified the causes of non-point source pollution, quantified non-point pollutant loads, and established measures for reducing the pollutant loads [5,6,7,8,9]. However, non-point source pollution is affected by various factors, and thus difficult to characterize common non-point source pollution applicable to watersheds in particular [10]. The development of geographic information system and remote sensing technologies has enabled such research using watershed models. Watershed models including AGNPS, ANSWERS, CASC2D, DWSM, HSPF, KINEROS, MIKE SHE, PRMS, and SWAT [11], have been extensively used to establish measures for quantifying, predicting, and reducing non-point pollution sources. These models require extensive input data, including monitoring, weather and terrain data. In addition, obtaining water quality monitoring data is crucial in modeling, because the models require calibration and validation based on monitoring data to produce reliable results.
Since pollutants from non-point sources are mostly discharged during rainfall events, quantification of such sources is labor- and cost-intensive [12]. The effects of non-point source pollution discharged during rainfall on river and lake water quality has increased, as sewage treatment rate and economic activities increase and land is more densely used [13]. Additionally, runoff flow rate varies greatly, and the prediction of runoff flow is consequently difficult. Unit load from monitoring data of non-point source pollution is important in order to apply quantitative data of non-point source pollution for calculating Total Maximum Daily Loads (TMDLs) and water quality management in South Korea [14]. To develop reasonable management measures, it is necessary to study not only the spatiotemporal distribution of non-point source pollution but also the quantitative and qualitative characteristics of the pollutants.
Multivariate statistical techniques, such as cluster, factor, and discriminant analyses, enable us to better understand complex data [15]. Multivariate analysis has been widely used because it assesses temporal and spatial changes in water quality and identifies potential causes of water pollution and watershed variability [16,17,18].
In this study, the event mean concentration (EMC) of non-point source pollution was calculated based on multiple monitoring data of non-point source pollution at three watersheds with different land cover characteristics. Based on the EMCs, the runoff characteristics of each of the three watersheds were compared through the first-flushing effect and multivariate statistical analyses were applied to establish water resource management plans.

2. Materials and Methods

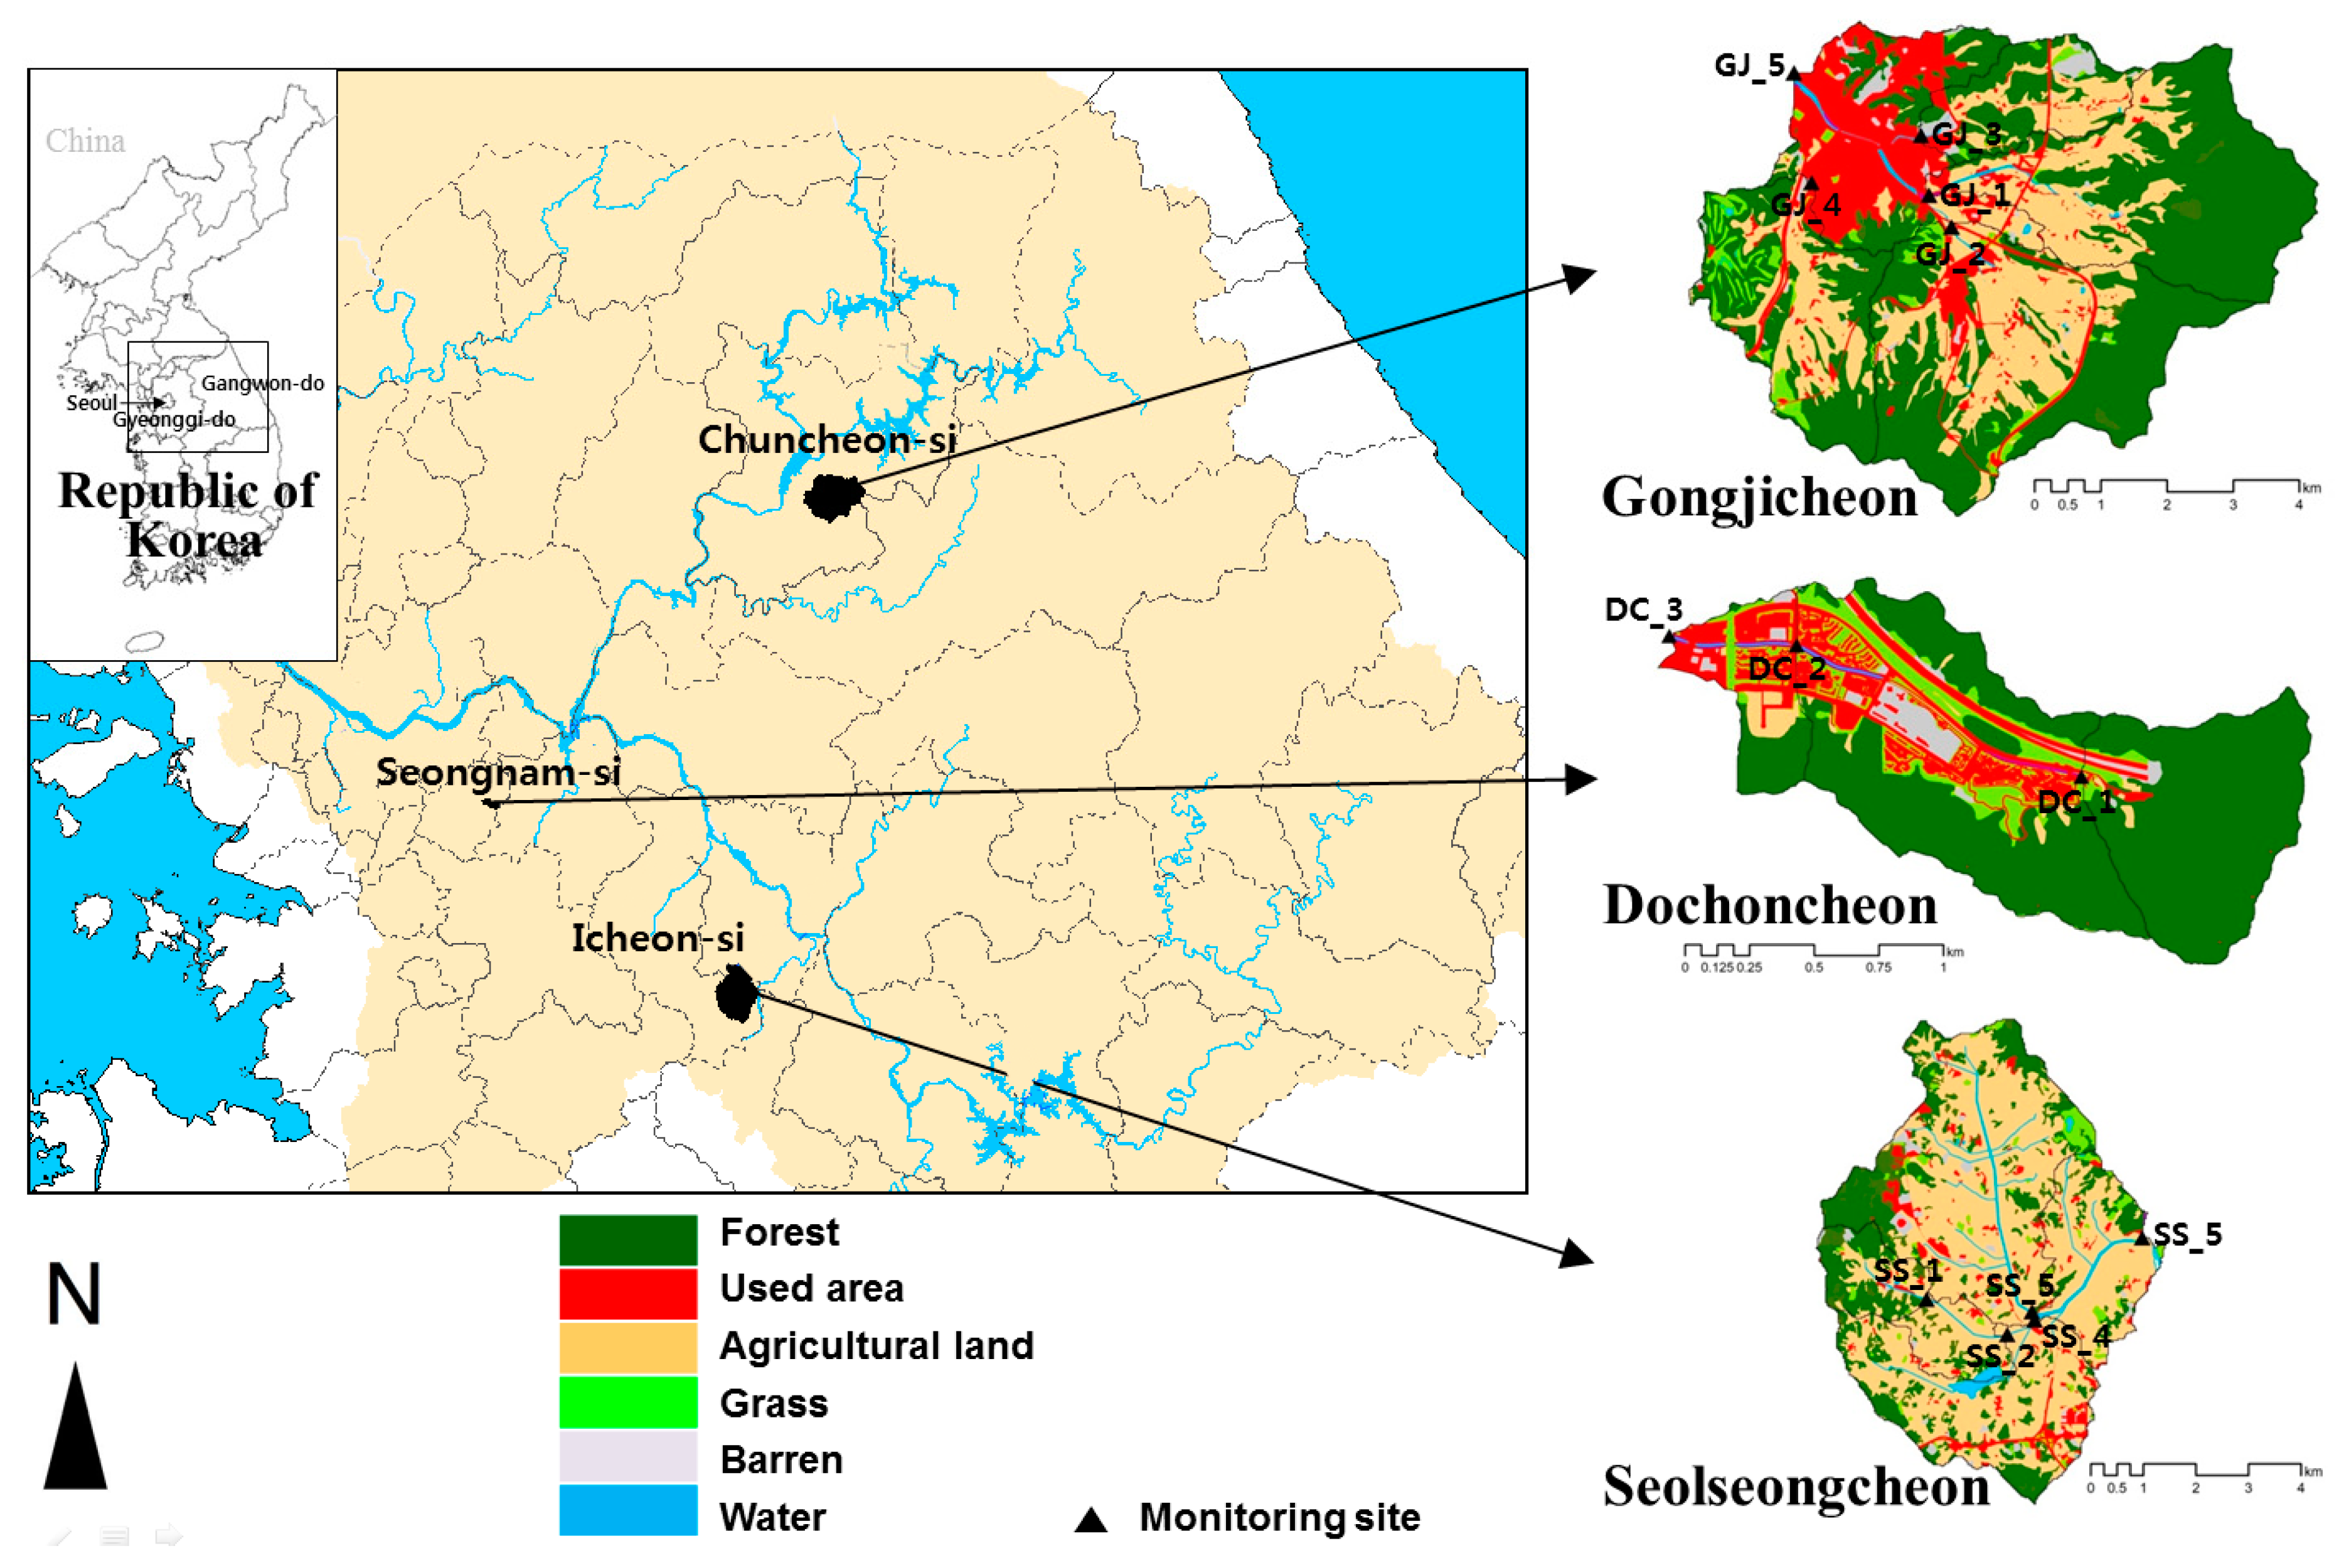
2.1. Watershed Characteristics

Three watersheds in Korea with different land cover characteristics (Dochoncheon, Gongjicheon, and Seolseongcheon) were selected to study the runoff characteristics of non-point source pollution for different land cover type. A land cover map from the Ministry of Environment [19] was used, and a 1:25,000 precision soil map [20] established by the National Institute of Agricultural Sciences was applied. Data from a 1:5000 digital map provided by the National Geographic Information Institute was used to construct a digital elevation model using ArcGIS 9.2.
The Dochoncheon watershed comprises an urban river with an area of 2.0 km2, where runoff water from forests in upstream watershed passes the downstream urban area through the river levee. Three monitoring sites (DC_1 to DC_3) were selected considering river structure and land cover. The average altitude and slope are 140.2 m and 33.9%, respectively. The soil in the watershed is composed of 72.0% Songsan, including SNE2, in terms of the soil series classification of the Soil Environmental Information System of the Rural Development Administration. The soil is sandy loam, containing gravel and rocks, and has very good drainage and permeability. Thus, it is suitable for use as forest land.
The Gongjicheon watershed with 45.1 km2 in area has a complex land cover structure that consists of greater than 10% for the respective forest, agricultural, and used (urban) areas. The average altitude is 215.3 m, with a slope of 25.6%. The soil consists of 36.4% Samgag, including SgE2, and 15.1% Songsan, including SNE2. Songsan soil occurs upstream in the watershed, and Samgag is mainly distributed midstream and downstream. Samgag soil comprises sandy loam with good drainage and slightly higher permeability, making it appropriate for pine forest lands.
The Seolseongcheon watershed is an agricultural watershed with an area of 37.5 km2 of which 65.0% is agricultural areas. The average altitude is 95.8 m with a slope of 11.5%. The soil is composed of 28.1% Samgag, including SgD2, 22.0% Yesan, including YaC2, 15.3% Sangju, including SAB, and 10.3% Yecheon, including YeB. Samgag is distributed evenly throughout the watershed, and Yecheon is concentrated downstream in the watershed. Yesan comprises loamy soil with good drainage and moderately high permeability, and it is mainly used for cultivating crops such as apples. Sangju comprises sandy loam with good drainage and moderately high permeability, and it is mainly used for cultivating crops such as barley. Yecheon comprises loamy soil with poor drainage and moderate permeability, and it is mainly used for rice cultivation.
Five monitoring sites in both Gongjicheon (GJ_1 to GJ_5) and Seolseongcheon (SS_1 to SS_5) were selected considering the major tributaries and structures such as bridges. Monitoring sites and land cover for each watershed are shown in Figure 1 and Table 1.
There is no livestock farm and point source pollution in the Dochoncheon watershed, and the population density is 8496 people/km2, which is 48 times greater than that in Seolseongcheon (177 people/km2). There are 454 and 974 cattle in the Gongjicheon and Seolseongcheon, respectively, and three and five point source pollution discharging pollutants at 15 and 33 m3/day, respectively. At sites GJ_5 and SS_5, where the respective watersheds end, the water cover rate was 0.2% or less, showing a low effect on the total water quality.

2.2. Multivariate Statistical Analysis

To analyze the data, multivariate analyses including correlation, principal component, and cluster analyses were performed using statistical processing with the R program.
Correlation analyses numerically represent the linear relationship between variables, and Pearson’s correlation coefficient (r) was used, with a value of −1 ≤ r < 0 indicating a negative correlation, and a value of 0 ≤ r < 1 indicating a positive correlation. In addition, the closer the r-value is to 0, the weaker the correlation is, and the closer it is to 1, the stronger the correlation is [21].
Cluster analysis classifies high similarity groups by measuring the similarity of each object; it identifies the similarity of objects belonging to the same cluster and the differences between objects belonging to different clusters [22]. In this study, clusters were obtained using hierarchical cluster analysis. The distance between the clusters was calculated by the Euclidean squared distance method, which squares and sums the differences of all variables. Ward’s method [23], which minimizes the increment of the error sum of squares at each combination step, was applied as a cluster combination method.
Factor analysis identifies a virtual variable called a factor, which can explain the covariance between observable quantitative variables. The variables are grouped together, and new variables that can represent each group are subsequently identified. Thus, factor analysis is used to identify the characteristics of the groups and reduce the dimensions. Principal component analysis, which is the method of estimation for factor analysis, was used to apply the principal components of the covariance matrix as factors. The Varimax rotation method, involving orthogonal rotation, was used as the method of rotating the factor axis [24].

2.3. Monitoring Method

Monitoring of non-point source pollution was carried out according to the Rainfall Runoff Survey Method [25]. For non-point source pollution monitoring, six characteristics (biological oxygen demand, BOD5; chemical oxygen demand, CODMN; total organic carbon, TOC; suspended solids, SS; total nitrogen, TN; and total phosphorus, TP) were monitored during rainy and dry days in Dochoncheon during 2014–2017, in Gongjicheon during 2015–2017, and in Seolseongcheon during 2016–2017. These characteristics were monitored 18–26 times during dry days and 5–14 times during rainy days at each site. Table 2 shows the surveys done during the monitoring period. The runoff of Dochoncheon ranged from 0.0001 m2/s to 0.029 m2/s and Gongjicheon and Seolseongcheon was up to 1.086 m2/s during dry days (Figure 2). The runoff during rainy days is shown in Figure 3.
To compare the monitoring results during rainy days, EMC was applied [26]:
EMC = n = 1 N ( Q n × Δ t n × C n ) n = 1 N ( Q n × Δ t n )
EMC is the flow-weighted mean concentration (mg/L) per rainfall runoff event (x) and calculated as the ratio of total pollutant mass and total runoff flow. Q is the runoff flow (m3/s), C is the concentration of a specific pollutant (mg/L), Δ t n is the measurement time interval, and N is the total number of measurements.

3. Results

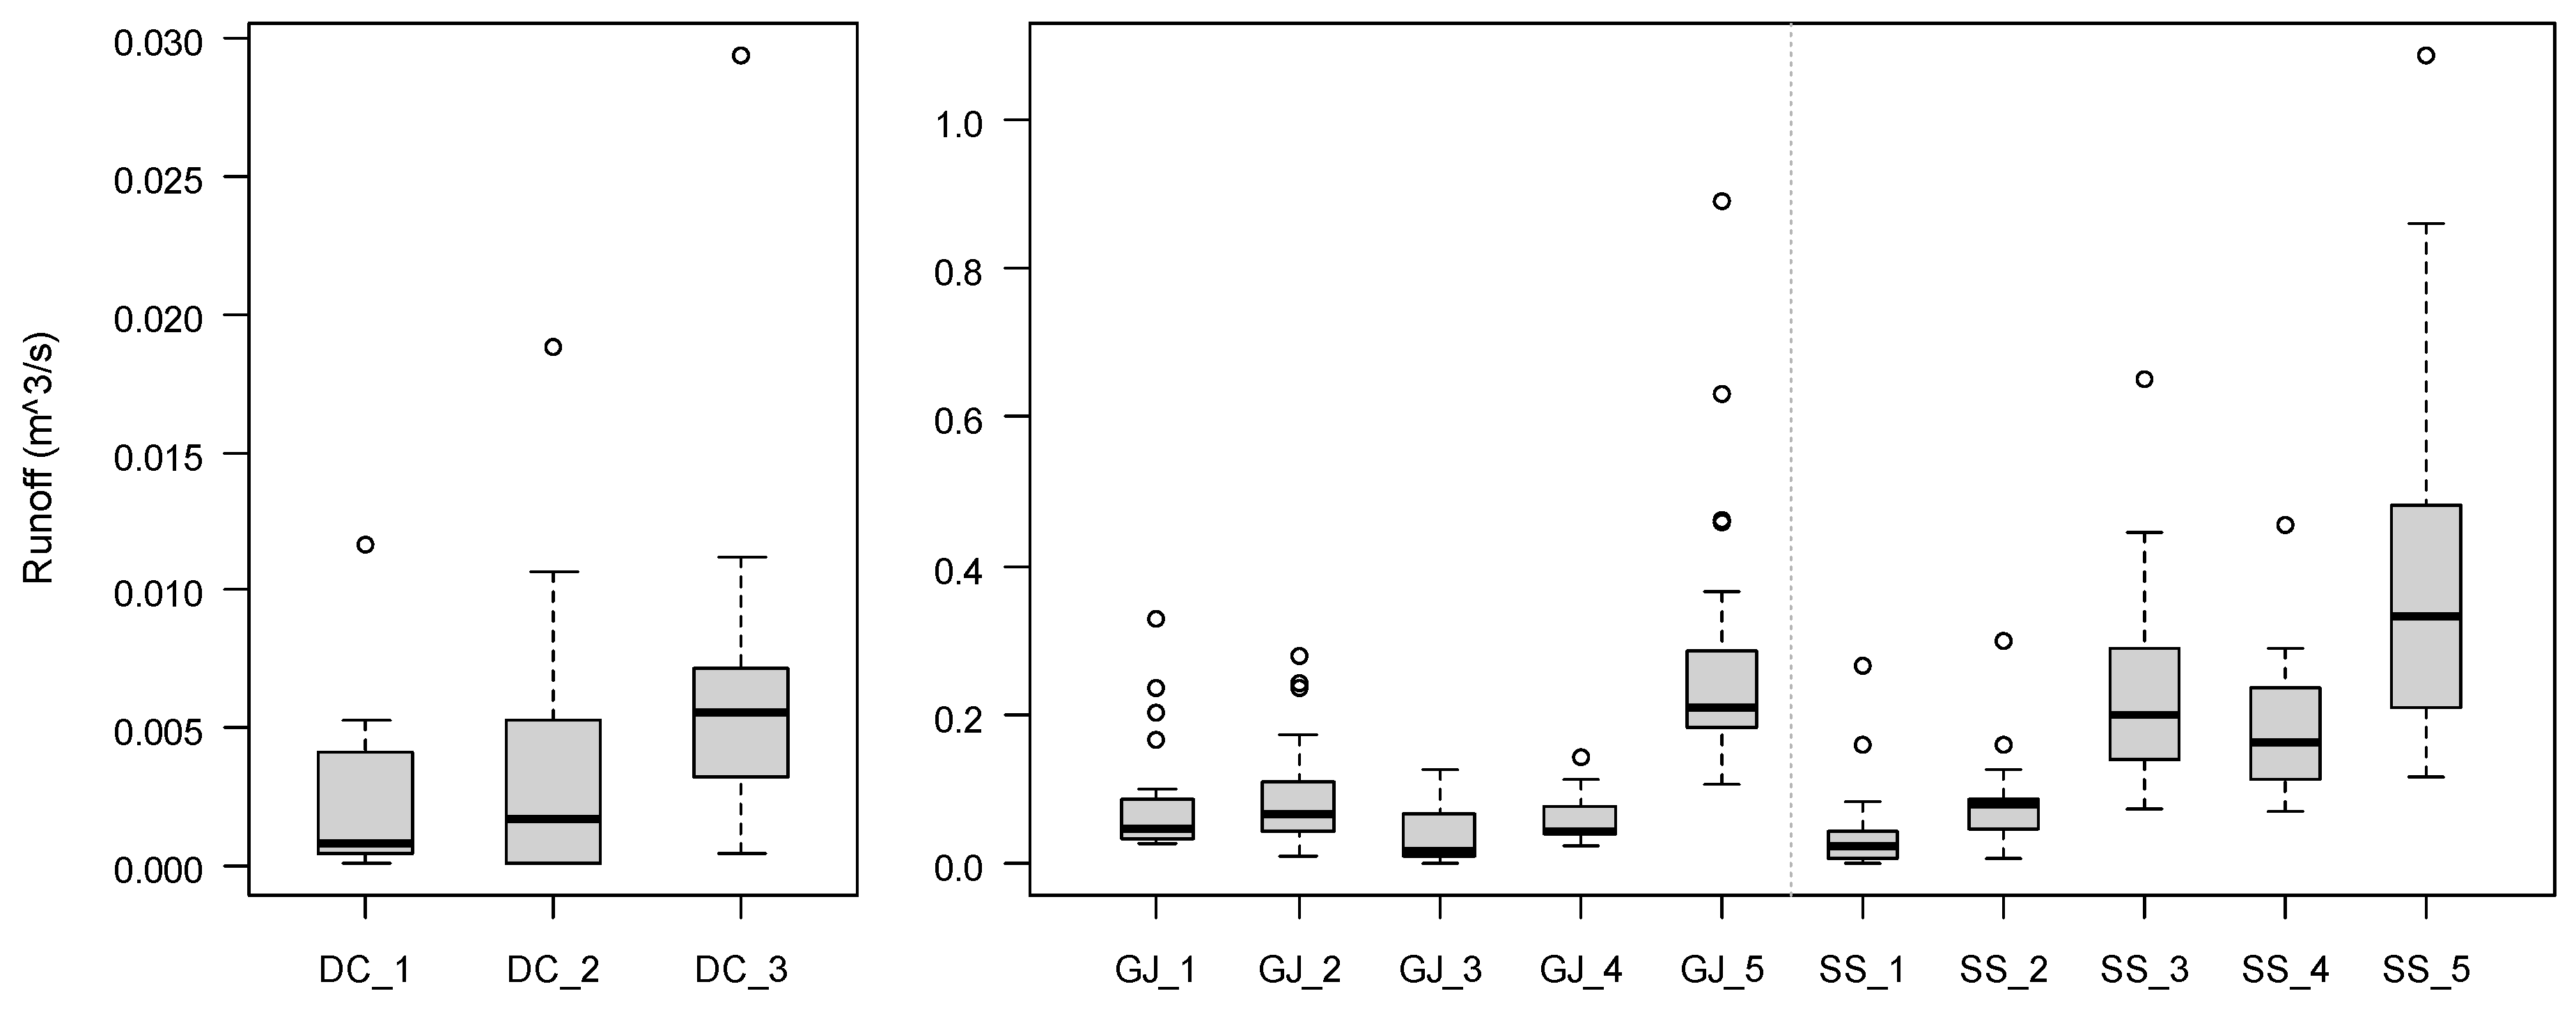
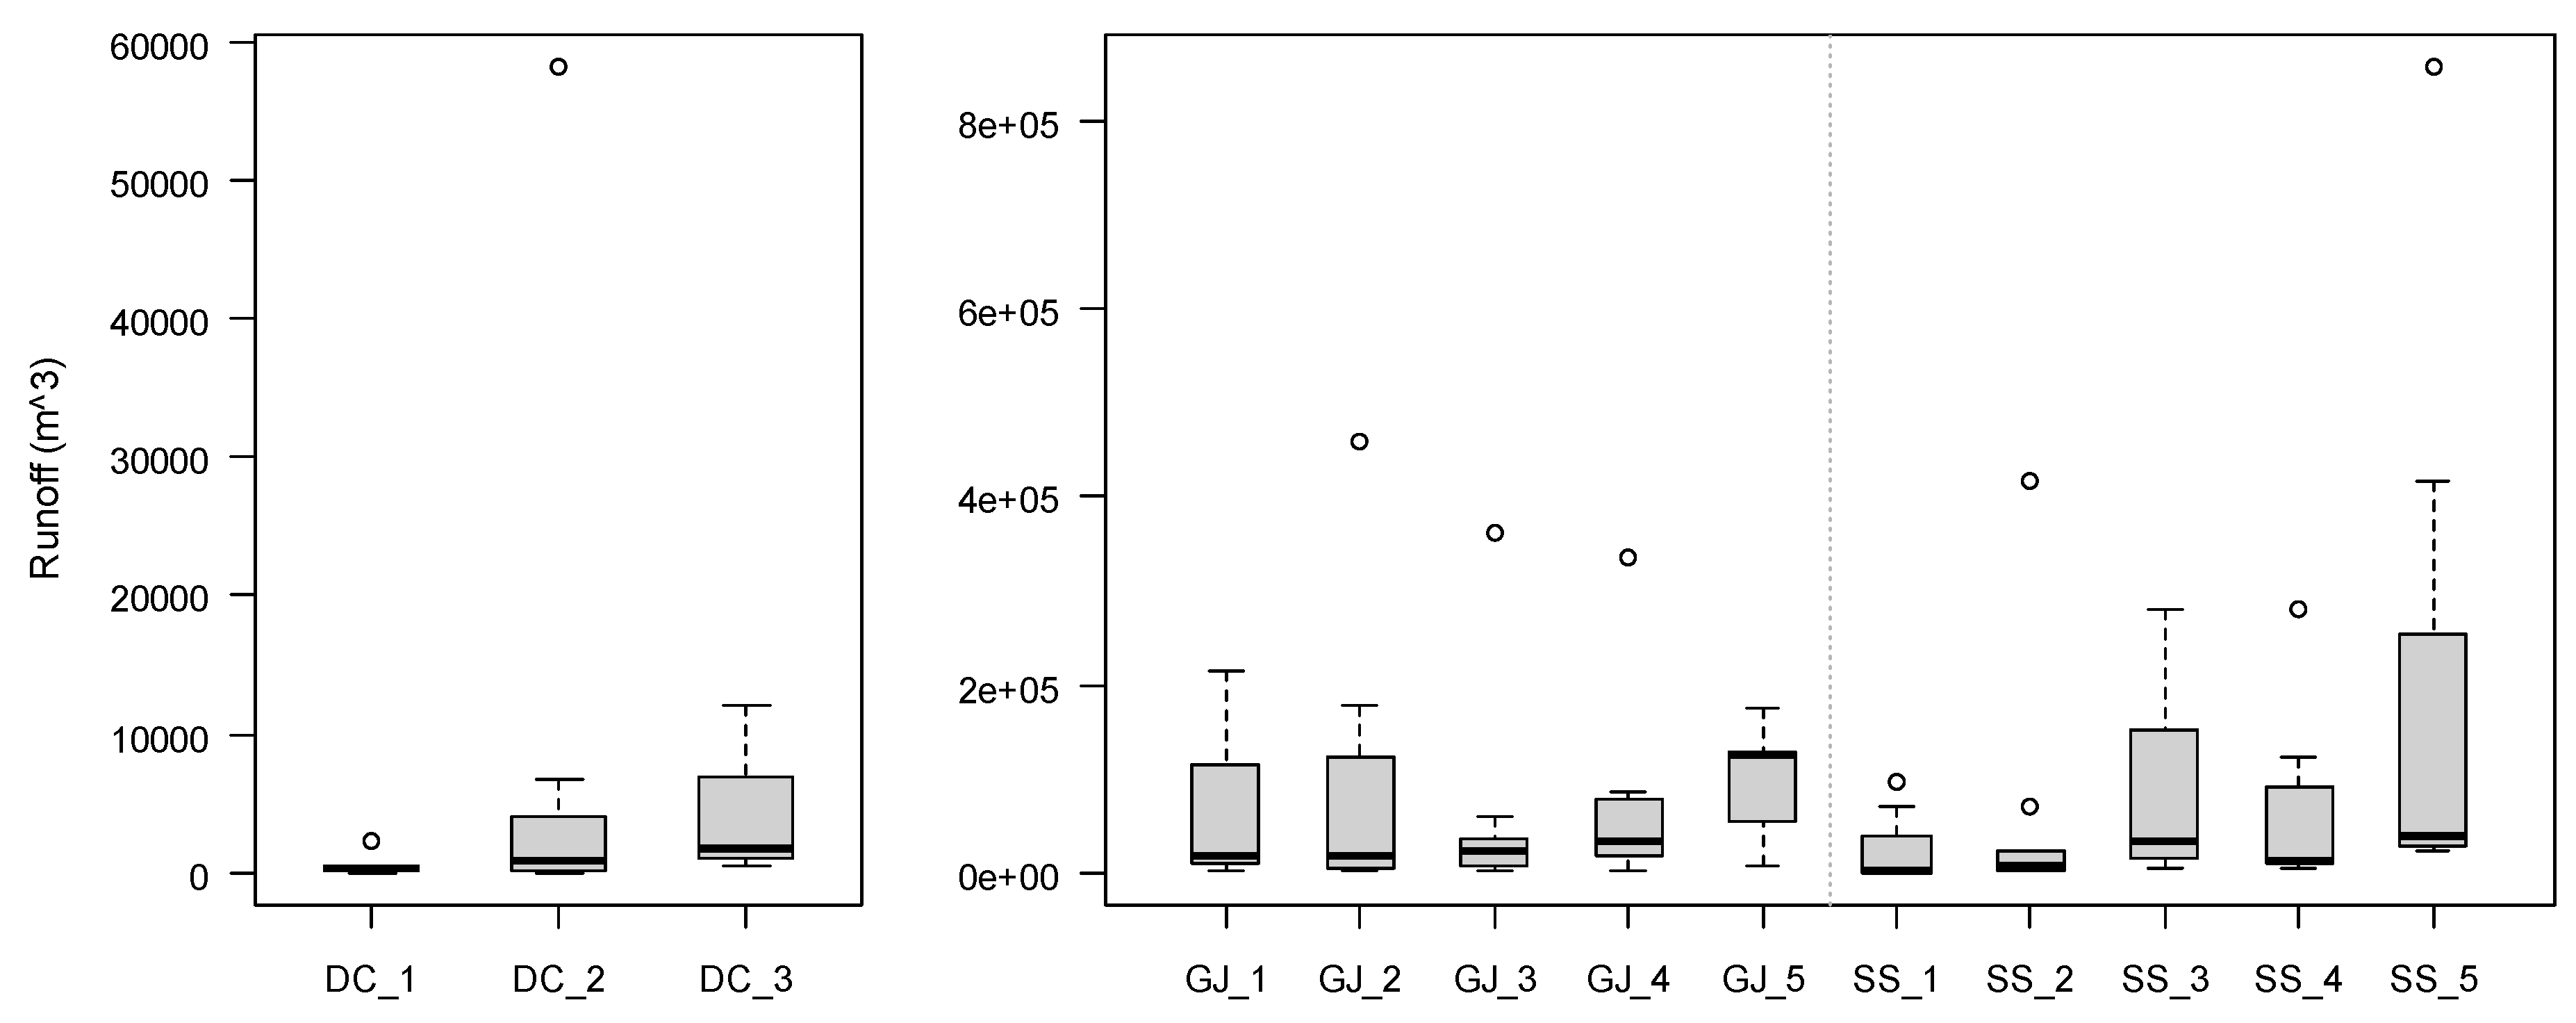
3.1. Rainfall Analysis

The rainfall in Dochoncheon, Gongjicheon, and Seolseongcheon was analyzed using rainfall data from Seongnam automatic weather station (AWS), Chuncheon weather station and Janghowon AWS, respectively. To identify the characteristics of rainfall during the monitoring period, the data from Chuncheon weather station from 1987 and the two other AWS from 1997 to 2017 were analyzed and compared to that from the monitoring period (Table 3). The average amount of rainfall in Gongjicheon was the highest among all the watersheds (1432.1 mm), and that in Seolseongcheon was the lowest (1217.7 mm). Fifty to seventy percent of the total amount of rainfall was measured in summer. In all three watersheds, the average amount of rainfall during the monitoring period was lower than the past average.

3.2. Water Quality and First Flush Analysis

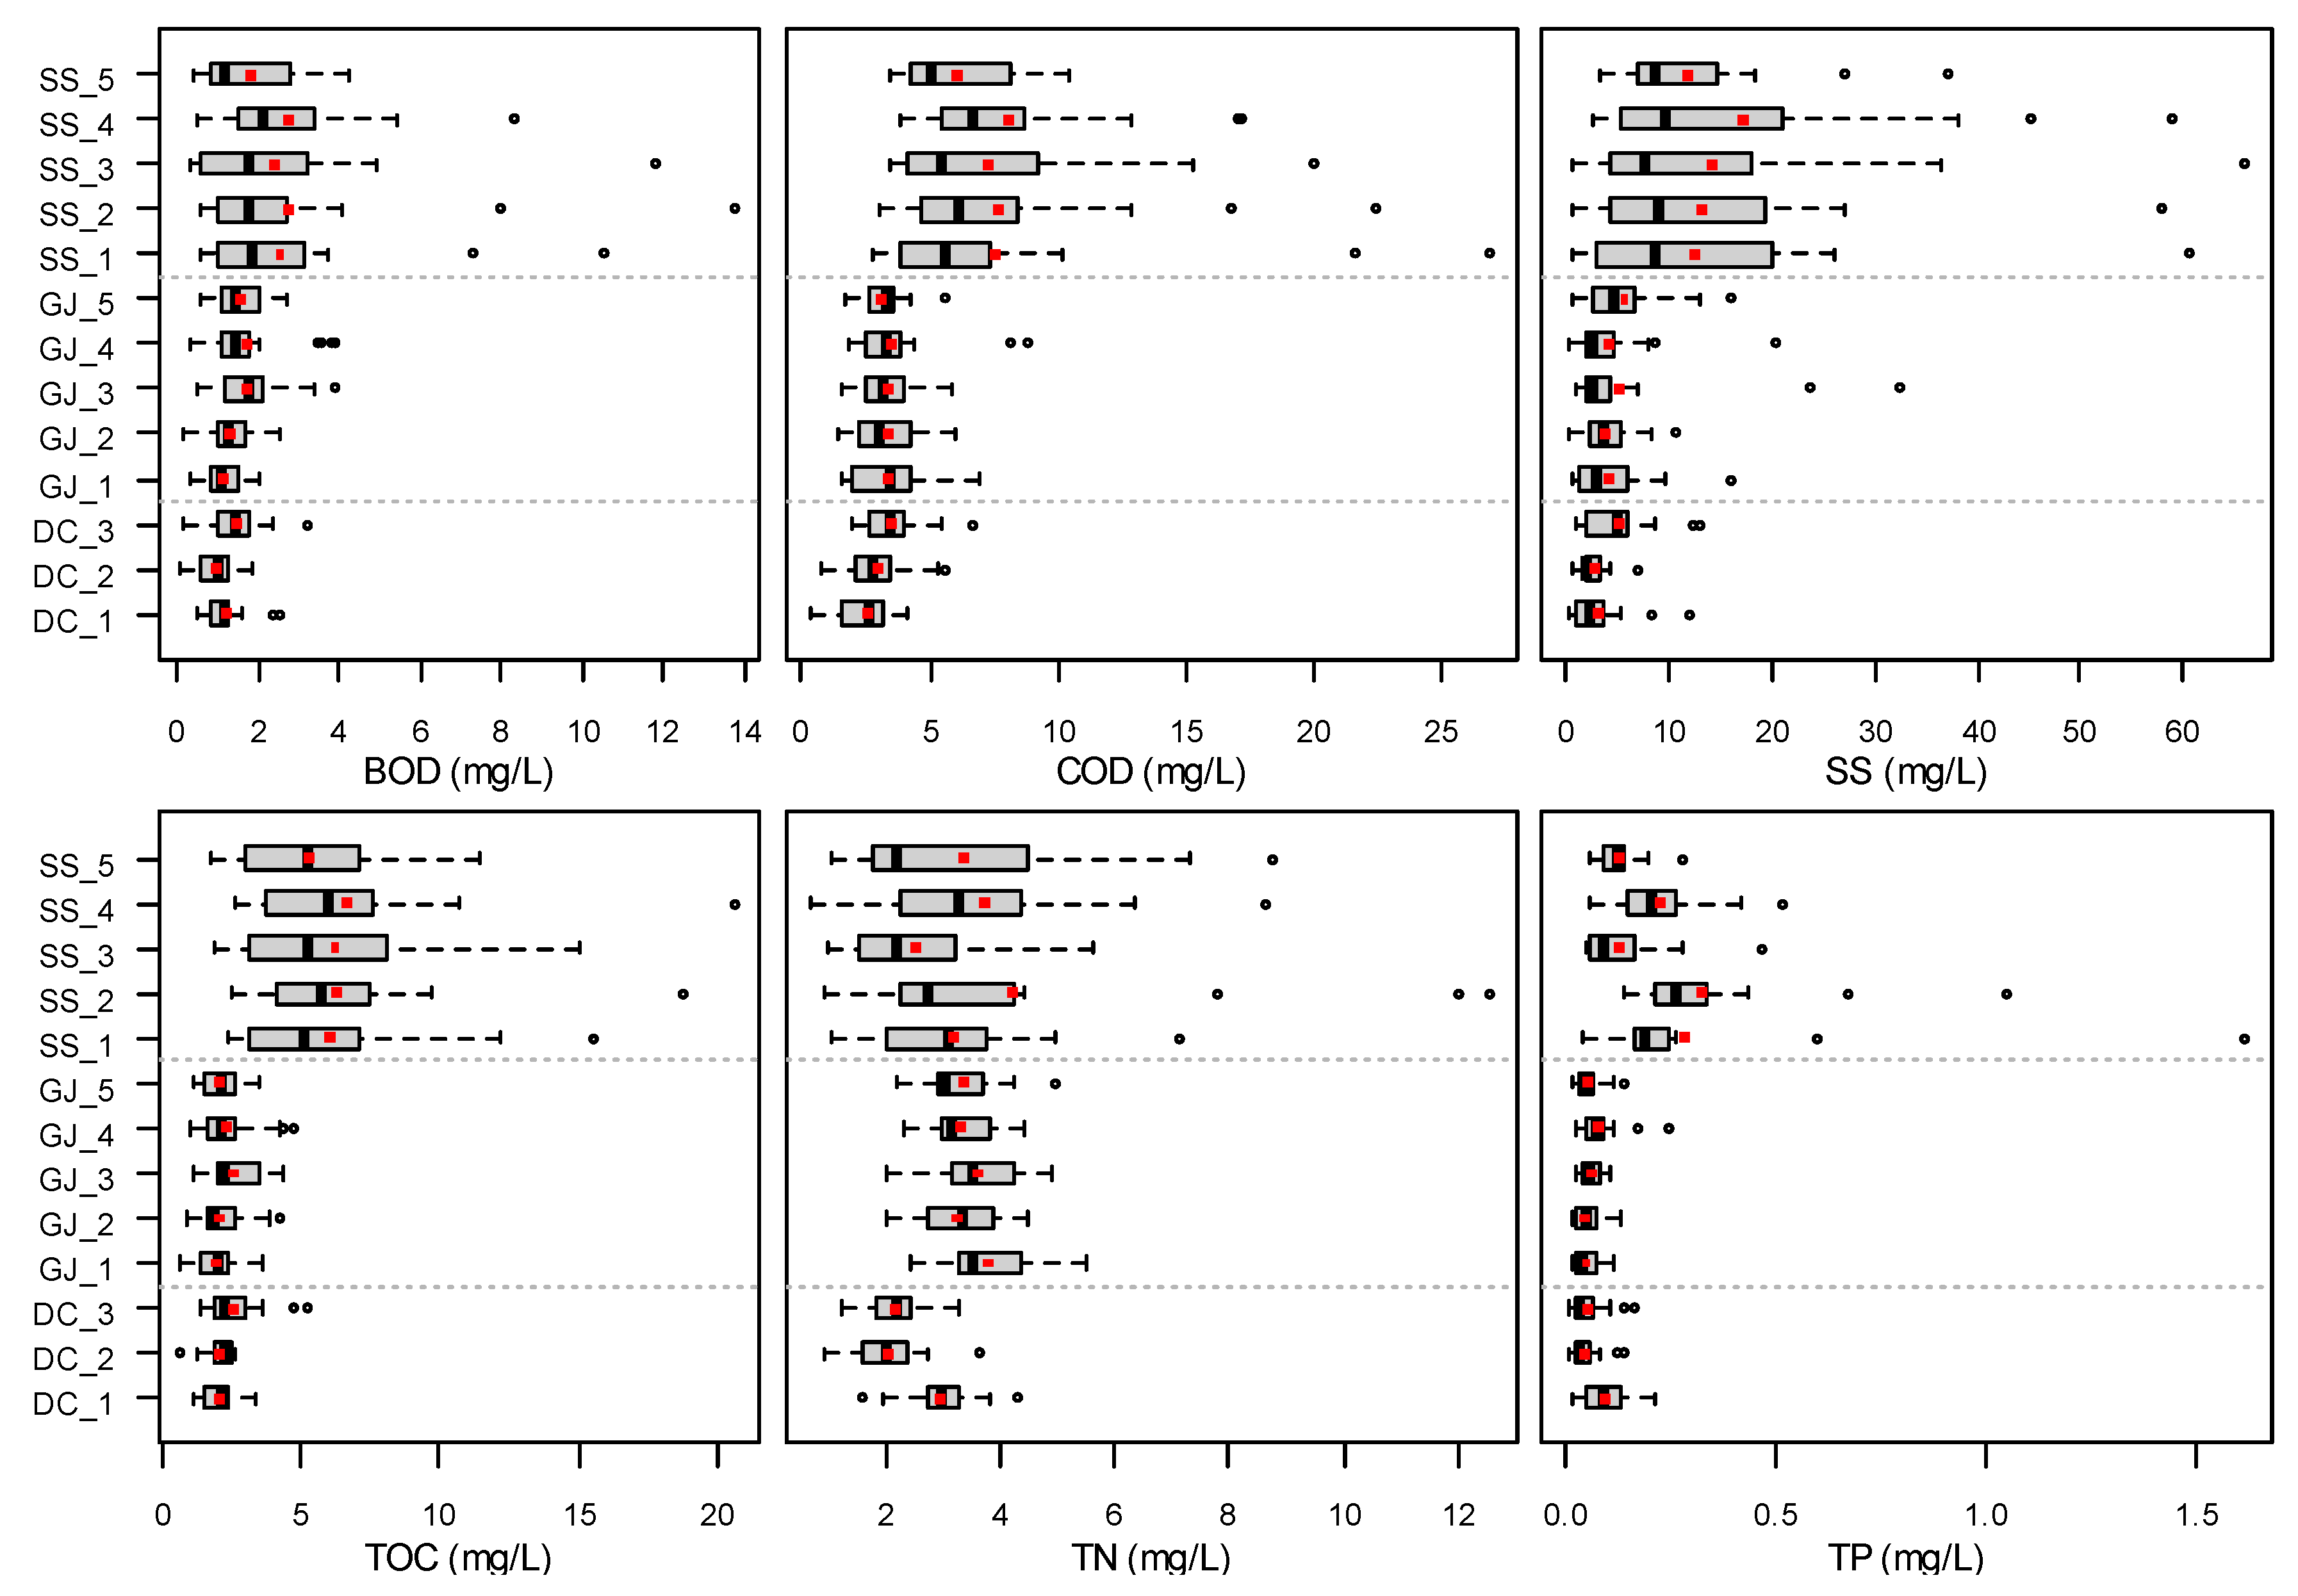
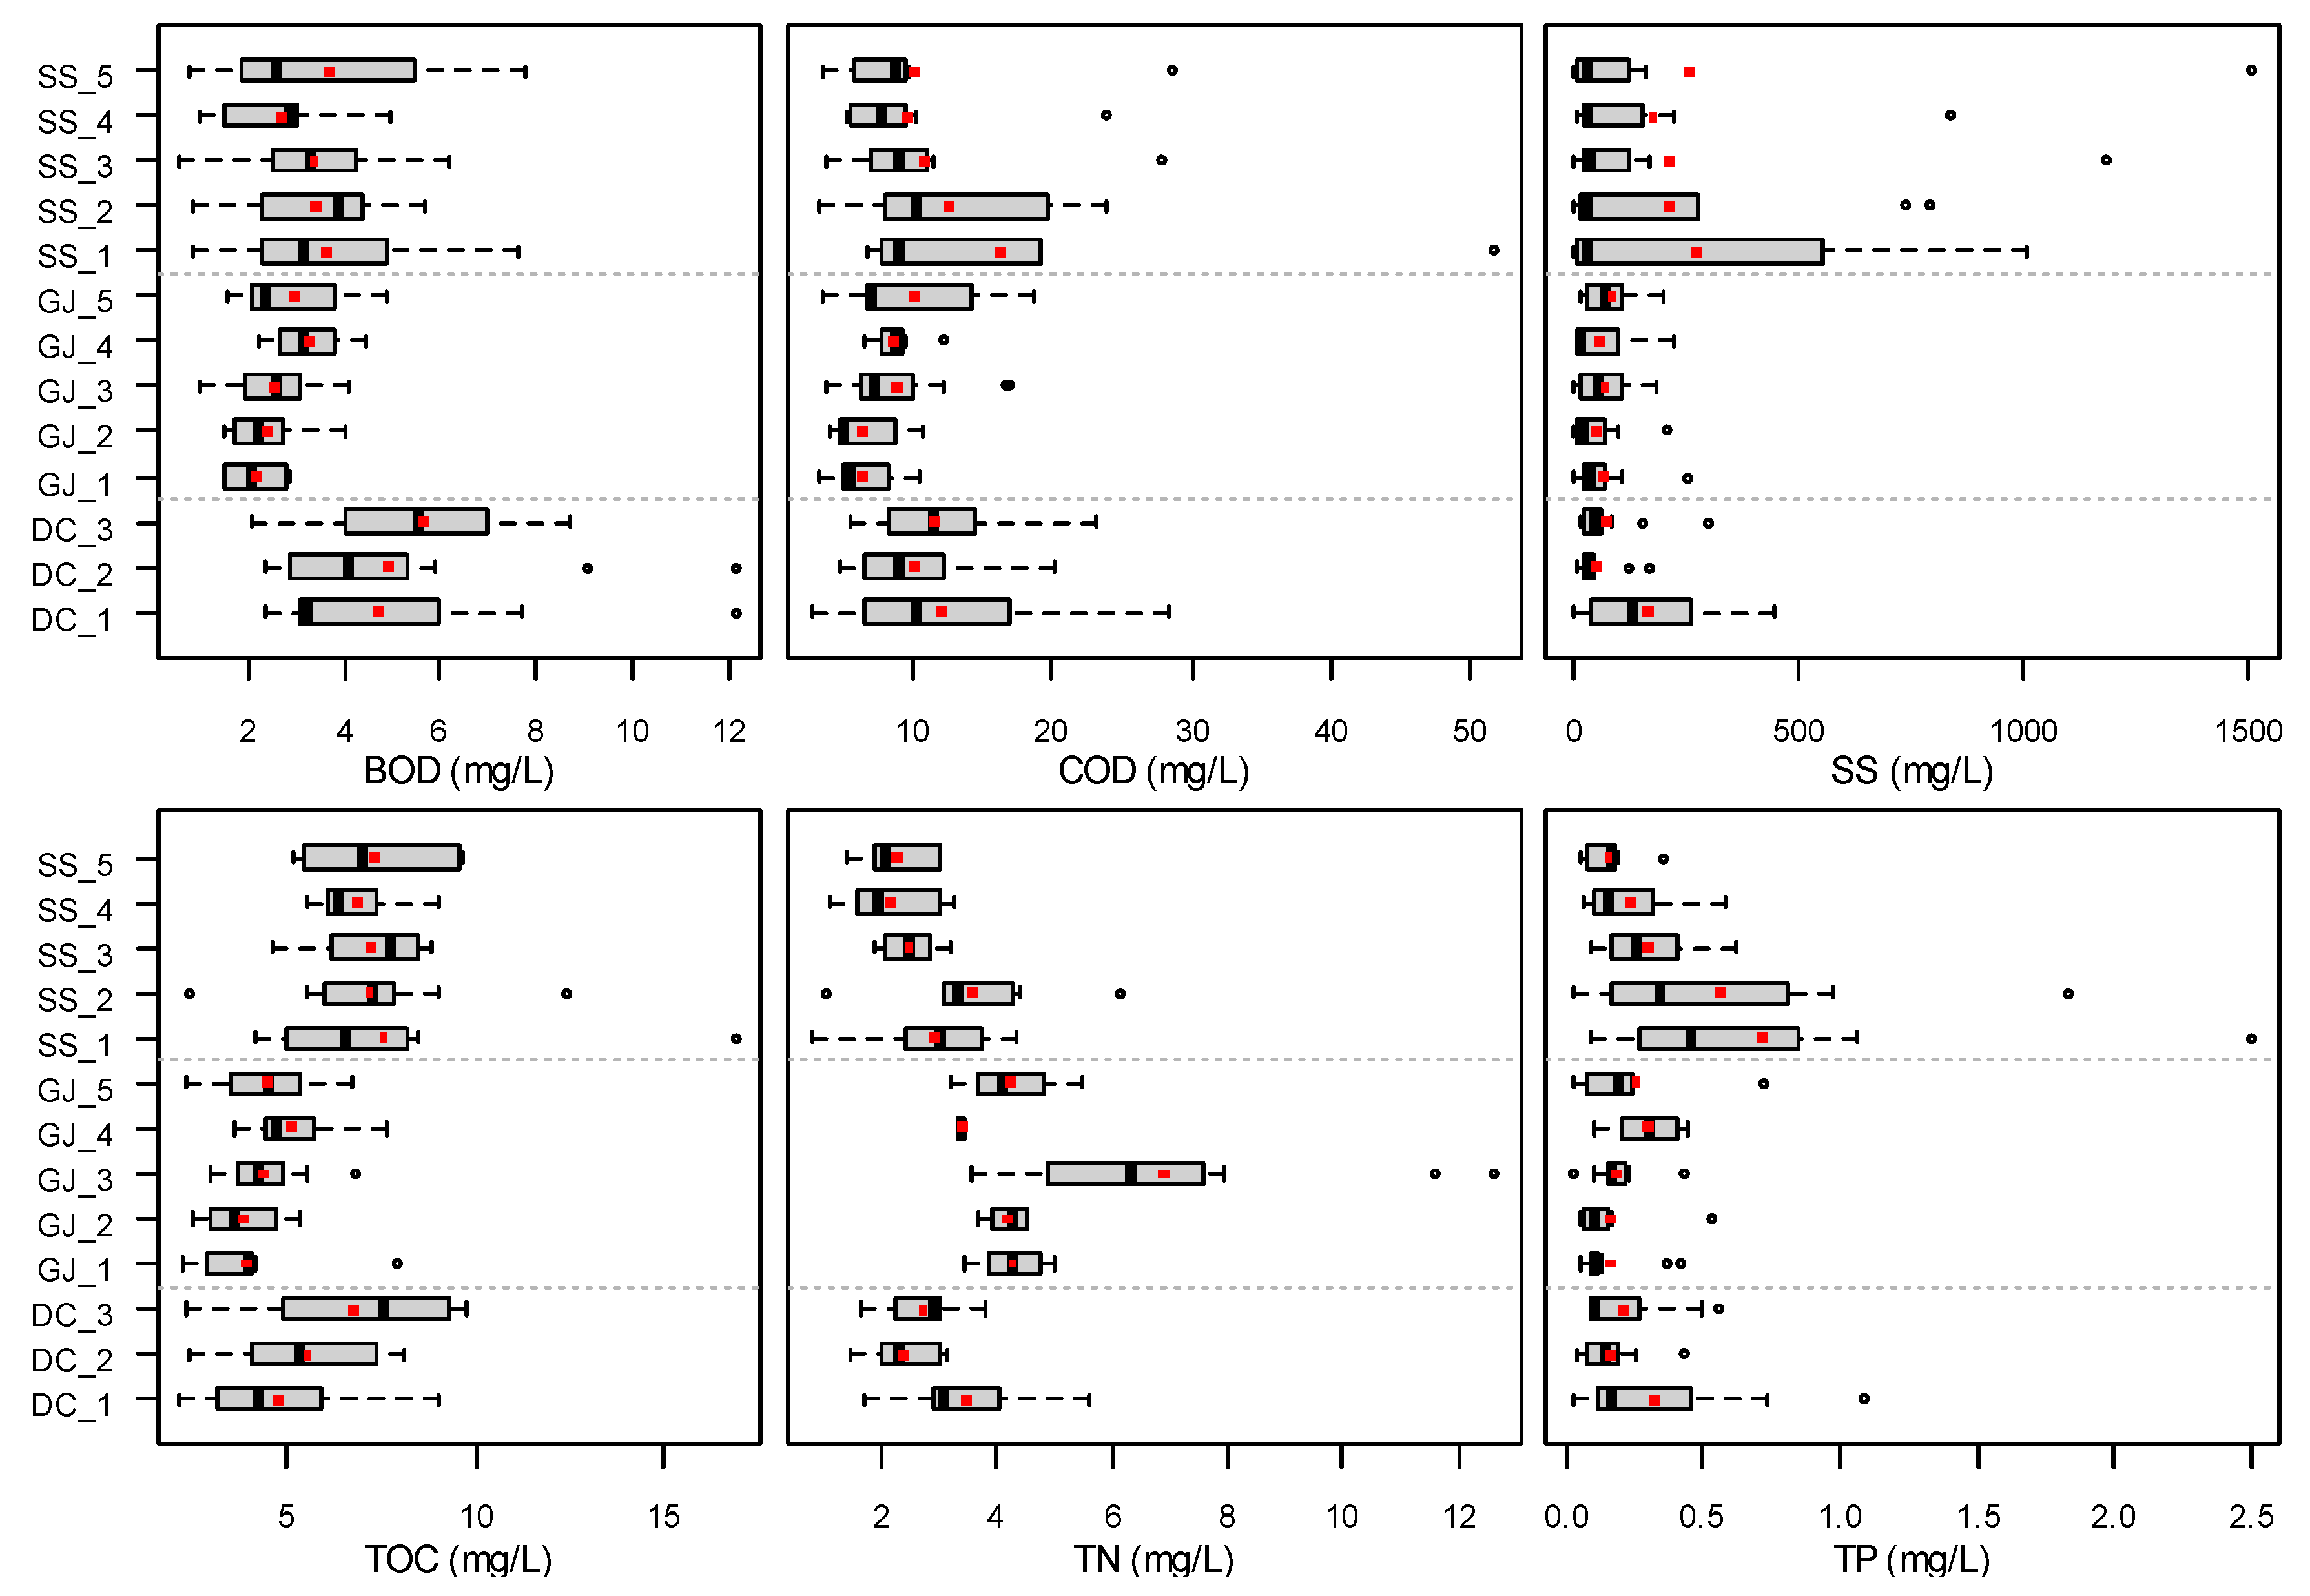
3.2.1. Water Quality
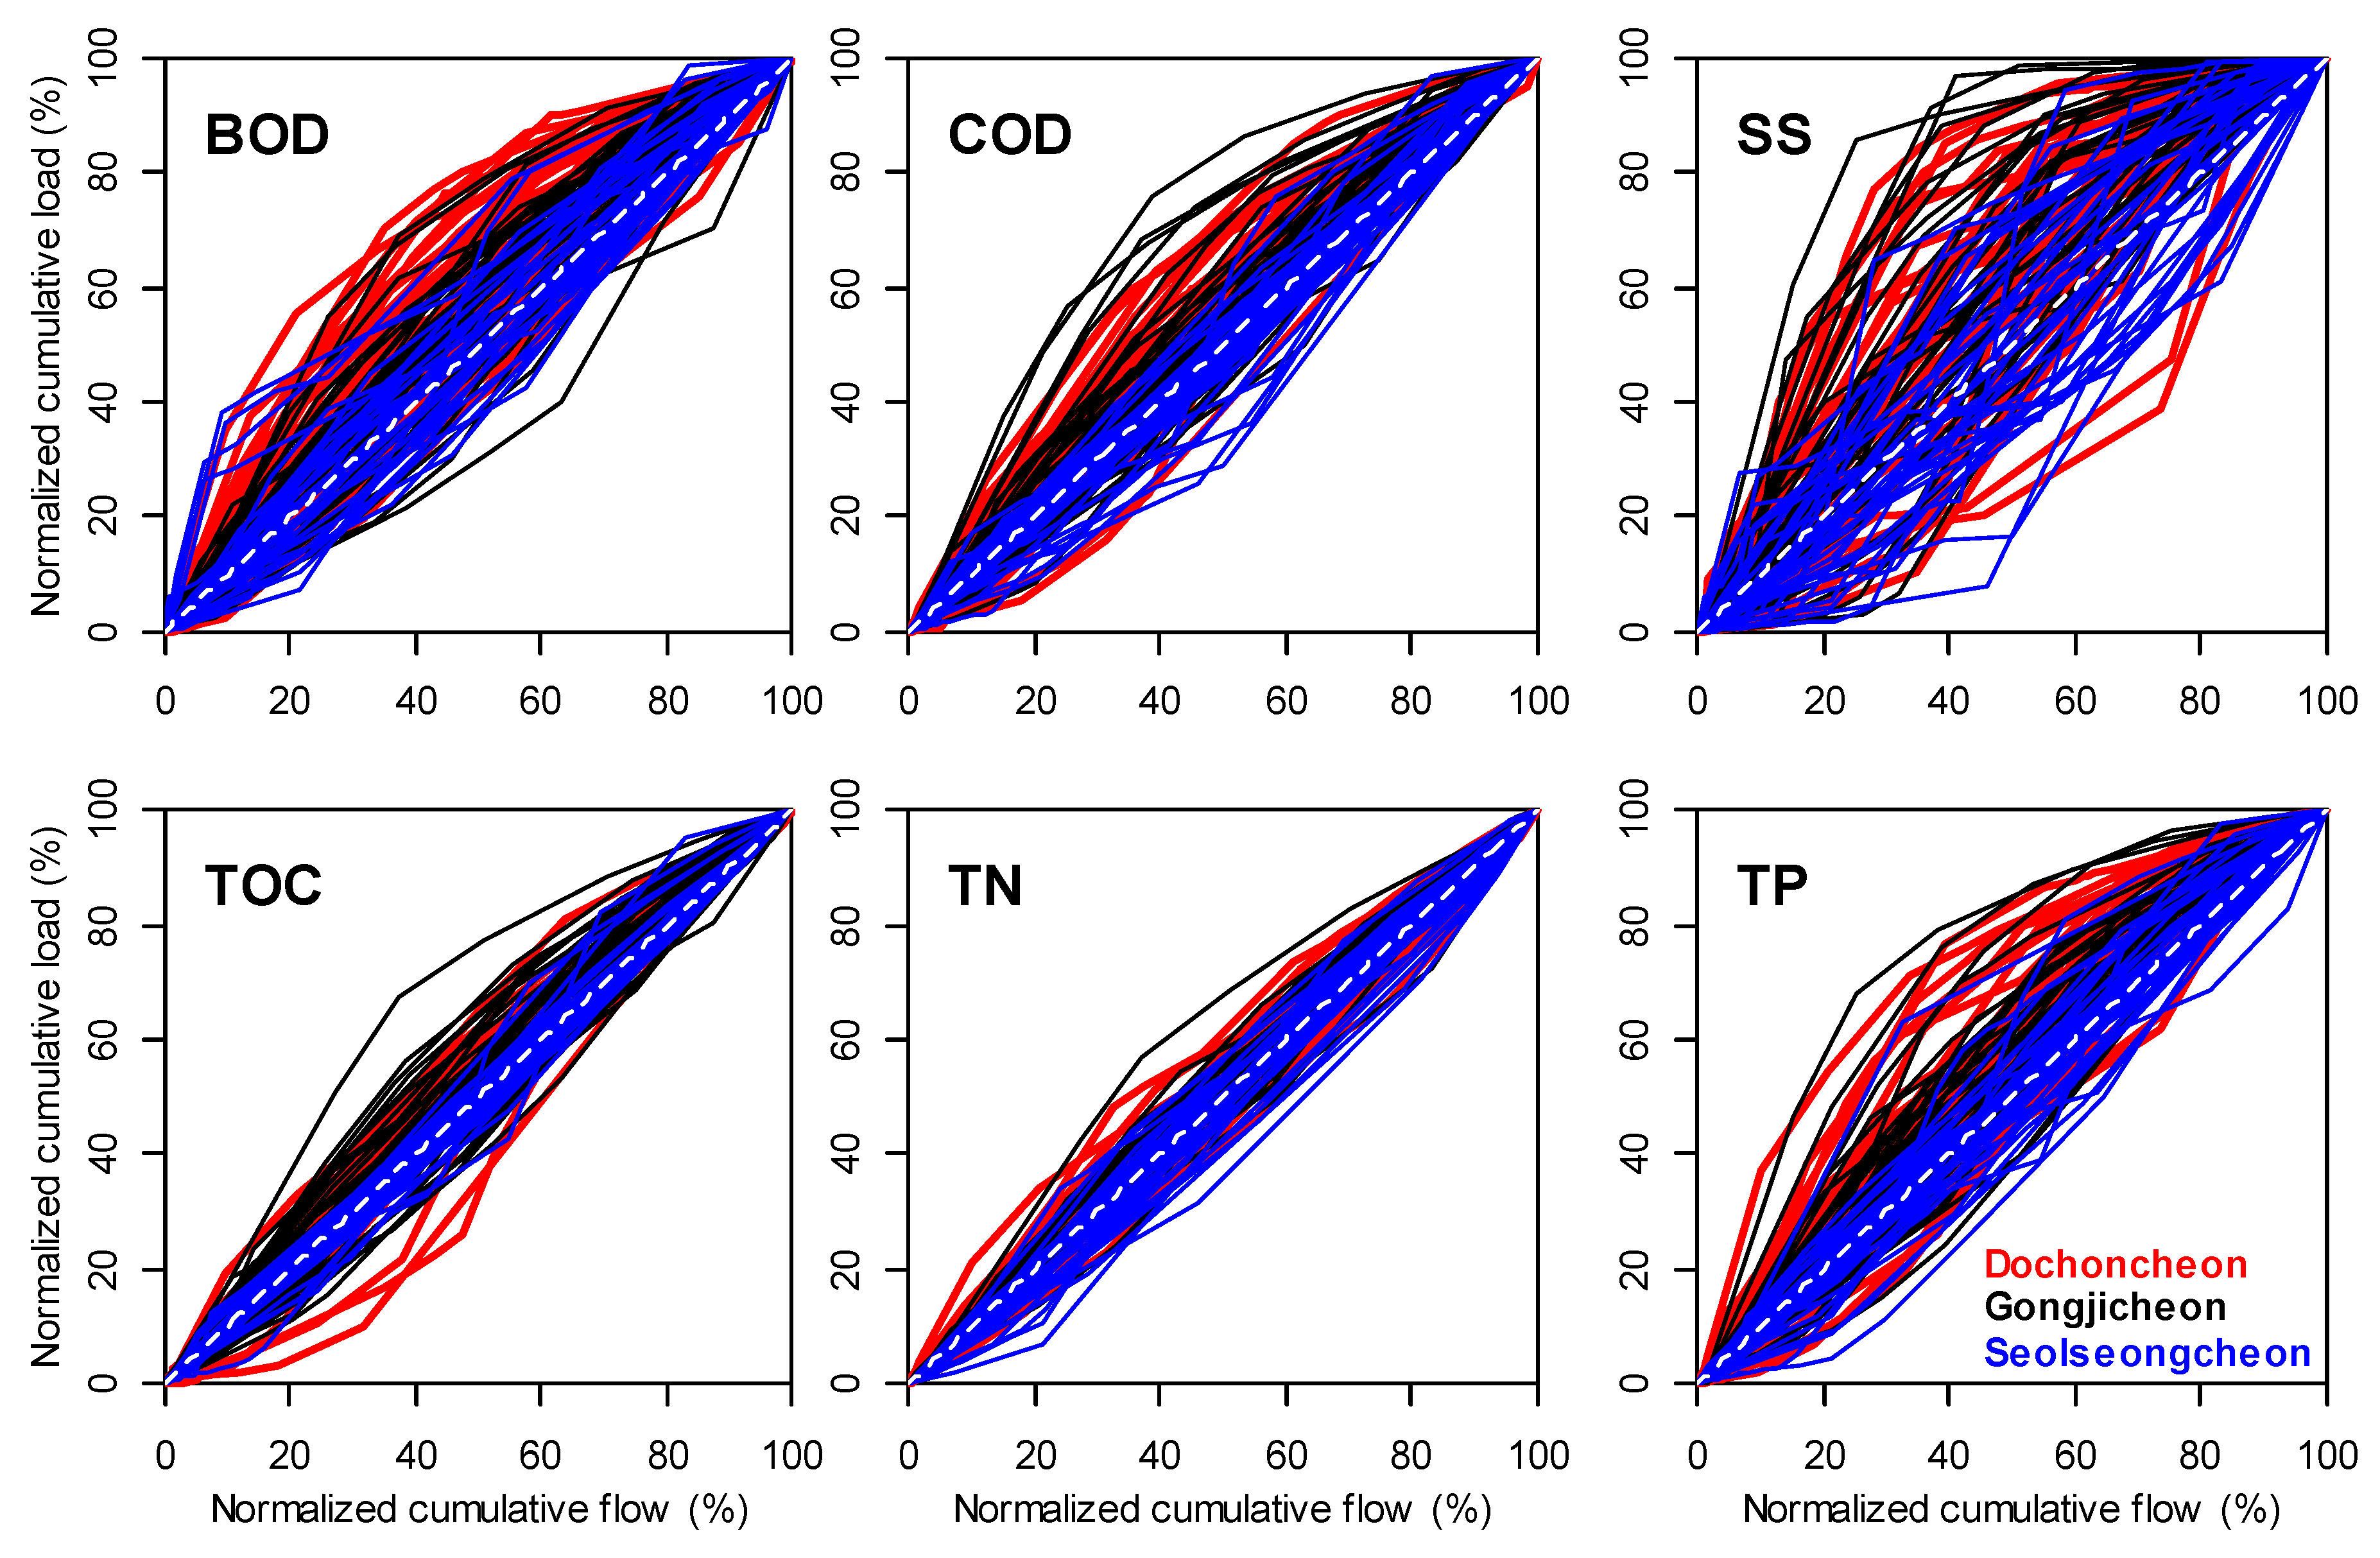
Figure 4 and Figure 5 show the variations in water quality concentration during dry days and EMC during rainy days for the monitoring sites. The mean of water quality parameters during dry days was the highest in Seolseongcheon. The mean BOD concentrations did not exceed 2.0 mg/L in Dochoncheon and Gongjicheon, but all sites in Seolseongcheon except for site SS_5 showed a mean BOD concentration greater than 2.0 mg/L. In particular, the mean BOD, COD, SS, and TOC concentrations were high at site SS_4, where sites SS_2 and SS_3 met and flowed into the main stream. The TN and TP (nutrient) concentrations were 4.215 and 0.320 mg/L, respectively, at site SS_2, located in the middle of the watershed. The water quality concentration of Seolseongcheon tended to increase significantly during the rice planting period from May to June, which may have resulted from increased fertilizer usage.
The EMC during rainy days showed that the mean BOD concentration was 4.74–5.67 mg/L in Dochoncheon, the urban river, which was higher than the other watersheds. These results were consistent with those of Mallin et al. [27]. The mean TN concentration was generally high in Gongjicheon, with a value of 6.873 mg/L at site GJ_3. COD, SS, TOC, and TP concentrations were high at site SS_1, in the upper region of Seolseongcheon.

3.2.2. First Flush

In general, pollutants show high concentrations at the start of rainfall due to the first-flush effect [28]. It is difficult to apply existing first flush formulae to other watersheds since the first flush is complex and varies widely depending on the characteristics of the watershed [29,30]. The cumulative pollutant load ratio of the monitoring data was used to identify the first flush characteristics of each water quality index. If the ratio of the cumulative pollutant loads to cumulative runoff flow is placed above the slope of the 1:1 line, there is a first flush effect [31,32,33,34,35,36]. The results of the first flush analyses of the three watersheds are shown in Figure 6, and the ratios of the loads relative to 30% of the runoff flow for each monitoring site are shown in Table 4.
As shown in Figure 5, the SS loads for most of the monitoring sites are located above the 1:1 line, but the TN loads are concentrated around the 1:1 line. Thus, the effect of the first flush was low, which is consistent with the results of previous studies [37,38]. However, as shown in Table 4, the water quality characteristics at the first flush, such as SS and COD, exhibited low values in the lower stream of Seolseongcheon and some other sites; it was therefore difficult to generalize the trend, as there were differences depending on the characteristics of the watersheds [39].
The highest BOD load appeared in Dochoncheon, and the SS load was highest on average in Gongjicheon. The remaining water quality characteristics were the highest in Gongjicheon and the lowest in Seolseongcheon. The loading resulting from the first flush were the lowest in Seolseongcheon. The SS load was high at most monitoring sites. However, at DC_3 (lower stream of Dochoncheon) and all Seolseongcheon sites except for SS_5 (lower stream of Seolseongcheon), the first flush of BOD was high.

3.3. Multivariate Statistical Analyses

3.3.1. Correlation Analysis

To evaluate the correlation between the monitoring data during rainy and dry days, correlation analyses were performed on the four hydrological and six water quality characteristics. The correlation coefficient between the characteristics in the three watersheds was 0.5 or more, and the significance level was 0.01 or less, implying a high correlation. The results are displayed in Figure 7.
The rainfall amount, rainfall intensity, and runoff flow were highly correlated with each other in all watersheds during rainy days, and the rainfall intensity was highly correlated with SS in Gongjicheon and Seolseongcheon. Antecedent dry days (ADD) showed a correlation of 0.55 with the BOD of Dochoncheon. The greater the number of ADD was, the greater the BOD concentration was. The correlation between COD, SS, and TOC was strong in all three watersheds. BOD and TP also showed a strong correlation in Dochoncheon and Seolseongcheon. SS was strongly correlated with organic matter in Seolseongcheon and TP in Dochoncheon and Gongjicheon. TOC showed a correlation of 0.5 or higher with five water quality characteristics in Seolseongcheon. TOC showed a correlation of 0.68 with BOD in Dochoncheon and a correlation of 0.53 with SS in Gongjicheon. TN showed correlations with COD and TOC in Seolseongcheon, and TP was correlated with four water quality characteristics except for SS; some showed correlations between organic matter during dry days, but there was generally no strong correlation.
COD, SS, and TOC commonly showed a strong correlation of 0.67–0.98 at a significance level (p < 0.05) at sites DC_1, GJ_1, and SS_1, which are in the upper stream of the watersheds, during rainy days, but a correlation according to land cover was not shown. Correlation between these three water quality characteristics was low, with a value of 0.45 or less at site DC_3, which is in the lower stream. COD and TOC showed a correlation of 0.95 at site GJ_5, and COD and SS were strongly correlated (r = 0.94) at site SS_5, whereas other characteristics showed a weak correlation.

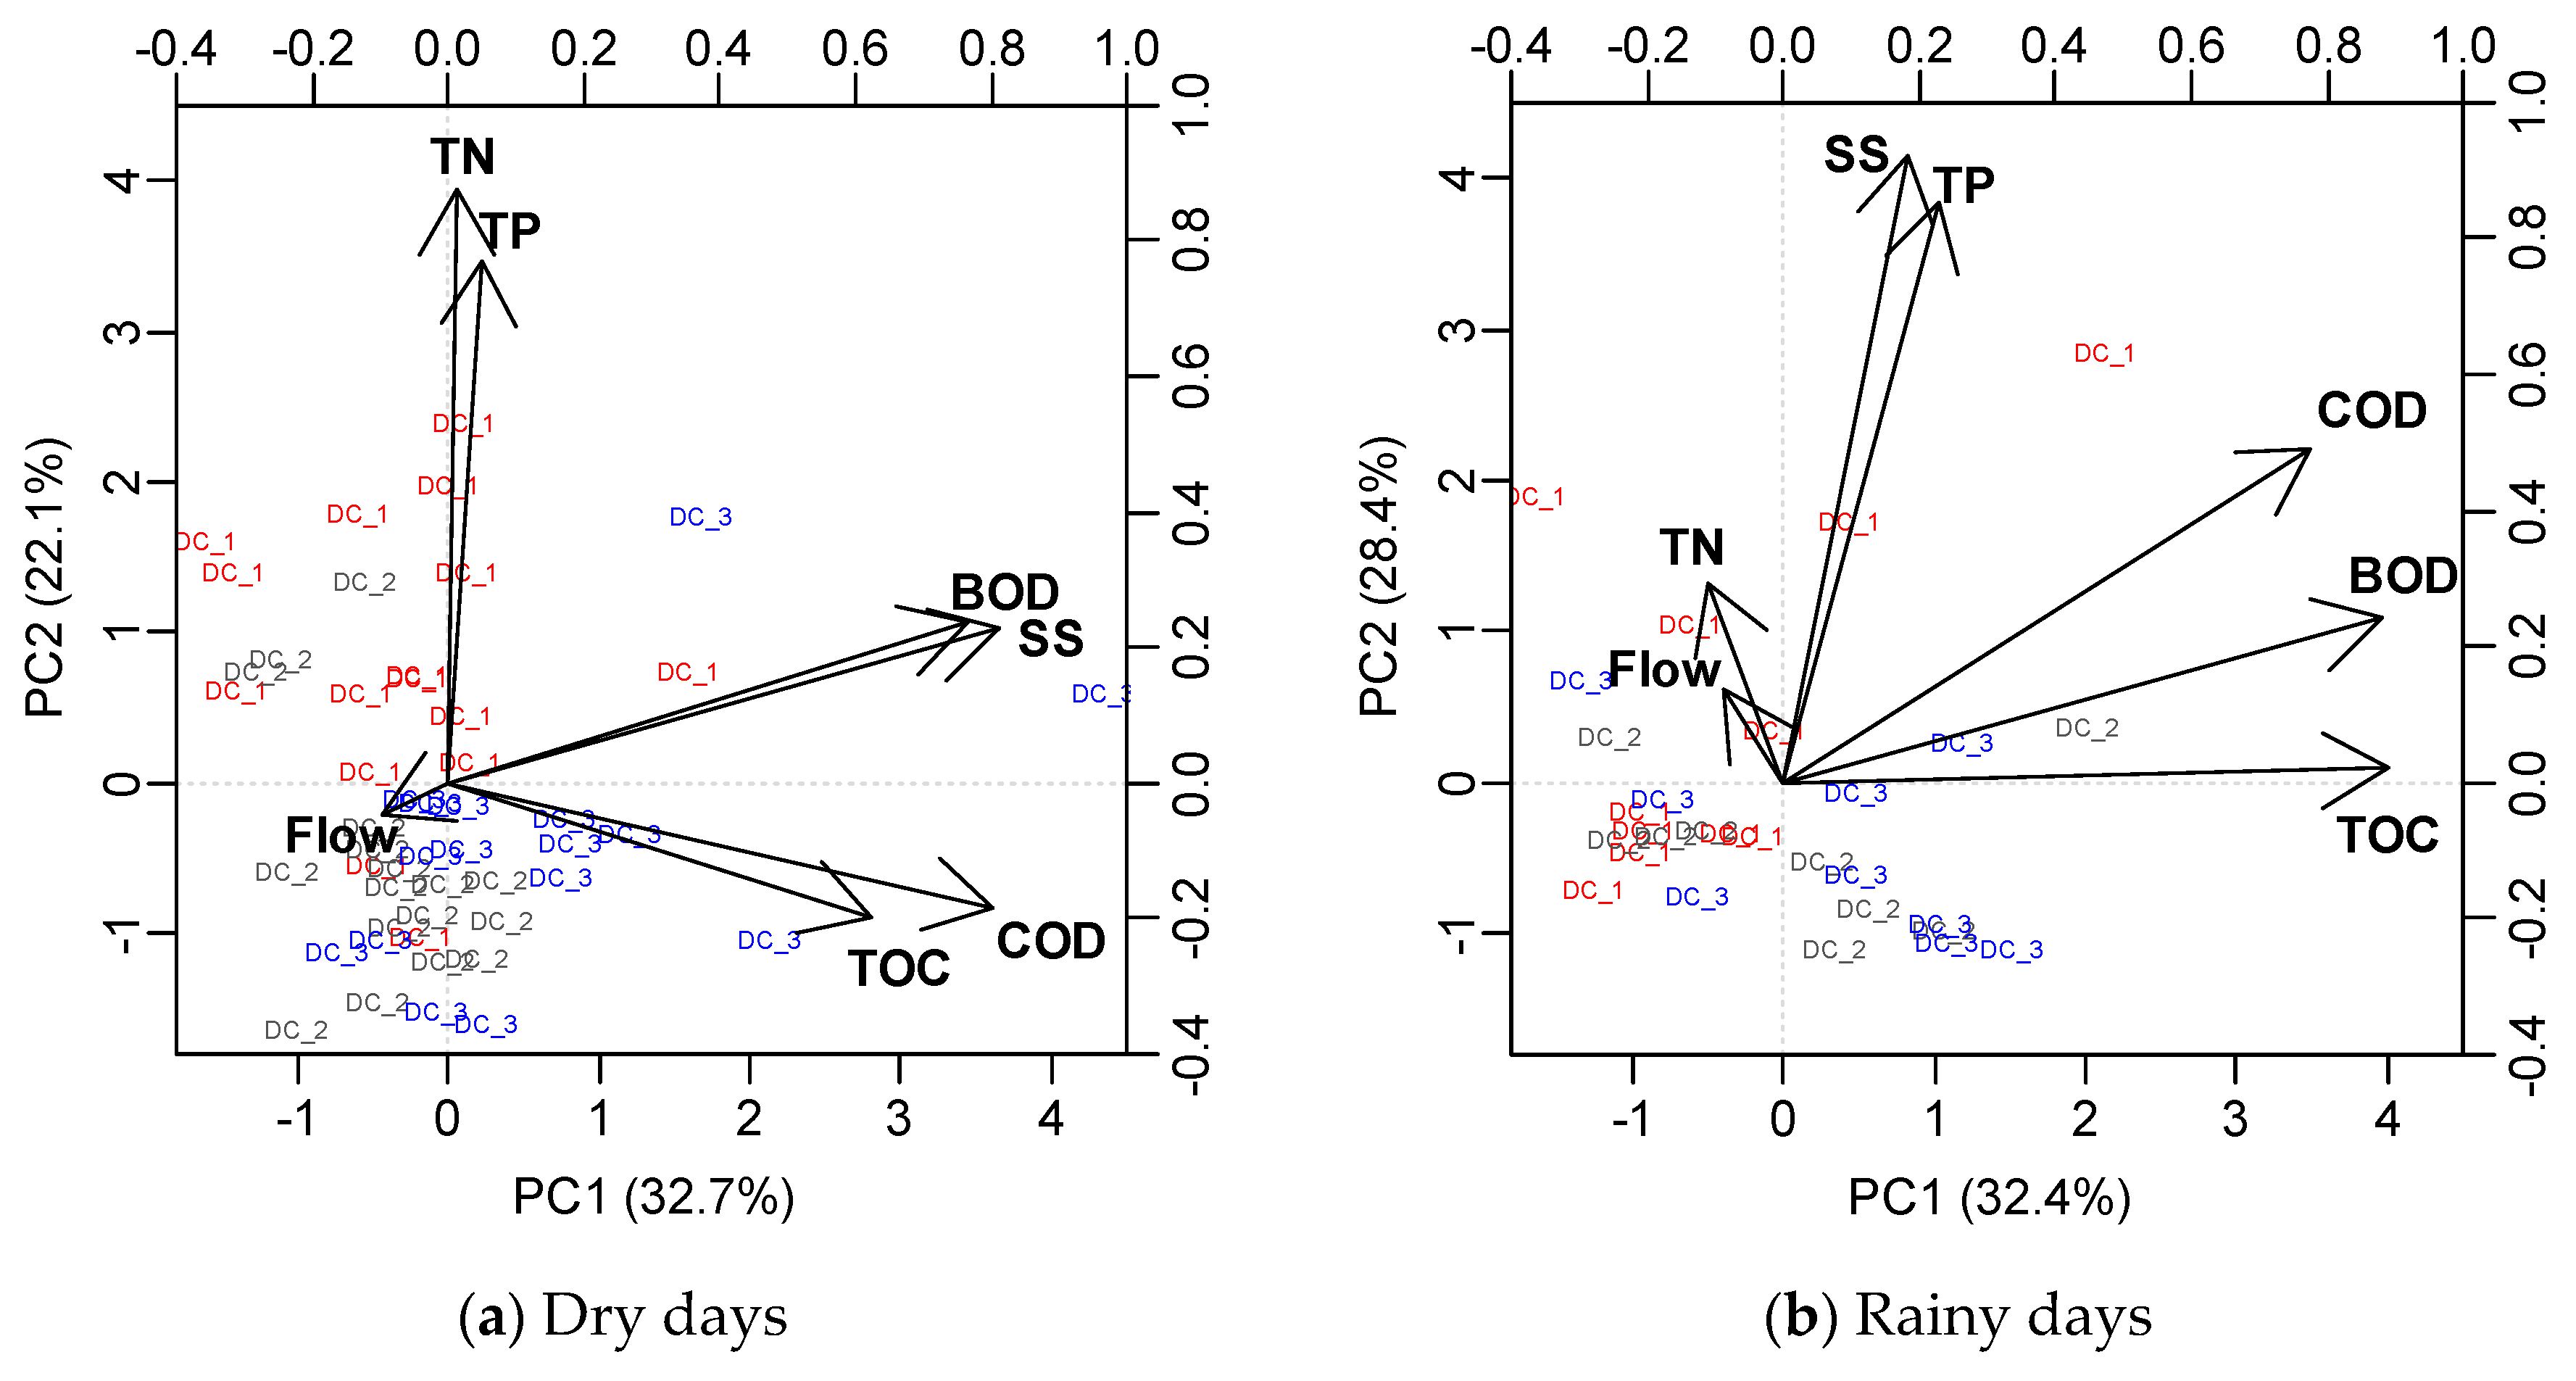
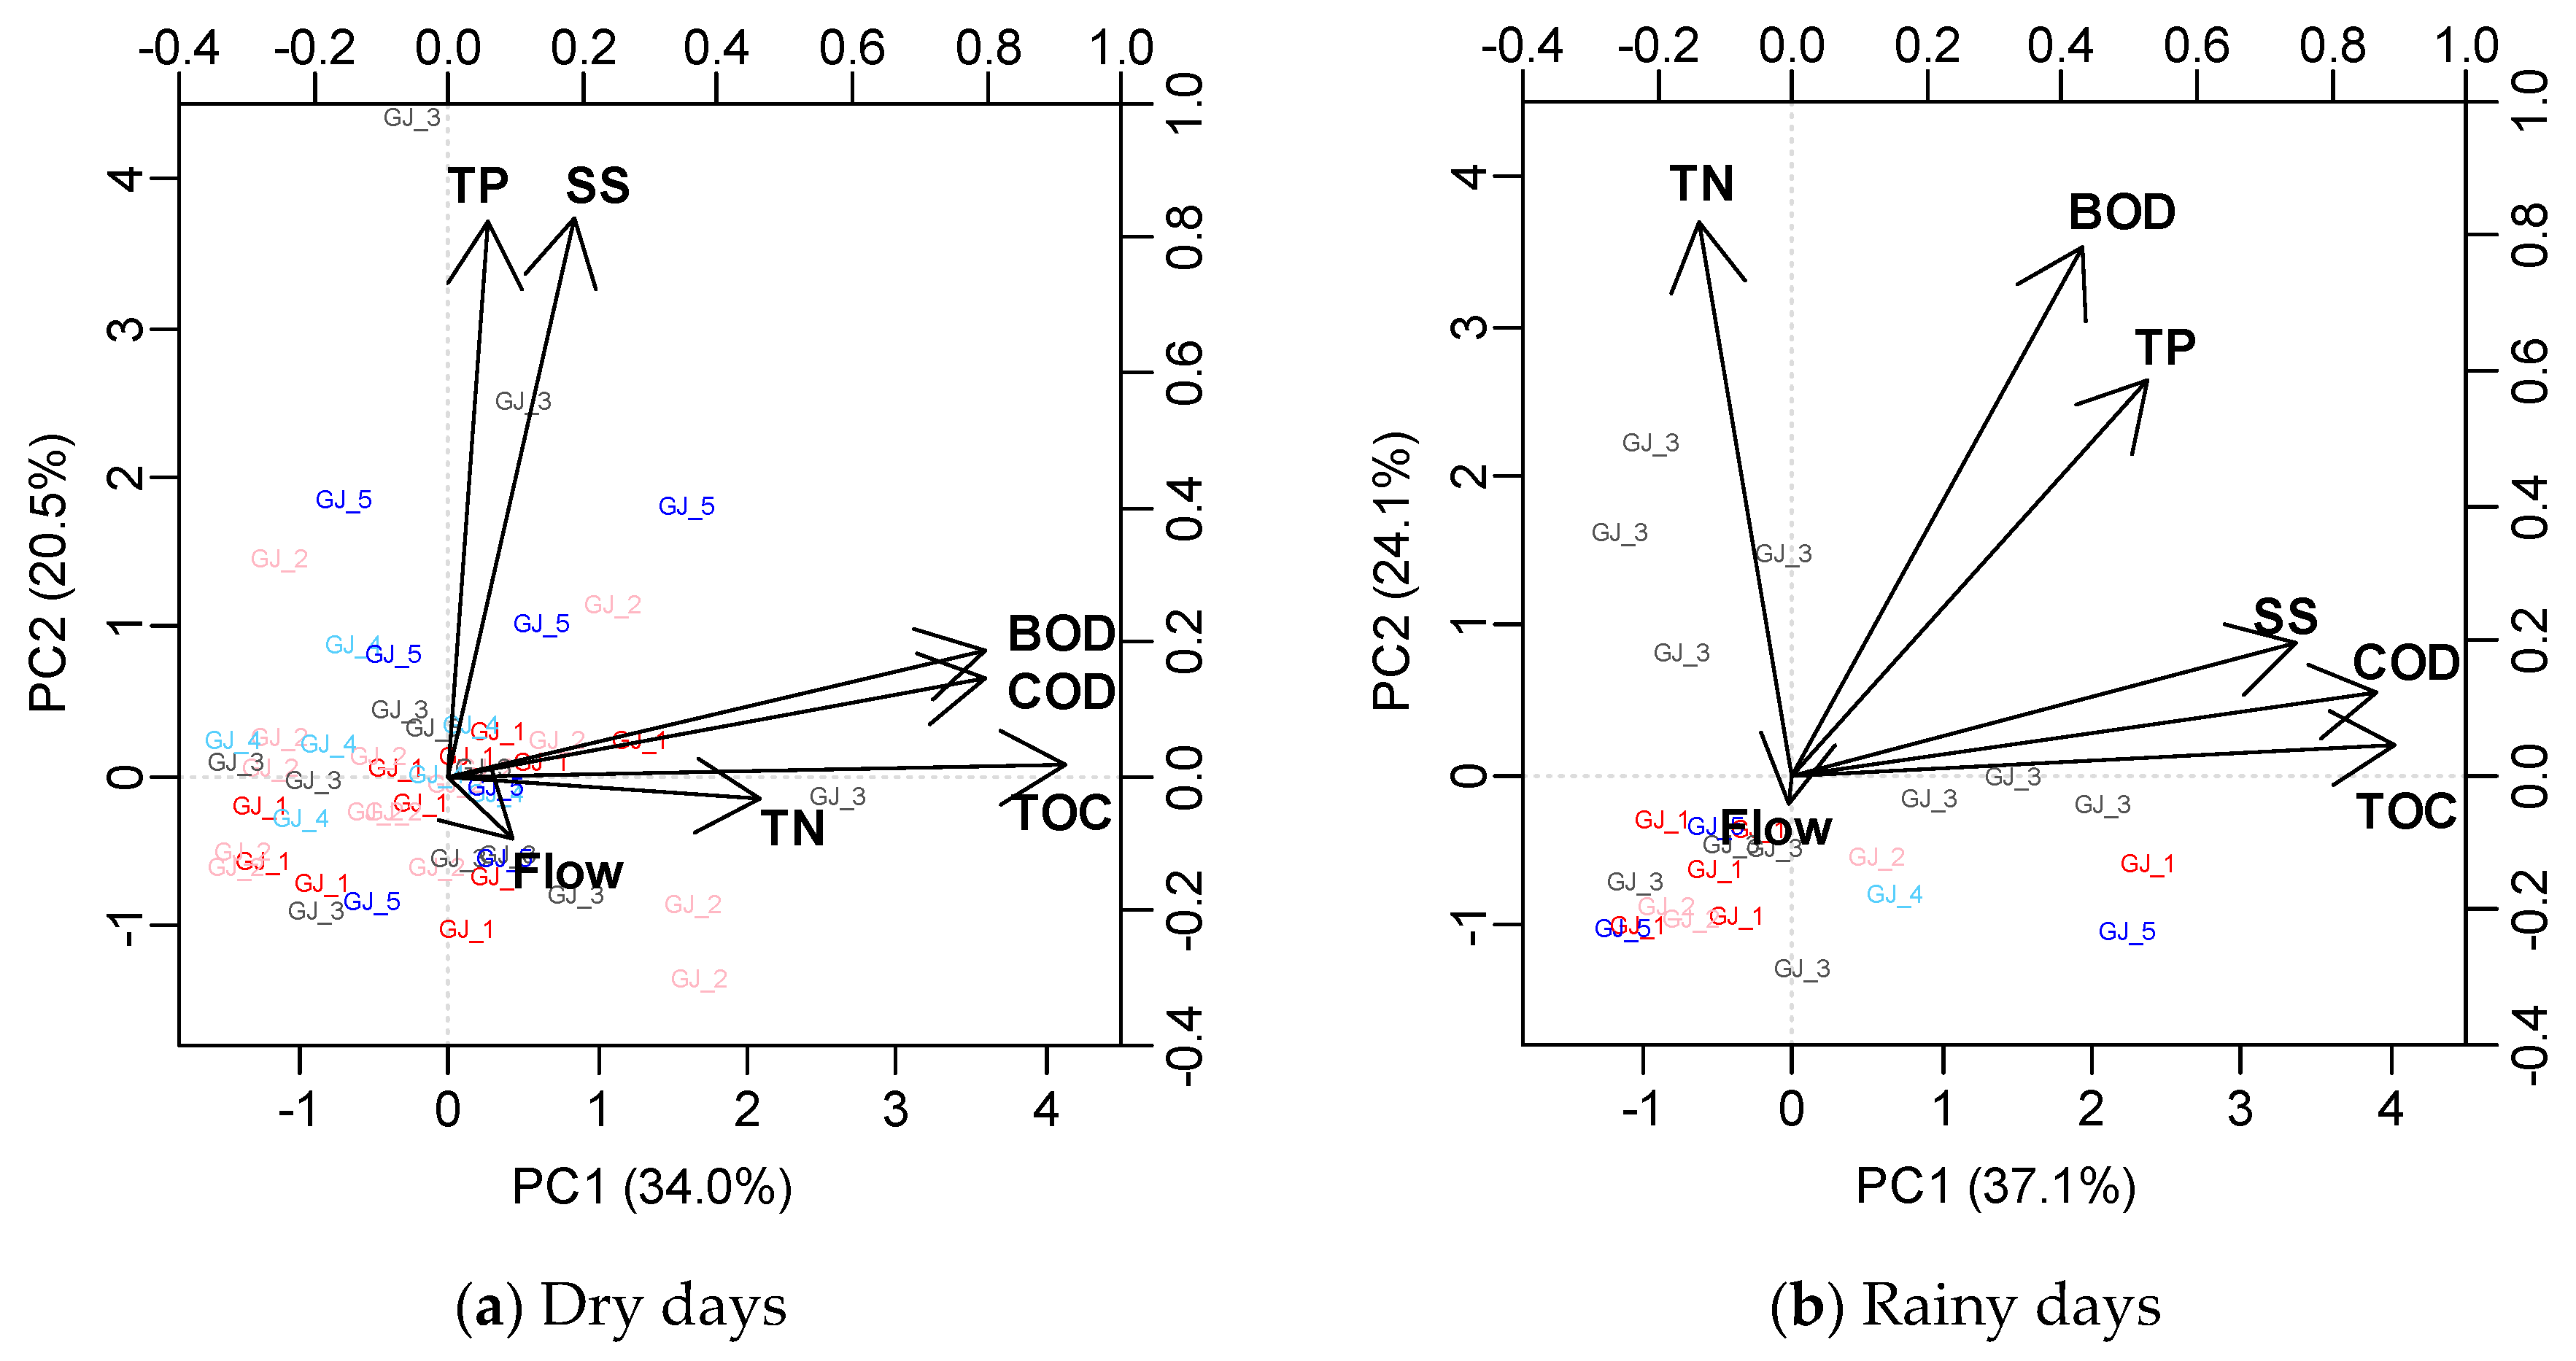
3.3.2. Factor Analysis

To understand the water quality characteristics of the non-point source pollution at the monitoring sites, the data were classified into water quality characteristic concentration during dry days and EMC during rainy days. The data were subsequently normalized, and factor analyses were carried out. Principal component analysis was used as the method of estimation. To determine the number of factors, eigenvalues of 1.0 and those using parallel analysis not exceeding the original eigenvalues (PA eigenvalues) [40] were investigated [41]. The numbers ranged from 1 to 3 for each watershed, and three factors were analyzed to compare the watersheds. In all three watersheds, the variance rate was over 70% for Factors 1–3 (described below). Table 5 shows the eigenvalues and proportion of variance explained and cumulative variance explained by principal component analysis.
As shown in Table 6 and Figure 8, Figure 9 and Figure 10, in all three watersheds, organic matter including COD and TOC showed high factor loadings for Factor 1 during dry and rainy days. Thus, pollution load factors were classified as the organic matter–related factors. Factor 2 was a nutritional factor including TN and TP in Dochoncheon during dry days. During rainy days, SS and TP showed high positive factor loadings, which confirmed the runoff characteristics from impervious areas such as roads [42]. TP was included in Factor 2, and TN was observed in Factor 3 in Gongjicheon and Seolseongcheon during dry days. SS in Gongjicheon and runoff flow in Seolseongcheon were included in Factor 2 with TP. It seemed that the water quality in Seolseongcheon watershed was affected by TP due to irrigation for rice field vegetation. On rainy days, TN and TP in Gongjicheon and Seolseongcheon, resulting from the inflow of livestock manure and fertilizer into the water systems, were classified as Factor 2. It was difficult to exactly identify the origin of non-point source pollution for the six monitored water quality characteristics. Nonetheless, the differences between the three watersheds in terms of these characteristics were determined.

3.3.3. Cluster Analysis

EMC data were constructed to group non-point source pollution of the monitoring sites according to rainfall events and water quality characteristics by considering rainfall amount, rainfall intensity, and number of ADD. Cluster analyses of the monitoring sites during rainy days were carried out. Figure 11 shows the analysis results in terms of the similarity of water quality characteristics. Based on the Sneath index [43], monitoring sites were divided into four groups. Sites DC_2 and DC_3 were classified as the same group and site DC_1 in the upper stream was classified into the same group as the five monitoring sites in Gongjicheon. Sites DC_1, GJ_1 and GJ_2 which contains relatively large forest areas with high altitude and slope were categorized into the same group. Sites SS_1, SS_2, and SS_3-5 in the upper stream were classified into the same group, since the distance between water quality characteristics was close. The distance between the Seolseongcheon sites was greater than that between the sites of other watersheds. In the lower stream of Seolseongcheon, mainly loamy soil occurs, and the altitude and slope were lower than that in the upper stream. Thus, the similarity was lower than that in other watersheds. The groups were classified according to the complex characteristics of the watersheds rather than the specific land cover ratio, such as forest, urban and agriculture. Sites DC_2 and GJ_5, which are similar in urban cover ratio, were farther than site DC_1. Sites GJ_3 and SS_1 showed similar land cover ratios, but the distance was farther than the Dochoncheon site. As a result of the cluster analysis, site DC_2, which is in the midstream of the river, and site SS_1, which is located upstream of site SS_2, could be deleted. In Gongjicheon, which was monitored at both sides of the river, sites GJ_1 and GJ_2 were combined into one site. Sites GJ_3 and GJ_4 corresponded to each side of the river, but it was difficult to combine the sites due to their location within the watershed.

4. Conclusions

In this study, non-point source pollution in three watersheds with different land cover characteristics was monitored, and EMC of non-point source pollution was calculated based on the monitoring data. The runoff characteristics of each watershed were analyzed through first flushing effect and statistical analyses.
  • The mean of water quality characteristics during dry days was the highest in Seolseongcheon. EMC during rainy days showed that BOD concentration was 4.74–5.67 mg/L on the mean in Dochoncheon, which was higher than that in the other watersheds. The TN concentration was high in Gongjicheon, and COD, SS, TOC, and TP concentrations were high in the upper stream of Seolseongcheon. Thus, it is necessary to manage BOD in the urban watershed and other water quality characteristics in complex and agricultural watersheds.
  • The first flush analysis revealed that SS had the strongest effect among the water quality factors in most monitoring sites, and TN had a low effect on the first flush. BOD showed the strongest effect on the first flush in Dochoncheon (urban watershed), and most of the factors, except for BOD, generally exhibited a strong effect on the first flush in Gongjicheon. The first flush effect was low in Seolseongcheon.
  • Analyses of the correlation between floodgate and water quality factors showed that the rainfall intensity during rainy days was strongly correlated with SS in Gongjicheon and Seolseongcheon. In Dochoncheon, the higher the number of ADD was, the higher the BOD concentration was. COD, SS, and TOC were strongly correlated in all three watersheds. There was some correlation between organic matters during dry days, but it was generally weak.
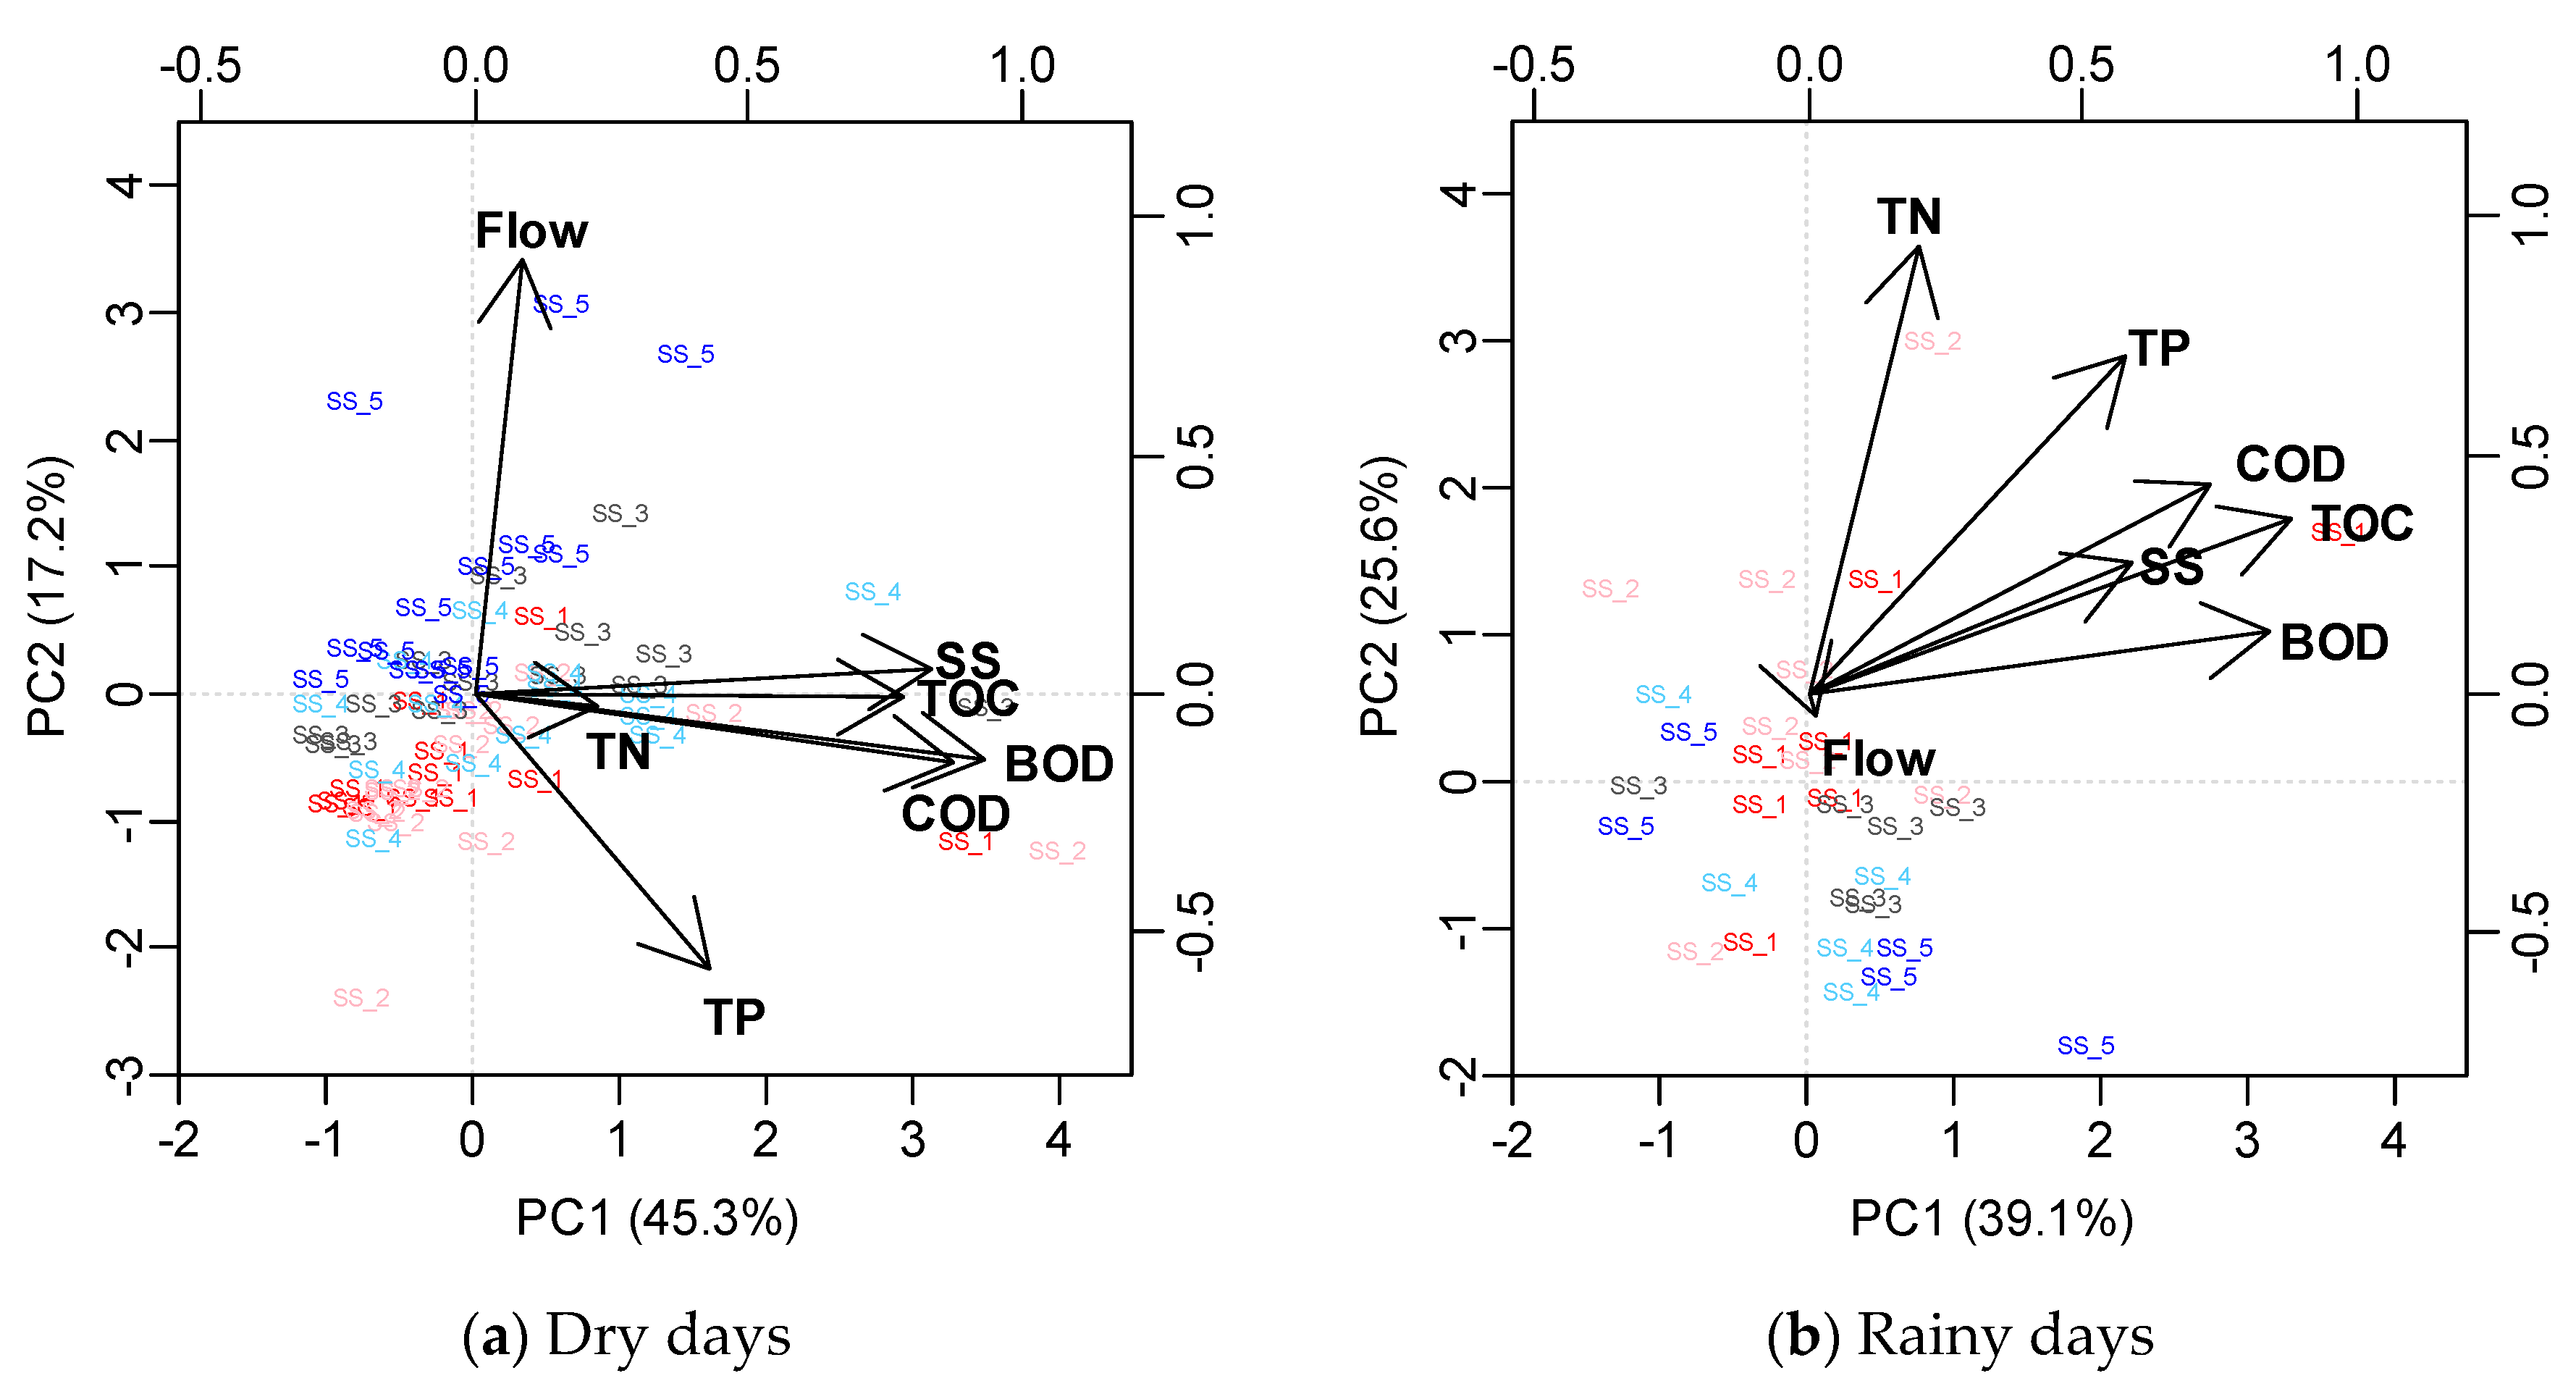
  • Organic matter including COD and TOC showed a high factor loading in Factor 1 in all three watersheds during dry and rainy days. These were consequently classified as organic matter–related factors. Nutrients including TN and TP were the second factor in Dochoncheon during dry days, but the second factor was SS and TP during rainy days. TP and TN were separately classified in Gongjicheon and Seolseongcheon during dry days but were the second factor during dry days. Thus, we confirmed the differences between watersheds in terms of the non-point pollution source.
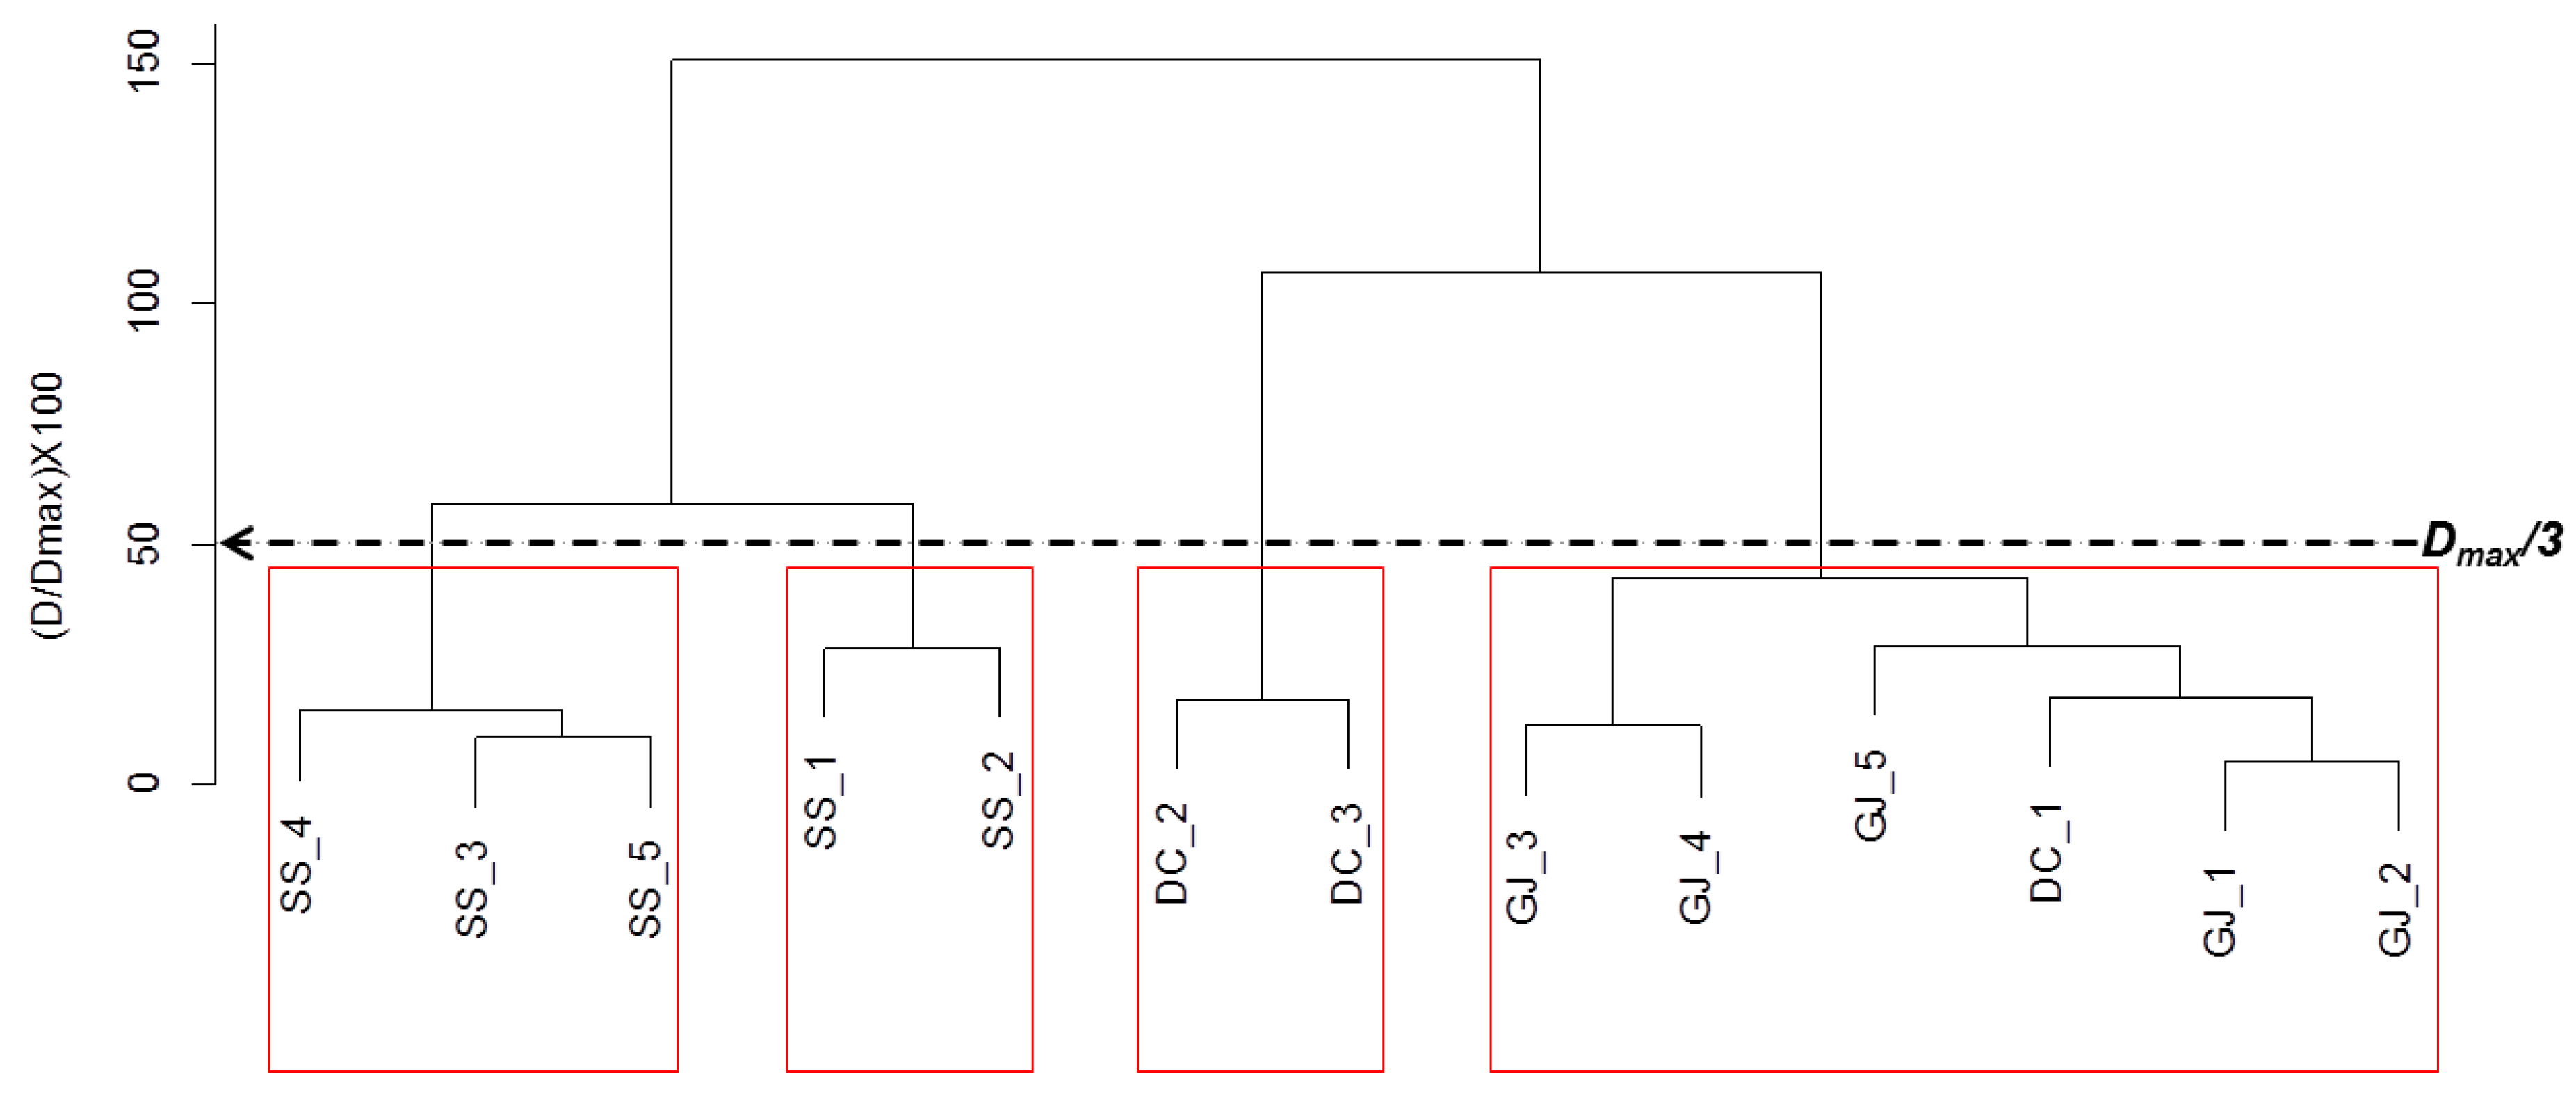
  • The cluster analysis results for grouping non-point source pollution monitoring sites and site specificity showed that the monitoring sites in Dochoncheon and Gongjicheon were similar. Furthermore, sites DC_1 and DC_2, SS_1 and SS_2 and GJ_1 and GJ_2 could be respectively combined to one site.
As a result of the comparison of non-point source pollution runoff in the three watersheds, a specific watershed factor alone such as land cover is insufficient to explain the differences in non-point source pollution runoff. For science-based management of non-point source pollution, it is necessary to obtain additional survey data that consider the climatic and, geographical factors, and the influence of major industries on water quality.

Author Contributions

Conceptualization, M.P. and Y.S.C.; Methodology, H.J.S.; Data Curation, I.S., C.G.Y. and J.D.C.; Writing-Original Draft Preparation, M.P.; Writing-Review & Editing, H.J.S. and I.S.; Supervision, S.J.Y.

Funding

This research was funded by the Han Gang Watershed Management Committee (HGWMC) of the Republic of Korea (NIER-2017-05-01-018, Integrated monitoring and management plan for non-point source pollution).

Conflicts of Interest

The authors declare no conflict of interest.

References

  1. Choi, G.C.; Lee, J.H.; Yu, J.C.; Ju, D.J.; Park, J.J. Laboratory assessment of biofilm process and its microbial characteristics for treating nonpoint source pollution. Korean J. Chem. Eng. 2011, 28, 1207–1213. [Google Scholar] [CrossRef]
  2. Liu, R.M.; Wang, J.W.; Shi, J.H.; Chen, Y.X.; Sun, C.C.; Zhang, P.P.; Shen, Z.Y. Runoff characteristics and nutrient loss mechanism from plain farmland under simulated rainfall conditions. Sci. Total. Environ. 2014, 468, 1069–1077. [Google Scholar] [CrossRef]
  3. Arnold, C.L.; Gibbons, C.J. Impervious Surface Coverage: The Emergence of a Key Environmental Indicator. JAPA 1996, 62, 243–258. [Google Scholar] [CrossRef]
  4. Xiang, C.; Wang, Y.; Liu, H. A scientometrics review on nonpoint source pollution research. Ecol. Eng. 2017, 99, 400–408. [Google Scholar]
  5. Ribaudo, M.O.; Heimlich, R.; Claassen, R.; Peters, M. Least-cost management of nonpoint source pollution: Source reduction versus interception strategies for controlling nitrogen loss in the Mississippi Basin. Ecol. Econ. 2001, 37, 183–197. [Google Scholar] [CrossRef]
  6. Grismer, M.E.; O’Geen, A.T.; Lewis, D. Vegetative Filter Strips for Nonpoint Source Pollution Control in Agriculture; ANR Publication 8195; University of California, Division of Agricultural and Natural Resources: St Davis, CA, USA, 2006. [Google Scholar]
  7. Kaushal, S.S.; Groffman, P.M.; Band, L.E.; Elliott, E.M.; Shields, C.A.; Kendall, C. Tracking nonpoint source nitrogen pollution in human-impacted watersheds. Environ. Sci. Technol. 2011, 45, 8225–8232. [Google Scholar] [CrossRef]
  8. Liu, J.; Fu, B.; Wang, Y.K.; Xu, P. Estimation and evaluation of non-point source pollutants loads in mountainous area of Sichuan. Trans. Chin. Soc. Agric. Eng. 2016, 32, 218–225. [Google Scholar]
  9. Zhang, W.Q.; Jin, X.; Liu, D.; Lang, C.; Shan, B.Q. Temporal and spatial variation of nitrogen and phosphorus and eutrophication assessment for a typical arid river—Fuyang River in northern China. J. Environ. Sci. 2017, 55, 41–48. [Google Scholar] [CrossRef]
  10. Adu, J.T.; Kumarasamy, M.V. Assessing non-point source pollution models: A review. Pol. J. Environ. Stud. 2018, 27, 1913–1922. [Google Scholar] [CrossRef]
  11. Borah, D.K.; Bera, M. Watershed-scale hydrologic and nonpoint-source pollution models: Review of mathematical bases. Trans ASAE 2003, 46, 1553–1566. [Google Scholar] [CrossRef]
  12. Ongley, E.D.; Xiaolan, Z.; Tao, Y. Current status of agricultural and rural non-point source pollution assessment in China. Environ. Pollut. 2010, 158, 1159–1168. [Google Scholar] [CrossRef]
  13. Long, H.L.; Liu, Y.S. Rural restructuring in China. J. Rural Stud. 2016, 47, 387–391. [Google Scholar] [CrossRef]
  14. National Institute of Environmental Research. Technical Guideline for TMDLs in Korea; National Institute of Environmental Research: Incheon, Korea, 2014. [Google Scholar]
  15. Shrestha, S.; Kazama, F. Assessment of surface water quality using multivariate statistical techniques: A case study of the Fuji river basin, Japan. Environ. Model. Softw. 2007, 22, 464–475. [Google Scholar] [CrossRef]
  16. Varekar, V.; Karmakar, S.; Jha, R.; Ghosh, N.C. Design of sampling locations for river water quality monitoring considering seasonal variation of point and diffuse pollution loads. Environ. Monit. Assess. 2015, 187, 376. [Google Scholar] [CrossRef]
  17. Barakat, A.; El Baghdadi, M.; Meddah, R.; Rais, J.; Nadem, S.; Afdali, M. Evaluation of water quality in open channels flowing through Beni-Mellal City (Morocco). J. Water Land Dev. 2013, 19, 3–11. [Google Scholar] [CrossRef]
  18. Khan, M.Y.A.; Gani, K.M.; Chakrapani, G.J. Assessment of surface water quality and its spatial variation. A case study of Ramganga River, Ganga Basin, India. Arab. J. Geosci. 2016, 9, 28. [Google Scholar] [CrossRef]
  19. Ministry of the Environment. Environmental geographic information system. Available online: https://egis.me.go.kr (accessed on 7 May 2019).
  20. Rural Development Administration. Korean soil information system. Available online: https://soil.rda.go.kr/ (accessed on 7 May 2019).
  21. Hair, J.F.; Bush, R.P.; Ortinau, D.J. Studyguide for Marketing Research within a Changing Information Environment, 2nd ed.; McGraw-Hill: New York, NY, USA, 2002; p. 567. ISBN 0-07-246757-6. [Google Scholar]
  22. Rokach, L.; Maimon, O. Clustering methods. In Data Mining and Knowledge Discovery Handbook; Maimon, O., Rokach, L., Eds.; Springer: Boston, MA, USA, 2005; pp. 321–352. ISBN 978-0-387-24435-8. [Google Scholar]
  23. Ward, J.H., Jr. Hierarchical grouping to optimize an objective function. J. Am. Stat. Assoc. 1963, 58, 236–244. [Google Scholar] [CrossRef]
  24. Johnson, R.A.; Wichern, D.W. Applied Multivariate Statistical Analysis, 6th ed.; Pearson Prentice Hall: London, UK, 2007; pp. 488–490. ISBN 978-0131877153. [Google Scholar]
  25. National Institute of Environmental Research. Survey Method of Rainfall Runoff; National Institute of Environmental Research: Incheon, Korea, 2012.
  26. Huber, W.C. Contaminant transport in surface water. In Handbook of Hydrology; Maidment, D.R., Ed.; McGraw-Hill: New York, NY, USA, 1993; pp. 14.11–14.50. ISBN 978-0070397323. [Google Scholar]
  27. Mallin, M.A.; Johnson, V.L.; Ensign, S.H. Comparative impacts of stormwater runoff on water quality of an urban, a suburban, and a rural stream. Environ. Monit. Assess. 2009, 159, 475–491. [Google Scholar] [CrossRef]
  28. Gupta, K.; Saul, A.J. Specific relationships for the first flush load in combined sewer flows. Water Resour. 1996, 30, 1244–1252. [Google Scholar] [CrossRef]
  29. Deletic, A. The first flush load of urban surface runoff. Water Res. 1998, 32, 2462–2470. [Google Scholar] [CrossRef]
  30. Maniquiz, M.C.; Choi, J.Y.; Lee, S.Y.; Cho, H.J.; Kim, L.H. Appropriate methods in determining the event mean concentration and pollutant removal efficiency of a best management practice. Environ. Eng. Res. 2010, 15, 215–223. [Google Scholar] [CrossRef]
  31. Geiger, W. Flushing effects in combined sewer systems. In Proceedings of the 4th International Conference Urban Drainage, Lausanne, Switzerland, 31 August–4 September 1987; pp. 40–46. [Google Scholar]
  32. Saget, A.; Chebbo, G.; Bertrand-Krajewski, J.L. The first flush in sewer systems. Water Sci. Technol. 1996, 33, 101–108. [Google Scholar] [CrossRef]
  33. Bertrand-Krajewski, J.L.; Chebbo, G.; Saget, A. Distribution of pollutant mass vs volume in stormwater discharges and the first flush phenomenon. Water Res. 1998, 32, 2341–2356. [Google Scholar] [CrossRef]
  34. Larsen, T.; Broch, K.; Andersen, M.R. First flush effects in an urban catchment area in Aalborg. Water Sci. Technol. 1998, 37, 251–257. [Google Scholar] [CrossRef]
  35. Barco, J.; Papiri, S.; Stenstrom, M.K. First flush in a combined sewer system. Chemosphere 2008, 71, 827–833. [Google Scholar] [CrossRef]
  36. Luo, H.B.; Luo, L.; Huang, G.; Liu, P.; Li, J.X.; Hu, S.; Wang, F.X.; Xu, R.; Huang, X.X. Total pollution effect of urban surface runoff. J. Environ. Sci. 2009, 21, 1186–1193. [Google Scholar] [CrossRef]
  37. Bach, P.M.; McCarthy, D.T.; Deletic, A. Redefining the stormwater first flush phenomenon. Water Res. 2010, 44, 2487–2498. [Google Scholar] [CrossRef]
  38. Chow, M.F.; Yusop, Z.; Mohamed, M. Quality and first flush analysis of stormwater runoff from a tropical commercial catchment. Water Sci. Technol. 2011, 63, 1211–1216. [Google Scholar] [CrossRef]
  39. Chow, M.F.; Yusop, Z. Storm runoff quality in a residential catchment in Malaysia. J. Environ. Hydrol. 2009, 17, 1–9. [Google Scholar]
  40. Horn, J.L. A rationale and test for the number of factors in factor analysis. Psychometrika 1965, 30, 179–185. [Google Scholar] [CrossRef]
  41. Franklin, S.B.; Gibson, D.J.; Robertson, P.A.; Pohlmann, J.T.; Fralish, J.S. Parallel analysis: A method for determining significant principal components. J. Veg. Sci. 1995, 6, 99–106. [Google Scholar] [CrossRef]
  42. Zhang, Q.Q.; Wang, X.O.; Hou, P.Q.; Wan, W.X.; Ren, Y.F.; Ouyang, Z.Y.; Yang, L. The temporal changes in road stormwater runoff quality and the implications to first flush control in Chongqing, China. Environ. Monit. Assess. 2013, 185, 9763–9775. [Google Scholar] [CrossRef]
  43. Simeonov, V.; Simeonova, P.; Tsakovski, S.; Lovchinov, V. Lake water monitoring data assessment by multivariate statistics. J. Water Res. Prot. 2010, 2, 353–361. [Google Scholar] [CrossRef]
Figure 1. Watersheds monitored in this study and their land cover.
Water 11 00966 g001
Figure 2. The runoff at each monitoring site during dry days over the monitoring period.
Water 11 00966 g002
Figure 3. The runoff at each monitoring site during rainy days over the monitoring period.
Water 11 00966 g003
Figure 4. Boxplot of water quality concentration at each monitoring site during dry days over the monitoring period (red dot: average).
Water 11 00966 g004
Figure 5. Boxplot of event mean concentration at each monitoring site during rainy days over the monitoring period (red dot: average).
Water 11 00966 g005
Figure 6. First flush effect during rainfall at three watersheds (red: Dochoncheon, black: Gongjicheon, blue: Seolseongcheon).
Water 11 00966 g006
Figure 7. Correlation between the hydrological and the water quality characteristics during rainy (above) and dry (below) days (red text: Dochoncheon, grey text: Gongjicheon, blue text: Seolseongcheon).
Water 11 00966 g007
Figure 8. Biplot of principle components for water quality characteristics in Dochoncheon.
Water 11 00966 g008
Figure 9. Biplot of principle components for water quality characteristics in Gongjicheon.
Water 11 00966 g009
Figure 10. Biplot of principle components for water quality characteristics in Seolseongcheon.
Water 11 00966 g010
Figure 11. Dendrogram of monitoring sites during rainy days (D: Distance, Dmax: Maximum Distance).
Water 11 00966 g011
Table 1. Monitoring sites and land cover for each watershed.
CategoryDochoncheonGongjicheonSeolseongcheon
Monitoring SiteDC_1DC_2DC_3GJ_1GJ_2GJ_3GJ_4GJ_5SS_1SS_2SS_3SS_4SS_5
Area (km2)0.51.31.911.414.33.97.745.12.85.216.514.937.5
Land cover (%)Forest91.667.063.566.056.448.140.651.436.634.421.324.721.3
Used area2.414.316.82.78.66.811.612.34.24.47.47.87.2
Agricultural land1.41.62.630.232.343.836.831.754.755.864.362.565.0
Grass2.912.412.20.21.20.810.62.81.71.43.41.62.8
Barren1.74.13.90.11.40.30.01.21.91.21.71.41.5
Water0.01.01.00.80.00.20.50.60.92.91.72.32.2
Average altitude (m)209.5149.7140.2332.3235.9130.9154.4215.3130.9108.3102.995.895.8
Average slope (%)50.136.133.934.230.917.921.425.624.316.712.311.911.5
Table 2. Number of surveys during dry and rainy days at each site.
Dry DaysRainy Days
NumberRainfall (mm)Event NumberRainfall Intensity (mm/h)Runoff (m3)Runoff Ratio (%)
Dochoncheon
(3 sites)
19–200–101–40.8–9.78.2–58,122.30.1–45.2
10–304–6
30–503–4
50<0–1
Total36
Gongjicheon
(5 sites)
25–260–101–21.1–6.51534.9–457,550.00.9–63.9
10–302–4
30–501–2
50<1–3
Total42
Seolseongcheon
(5 sites)
18–190–102–40.5–6.0705.1–856,206.12.3–68.6
10–301–3
30–500–1
50<1–2
Total38
Table 3. Rainfall for each watershed during the study period.
WatershedWeather StationPastMonitoring
PeriodAverage Rainfall (mm)PeriodAverage Rainfall (mm)
DochoncheonSeongnam AWS1997–20131350.52014–2017880.5
GongjicheonChuncheon KMA1987–20141432.12015–20171102.6
SeolseongcheonJanghowon AWS1997–20151217.72016–2017810.5
Table 4. Average cumulative load (%) relative to 30% of cumulative runoff flow at each site.
WatershedSiteBODCODSSTOCTNTP
DochoncheonDC_139.336.048.032.031.740.5
DC_238.934.941.028.631.839.9
DC_336.734.935.031.831.134.4
GongjicheonGJ_135.537.144.933.333.238.1
GJ_233.035.342.031.832.436.0
GJ_336.531.437.933.632.432.0
GJ_434.332.142.630.630.234.3
GJ_536.341.545.137.333.841.6
SeolseongcheonSS_130.429.729.129.026.328.0
SS_233.829.030.128.429.329.4
SS_331.427.830.930.229.329.0
SS_431.225.524.030.026.628.9
SS_528.629.529.928.429.629.9
Table 5. Eigenvalues and proportion of variance explained by principal component analysis.
Watershed Dry DaysRainy Days
Factors123123
DochoncheonEigenvalue2.3941.5171.0543.0821.3221.029
PA eigenvalue1.3221.1691.0351.4451.1981.042
% Variance32.722.116.232.428.416.8
% Cumulative32.754.870.932.460.877.6
GongjicheonEigenvalue2.6811.2691.1953.1261.3231.013
PA eigenvalue1.2351.1131.0231.4141.1921.049
% Variance34.020.519.037.124.116.8
% Cumulative34.054.573.537.161.278.0
SeolseongcheonEigenvalue3.5991.1290.7854.1491.2950.641
PA eigenvalue1.2681.1621.0361.4761.2131.033
% Variance45.317.216.239.125.622.2
% Cumulative45.362. 578.839.164.786.9
Table 6. Loadings of experimental variables (7) on principal components for three watersheds.
WatershedClassificationDry DaysRainy Days
CharacteristicFactor 1Factor 2Factor 3Factor 1Factor 2Factor 3
DochoncheonFlow−0.100−0.0500.896−0.0900.134 0.850
BOD0.7650.238−0.0500.880 0.243 −0.010
COD0.803−0.186−0.1570.774 0.491 −0.060
SS0.8110.2280.1690.184 0.924 −0.090
TOC0.623−0.199−0.2870.888 0.0200.050
TN0.0100.8750.197−0.110 0.293 −0.663
TP0.0500.772−0.3880.226 0.855 −0.030
GongjicheonFlow0.090 −0.090 −0.877 −0.010 −0.040 0.939
BOD0.799 0.147 0.010 0.430 0.785 0.194
COD0.798 0.189 0.163 0.869 0.122 −0.030
SS0.187 0.830 −0.157 0.749 0.196 0.299
TOC0.917 0.020 0.000 0.896 0.040 −0.118
TN0.464 −0.030 0.663 −0.140 0.818 −0.333
TP0.060 0.825 0.268 0.527 0.585 0.207
SeolseongcheonFlow0.090 0.908 0.070 0.010 −0.040 0.965
BOD0.929 −0.138 0.113 0.840 0.131 0.132
COD0.873 −0.145 0.221 0.734 0.438 0.383
SS0.834 0.050 0.090 0.591 0.273 0.673
TOC0.783 −0.010 0.250 0.879 0.366 −0.020
TN0.222 −0.020 0.954 0.199 0.936 0.040
TP0.428 −0.580 0.299 0.576 0.707 0.050

