Article

Allocating Water Environmental Capacity to Meet Water Quality Control by Considering Both Point and Non-Point Source Pollution Using a Mathematical Model: Tidal River Network Case Study

1
Jiangsu Provincial Key Laboratory of Environmental Engineering, Nanjing 210036, China
2
Jiangsu Provincial Academy of Environmental Sciences, Nanjing 210036, China
3
Environment College, Hohai University, Nanjing 210098, China
4
Jiangsu Engineering Consulting Center, Nanjing 210000, China
5
Yellow River Institute of Hydraulic Research, Zhengzhou 450003, China
6
College of Science, Hohai University, Nanjing 210098, China
7
Academy of Environmental Planning and Design, Nanjing University, Nanjing 210093, China
*
Author to whom correspondence should be addressed.
Water 2019, 11(5), 900; https://doi.org/10.3390/w11050900
Submission received: 21 February 2019 / Revised: 9 April 2019 / Accepted: 26 April 2019 / Published: 29 April 2019
(This article belongs to the Section Water Quality and Contamination)

Abstract

:
Based on the principles of fairness and feasibility, a nonlinear optimization allocation method for pollutants was developed based on controlled section water quality standards, considering the synergetic influence of point and surface sources. The maximum allowable emission of pollutants from point and surface sources were taken as the objective function. The water quality attainment rate of controlled sections, the control requirements of pollution sources, and technical parameters of pollution control engineering were taken as constraints. A nonlinear optimization allocation model was established, and a genetic algorithm was used to solve the problem. As an example, the model was applied to a certain area in the Taihu Lake basin, southern Jiangsu province, China. The analysis results showed that the annual number of days for ammonia-nitrogen and total phosphorus meeting the standard were 334 and 332 days, respectively, under maximum allowable emissions for each pollutant, and the water quality compliance rates of the control section were 91.5% and 91%, respectively. The ammonia-nitrogen and total phosphorus concentrations in the controlled section achieved related water quality compliance rate targets of 90%. These all met the water quality compliance rate requirements of the control section. The results indicate that this method reflects the feasibility of optimizing the total allocation results systematically and intuitively, overcomes the insufficiency in the feasibility of the optimized allocation method, and provides effective and reliable technical support for control and management of the total pollutant amount based on water quality improvement.

1. Introduction

Total pollutant allocation is the process of allocating regional allowable pollutant discharge (water environment capacity) to each point and non-point source in accordance with certain principles. It is the core component in total pollutant volume control technology systems.
As a prerequisite to guide total pollutant allocation, water environment capacity calculation is one of the key techniques. However, most scholars have only conducted quantitative studies on point source pollution. There are relatively few studies on the calculation of pollution loads that include non-point sources, especially in tidal river network areas [1,2]. Generally, the hydrological situation is very complicated [3] in tidal river network areas, which are characterized by unsteady flow directions and large temporal variabilities of flow rates. Furthermore, even during periods with relatively stable pollution loads, water quality of tidal river networks shows high temporal variability because of the variability in hydrodynamic conditions [4,5,6]. Otherwise, with point source compulsive governance, the proportion and contribution of non-point source pollution loads to the total pollution loads in the basin in this region is increasing. For further improvement of water quality in river and lake basins [7,8], it is necessary to study the synergistic influence of point and non-point sources on the water environment capacity. Chen et al. [2] put forward one method for calculating water environment capacity based on the water quality in a tidal river network, including both point sources and non-point sources. Zhang [9] accounted for pollution load and water environment capacity on a monthly basis based on non-point source pollution control in the Ashi River basin.
Among the most common methods for pollutant allocation, the proportional distribution method is the most widely used in current total pollutant volume control and management because of its simplicity and high efficiency [10,11,12]. However, it has the disadvantages of multiple rows and multiple points. What is worse, the proportional distribution method mainly focuses on the total environment capacity, which limits investigation of different pollutant sources [13]. Otherwise, the analytical hierarchy process [14,15] and Gini coefficient method [16] both comprehensively consider economy, society, and environmental resources. Index selection is one of the key factors for allocating scientific and feasible aspects of a project; however, it is still difficult to avoid subjectivity in index selection and weight assignment. This makes it cumbersome to allocate pollutants and easy to introduce high uncertainty. To obtain high accuracy, the optimal distribution model method [17], which can automatically be adjusted by the constraint conditions of the system, generally is used to calculate water environment capacity to optimize the total allocation for a single river [18,19,20,21,22]. Jing et al. [23] took a linear programing model to optimize the allocation of water environment capacity at each point source. By combining the linear programming equation and response coefficient matrix, Li [24] obtained the water environment capacity and allocation scheme for Liaohe River in the city of Tieling. Deng et al. [25] studied total allocation calculations based on linear programming methods in the Yangtze estuary and adjacent sea, which had good results and improved the efficiency. Even though the linear programming method was proven to be suitable for allocating the water environment capacity of rivers or estuaries, the application of a river network area, especially a tidal river network area, was limited.
Based on regional compulsive administrative requirements (e.g., the water quality standards of the control section and the discharge reduction rate) and pollution treatment technology, this paper established a nonlinear optimal distribution model considering the synergetic influence of point and non-point sources. The distributed non-point source model was introduced to generalize regional non-point source pollutant loads, and a genetic algorithm was applied as an optimal distribution tool for non-linear optimization. Taking one tidal river network area in the Taihu Lake basin of China as an example, total optimal pollutant allocation in a tidal river network area is studied. This optimal allocation model has the potential to overcome insufficient feasibility of the traditional optimized allocation method, and it can provide effective and reliable technical support for control and management of total pollutant loads based on water quality compliance rates.

2. Methods of Total Pollutant Distribution

2.1. Optimization Assignment Model

The maximum allowable emissions of pollutants from point and non-point sources were taken as the objective function. The requirement for the control section to meet the specified water quality objectives (the water quality compliance rate of the control section was 90%), the administrative requirements for pollution sources, and the reduction of technical parameter limits were taken as constraints. A nonlinear optimizing distribution model was then established, considering the coordinated effects of point and non-point sources as follows:
Objective function:
max i = 1 n X i .
Constraint condition:
P { i = 1 n α i X i C s C B } α f ,
X imin X i X imax ,
where P { } is the probability of the event being established; α f is the water quality requirements; X i is decision variables representing the quantity of the i -th pollution sources discharged into the river; α i is the response coefficient, which indicates the effect of the i -th pollution source on the control section; C s is the water quality control concentration standard value of the constrained control section (mg/L); and C B is the response concentration of upland water of the control section (mg/L).
The principles for setting the limits of decision variables were as follows:
(1)
The upper limit value of decision variables ( X imax ), which was the maximum allowed discharged quantity, was set according to the current emission characteristics of pollution sources, with reference to compulsive administrative requirements set by the local government for pollutant discharge reduction, comprehensively considering local economic, social, and environmental sustainability, and so on.
(2)
The lower limit value of decision variables ( X imin ), which was the maximum cost efficiency and technical feasibility of the discharged quantity, was set according to the current emission characteristics of pollution sources, combined with the existing level of pollution treatment technology and disposal cost control.

2.2. Point Source and Non-Point Source Response Coefficients for Contaminant Concentration in the Control Section

The water quality response coefficient reflected the response of a section of specified water area to the pollution load discharged by an upstream pollution source. After the river divided into the water function zone, the factors affecting change of pollutant concentration at a control section included upstream water and the interval sewage outlet. The set of response coefficients of the control section within the study area for each pollution source and upstream water area was called the water quality response coefficient matrix.
Using a non-steady-state river network hydrodynamic and water quality mathematical model [2,6], which were based on one-dimensional Saint-Venant equations, the form was as follows:
( AC ) t + ( AUC ) x = x ( AE x C x ) KAC + S ,
where C is the average cross-sectional concentration of the pollutant in mg/L; U is the average flow velocity of the section in m/s; A is the area of the section in m2; E x is the longitudinal dispersion coefficient; S is the pollutant discharge per unit time and unit river length in kg/(s·m); K is the pollutant degradation coefficient; x is the space coordinate; and t is the time coordinate. Using the three-stage joint solution method, the time variation process of pollutant concentration in all nodes and sections of the river network can be obtained.
The time series of the design of the hydrological conditions (usually the typical dry year) and the pollutant concentration response at the control section of each inflow boundary can be calculated, which are expressed as a column vector:
{ C B } = ( C B ( 1 ) , C B ( 2 ) , , C B ( i ) , , C B ( N ) ) T i = 1 ,   2 , N ,
where T is the vector transposition; N is the length of the time series, for a typical hydrological year it can be set to 365 days; and C B ( i ) is the concentration response value of all inflow boundary pollutants entering the circulation during the itch period of the control section (unit is mg/L). Among them, the concentration of inflow pollutants is determined according to the water quality management target of the inflow boundary in the controlled area.
In the same way, the time-varying sequence of pollutant concentration response at the control section of the river basin, with a non-point source pollution load into the river, is represented by vectors as:
{ C N } = ( C N ( 1 ) , C N ( 2 ) , , C N ( i ) , , C N ( N ) ) T i = 1 ,   2 , N .
The time-varying sequence of the pollutant concentration response in sediment during the discharge process of pollutants is represented by a vector:
{ C SS } = ( C SS ( 1 ) , C SS ( 2 ) , , C SS ( i ) , , C SS ( N ) ) T i = 1 ,   2 , N .
Point source pollutants have uncertainties because of the location of the vents and their corresponding emissions. In the current situation, there were more discharge ports in the controlled area, which generally referred to the status of the current sewage outlets. Calculation of the current discharge of the ports and current pollution source emissions at the control section was represented by vectors:
{ C P } = ( C P ( 1 ) , C P ( 2 ) , , C P ( i ) , , C P ( N ) ) T i = 1 , 2 , N .
Because contaminants migrate and transform in surface water to meet the requirements of diffusion in the convection diffusion equation, they belong to the first-order kinetic system. Therefore, the principle of linear superposition was satisfied. Based on this, the time course of pollutant concentration at the control section can be expressed as a vector:
{ C c } = { C B } + { C N } + { C SS } + { C P } .
At the same time, the time-varying sequence of pollutant concentration response at the control section, formed by a certain source intensity value, can be viewed as a linear superposition of the effect of a number of unit source intensity values (i.e., P i = 1). Correspondingly, the following relationship holds:
{ C i } = { α i } × P i ,
where { α i } is the time-varying sequence of the pollutant concentration response at the control section formed by P i (unit pollution source). Here, α i was defined as the response factor, acting as the contributing concentration of the unit pollutant in the control section. It represents the response relationship of the water quality in the control section to a certain pollution source. The response coefficient was based on the principle of conservation of mass (Equation (4)) and establishes a quantitative relationship between the water quality of the control section and the pollution source. It was the basis for calculation of water environment capacity and distribution of total pollutants based on water quality in the controlled section.

2.3. Solving the Optimization Model Method

Equations (1)–(3) are solutions to the nonlinear constraint problem of the linear objective function, which was solved by the genetic algorithm. The genetic algorithm was first proposed by Prof. Holland [26]. It simulates biological natural selection and genetic processes to select, cross, and mutate populations. Based on the principle of survival of the fittest, in each generation individuals are selected according to the degree of fitness, and evolutionary approximations are generated from generation to generation. After iteration, an optimal solution to the research problem can be obtained. It is an adaptive global optimization search algorithm [27,28,29]. The genetic algorithm steps are as follows:
(1)
Set operating parameters. The parameters involved in the genetic algorithm included: population size, M ; mutation probability, P M ; crossover probability, P C ; and evolution algebra, T . The different values of the parameters will directly affect the performance of the algorithm, so multiple debuggings should be performed, and the best value should be selected after comparison. In this case, the population size was 100, the crossover probability was 0.001, and the evolution algebra was 100.
(2)
Generate the initial population. Several individuals were randomly selected and judged according to the constraints, and the individuals who met the conditions as a whole constituted the initial population.
(3)
Fitness and choice. According to the principle of natural selection, individuals with high fitness are inherited to the next generation. The objective function value was generally used as the individual fitness.
(4)
Crossover. In genetic algorithms, crossover is mainly used to generate new individuals. The object of operation change was the binary code of the decision variable, not the decision variable itself. Firstly, individuals were selected and paired randomly according to a certain method. Then, the location of the intersection and exchange of genes, according to a certain crossover method, are determined to reflect the idea of information exchange. Since the new individual obtained after the intersection was not necessarily a feasible solution, the result was checked by constraint conditions. If the condition remained unsatisfied, the crossover operation was performed again until the constraint condition was satisfied or the number of crossover operations reached the limit value.
(5)
Mutation. The mutated object was also the binary code of the decision variable. The mutation here only required the individual to reverse the value at the mutation point (0 to 1 and 1 to 0). Variation is the main method of generating new individuals, but new individuals after mutation required testing by constraints.
(6)
Generate a new generation of populations. From the offspring generated by crossover and mutation, individuals were selected as parents to generate a new population generation. In general, the optimal individuals in each generation were selected to be inherited to the next generation. Therefore, the solution of the model can be obtained by decoding the best individual of the last generation.

3. Case Study

3.1. Research Area

The research area was located in the Xijiu Lake water system of Yixing City, Jiangsu Province, west of Taihu Lake and south of Ge Lake. It is a typical tidal river network belonging to the Nanxi water system of the Taihu Lake basin. The catchment area included many rivers such as Nanxi River, Beixi River, and Youfang River. The upstream flowed through Nanxi river, Beixi River, Youfang River, etc. to flow into Xijiu Lake. Finally, the water flowed into Taihu Lake after going across Dongjiu Lake. The section of Xijiu Bridge was the representative section of the water system for quality assessment of the water system. The water quality target was Class III (ammonia nitrogen, 1 mg/L; total phosphorus, 0.2 mg/L) of surface water according to the water quality standard in China (GB3838-2002). The water system of this study area and pollutant source locations are all shown in Figure 1. In addition, pollutant source discharge loads are shown in Table 1.

3.2. Establishing the Hydrodynamic Model of the River Network Considering Rainfall and Runoff

3.2.1. Boundary Conditions

According to the frequency analysis of long series annual rainfall data of the river basin, the year (within the 2000s) that matched a 90% guarantee rate was selected as the typical year for designing dry water. A time course of water level or flow extraction from the hydrodynamic boundary of the Taihu Lake basin was used as a boundary condition, with a total of 13 flow boundaries and 4 water level boundaries. For rainfall runoff flow into rivers, the corresponding relationship between land units and inflow sections was identified according to a spatial location relationship. Then, the production flows of each unit were calculated based on the production coefficient, and the time allocation process of runoff into the river was determined by the time allocation ratio. Thus, temporal and spatial coupling of terrestrial runoff and river network convergence was realized.

3.2.2. Parameter Values and Water Model Validation

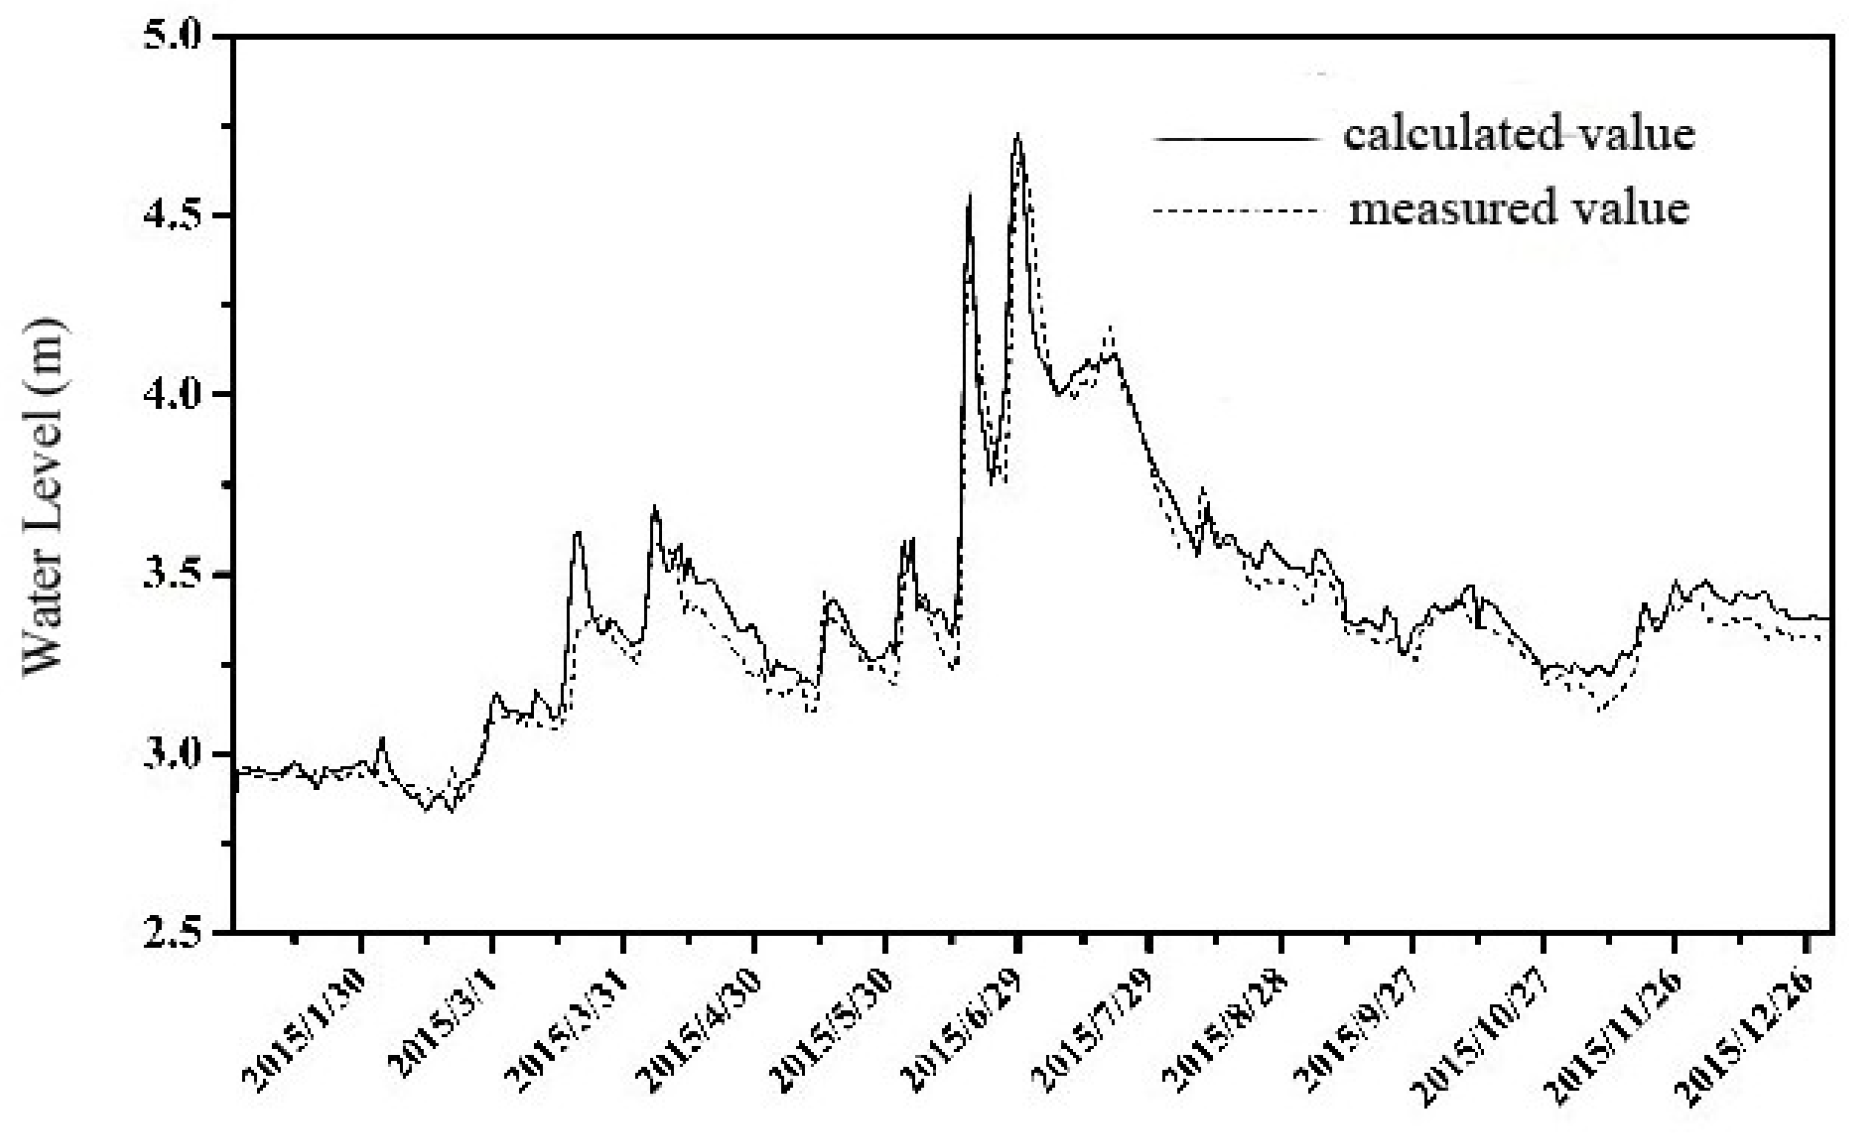
The roughness of the river was determined by referencing historical research in the area. Daily water level observation data at the Yixing (West) station in Xijiu was used to verify results. The comparison results between the calculated values of the water level and the measured values are shown in Figure 2. The calculated value of the water level agreed well with the measured value, with an average error of 0.03 m.

3.3. Establishing the River Network Water Quality Model Based on Time Variation of Non-Point Source Release into Rivers

3.3.1. Boundary Conditions

According to the water quality target corresponding to the upstream functional water zone of the water body adjacent to the inflow boundary, the concentration–time variation process of the inflow section was given, and the second boundary condition was adopted for the outflow boundary.

3.3.2. Point Source and Non-Point Source Generalization

There were a total of 10 point source sewage outlets in the study area. The corresponding relationship between pollution produced by land units and inflowing river reaches was identified. According to the rainfall runoff pollutant concentration change process at the source and the research experiment experience value, determining the time allocation process of land contamination for the river as well as realizing the spatial and temporal dynamic coupling of the land surface source pollution load to the river network pollutant transport can be achieved.

3.3.3. Parameter Value and Model Validation

According to relevant research results in the region, water quality parameters such as the pollutant degradation coefficient and the pollutant dispersion coefficient were determined. In this case, the degradation coefficient for ammonia-nitrogen ranged from 0.06 to 0.09 per day and that for total phosphorus ranged from 0.06 to 0.1 per day. Water quality monitoring data from the Xijiu Bridge section were used to verify results. The comparison results between the calculated water quality and measured values are shown in Figure 3. The calculated water quality of the Xijiu Bridge section showed good agreement with the measured values. The average relative error of ammonia-nitrogen was 18. 8% and the average relative error of total phosphorus was 17.8%.
Furthermore, the Nash–Sutcliffe efficiency coefficients for ammonia-nitrogen and total phosphorus were 0.92 and 0.59, respectively, which meant the model had a good quality and high credibility, especially for ammonia-nitrogen (the coefficient was close to 1). Otherwise, the value of percent bias (PBIAS) was 1.39% for ammonia-nitrogen and −15.74% for total phosphorus. These values also showed this model was robust.

3.4. Constructing an Optimal Allocation Model for Total Pollutants Based on Controlled Section Water Quality Standards, Considering the Synergetic Influence of Point and Non-Point Sources

Objective function:
max ( i = 1 N W NS , i + j = 1 M W NN , j + k = 1 K W PW , k + l = 1 L W PP , l ) .
Constraint condition:
P { ( i = 1 N α i W NS , i + j = 1 M β j W NN , j + k = 1 K δ k W PW , k + l = 1 L γ l W PP , l ) C S C B } α f ,
A NS , i min W NS , i 0 W NS , i A NS , i max W NS , i 0           ( i = 1 , 2 , , N ) ,
A NN , j min W NN , j 0 W NN , j A NN , j max W NN , j 0           ( j = 1 , 2 , , M ) ,
A PW , k min W PW , k 0 W PW , k A PW , k max W PW , k 0     ( k = 1 , 2 , , K ) ,
W PP , l A PP , l max W PP , l 0                                       ( l = 1 , 2 , , L ) ,
where P { } is the probability of the event being established; α f is the water quality requirements; W NS , i is the i -th unoccupied non-point source of urban and rural life, W NS , i 0 is its current value, and A NS , i min   and   A NS , i max are the upper and lower limits of their pollutant reduction factors, respectively; α i is the corresponding control section response coefficient; W NN , j is the j -th agricultural source, W NN , j 0 is its current value, and A NN , j min   and   A NN , j max are the upper and lower limits of their pollutant reduction factors, respectively; β j is the corresponding control section response coefficient; W PW , k is the point source for the k -th sewage treatment plant, W PW , k 0 is its current value, and A PW , k min   and   A PW , k max are the upper and lower limits of their pollutant reduction factors, respectively; δ k is the corresponding control section response coefficient; W PP , l is the l -th industrial straight line point source, W PP , l 0 is its current value, and A PP , l max is the upper limit of its pollutant reduction factor; and γ l is its corresponding control section response coefficient. The values of the upper and lower constraints of the decision variables are shown in Table 2.

3.5. Total Pollutant Distribution Results

The system-optimized distribution model, considering the synergistic influence of point and non-point sources, and the water quality at the controlled section were used to allocate ammonia-nitrogen and total phosphorus pollutants (that is, the water environmental capacity) in the study area. The distribution results are given in Table 3.
For ammonia-nitrogen, the reduction rate of the industrial point source was 48%–52%, the reduction rate of sewage treatment plants was 28%–30%, the reduction rate of non-point source of domestic wastewater was 81%–82%, and the reduction rate of agricultural non-point sources was 26%–68%.
For total phosphorus, the reduction rate of the industrial point source was 47%–51%, the reduction rate of sewage treatment plants was 20%, the reduction rate of non-point source of domestic wastewater was 37%–44%, and the reduction rate of agricultural non-point sources was 21%–59%.

3.6. Feasibility Analysis

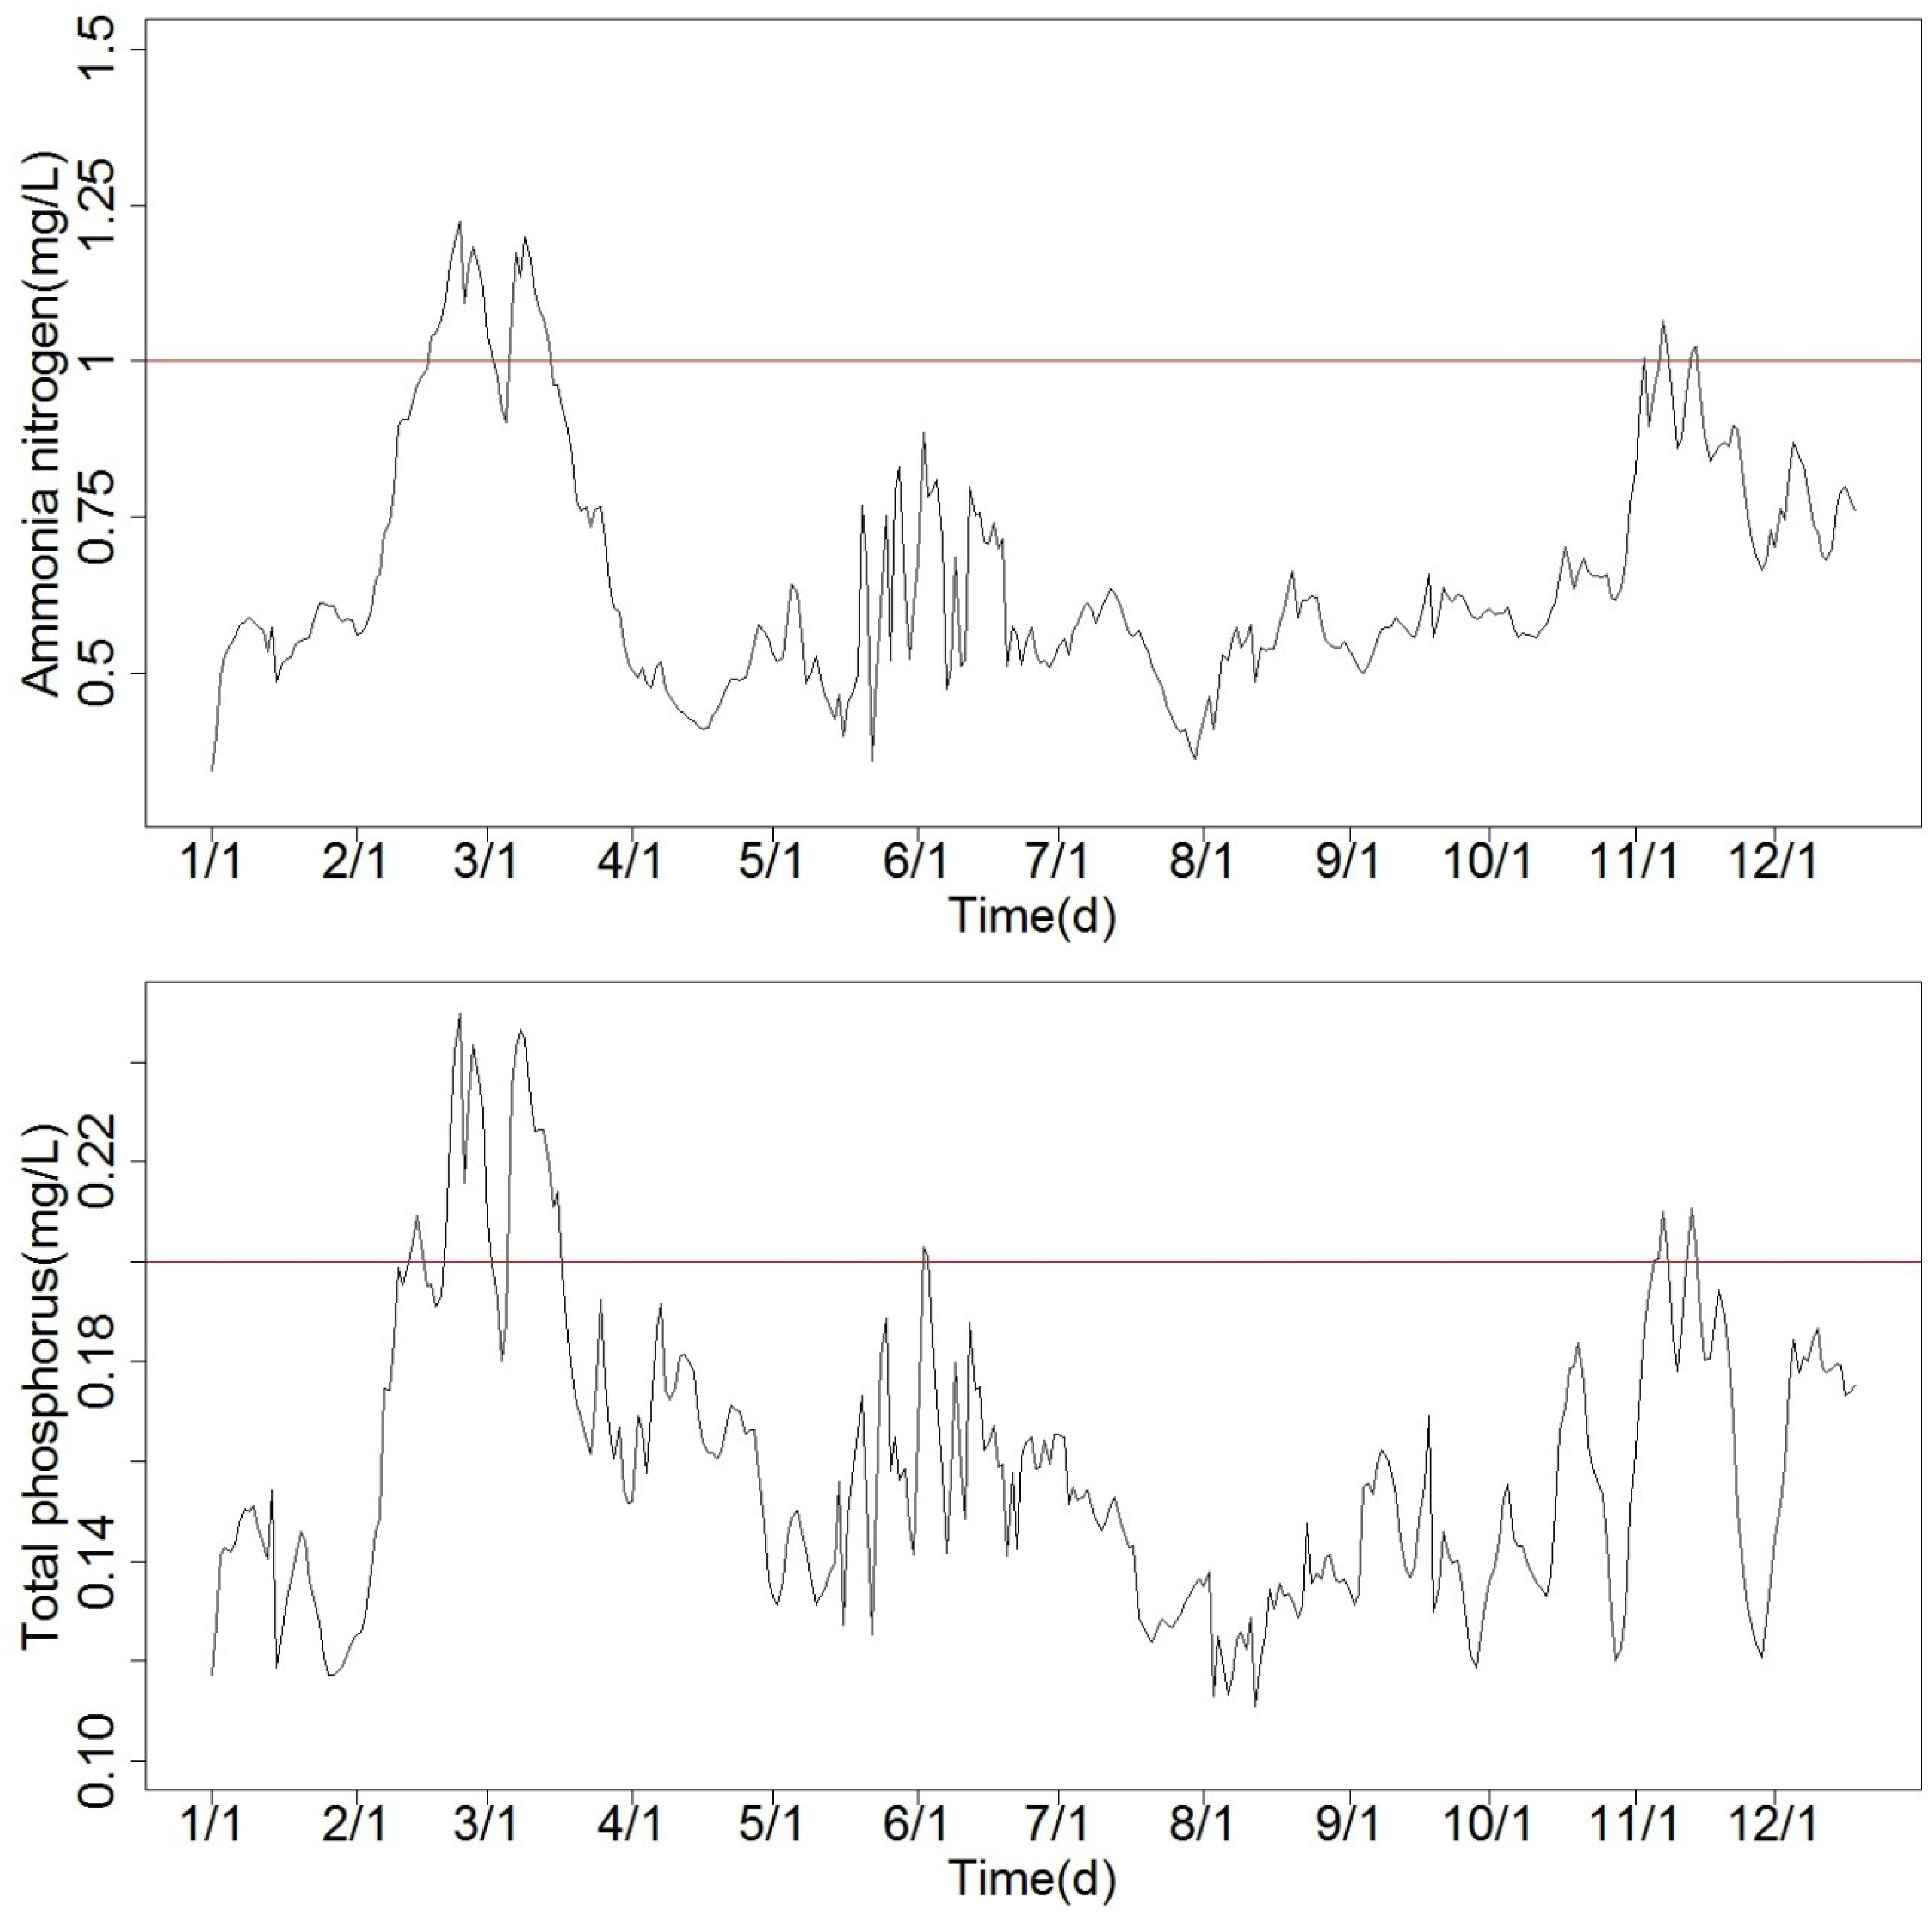
The maximum allowable emission of each generalized sewage outlet was inputted into the model, and the water quality compliance rate of the controlled section under the discharge was analyzed to verify the rationality of the optimized allocation of total pollutants in the study area. The results of the model prediction showed that the number of days needed to reach the standard of ammonia-nitrogen and total phosphorus was 334 and 332 days, respectively. The water quality compliance rate in the controlled section was 91.5% and 91% for ammonia-nitrogen and total phosphorus concentration, respectively. Ammonia-nitrogen and total phosphorus concentration in the controlled section, thus, achieved class III water quality targets for approximately 90% of the year (Figure 4).
In summary, it was reasonable and feasible to optimize the allocation of total pollutants in the study area.

4. Discussion and Conclusions

This method has potential to be applied to all tidal river network areas and is not limited in our research area. Based on the principles of fairness and feasibility, this paper proposes a non-linear optimization method for allocation of total pollutants based on the water quality of the control section, taking into account the synergistic influence of point and non-point sources. This method takes the maximum allowable emission of pollutants from point and non-point sources as the objective function. In addition, it treats the requirement of the controlled section to meet the specified water quality objectives, the controlled requirements of pollution sources, and the technical parameters of pollution control projects as constraints. It establishes a nonlinear optimal distribution model for the research area in demand, considering the coordinated effects of point and non-point sources and water quality of the controlled section.
Given this method was applied to a certain water system in the southern part of the Taihu Lake basin, China, this paper distributes the total amount of pollutants in the study area to each generalized sewage outlet (including point and non-point sources) and analyzes the feasibility of total allocation. The main conclusions are as follows:
(1)
The analysis results showed that when the maximum allowable emission of each pollutant discharge port was inputted into the model, the annual numbers of days for ammonia-nitrogen and total phosphorus meeting the standard were 334 and 332 days, respectively, and the water quality compliance rates of the control section was 91.5% and 91%, respectively. The ammonia-nitrogen and total phosphorus concentrations in the controlled section achieved class III water quality targets for 90% of the year. These all meet the water quality compliance rate requirements of the control section.
(2)
The method systematically and intuitively reflects the feasibility of optimizing allocation results of the total amount. It overcomes the shortcomings in the feasibility of optimizing the distribution method, solves the key constraints in its application, and provides effective and reliable technical support for the control and management of regional total pollutants based on water quality improvement. It offers improvement for environment management and protection.

Author Contributions

Conceptualization, L.C. and L.H.; methodology, L.C. and L.H.; software, L.C., M.Z. and J.T.; investigation, H.L. and J.W.; data curation, Z.L. and Y.F.; writing—original draft preparation, F.Z. and Y.L.; writing, review, and editing, B.C. and L.C.; supervision, L.C.

Funding

This work was supported by the open subject of the Key Laboratory of environmental engineering in Jiangsu (ZX2017011): Study on total pollutant allocation technology based on synergistic effect of point and area source on water quality improvement. Funding was also provided by the National Natural Science Foundation of China (Grant No. 51679102).

Conflicts of Interest

The authors declare no conflicts of interest.

References

  1. Zhang, L.K. Study on Total Quantity Control Technology of Ashi River Basin Based on Nonpoint Source Pollution Control. Master’s Thesis, Chinese Academy of Environmental Sciences, Beijing, China, 2014. [Google Scholar]
  2. Chen, L.; Han, L.; Tan, J.; Zhou, M.; Sun, M.; Zhang, Y.; Chen, B.; Wang, C.; Liu, Z.; Fan, Y. Water Environmental Capacity Calculated Based on Point and Non-Point Source Pollution Emission Intensity under Water Quality Assurance Rates in a Tidal River Network Area. Int. J. Environ. Res. Public Health 2019, 16, 428. [Google Scholar] [CrossRef] [PubMed]
  3. Zheng, X.Y.; Zhu, J.D.; Zhu, W.B. Research on water environmental capacity of dynamic river system. Adv. Water Sci. 1997, 8, 25–31. [Google Scholar]
  4. Han, L.; Lu, D.; Ji, H. Study on the Concentration Response of Pollutant Concentration in the Inflow and Outflow Section of the Cross-type Mouth of Plain River Network. J. Sun Yat-Sen Univ. (Nat. Sci. Ed.) 2011, 50, 123–128. [Google Scholar]
  5. Han, L.; Lu, D. Prospect of numerical simulation study on water quality of plain river network. J. Hohai Univ. (Nat. Sci. Ed.) 2004, 32, 127–130. [Google Scholar]
  6. Yao, Y.J.; Yin, H.L.; Li, S.I. The computation approach for water environmental capacity in tidal river network. J. Hydrodyn. 2006, 18, 269–273. [Google Scholar] [CrossRef]
  7. Bian, B.; Zhu, W.; Li, B. The characteristics of non-point source pollution and its control techniques in western Taihu Basin. Water Resour. Prot. 2015, 31, 48–55. [Google Scholar]
  8. Dong, Y. Study on Coupling Simulation and Control Strategy of Non-Point Source Pollution in Dianchi Lake between Urban and Rural Areas; Tsinghua University: Beijing, China, 2016. [Google Scholar]
  9. Zhang, L. Study on Water Pollutant Total Amount Control Technique in ASHI River Basin Based on Non-Point Source Pollution Control; Chinese Research Academy of Environmental Sciences: Beijing, China, 2014. [Google Scholar]
  10. Wang, C.Y.; Peng, H.; Zhang, S.W. Water Pollution Control Plan TMDL Project on Wuhan East Lake. People’s Yangtze River 2010, 41, 86–89. [Google Scholar]
  11. Bao, K.; Feng, Y.; Sun, H. Research on Calculation Method of Water Environmental Capacity Based on Water Quality Control at Control Section—Taking Yincun Port as an Example. Resour. Sci. 2011, 33, 249–252. [Google Scholar]
  12. Wang, Z.X.; Pang, Y.; Luo, J. Study on Water Environment Capacity and Water Quality Control Plan for Plain River Network in Dianshan Lake Basin. J. Water Resour. Water Eng. 2015, 12, 249–252. [Google Scholar]
  13. Ma, X. Water Environmental Capacity Calculation and Allocation Based on the Optimal Reduction Model of Pollution; Tsinghua University: Beijing, China, 2017. [Google Scholar]
  14. Li, R.Z.; Qian, J.Z.; Wang, J.Q. Research on the Total Allocation of Water Pollutants Allowed Emissions. J. Hydraul. Eng. 2003, 5, 112–115. [Google Scholar]
  15. Xu, H.; Wu, J.M.; Zhao, P.D. Case studies on sustainability assessment of urban wetland resources. Fresenius Environ. Bull. 2013, 22, 3458–3464. [Google Scholar]
  16. Chen, D.J.; Lv, J.; Shen, Y.N. Water Environment Gini Coefficient Method for Multi-objective Fair Allocation of Water Environment Capacity among Regions. Environ. Pollut. Prev. 2010, 32, 88–91. [Google Scholar]
  17. Wang, L.; Zhang, H.W.; Yue, L. Research on the Model of Optimizing Distribution of Total Water Pollutant Industry. Environ. Sci. 2005, 26, 195–198. [Google Scholar]
  18. Wang, J.N.; Pan, X.Z. Application of Linear Programming Method in Allocation of Environmental Capacity Resources. Environ. Sci. 2005, 26, 195–198. [Google Scholar]
  19. Xun, F.F.; Ge, Y.J.; Ma, J.Y. Application of Linear Programming in Water Environment Capacity Calculation. J. Water Resour. Water Eng. 2009, 20, 180–182. [Google Scholar]
  20. Dong, Y.B.; Zhang, H.X.; Li, Z.W. Study on Water Environment Capacity of Taizihe Liaoyang Section Based on Linear Programming. Water Conserv. Technol. Econ. 2016, 22, 12–14. [Google Scholar]
  21. Wu, S.Y.; Hu, C. Research on water environment capacity of the Weihe River system based on the water ecological function zoning. J. Meteorol. Environ. 2014, 30, 107–111. [Google Scholar]
  22. Wan, J.M.; Li, S.Y. Research on Total Control Scheme of Water Environmental Capacity in Tidal River Reaches. Environ. Sci. Manag. 2009, 34, 34–36. [Google Scholar]
  23. Jing, H.X.; Li, X.B.; Fang, H.Y.; Liu, C.G. Investigation of the river water environment capacity allocation by using linear programming model. J. Water Resour. Water Eng. 2018, 29, 34–38. [Google Scholar]
  24. Li, M. Study on Estimation and Allocation Method of River Water Environmental Capacity for Liaohe River in Tieling; Shenyang Ligong University: Shenyang, China, 2011. [Google Scholar]
  25. Deng, Y.X.; Meng, W.; Zheng, B.H.; Fu, G.; Lei, K. Application of linear programming method based on response fields in total load allocation for Yangtze estuary and adjacent sea. Res. Environ. Sci. 2009, 16, 995–1000. [Google Scholar]
  26. Holland, J. Adaptation in Natural and Artificial Systems; University of Michigan Press: Ann Arbor, MI, USA, 1975. [Google Scholar]
  27. Yuan, X.M.; Li, H.Y.; Li, S.K. Application of Neural Network and Genetic Algorithm in Water Science; China Water Conservancy and Hydropower Press: Beijing, China, 2002. [Google Scholar]
  28. Xu, L.N.; Li, L.L. Application of Genetic Algorithm in Nonlinear System Identification. J. Harbin Inst. Technol. 1999, 31, 39–42. [Google Scholar]
  29. Ozemir, O.N.; Ucaner, E. Validation of genetic algorithms for the hydraulic calibration of a water supply network. Fresenius Environ. Bull. 2007, 16, 278–284. [Google Scholar]
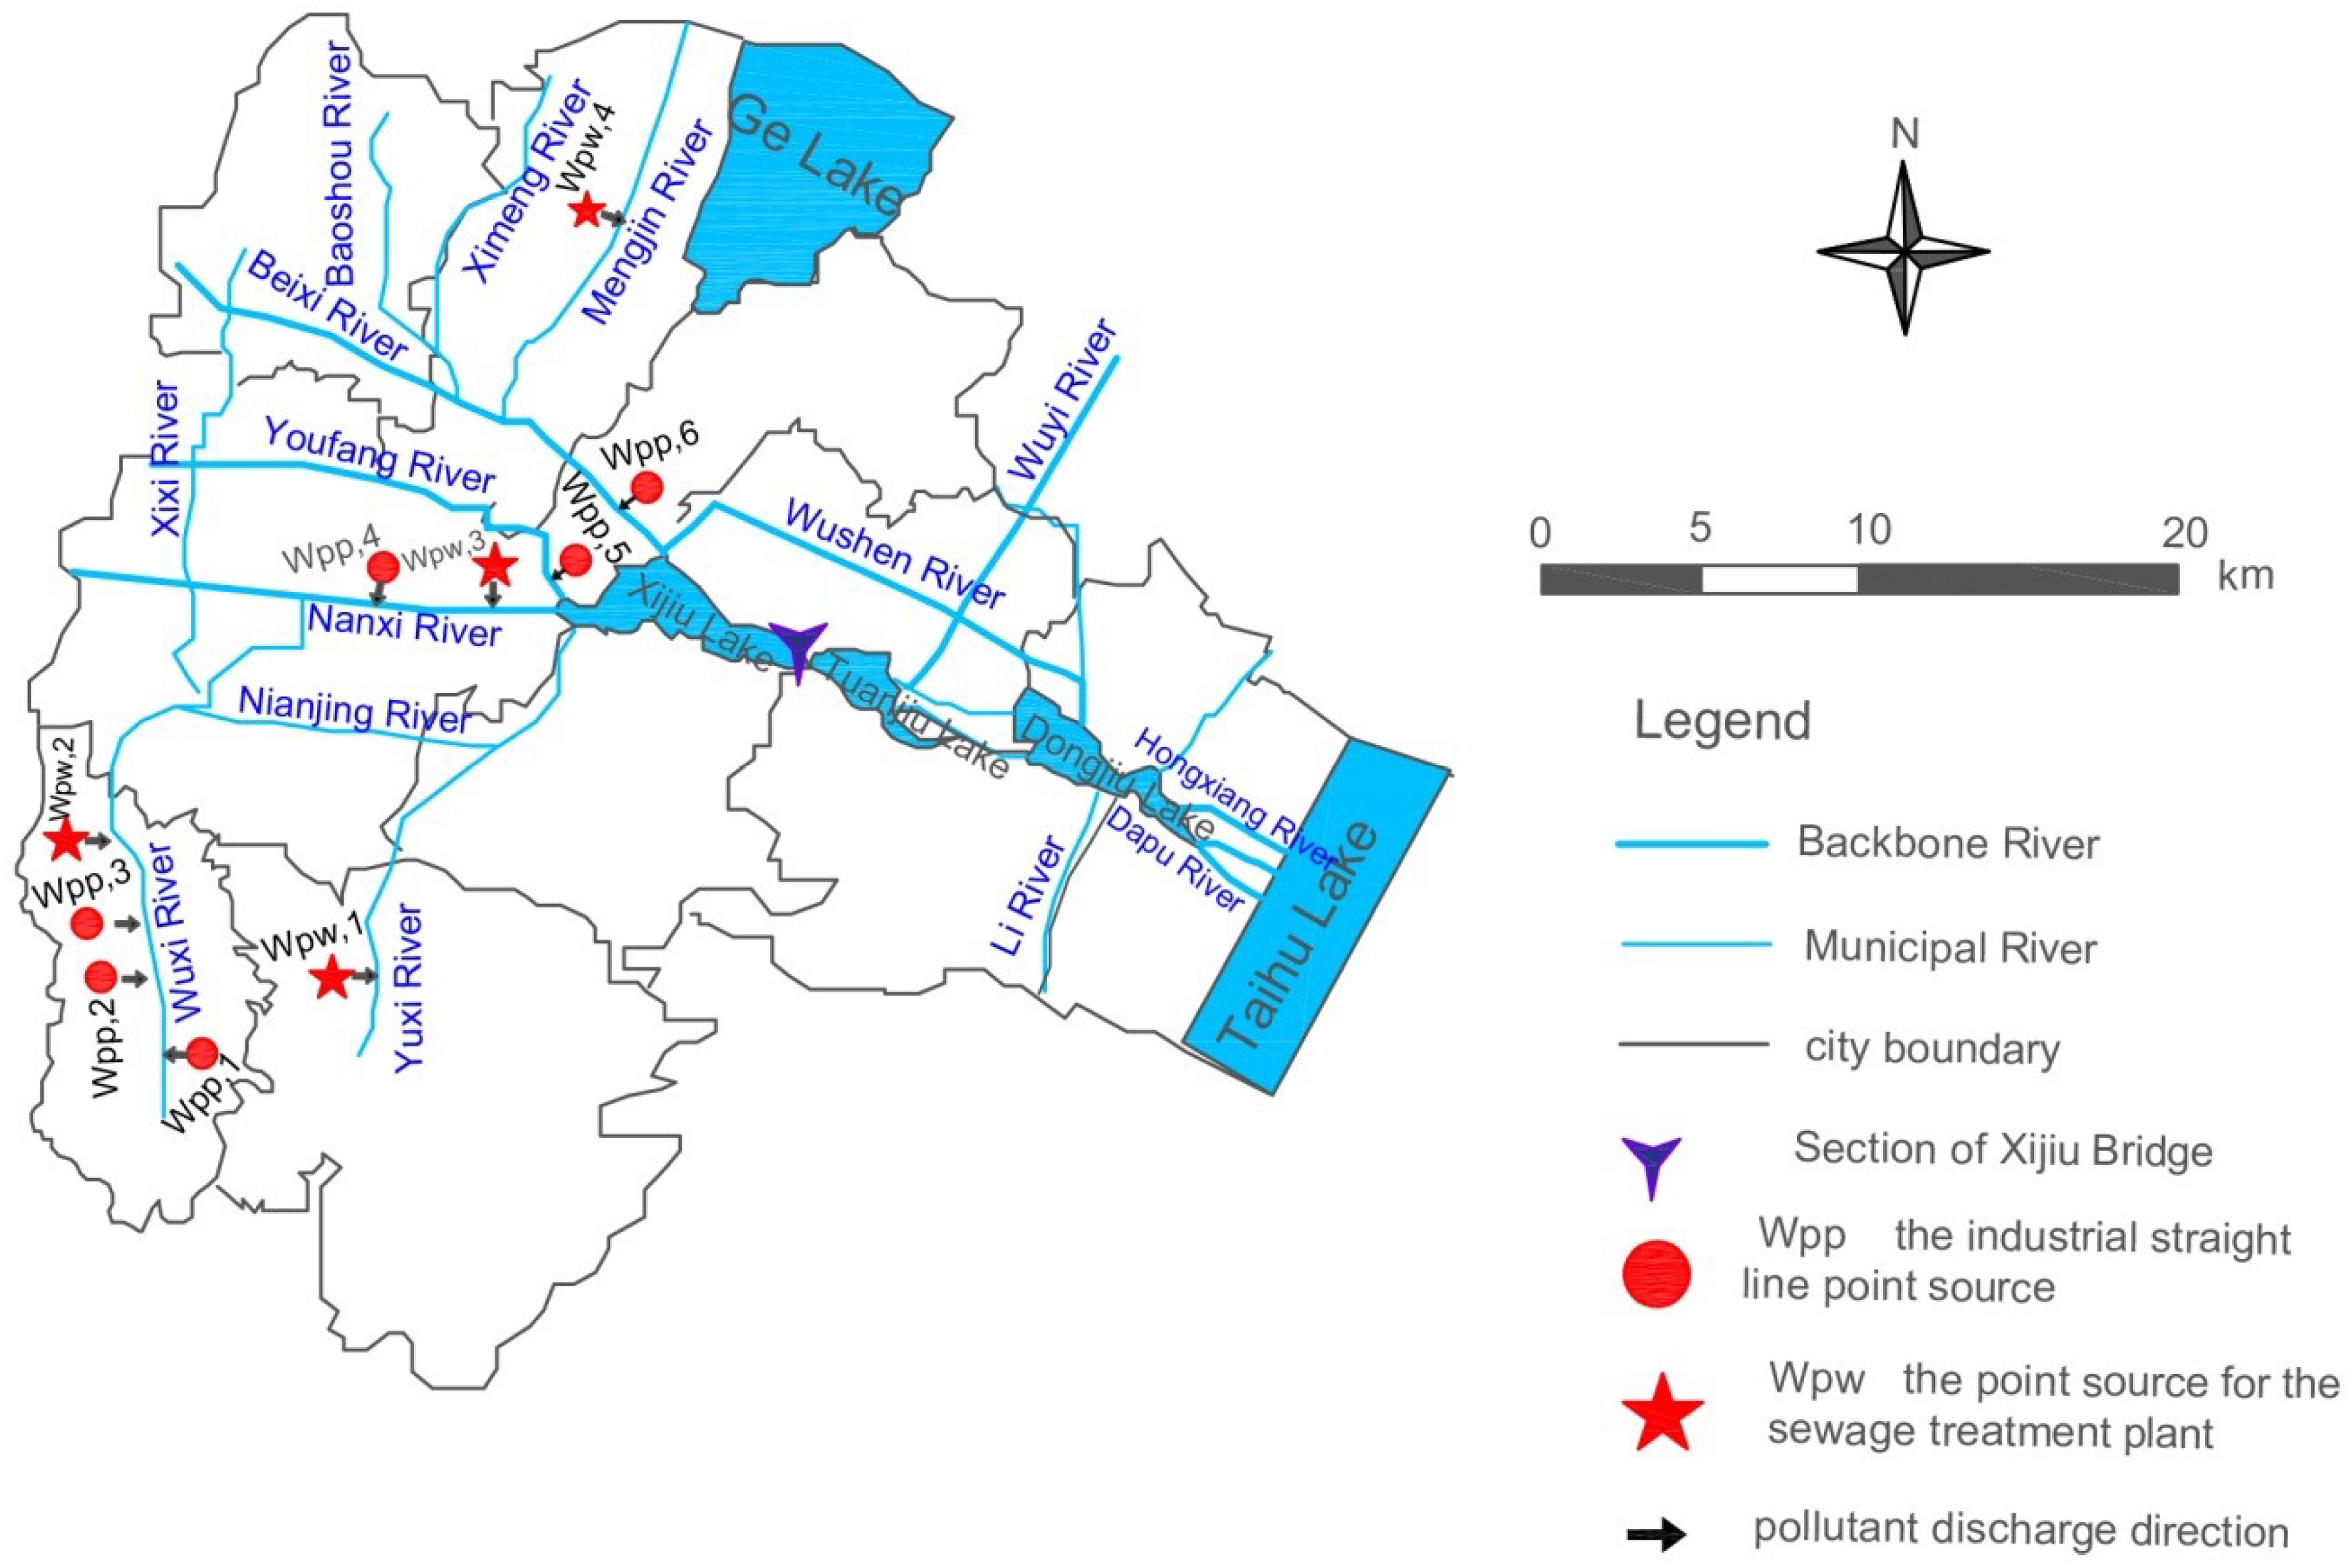
Figure 1. Representative section of water system and water quality control in the study area.
Water 11 00900 g001
Figure 2. Comparison of calculated water level to measured values.
Water 11 00900 g002
Figure 3. Comparison between calculated and measured water quality (the upper graph is for ammonia-nitrogen; the lower graph is for total phosphorus).
Water 11 00900 g003
Figure 4. Concentration curve for ammonia-nitrogen and total phosphorus in the controlled section (the upper graph is for ammonia nitrogen; the lower graph s for total phosphorus. The horizontal line represents the value of water quality class III in China).
Water 11 00900 g004
Table 1. Current pollutant discharge load in the study area.
Pollutant SourceDischarge Load (t/year)Pollutant Source Style
Ammonia-Nitrogen (NH3-N)Total Phosphorus (TP)
WPP,12.20.2Point source
industrial outlet
WPP,220.2
WPP,31.30.1
WPP,40.20
WPP,50.20
WPP,60.10
WPW,130.36.06Point source
waste water treatment outlet
WPW,210.42.08
WPW,38.031.6
WPW,47.31.46
WNS,120.12.5Non-point source
WNS,245.65.7
WNS,365.38.2
WNS,432.44
WNS,518.62.3
WNS,610.71.4
WNS,711.11.4
WNN,137.27.99Non-point source
agricultural
WNN,235.57.77
WNN,367.939.7
WNN,461.213.3
WNN,530.76.62
WNN,643.79.7
WNN,79.811.95
Total551.7124.2
Table 2. Upper and lower bound constraint parameters of the decision variables.
IndexValueGovernance Measures
A NS , i min 10%Takeover or build a decentralized wastewater treatment facility
A NS , i max 40%According to relevant pollution control management requirements
A NN , j min 20%Various measures related to agriculture
A NN , j max 100%Current pollution-free control management requirements
A PW , k min 60%Accelerate the upgrading of urban sewage treatment plants
A PW , k max 80%Multi-channel utilization of tail water
A PP , l max 80%Enterprises in industrial concentration areas takeover, printing and dyeing enterprises raise standards, and the reuse of water is increased
Solution: Using a genetic algorithm, α i ,   β j ,   δ k ,   γ l ,   W NS , i 0 ,   W NN , j 0 ,   W PW , k 0 ,   W PP , l 0 ,   C B , and C S are known constants.
Table 3. Ammonia-nitrogen and total phosphorus pollutant allocation results.
Pollutant Source CodeNH3-NTP
Current Pollution LoadAllowed EmissionsReductionReduction RateCurrent Pollution LoadAllowed EmissionsReductionReduction Rate
Unit(t/year)(t/year)(t/year)(%)(t/year)(t/year)(t/year)(%)
WPP,12.21.151.05480.20.10.150
WPP,221.040.96480.20.110.0947
WPP,31.30.680.62480.10.050.0551
WPP,40.20.10.1520000
WPP,50.20.10.1500000
WPP,60.10.1000000
WPW,130.321.88.46286.064.871.1920
WPW,210.47.33.1302.081.620.4622
WPW,38.035.652.38301.61.280.3220
WPW,47.35.132.17301.461.170.2920
WNS,120.13.6316.5822.51.5140
WNS,245.68.7136.9815.73.42.340
WNS,365.312.253.1818.25.183.0237
WNS,432.45.7726.68242.271.7343
WNS,518.63.3715.2822.31.330.9742
WNS,610.71.878.83821.40.790.6144
WNS,711.11.979.13821.40.790.6144
WNN,137.216.620.7567.996.331.6621
WNN,235.514.920.5587.774.653.1240
WNN,367.921.646.36839.716.223.659
WNN,461.22140.26613.39.523.7428
WNN,530.715.715496.624.482.1432
WNN,643.717.726609.76.183.5136
WNN,79.817.232.58261.951.260.736
Total551.7195.2356.565124.273.0251.1841