Abstract
Hydrological changes attributable to global warming increase the severity and frequency of droughts, which in turn affect agriculture. Hence, we proposed the Standardized Agricultural Drought Index (SADI), which is a new drought index specialized for agriculture and crops, and evaluated current and expected droughts in the Korean Peninsula. The SADI applies crop phenology to the hydrological cycle, which is a basic element that assesses drought. The SADI of rice and maize was calculated using representative hydrological variables (precipitation, evapotranspiration, and runoff) of the crop growing season. In order to evaluate the effectiveness of SADI, the three-month Standardized Precipitation Index, which is a representative drought index, and rainfed crop yield were estimated together. The performance evaluation of SADI showed that the correlation between rainfed crop yield and SADI was very high compared with that of existing drought index. The results of the assessment of drought over the past three decades provided a good indication of a major drought period and differentiated the results for crops and regions. The results of two future scenarios showed common drought risks in the western plains of North Korea. Successfully validated SADIs could be effectively applied to agricultural drought assessments in light of future climate change, and would be a good example of the water-food nexus approach.
1. Introduction
Many climate change-related studies at global levels have shown the most notable changes in temperate regions, particularly highlighting hydrological changes [1,2]. Hydrological changes lead to climate disasters such as droughts and floods, and recent extreme droughts and floods have appeared in many parts of the world [3]. In 2016, the cause of Brexit, namely Britain’s withdrawal from the European Union, was socio-economic and political, but it originated from a prolonged, severe drought in Syria [4,5]. This drought, which has been extensive and prolonged owing to climate change, has had a direct impact on agriculture and has resulted in the emergence of refugees and international issues.
Traditionally, understanding of droughts has been conducted to promote primary industrial productivity, such as agriculture, where water consumption is high [6]. In recent years, climate dependence on water supply in most developed countries has decreased due to expanding irrigation facilities, but it is still a major problem in developing countries and can cause limitation of irrigation facilities in extreme drought situations [7,8]. The monitoring and prediction of drought are still important for human survival.
Drought indexes are widely used to predict and evaluate droughts. Many drought indexes, such as the Standardized Precipitation Index (SPI), the Palmer Drought Severity Index (PDSI), and the Standardized Precipitation Evapotranspiration Index (SPEI), have been proposed and widely used in agriculture, hydrology, and forestry [9,10,11]. Although the reliability of existing meteorological drought indexes has been proven in many studies, they are not highly relevant to the effects on vegetation, such as agriculture and forests [11,12]. They are limited to considering the characteristics of a specific agriculture, forest and ecosystem because of the use of time series precipitation data or the consideration of evapotranspiration in calculating the drought index. In order to compensate for this, some drought-related indexes have been proposed for specific agriculture and forest disasters using soil and vegetation-related variables [13,14,15]. However, owing to the lack of meteorological considerations, it is difficult to make future predictions for extreme climate changes. In other words, representative drought indexes can assess hydrometeorological or vegetative conditions, but are limited to agriculturally and hydrologically connected assessments.
Although drought is meteorologically and hydrologically defined and indexed, it is necessary to overcome the limitations of the relationship with agriculture. In agriculture, the amount of water demand, yield, and cultivation period are different depending on the characteristics of the crops, but existing drought indexes have difficulties considering these [16,17]. In recent years, there have been various attempts at the concept of a water-food nexus, but there have not been many studies suggesting a practical approach through a structural linkage [18,19]. Thus, it is necessary to contribute to understanding the amount of water available and the amount of water needed for agriculture through an agriculture or crop-specific drought index.
Hence, in this study, we tried to assess the current and future agricultural droughts in the Korean Peninsula using a new crop-specific drought index. This study presents the Standardized Agricultural Drought Index (SADI) for each crop, which is an agricultural drought index considering the hydrological cycle and crop phenology. We evaluate the effectiveness of the SADI over the past three decades of data and applied two climate change scenarios to estimate short-term and long-term future changes. Ultimately, we present the importance of crop-specific agricultural drought indexes and the importance of the nexus approach between agriculture and water.
2. Data and Methods
2.1. Study Area
The Korean Peninsula has a temperate monsoon climate with hot and humid summers and cold, dry winters. The average annual temperature is 10–16 °C and the annual precipitation is about 1000–1400 mm [20]. Geographically, the northern part of the Kaema Plateau and the Taebaek mountain range on the east coast are major mountainous areas, and plains are widely distributed around the west coast [20,21] (Figure 1).
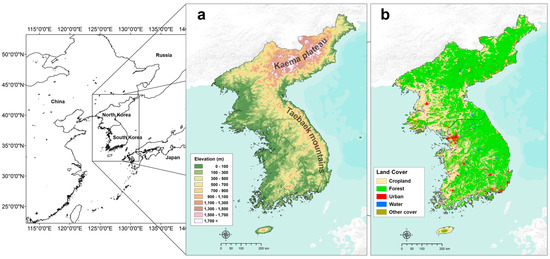
Figure 1.
Study area. (a) topographical information, (b) land cover.
The Korean Peninsula, which includes the Republic of Korea (hereafter ‘South Korea’) and Democratic People’s Republic of Korea (hereafter ‘North Korea’), covers an area of 221,000 km2, of which about 55,000 km2 is farmland, accounting for 25%. Cropland covers approximately 20,000 km2 in South Korea and 35,000 km2 in North Korea, and the cropland in North Korea has greatly increased in the past two decades [22,23]. This is a phenomenon caused by rapid deforestation and cropland expansion due to food problems in the 1990s [23]. Traditionally, rice is a staple food in the Korean Peninsula, so rice production is the most popular. In North Korea, maize is also used as a major food crop. Although the crop phenology differs depending on the region due to its long north-south characteristics, maize is a typical phenology from April to July–August, and rice is from May to September.
The Korean Peninsula is a temperate region in the mid-latitudes, and it is expected that the annual mean temperature will increase 4 °C by the year 2100 and the precipitation pattern also will change significantly with climate change [20,24]. It has been predicted that agricultural productivity will increase, but it is expected that it will be necessary to provide a stable water supply and risk reduction owing to exposure to climate disasters and hydrological changes [21].
2.2. Concept of SADI
The SADI is theoretically defined as the state of the hydrometeorological water cycle for each crop phenology. Three specific hydrological variables, namely precipitation, evapotranspiration, and runoff, are needed to calculate the SADI. It is fundamentally based on the hydrological cycle, but it is calculated for the crop phenology rather than annually. SADI assesses drought through equilibrium, taking into account the water supply and demand of the crop phenology. The calculation is as follows:
where PGS, QGS, and ETGS are the growing season precipitation, growing season runoff, and growing season evapotranspiration, respectively, and μAD and σAD are the 30-year arithmetic mean and standard deviation of AD, respectively.
The growing season of each crop, namely crop phenology, was estimated by the Environmental Policy Integrated Climate (EPIC) crop model. Climatic verified cropping information was applied to the model parameters to simulate harvesting when all the crops were grown. Here, the period between the planting date and harvesting date was defined as the growing season for each crop, this growing season was defined as phenology. In this study, the SADI was calculated for rice and maize.
Potential evapotranspiration (PET) for calculating ETGS was based on the Penman–Monteith equation [21], which is the most representative estimation method. PET was estimated, then evapotranspiration was calculated according to the crop coefficient by crop, and ETGS was calculated according to the phenology. The estimation equation is as follows:
The Penman–Monteith equation simulates the daily PET. Daily minimum and maximum temperatures, solar radiation, relative humidity, and wind speed data are required. RN is the total solar irradiance (MJ·m−2·d−1), δ is the slope of the saturation vapor pressure curve (kPa·°C−1), AD is the air density (kg·m−3), and EA is the saturation vapor pressure at mean air temperature (kPa). RH is the average relative humidity per day, U is the average daily wind speed (m·s−1), T is the daily average temperature (°C), and γ is the psychrometric constant (kPa·°C−1) [21].
Runoff was estimated based on the Groundwater Loading Effects of Agricultural Management System (GLEAMS) model equation [25,26]. The GLEAMS model is a physically based mathematical model developed for evaluating the effects of agricultural management systems on field-sized areas within and throughout the plant root zone. It is composed of four sub-modules for hydrology, erosion/sediment yield, pesticides, and plant nutrients, but we only used the hydrology sub-module for estimating the amount of runoff. The GLEAMS hydrology sub-model parameter sets were constructed for the developing periods for each of the plots and catchments in the United States [25]. The sequence for the parameterization of each component consists of the soil, crop, and tillage operations provided for each site and the supporting database information provided with the model [25]. The hydrologic soil groups and runoff curve numbers are applied differently depending on the soil characteristics of the region. Runoff calculation by the GLEAMS model equation uses a modified soil conservation service curve number procedure [27]. The hydrologic soil groups and runoff curve numbers are applied differently depending on the region’s soil characteristics but they most have C–D group and a runoff curve number of 80–90 in most of Korean Peninsula [23]. The runoff estimation equation is as follows:
where Q is runoff volume (cm day−1), P is daily precipitation (cm day−1), SM is snowmelt contribution to precipitation (cm day−1), and S (cm day−1) is an abstraction which is a function of soil conditions and land use [28]. A more detailed description of the model can be found in the GLEAMS manual [23,29].
SADI classifies drought into eight classes according to the index value. This classification refers to the standard of other representative drought indexes, and these are summarized in Table 1.

Table 1.
Classification of drought according to the Standardized Agricultural Drought Index (SADI).
2.3. Evaluation of SADI
In order to evaluate the effectiveness of the SADI, we conducted a comparative analysis with the agricultural productivity and the existing representative drought index. However, since productivity in agricultural statistics refers to the irrigation condition, we estimated the crop yield of the rainfed condition and evaluated its effectiveness. The rainfed crop yields of rice and maize were estimated using the EPIC crop model, which has been successfully tested on the Korean Peninsula. The three-month SPI (SPI-3) was selected as the representative drought index, and it was calculated for the same period and compared with the SADI and rainfed crop yield. The SPI is based on monthly precipitation data over a mostly continuous period of a minimum of 30 years. Statistics were used to determine the dryness or wetness by comparing past precipitation data over the same period as the total months of rainfall. Precipitation was normalized using a probability distribution function, so the value of the SPI was actually the standard deviation of the median. Although, for SPI, there are various types such as SPI-1, 3, 6, 12, and 24 depending on the range of application of precipitation data, in this study, we applied SPI-3, which has been shown to be related to agriculture and most widely used [30,31]. A detailed description of the SPI can be found in McKee et al. [32] and in similar studies [11,12]. In the case of the SPI, which is calculated monthly, the annual average SPI-3 was calculated separately for comparison with the SADI derived from annual data. Linear regression analysis and coefficient of determination were used to determine the relationships between the SADI and rainfed crop yield and the SPI-3 and rainfed crop yield.
2.4. Use of the EPIC Crop Model to Estimate Crop Phenology and Rainfed Crop Yield
The EPIC model is a widely used crop model worldwide, and it has been applied in many studies on the Korean Peninsula [21,23,33,34,35]. In this study, the EPIC crop model was used for gridded estimation of crop phenology using the parameters of optimum climate conditions (see later) and for gridded estimation of rainfed crop yield to evaluate the performance of the SADI.
EPIC is a generic crop model that was developed in the United States. It is used in various fields related to the agricultural environment, such as crop productivity, soil quality and condition, and hydrological variables [25,35,36]. It was first developed in the 1980s, and has been updated and widely used in agricultural research in the United States, Europe, Asia, Africa, and global scale [37,38,39]. We used the most recent version of the EPIC model (EPIC 0810). In the EPIC model to estimate crop growth, potential biomass is calculated daily from photo-synthetically active radiation and radiation-use efficiency [37]. And a potential biomass is adjusted to actual biomass through daily stress caused by water condition, extreme temperatures, and nutrient deficiency [37,40]. The estimation of daily potential biomass growth uses climate-related parameters, such as solar radiation, temperature, and biomass-energy conversion rates of crops. Ultimately, crop yield estimates are based on the actual biomass accumulation and crop harvest index [38,41].
In this study, a calibrated crop parameter was used to estimate the crop yield on the Korean Peninsula using previous verified studies [21,35]. For rice, the optimum temperature was 25 °C, the base temperature was 10 °C, the harvest index was 0.55 mg·mg−1, the biomass-energy ratio was set at 30 kg·MJ−1, and the potential heat unit (PHU) ranged from 1300 °C to 1500 °C depending on the climate of the specific grid cells. For maize, the optimum temperature was 25 °C, the base temperature was 8 °C, the harvest index was 0.45 mg·mg−1, the biomass-energy ratio was set at 43 kg·MJ−1, and the PHU range was 1000–1200 °C depending on the climate of the specific grid cells [21,37,38]. These parameters have been verified for performance in previous studies in the Korean Peninsula [21,34,35], and thus were not evaluated for crop yield estimates. Lim et al. [35] verified for rice yield by an average accuracy of 91% in the root mean square error (RMSE) and an average error rate of 4.2% in the relative error. Kafatos et al. [34] showed an average accuracy of 80% for maize yield estimation. In Lim et al. [21], the average accuracy by RMSE of rice was 89% and the relative error was 2.3%, and the RMSE of maize was 81% and the relative error was 5.8%. The rice showed a more accurate evaluated result, and the maize also had a sufficiently high level of accuracy. The three studies, although the same calibrated version was used for the Korean Peninsula, showed a little different accuracy by the dissimilar spatial unit of statistics and different climate data. Unlike the estimates rainfed crop yield in this study, these references are simulated and verified in irrigated conditions, but it is reasonable to utilize this calibrated version because the statistical evaluation of rainfed crop yields is not possible.
2.5. Climate and Other Input Data and Process
For calculating SADI, six meteorological variables at a daily time scale were required (minimum and maximum temperature, solar radiation, precipitation, relative humidity, and wind speed). Precipitation was used to calculate PGS and SPI-3, the remaining five variables were used to calculate ETGS, and all six variables were used to calculate QGS. Daily meteorological data were obtained by the Korean Meteorological Administration online climate data portal system. We used 102 weather stations for the period of 1981–2010. For points for which there were no records, the parameters were determined using the Kriging and inverse distance weighted (IDW) interpolation methodologies for 1 km2 spatial resolution. The Kriging method was used to interpolate the maximum and minimum temperature, and the IDW method was applied to solar radiation, precipitation, relative humidity, and wind speed [42,43,44].
In addition, to assess future agricultural drought, we applied two typical climate change scenarios, namely Representative Concentration Pathways (RCPs) 4.5 and 8.5. We used the HadGEM2-AO Global Climate Model (GCM) developed by the Hadley Centre for Climate Prediction and Research in the United Kingdom, and the HadGEM3-RA regional climate model. The HadGEM3-RA is a regional downscaled version of the HadGEM2-AO GCM. The climate model data for the study area were acquired through the Coordinated Regional Climate Downscaling Experiment-East Asia. All the future climate data had 12.5 km2 spatial resolution, but we resampled the spatial resolution to 1 km2 using the nearest technique considering the small patch characteristics of Korean cropland. We utilized 40 years of future climate data from 2041 to 2080. The EPIC model required several soil-related parameters (pH, OC (%), bulk density (tm−3), cation exchange capacity (cmol·kg−1), silt (%), sand (%), and electrical conductivity (mS·cm−1)). The soil data were constructed spatially using the Digital Soil Map of the World [45] and the ISRIC-WISE database [46].
We used the 2010 Global Land Cover 30 (GLC30) data to apply the current agricultural area [47] (accessed from http://www.globallandcover.com). The GLC30 is a constructed 30 m2 land cover map based on Landsat 7 satellite imagery. We extracted the cropland of the Korean Peninsula and resampled the nearest technique with 1 km2 grid cells.
The overall process of calculating these SADI is shown in Figure 2.
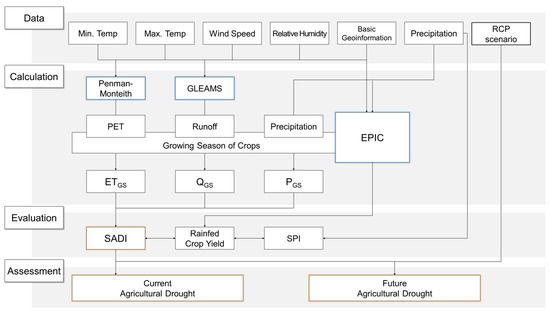
Figure 2.
Graphical methodology of this study.
3. Results and Discussion
3.1. Evaluation of SADI Using Rainfed Crop Yield and the SPI-3
In the baseline period (1981–2010), we compared the SADI, SPI-3, and rainfed crop yield annually. The SADI of rice (SADI-Rice) showed a higher annual deviation than the SPI-3 or rainfed crop yield, and there was a severe agricultural drought in 1988–1989 and 2000. On the other hand, very wet conditions were observed in 1998 and 2002, and it was estimated that the rainfed rice yield was high in this period. In fact, 2002 was the year when summer precipitation was more concentrated. SADI sensed the highly wet condition of the growing season, while SPI-3 showed a significant difference from the production due to other seasonal dry conditions. Overall, the SADI-Rice and rainfed rice yields showed similar trends, while the SPI-3 and rainfed rice yields showed less similarity (Figure 3). The SADI-Rice and SPI-3 showed a similar trend, but only during a certain period.
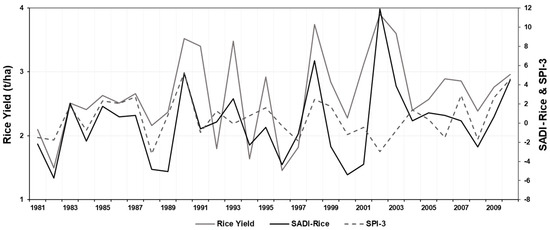
Figure 3.
Annual comparison of the Standardized Agricultural Drought Index for rice (SADI-Rice), three-month Standardized Precipitation Index (SPI-3), and rainfed rice yield (1981–2010).
In the case of SADI of maize (SADI-Maize), the similarity with the rainfed maize yield was higher than that for rice. In 1990, the three indicators which is SADI-maize, SPI-3, and rainfed maize yield showed similar values, and in 1998, the similarities were high. However, the SPI-3 and rainfed maize yield were significantly different at many times, while the SADI-Maize showed a consistent pattern with rainfed maize yield. SADI-Maize estimated that there was a severe agricultural drought in 1982 and 2000, and the rainfed maize yield showed the same tendency (Figure 4). In the case of agricultural statistics and related research, it was reported that the agricultural production was relatively low during these years [21,48,49].
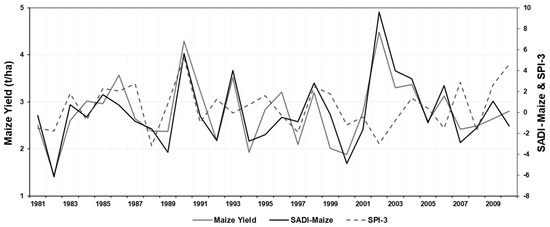
Figure 4.
Annual comparison of the Standardized Agricultural Drought Index for maize (SADI-Maize), three-month Standardized Precipitation Index (SPI-3), and rainfed maize yield (1981–2010).
The relationship between SADI and rainfed crop yield was revealed in the linear comparison with the linear regression analysis, but the relationship between the SPI-3 and rainfed crop yield was very weak (Figure 5). Between the SADI-Rice and rainfed rice yield, the linear regression returned a coefficient of determination of 0.523, which showed a sufficient correlation with productivity. On the other hand, the SPI-3 showed a coefficient of determination of only 0.051 with rainfed rice yield. Between the SADI-Maize and rainfed maize yield, the linear regression returned a coefficient of determination of 0.763, which was highly correlated with productivity. On the other hand, the SPI-3 showed a coefficient of determination with rainfed maize yield of only 0.026.
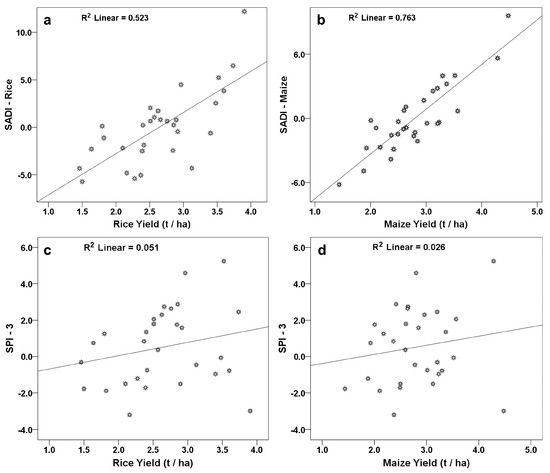
Figure 5.
Linear regression for the Standardized Agricultural Drought Index (SADI), three-month Standardized Precipitation Index (SPI-3), and crop yield ((a): SADI-Rice and rainfed rice yield, (b): SADI-Maize and rainfed maize yield, (c): SPI-3 and rainfed rice yield, and (d): SPI-3 and rainfed maize yield).
The SADI using crop-specific phenology was found to be highly correlated with rainfed crop yield compare with the SPI-3, although it was not the actual production statistics. SADI showed high similarities with both crops, and especially indicated a high correlation with crop yield for maize. The high correlation with rainfed crop yields could be interpreted as the high explanatory power of the SADI for agricultural productivity and agricultural water demand.
3.2. Assessing Agricultural Drought of the Baseline Period Using the SADI
The SADI-Rice calculated for all regions on the Korean Peninsula demonstrated that the spatial patterns changed over time. Initially, in the 1980s, North Korea was wetter than South Korea during the rice growing season, but this was reversed in the 1990s (Figure 6). In particular, the northern part of North Korea showed widespread, severe drought conditions in the 1990s. In the 1990s, North Korea suffered from a significant food problem, which was called the Arduous March. In the 2000s, overall wet conditions were observed, and the extremely wet area was very wide in South Korea. However, in North Korea, dry conditions were still widely distributed in the northern area. The average SADI over the 30 y identified the southern part of the peninsula as the wettest region and the northern part as the driest (Figure 5). The SADI was found to have a larger annual spatial variation when compared with the previously applied drought indexes at the same regions, such as the SPI, PDSI, and SPEI [8,10,11,50].
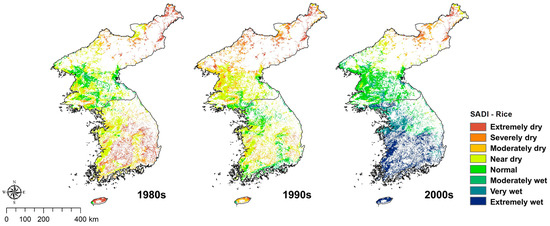
Figure 6.
Spatial distribution of the Standardized Agricultural Drought Index for rice (SADI-Rice) for the 1980s, 1990s, and 2000s.
The spatial patterns for the SADI-Maize also varied with time (Figure 7). In the 1980s, it was dry in the inland area and relatively wet in North Korea. In the 1990s, the severely dry region was widespread in South Korea, and, as in the 1980s, North Korea showed wetter conditions. In northern North Korea, which is known to be disadvantageous for agriculture owing to the temperature distribution, most areas had wet conditions that were greater than medium. In the 2000s, overall wet conditions were observed throughout the Korean Peninsula, and dry conditions were only observed in some inland and island areas. The northern part of the Korean Peninsula was wetter during the maize growing season than the southern regions based on the three decades average (Figure 7).
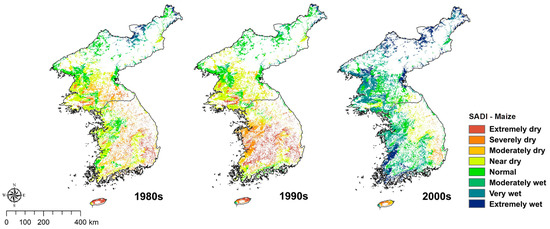
Figure 7.
Spatial distribution of the Standardized Agricultural Drought Index for maize (SADI-Maize) in the 1980s, 1990s, and 2000s.
These clear differences between rice and maize were not reflected in the meteorological drought index such as SPI-3 [8,10,14].
3.3. Assessing Agricultural Droughts in the Future Using the SADI and Two RCP Scenarios
Future drought assessments were made using data from 40 years from 2041 to 2080 and spatially suggested mean values in the 2050s (2041–2060) and 2070s (2061–2080). For future SADI estimations, rice and maize demonstrated similar results. Both crops were predicted to face drier conditions in the future for both climate change scenarios.
In the case of the SADI-Rice, South Korea was significantly wetter in the baseline period compared to North Korea, and the west coast was wet compared to inland and northern regions (Figure 8). For the RCP 4.5 scenario in the 2050s, the wet area of South Korea appeared to be widening, but in the case of North Korea, moderately and severely dry areas were found to be widespread in the western plain, which is the most important granulous area. For the RCP 4.5 scenario in the 2070s, the wet region in South Korea decreased and the dry region in North Korea decreased. This tendency was similar in the RCP 8.5 scenario at the 2050s and 2070s, respectively. Nevertheless, the dry area of North Korea for the RCP 8.5 scenario was more widespread than the RCP 4.5 scenario. Overall, dryness decreased in the northern part of the Korean Peninsula where the dry region was widespread in the baseline period, and the increase in dryness in the western part of North Korea was significant.
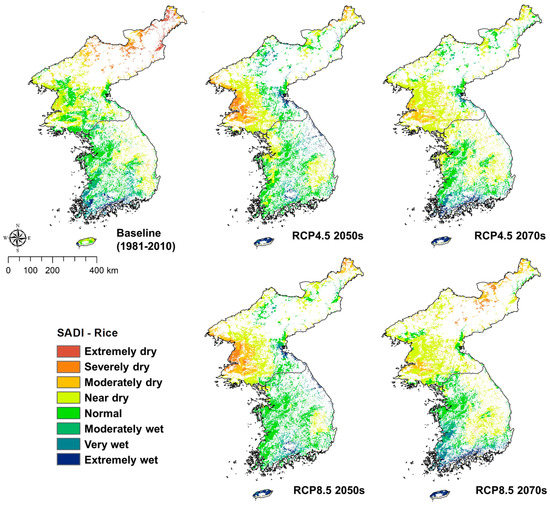
Figure 8.
Spatial distribution of the Standardized Agricultural Drought Index for rice (SADI-Rice) in the baseline and future climate scenarios.
In the case of the SADI-Maize, the baseline period was found to be wetter in North Korea than in South Korea, and dry regions were found in the inland and island areas (Figure 9). For the RCP 4.5 scenario in the 2050s, the wetness increased in the South compared with that in the baseline period, and moderately and severely dry areas in the western plain were found to be widespread in North Korea. This tendency was similar in the RCP 8.5 scenario. In the 2070s, wet conditions increased in South Korea’s southern coastal and island areas, while severely dry areas in North Korea decreased, but nearby dry regions increased. In the case of Jeju Island, which is basaltic, water resources are limited in agricultural areas, and wet conditions are caused by the increase in overall precipitation.
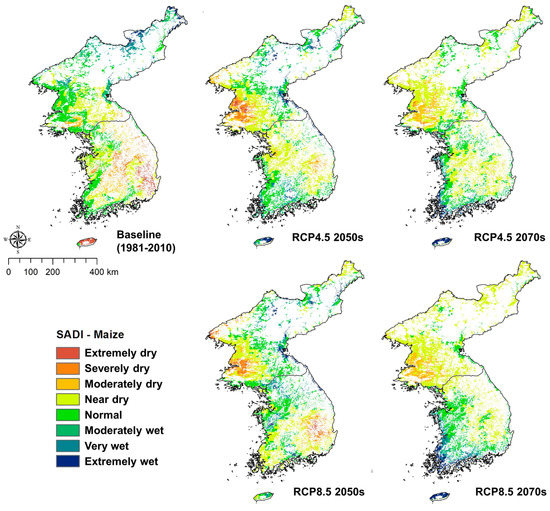
Figure 9.
Spatial distribution of the Standardized Agricultural Drought Index for maize (SADI-Maize) in the baseline and future climate scenarios.
Generally, the risk of agricultural drought in North Korea in the future is high. The western plains of North Korea were predicted to be particularly affected in this respect. However, unlike previous studies, the causes of inconsistency between the drought assessment for South Korea and North Korea (RCP 8.5: 2070s) seemed to be related to crop cycles [51,52].
In the southern part of the Korean Peninsula, which will shift toward a subtropical climate in the future, the growing season for maize and rice will shorten, thereby ameliorating the damage caused by agricultural drought [53,54].
3.4. Implications of the New Agricultural Drought Index Using a Water-Agriculture Nexus Approach
The reason why existing drought indexes are not related to agricultural productivity or water demand is because they are focused on hydrometeorological changes [8,9,10]. The indexes developed specifically for agricultural drought have been developed or evaluated mainly using variables related to soil moisture and vegetation [13,14,16,17]. However, there are difficulties in forecasting or backcasting short-term or long-term, and there are limitations in connecting them with meteorological drought [14,16,55]. The SADI presented in this study might be able to overcome the limitations of the two previous types of indexes.
In terms of climate change impacts and adaptation, most studies evaluating future droughts only identified meteorological droughts [51,52,53]. This is because most of the variables needed for agricultural drought evaluation are difficult to predict for the future. In this study, we evaluated agricultural drought considering climate change by using crop phenology. Although only two representative crops were considered in this study, the effects of climate change on overall agriculture could be predicted deeply with the application of vegetables and other main crops [56].
The development of SADI using hydrological cycles and crop phenology is an example of an empirical nexus approach between water and food. Many nexus concepts have been presented in the water-food sector, but they have only focused on quiet conceptualizing or synergies and trade-offs based on intervariable relationships [18,57,58]. In other words, it was difficult to apply the nexus approach within the equations and into the variables. However, the SADI is significant in that it is more empirically integrate through linkage within equations and concepts.
Nevertheless, this study had some limitations. First, there were structural limitations in that it could not be quantitatively compared to production statistics. In the case of representative crops, irrigation is basically used in production and agricultural statistics are produced, so it is impossible to directly verify the statistical crop yield. It would be possible to verify this if the SADI were used with the crop phenology of vegetable crops for which rainfed cultivation statistics are available. The second limitation was that only one model’s data could be used for future climate predictions, and the spatial resolution of the overall climate data was not high. Future climate data have been produced by various climate models of Coupled Model Intercomparison Project Phase 5, but this study only used data from one climate model to focus on the development and application of new indexes. In addition, the spatial resolution of the original climate data was low, but that for drought assessment progressed to 1 km2 owing to the nature of the cropland consisting of small patches on the Korean Peninsula. This could also cause uncertainty.
In summary, the results of this agricultural drought assessment showed similarities and differences with previous results. While the same at-risk areas and time frames were identified, crop cycle characteristics not captured by meteorological drought or productivity measurements were observed. Thus, nexus thinking has the ability to identify previously unidentified phenomena by suggesting new forms of output, such as the SADI.
4. Conclusions
A new agricultural drought index considering the hydrological cycle and crop phenology is suggested, namely the SADI. Close assessment of agricultural drought using SADI in the Korean Peninsula has significant implications for the empirical water-food nexus approach and for identifying regions at risk of drought due to climate change. The growing season precipitation, evapotranspiration, and runoff were used to calculate the SADI of each crop, and two climate change scenarios were applied for assessing future agricultural drought. First, the evaluation of the SADI performance, which was compared with the rainfed crop yield, showed excellent results compared with those of the traditional drought index. As an assessment result of the baseline period, we could identify the spatial difference according to the crops in the same period and area, and could confirm the traditional difference between South Korea and North Korea. In future scenarios, the SADI predicted to face drier conditions for both climate change scenarios and each crop. The risk of agricultural drought in North Korea was expected to be higher than that in South Korea, and the western plains of North Korea might be particularly affected in this respect. The SADI has great significance in realizing the structural linkage between the water and food sector, but it is limited in that it could not have a high correlation with the actual statistical crop yield. This study highlighted the fact that a drought index considering crop phenology could contribute to enhancing the assessment of climate change impact and to comprehensive adaptation in the water-agricultural sector.
Author Contributions
Conceptualization, methodology and lead writing, C.-H.L.; data preparation and analysis, C.-H.L. and S.H.K.; writing—review and editing, J.A.C. and M.C.K.; supervision, W.-K.L.
Funding
This research was supported by the National Research Foundation of Korea (NRF) grant of the Ministry of Science and ICT, grant numbers 2018K1A3A7A03089842 and 2019R1C1C1004979, and by Korea University grant.
Conflicts of Interest
The authors declare no conflict of interest.
References
- IPCC. Climate Change 2014: Impacts, Adaptation, and Vulnerability. Part A: Global and Sectoral Aspects, Contribution of Working Group II to the Fifth Assessment Report of the Intergovernmental Panel on Climate Change; Cambridge University Press: Cambridge, UK, 2014. [Google Scholar]
- Schlaepfer, D.R.; Bradford, J.B.; Lauenroth, W.K.; Munson, S.M.; Tietjen, B.; Hall, S.A.; Wilson, S.D.; Duniway, M.C.; Jia, G.; Pyke, D.A. Climate change reduces extent of temperate drylands and intensifies drought in deep soils. Nat. Commun. 2017, 8, 14196. [Google Scholar] [CrossRef]
- Roudier, P.; Andersson, J.C.; Donnelly, C.; Feyen, L.; Greuell, W.; Ludwig, F. Projections of future floods and hydrological droughts in Europe under a +2 C global warming. Clim. Chang. 2016, 135, 341–355. [Google Scholar] [CrossRef]
- Kelley, C.P.; Mohtadi, S.; Cane, M.A.; Seager, R.; Kushnir, Y. Climate change in the Fertile Crescent and implications of the recent Syrian drought. Proc. Natl. Acad. Sci. USA 2015, 112, 3241–3246. [Google Scholar] [CrossRef] [PubMed]
- Gietel-Basten, S. Why Brexit? The toxic mix of immigration and austerity. Popul. Dev. Rev. 2016, 42, 673–680. [Google Scholar] [CrossRef]
- Wilhite, D.A.; Glantz, M.H. Understanding the drought phenomenon: The role of definitions. Water Int. 1985, 10, 111–120. [Google Scholar] [CrossRef]
- Karim, M.R.; Rahman, M.A. Drought risk management for increased cereal production in Asian least developed countries. Weather Clim. Extrem. 2015, 7, 24–35. [Google Scholar] [CrossRef]
- Lim, C.-H.; Kim, D.; Shin, Y.; Lee, W.K. Assessment of drought severity on cropland in Korea Peninsula using Normalized Precipitation Evapotranspiration Index (NPEI). J. Clim. Chang. Res. 2015, 6, 223–231. [Google Scholar] [CrossRef]
- Zhu, Y.; Liu, Y.; Ma, X.; Ren, L.; Singh, V.P. Drought analysis in the Yellow River Basin based on a short-scalar Palmer Drought Severity Index. Water 2018, 10, 1526. [Google Scholar] [CrossRef]
- Vicente-Serrano, S.M.; Beguería, S.; López-Moreno, J.I. A multiscalar drought index sensitive to global warming: The Standardized Precipitation Evapotranspiration Index. J. Clim. 2010, 23, 1696–1718. [Google Scholar] [CrossRef]
- Kim, S.J.; Lim, C.-H.; Kim, G.S.; Lee, J.; Geiger, T.; Rahmati, O.; Son, Y.; Lee, W.-K. Multi-temporal analysis of forest fire probability using socio-economic and environmental variables. Remote Sens. 2019, 11, 86. [Google Scholar] [CrossRef]
- Wang, K.; Li, T.; Wei, J. Exploring drought conditions in the Three River Headwaters Region from 2002 to 2011 using multiple drought indices. Water 2019, 11, 190. [Google Scholar] [CrossRef]
- Narasimhan, B.; Srinivasan, R. Development and evaluation of Soil Moisture Deficit Index (SMDI) and Evapotranspiration Deficit Index (ETDI) for agricultural drought monitoring. Agric. For. Meteorol. 2005, 133, 69–88. [Google Scholar] [CrossRef]
- Park, S.; Im, J.; Park, S.; Rhee, J. Drought monitoring using high resolution soil moisture through multi-sensor satellite data fusion over the Korean Peninsula. Agric. For. Meteorol. 2017, 237, 257–269. [Google Scholar] [CrossRef]
- Lim, C.-H.; Kim, Y.S.; Won, M.; Kim, S.J.; Lee, W.K. Can satellite-based data substitute for surveyed data to predict the spatial probability of forest fire? A geostatistical approach to forest fire in the Republic of Korea. Geomat. Nat. Haz. Risk 2019, 10, 719–739. [Google Scholar] [CrossRef]
- Martínez-Fernández, J.; González-Zamora, A.; Sánchez, N.; Gumuzzio, A.; Herrero-Jiménez, C.M. Satellite soil moisture for agricultural drought monitoring: Assessment of the SMOS derived Soil Water Deficit Index. Remote Sens. Environ. 2016, 177, 277–286. [Google Scholar] [CrossRef]
- Anderson, M.C.; Zolin, C.A.; Sentelhas, P.C.; Hain, C.R.; Semmens, K.; Yilmaz, M.T.; Tetrault, R. The Evaporative Stress Index as an indicator of agricultural drought in Brazil: An assessment based on crop yield impacts. Remote Sens. Environ. 2016, 174, 82–99. [Google Scholar] [CrossRef]
- Rasul, G.; Sharma, B. The nexus approach to water–energy–food security: An option for adaptation to climate change. Clim. Policy 2016, 16, 682–702. [Google Scholar] [CrossRef]
- Al-Saidi, M.; Elagib, N.A. Towards understanding the integrative approach of the water, energy and food nexus. Sci. Total Environ. 2017, 574, 1131–1139. [Google Scholar] [CrossRef]
- Lim, C.-H.; Yoo, S.; Choi, Y.; Jeon, S.W.; Son, Y.; Lee, W.-K. Assessing climate change impact on forest habitat suitability and diversity in the Korean Peninsula. Forests 2018, 9, 259. [Google Scholar] [CrossRef]
- Lim, C.-H.; Kim, S.H.; Choi, Y.; Kafatos, M.C.; Lee, W.-K. Estimation of the virtual water content of main crops on the Korean Peninsula using multiple regional climate models and evapotranspiration methods. Sustainability 2017, 9, 1172. [Google Scholar] [CrossRef]
- Kim, D.; Lim, C.-H.; Song, C.; Lee, W.K.; Piao, D.; Heo, S.; Jeon, S. Estimation of future carbon budget with climate change and reforestation scenario in North Korea. Adv. Space Res. 2016, 58, 1002–1016. [Google Scholar] [CrossRef]
- Lim, C.-H.; Choi, Y.; Kim, M.; Jeon, S.W.; Lee, W.-K. Impact of deforestation on agro-environmental variables in cropland, North Korea. Sustainability 2017, 9, 1354. [Google Scholar] [CrossRef]
- Choi, Y.; Lim, C.-H.; Ryu, J.; Jeon, S.W. Bioclimatic classification of Northeast Asia reflecting social factors: Development and characterization. Sustainability 2017, 9, 1137. [Google Scholar] [CrossRef]
- Leonard, R.A.; Knisel, W.G.; Still, D.A. GLEAMS: Groundwater loading effects of agricultural management systems. Trans. ASAE 1987, 30, 1403–1418. [Google Scholar] [CrossRef]
- Williams, J.R. The EPIC model. In Computer Models of Watershed Hydrology; Singh, V.P., Ed.; Water Resources Publications: Highlands Ranch, CO, USA, 1995; pp. 109–1000. [Google Scholar]
- Williams, J.R.; LaSeur, W.V. Water yield model using SCS curve numbers. J. Hydraul. Div. 1976, 102, 1241–1253. [Google Scholar]
- Ma, Q.L.; Wauchope, R.D.; Hook, J.E.; Johnson, A.W.; Truman, C.C.; Dowler, C.C.; Gascho, G.J.; Davis, J.G.; Sumner, H.R.; Chandler, L.D. GLEAMS*, opus, and PRZM-2 model predicted versus measured runoff from a coastal plain loamy sand. Trans. ASAE 1998, 41, 77–88. [Google Scholar]
- Knisel, W.G. GLEAMS: Groundwater Loading Effects of Agricultural Management Systems: Version 2.10 (No. 5); University of Georgia Coastal Plain Experiment Station, Department of Biological & Agriculture Engineering: Tifton, GA, USA, 1993. [Google Scholar]
- Zhang, Q.; Sun, P.; Li, J.; Singh, V.P.; Liu, J. Spatiotemporal properties of droughts and related impacts on agriculture in Xinjiang, China. Inter. J. Climatol. 2015, 35, 1254–1266. [Google Scholar] [CrossRef]
- Bachmair, S.; Tanguy, M.; Hannaford, J.; Stahl, K. How well do meteorological indicators represent agricultural and forest drought across Europe? Environ. Res. Lett. 2018, 13, 034042. [Google Scholar] [CrossRef]
- McKee, T.B.; Doesken, N.J.; Kleist, J. The relationship of drought frequency and duration to time scales. In Proceedings of the 8th Conference on Applied Climatology, 22nd ed.; American Meteorological Society: Boston, MA, USA, 1993; Volume 17, pp. 179–183. [Google Scholar]
- Lim, C.-H.; Lee, W.K.; Song, Y.; Eom, K.C. Assessing the EPIC model for estimation of future crops yield in South Korea. J. Clim. Chang. Res. 2015, 6, 21–31. [Google Scholar] [CrossRef]
- Kafatos, M.C.; Kim, S.H.; Lim, C.-H.; Kim, J.; Lee, W.-K. Responses of agroecosystems to climate change: Specifics of resilience in the mid-latitude region. Sustainability 2017, 9, 1361. [Google Scholar] [CrossRef]
- Lim, C.-H.; Choi, Y.; Kim, M.; Lee, S.J.; Folberth, C.; Lee, W.-K. Spatially explicit assessment of agricultural water equilibrium in the Korean Peninsula. Sustainability 2018, 10, 201. [Google Scholar] [CrossRef]
- Song, Y.; Lim, C.-H.; Lee, W.K.; Eom, K.C.; Choi, S.E.; Lee, E.J.; Kim, E. Applicability analysis of major crop models on Korea for the adaptation to climate change. J. Clim. Chang. Res. 2014, 5, 109–125. [Google Scholar] [CrossRef]
- Balkovič, J.; van der Velde, M.; Schmid, E.; Skalský, R.; Khabarov, N.; Obersteiner, M.; Xiong, W. Pan-European crop modelling with EPIC: Implementation, up-scaling and regional crop yield validation. Agric. Syst. 2013, 120, 61–75. [Google Scholar] [CrossRef]
- Xiong, W.; Balkovič, J.; van der Velde, M.; Zhang, X.; Izaurralde, R.C.; Skalský, R.; Lin, E.; Mueller, N.; Obersteiner, M. A calibration procedure to improve global rice yield simulations with EPIC. Ecol. Model. 2014, 273, 128–139. [Google Scholar] [CrossRef]
- Folberth, C.; Yang, H.; Gaiser, T.; Liu, J.; Wang, X.; Williams, J.; Schulin, R. Effects of ecological and conventional agricultural intensification practices on maize yields in sub-Saharan Africa under potential climate change. Environ. Res. Lett. 2014, 9, 44004. [Google Scholar] [CrossRef]
- Williams, J.R.; Jones, C.A.; Kiniry, J.R.; Spanel, D.A. The EPIC crop growth model. Trans. ASAE 1989, 32, 497–511. [Google Scholar] [CrossRef]
- Wang, X.; He, X.; Williams, J.R.; Izaurralde, R.C.; Atwood, J.D. Sensitivity and uncertainty analyses of crop yields and soil organic carbon simulated with EPIC. Trans. ASAE 2005, 48, 1041–1054. [Google Scholar] [CrossRef]
- Kim, S.; Lee, W.; Shin, K.; Kafatos, M.; Seo, D.J.; Kwak, H. Comparison of spatial interpolation techniques for predicting climate factors in Korea. For. Sci. Technol. 2010, 6, 97–109. [Google Scholar] [CrossRef]
- Kim, G.S.; Lim, C.-H.; Kim, S.J.; Lee, J.; Son, Y.; Lee, W.K. Effect of national-scale afforestation on forest water supply and soil loss in South Korea, 1971–2010. Sustainability 2017, 9, 1017. [Google Scholar] [CrossRef]
- Kim, M.; Lee, W.K.; Choi, G.M.; Song, C.; Lim, C.H.; Moon, J.; Piao, D.; Kraxner, F.; Shividenko, A.; Forsell, N. Modeling stand-level mortality based on maximum stem number and seasonal temperature. For. Ecol. Manag. 2017, 386, 37–50. [Google Scholar] [CrossRef]
- Food Agriculture Organization. FAO Digital Soil Map of the World; FAO: Rome, Italy, 1995. [Google Scholar]
- Batjes, N.H. ISRIC-WISE Derived Soil Properties on a 5 by 5 Arc-Minutes Global Grid; ISRIC—World Soil Information: Wageningen, The Netherlands, 2006. [Google Scholar]
- Chen, J.; Chen, J.; Liao, A.; Cao, X.; Chen, L.; Chen, X.; Zhang, W. Global land cover mapping at 30 m resolution: A POK-based operational approach. ISPRS J. Photogramm. Remote Sens. 2015, 103, 7–27. [Google Scholar] [CrossRef]
- Korean Statistical Information System Homepage. Available online: http://kosis.kr/index (accessed on 15 November 2018).
- FAOSTAT Homepage. Available online: http://www.fao.org/faostat (accessed on 15 November 2018).
- Nam, W.H.; Hayes, M.J.; Wilhite, D.A.; Svoboda, M.D. Projection of temporal trends on drought characteristics using the standardized precipitation evapotranspiration index (SPEI) in South Korea. J. Kor. Soc. Agri. Eng. 2015, 57, 37–45. [Google Scholar]
- Choi, Y.-W.; And, J.-B.; Suh, M.-S.; Cha, D.-H.; Lee, D.-K.; Hong, S.-Y.; Min, S.-K.; Park, S.-C.; Kang, H.-S. Future changes in drought characteristics over South Korea using multi regional climate models with the standardized precipitation index. Asia-Pac. J Atmos. Sci. 2016, 52, 209–222. [Google Scholar] [CrossRef]
- Nam, W.H.; Hayes, M.J.; Svoboda, M.D.; Tadesse, T.; Wilhite, D.A. Drought hazard assessment in the context of climate change for South Korea. Agric. Water Manag. 2015, 160, 106–117. [Google Scholar] [CrossRef]
- Baek, H.J.; Lee, J.; Lee, H.S.; Hyun, Y.K.; Cho, C.; Kwon, W.T.; Lee, J. Climate change in the 21st century simulated by HadGEM2-AO under representative concentration pathways. Asia-Pac. J. Atmos. Sci. 2013, 49, 603–618. [Google Scholar] [CrossRef]
- Kim, H.Y.; Ko, J.; Kang, S.; Tenhunen, J. Impacts of climate change on paddy rice yield in a temperate climate. Global Chang. Biol. 2013, 19, 548–562. [Google Scholar] [CrossRef] [PubMed]
- Baek, S.G.; Park, J.H.; Na, C.S.; Lee, B.; Cheng, H.C.; Woo, S.Y. The morphological characteristics of Pterocarpus indicus induced by elevated ozone under well-watered and drought conditions. For. Sci. Technol. 2018, 14, 105–111. [Google Scholar] [CrossRef]
- Lim, C.H.; Kim, G.S.; Lee, E.J.; Heo, S.; Kim, T.; Kim, Y.S.; Lee, W.K. Development on crop yield forecasting model for major vegetable crops using meteorological information of main production area. J. Clim. Chang. Res. 2016, 7, 193–203. [Google Scholar] [CrossRef]
- Lamchin, M.; Lee, W.K.; Jeon, S.W.; Wang, S.W.; Lim, C.H.; Song, C.; Sung, M. Long-term trend and correlation between vegetation greenness and climate variables in Asia based on satellite data. Sci. Total Environ. 2018, 618, 1089–1095. [Google Scholar] [CrossRef]
- Castillo, R.M.; Feng, K.; Sun, L.; Guilhoto, J.; Pfister, S.; Miralles-Wilhelm, F.; Hubacek, K. The land-water nexus of biofuel production in Brazil: Analysis of synergies and trade-offs using a multiregional input-output model. J. Clean. Prod. 2019, 214, 52–61. [Google Scholar] [CrossRef]
© 2019 by the authors. Licensee MDPI, Basel, Switzerland. This article is an open access article distributed under the terms and conditions of the Creative Commons Attribution (CC BY) license (http://creativecommons.org/licenses/by/4.0/).