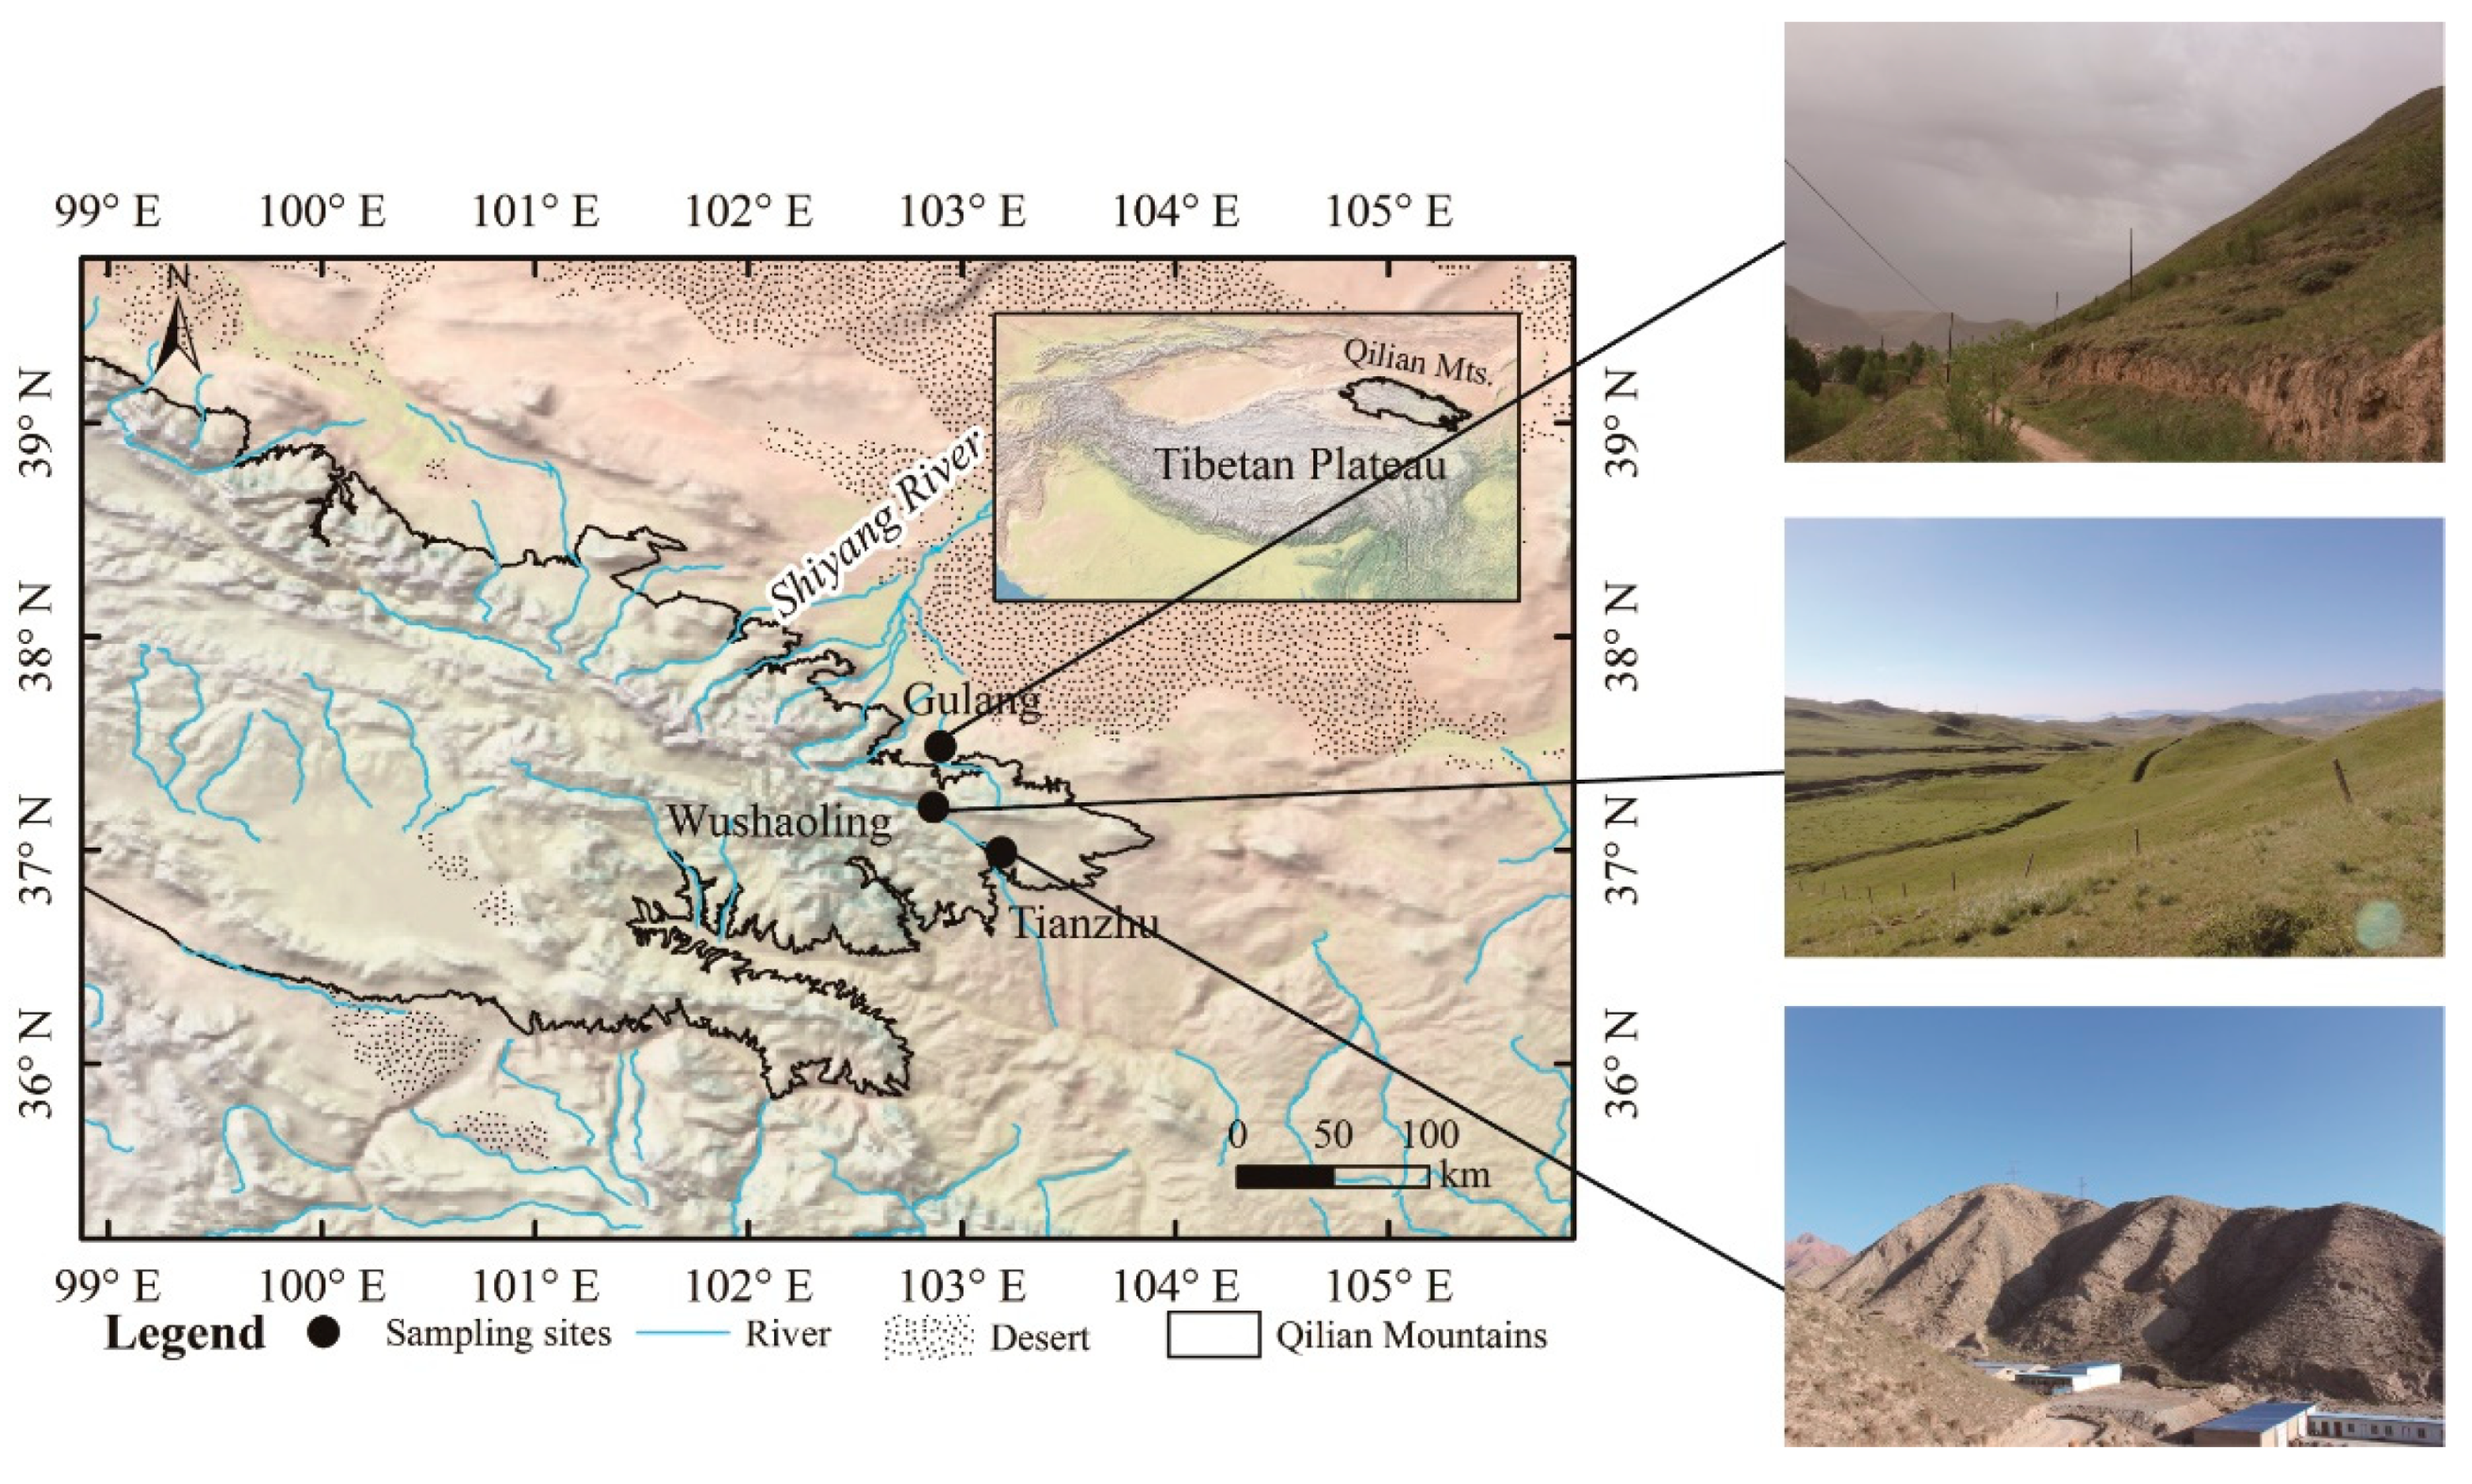
Figure 1.
A map showing the locations of the sampling sites in the Qilian Mountains. The boundary of the mountainous area is marked by the black line. The satellite-derived background was acquired from Natural Earth (
http://www.naturalearthdata.com). The desert areas are based on Wang et al. [
18]. The inset map identifies the location of the Qilian Mountains relative to the Tibetan Plateau.
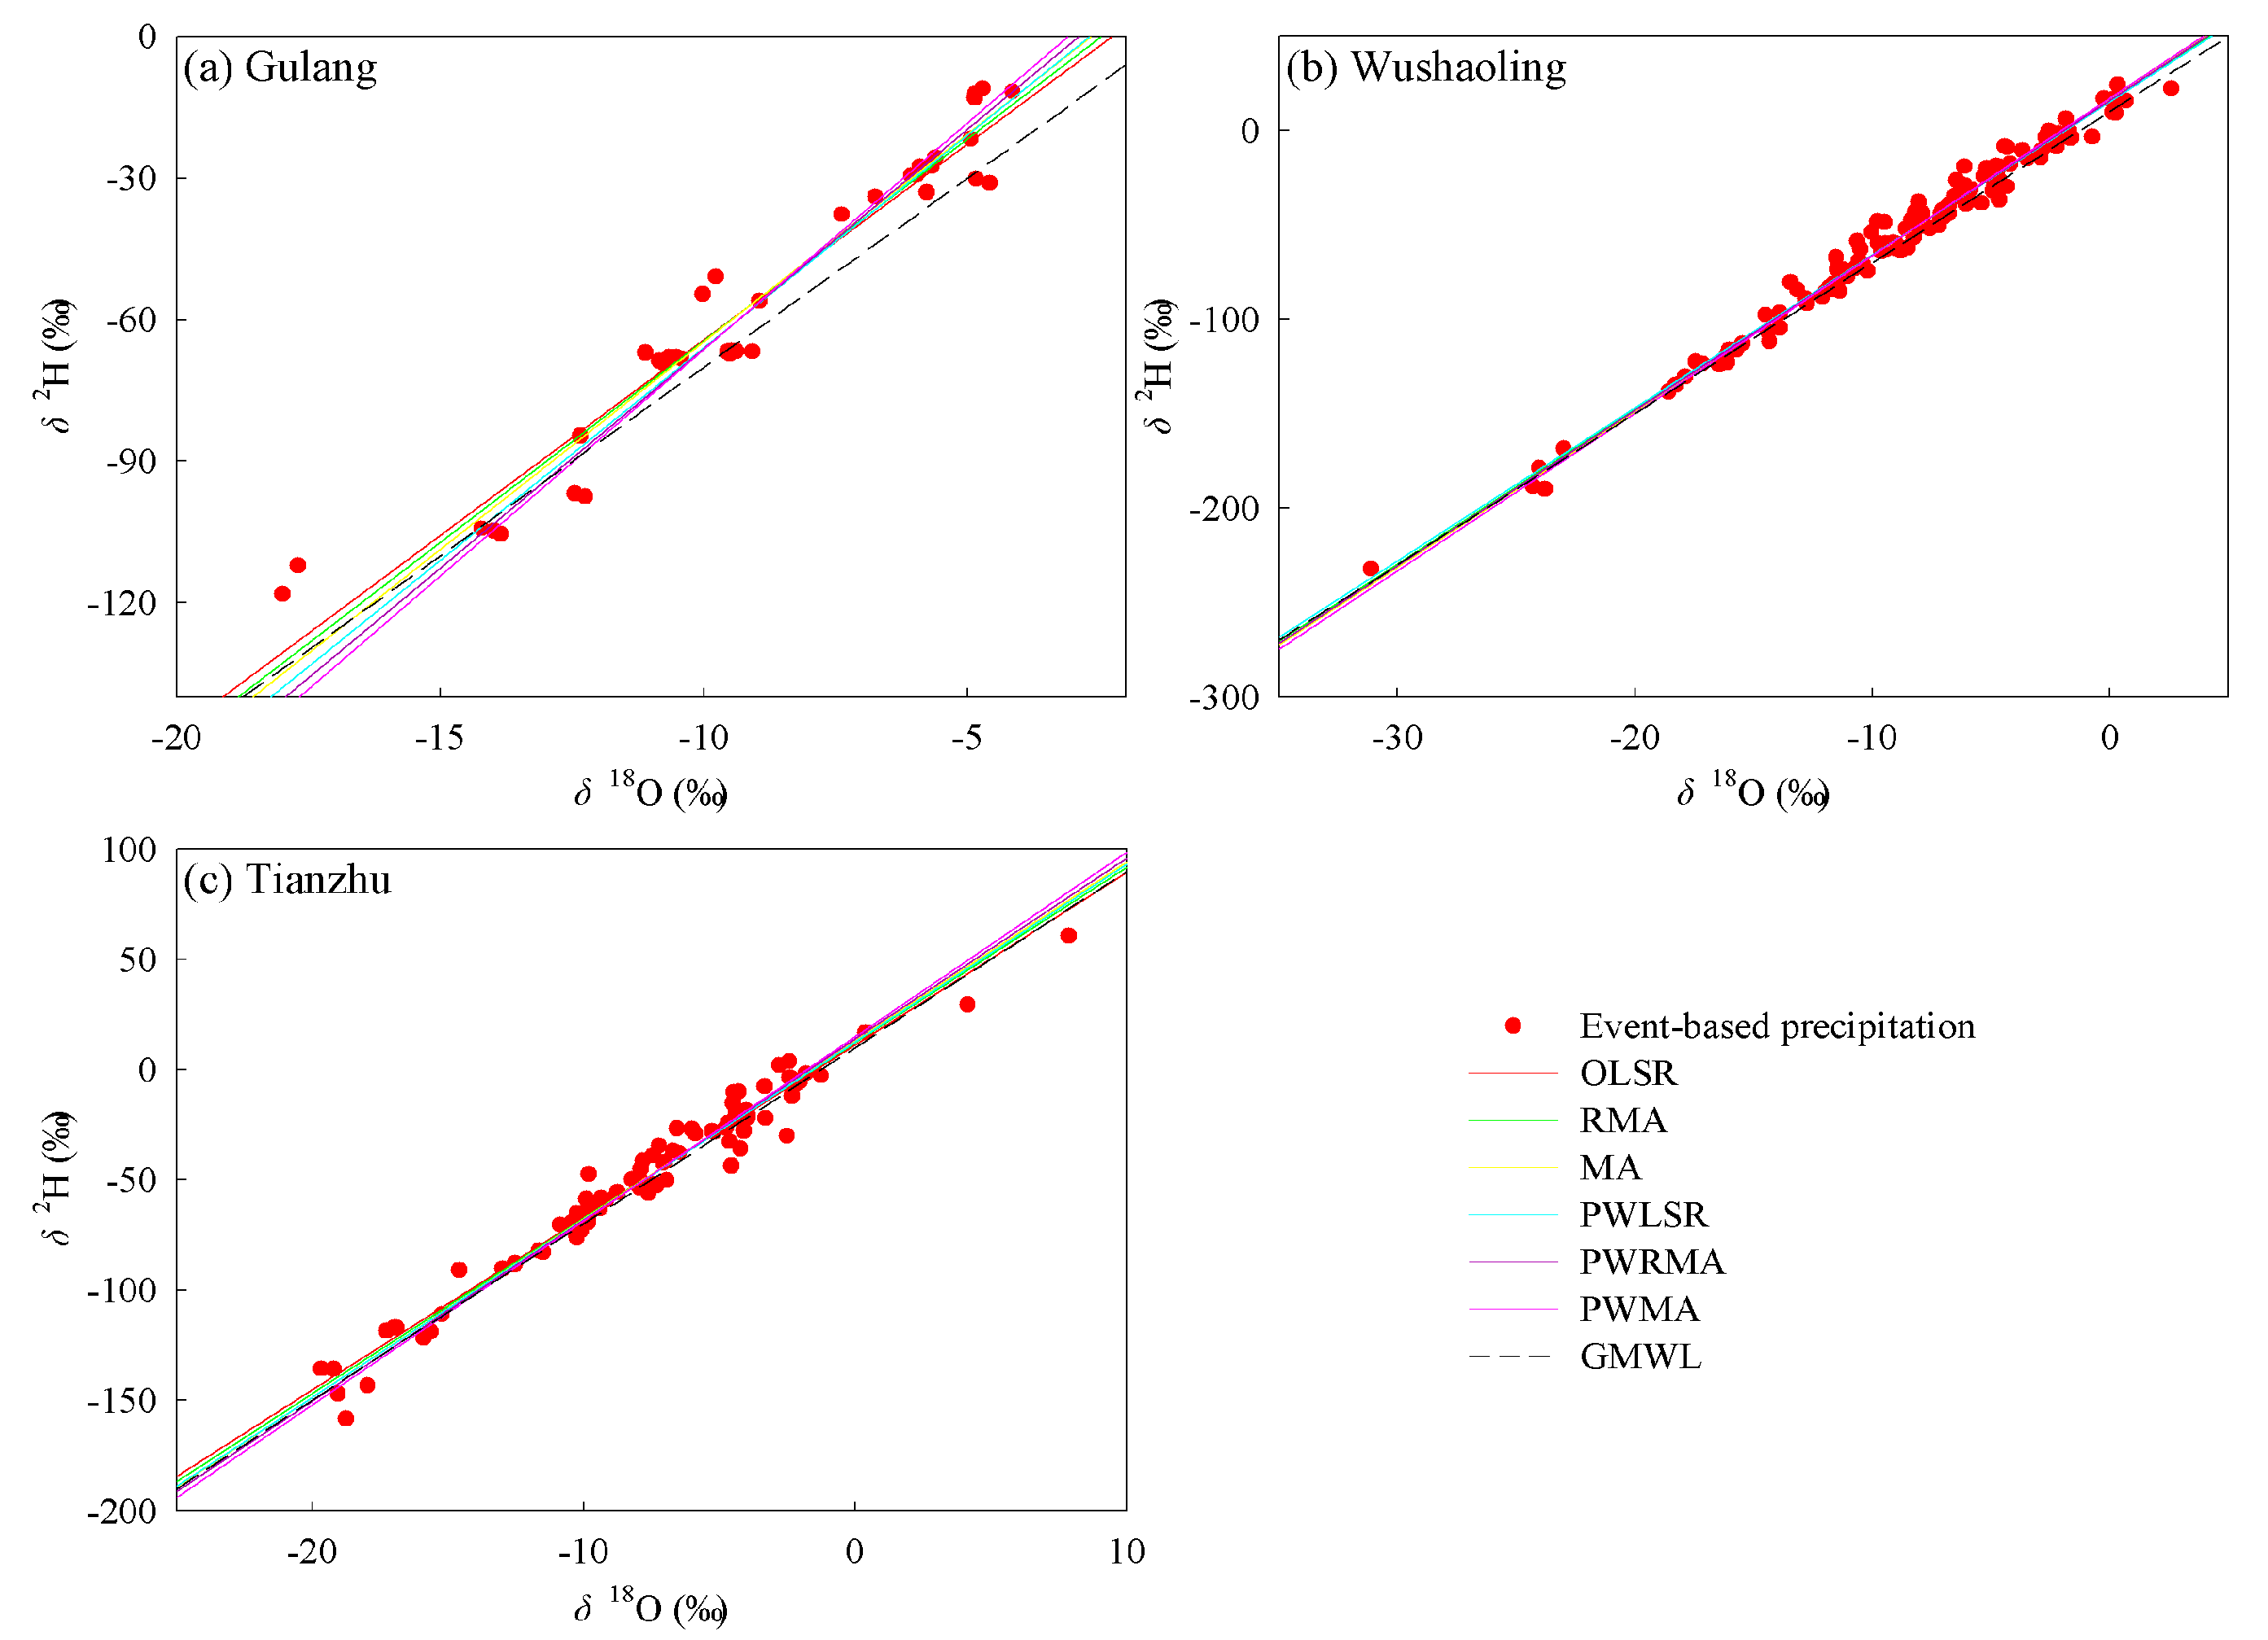
Figure 2.
The Local Meteorological Water Line (LMWL) at the three sites; the Global Meteoric Water Line (GMWL) was also shown for reference. (a–c) are the LMWL at Gulang, Wushaoling, and Tianzhu, respectively.
Figure 2.
The Local Meteorological Water Line (LMWL) at the three sites; the Global Meteoric Water Line (GMWL) was also shown for reference. (a–c) are the LMWL at Gulang, Wushaoling, and Tianzhu, respectively.
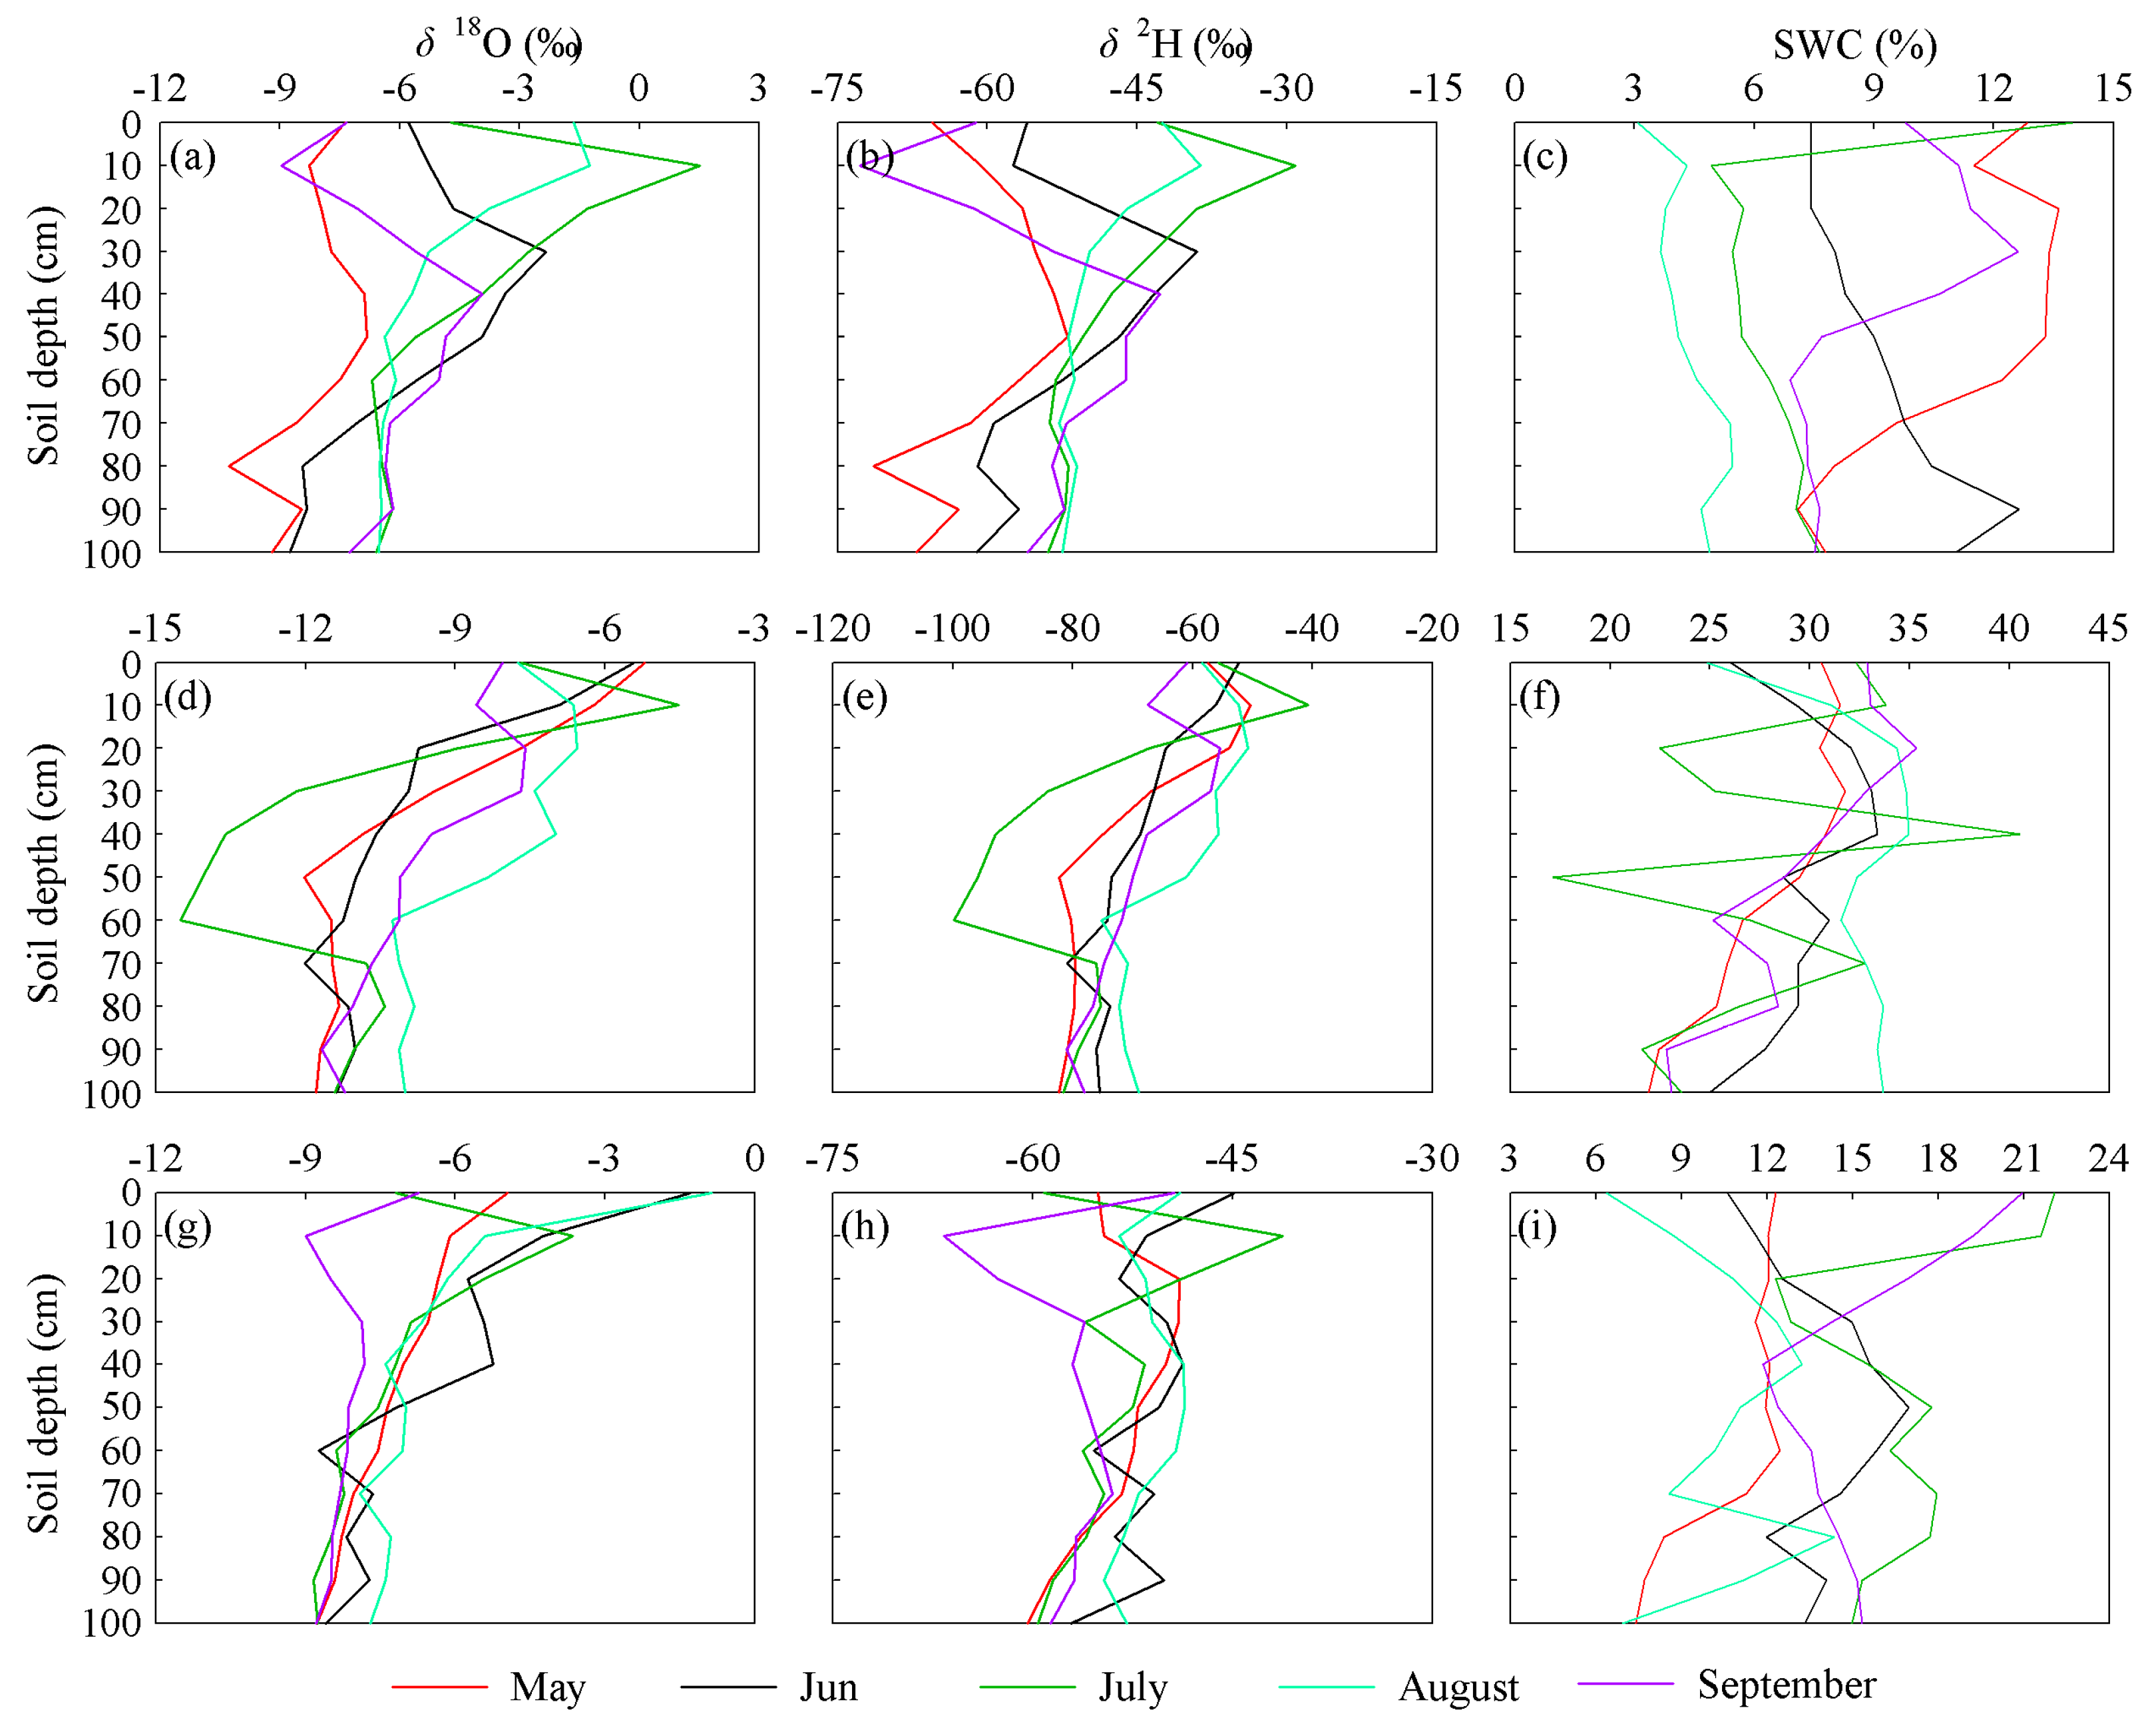
Figure 3.
Mean δ18O, δ2H, and soil water content (SWC) for soil water at a depth of 0–100 cm in Gulang (a–c), Wushaoling (d–f) and Tianzhu (g–i).
Figure 3.
Mean δ18O, δ2H, and soil water content (SWC) for soil water at a depth of 0–100 cm in Gulang (a–c), Wushaoling (d–f) and Tianzhu (g–i).
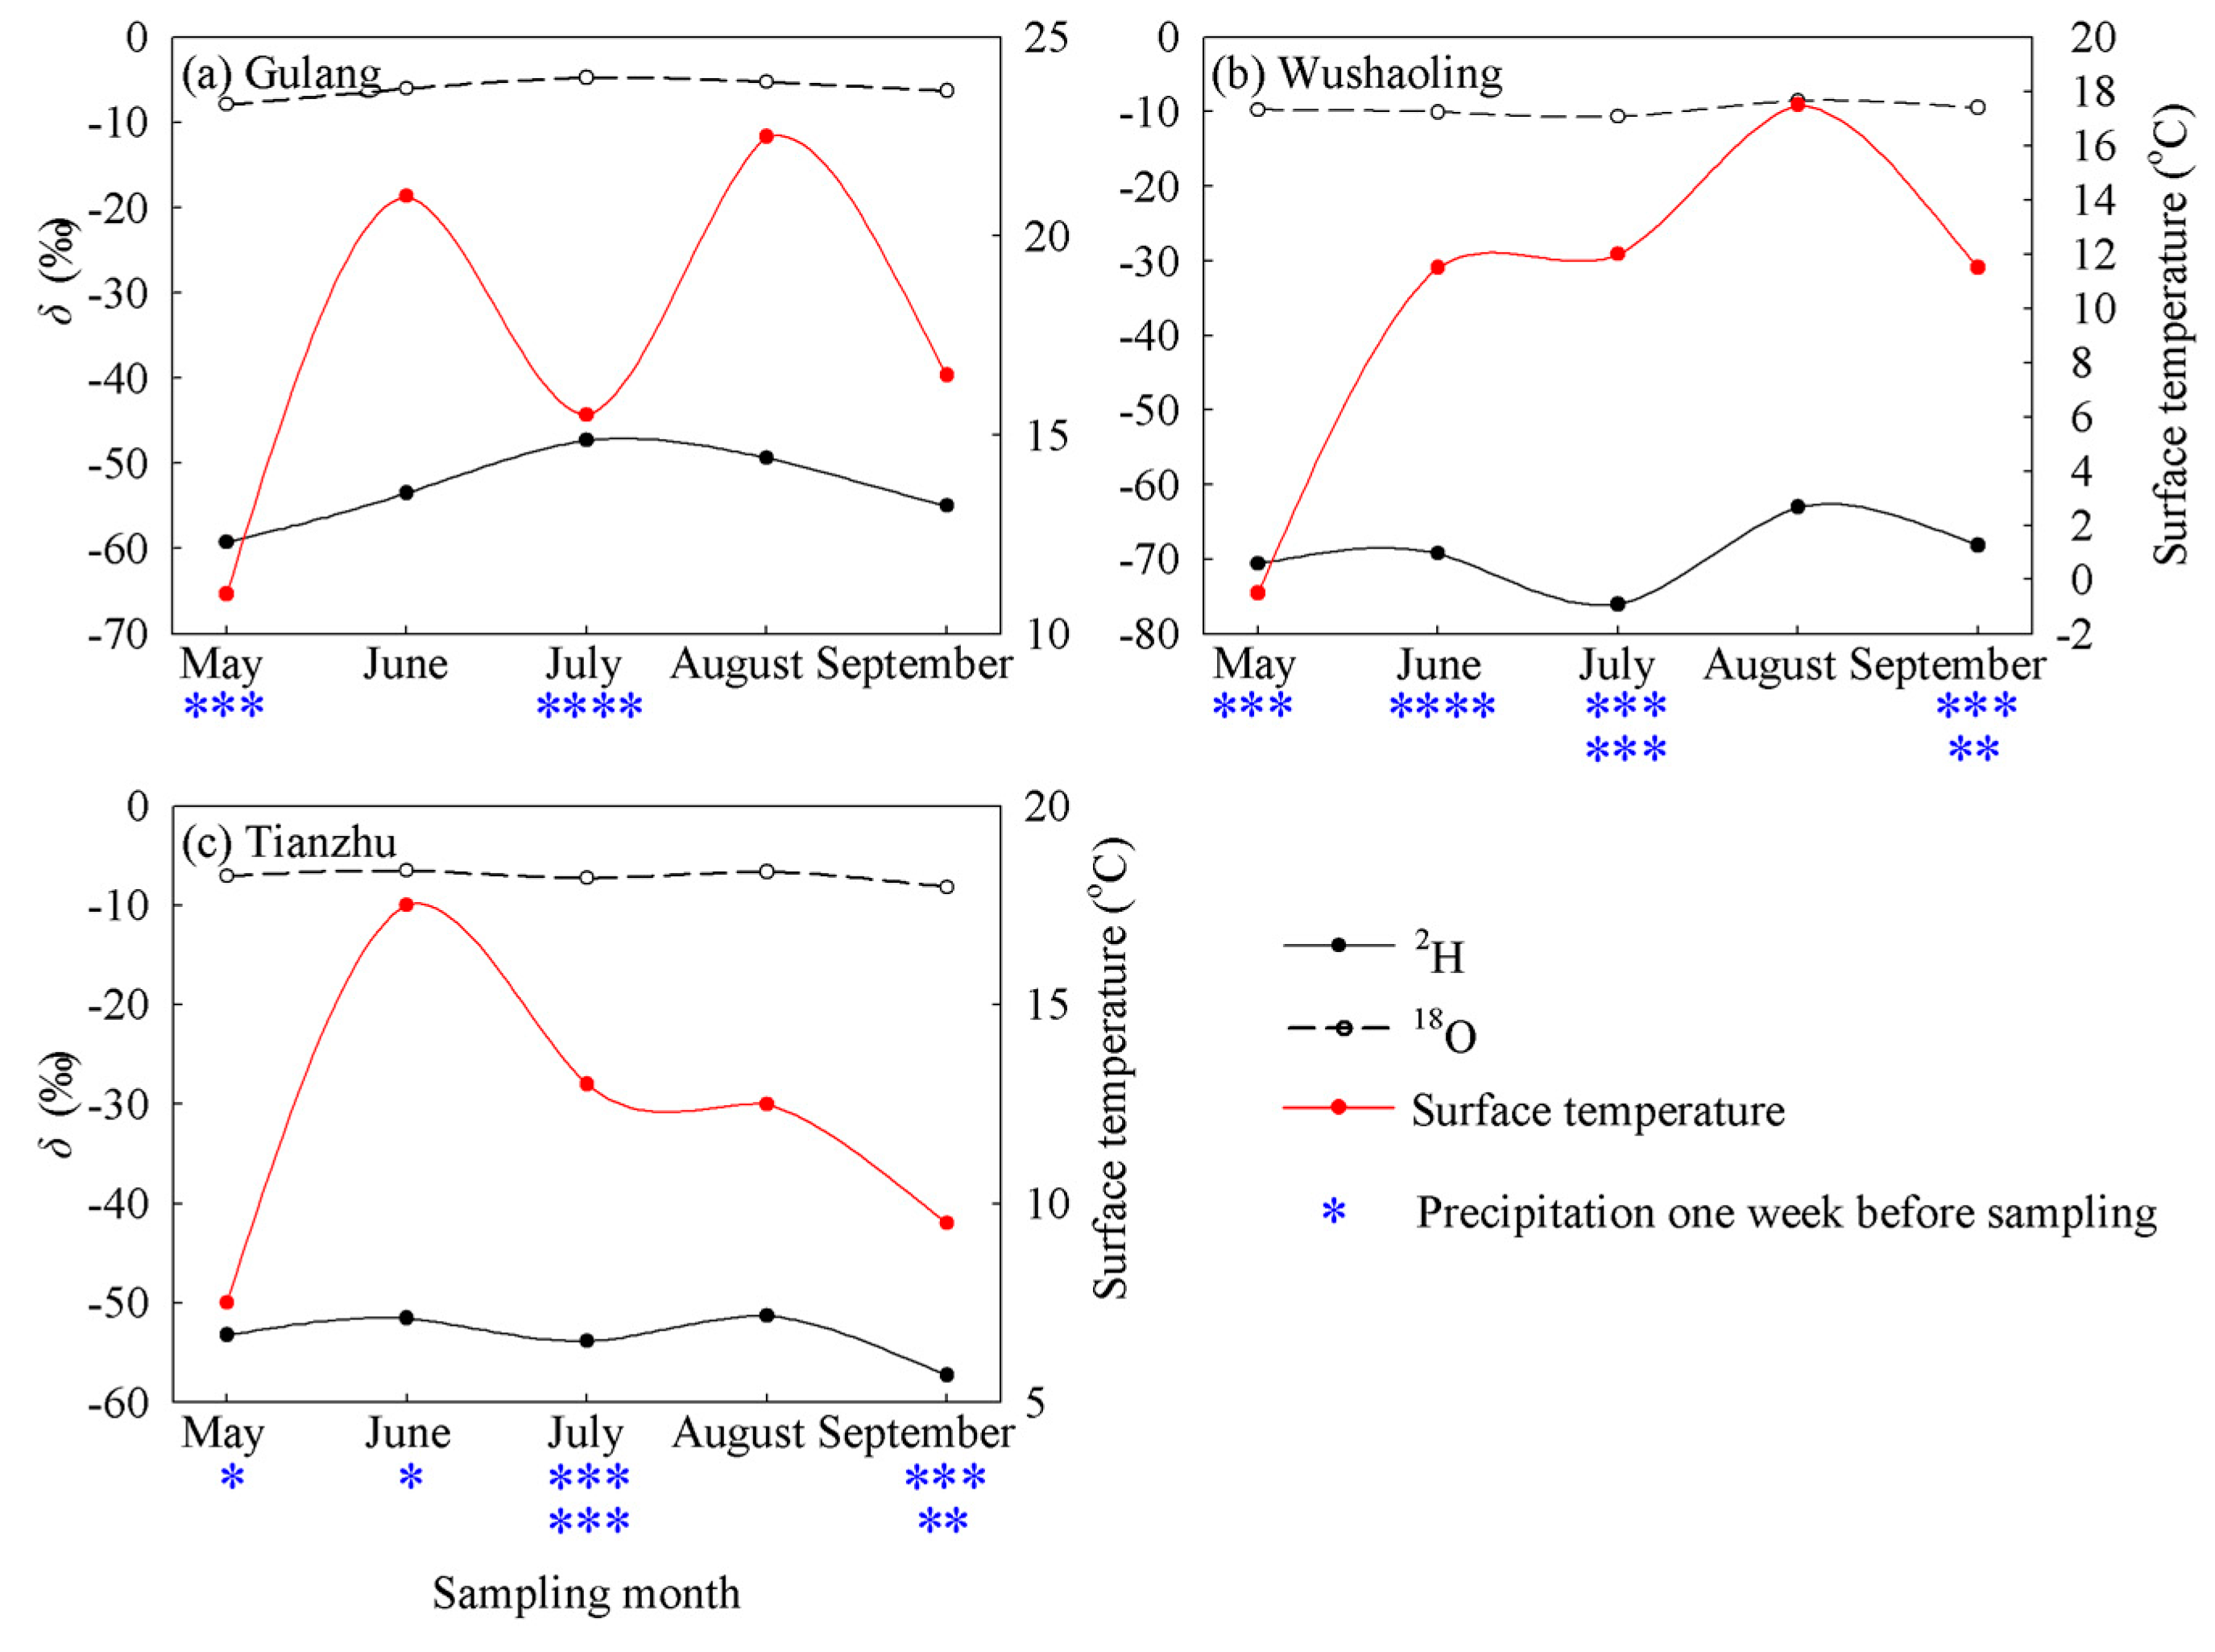
Figure 4.
Monthly variation of SWC-weighted soil water δ18O and δ2H, and near-surface temperature. (a–c) are the variations at Gulang, Wushaoling and Tianzhu, respectively.
Figure 4.
Monthly variation of SWC-weighted soil water δ18O and δ2H, and near-surface temperature. (a–c) are the variations at Gulang, Wushaoling and Tianzhu, respectively.
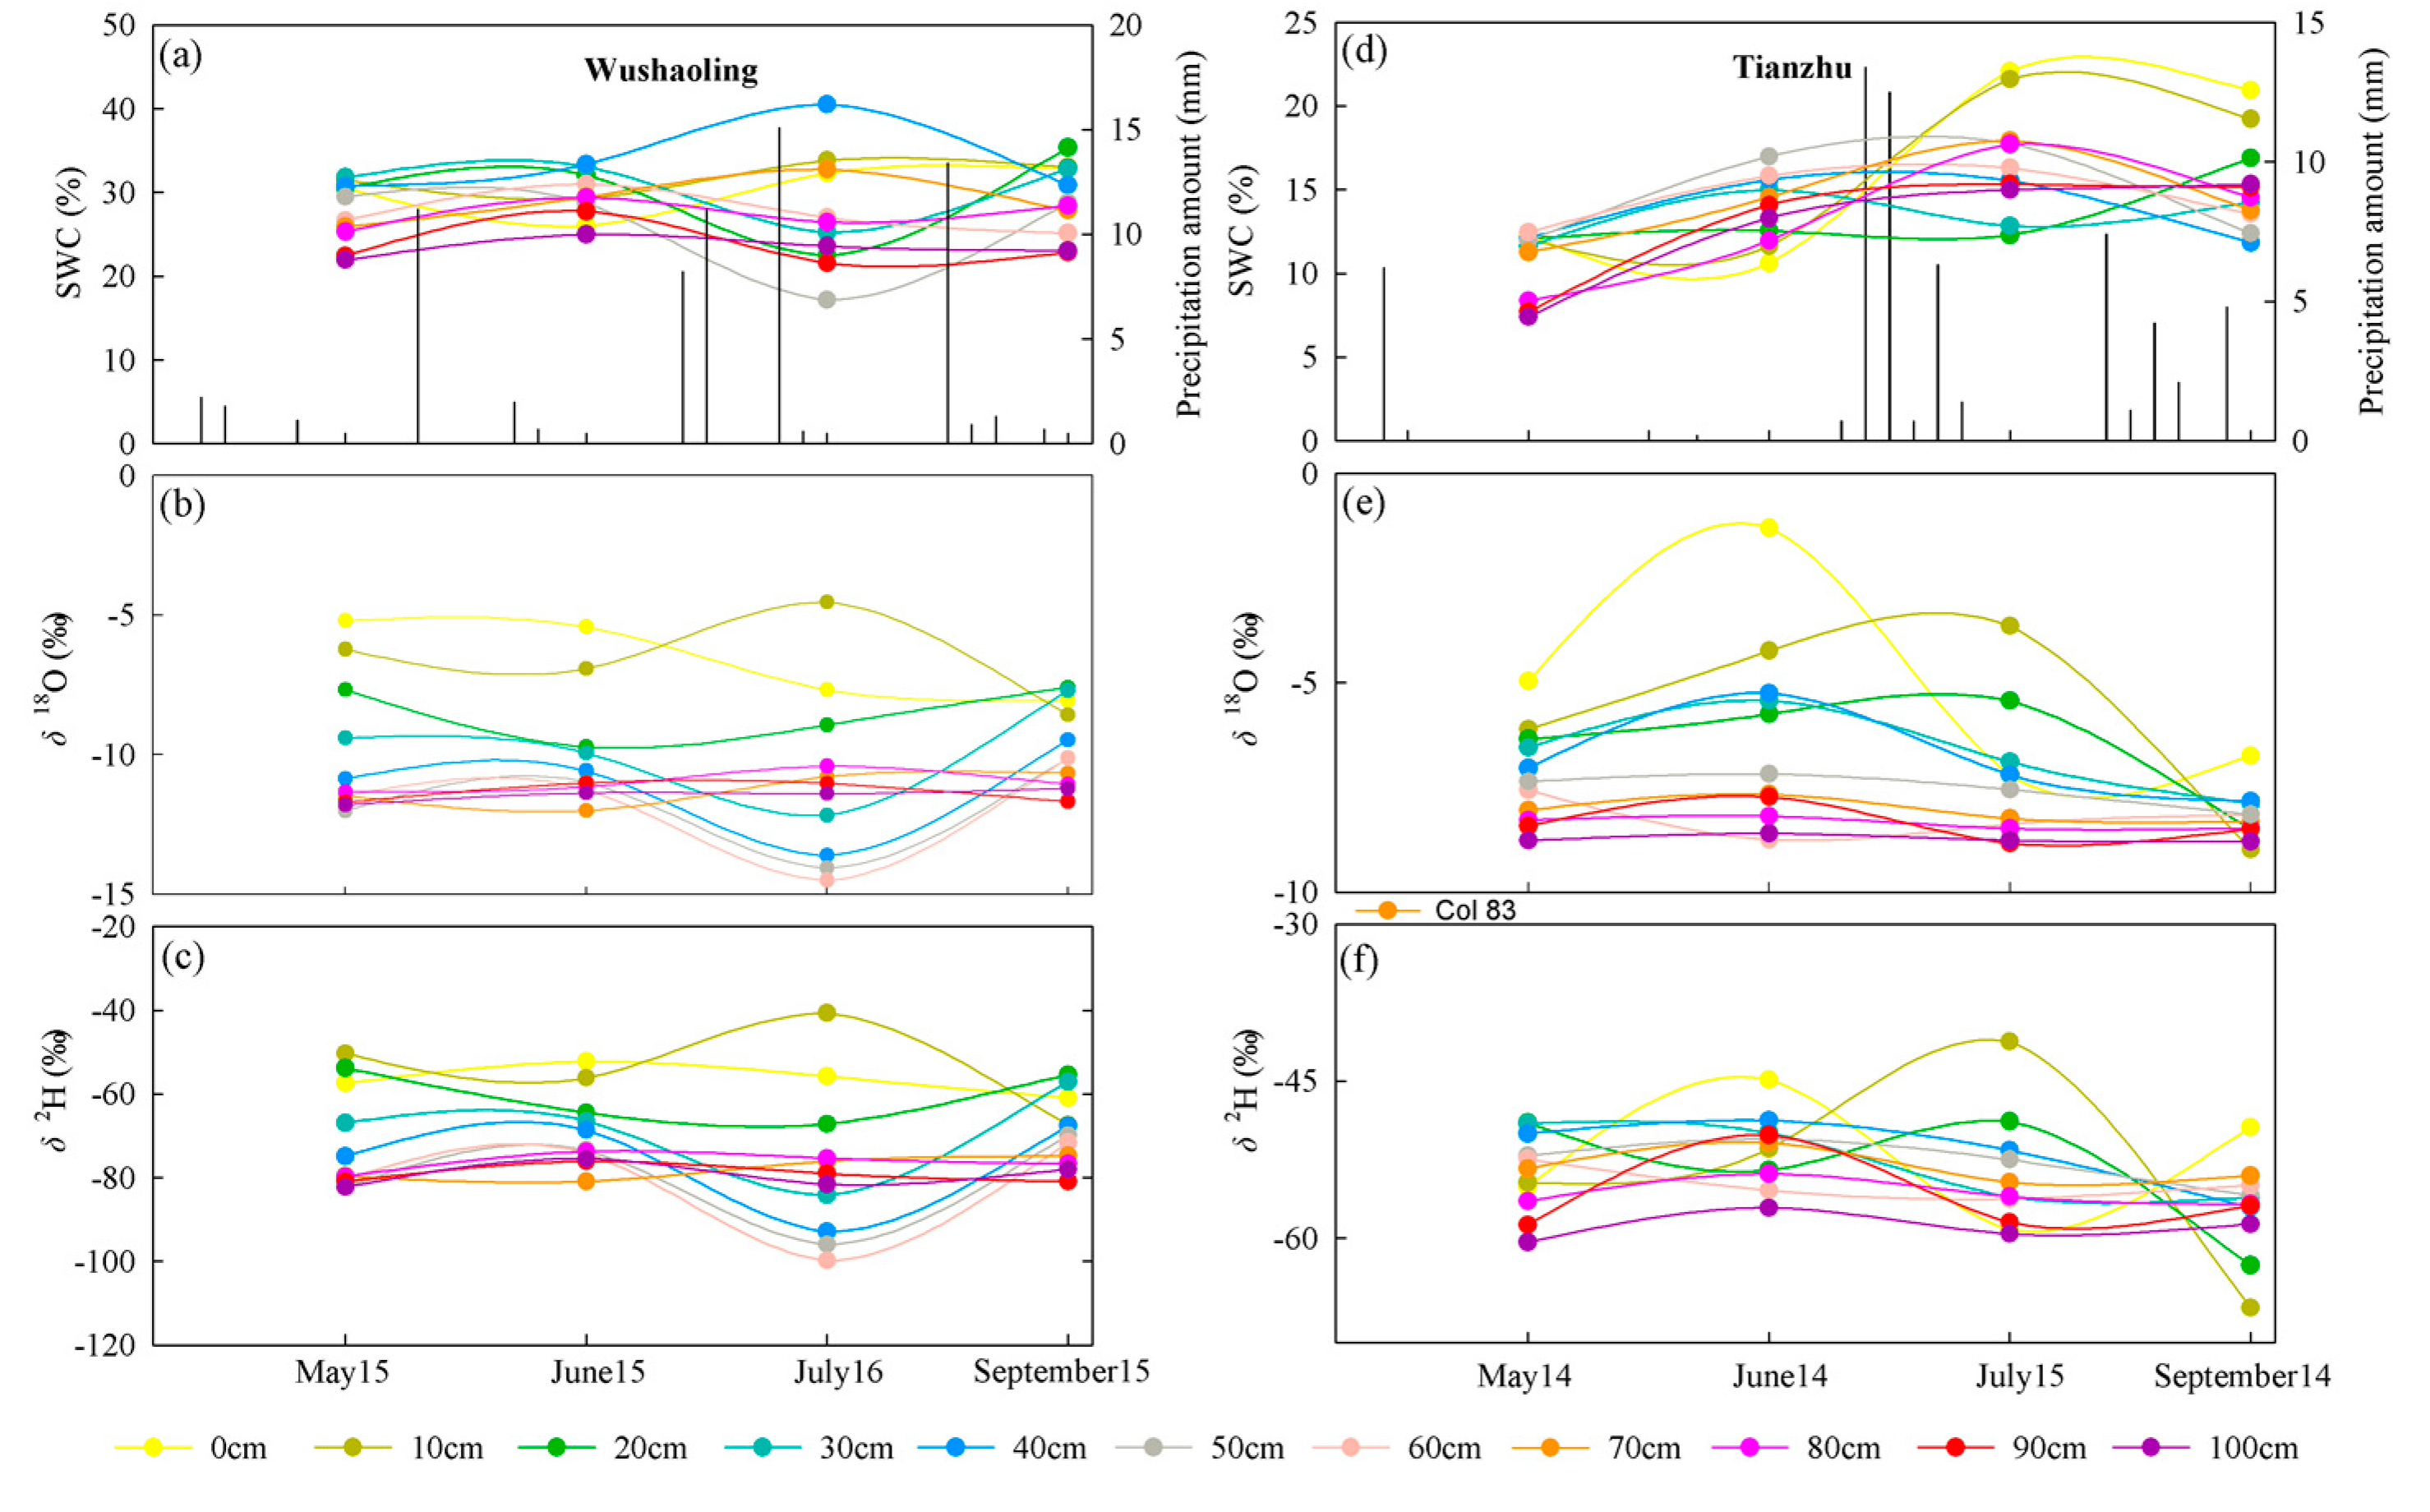
Figure 5.
The response of soil water, δ18O, and δ2H to different amounts. (a–c) are the response of SWC, δ18O, and δ2H to precipitation pulsse at Wushaoling, and (d–f) are for the responses at Tianzhu.
Figure 5.
The response of soil water, δ18O, and δ2H to different amounts. (a–c) are the response of SWC, δ18O, and δ2H to precipitation pulsse at Wushaoling, and (d–f) are for the responses at Tianzhu.
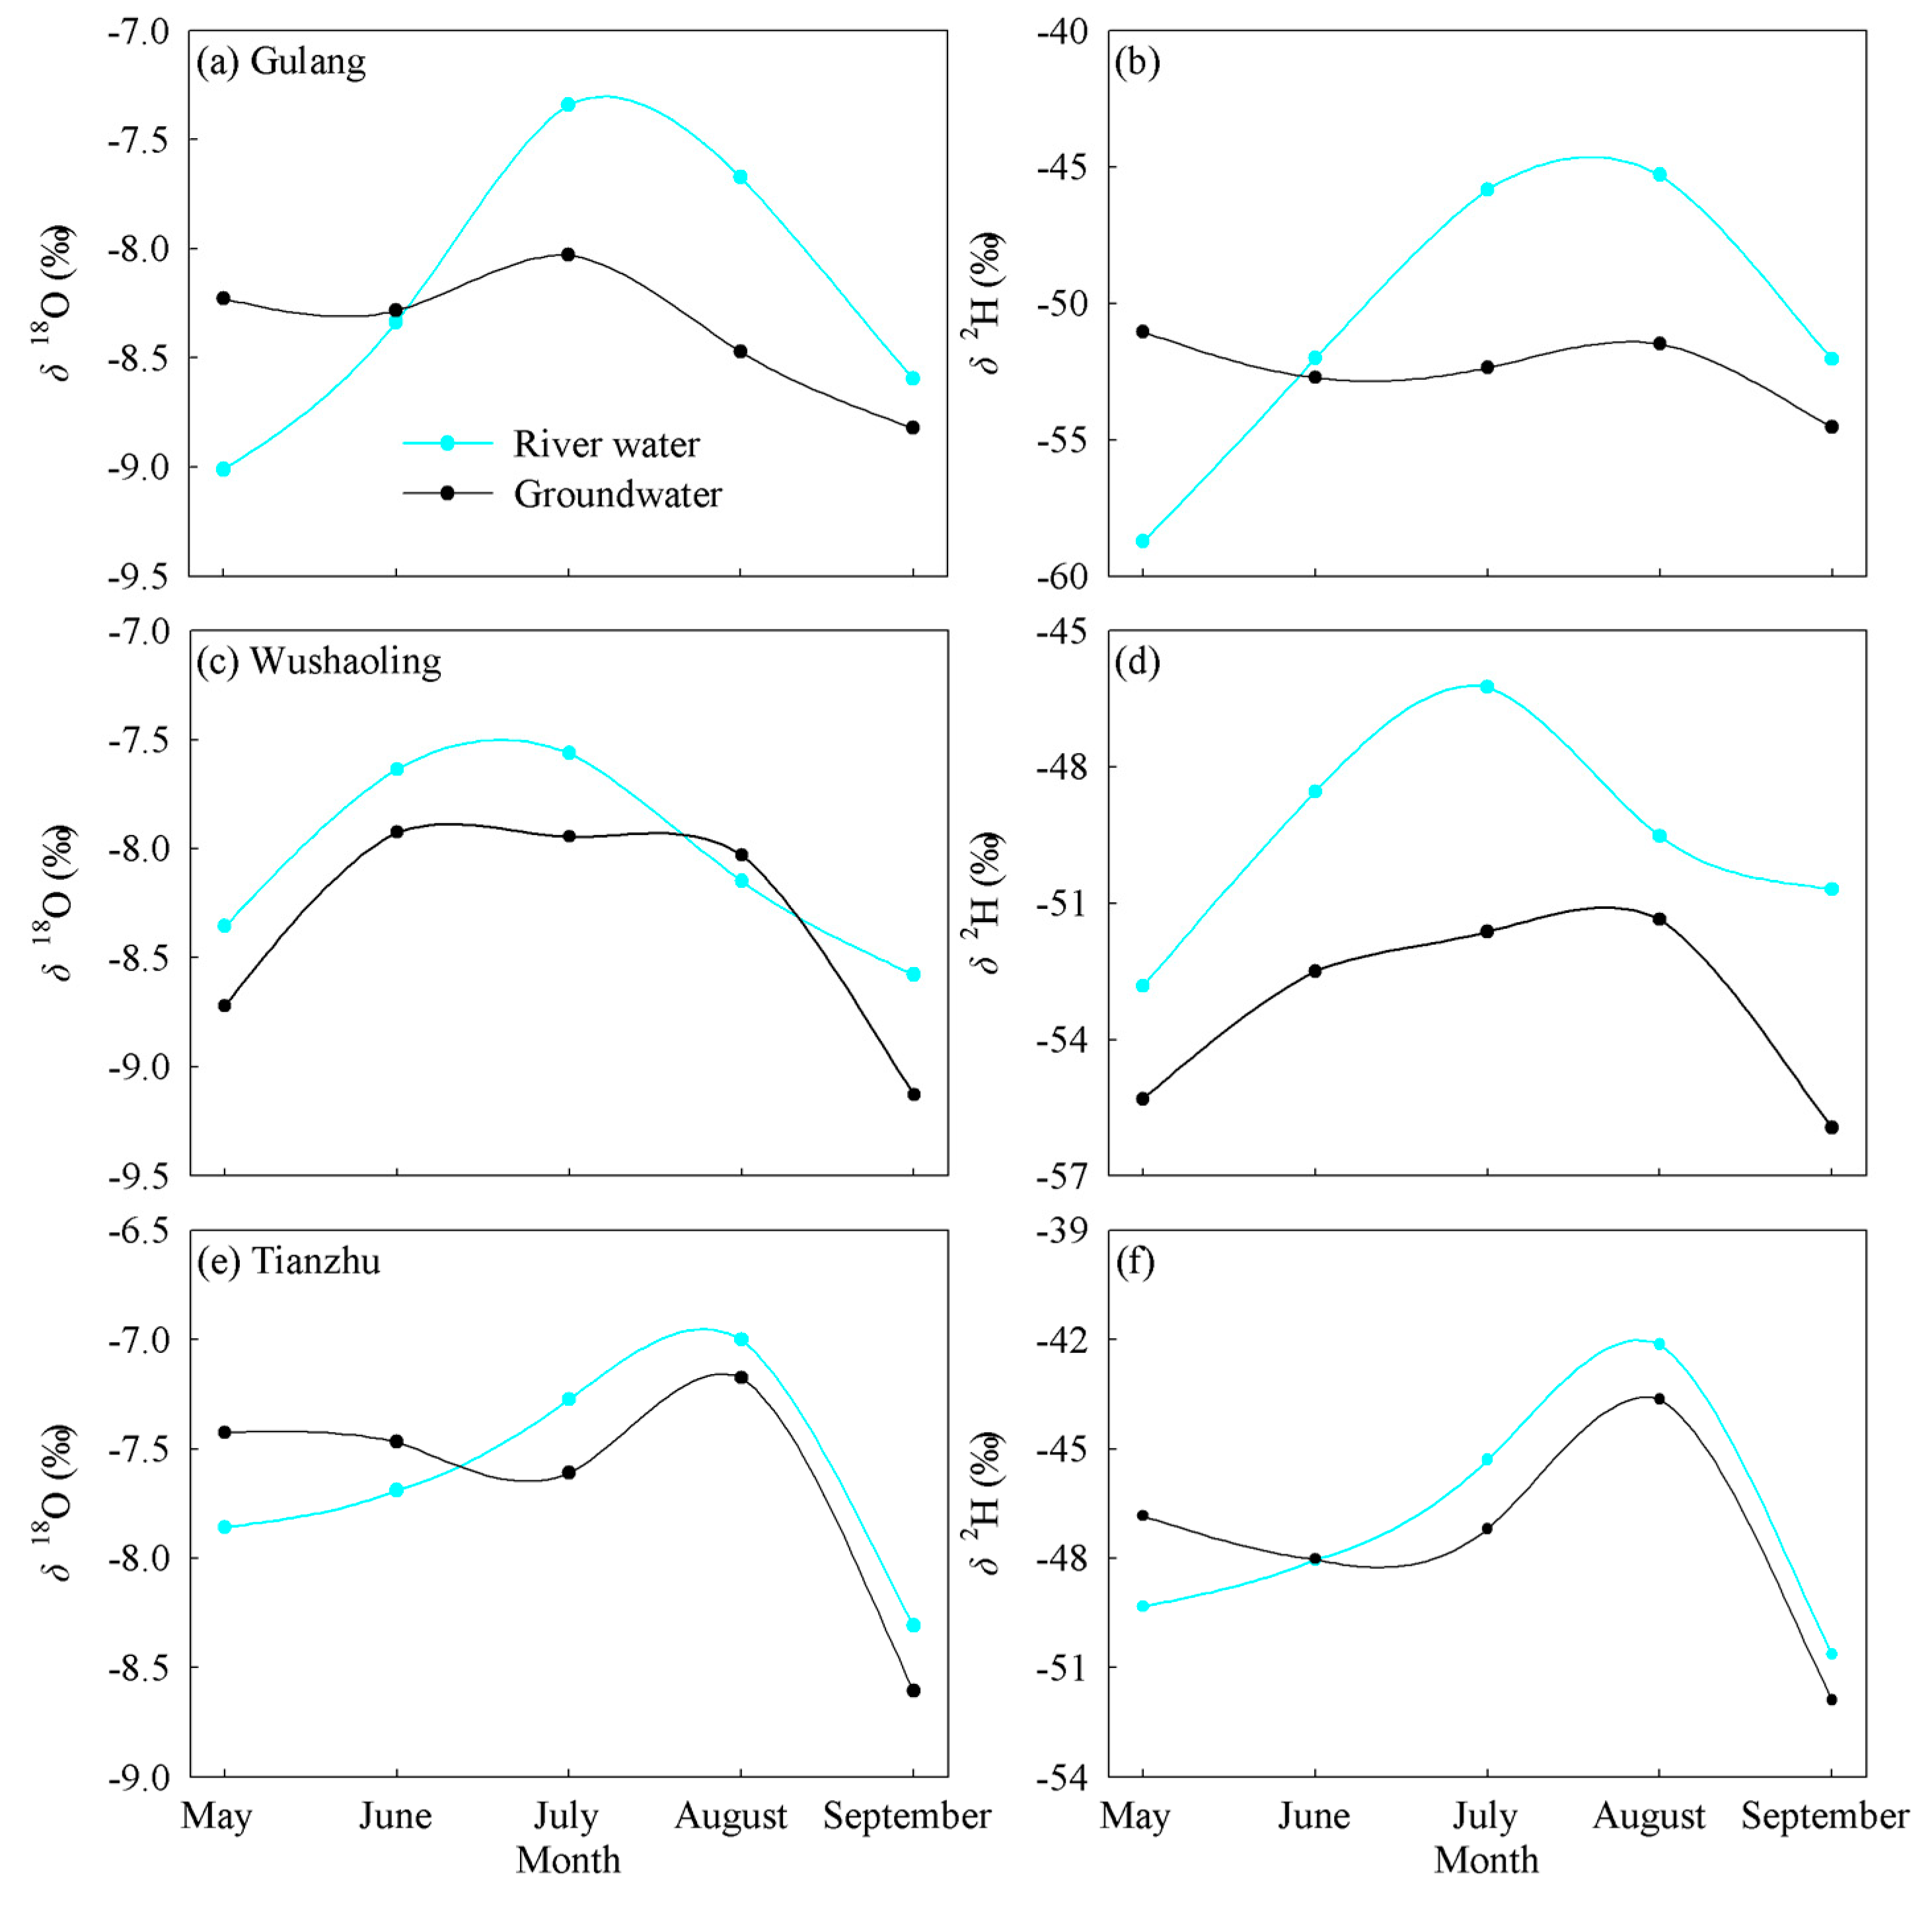
Figure 6.
δ18O and δ2H in river water and groundwater where (a,b) are the δ18O and δ2H measurements, respectively, in river water and groundwater at Gulang; (c,d) are the measurements for Wushaoling; and (e,f) are the measurements for Tianzhu.
Figure 6.
δ18O and δ2H in river water and groundwater where (a,b) are the δ18O and δ2H measurements, respectively, in river water and groundwater at Gulang; (c,d) are the measurements for Wushaoling; and (e,f) are the measurements for Tianzhu.
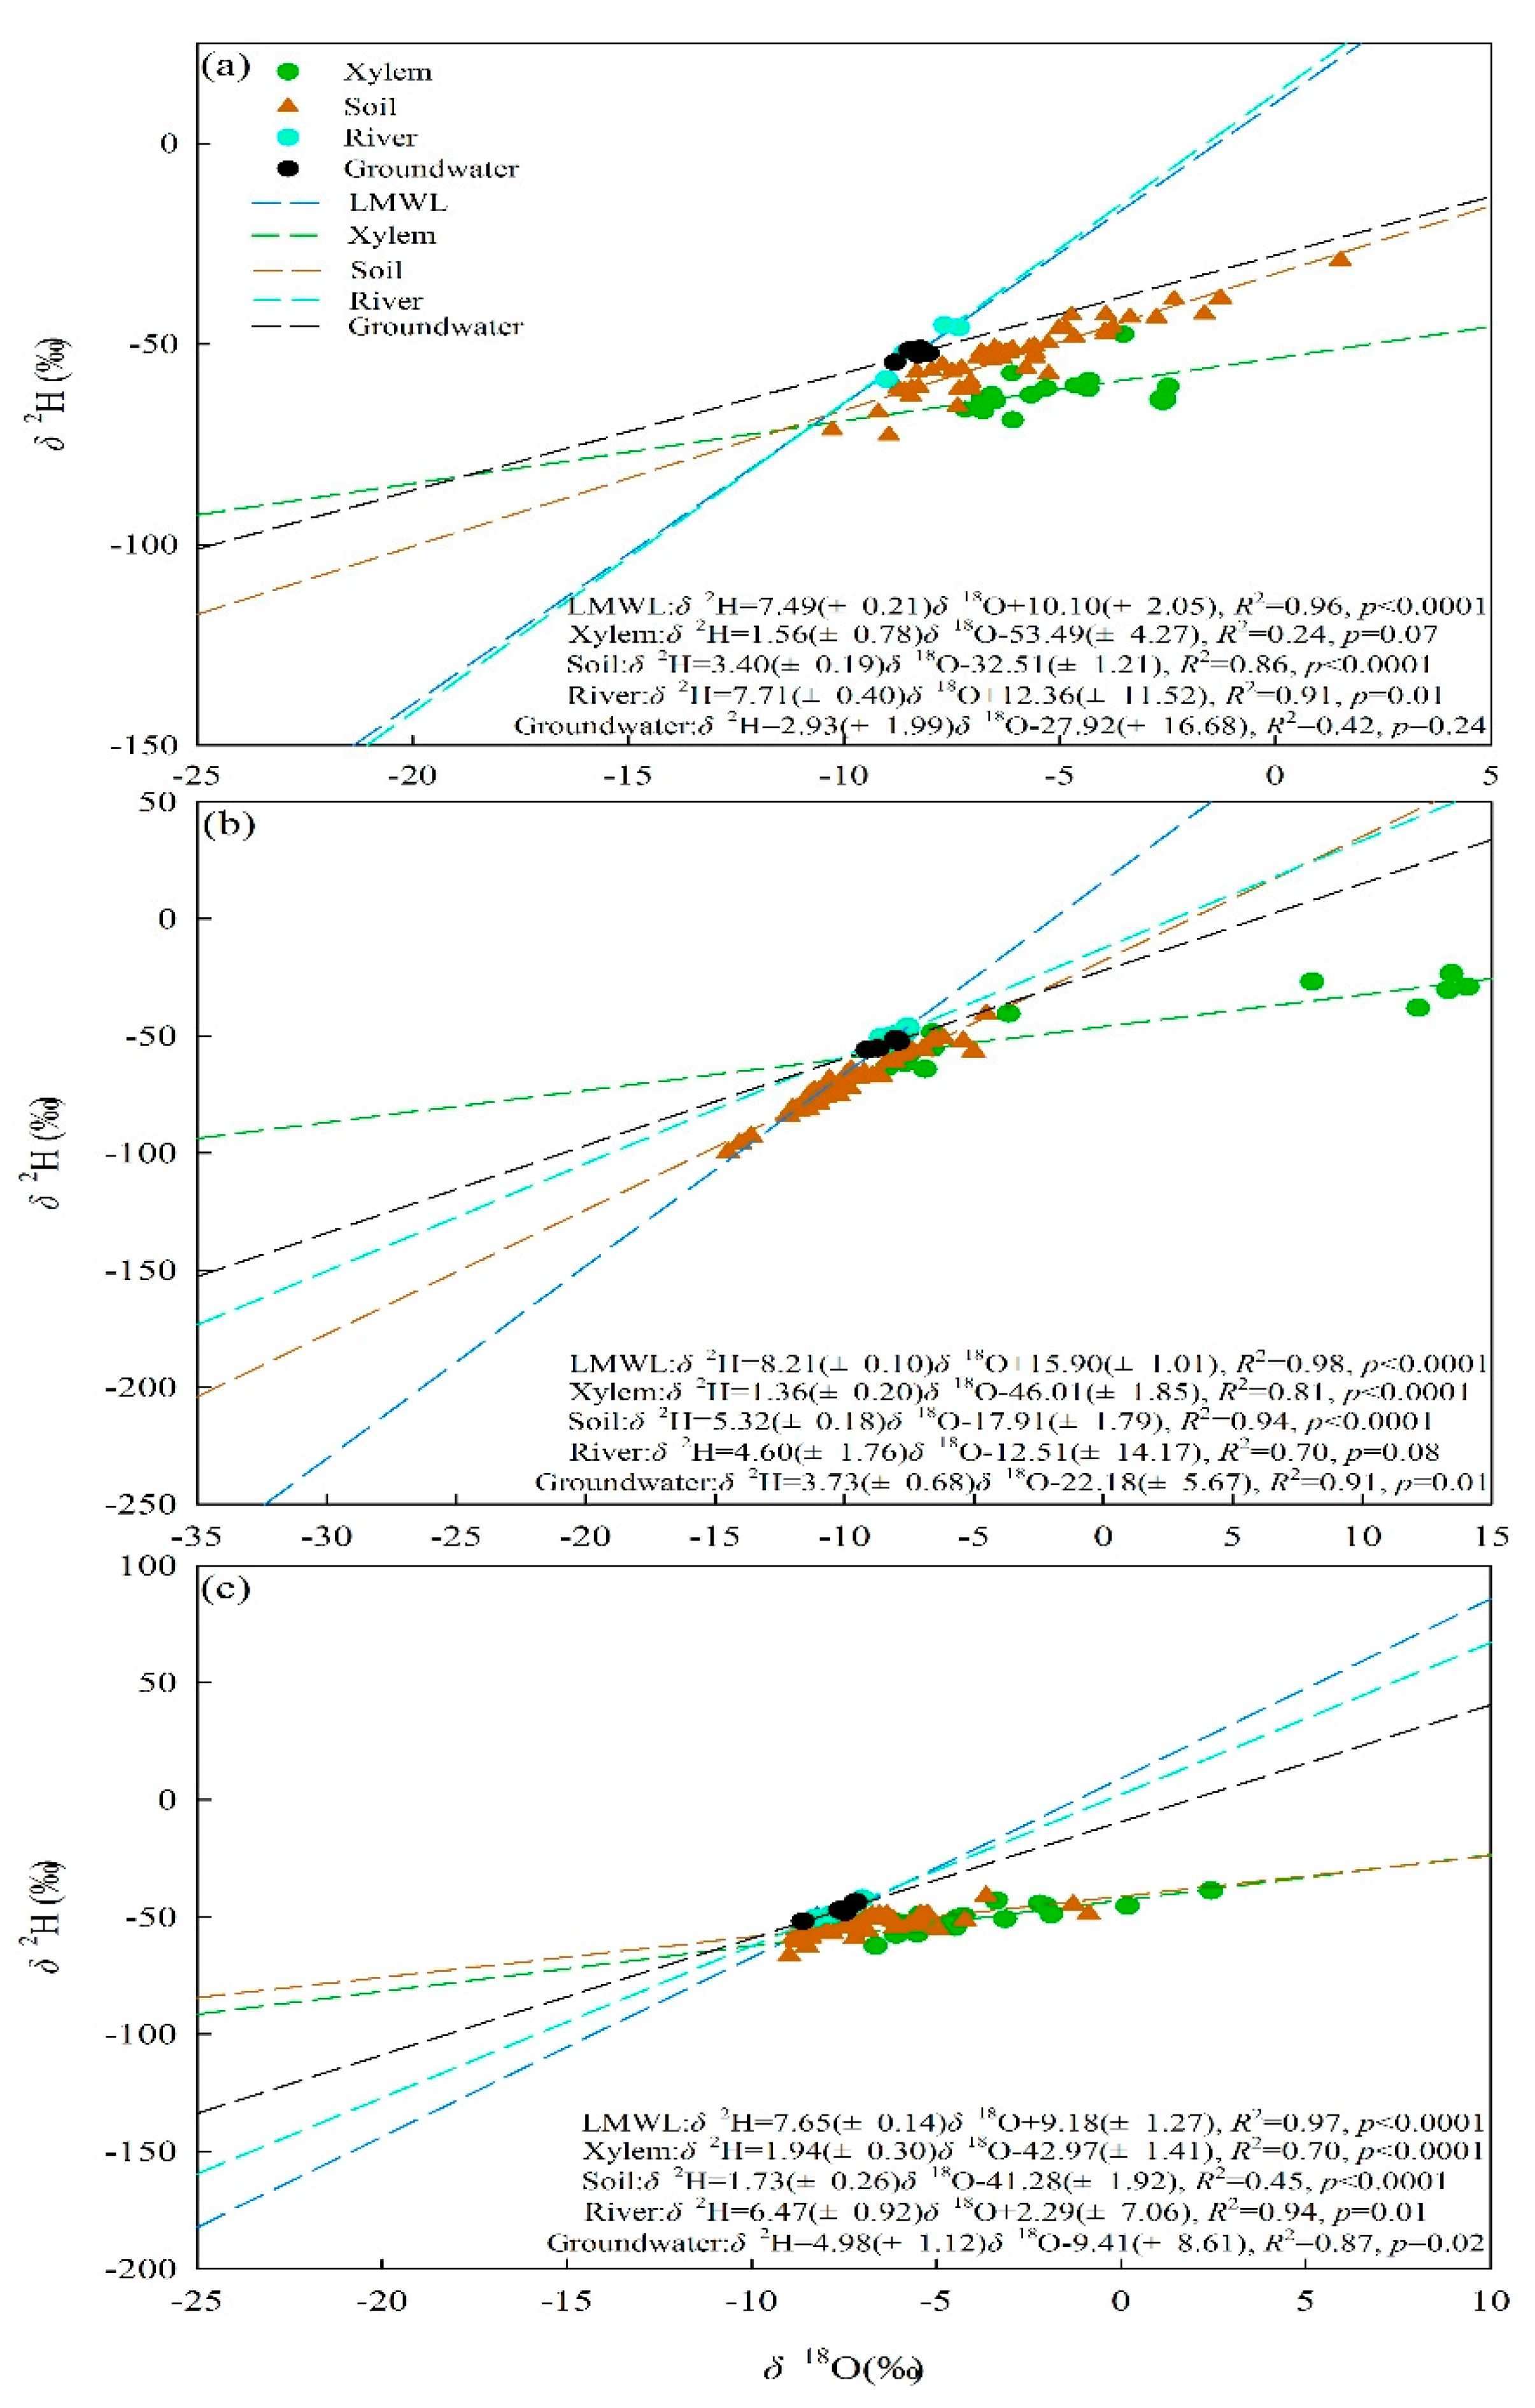
Figure 7.
The linear relationship between δ18O and δ2H of the different water bodies sampled in (a) Gulang, (b) Wushaoling, and (c) Tianzhu.
Figure 7.
The linear relationship between δ18O and δ2H of the different water bodies sampled in (a) Gulang, (b) Wushaoling, and (c) Tianzhu.
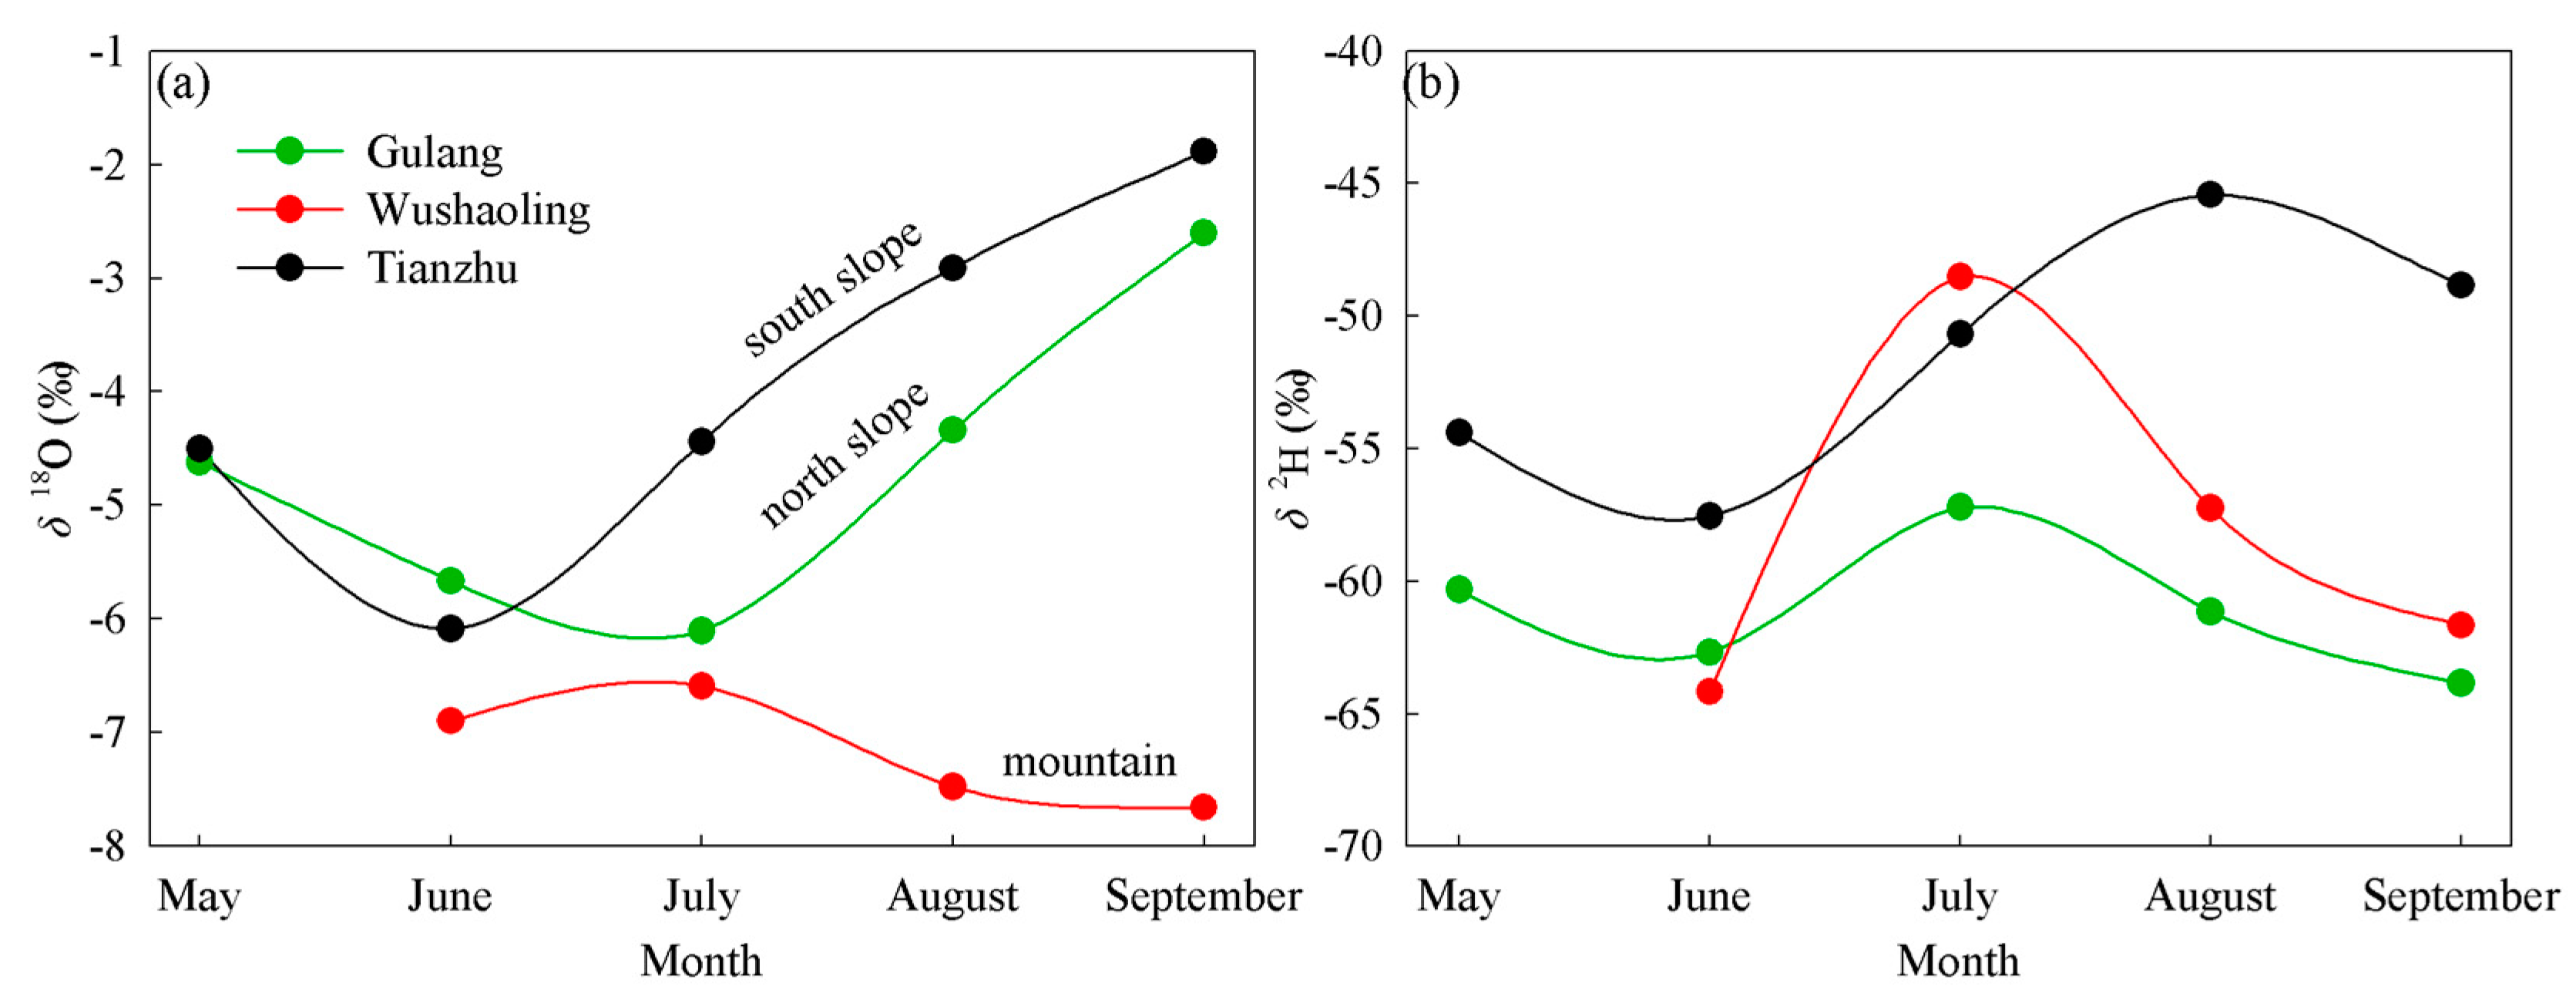
Figure 8.
The monthly variations in stem water isotopes. (a) is δ18O variation and (b) is δ2H variation.
Figure 8.
The monthly variations in stem water isotopes. (a) is δ18O variation and (b) is δ2H variation.
Figure 9.
The monthly variations in major meteorological parameters: (a) is air temperature, (b) is relative humidity, (c) is vapor pressure, and (d) is precipitation amount.
Figure 9.
The monthly variations in major meteorological parameters: (a) is air temperature, (b) is relative humidity, (c) is vapor pressure, and (d) is precipitation amount.
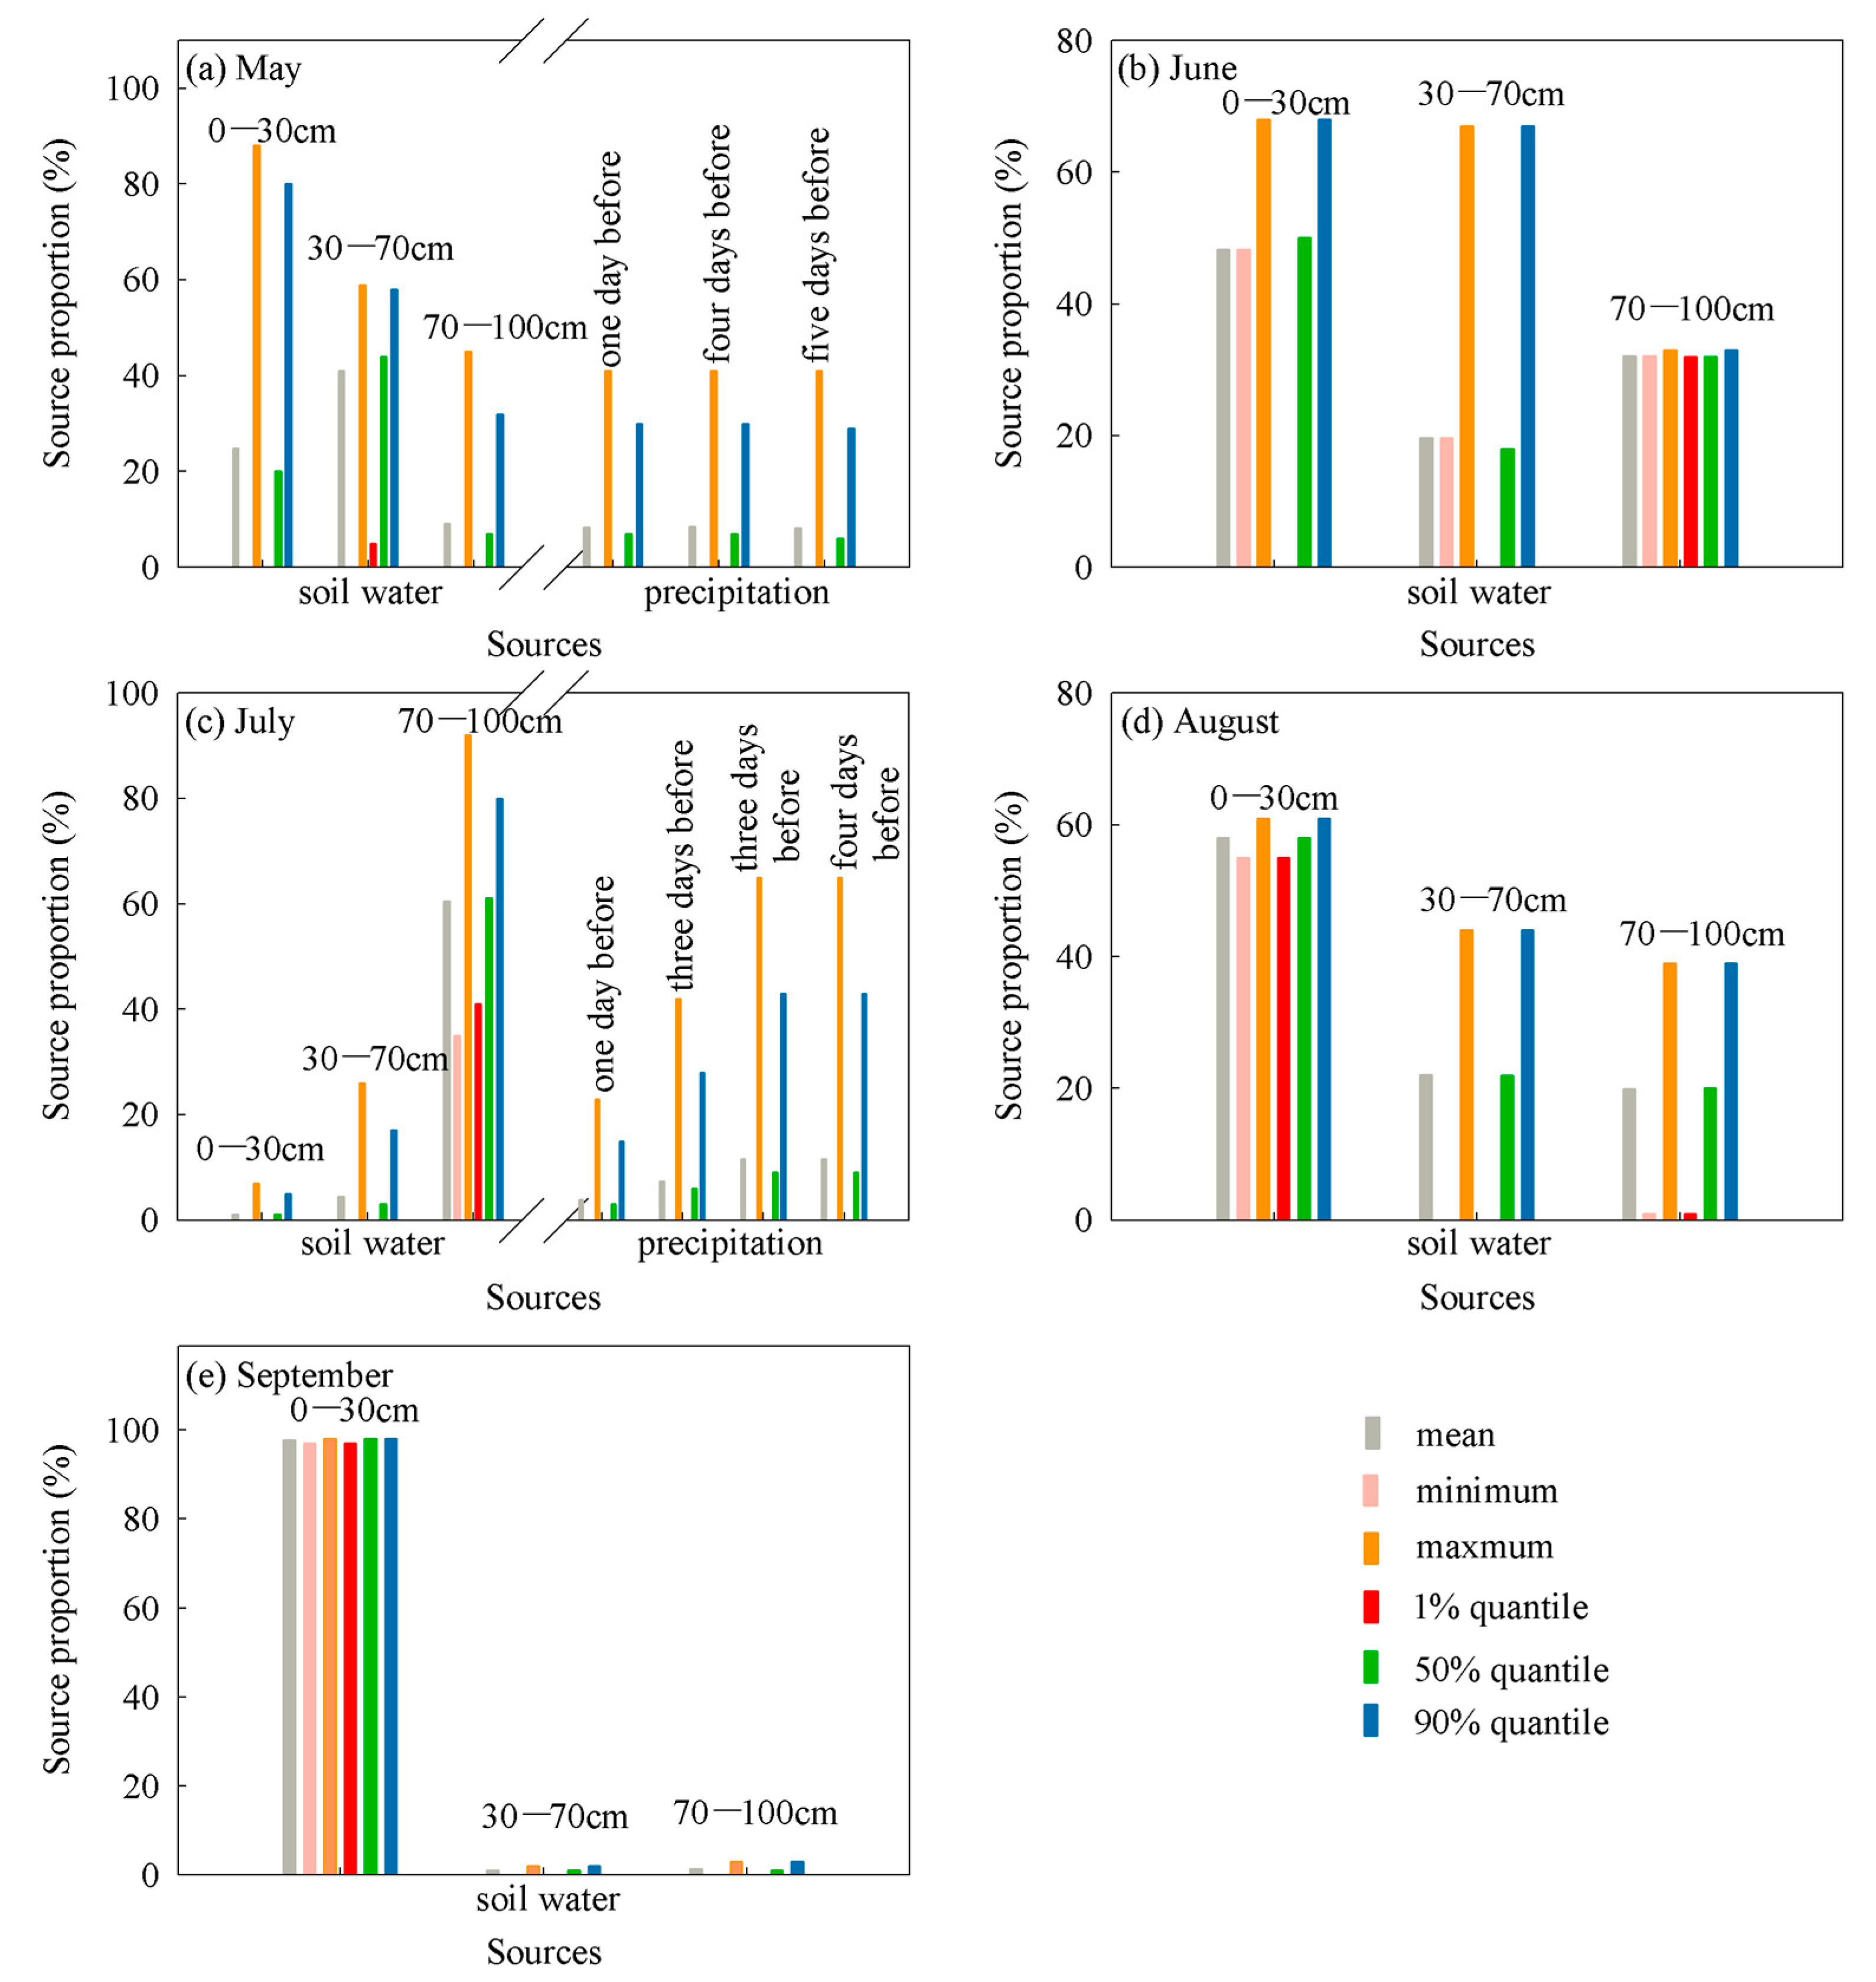
Figure 10.
The fraction of plant water use from the different soil layers (0–30 cm, 30–70 cm, 70–100 cm) and precipitation at Gulang. (a–e) represent the months of May, June, July, August, and September, respectively.
Figure 10.
The fraction of plant water use from the different soil layers (0–30 cm, 30–70 cm, 70–100 cm) and precipitation at Gulang. (a–e) represent the months of May, June, July, August, and September, respectively.
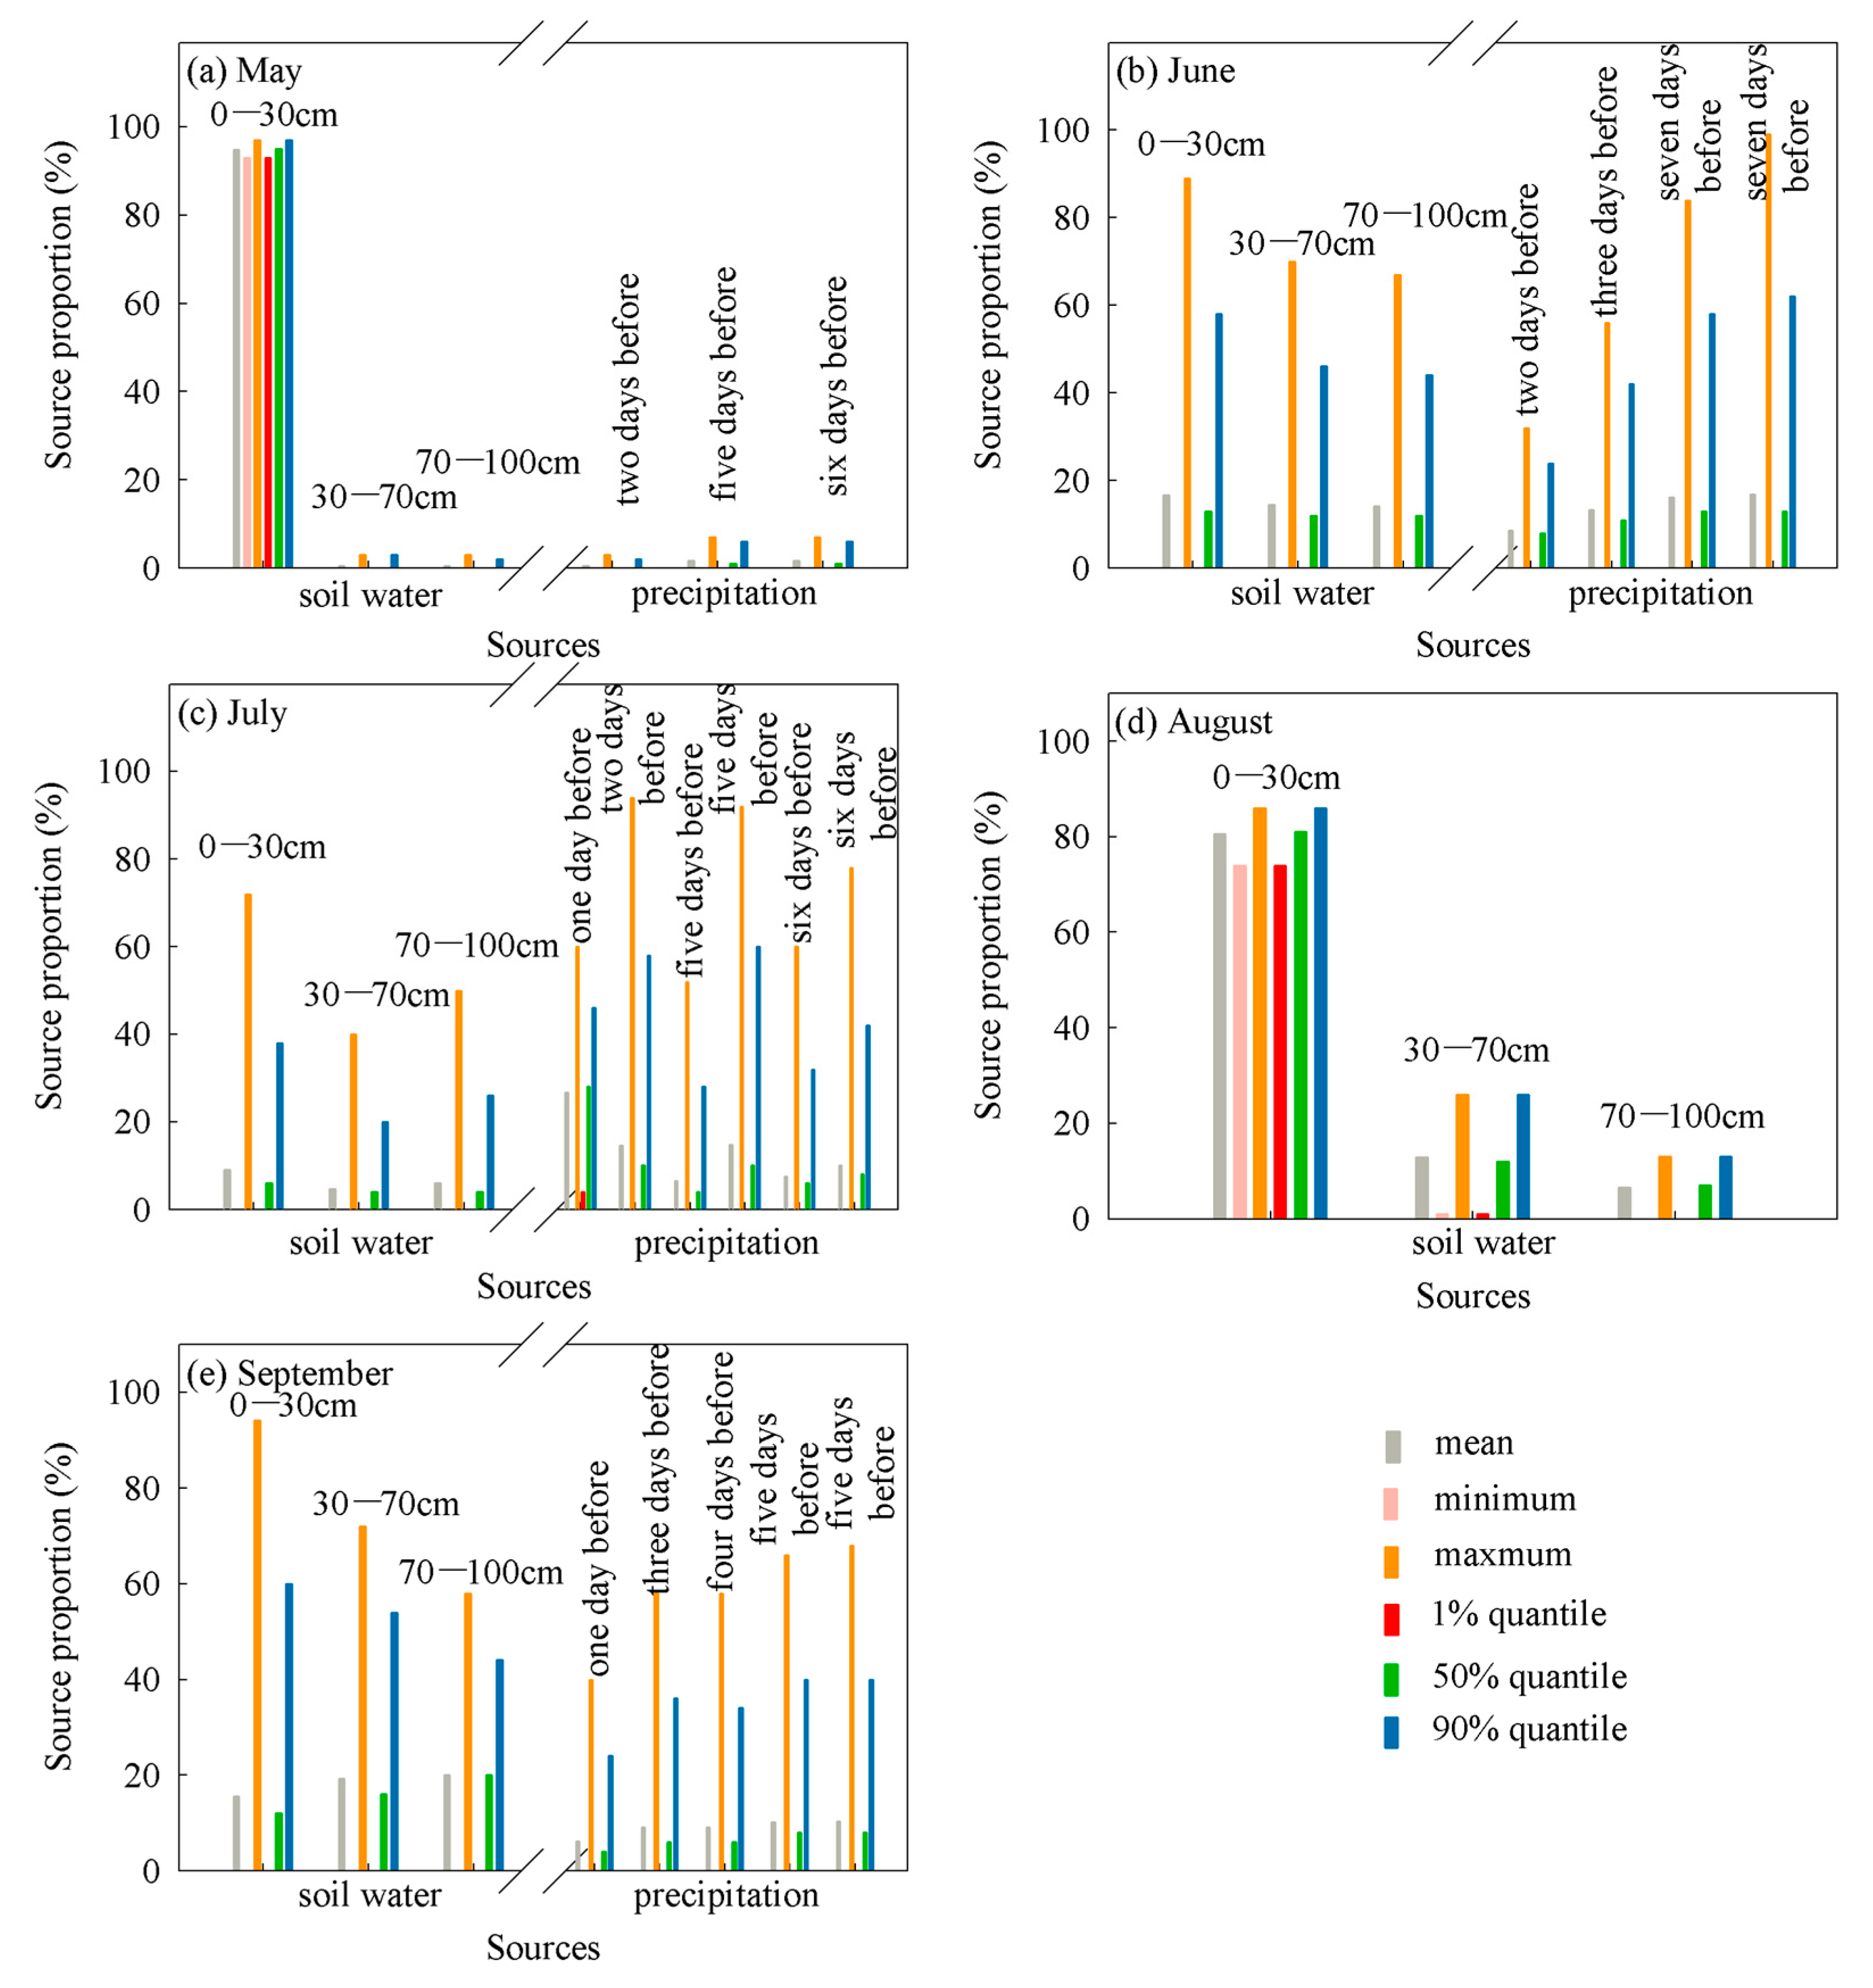
Figure 11.
The fraction of plant water use from the different soil layers (0–30 cm, 30–70 cm, 70–100 cm) and precipitation at Wushaoling. (a–e) represent the months of May, June, July, August, and September, respectively.
Figure 11.
The fraction of plant water use from the different soil layers (0–30 cm, 30–70 cm, 70–100 cm) and precipitation at Wushaoling. (a–e) represent the months of May, June, July, August, and September, respectively.
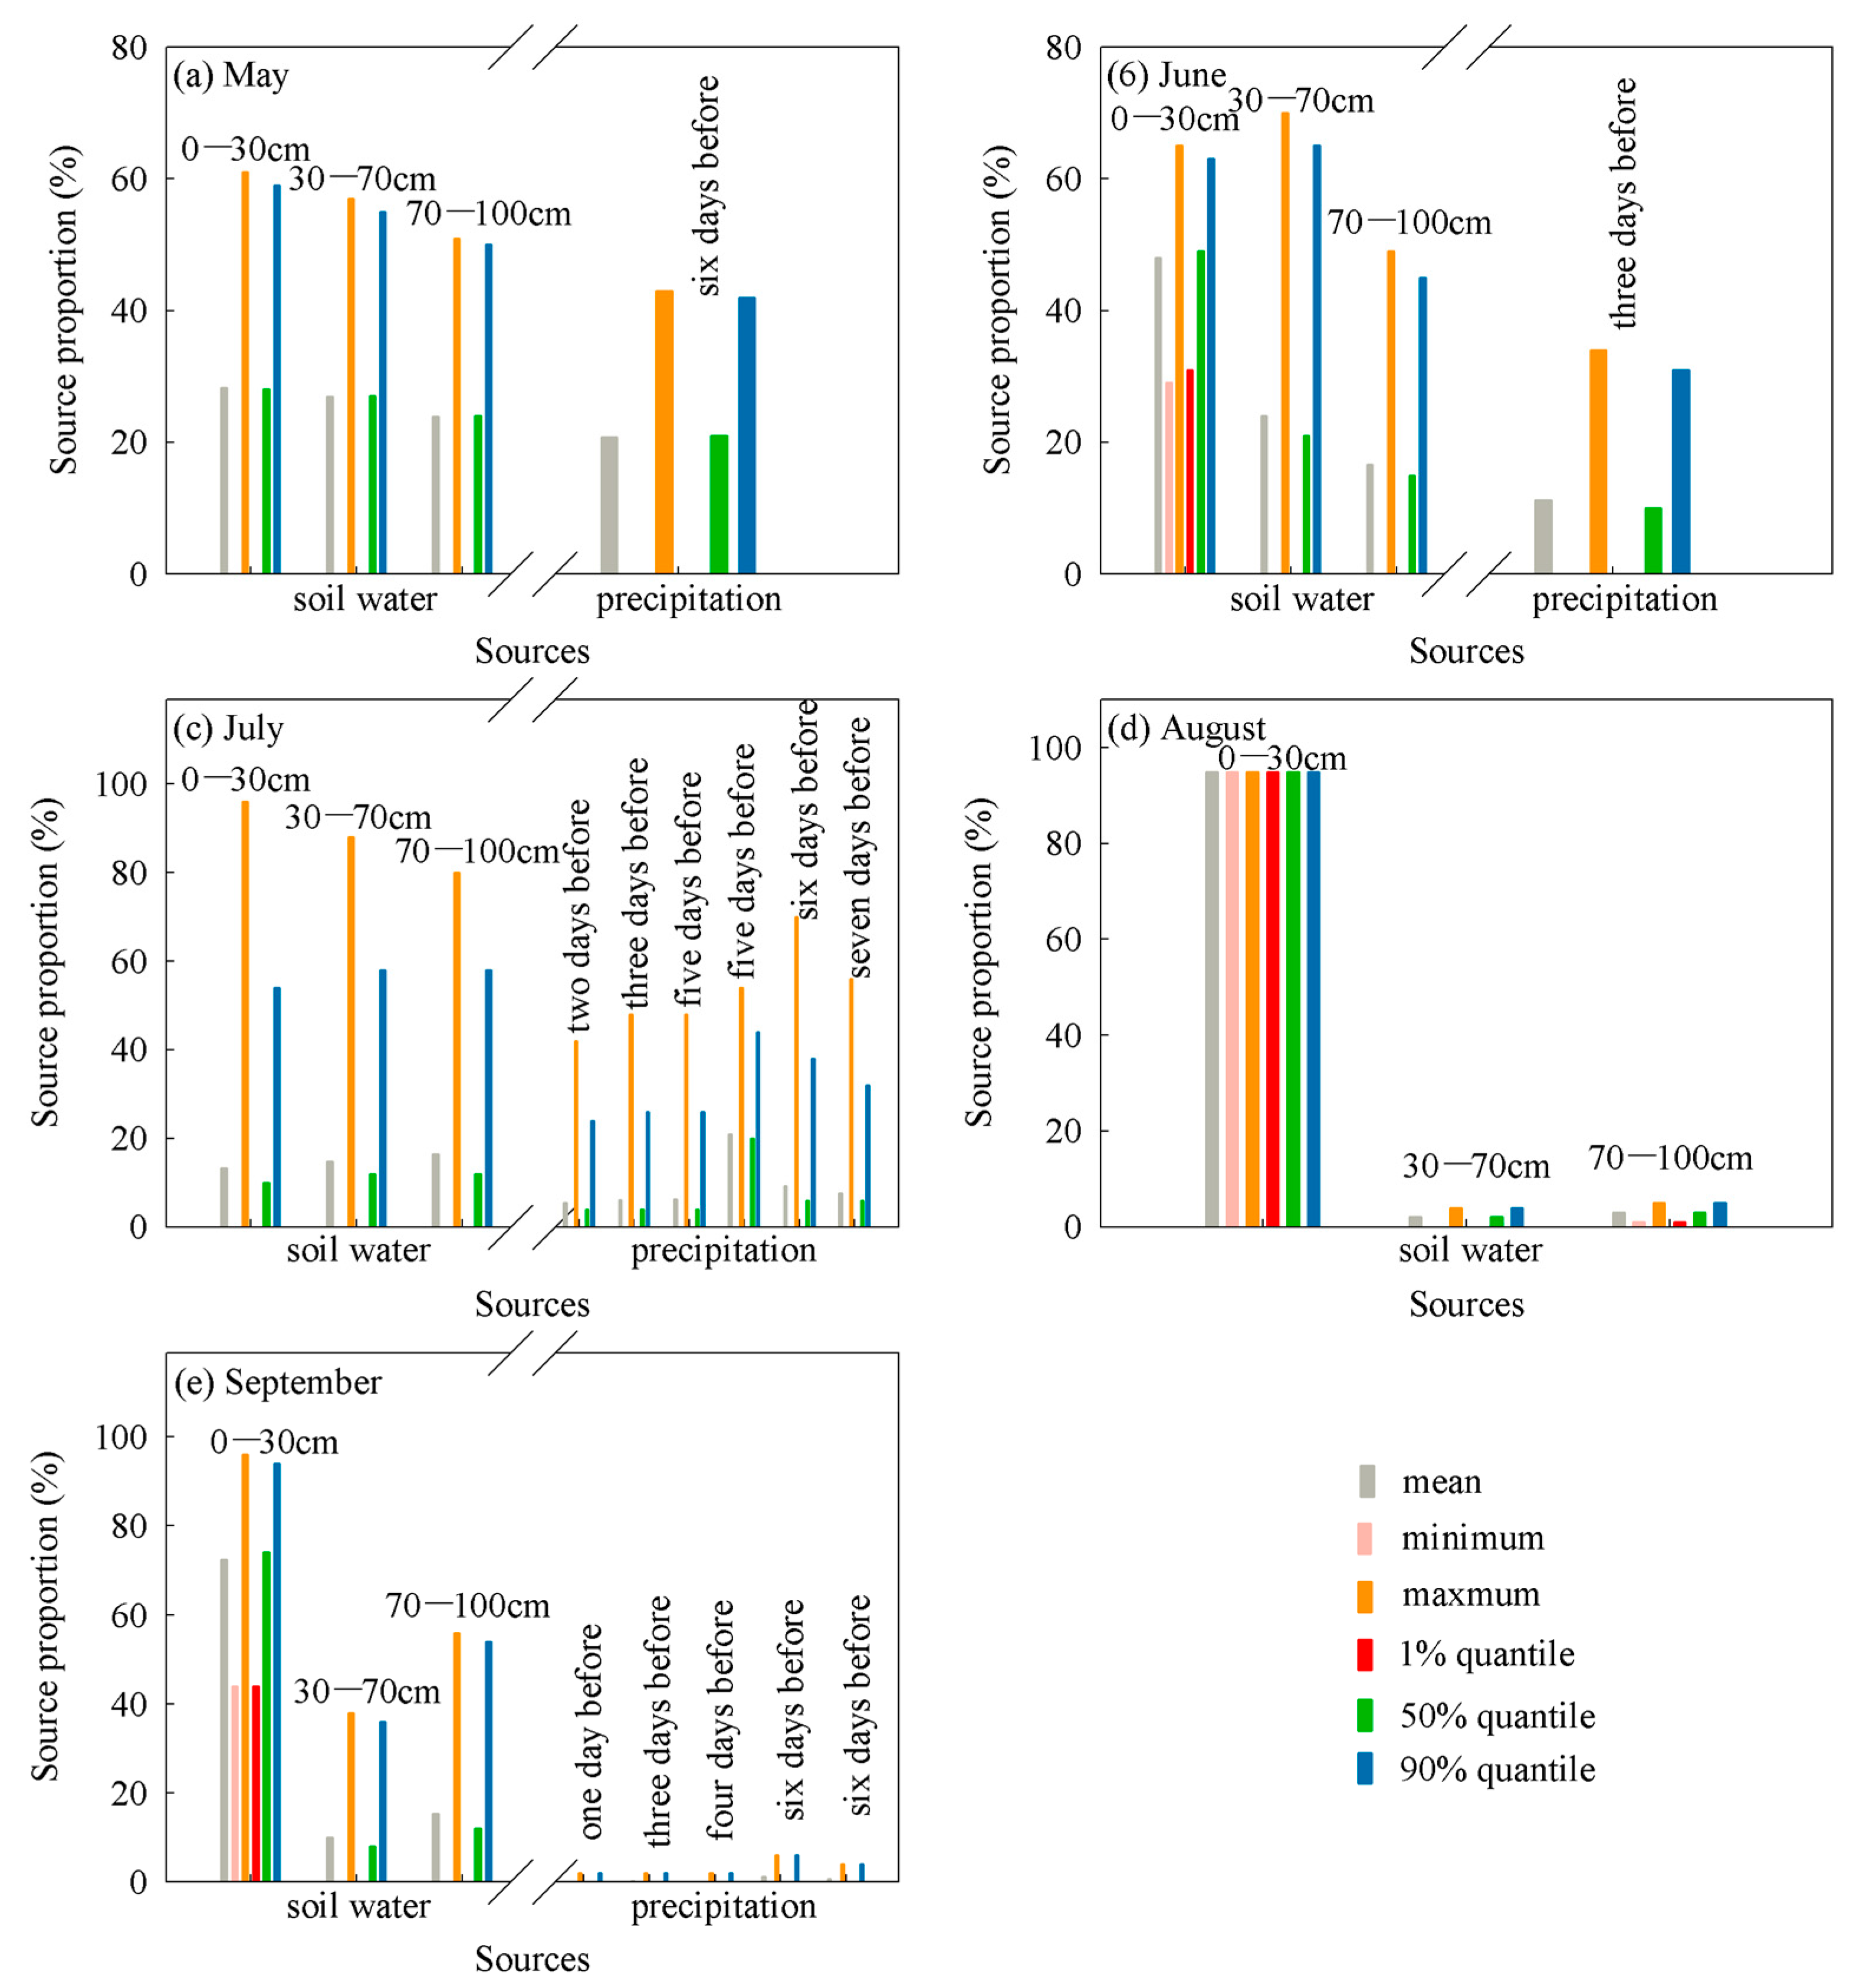
Figure 12.
The fraction of plant water use from the different soil layers (0–30 cm, 30–70 cm, 70–100 cm) and precipitation at Tianzhu. (a–e) represents May, Jun, July, August and September, respectively.
Figure 12.
The fraction of plant water use from the different soil layers (0–30 cm, 30–70 cm, 70–100 cm) and precipitation at Tianzhu. (a–e) represents May, Jun, July, August and September, respectively.
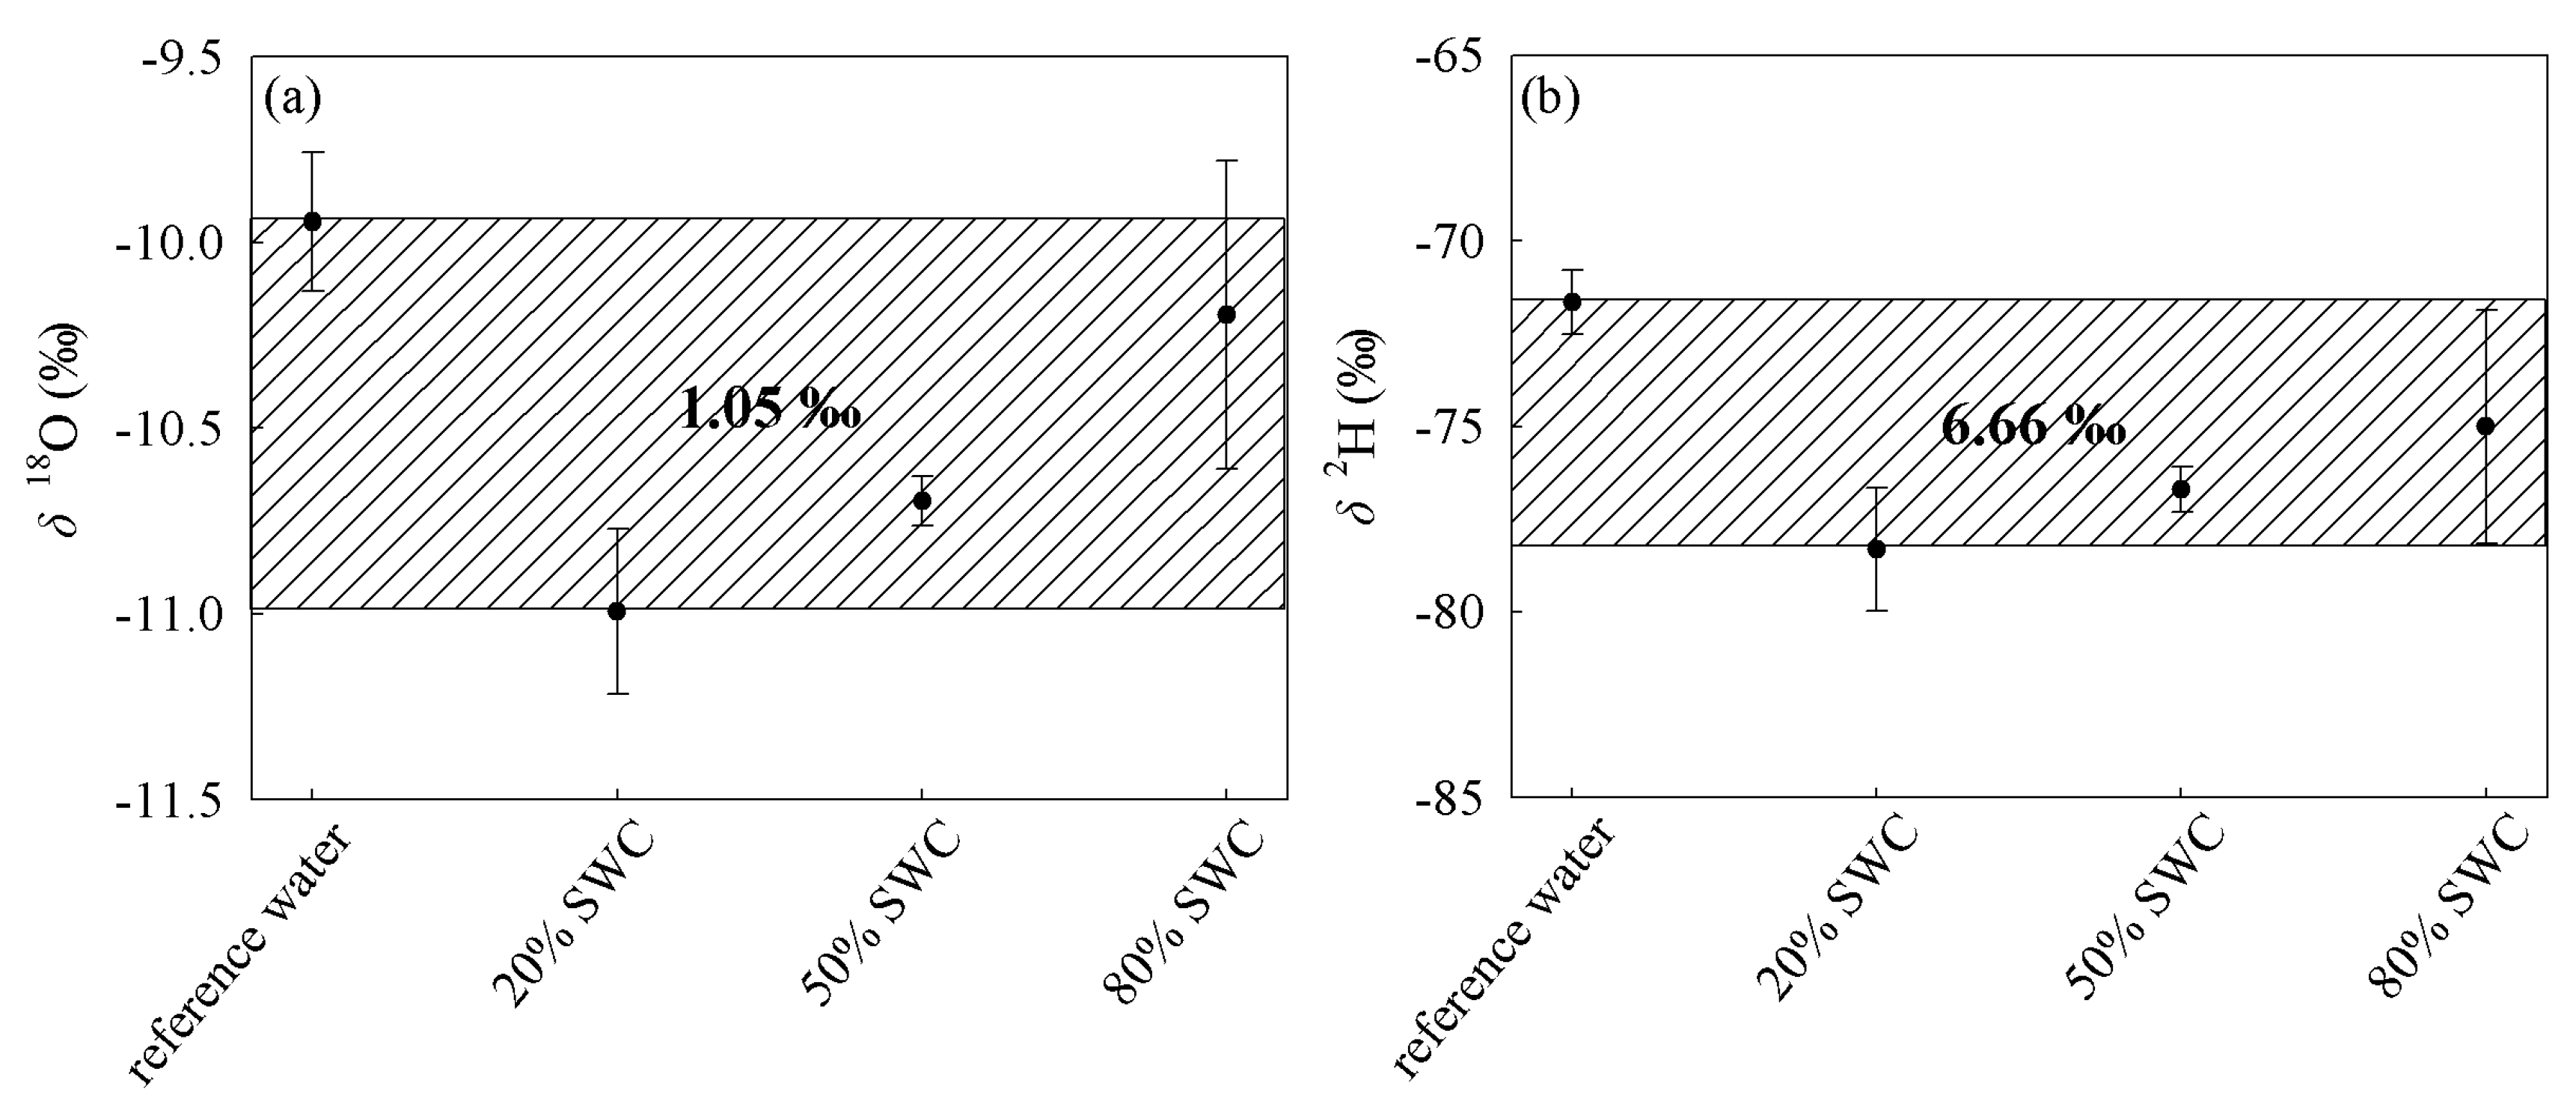
Figure 13.
The isotopic differences for the soil samples with different SWC and the reference water. (a,b) are for δ18O and δ2H, respectively.
Figure 13.
The isotopic differences for the soil samples with different SWC and the reference water. (a,b) are for δ18O and δ2H, respectively.
Table 1.
The locations and long term climatology (T = air temperature and P = precipitation amount) during 1981–2010 at the sampling sites in the Qilian Mountains.
Table 1.
The locations and long term climatology (T = air temperature and P = precipitation amount) during 1981–2010 at the sampling sites in the Qilian Mountains.
| Sampling Sites | Latitude | Longitude | Altitude (m) | T (°C) | P (mm) |
|---|
| Gulang | 37°29′ | 102°54′ | 2072.4 | 5.7 | 352.3 |
| Wushaoling | 37°12′ | 102°52′ | 3045.1 | 0.3 | 407.4 |
| Tianzhu | 36°59′ | 103°11′ | 2484.8 | 3.5 | 450.0 |
Table 2.
Number of samples collected in the Qilian Mountains from 2015 to 2016.
Table 2.
Number of samples collected in the Qilian Mountains from 2015 to 2016.
| Sampling Sites | Precipitation | Plant | Soil | River | Groundwater |
|---|
| Gulang | 60 | 15 | 165 | 5 | 5 |
| Wushaoling | 156 | 20 | 165 | 5 | 5 |
| Tianzhu | 107 | 13 | 165 | 5 | 5 |
Table 3.
Isotopic signatures of precipitation in the Qilian Mountains from 2015 to 2016.
Table 3.
Isotopic signatures of precipitation in the Qilian Mountains from 2015 to 2016.
| δ18O (‰) | δ2H (‰) | D-Excess (‰) |
|---|
| Gulang | −19.91−2.40 | −135.86−14.28 | −10.96−29.41 |
| (mean −8.58) | (mean −54.21) | (mean 14.46) |
| Wushaoling | −31.11−2.58 | −232.15−28.64 | −8.77−31.43 |
| (mean −8.61) | (mean −54.78) | (mean 14.10) |
| Tianzhu | −19.67−7.89 | −158.44−60.81 | −10.01−31.46 |
| (mean −7.53) | (mean −48.48) | (mean 11.79) |
Table 4.
The relationship between δ18O and precipitation amount (P), and between δ18O and temperature (T).
Table 4.
The relationship between δ18O and precipitation amount (P), and between δ18O and temperature (T).
| Site | δ18O−P | δ18O−T |
|---|
| Correlation Coefficient | Regression Coefficient (‰·mm−1) | Correlation Coefficient | Regression Coefficient (‰·oC−1) |
|---|
| Gulang | −0.15 | −0.11 | 0.402 * | 0.124 |
| P = 0.397 > 0.05 | P = 0.017 < 0.05 |
| Wushaoling | 0.095 | 0.113 | 0.483 ** | 0.226 |
| P = 0.289 > 0.05 | P = 0.000 |
| Tianzhu | −0.096 | −0.066 | 0.562 ** | 0.362 |
| P = 0.367 > 0.05 | P = 0.000 |
Table 5.
Parameters of the fit for OLSR (ordinary least squares regression), RMA (reduced major axis regression), MA (major axis regression), PWLSR (precipitation weighted least squares regression), PWRMA (precipitation weighted reduced major axis regression), PWMA (precipitation weighted major axis regression) regressions at each site in the Qilian Mountains.
| Sites | Algorithm | Slope | Intercept | rmSSEav | t-Value |
|---|
| Gulang N = 43 | OLSR | 8.31 ± 0.32 | 18.86 ± 3.15 | 1.01 | - |
| RMA | 8.56 ± 0.31 | 21.17 ± 3.08 | 1.00 | 0.55 |
| MA | 8.81 ± 0.33 | 23.48 ± 3.24 | 1.01 | 1.09 |
| PWLSR | 9.01 ± 0.36 | 24.24 ± 3.55 | 1.00 | 1.50 |
| PWRMA | 9.31 ± 0.37 | 27.00 ± 3.58 | 1.03 | 2.07 |
| PWMA | 9.60 ± 0.37 | 29.78 ± 3.66 | 1.08 | 2.59 |
| Wushaoling N = 127 | OLSR | 8.09 ± 0.10 | 14.99 ± 1.02 | 1.00 | - |
| RMA | 8.17 ± 0.10 | 15.64 ± 1.02 | 1.00 | 0.54 |
| MA | 8.24 ± 0.10 | 16.27 ± 1.03 | 1.00 | 1.06 |
| PWLSR | 8.09 ± 0.12 | 15.21 ± 1.11 | 1.00 | 0.01 |
| PWRMA | 8.21 ± 0.12 | 16.15 ± 1.12 | 1.00 | 0.84 |
| PWMA | 8.32 ± 0.13 | 17.07 ± 1.13 | 1.01 | 1.65 |
| Tianzhu N = 90 | OLSR | 7.83 ± 0.16 | 11.18 ± 1.45 | 1.01 | - |
| RMA | 7.96 ± 0.15 | 12.22 ± 1.43 | 1.00 | 0.61 |
| MA | 8.10 ± 0.16 | 13.25 ± 1.47 | 1.01 | 1.21 |
| PWLSR | 8.05 ± 0.17 | 12.60 ± 1.56 | 1.00 | 1.01 |
| PWRMA | 8.20 ± 0.17 | 13.89 ± 1.57 | 1.01 | 1.68 |
| PWMA | 8.35 ± 0.17 | 15.17 ± 1.59 | 1.03 | 2.32 |
Table 6.
Correlation coefficients between soil water δ18O and soil water content (SWC).
Table 6.
Correlation coefficients between soil water δ18O and soil water content (SWC).
| Month | May | June | July | August | September |
|---|
| Gulang | 0.781 ** | −0.733 * | −0.291 | −0.655 * | −0.057 |
| Wushaoling | −0.125 | −0.524 | 0.227 | 0.907 ** | −0.709 * |
| Tianzhu | 0.589 | −0.640 * | 0.040 | −0.571 | −0.024 |
Table 7.
The correlation relationships between precipitation, river water, and groundwater.
Table 7.
The correlation relationships between precipitation, river water, and groundwater.
| Sites | Precipitation-River Water | Precipitation-Groundwater | River Water-Groundwater |
|---|
| Gulang | 0.386 | 0.118 | 0.358 |
| Wushaoling | 0.413 | 0.142 | 0.893 * |
| Tianzhu | −0.455 | −0.398 | 0.798 |
Table 8.
The mean δ18O and δ2H for river water and groundwater.
Table 8.
The mean δ18O and δ2H for river water and groundwater.
| Site | River Water | Groundwater |
|---|
| δ18O (‰) | δ2H (‰) | δ18O (‰) | δ2H (‰) |
|---|
| Gulang | −8.19144 | −50.7811 | −8.36746 | −52.4299 |
| Wushaoling | −8.05623 | −49.566 | −8.34914 | −53.3473 |
| Tianzhu | −7.62581 | −47.0895 | −7.65622 | −47.5145 |
Table 9.
Identification of the plant species collected in the Qilian Mountains in 2016.
Table 9.
Identification of the plant species collected in the Qilian Mountains in 2016.
| Sampling Sites | Latin Name of Plant Species |
|---|
| Gulang | Armeniaca vulgaris Lam. |
| Caragana korshinskii Kom. |
| Populus davidiana |
| Wushaoling | Caragana stenophylla Pojark. |
| Iris lactea Pall. Var. chinensis (Fisch.) Koidz. |
| Achnatherum inebrians (Hance) Keng |
| Tianzhu | Populus davidiana |
| Caragana stenophylla Pojark. |
| Ceratoides arborescens (Losinsk.) Tsien et C.G.Ma |
| Picea crassifolia |
Table 10.
Information about the extraction efficiency of LI-2100.
Table 10.
Information about the extraction efficiency of LI-2100.
| Number | Soil Weight (g) | Water Weight Filled by Reference Water (g) | Water Weight after Extraction (g) | Extraction Rate (%) |
|---|
| 20-1 | 15.74 | 3.15 | 3.12 | 99 |
| 20-2 | 14.98 | 3.00 | 2.94 | 98 |
| 20-3 | 14.52 | 2.90 | 2.76 | 95 |
| 50-1 | 8.88 | 4.44 | 4.42 | 100 |
| 50-2 | 10.24 | 5.12 | 5.10 | 100 |
| 50-3 | 7.97 | 3.98 | 3.92 | 98 |
| 80-1 | 7.45 | 5.96 | 5.80 | 97 |
| 80-2 | 6.97 | 5.58 | 5.50 | 99 |
| 80-3 | 7.54 | 6.03 | 5.93 | 98 |

 ,
, 


