1. Introduction
The Blue Nile River that is located in the dry and semi-dry region is very important for Egypt, Sudan, and Ethiopia, as it is considered the major source of water supply. Although the Blue Nile basin accounts for only 8% of the Nile River watershed [
1], it provides approximately 60% of water flow in the Nile River. The Nile River provides Egypt with more than 95% of its water supply [
2]. Ethiopia depends on rainfed agriculture with 89% of its labor force employed in smallholder agriculture [
3]. Therefore, accurate estimation of rainfall and investigation on the long-term trends on different temporal scales is essential for water resources management. The Intergovernmental Panel on Climate Change [
4] proved that warming over Africa had increased during the last 50–100 years, which may cause a water cycle modification affecting the rainfall amount [
5]. Although an increase in average annual rainfall is evident over eastern Africa where the Blue Nile exists, the rainfall trends have a high variability over time and location. The migration of the Inter-Tropical Convergence Zone (ITCZ) is a main driver for the rainfall variability over the Blue Nile basin [
6].
Several hydro-meteorological studies have been carried out in the Blue Nile basin and sub-basin scale over the last few decades. In one of the major development projects in the hydropower and irrigation sectors in Ethiopia, Tesemma et al. [
7] analyzed the 10-day discharge data at the Sudan–Ethiopia border, and the monthly average precipitation in the Upper Blue Nile Basin (UBNB) over 40 years. They found that, in the rainy season, significant increases in the discharge data occur at all the stations and no significant trends were found for the seasonal and annual rainfall data. Gebremicael et al. [
8] applied the Mann–Kendall test on the long-term variation regions of runoff and sediment fluxes in the UBNB. They found significant increasing trends for the total annual and wet season stream flow and sediment load, while a decreasing trend was detected in the dry season for both. However, there were no significant trends in the total annual rainfall over the basin. Tekleab et al. [
9] carried out the trend and change point analyses for 13 precipitation, 12 temperature, and 9 stream gauging stations in the UBNB. They found a statistically significant increase in temperature in small rainy season and dry season, while there were significant increasing and decreasing trends in the seasonal and extreme streamflow. In addition, they observed no significant trends for both seasonal and annual precipitation. Samy et al. [
10] analyzed two stream flow stations (one in the outlet of Lake Tana and another on the Blue Nile River) and found insignificant trend in the flow time series, except for two months in the rainy season where an increasing trend occurred.
The plausible reasons that specific unified trends were not detected in the previous studies are the higher variability of rainfall in the UBNB, insufficiency in the number of analyzed data for the extraction of a long-term trend, and different statistical measures used in each study. Researchers used several methods to characterize and analyze the monotonic trends of hydro-meteorological data over a few decades. The nonparametric Mann–Kendall (MK) statistical test [
11,
12] was found to be more suitable for non-normally distributed data and datasets with frequently missing data. Önöz and Bayazit [
13] compared the parametric t-test with the nonparametric MK test to examine the powers of detecting trend in long-term time series. They found that both tests detected a trend in the river basins of Turkey, while they differed at the border lines. The authors recommended applying both tests for the trend analysis using different significance levels. Pandey and Khare [
14] investigated the spatial variability and temporal trend of precipitation and reference evapotranspiration in Narmada River basin (India) over 102 years. They used MK and Spearman Rank (SR) test and found relatively close results in both tests. They determined the magnitude of variability and trends using Sen’s slope estimator. To determine the shifting year in the time series, they applied Buishand Range Test and Pettitt Test.
Prior studies applied on the UBNB were mostly conducted on a sub-basin scale, which implies further research on the basin. In addition, not all studies apply normality and auto-correlation analyses, which are essential to use the most appropriate trend analysis method. Furthermore, most studies of trend analysis do not interfere with the inter-annual variability analysis of the rainfall that affects the rainfall temporal distribution prediction. To overcome these drawbacks, this research assessed the trend in UBNB by applying nonparametric statistical analysis using MK and Sen’s slope estimator accompanied with normality and autocorrelation tests. In addition, inter-annual variability analysis was carried out over the study period of 1953–2014 using the Coefficient of Variation (CV) and Precipitation Concentration Index (PCI). The data and results contained herein can be used to predict future precipitation and to estimate the uncertainty in future precipitation prediction models. In addition, it provides updated information about the current situation in the basin.
2. Materials and Methods
2.1. Study Area
The Blue Nile River is the largest tributary of the River Nile with a drainage area about 176,000 km
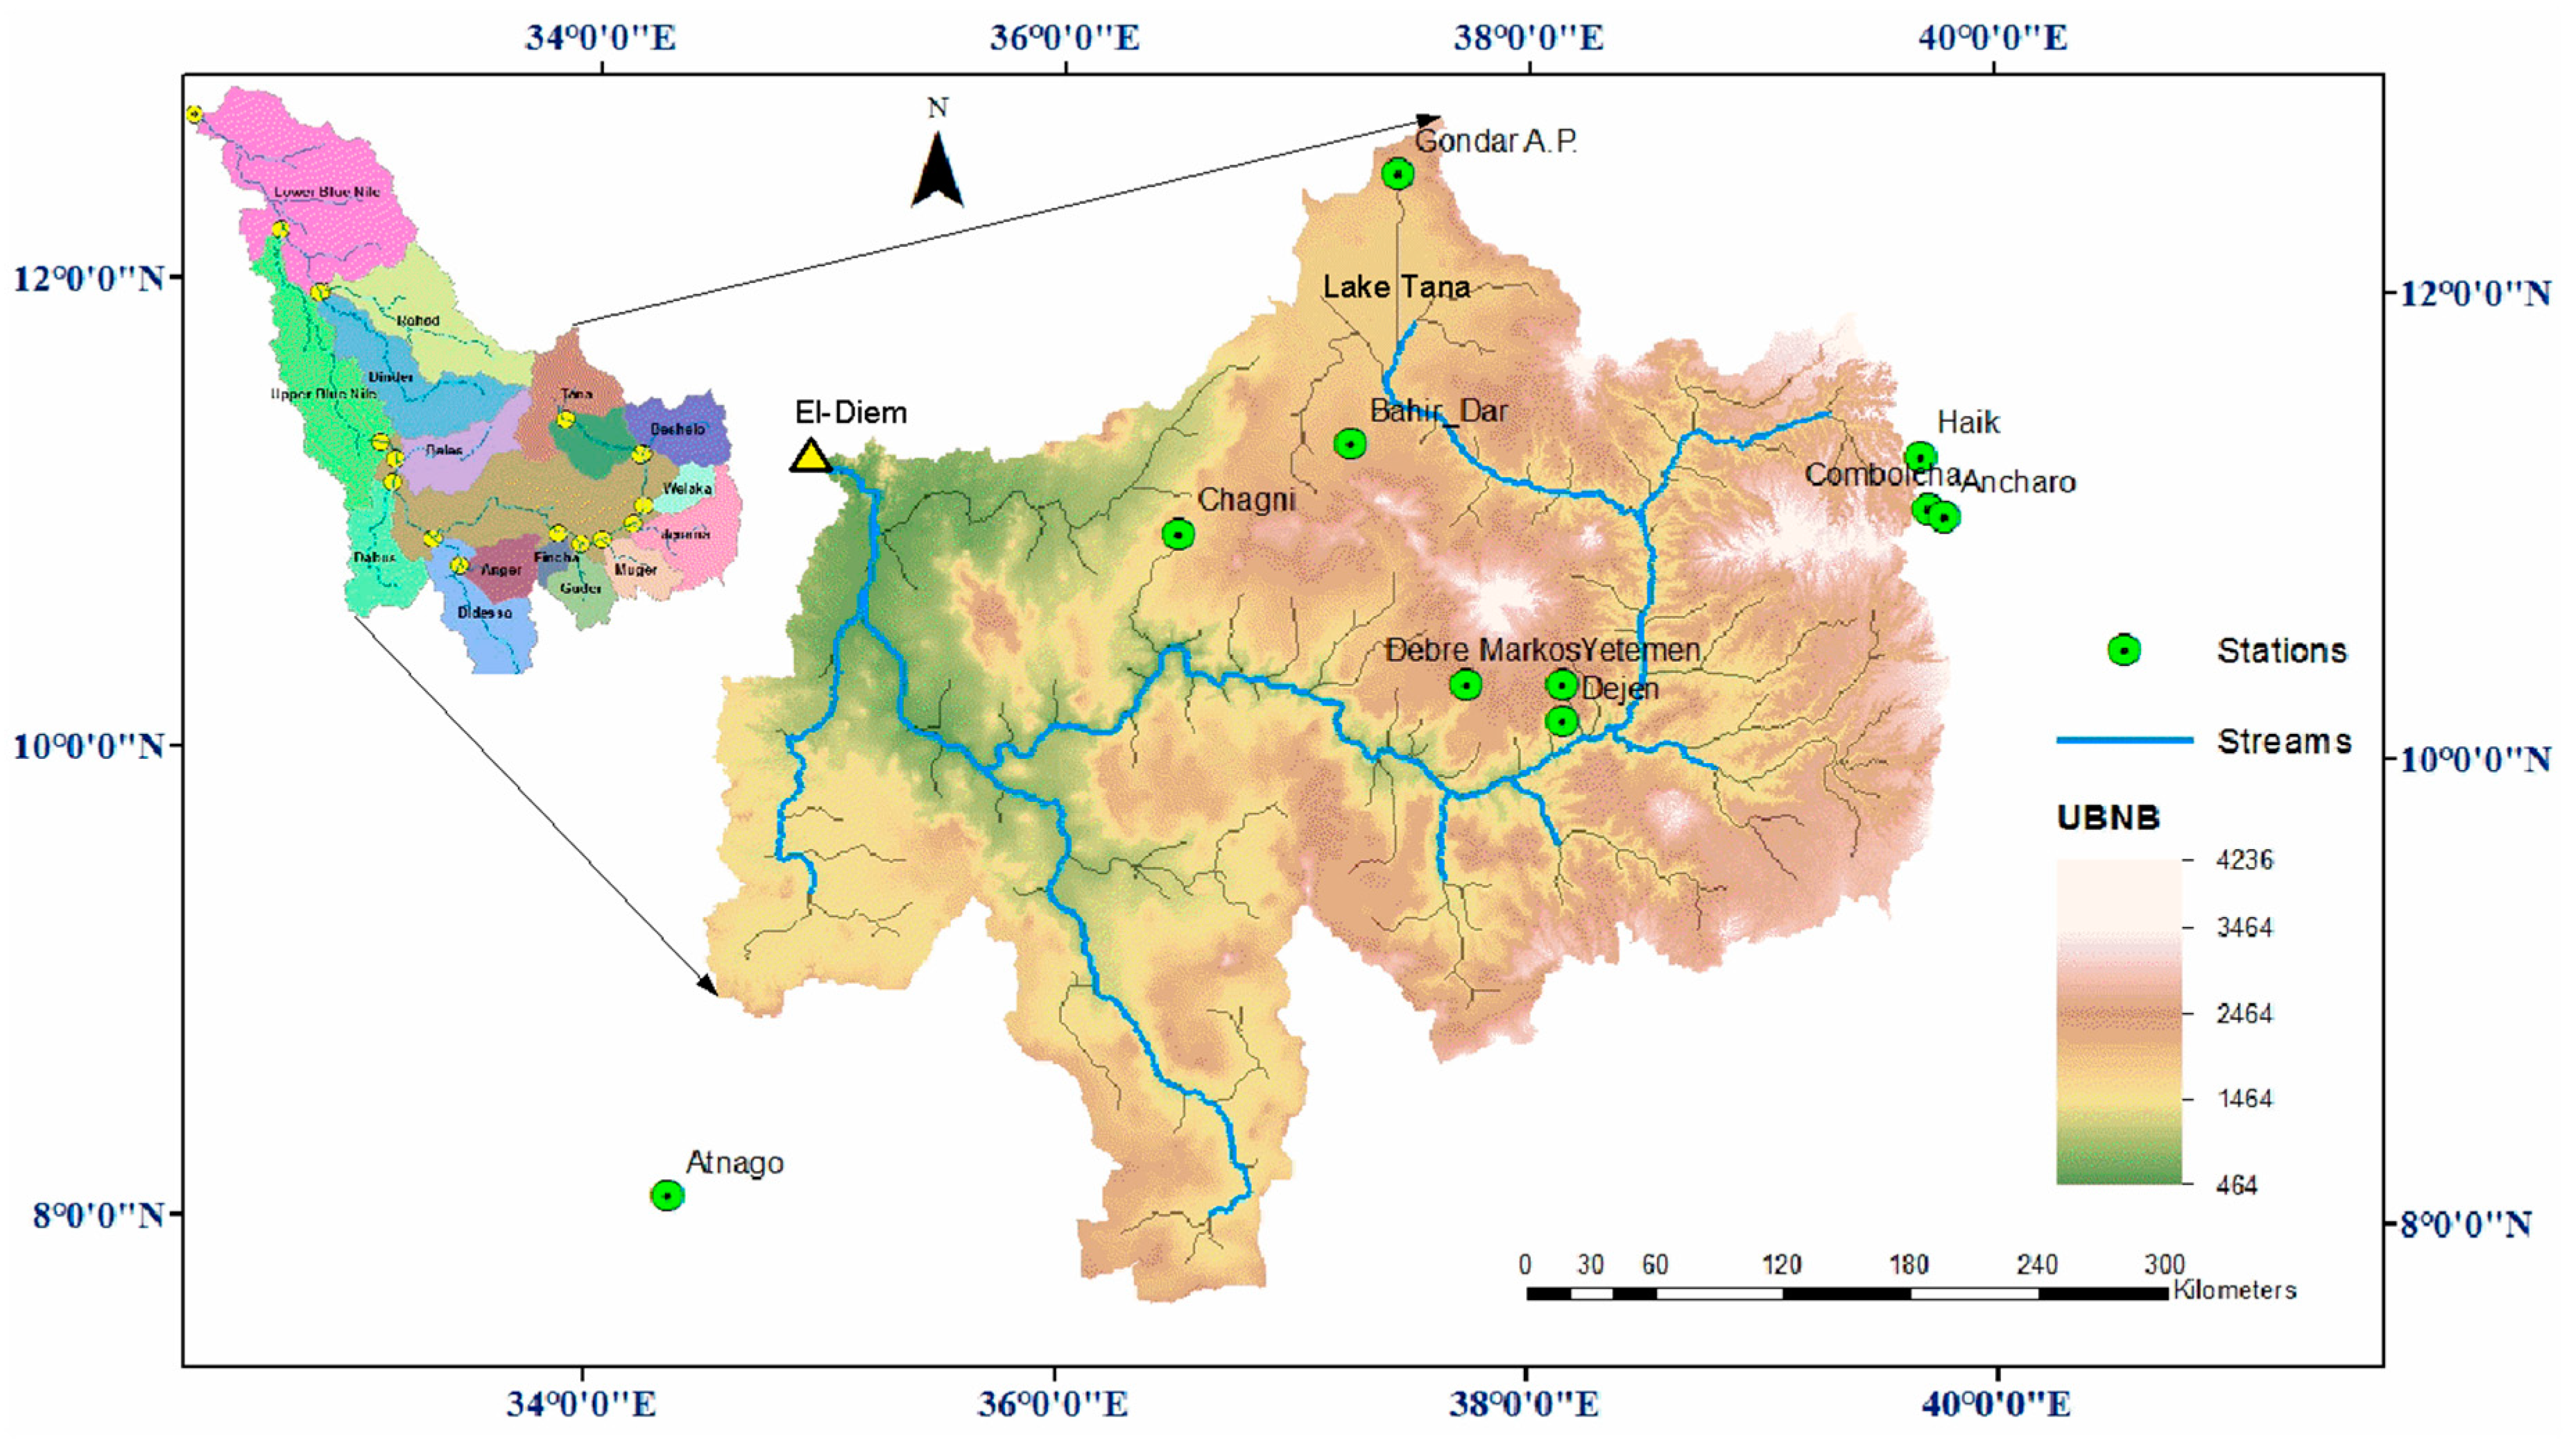
2 covering about 17% of Ethiopia. Its headwaters commence from Lake Tana at an elevation of 1830 m above sea level (asl) at Bahir Dar, as shown in
Figure 1. Many tributaries join the main stream through central and southwestern Ethiopian high lands until the main stream reaches the lowlands at the Ethiopian–Sudanese border at El-Diem. The part of the Blue Nile basin in Ethiopia is called UBNB, which locates in the northwestern part of Ethiopia between longitudes 34°30′ and 39°45′ E and latitudes 7°45′ and 12°45′ N [
15]. From the headwaters at Bahir Dar to down the stream at El Diem, the elevation varies from 4000 m in the headwaters in Ethiopian highlands to 480 m near the downstream at the Sudanese border with an approximate length for the Upper Blue Nile (UBN) of 940 km [
1]. The basin topography is composed of hills and highlands in the northeastern part, and valleys continue in the southern and western parts [
8]. Lake Tana accounts for about 7% of the UBN flow; approximately 80% of this the flow occurs between June and September, while the rest of flow occurs during March–May on the southern tributaries.
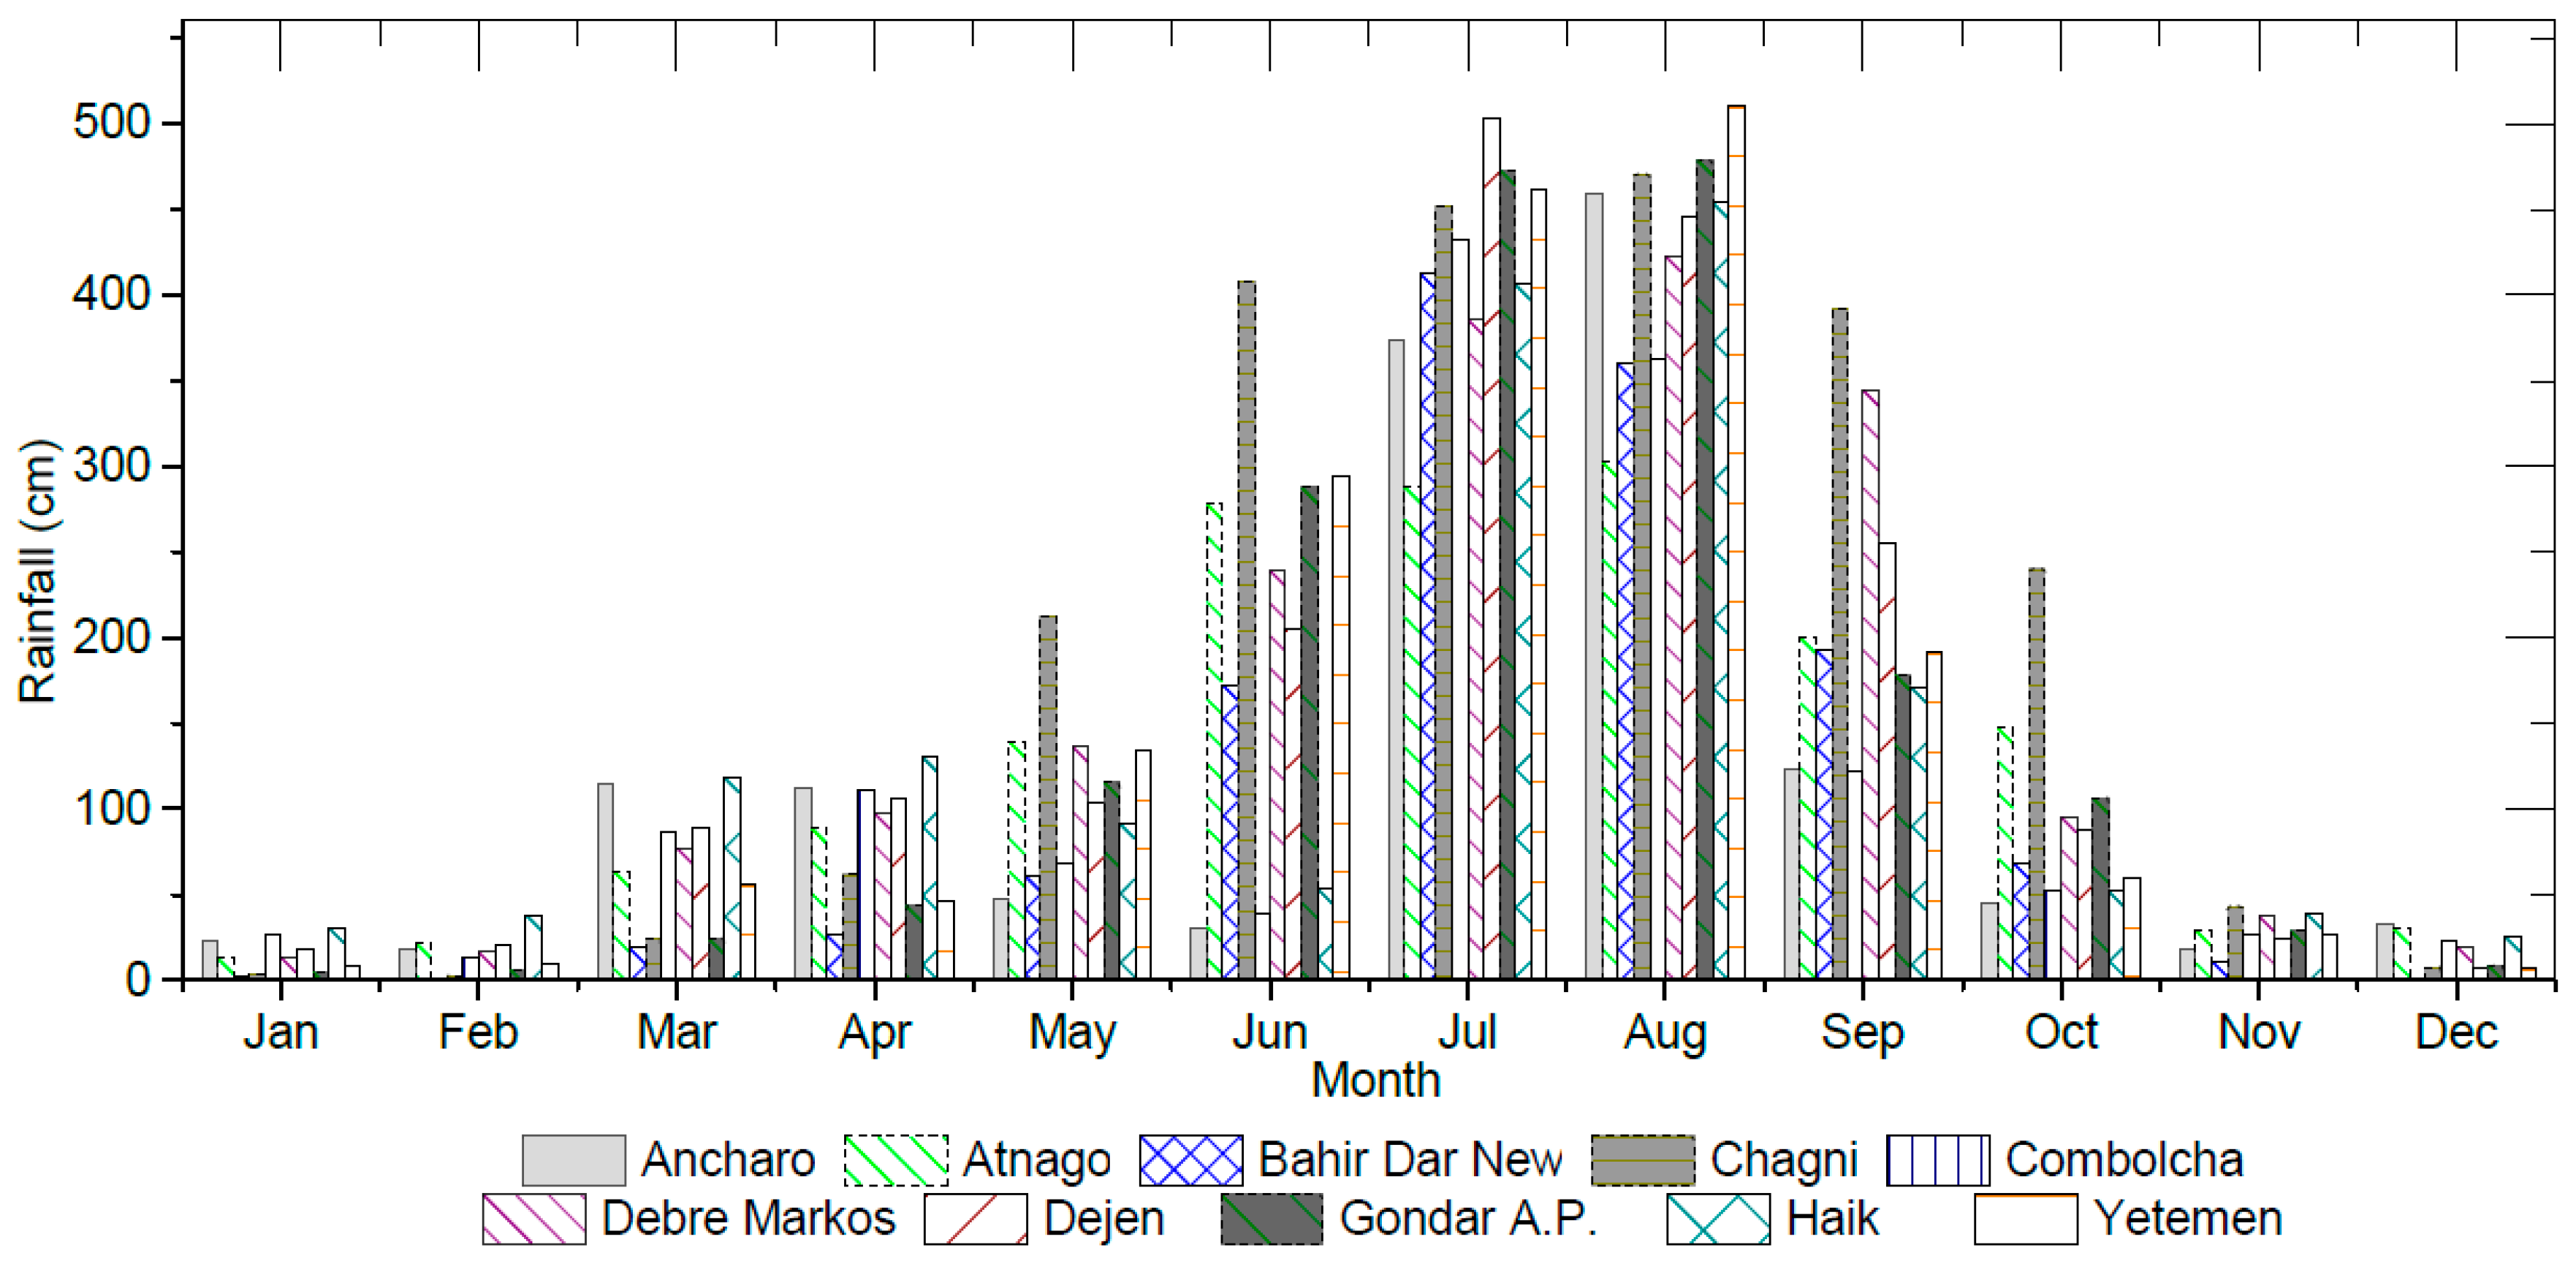
The Blue Nile is known to have a high rainfall seasonality and variability of rainfall varying spatially over Ethiopia due to different climatic indices, as shown in
Figure 2. There are three main rainy seasons in the UBNB: the dry season from October to February, the small rainy season from March to May and the main rainy season usually from June to September [
16,
17]. In the dry season, most of the country is dry except for the south and southeas; in the small rainy season, the main rainfall is in the southern and southeastern of Ethiopia heading towards the eastern central of the UBNB; and, during the rainy season, rainfall is covering most of the country except for the south and southeast of Ethiopia [
18].
2.2. Data
Data were collected from the National Meteorological Agency (NMA) of Ethiopia with records spanning from 1953 to 2014. The data contained rainfall amount, station location and elevation. The geographical location of the basin and the spatial distribution of the ground stations are shown in
Figure 1. Ten rainfall stations were used in this study based on the area coverage and data availability. Each station’s geographical and data characteristics are given in
Table 1.
2.3. Statistical Analysis
2.3.1. Data Checking
To ensure the data quality, only the observing stations that have data series accounting for 80% of the total period were selected. Moreover, the years when all monthly data are available were also considered to be mandatory for the data analysis. During the evaluation of the data quality, some missing years were found in time series for some stations. Such missing years were excluded from the analysis. Then, the trends were evaluated over different time periods (not less than 30 years) depending on data availability at the respective stations [
19]. The different periods of the used rainfall record for each station are given in
Table 1.
Prior to the trend analysis, some statistical tests were used to examine the normality and auto-correlation of the data. For the normality test, the Shapiro–Wilk and the Kolmogorov–Smirnov tests were applied [
20]. To apply nonparametric MK test, the data time series does not need to be normally distributed, but it must be serially independent and randomly ordered [
21]. Nonetheless, some hydrological data may show significant serial correlation, thus auto-correlation statistical test for all time-series was applied to eliminate the effect of serial correlation [
22].
2.3.2. Variability Analysis
The inter-annual variability of the rainfall was considered in this study because Ethiopia has suffered from several droughts since the 1970s in specific seasons and seasonal agriculture is dominant. The data were analyzed using the Coefficient of Variation (CV) to investigate the inter-annually reliability and to evaluate the variability of rainfall. CV is calculated using Equation (1):
where
σ is the standard deviation and
μ is the rainfall mean.
Higher values of annual and seasonal CV indicate high variability in rainfall causing extremes whether flood or drought. Based on CV, rainfall variability degree can be classified as [
23]: CV < 20, less variability; 20 < CV < 30, moderate variability; and CV > 30, high variability.
Precipitation Concentration Index (PCI) was calculated using Equation (2). PCI is used to identify the heterogeneity pattern of rainfall, its change over time, and concentration of rainfall at annual and seasonal scales [
24].
where
pi is the monthly rainfall in month
i, and
n is the number of months in the period of the considered specific season (i.e., 12 for total annual, 4 for rainy season, 3 for small rainy season, and 5 for dry season). Equation (2) proves that, for equally distributed rainfall data (same rainfall amount occurs in each month), PCI will be minimum and equal to 8.3, which corresponds to uniform distribution. A similar conclusion was made by Oliver [
24] who proposed the following classification of rainfall distribution based on PCI value: PCI < 10, uniform (U); 10 < PCI ≤ 15, moderate (M); 15 < PCI ≤ 20, irregular (I); and PCI > 20, strong irregular (SI).
2.3.3. Mann–Kendall Trend Test
MK trend test is based on ranks within time series without assuming any specific distribution, implying that there is no serial correlation between the observations [
25,
26]. The null hypothesis (H
o) represents that the data series is independent and identically distributed with the insignificant trend, and it is tested against the alternative hypothesis (H
1). If the null hypothesis is rejected, it indicates that the time series has either an upward or downward significant trend. The null hypothesis was tested in this study at the 5% level of significance.
The MK test statistic
S is a measure of association between two samples to determine whether there is an increasing or decreasing trend. This statistic was calculated using Equation (3) [
27,
28]:
where
n is the length of datasets,
xj and
xk are sequential data values (where
j >
k), and the sign function
sgn(xj − xk) was calculated as in Equation (4):
The variance of
S, for the data following the standard normal distribution with mean of zero and variance of one, was computed as in Equation (5):
The positive and negative values of
S represent a general tendency towards an increasing and decreasing trend, respectively. Finally, the standard normal test statistic Z for the MK test was calculated using Equation (6):
where Z is used to evaluate the presence of the significance of any trend. A positive value of Z indicates an increasing trend, while a negative Z shows a decreasing trend. The computed standardized MK statistic Z value can be evaluated with the standard normal distribution according to the confidence level (α = 0.05). If the computed absolute Z value is greater than Z
α/2 (50% of the level of confidence), then the null hypothesis (H
0) is rejected. Otherwise, H
0 is accepted, representing that the trend is statistically insignificant. In this study, the statistical significance of the trends was evaluated at the 5% level of significance, thus a positive Z value larger than 1.96 (based on normal probability tables) indicates a significant increasing trend, while a negative Z value lower than −1.96 shows a significant decreasing trend.
2.3.4. Sen’s Slope Estimator
If a linear trend exists, the magnitude of the monotonic trend (change per unit time) in hydrologic time series can be quantified by using the nonparametric Sen’s estimator of slope using Equation (7) [
29,
30]. Sen’s slope
was used to evaluate the relative strength of the MK trend test. In this analysis, there are no constraints regarding whether data are serially correlated or not as well as normally distributed or not [
31].
where
β is the magnitude of trend slope between data points
xi and
xj, and
xi and
xj are the data measurements at time
i and
j respectively (
i >
j). The positive and negative values of
β indicate an upward and a downward trend in the time series, respectively [
32,
33,
34].
2.3.5. Pettitt Test for Change Point Detection
To detect the abrupt change in the rainfall time series, a non-parametric Pettitt test is applied [
35]. It is used to assess existing of significant change point X
t in a time series of random values {X
1, X
2, …, X
T}, with a change point at t where F
1(X) = {X
1, X
2, …, X
T} ≠ F
2(X) = {X
t+1, X
t+2, …, X
T}.
The null hypothesis H
0 is the absence of change point and it is tested against the alternative hypothesis H
a (change point occurs, 1 ≤
t ≤
T) using the non-parametric statistic:
If a change point does not exist, |
Ut,T| will continue rising and no turning points will be observed. Nevertheless, when a changing point exists in the time series, |
Ut,T| will decrease and the turning point is formed. To determine whether change point exists or not, the probability of detecting the change point is calculated using Equation (11) considering 5% significance level, and null hypotheses H
0 is rejected when
P is smaller than the significance level, 0.05.
3. Results and Discussion
3.1. Descriptive Statistics and Rainfall Variability Analysis
Descriptive statistical measures of rainfall in UBNB were estimated based on the collected data, as shown in
Figure 3. For the total annual rainfall, the lowest annual rainfall occurred over Bahir Dar station (at the outlet of Lake Tana) and the northeastern part of the basin, over Haik station, while the highest rainfall occurred over the southwestern part of the basin. During the rainy season, the lowest rainfall occurred at Haik station while the highest rainfall occurred at Atnago. The rainy season share of the rainfall counted as 72% of the total annual rainfall. For the small rainy season, the basin encountered rainfall of 221 mm as an average with a standard deviation of 104 mm, and it represented about 17% of the total annual rainfall on the basin. Finally, for the dry season, the rainfall amount was less throughout the year with an average 150 mm with a standard deviation of 88 mm representing 11% of the total annual rainfall.
Figure 3 shows the rainfall characteristics for each station (minimum, maximum, average, and standard deviation).
3.2. Rainfall Variability Analysis
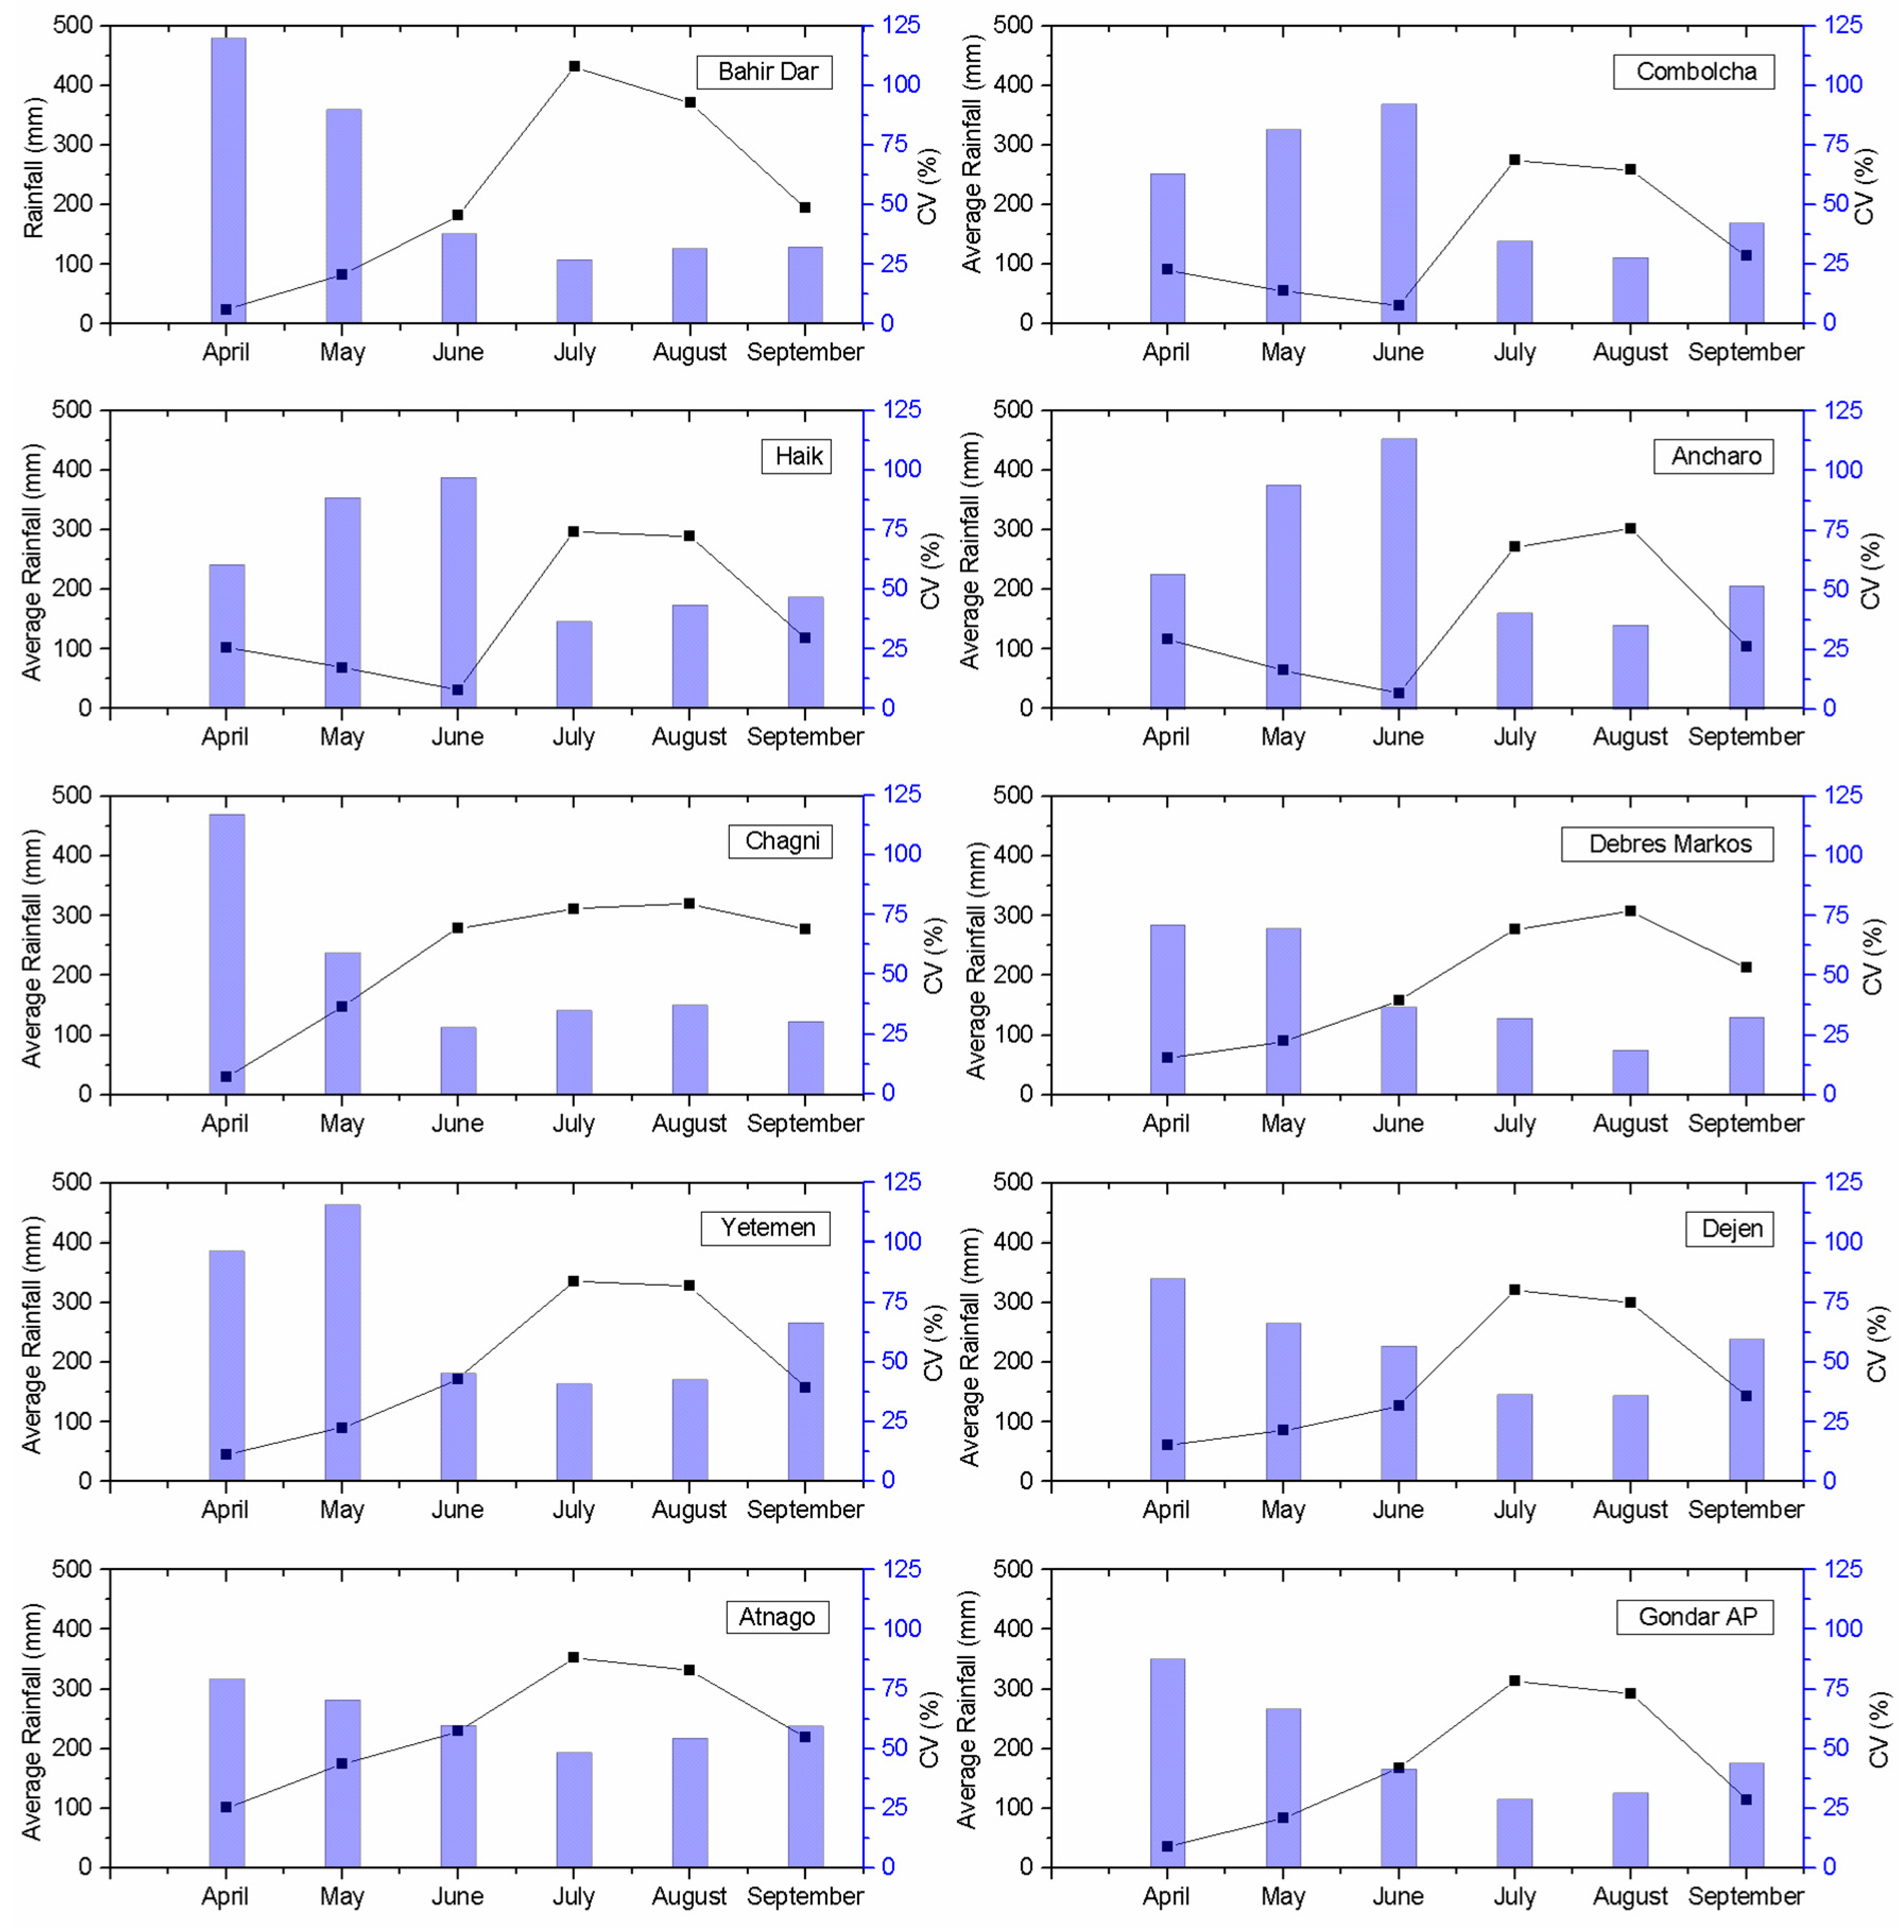
The Coefficient of Variation (CV) was calculated on a monthly basis for small rainy and rainy seasons, to investigate the inter-annual variability of rainfall distribution. Investigating variability in the onset and cessation of the rainy season is crucial to the agriculture in the region, as the rainy season is directly affecting crop production over most parts of Ethiopia and any delay may cause crop failure. The period from June to September is considered the major rainy season, during which 60–85% of the annual rainfall is received. Although rainfall generally peaked in July and August, its variability was greater at the beginning and end of the rainy season (June and September), as shown in
Figure 4. The rainfall mostly commenced in April with a lower rainfall amount in the small rainy season, and then it peaked in August in the rainy season. The results show the high coefficient of variability that exceeded 30, indicating that rainfall over the basin was classified as having high variability.
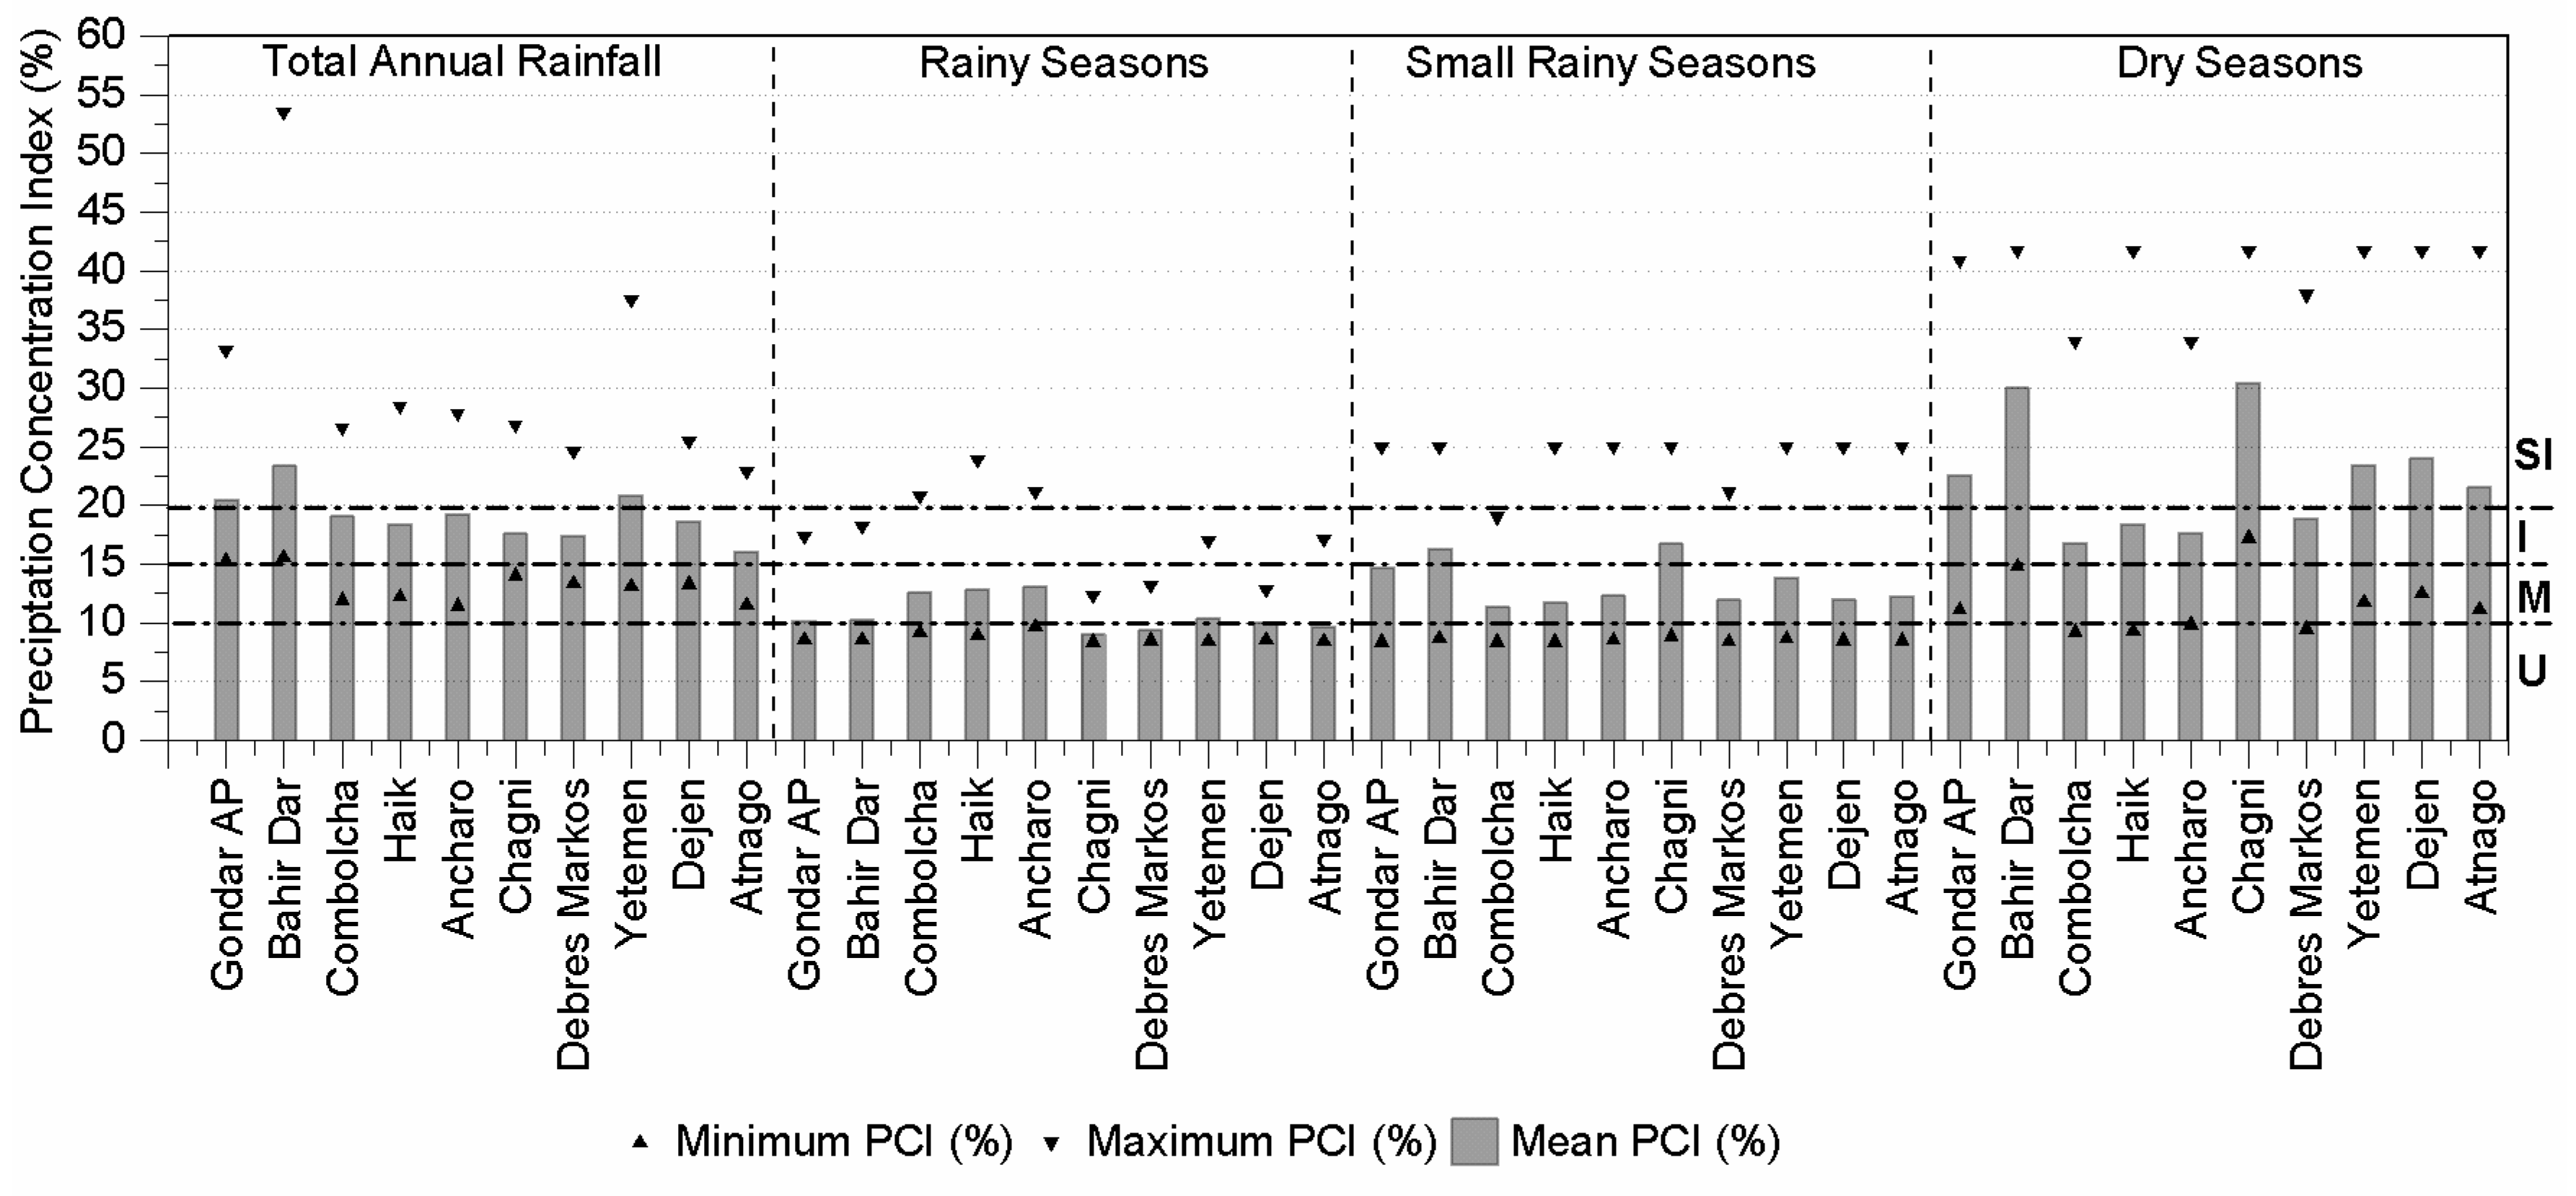
The yearly Precipitation Concentration Index (PCI) was calculated on an annual and seasonal basis for the available ten stations according to Equation (2) and the mentioned factors. The yearly distribution of PCI showed that, for all stations, total annual rainfall and dry season rainfall both have the same PCI classification, which was irregular (I) and strong irregular (SI) rainfall distribution. This was due to the inequality of rainfall concentrations over all months. For the rainy and small rainy seasons, PCI was found to be categorized in uniform (U) and moderate (M) rainfall distribution, respectively. This is because rainfall was well distributed among all the months of each season. This enables the farmers to cultivate the crops in its suitable timing within the rainy season.
Average annual and seasonal PCI were calculated for each station, as shown in
Figure 5. For the total annual rainfall, the northeastern of the UBNB had a PCI value ranging from 11.43 to 28.39 with an average 18.84, showing that about 15% of the years were characterized with a moderate rainfall distribution, 48% with an irregular rainfall distribution and about 38% with a strong irregularity of rainfall distribution over the year. The total annual rainfall in the northeastern part of the basin was characterized by an irregular distribution in the rainfall where it happens in almost six months of the year. Similarly, for the northern and eastern central of the UBNB, total annual PCI indicated a strong irregularity in the rainfall distribution along the year, showing that the rainfall was only distributed over a third of the year. Finally, for the central and southwestern, PCI indicated irregular rainfall distribution over the year.
For the rainy season, calculated PCI over the basin showed that it varied from about 8.39 to 23.94 with an average 10.7. For the northern, northeastern and eastern central parts of the basin, PCI indicated a moderate rainfall distribution over the months of the rainy season. For the central and southeastern parts of the basin, PCI indicated uniform rainfall distribution over the season. Whereas, for the small rainy season, PCI values indicated moderate rainfall distribution all over the season for the basin, and the PCI for the dry season indicated irregularity and strong irregularity of rainfall distribution over the dry season months.
3.3. Trend Analysis of Rainfall using the Mann–Kendall Test
Normality and serial-correlation tests were performed to the rainfall time series data in the UBNB over 1953–2014 prior to the MK test and Sen’s slope estimator. The normality and serial-correlation tests were implemented to the annual and seasonal rainfall for 10 stations using Xlstat and Minitab, respectively, at a significance level (α) of 5%. In the normality test, the statistics of the Shapiro–Wilk and Kolmogorov–Smirnov tests were examined, resulting in the rejection of the null hypothesis for the stations such as Gondar AP, Dejen and Yetemen. Thus, the rainfall data in such an observing station were non-normally distributed. Subsequently, lag-1 auto correlation for the seasonal rainfall time series was performed. As a result, no rainfall time series was serially correlated at the 95% confidence limit, enabling MK test to be applied without any further modifications. Results of the MK test for trend analysis were used to identify the time series of total annual and seasonal rainfall for each station, as shown in
Table 2, with detailed results such as Kendall’s statistics (S), computed probability (
p-value), Sen’s slope (Sen’s S), result of H
0 hypothesis (H
0) and trend according to
p-value, whether it exists or not (or whether it is increasing or decreasing if present).
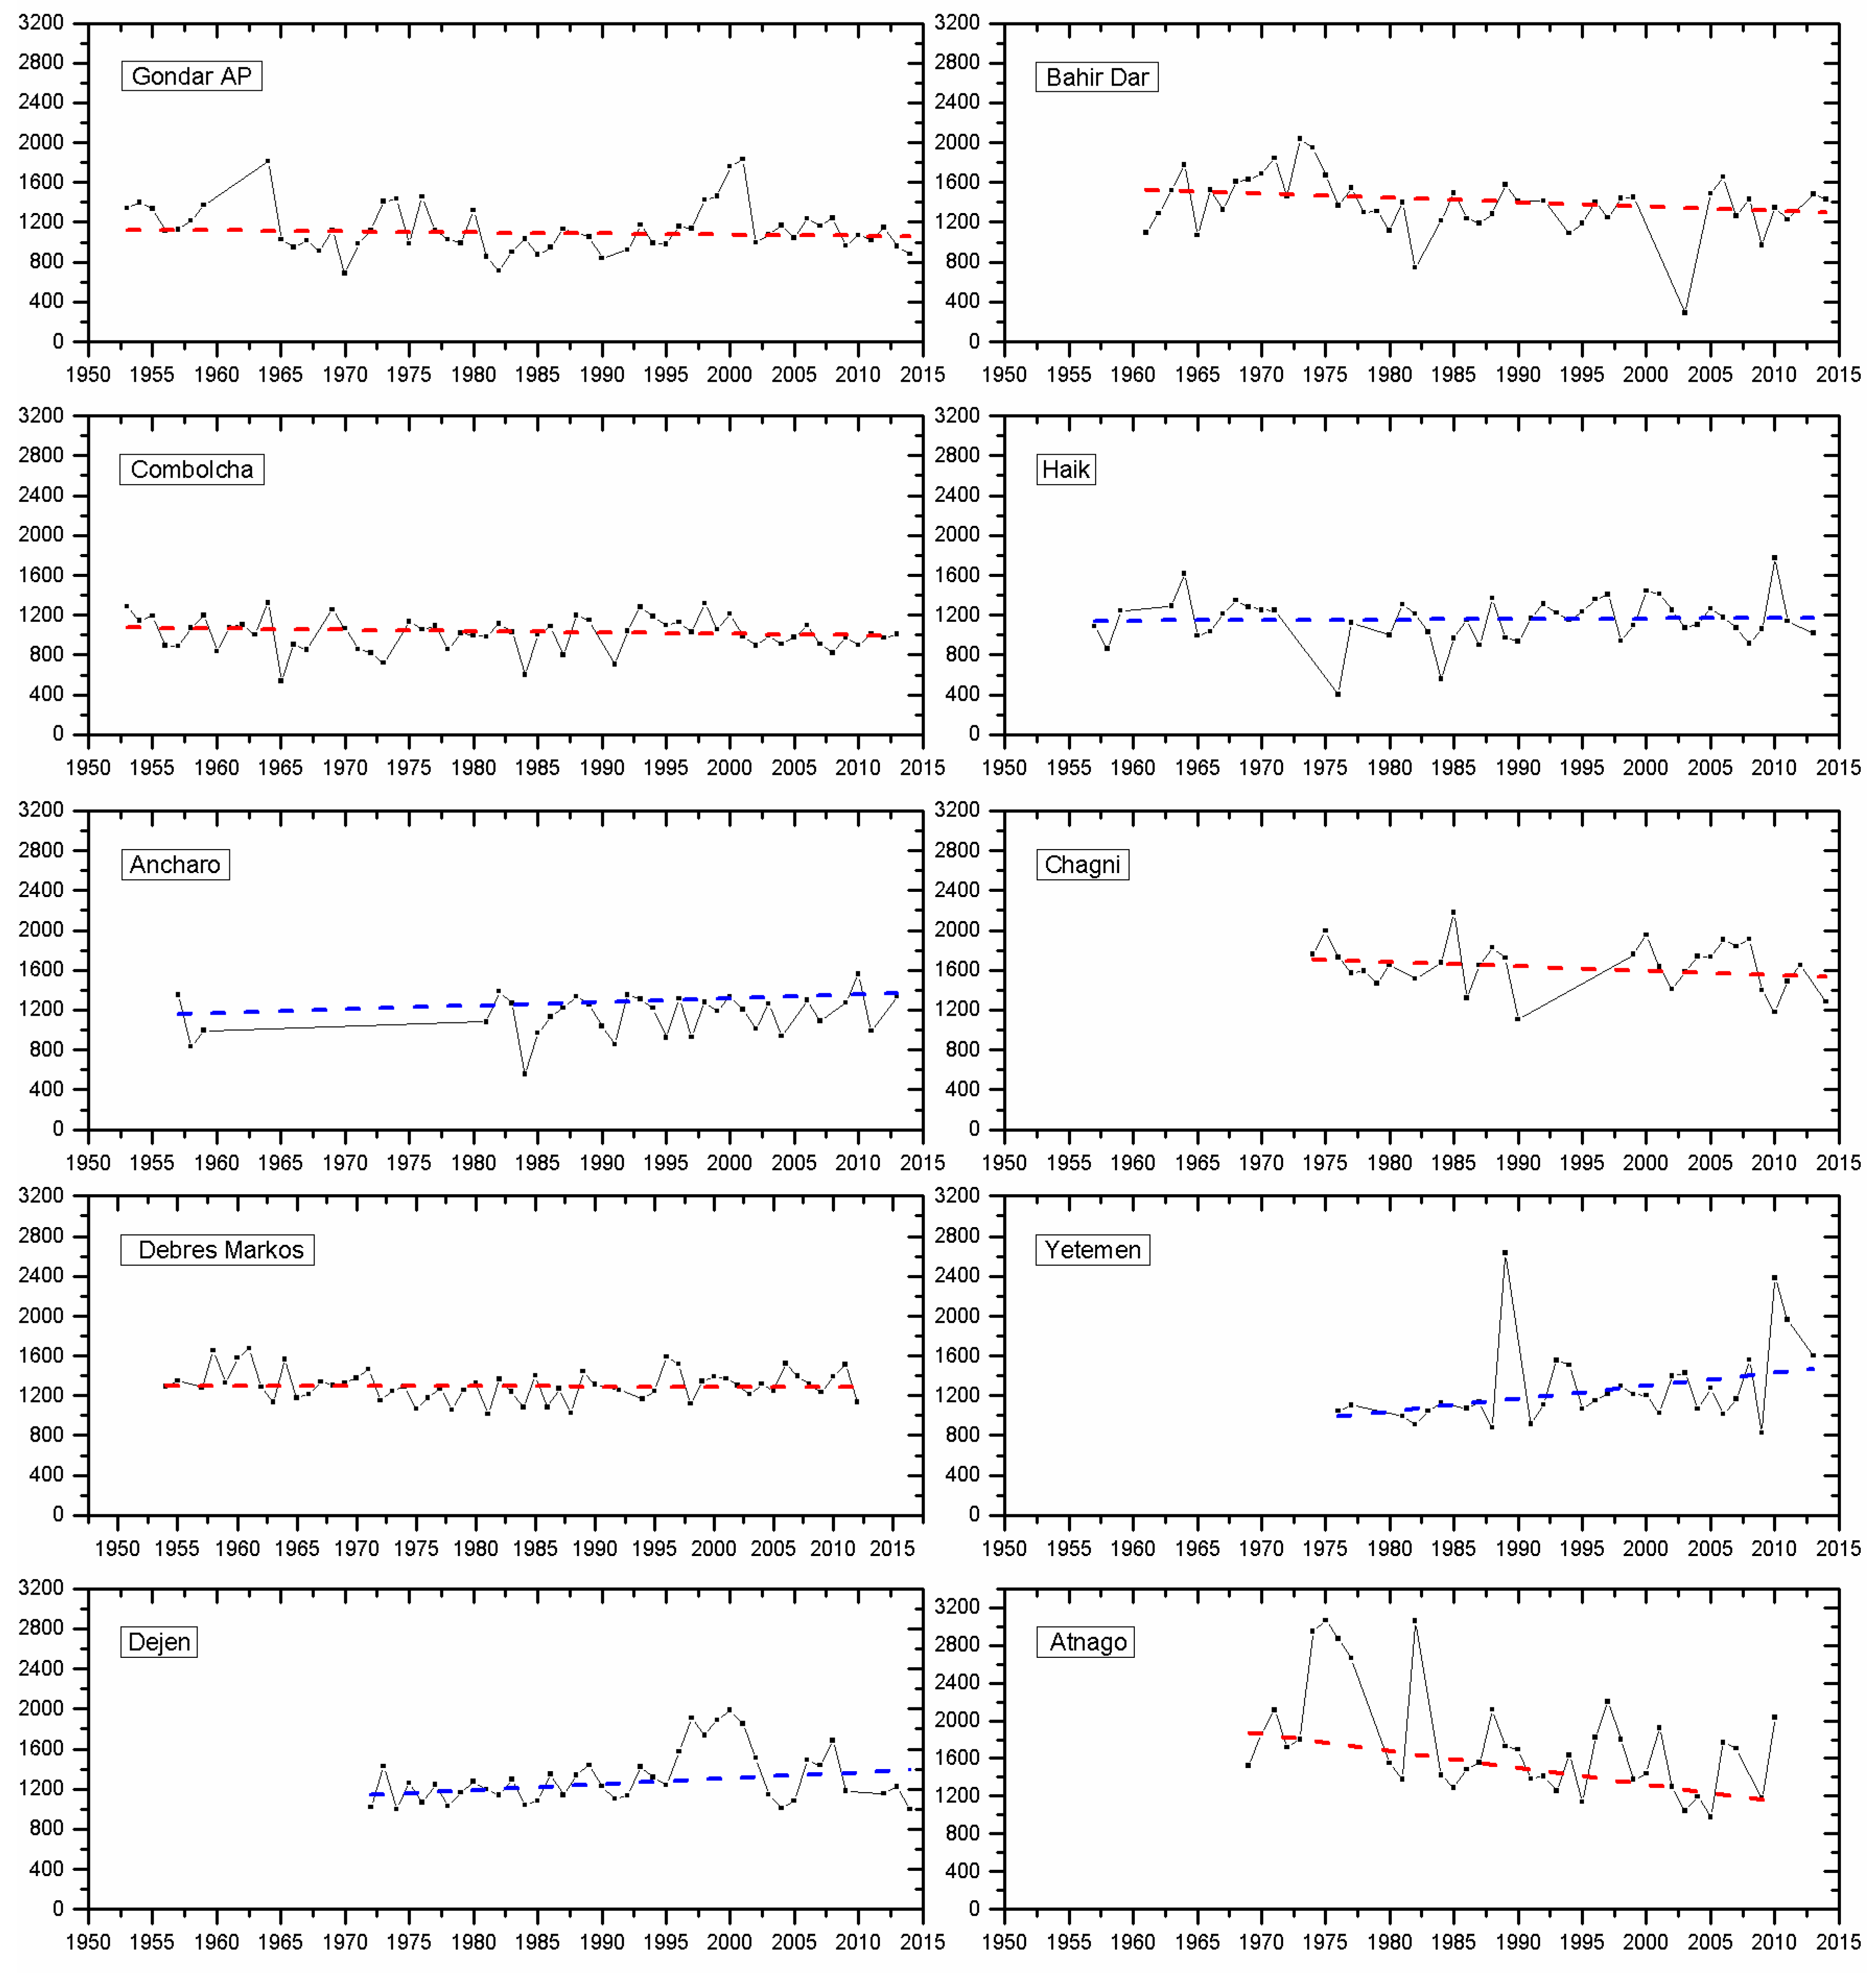
Figure 6 illustrates the total annual rainfall time series for the studied stations with the Sen’s slope trend line. For total annual rainfall time series for Yetemen and Atnago, the
p-values were smaller than the significance level, indicating the presence of a significant trend. Based on Z value, a significant increasing trend was found for Yetemen and significant decreasing trend for Atnago. For the seasonal rainfall data, stations of Haik, Ancharo, Yetemen and Dejen in the rainy season had a significant increasing trend according to Sen’s slope with MK statistic Z of 2.15, 3.02, 2.74 and 2.48 respectively. Note that Haik and Ancharo locate at the northeastern part of the UBNB, and Yetemen and Dejen are in the eastern central part of the UBNB. In contrast, for Atnago in the small rainy season (which locates in the southwestern part of the basin), the trend was significantly decreased with MK statistic Z= −2.02. Magnitudes of the increasing and decreasing trend of rainfall for total annual rainfall time series were determined to be 12.85 and −17.73 mm year
−1 for Yetemen and Atnago, respectively. In contrast, the magnitude of increase for the rainy season rainfall time series was determined to be 3.33, 12.63, 11.31 and 7.25 mm year
−1 for Haik, Ancharo, Yetemen and Dejen, respectively. For the small rainy season in Atnago, the magnitude of decrease was determined to be −4.86 mm year
−1.
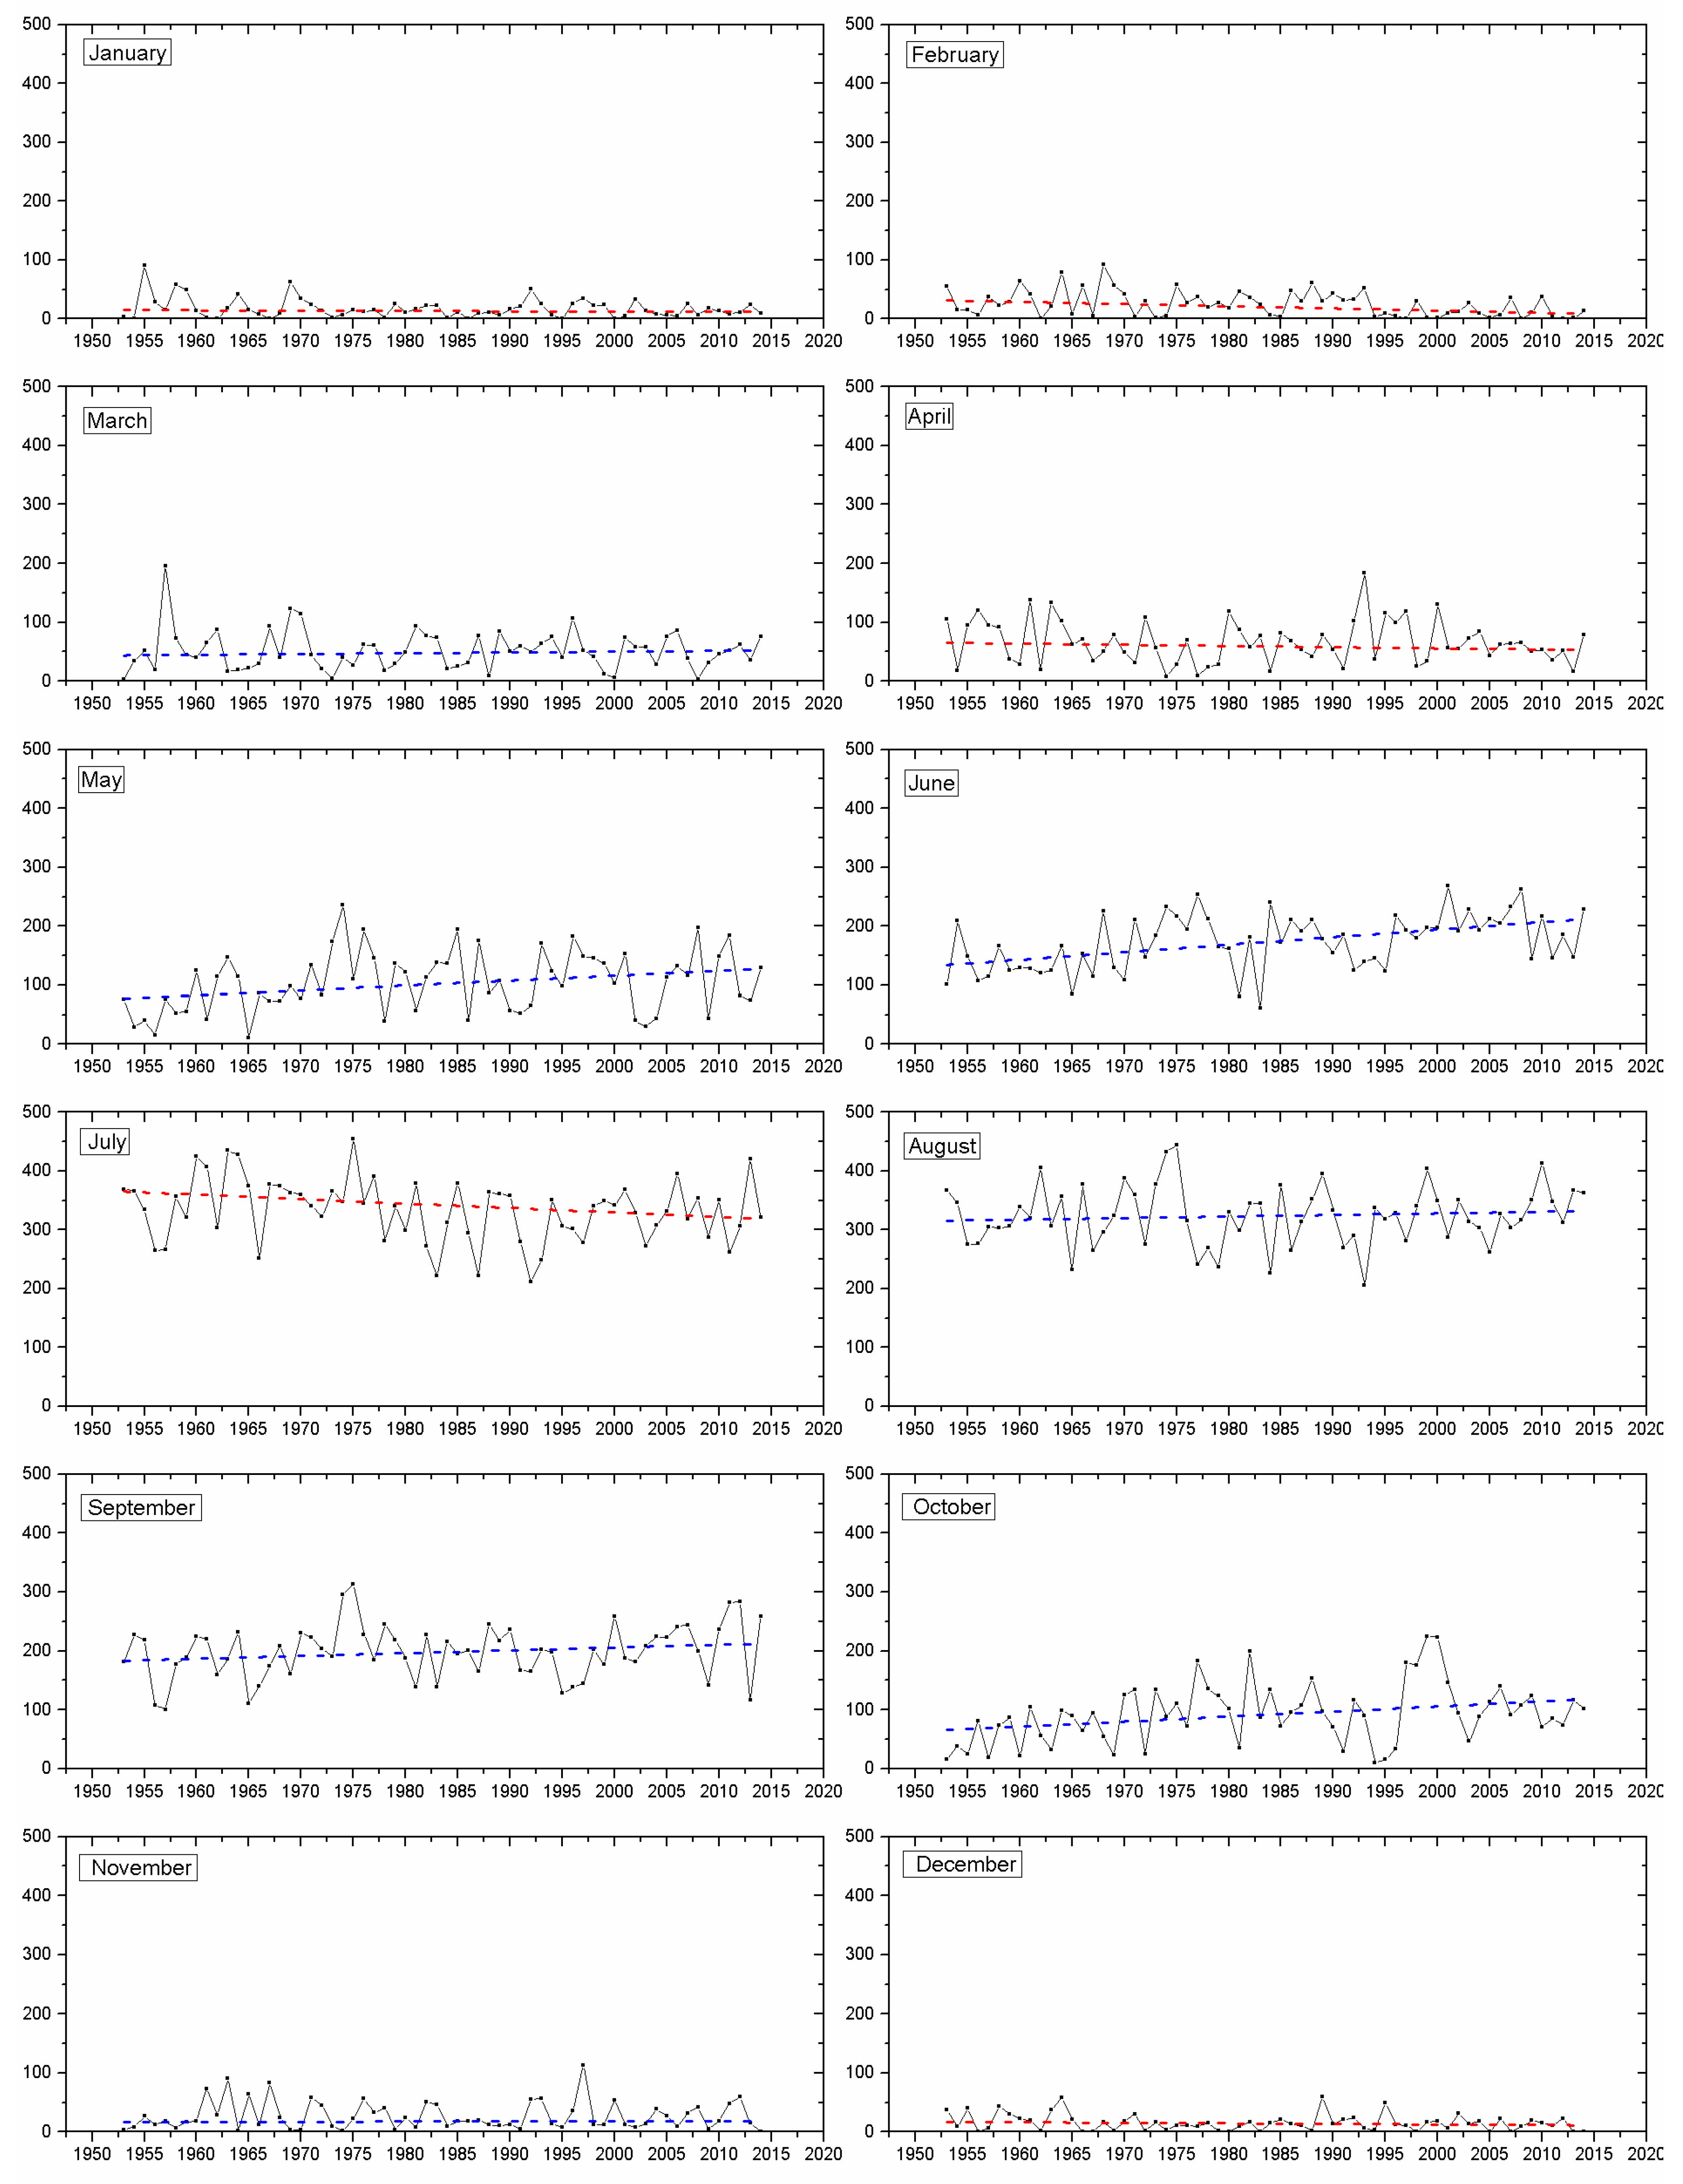
For the ten stations, an average monthly rainfall over the whole basin was calculated using Thiessen’s weighted average interpolation method. Then, MK trend analysis was applied on this averaged data to check whether the rainfall is increasing or decreasing.
Table 3 shows the results of MK trend analysis for the monthly-averaged rainfall over the whole basin and the percentage of sharing of each month of the total rainfall per year. It was found that July and August have the highest percentage of rainfall all over the year with 23.32% and 22.65%, respectively. Based on Z values, a significant increasing trend over May, June and October occurred, while a significant decreasing trend on February was evident. Generally, there was an insignificant increasing trend over March, August, September and November, and an insignificant decreasing trend over January, April, July and December.
Figure 7 illustrates the time series plot for the average rainfall over the UBNB for each month of the year covering the whole study period of 1953–2014. The figure proves that the rainfall intensity started to increase slightly in the small rainy season (March and April), and then increased higher in the rainy seasons (June, July and August). Later, it started decreasing until reaching the dry season period. Over the study period, it was noticed that the magnitude of rainfall significantly increased by 0.821, 1.279 and 0.855 mm/year for May, June and October, respectively.
3.4. Detection of Change Point for Rainfall Time Series
The Pettitt test revealed that, at 95% confidence limit, only four stations out of ten had a changing year where the mean of the rainfall changed before and after, as shown in
Table 4. The defined changing year, the mean of the rainfall before and after the changing point and the percentage of change are also listed in
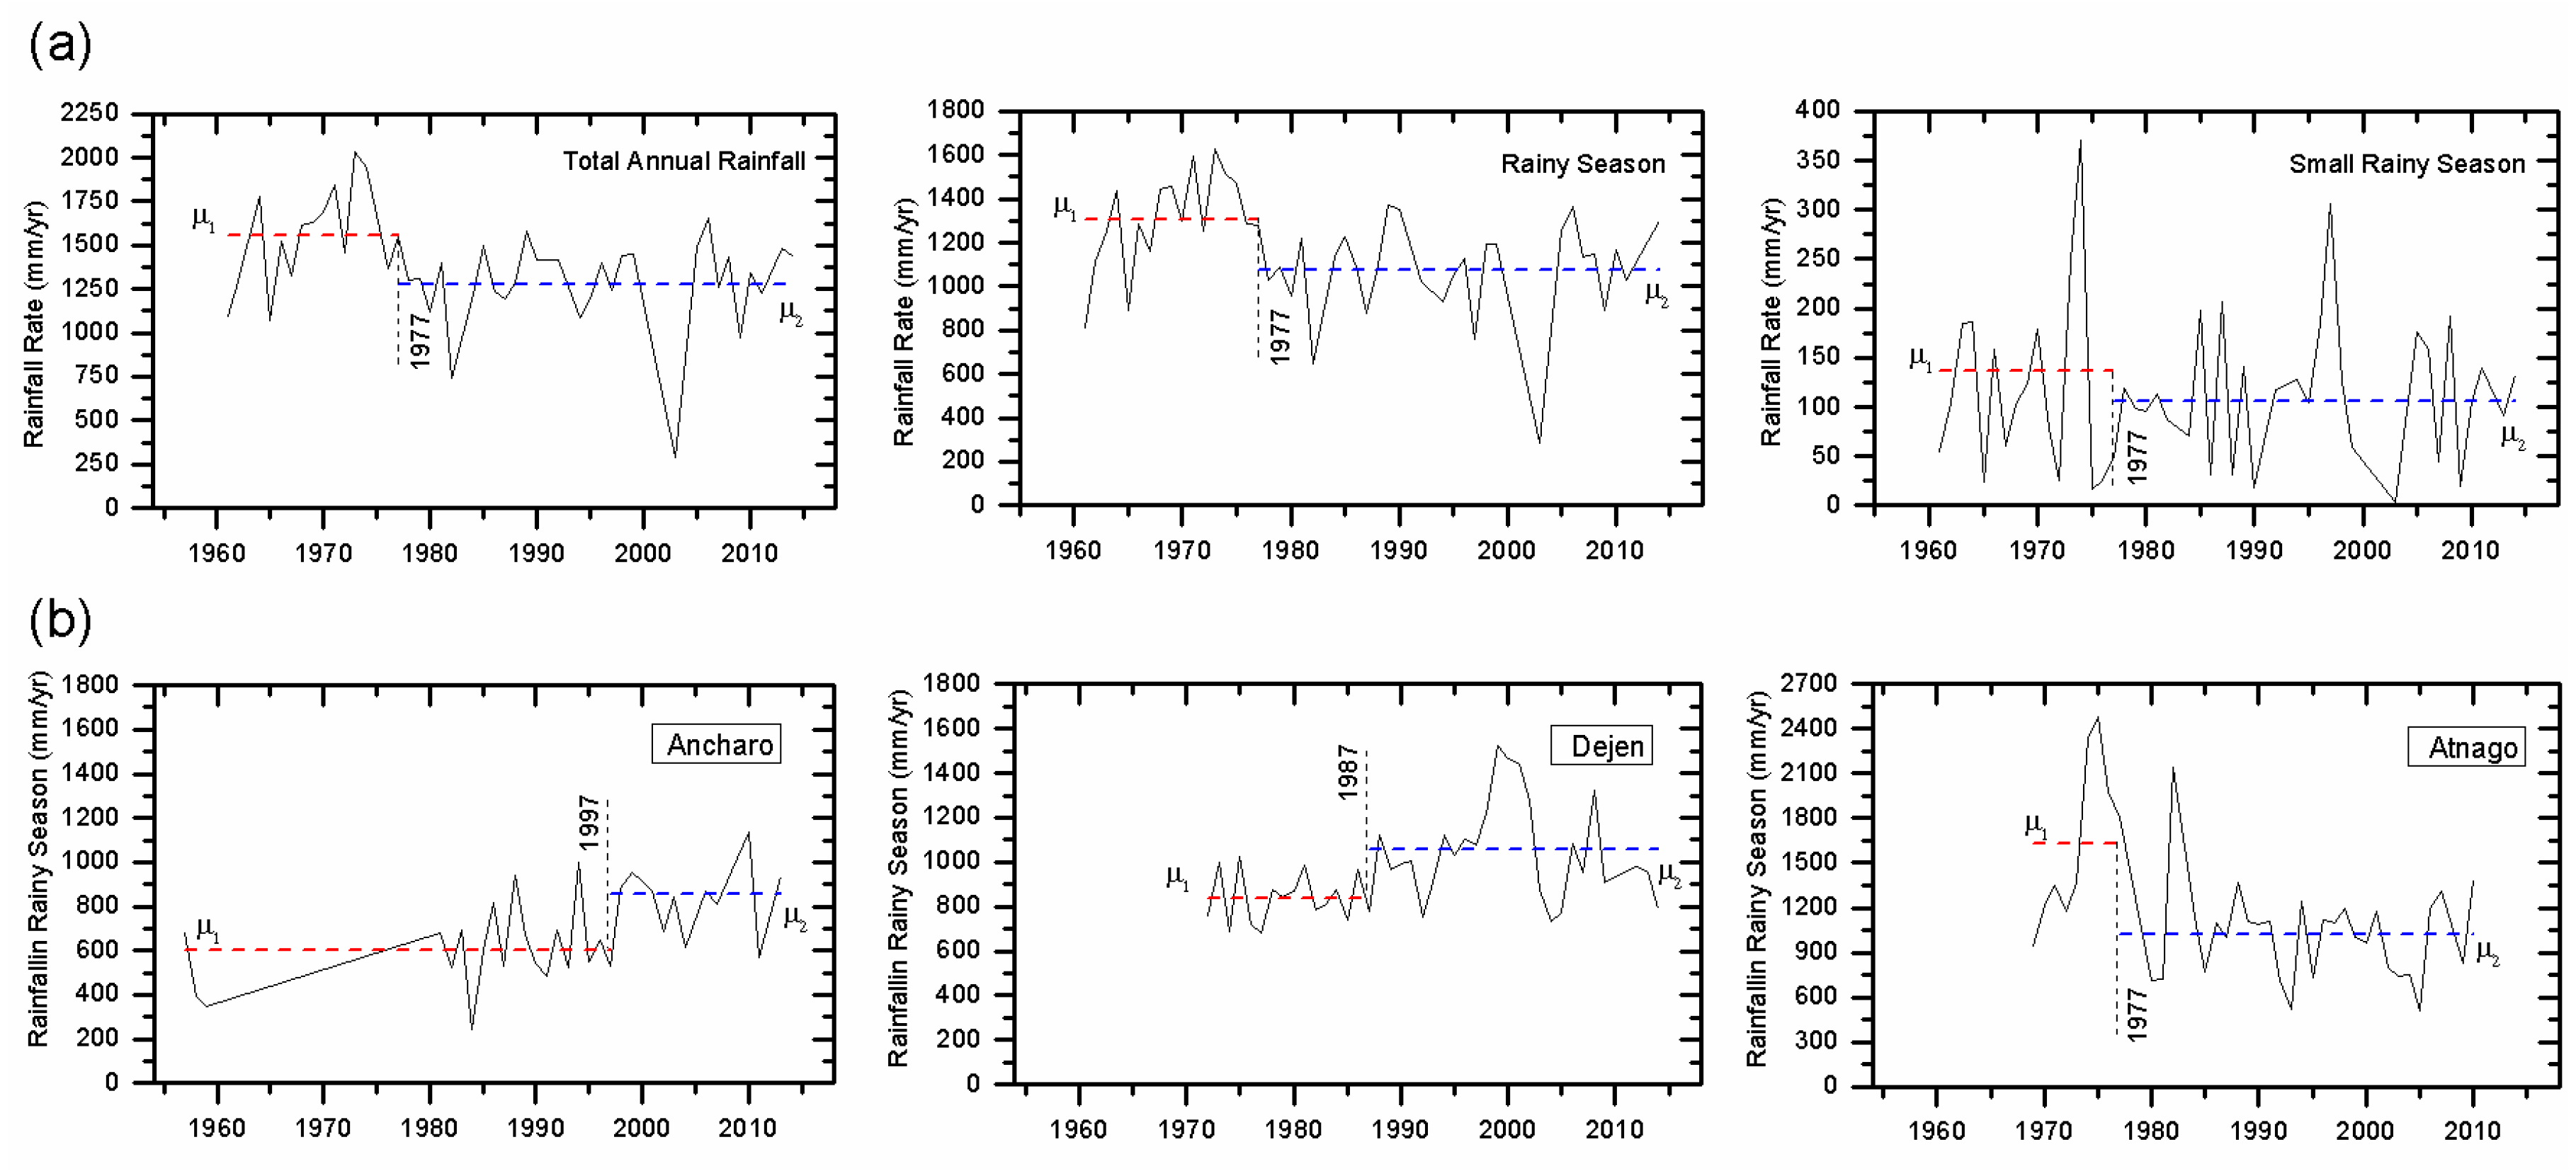
Table 4. For Bahir Dar station, located in the north at the outlet of Lake Tana, there was an abrupt decrease in the mean of the rainfall before and after 1977 for the total annual and the rainy season rainfall with about 17.6% after change point. The rainfall decreased with about 22.1% after 1974 for the small rainy season, as illustrated in
Figure 8a. This is correspondent with the climate change in this period where during the 1970s the BNB suffered from drought. Similarly, there was a decreasing shift in 1982 and 1977 for Atnago (in the southwestern part of the basin) in the total annual and the rainy season rainfall with values of 30.6% and 37.4%, respectively, as shown in
Figure 8b. In contrast, there was an increasing shift in 1987 and 1997 during the rainy season rainfall in Dejen (eastern central part of the basin) and Ancharo (northeastern part of the basin), as shown in
Figure 8b.
The results of the Mann–Kendall test and Pettitt test confirmed the change point of the trends. Those abrupt differences for changing points at each station may be related to the changes of climate on the local and global scale. One of the plausible explanations for the observed significant trend can be at least partially associated with changes in climate conditions over the basin such as the drought period that the UBNB experienced from the 1970s to the early 1980s. This notion is, indeed, consistent with our results that the abrupt changing points were detected in 1974, 1977 and 1982 at Bahir Dar and Atnago. In addition, the decreasing trend in rainfall at Atnago station, which locates in the southwestern part of the basin, was detected with this trend possibly corresponding to the warming of the South Atlantic Ocean [
18]. On the other hand, wet periods in the UBNB were reported during 1960–1970 and 1990–2000 [
36], while an increasing abrupt point occurred at Dejen and Ancharo stations in the rainy seasons of 1987 and 1997, respectively. Given that long-term trends of rainfall were detected in this study, future hydro-metrological studies in UBNB can be performed with particular attention given to the long-term trend as well as its spatiotemporal variability. Although the large variability of the rainfall trends in the UBNB is one of the factors that make it difficult to extract the long-term change of rainfall, it can be recommended to enhance the collection of long-term rainfall data and perform an appropriate data processing for the further understanding of the rainfall changes and its relationship with climate variability.
4. Conclusions
It is important to understand the distribution and trend analysis of rainfall to provide descriptive and quantitative information for the planning and management of existing water resources and agriculture. Prior studies on the UBNB suffer from several drawbacks such as scale of the study, the method of trend analysis used and not considering the inter-annual variability analysis of the rainfall. In this study, inter-annual variability analysis was carried out using coefficient of variation and precipitation concentration index; then trend analysis was done by applying the nonparametric Mann–Kendal test and Sen’s slope estimator test; and Pettit was used test to determine the changing year of the trend. The rainfall stations were chosen based on the quality of observed rain gauge data. Prior to the long-term trend analysis, the data were tested in terms of normality and auto-correlation, to determine whether they were suitable to use the Mann–Kendall trend analysis or the modified one. Data were found to not be autocorrelated, thus Mann–Kendall test was applied.
Variability analysis showed that the basin had high rainfall variability over the year and seasons. The rainy season participates with the great share of the rainfall throughout the year (almost 70%). Investigating the inter-annual variability showed that, over the northeastern part of the basin, the rainy and small rainy season were separated by a distinctly drier period from May to June until rainfall reached its maximum in August. For the rest of the basin, rainfall commenced in May with less values until June, then it increased rapidly until August. Calculating precipitation concentration index revealed that rainfall was highly concentrated with strong irregular distribution on an annual basis and in the dry season over the basin, as rainfall occurred during only one third of the examined period. It was moderate and uniformly distributed with medium and low concentration over the rainy and small rainy season, as it was equally distributed over the months of the season. Climate change appeared to be the cause of the high variability and high precipitation concentration index over the entire basin. Understanding the inter-annual variability of rainy season rainfall is a priority for agriculture decision makers.
Trend analyses were applied on the total annual rainfall of each station as well as the monthly-averaged rainfall over the entire basin. Trend analysis results indicated that there were insignificant increasing and decreasing trends in the rainfall time-series over the majority of the stations. For the annual rainfall between 1953 and 2014, five of the stations exhibited an insignificant decreasing rainfall over the tested period, while one station (Atnago in the southwestern part of the basin) had a significant decreasing rainfall trend with magnitude of 17.780 mm year−1, and another three stations had an insignificant increasing trend, while only one station (Yetemen) exhibited a significant increasing rainfall trend of 12.850 mm year−1. Rainy season exhibited an insignificant decreasing trend for five stations, and an insignificant increasing trend for one station. The other four stations, Haik, Ancharo, Yetemen and Dejen, showed a significant increasing rainfall trend of 3.330, 12.650, 11.308 and 7.250 mm year−1 respectively. For the small rainy season, all stations showed an insignificant decreasing trend except for Debres Markos station, which had an insignificant increasing trend. Overall, the trend analysis of the annual rainfall series indicated 40% increasing and 60% decreasing trends for the stations, while 20% of the stations had significant increasing and decreasing trends. The trend analysis of the rainy season series indicated 50% increasing and 50% decreasing trends for the stations, whereas 40% of the stations were found to have a statistically significant increasing trend over the northeastern and eastern central part of the basin. For the monthly-averaged rainfall over the basin, it was found that July and August had 45.97% of the total rainfall per year. The small rainy season contributed only 15.57% of the total rainfall per year.
Pettitt test was applied to detect the changing year in the rainfall time series and it varied considerably across the stations. For Bahir Dar station at the outlet, there was a decreasing of the rainfall with 17.7% after 1977, while, for the stations in the northern and eastern central parts of the basin, there was evidence of increasing rainfall with 41% and 25.9% after 1997 and 1987, respectively. Finally, for the southwestern part of the basin at Atnago, there was evidence of decreasing in rainfall of 37.4% after 1977. The trend results matched the change point results. Those results are considered important to update the current rainfall situation of the UBNB. The data and results contained herein can be used to predict future precipitation and to estimate the uncertainty in future precipitation prediction models. Future studies that connect other hydro-metrological variables (stream flow and temperature), land use, and that considered the long-term trend of rainfall and its spatiotemporal variability should be carried out for better future prediction of the UBNB rainfall characteristics.

 ,
, 


