Abstract
Recently, human and property damages have often occurred due to various reasons—such as landslides, debris flow, and other sediment-related disasters—which are also caused by regional torrential rain resulting from climate change and reckless development of mountainous areas. Debris flows mainly occur in mountainous areas near urban living communities and often cause direct damages. In general, debris flows containing soil, rock fragments, and driftwood temporarily travel down to lower parts along with a mountain torrent. However, debris flows are also often reported to stream down from the point where a slope failure or a landslide occurs in a mountain directly to its lower parts. The impact of those debris flows is one of the main factors that cause serious damage to structures. To mitigate such damage of debris flows, a quantitative assessment of the impact force is thus required. Moreover, technologies to evaluate disaster prevention facilities and structures at disaster-prone regions are needed. This study developed two models to quantitatively analyze the damages caused by debris flows on structures: Type-1 model for calculating the impact force, which reflected the flow characteristics of debris flows and the Type-2 model, which calculated the impact force based on the topographical characteristics of mountainous regions. Using RAMMS a debris flow runoff model, the impact forces assessed through Type-1 and Type-2 models were compared to check reliability. Using the assessed impact forces, the damage ratio of the structures was calculated and the amount of damage caused by debris flows on the structures was ultimately assessed. The results showed that the Type-1 model overestimated the impact force by 10% and the Type-2 model by 4% for Mt. Umyeon in Seoul, compared to the RAMMS model. In addition, the Type-1 model overestimated the impact force by 3% and Type-2 by 2% for Mt. Majeok in Chuncheon, South Korea.
1. Introduction
Landslide refers to a phenomenon wherein soil or rocks lose stability and collapse with the gravitational force caused by earthquakes or rainfall. On the other hand, debris flow is a phenomenon wherein soil, rocks, and driftwood that toppled down due to landslide or other collapses temporarily flow downstream along the valleys. In general, debris flows occur in summer after the rainy season or typhoons in South Korea [1,2,3,4].
With the recent extreme weather events across the world as well as in South Korea, damages from debris flows frequently occur due to the regional torrential rain and typhoon, which lead to significant human and property losses. Debris flows move downstream areas along the valley and, as a result, cause damage to facilities situated in those areas. As such damage is created in a wide variety of areas—from residential districts to public facilities and farmland—the socioeconomic damages that it has brought about is quite far-reaching in scope. To reduce such damage from debris flows, the Korea Forest Service, Korea Institute of Geoscience and Mineral Resources, and National Disaster Management Institute have created geographic information system-based (GIS) landslide hazard maps, which take into consideration topography and ground characteristics. In addition, the National Disaster Management Institute is actively carrying out research on steep-slope collapse alerts and evacuation standards [5,6,7,8].
In addition, a number of other studies are underway with regard to sediment-related disasters, but those studies generally focus on the creation of landslide hazard maps after selecting hazard-prone regions, devising forecast/alert systems operated when signs of risk are detected, or setting up evacuation standards [9].
To assess the vulnerability of structures prone to landslides and debris flows, the dynamic response theory was used to carry out the analysis on Mt. Umyeon in Seoul and Mt. Majeok in Chuncheon, South Korea [9]. Subsequently, using the exemplary cases of debris flow damage, the physical characteristics of debris flows and the extent of damage created on the structures were expressed into three vulnerability functions: height, velocity, and impact force of debris flows. Also, the vulnerability functions of reinforced concrete block constructions and nonconcrete constructions were assessed Kang and Kim (2014) [10]. In addition, the flow characteristics of debris flows were analyzed in accordance with the existence/nonexistence of facilities, as well as the distance from the discharge outlet, by utilizing the FLO-2D numerical analysis model. Ultimately, the formula for calculating the impact force of debris flows, which takes into account changes in impact force resulting from the facility constructions, was proposed by Kim et al. (2018) [11].
Meanwhile, in the case of other countries, various research are underway for assessing the impact force by using simulation models and evaluating the vulnerability and risk associated with structures based on past examples [12,13,14,15,16,17,18,19,20,21,22]. Aleotti et al. (2004) [23] and Hürlimann et al. (2006) [24] conducted risk assessment using a risk matrix and risk mapping.
To mitigate the human and property damages created by debris flows, a quantitative assessment of the debris flow impact force is needed. However, until now, there remains an insufficient amount of studies that take into account the influence of the structures, based on the debris-flow impact force model.
Thus, to quantitatively assess the impact force created by debris flows, this study devised a Type-1 model, which takes into account the discharge and flow depth of debris flows. It reflects the flow characteristics based on the dynamical methodology, a kinematic analysis model with an emphasis on debris flow. Alongside this is the Type-2 model, which takes into consideration the slope and length of the basin, and was developed by reflecting the characteristics of the basins in mountainous regions.
Moreover, the debris flow direction and the direction angle faced by the constructions were reflected in the impact force assessment, as the force could be offset in line with the direction to which the debris flows hit the structures. To carry out a comparative analysis on Type-1 and Type-2 models in quantitative terms, impact force was calculated by using Rapid Mass Move Simulations (RAMMS), a debris-flow runoff model, for the areas suffering from sediment-related damages at Mt. Umyeon in Seoul and Mt. Majeok in Chuncheon, South Korea. Moreover, using the assessed impact forces, the damage ratios of the structures were calculated for the reinforced concrete block constructions and nonconcrete constructions, respectively. Subsequently, the total extent of the damage was assessed by using the damage ratios and property values of the structures.
2. Study Site
In South Korea, sediment-related disasters mostly occur due to typhoons and torrential rains during summertime, which is from July to September. Accordingly, during the summer days of July in 2011, regional torrential rain led to massive debris flows at Mt. Umyeon in Seocho-gu, Seoul and at Mt. Majeok in Chuncheon, Gangwon Province, South Korea, which created huge human and property losses. The sites subject to this study include the area surrounding the Raemian Apartment where the biggest damage occurred from among the other areas near Mt. Umyeon, and the area surrounding the resort pensions and rental houses located at the lower parts of Mt. Majeok where much damage also occurred [25].
The geological feature of the study site is represented by banded biotite gneiss for Mt. Umyeon and biotite schist for Mt. Majeok. The depths of the landslides that occurred in the two research areas were approximately 1.0 to 1.5 m, which corresponded to the weathered soil or colluvium layer. It was also found that the failure surfaces mostly consists of weathered rock or soft rock layers along the boundary between the soil stratum and bedrock. This indicates that landslides occur first, followed by debris flows that travel down to the lower parts along the mountain slope.
The accumulated rainfall from 26 to 27 July 2011, received by areas near Mt. Umyeon amounted to 281 mm for Seocho-gu, 318 mm for Gangnam-gu, 348 mm for Gwanak-gu, and 358 mm for Namhyeon throughout nine hours in Seoul. In the case of Chuncheon, the amount was 261 mm for Soyanggyo, 2257 mm for Chichon Elementary School, and 306 mm for Cheonjeon-ri. This is considered the result of accumulated rainfall with an hourly maximum of 40 mm or more. In addition, although the field study did not report the damage of Raemian Apt., a structure in Mt. Umyeon, as “collapsed” or “fully destroyed”, the study classified this uninhabitable structure “completely damaged”. The resort pensions and rental houses, as well as damaged structures, in Mt. Majeok were also classified “completely damaged” because they lost their original functions by 80% or more.
This study created a 5 m × 5 m grid Digital Elevation Model (DEM) by using 1:5000 numerical maps of the Mt. Umyeon and Mt. Majeok regions, while creating land use maps and soil maps in the same sizes and applying them in the Spatial Runoff Assessment Tool (S-RAT) [26,27,28] and RAMMS models [29]. Figure 1 shows the accumulated rainfall in Mt. Umyeon and Mt. Majeok regions, while Figure 2 contains photos of the study sites and the damage created at the sites.
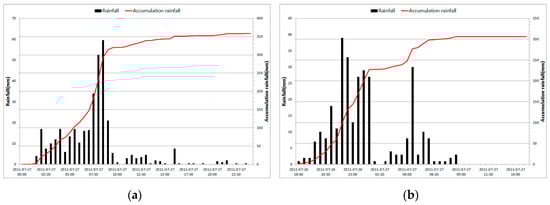
Figure 1.
Accumulated rainfall at study sites in South Korea. (a) Accumulated Rainfall at Mt. Umyeon (Seoul). (b) Accumulated Rainfall at Mt. Majeok (Chuncheon).
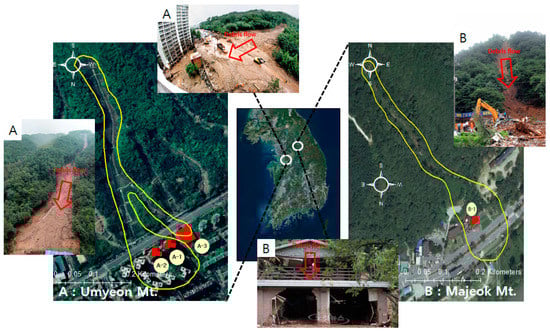
Figure 2.
Photos of damages and damaged structure at the study sites in South Korea: (A) shows damages from debris flows into the Raemian Apt. located in the lower part of Mt. Umyeon in Seoul and (B) shows the damages from debris flows on the resort pensions and rental houses at the lower part of Mt. Majeok in Chuncheon, Gangwon Province.
3. Methods
The analysis flowchart is presented in Figure 3. Rainfall data, which was the actual cause of the debris flows in 2011, was applied to the S-RAT model, and the peak flow discharge and total flow discharge were calculated to be used as the input data for the RAMMS [29]. Sediment amount, an additional input data for the RAMMS model, was assessed based on the sediment calculation formula presented by the Ministry of Land, Infrastructure, Transport, and Tourism of Japan [30], and the 0.4 value derived from the experiment results were used as the sediment concentration level. Regarding the formula, Tak (2015) [31] and Nam et al. (2016) [32] calculated the sediment volumes of the Gangwon and Gyeonggi Province areas by using it and applied the calculation result to the RAMMS. The studies conducted a comparative analysis to validate the result and showed that the debris flow damage extent produced by RAMMS is nearly matched with the actual one. With the application of the RAMMS model, the damaged area, debris flow depth, velocity, and impact force were calculated. Using the assessed sediment amount and concentration level, as well as the debris flow depth, velocity, and direction angle, the impact force was assessed using the Type-1 model by reflecting such flow characteristics. In addition, by utilizing the sediment concentration, slope, wetted perimeter, and direction angle, the impact force was computed using the Type-2 model by reflecting such characteristics of mountain basins.
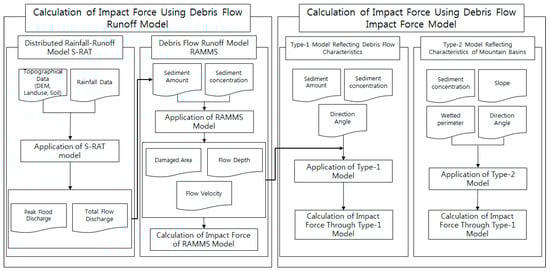
Figure 3.
Analysis flowchart on the impact force assessment using the RAMMS and Type-1 and Type-2 models.
Furthermore, with the use of the impact forces calculated in the RAMMS model and Type-1 and Type-2 models, the methodology for computing the damage ratio and damage function of concrete and nonconcrete construction structures presented by Kang and Kim (2014) [10] was applied to assess the damage ratios of the structures affected by the impact force of debris flows. Additionally, based on the property value of the structures, the total amount of damage on the structures due to the debris flows was calculated.
3.1. Distributed Rainfall-Runoff Model: S-RAT
The S-RAT model is a distributed rainfall-runoff model developed by Kim et al. (2010) [26], and the model expresses the subject area into grids of consistent sizes. The conceptual water balance per time interval is calculated for each grid so as to simulate the spatial/temporal changes in the flow discharge of the basin area. Moreover, while most of the distribution-type hydrological models rely on GIS-related commercial packages, such as ArcGIS or IDRISI, to extract the topographical parameters; S-RAT autonomously extracts the parameters. As such, its input data are more simplified. Formula (1) below is an equation for estimating the water balance in each grid.
Here, F is the infiltration capacity (mm/h) of the infiltration detention facility, P is the surface flow amount, E is evapotranspiration, and H is the parameter, a constant value.
3.2. Two-Dimensional Debris Flow Numerical Model: RAMMS
The RAMMS model was developed by the WSL team at the Swiss Federal Institute for Snow and Avalanche Research (SFL). This model allows one to analyze the three modules of debris flow, rock fall, and avalanches through dynamic modeling in DEM [26]. The basic equation of this model is based on the Voellmy–Salm approach and can be expressed as Formula (2).
Here, S is the frictional force (N), C is the cohesiveness on fluid substances, is the dry Coulomb-type friction coefficient, g is the acceleration of gravity, is density (kg/m3), U is flow velocity (m3/s), and N is the normal stress on the slip surface (MPa).
In the above, is impact force (kPa) while is the drag coefficient, is density (kg/m3), and U is velocity (m/s).
3.3. Calculating the Direction Angle of Constructions Considering the Debris Flow Direction
When assessing the impact force, this study took into account the direction of the debris flow and the direction angle (sinβ) faced by the constructions as the force could be offset by the direction to which the debris flows hit the constructions. Figure 4 is a concept map for assessing the direction angle of the structure, with the direction of debris flow taken into consideration. If the direction of debris flow and the structure surface form a right angle (sinβ = 90°), as in the figure below, the structure receives all the impact force of the debris flow (Figure 5).
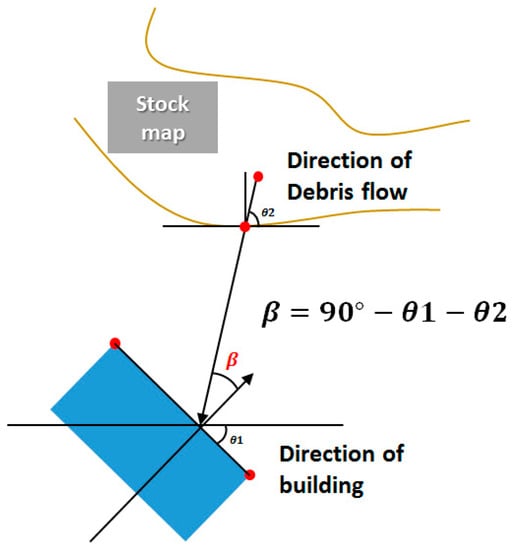
Figure 4.
Concept map for calculating the direction angle of structure considering the debris flow direction.
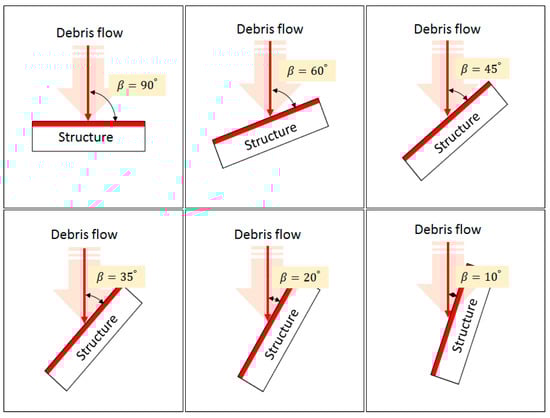
Figure 5.
Direction angle (β) of the structure surface by the debris flow.
3.4. Development of Assessment Model for the Impact Force of Debris Flow
Type-1 and Type-2 models were used to calculate the impact forces of debris flow by applying variables (velocity, flow depth, runoff, etc.) and direction angles related to debris flow motions [11]. When calculating impact forces, Type-1 reflected the flow characteristics of the debris flow to produce the result based on the relation between the flow depth and runoff, while Type-2 used the Manning formula considering that debris flow mobility is more often observed in the form of an open channel. As a result, the impact forces of debris flow calculated with Type-1 and Type-2 models that the study suggests are capable of reflecting the direction angles of debris flow mobility to allow the comparison of calculated results with the actual resistance forces of structures impacted by debris flows. Therefore, they can be used to analyze to what extent structures are damaged by debris flows.
3.4.1. Impact Force Calculation Model Reflecting the Characteristics of Debris Flow (Type-1)
Referred to as Type-1 in this study, this model reinterpreted density and flow velocity based on the dynamical model to assess the impact force of debris flow. To calculate the flow velocity by taking into account the discharge (Q) and flow depth (H), the discharge (Q) of debris flow can be expressed in the formula below, which assumes that the length of debris flow movement is the unit width.
In the above formula, Q is discharge (m3/s), A is cross-section area (m2), and V is velocity (m/s). Using Formula (4), the flow velocity of debris flow can be calculated as
Here, the cross-section (A) of debris flow can be expressed with peak flow depth (hmax) and width (w):
Here, w is width (m2), hmax is the peak flow depth (m), and Qmax is the peak discharge (m3/s). By using Formula (6), the impact force can be calculated, as below, by taking into account the discharge (Q) and the flow depth (H).
In the above formula, C is the concentration level of sediments and is the density of water (kg/m3). In addition, sinβ is the direction angle formed by the direction of the debris flow and the wall of the structure. According to existing studies, including Hübl et al. (2009) [33] and Moriguchi et al. (2009) [34], the impact force of debris flow was in the range of 5 to 250 kN/m2, and the distributional range of the density of debris sediments (δ) was found to be 2000–2200 kg/m3 in preceding research [35,36].
3.4.2. Impact Force Calculation Model Reflecting Topographical Characteristics (Type-2)
Referred to as Type-2 in this study, this is an impact-force calculation model that takes into account the topographical characteristics of mountainous regions based on the dynamical model as in Type-1.
In the above, k is the empirical coefficient, V is velocity (m/s), and ρ is density (kg/m3). Density is a unique value, which is calculated by dividing the mass of a substance to its volume. For assessing debris flow density, air mass was excluded while the densities of soil and water were used. Accordingly, it was reinterpreted as below, in line with the concentration level of debris flow.
In the above, δ is the density (kg/m3) of debris flow, Cv is the concentration level of sediments, and ρw is the density (kg/m3) of water.
While there are various types of formula for calculating the velocity (V) of debris flow, the Manning formula was used to reinterpret the flow velocity in this study. The Manning formula, which is similar to the Chézy formula, is a useful and practical average flow-velocity assessment tool for rivers or waterways [37].
In the equation above, n is the coefficient of roughness, R is wetted perimeter (m), I is a hydraulic gradient, and α is a modification factor with a range of 0.4 to 0.5 by Kim et al. (2018) [11].
4. Results
4.1. Assessment on the Impact Force of Debris Flow
4.1.1. Flood Flow Simulation
To assess the amount of sediments and peak flood discharge, the input data of the debris flow runoff model, the actual rainfall record of when debris flow that occurred at Mt. Umyeon on 27 July 2011, and Mt. Majeok on 26 July 2011, was applied to the distributed S-RAT. To calculate the discharge that triggers debris flow rather than the discharge of the basin, this study assessed the total discharge (m3/s) and the peak discharge (m3/s) of the area where the debris flow occurred (Figure 6).
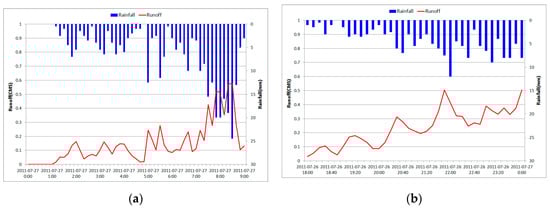
Figure 6.
Flood Runoff Simulation using the S-RAT Model. (a) Flood Runoff Simulation of Mt. Umyeon (Seoul). (b) Flood Runoff Simulation of Mt. Majeok (Chuncheon).
4.1.2. Calculation of Input Variable in RAMMS Model
In the debris flow simulation, the input variable has a significant influence on the result of the model. Therefore, setting an appropriate input variable is critical for the analysis of the movement and influence range. The input variables for the RAMMS model include sediment density, sediment volume, peak discharge, velocity, viscous friction coefficient, and turbulent friction coefficient. In this paper, the method proposed by the Ministry of Land, Infrastructure, Transport, and Tourism of Japan [30] was used to estimate sediment volume [31,32] and sediment density [35,36]. The results of previous assessments were used for the total flow discharge. As for the sediment concentration level, Jang et al. (2011) [38] presented a debris flow experiment result with a runoff sediment volume concentration range of 0.38 to 0.42. As mud flow, which is the most similar to debris flow, shows fluid characteristics that most closely resemble those of debris flow when it has a sediment concentration level of 0.40 to 0.45 [39]. The sediment concentration used in this study was 0.40, which was the average value in Jang et al. (2011) [38], falling in the range of sediment concentrations for mud flow. Table 1 shows the variables used in the RAMMS model based on the Net Success Index (NSI) to compute the optimal parameter [32].

Table 1.
Input variables of the RAMMS model.
4.1.3. Calculation of Input Variable for Impact Force Model
The input data computed above was applied in the RAMMS model to assess the flow depth, which is the input data for the impact force model. As shown in Figure 2, the flow depths for each structure at Mt. Umyeon were found to be 1.67 m for A-1, 1.59 m for A-2, and 1.99 m for A-3 while that of structure B-1 at Mt. Majeok was 0.36 m. Moreover, for the additional input data from the Type-1 and Type-2 models, sediment density, water density, and sediment concentration level calculated in the previous procedures were used. The width of the stream was assessed by computing the average width of the basin. In the case of direction angle, the direction angle formed by the debris flow direction and the wall of the structure was calculated by using the GIS, which came down to 31° for A-1, 65.7° for A-2, 5.3° for A-3, 53° for A-4, and 14.8° for B-1. Meanwhile, in the case of the modification coefficient α for the Type-2 model, the value of 0.4 was used as proposed by Kim et al. (2018) [11].
4.1.4. Calculation of the Structure Direction Angle
An angle of a structure to face the travel direction of the debris flow was calculated for each of the structures at Mt. Umyeon in Seoul and Mt. Majeok in Chuncheon, as shown in Figure 7. As a result, the structure direction angle was calculated as 31°, 65.7°, and 53° for A-1, A-2, and A-3 structures, respectively, in the damaged area at Mt. Umyeon, reflecting the travel direction of debris flow down to the lower part of the mountain. The structure direction angle was calculated as 14.8° for B-1 of Mt. Majeok.
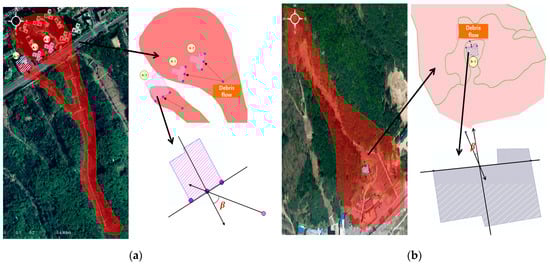
Figure 7.
Calculation of the structure direction angle (β) reflecting travel direction of debris flows in the study site. (a) Structure direction angle of Mt. Umyeon in Seoul and (b) structure direction angle of Mt. Majeok in Chuncheon.
4.1.5. Impact Force Assessment
Impact force was calculated through the Type-1 model, which reflects the flow characteristics of debris flow the Type-2 model, which takes into account the topographical characteristics and the RAMMS model. The results are shown in Table 2. When comparing the data based on the assessment results of the RAMMS model, it was found that the impact force was overestimated in the Type-1 model. Perhaps, this is mainly due to the fact that the flow discharge of the input data showed a bigger value than the cross-section area where the debris flow damage occurred. Furthermore, it was found that the changes in impact force differ greatly according to the differences in the direction angle (sinβ) formed between the debris flow direction and the wall of the structure. The results in the Type-2 model showed little difference with those of the RAMMS model. Table 2 below shows the impact force and the damage status, while Figure 8 compares the impact force assessment results of each calculation method.
Table 2.
Calculation of impact force on structures damaged by debris flow.
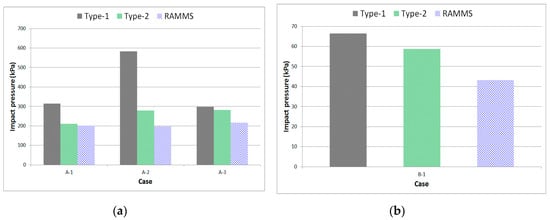
Figure 8.
Calculation of impact force on each structure. (a) Impact force at Mt. Umyeon (Seoul) and (b) impact force at Mt. Majeok (Chuncheon).
4.2. Assessment of Losses in Structures Damaged by Debris Flow
4.2.1. Calculation of Damage Ratio using the Structure Damage Index
To assess the damage ratio of the structures impaired by the impact force of debris flow, this study used the structure damage index formula proposed by Kang and Kim (2014) [10]. As for the structural material of the study sites, four structures of the Raemian Apartment near Mt. Umyeon in Seoul were concrete structures while one structure near Mt. Majeok in Chuncheon was a masonry structures categorized as a nonconcrete structure. Accordingly, the damage ratios of a total of five structures were calculated. The damages on the structures are expressed in values ranging from 0 to 1 in line with the extent of damage, and the values are categorized into four stages: Slight (0.1–0.3), Moderate (0.3–0.6), Extensive (0.6–0.8), and Complete (0.8–1.0) [10]. Below are the formulas for calculating the damage ratios of concrete and nonconcrete structures based on impact forces.
The results of the damage ratio calculation in the Type-1 model showed that the damage ratio of A-1 was 96% (Complete), A-2 was 95% (Complete), A-3 was 95% (Complete), and B-1 was 100% (Complete). Using the impact force in the RAMMS model, the damage ratio turned out to be 89% (Complete) for A-1, 88% (Complete) for A-2, 90% (Complete) for A-3, and 97% (Complete) for B-1 (Figure 9). The results of the field research conducted at the actual sites of Mt. Umyeon in Seoul and Mt. Majeok in Chuncheon showed that A-1 and A-2 suffered severe damage, while A-3 and B-1 were completely destroyed. Comparing the damage ratios in the RAMMS and Type-1 and Type-2 models, it was found that the impact force assessed in Type 1 was overestimated compared to the damage ratio calculated in the RAMMS model. In the case of the Type-2 model, its impact force was on a similar level with the damage ratio shown in the RAMMS model. This means that the application of the Type-2 model would be more appropriate than the Type-1 model (Figure 10).
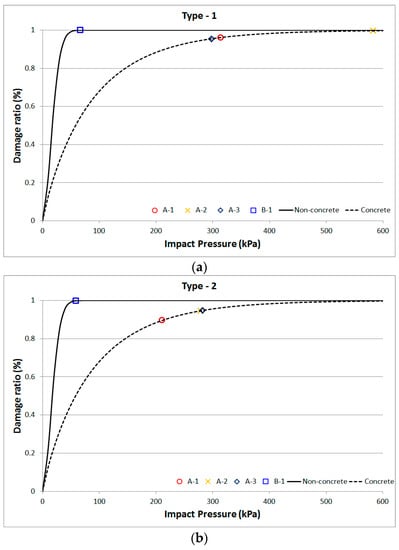
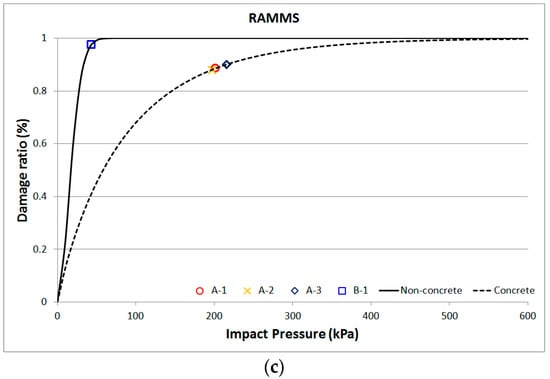
Figure 9.
Damage ratio calculation using the damage curve. (a) Damage ratio calculation of each structure using the impact force assessment in the Type-1 model, (b) Damage ratio calculation of each structure using the impact force assessment in the Type-2 model, and (c) damage ratio calculation of each structure using the impact force assessment in the RAMMS model.
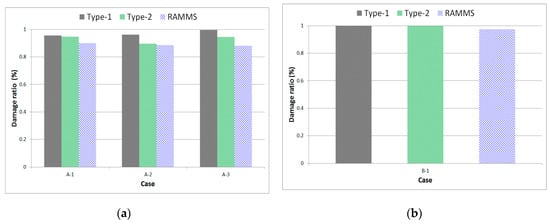
Figure 10.
Damage ratio calculation of each structure. (a) Damage ratio of Mt. Umyeon (Seoul) and (b) damage ratio of Mt. Majeok (Chuncheon).
4.2.2. Damage Calculation using the Damage Ratio of Structures
To assess the actual extent of the damage on a structure, the property value of the damaged structure is required. The 2016 Construction Price Index Table of the Korea Appraisal Board [40], which enabled a detailed calculation of the construction price based on actual design drawing and detailed construction statements, was used to appraise the property value of the structures. Furthermore, by utilizing the damage ratios and property values, the extent of damage on the structures caused by debris flows was assessed. Formula (14) is used for evaluating the property value of the structures, while Formula (15) calculates the extent of the damage.
In the above, the value for having basements is 1, while the value for not having basements is 0.
Table 3 and Figure 11 show the sum of the debris flow damage by region. It demonstrates that in the case of Mt. Umyeon in Seoul, the extent of debris flow damage was overestimated by 10% in the Type-1 model and by 4% in the Type-2 model, compared to the result in the RAMMS model. In the case of Mt. Majeok in Chuncheon, the Type-1 model overestimated the extent of the damage by 3% and the Type-2 model by 2%.
Table 3.
Damage extent calculation using the damage ratios of structures.
Figure 11.
Assessment of debris flow damage by cases. (a) Debris flow damage at Mt. Umyeon (Seoul) and (b) debris flow damage at Mt. Majeok (Chuncheon).
5. Conclusions
This study devised a Type-1 model, which reflects the flow characteristics of the debris flows based on the impact force that directly affects the structures, and the Type-2 model for calculating the impact force, which takes into account the characteristics of mountain basins. Moreover, to assess the reliability of the models, impact forces were calculated using the Type-1 and Type-2 models for the regions that were actually damaged by debris flows in 2011 the areas surrounding the Raemian Apartment near Mt. Umyeon in Seoul as well as areas where resort pensions and rental houses are located near Mt. Majeok in Chuncheon, South Korea. After comparing the assessment results with the impact force calculated using the RAMMS model, the damage ratio for each construction material was computed, and the extent of the damage on the structures due to the debris flows was ultimately assessed.
In order to analysis of impact force of debris flow in research areas, the input variables of the impact force models were acquired by using topographic data and the flow depth assessment of the RAMMS model. As the force can be offset by the direction to which the debris flow hits the structure, the debris flow direction and the direction angle faced by the structure were calculated using the GIS.
The assessment results of the impact force of debris flows and the damage ratio of structures showed that the Type-1 model overestimated the impact force compared to the results of the RAMMS model. The difference was mainly due to the higher flow discharge value compared with the cross-section value of the area damaged by the debris flow. Moreover, the topographical variables also seem to have played a major role.
The impact force calculated by the Type-2 model showed little difference with the results in the RAMMS model. The damage ratios for four structures in total three concrete structures (A-1, A-2, and A-3) and one nonconcrete structure (B-1) were all assessed to be in the state of complete damage in both Type-1 and Type-2 models. Looking into the actual damage status of the structures, it was found that both the concrete and nonconcrete structures were completely damaged.
Assessment of property value of the structures is an important factor in estimating the amount of structure damage caused by the debris flow disaster. In addition, the amount of structure damage will vary greatly depending on the type of materials constituting the structures. Therefore, the property values of the structures were reevaluated for the concrete and the nonconcrete structures, which are the damage structures in the study area, considering the materials of the structures. Also the amount of structure damage was estimated.
Further studies are underway with regard to the Type-1 and Type-2 models. Using the results of this research, the impact force of debris flow may be quantitatively assessed and used for urban planning and disaster prevention measures, which is expected to mitigate the damages caused by debris flows. In particular, the extent of the damage on the structures was calculated by assessing their property values using the 2016 Construction Price Index Table [40] as well as the structure area, construction price, and number of basements of the structures. Then, their damage ratios were subsequently applied to the values.
Author Contributions
D.H.N. and D.H.K. carried out the survey of previous study and wrote the graph of the data. B.S.K. and M.-I.K. suggested the idea of study and contributed to the writing of the paper. In addition, we contributed to conducting a reanalysis of the research data responding to the reviewers’ results and providing a clear research result with a solid academic basis that coincides with the research purposes.
Funding
This work is supported by the Korea Agency for Infrastructure Technology Advancement (KAIA) grant funded by the Ministry of Land, Infrastructure, and Transport (Grant 18AWMP-B083066-05). Also, this paper work (or document) was financially supported by Ministry of the Interior and Safety as “Human resource development Project in Disaster management”.
Conflicts of Interest
The authors declare no conflicts of interest.
References
- Development of Forecasting Method of Debris Flow Generation Characteristics and Damage Scale; Research Report; Korea Forest Research Institute: Seoul, Korea, 2009; pp. 1–230. (In Korean)
- Kim, S.; Paik, J.; Kim, S.K. Run-out Modeling of Debris Flows in Mt. Umyeon using FLO-2D. J. Korean Soc. Civ. Eng. 2013, 33, 965–974, (In Korean with English Abstract). [Google Scholar] [CrossRef]
- Ko, S.M.; Lee, S.W.; Yune, C.-Y.; Kim, G. Topographic Analysis of Landslides in Umyeonsan. J. Korean Soc. Surv. Geod. Photogramm. Cartogr. 2014, 32, 55–62, (In Korean with English Abstract). [Google Scholar] [CrossRef]
- Pradhan, A.M.S.; Kim, Y.T. Spatial data analysis and application of evidential belief functions to shallow landslide susceptibility mapping at Mt. Umyeon, Seoul, Korea. Bull. Eng. Geol. Environ. 2017, 76, 1263–1279. [Google Scholar] [CrossRef]
- Study on the Monitoring and Detection of Slope Failure (I): Field Investigation and Case Studies; Research Report; National Institute of Disaster Safety: Seoul, Korea, 2004; pp. 18–145. (In Korean)
- Criteria for Grading Hazardous Landslides and Basic Data for Grading; Research Report; Korea Forest Service: Daejeon, Korea, 2006; p. 1. (In Korean)
- Development of Landslide Prediction Technology and Damage Mitigation Countermeasures; Research Report; Korea Institute of Geoscience and Mineral Resources: Daejeon, Korea, 2009; pp. 1–595. (In Korean)
- Establishment of Failure Warning and Evacuation Criteria for Steep Slopes: GIS-Based Warning System for Steep Slope; Research Report; National Disaster Management Research Institute: Ulsan, Korea, 2011; pp. 18–175. (In Korean)
- Choi, W.I.; Lee, S.G.; Lee, B.K.; Jang, S.J. A Study of Vulnerability of Structure by Debris Flow. J. Korea Soc. Civ. Eng. 2012, 12, 141–146, (In Korean with English Abstract). [Google Scholar] [CrossRef]
- Kang, H.S.; Kim, Y.T. Physical Vulnerability Function of Buildings Impacted by Debris Flow. J. Korea Soc. Civ. Eng. 2014, 14, 133–143, (In Korean with English Abstract). [Google Scholar] [CrossRef]
- Kim, M.I.; Kwak, J.H.; Kim, B.S. Assessment of Dynamic Impact Force of Debris Flow in Mountain Torrent Based on Characteristics of Debris Flow. Environ. Earth Sci. 2018, 77, 538. [Google Scholar] [CrossRef]
- Haugen, E.D.; Kaynia, A.M. Vulnerability of Structures Impacted by Debris Flow. Landslides Eng. Slopes 2008, 381–387. [Google Scholar] [CrossRef]
- Marco, U.; Farrokh, N.; Suzanne, L.; Amir, M.K. A conceptual framework for quantitative estimation of physical vulnerability to landslides. Eng. Geol. 2008, 102, 251–256. [Google Scholar] [CrossRef]
- Quan, L.B.; Blahut, J.; Van Westen, C.J.; Sterlacchini, S.; van Asch, T.W.J.; Akbas, S.O. The Application of Numerical Debris Flow Modeling for the Generation of Physical Vulnerability Curves. Nat. Hazards Earth Syst. Sci. 2011, 11, 2047–2060. [Google Scholar] [CrossRef]
- Wen, C.L.; Ting, C.T.; Chih, H.H. Building vulnerability to debris flows in Taiwan: A preliminary study. Nat. Hazards 2012, 64, 2107–2128. [Google Scholar] [CrossRef]
- Jakob, M.; Stein, D.; Ulmi, M. Vulnerability of Buildings to Debris Flow Impact. Nat. Hazards J. Int. Soc. Prev. Mitig. Nat. Hazards 2012, 60, 241–261. [Google Scholar] [CrossRef]
- Maria, P.K. Vulnerability curves vs. vulnerability indicator: Application of an indicator-based methodology for debris-flow hazards. Nat. Hazards Earth Syst. Sci. 2016, 16, 1771–1790. [Google Scholar] [CrossRef]
- Joshua, M.; Tiziana, R.; Ioanna, I.; Ian, E. Investigation of the Effect of Debris-Induced Damage for Constructing Tsunami Fragility Curves for Buildings. Geosciences 2018, 8, 117. [Google Scholar] [CrossRef]
- Maria, N.P.; Luca, S.; Francesco, S.V.; Vicente, M. Application of the 2D Depth-Averaged Model, FLATMModel, to Pumiceous Debris Flows in the Amalfi Coast. Water 2018, 10, 1159. [Google Scholar] [CrossRef]
- Santi, P.M.; Hewitt, K.; Vandine, D.F.; Barillas Cruz, E. Debris-flow impact, vulnerability, and response. Nat. Hazards 2011, 56, 371–402. [Google Scholar] [CrossRef]
- Lan, H.X.; Li, L.P.; Zhang, Y.S.; Gao, X.; Liu, H.J. Risk assessment of debris flow in Yushu seismic area in China: A perspective for the reconstruction. Nat. Hazards 2013, 13, 2957–2968. [Google Scholar] [CrossRef]
- HAZUS: Multi-hazard Loss Estimation Methodology Earthquake Model User Manual; Department of Homeland Security Emergency Preparedness and Response Directorate: Washington, DC, USA, 2003; pp. 1–712.
- Aleotti, P.; Polloni, G.; Tropeano, D.; Turconi, L. Numerical modeling to determine risk scenarios in an alpine alluvial fan. Risk Anal. Ivmanagement Inf. Syst. 2004, 9, 153–162. [Google Scholar] [CrossRef]
- Hürlimann, M.; Copons, R.; Altimir, J. Detailed debris flow hazard assessment in Andorra: A multidisciplinary approach. Geomorphology 2006, 78, 359–372. [Google Scholar] [CrossRef]
- Additional Supplementary Investigation on the Cause of Umyeon Mountain’s Landslide; Research Report; The Seoul Institute: Seoul, Korea, 2014; pp. 1–299. (In Korean)
- Kim, B.S.; Yoon, S.K.; Yang, D.M.; Kwon, H.H. Development of Grid-Based Conceptual Hydrologic Model. J. Korea Water Resour. Assoc. 2010, 7, 667–679, (In Korean with English Abstract). [Google Scholar] [CrossRef]
- Nam, D.H. Study on Flood Estimation using S-RAT Model. Master’s Thesis, Kangwon National University, Chuncheon, Korea, 2015; pp. 1–69, (In Korean with English Abstract). [Google Scholar]
- Lee, D.S. Development of Functions of S-RAT Model using CBD Methodology. Master’s Thesis, Kangwon National University, Chuncheon, Korea, 2015; pp. 1–78, (In Korean with English Abstract). [Google Scholar]
- RAMMS: Debris Flow User Manual; SLF/WSL: Zurich, Switzerland, 2017; pp. 18–116.
- Guidelines for Establishing a Basic Plan for Erosion Control; Research Report; Ministry of Land, Infrastructure, Transport and Tourism of Japan: Tokyo, Japan, 2007; pp. 1–74. (In Japanese)
- Tak, W.J. A Study on the Transport and Diffusion Range Estimate of Debris Flow using RAMMS. Master’s Thesis, Kangwon National University, Chuncheon, Korea, 2015; pp. 1–71, (In Korean with English Abstract). [Google Scholar]
- Nam, D.H.; Lee, S.H.; Jun, K.W.; Kim, B.S. A Study on the Debris Flow Movement and the Run-Out Calculation Using the Coupling of Flood Runoff Model and Debris Flow Model. Crisisonomy 2016, 12, 131–143, (In Korean with English Abstract). [Google Scholar] [CrossRef]
- Hübl, J.; Suda, J.; Proske, D.; Kaitna, R.; Scheidl, C. Debris flow impact estimation. In 11th International Symposium on Water Management and Hydraulic Engineering; Popovska, C., Jovanovski, M., Eds.; Water Management and Hydraulic Engineering (WMHE): Ohrid, Macedonia, 2009; Volume 1, pp. 137–148. [Google Scholar]
- Moriguchi, S.; Borja, R.I.; Yashima, A.; Sawada, K. Estimating the Impact Force Generated by Granular Flow on a Rigid Obstruction. Acta Geotech. 2009, 4, 57–71. [Google Scholar] [CrossRef]
- Okuda, S.; Okunishi, K.; Suwa, H. Observation of Debris flow at Kamikamihori Valley of Mt. Yakedake. In Proceedings of the 3rd Meeting of IGU Commission on Field Experiment in Geomorphology, Kyoto, Japan, 24–30 August 1980; pp. 116–139. [Google Scholar]
- Li, J.; Luo, D. The Formation and Characteristics of Mudflow and Flood in the Mountain Area of the Dachao River and Its Prevention. Z. Geomorphol. N.F. 1981, 25, 470–484. [Google Scholar]
- Holland, P.G. Encyclopedia of Hydrology and Water Resources (Encyclopedia of Earth Science Series); Springer: Berlin, Germany, 2016; pp. 1–790. [Google Scholar]
- Jang, C.D.; Yun, Y.H.; Jeon, G.W. Numerical Simulation on Debris Flow Disaster Area Using Kanako-1D. Crisis Emerg. Manag. Theory Prax. 2011, 7, 205–214. (In Korean) [Google Scholar]
- Kim, N.G. A Study on Transport and Diffusion of Debris Flow with FLO-2D. Master’s Thesis, Kangwon National University, Chuncheon, Korea, 2011; pp. 1–58, (In Korean with English Abstract). [Google Scholar]
- Korea Appraisal Board. Construction Price Index Table; Korea Appraisal Board: Seoul, Korea, 2016; pp. 1–654. (In Korean) [Google Scholar]
© 2019 by the authors. Licensee MDPI, Basel, Switzerland. This article is an open access article distributed under the terms and conditions of the Creative Commons Attribution (CC BY) license (http://creativecommons.org/licenses/by/4.0/).