Article

Treatment of Aquaculture Wastewater through Chitin/ZnO Composite Photocatalyst

1
Key Laboratory of Environmental Biotechnology, Xiamen University of Technology, Xiamen 361024, China
2
Institute for Energy, Environment and Sustainability Research, UR-BNU, 3737 Wascana Parkway, Regina, SK S4S 0A2, Canada
3
Sino-Canada Resources and Environmental Research Academy, North China Electric Power University, Beijing 102206, China
4
School of Engineering, University of Guelph, Guelph, ON N1G 2W1, Canada
*
Author to whom correspondence should be addressed.
Water 2019, 11(2), 310; https://doi.org/10.3390/w11020310
Submission received: 21 September 2018 / Revised: 15 January 2019 / Accepted: 31 January 2019 / Published: 12 February 2019
(This article belongs to the Section Wastewater Treatment and Reuse)

Abstract

:
This paper proposed a newly explored composite photocatalyst, Chitin/ZnO, prepared via the sol-gel method for exploring its photocatalytic activity in the simulated aquaculture wastewater under UV irradiation. The study mainly involves the application of Chitin/ZnO from three aspects: the structure, the principle and the degradation efficiency. The effects of purification operation factors including mass ratio rate, dosage, calcination temperature, initial NH4+–N concentration and illumination conditions on the NH4+–N removal effectiveness were investigated. Optimum conditions were explored through orthogonal experiments, which revealed that 88.73% NH4+–N removal from 60 mg/L synthetic wastewater was achieved by direct illumination for 120 min. Additionally, Chitin/ZnO photocatalysts (mass ratio of 2:3) at a calcination temperature of 500 °C were favorable for Chitin loaded over a ZnO lattice. The obtained nanoparticles of Chitin/ZnO were characterized using SEM and X-ray diffraction. The purpose of this paper is to grope for an economical and easy method of Chitin/ZnO powder preparation and to provide a practical approach for future research on the photocatalytic purification of aquaculture wastewater.

1. Introduction

As the main component of feed raw material (urea), highly concentrated ammonia would seriously interfere with the stability of aquaculture water, leading to adverse effects on wild plants, inhabited animals and human life [1]. Traditional technologies that are widely used for the removal of NH4+–N in aquaculture wastewater mainly include physical, chemical, biological and integrated treatment processes [2,3,4]. Photocatalytic oxidation is one of the most effective chemical methods. It shows great potential in wastewater purification through inducing the generation of hydroxyl radicals and superoxide anion by irradiating specific semiconductor photocatalysts with band structures such as TiO2, ZnO, CdS, WO3, SrTiO3, Fe2O3 and so forth [5]. The semiconductor photocatalyst doped with non-metallic or metal elements generates a synergistic effect of multiple functions, namely
  • broadening the responsive light zone to improve the utilization of solar light or UV;
  • prohibiting the recombination of light-based electrons and catalyst holes (e–h+), and enhancing the quantitative efficiency of the semiconductor photocatalyst;
  • having an absorption capacity that plays a critical role in physical and chemical reactions.
In order to ameliorate the photocatalytic efficiency of semiconductor photocatalysts in wastewater purification, recent studies have been performed on the photocatalytic degradation of ammonia in aquaculture water under UV light. For example, Jin et al. [6] prepared the nano-SnO2 photocatalyst using a chemical precipitation method with SnCl4·5H2O as the raw material and explored the effect of the SnO2 catalyst on the removal of pollutants from wastewater under laboratory preparation conditions. Based on this experiment, the optimization of the SnO2 catalyst was carried out by Yu et al. [7] who doped rare-earth metal Ce to SnO2. In comparison to the pure SnO2, it was found that the conduction bands of SnO2 doped with Ce became dense, that the fluctuation between bands was gentler and that the entire valence and conduction bands moved to the side of low energy end. Moreover, the optimal wastewater treatment efficiency of Ce/SnO2 (92.7%) was superior to that of the pure SnO2 (72%).
Through an analysis carried out by Shavisi et al. [8], it was indicated that 5 wt.% CuO loaded over ZnO could significantly increase the photocatalytic activity as 77.2% ammonia removal from synthetic wastewater was achieved within 240 min of solar irradiation time. Accordingly, ultraviolet and visible light are essential for the excitation of oxides (SnO2 and ZnO).
The absorption spectrum of the semiconductor can be extended to the visible region by choosing suitable dopants (such as non-metals and metal oxides) to make full use of light energy. Zhang et al. [9] prepared a Nano-ZnO/Chitosan composite membrane (ZnO–CTF) for exploring its adsorption capacity on methyl orange; the membrane-forming performance of such a composite membrane was decent, and the adsorption rate of methyl orange could reach 90.9%.
Chitin or Chitosan, derived from the crustacean shell, is an environment-friendly biodegradable non-metal material [10]; it could be loaded over ZnO crystal to harvest the maximum possible energy of the sunlight. However, Chitin/ZnO has only been explored in the field of composite membrane preparation [9,11], and there are no related reports on the synthesis of photocatalyst powder. Therefore, the objective of this research is to improve the UV-light utilization efficiency of pure ZnO photocatalysts by integrating the low-cost fabrication process and the simple-step design principle of the Chitin/ZnO photocatalyst powder (Figure 1).
Different doping ratios and calcination temperatures are considered in this research. In order to degrade key contaminants (NH4+–N) [12,13] in the simulated aquaculture wastewater under ultraviolet irradiation, Chitin/ZnO is adopted and the optimal reaction conditions are explored. Such a procedure can also be used as a guideline for future research on the photocatalytic purification of aquaculture wastewater. A general framework of this research is presented in Figure 2.

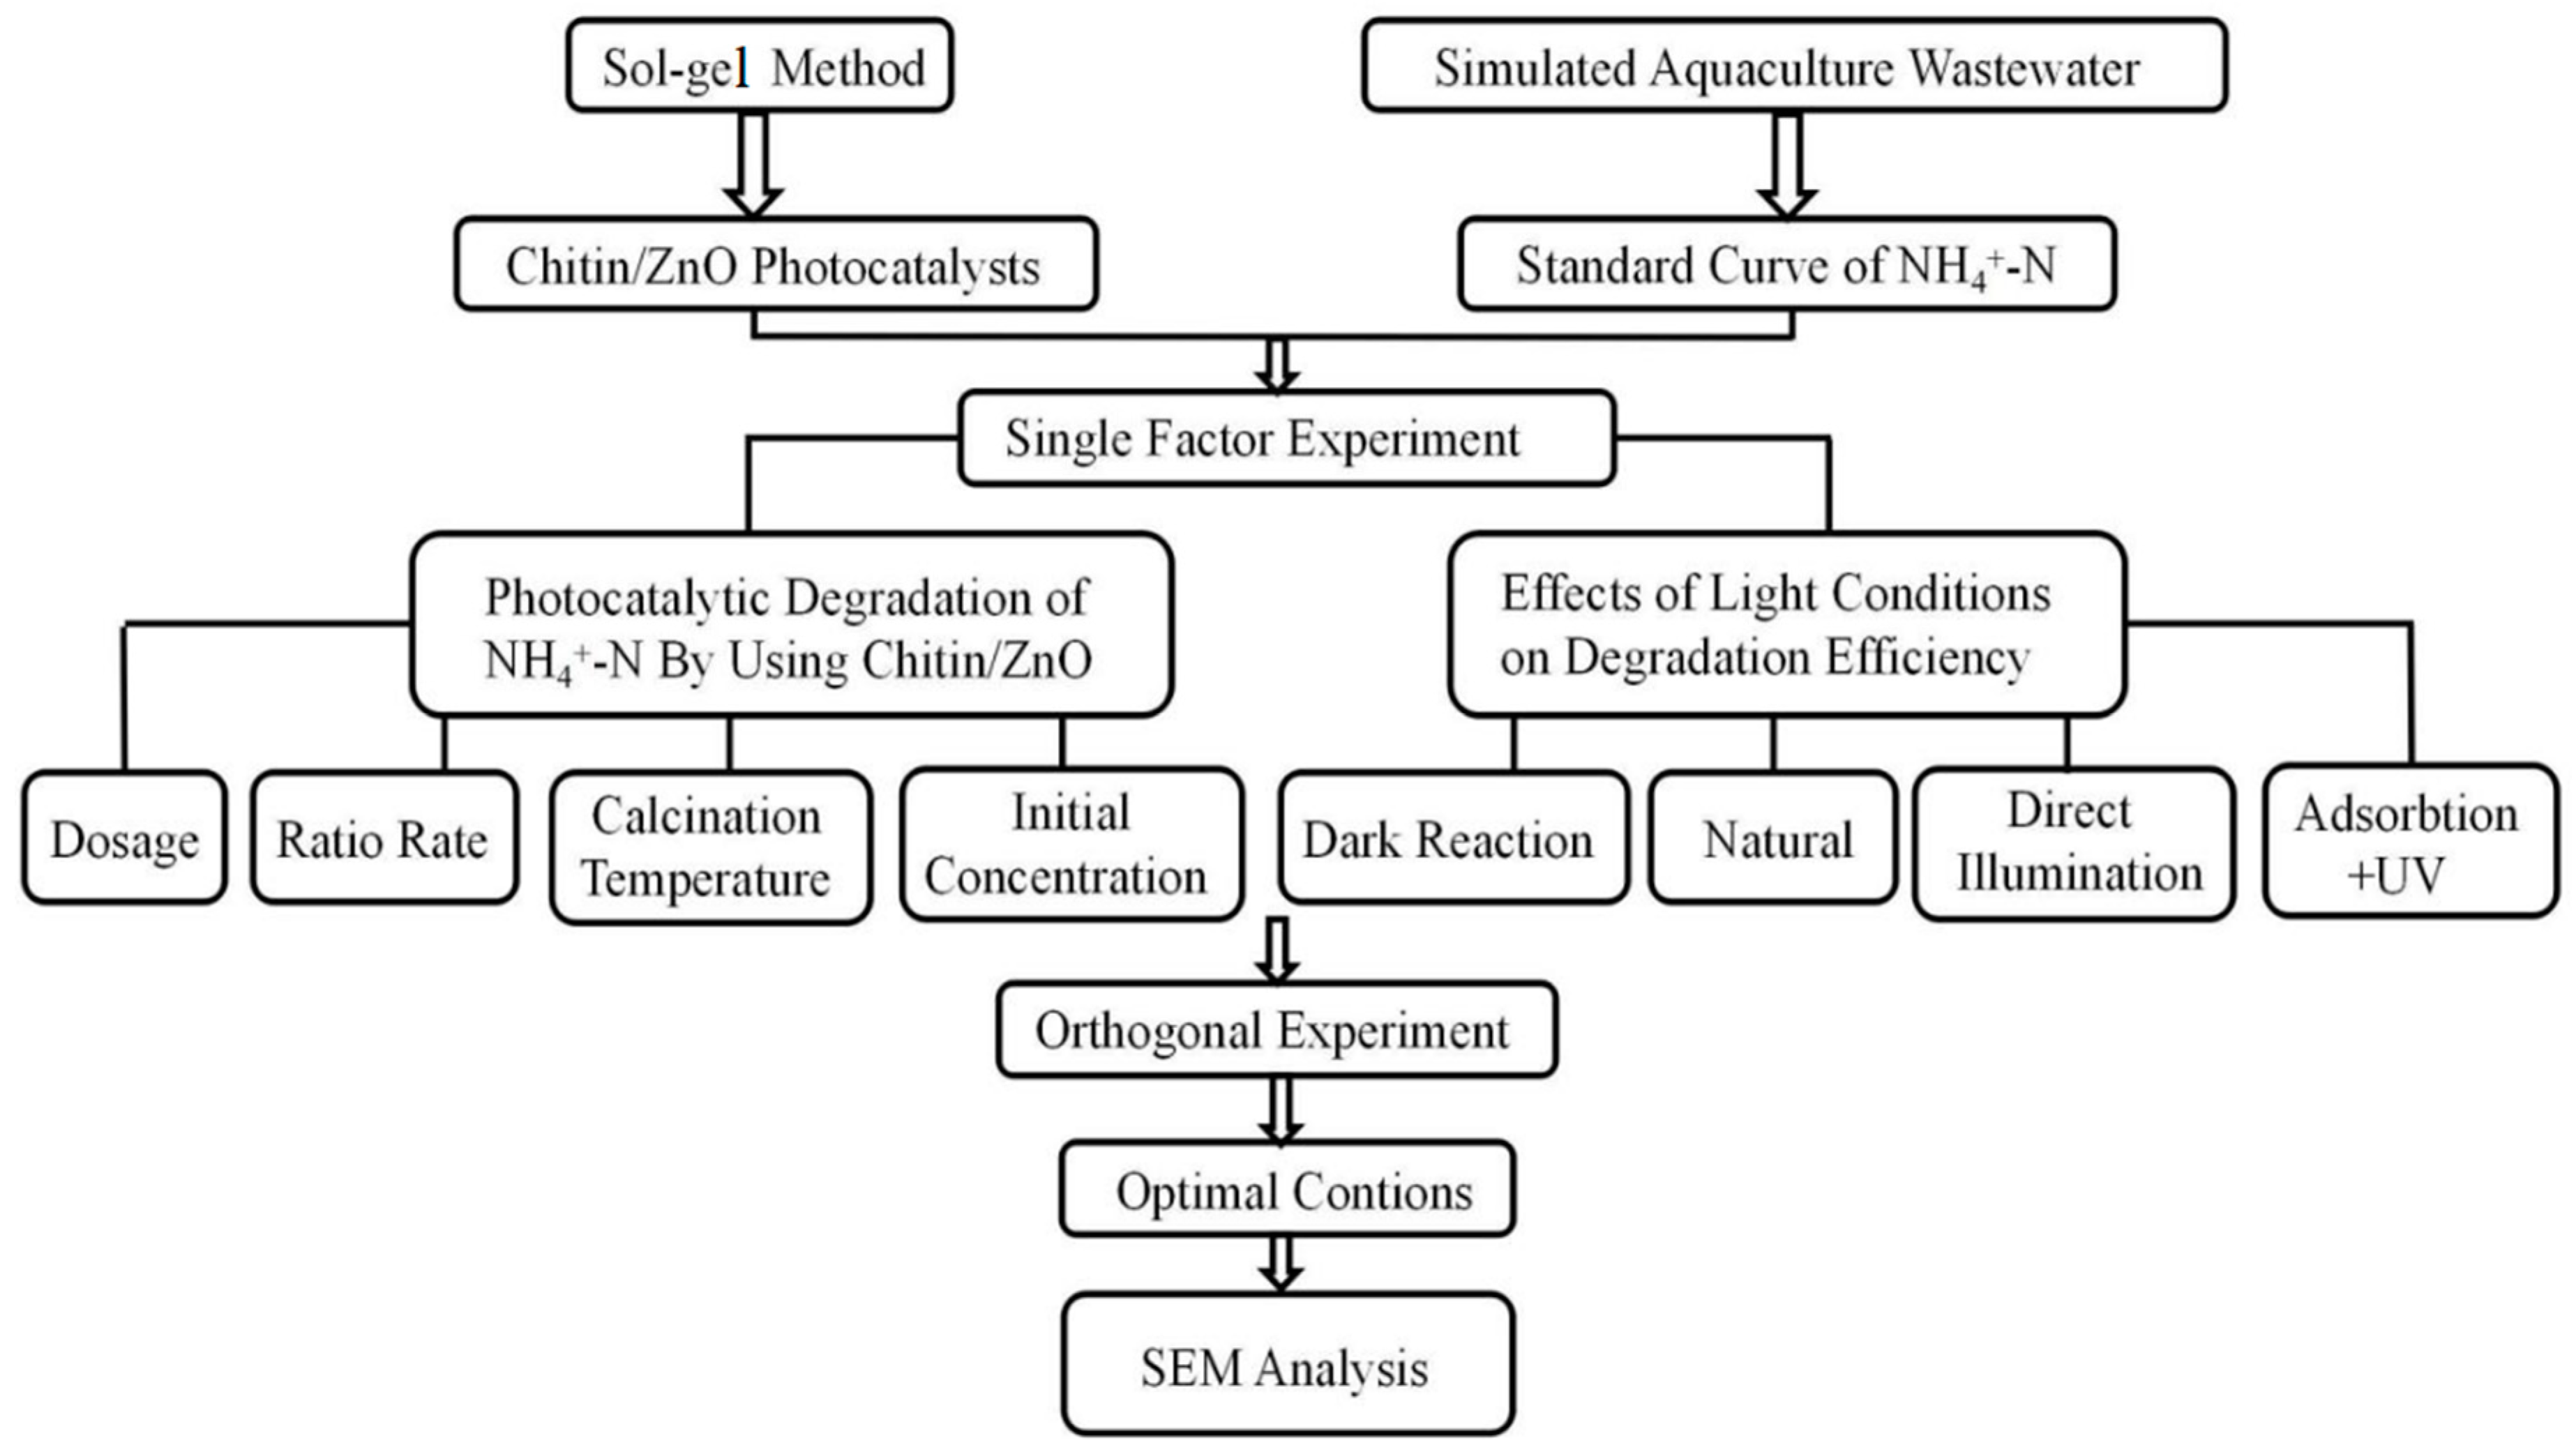
2. Materials and Methods

2.1. Materials

The raw materials needed for the preparation of the Chitin/ZnO composite photocatalyst and the stimulation of the aquaculture wastewater are shown in Table 1.
The instruments used in this research are shown in Table 2.

2.2. Preparation of the Photocatalyst

2.2.1. ZnO Photocatalyst Preparation

In order to prepare pure ZnO powder, 29.73 g ZnNO3.6H2O (AR) was dissolved in 1000 mL distilled water (0.1 mol/L), and the 20 mL polyethylene glycol was added. Then, the NaOH solution was slowly poured into the mixed solution until the pH value reached 8. The temperature knob was adjusted to 80 °C and the mixed solution was stirred for two hours [14]. Subsequently, the solution was washed using ultrapure water for 2 to 3 times after centrifugation. In the final stage, in order to obtain the pure ZnO nanoparticles, the as-prepared product was dried at 100 °C for 8 h and then fully ground and calcined in the muffle furnace at 450 °C for 2 h.

2.2.2. Chitin/ZnO Photocatalyst Preparation

The three-step sol-gel synthesis method was used to prepare Chitin loaded over ZnO nanostructures. The specific preparation process is as follows:
Initially, different mass ratios (m-Chitin/m-ZnO) of 1:2, 2:3, 1:1 and 2:1 were selected; the corresponding Chitin and ZnO powder were weighed and added to the 50mL the acetic acid solution.
In the following steps, the mixed powders floating on the surface of the acetic acid solution were stirred at 100 °C for 2 h. It is essential to observe whether the material morphology had changed or the light green semitransparent gel solid had appeared during the agitation process. In general, a thin gel would be formed on the surface of the mixed solution after 30 min. When the entire surface of the solution was fully covered, the gel ought to be removed with a glass rod and placed in a crucible. This operation should be repeated until the mixture was completely condensed into a translucent colloidal solid, and the stirring procedure was about 2 h.
Finally, to produce the Chitin/ZnO photocatalyst, the semitransparent gelatinous solid was dried at 100 °C for 6 h. After the as-synthesized product was calcined at 300, 400, 500 and 600 °C, 16 Chitin/ZnO photocatalysts with various temperatures and mass ratios were obtained.

2.3. Preparation of the Simulated Aquaculture Wastewater

Samples were collected from the freshwater lake at the Xiamen University of Technology. The initial value of NH4+–N was 0.142 mg/L, and the pH value was 9.21.
Water sample pretreatment: a 20% sulfuric acid solution was used to acidify a filtered water sample to pH < 2, which was then stored in a polyethylene bottle and sealed in a freezer at 1–5 °C for seven days [15].
Simulated aquaculture wastewater: a (NH4)2SO4 solution was added to the filtered samples to form different concentrations (i.e., 15, 30, 45, 60 and 75 mg/L) of NH4+–N solutions. The 10% ZnSO4 and 25% NaOH solutions were added to the NH4+–N wastewater for adjusting the pH value to about 8.0–8.5 every time before testing. It would simulate the optimum pH range of aquaculture wastewater and approach to the living environment for freshwater organisms, which eliminates the interference of external pollutants.

3. Results and Discussions

3.1. Degradation of Aquaculture Wastewater by the Chitin–ZnO Composite Photocatalyst

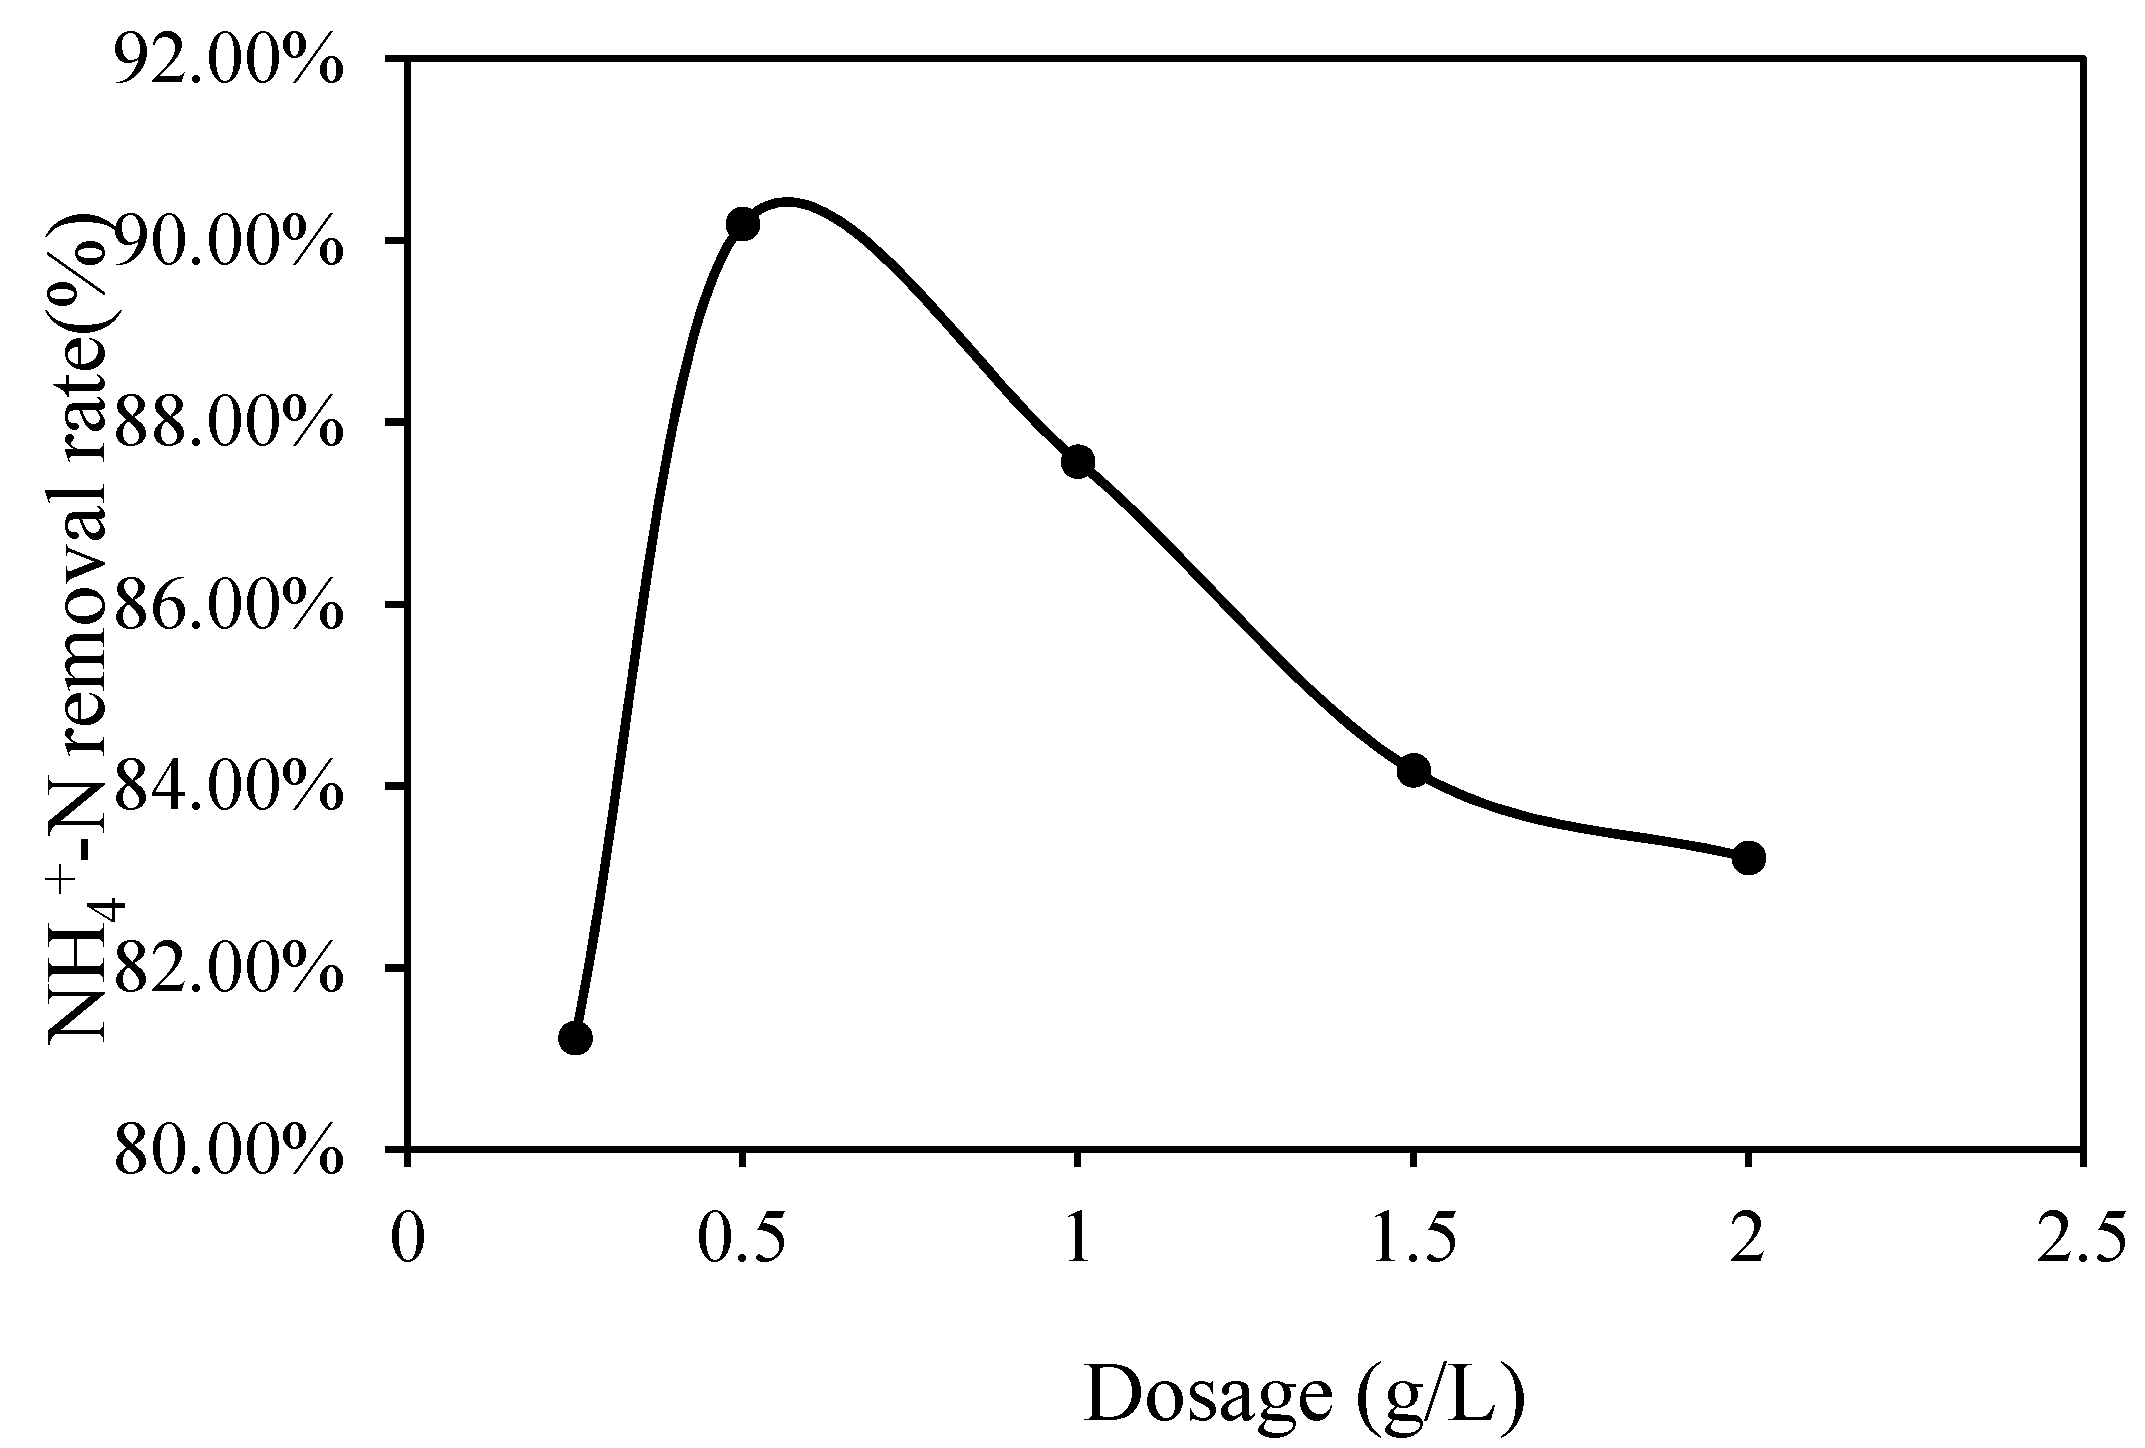
3.1.1. Effect of the Chitin–ZnO Dosage

The initial concentration of NH4+–N in the simulated aquaculture wastewater was adjusted by the (NH4)2SO4 solution to 60 mg/L. Five groups of Chitin–ZnO photocatalysts (0.25 g, 0.5 g, 1 g, 1.5 g and 2 g/L) were added into the water with a pH value of 8.12. The photocatalysts were irradiated by ultraviolet light for 2 h.
The removal rate of NH4+–N using Chitin–ZnO at different dosages is shown in Figure 3. Figure 3 shows that the NH4+–N removal efficiency increased at a peak of 90.18% when the dosage was 0.5g/L and then decreased by less than 84% when the dosage raised to 2 g/L.
The reasons for this fluctuation may be as follows: 1) When a small amount of composite photocatalyst was added, ultraviolet light would not induce the formation of enough electron–hole pairs [16], which proved to be of limited effect on ammonia nitrogen oxidation; 2) when the dosage of Chitin–ZnO rose from 0.25 g/L to 0.5 g/L, a great deal of electron–hole pairs were enriched in the wastewater, which largely enhanced the utilization of ultraviolet light and improved the photocatalytic oxidation reaction to be carried out efficiently; 3) however, when the dosage exceeded 0.5g/L, the scattering degree of UV light was aggravated by the powdered catalyst, and only some photogenerated electron–holes were produced, which resulted in the falling removal efficiency.

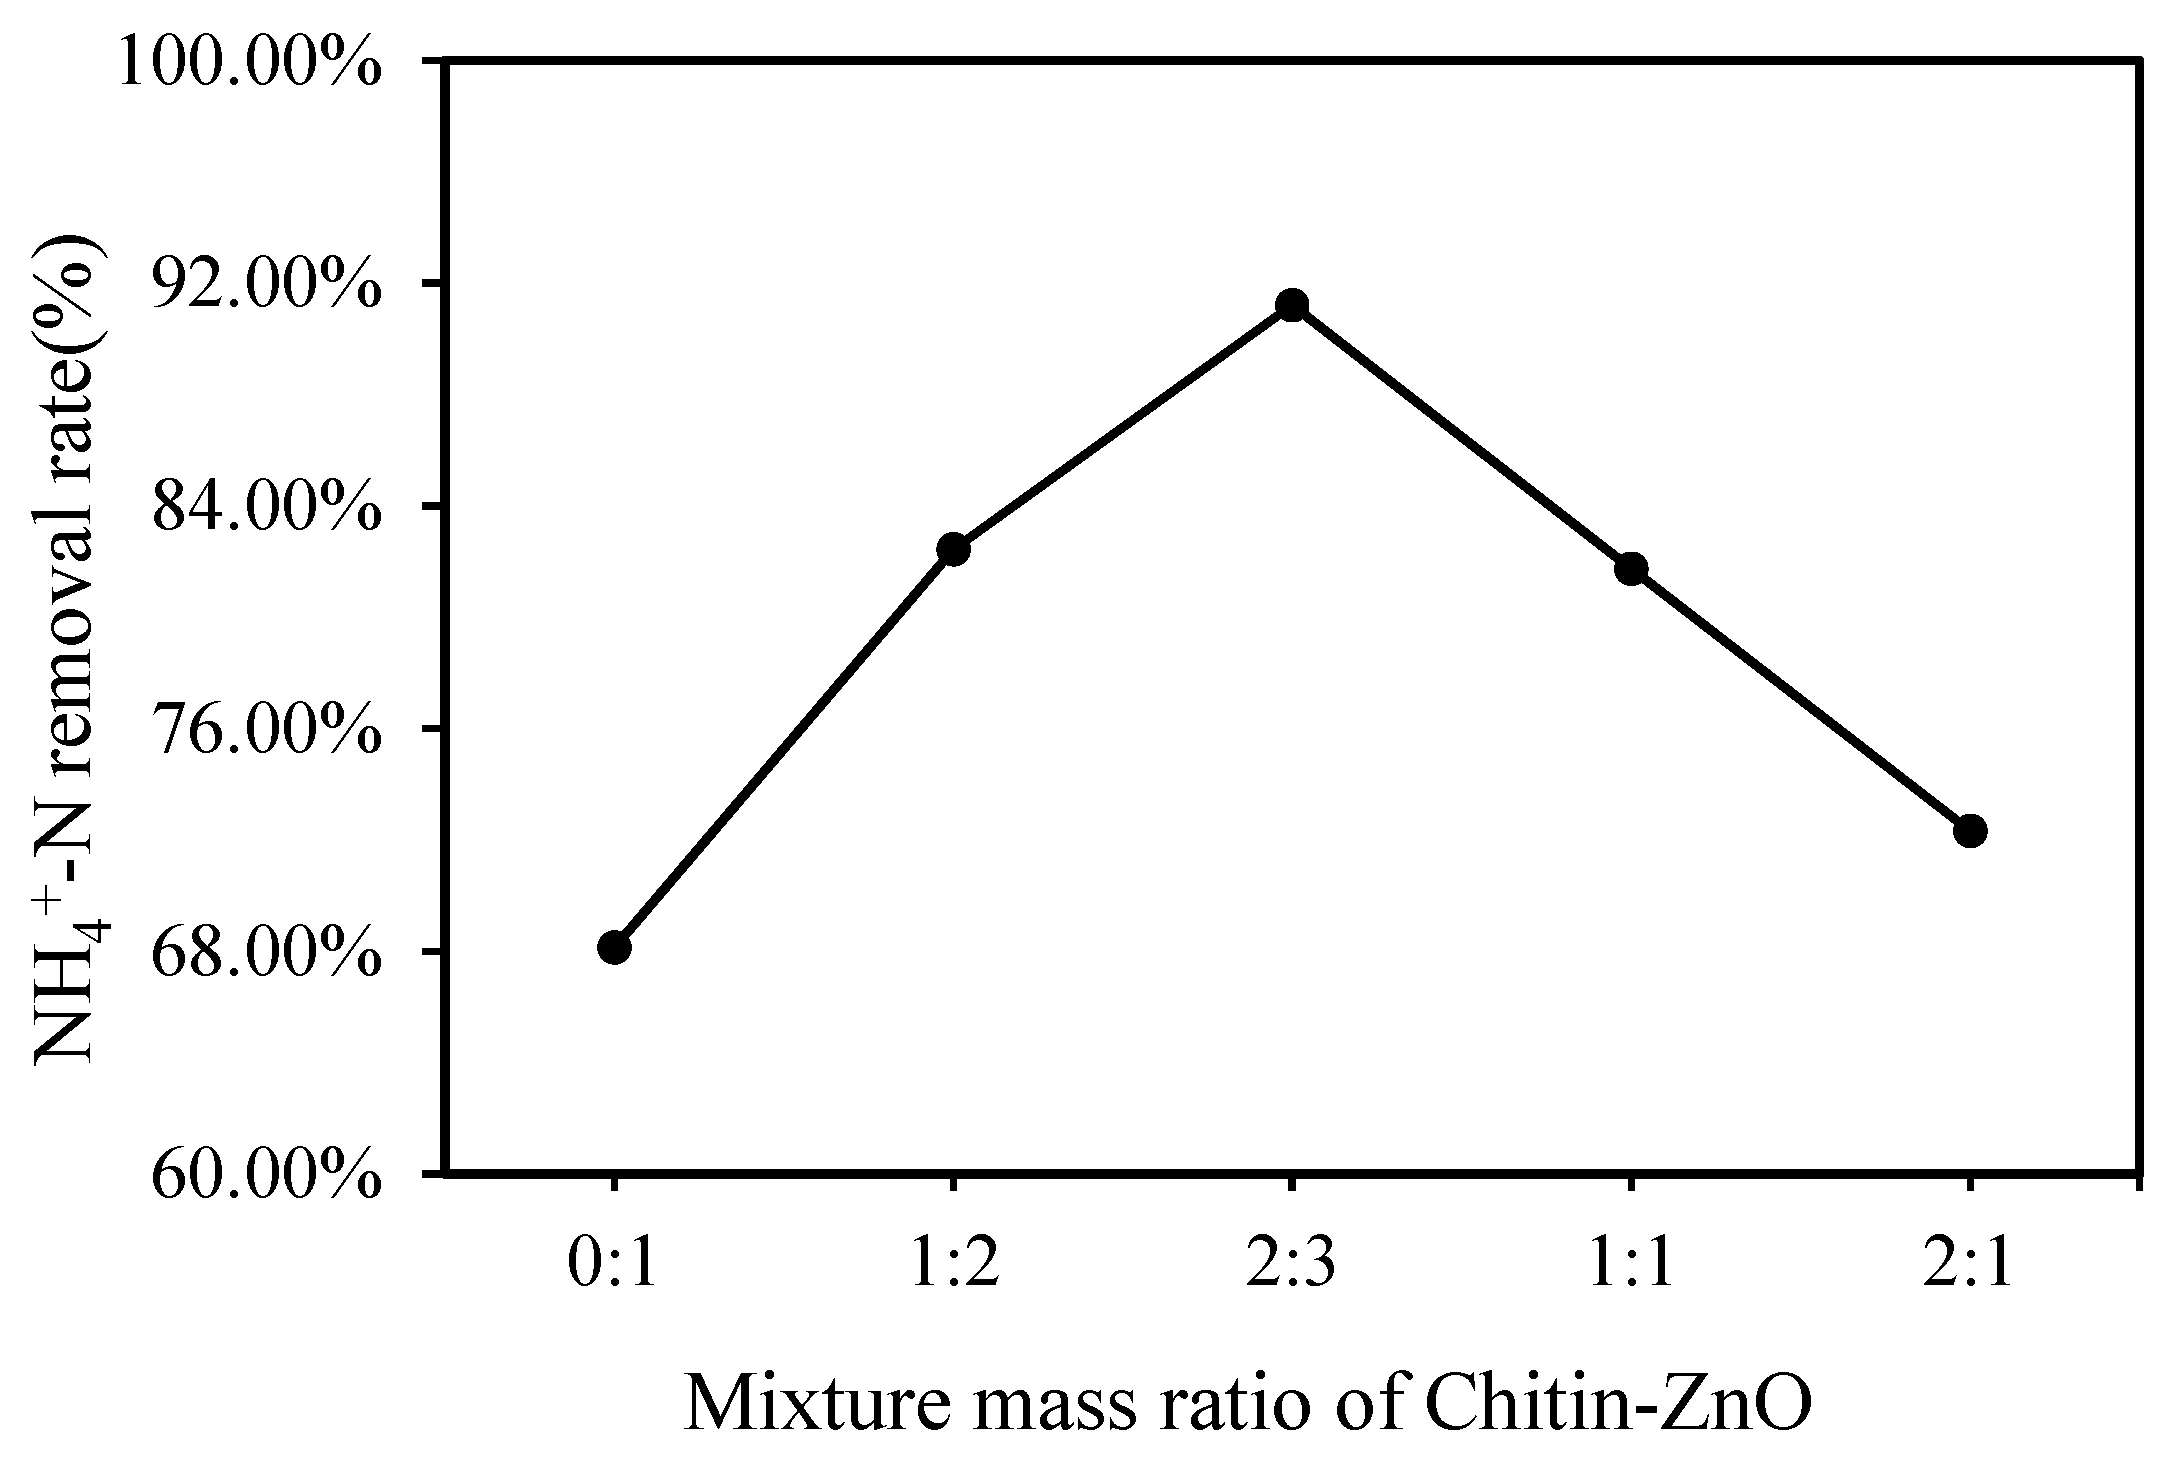
3.1.2. Effect of Mixture Mass Ratio

The initial concentration of NH4+–N solution was 60 mg/L. 0.5 g/L Chitin–ZnO with different mass ratios of 1:2, 2:3, 1:1 and 2:1 were added into the wastewater of pH 8.12, irradiated by ultraviolet light for 2 h.
Figure 4 shows that the removal rate of NH4+–N was 67.53% when the pure ZnO photocatalyst powder was added. It was found that the purification rate of wastewater could be improved in a certain range by adding chitin with different proportions. When the mass ratio of chitin to zinc oxide was controlled in the range of 1:2 to 2:3, the NH4+–N removal rate increased with the rise of the chitin loading ratio, and the optimal removal efficiency (91.21%) could be achieved when the figure was 2:3. However, the excessive increase of the chitin proportion in the mixed photocatalyst would directly lead to a significant reduction of the NH4+–N removal rate, which was most apparent when the chitin proportion exceeded 66.67%.
This may be due to 1) doping a certain proportion of non-metallic elements in ZnO lattice, namely chitin, could generate some corresponding improvements within the range of 1:2 to 2:3. Chitin could replace the oxidation potential and narrow the forbidden band of ZnO, thus broadening the wavelength range of light response and making full use of ultraviolet energy to promote degradation efficiency [17]. 2) When the proportion of chitin was excessively increased, the excess defects were introduced into the ZnO lattice, which would lead to great damage of ZnO. The crystallization structure directly reflected the gradual degradation of efficiency.

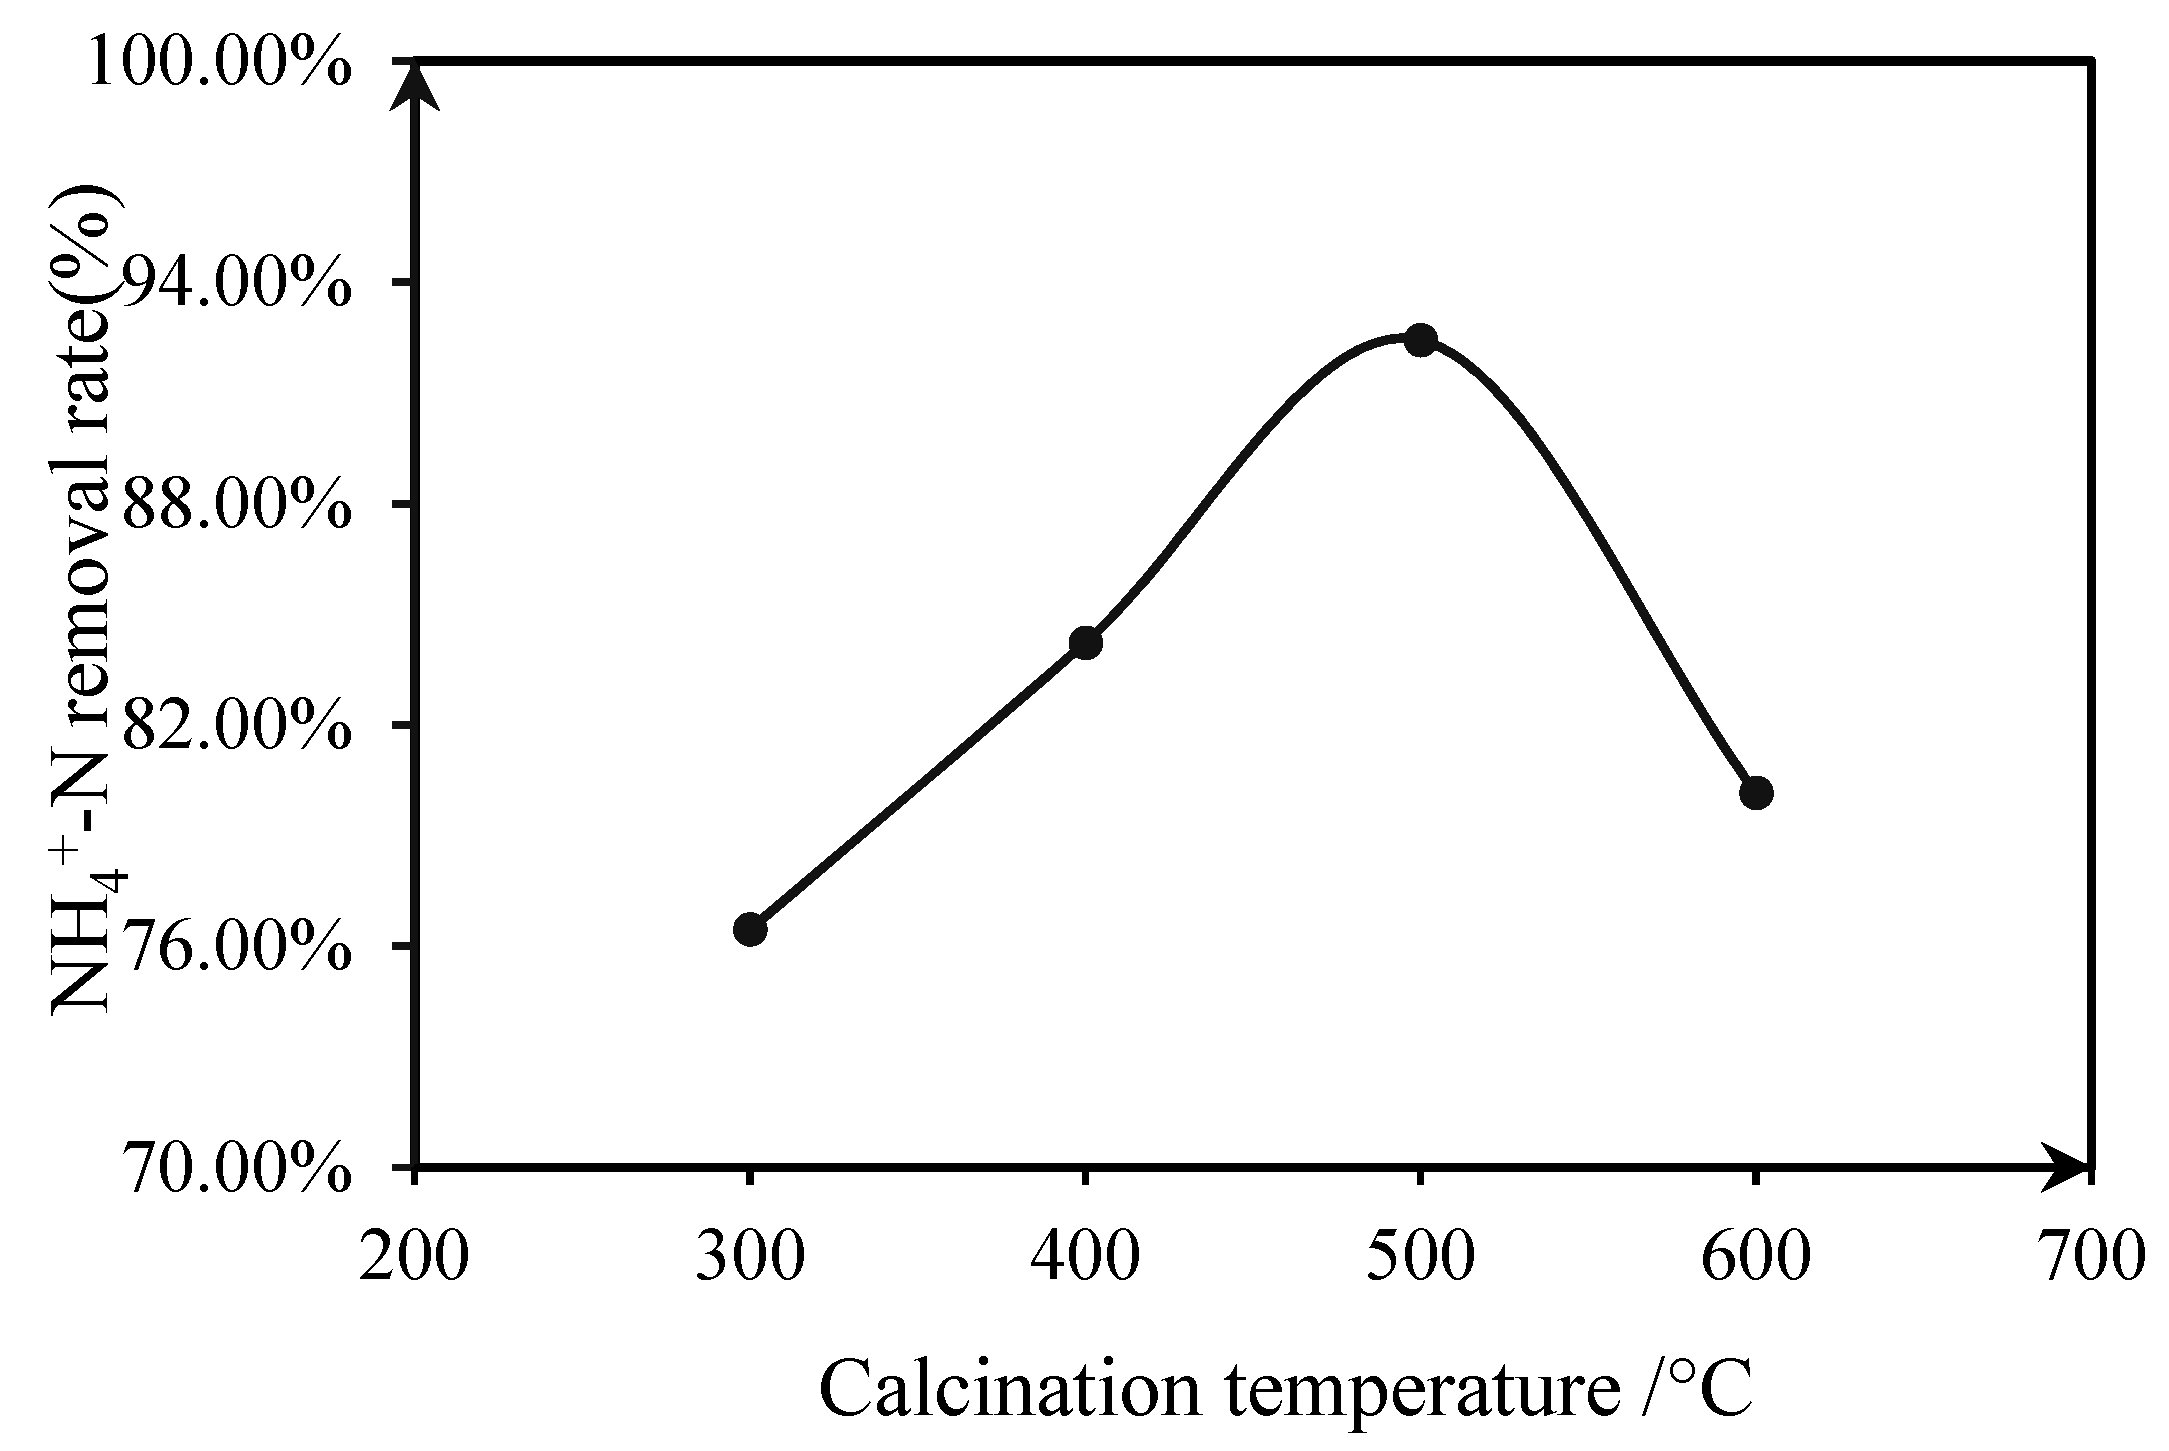
3.1.3. Effect of Calcination Temperature

The influence of a calcination temperature of the Chitin–ZnO photocatalyst for NH4+–N degradation was studied in the range of 300–600 °C. All experiments were carried out in the same condition (initial NH4+–N concentration 60 mg/L), pH = 8.12 and irradiation time 2 h. The results are shown in Figure 5.
Figure 5 shows that the composite photocatalyst prepared at higher temperatures improves the degradation efficiency in the range of 300–500 °C. The Chitin/ZnO prepared by calcination at 500 °C presented the superior catalytic oxidation activity (92.43%). In comparison with the samples calcined at a lower temperature (300/400 °C), the ZnO lattice could obtain better load balancing. Defects could either favour or deteriorate the photocatalytic activity of the metal oxide, depending on their physical location in the system [18]. By these calcination conditions, the chitin would occupy a proper proportion of the defect position of the zinc oxide, which promotes the separation, restrains the recombination of electrons and holes (e–h+), increases the charge transport and accelerates the photocatalytic activity [19].
However, the overall removal efficiency of the photocatalyst cannot be continuously improved by the increasing calcination temperature [20], which may be due to the excessive temperature that affects the matching degree between chitin and ZnO. The poor loading effect could be shown as an agglomeration phenomenon [21], which indirectly prolonged the time of photogenerated electrons diffusing to the catalyst surface and then increased the probability of negative photogenerated electrons compounding with positive holes, thus reducing the photocatalytic activity.

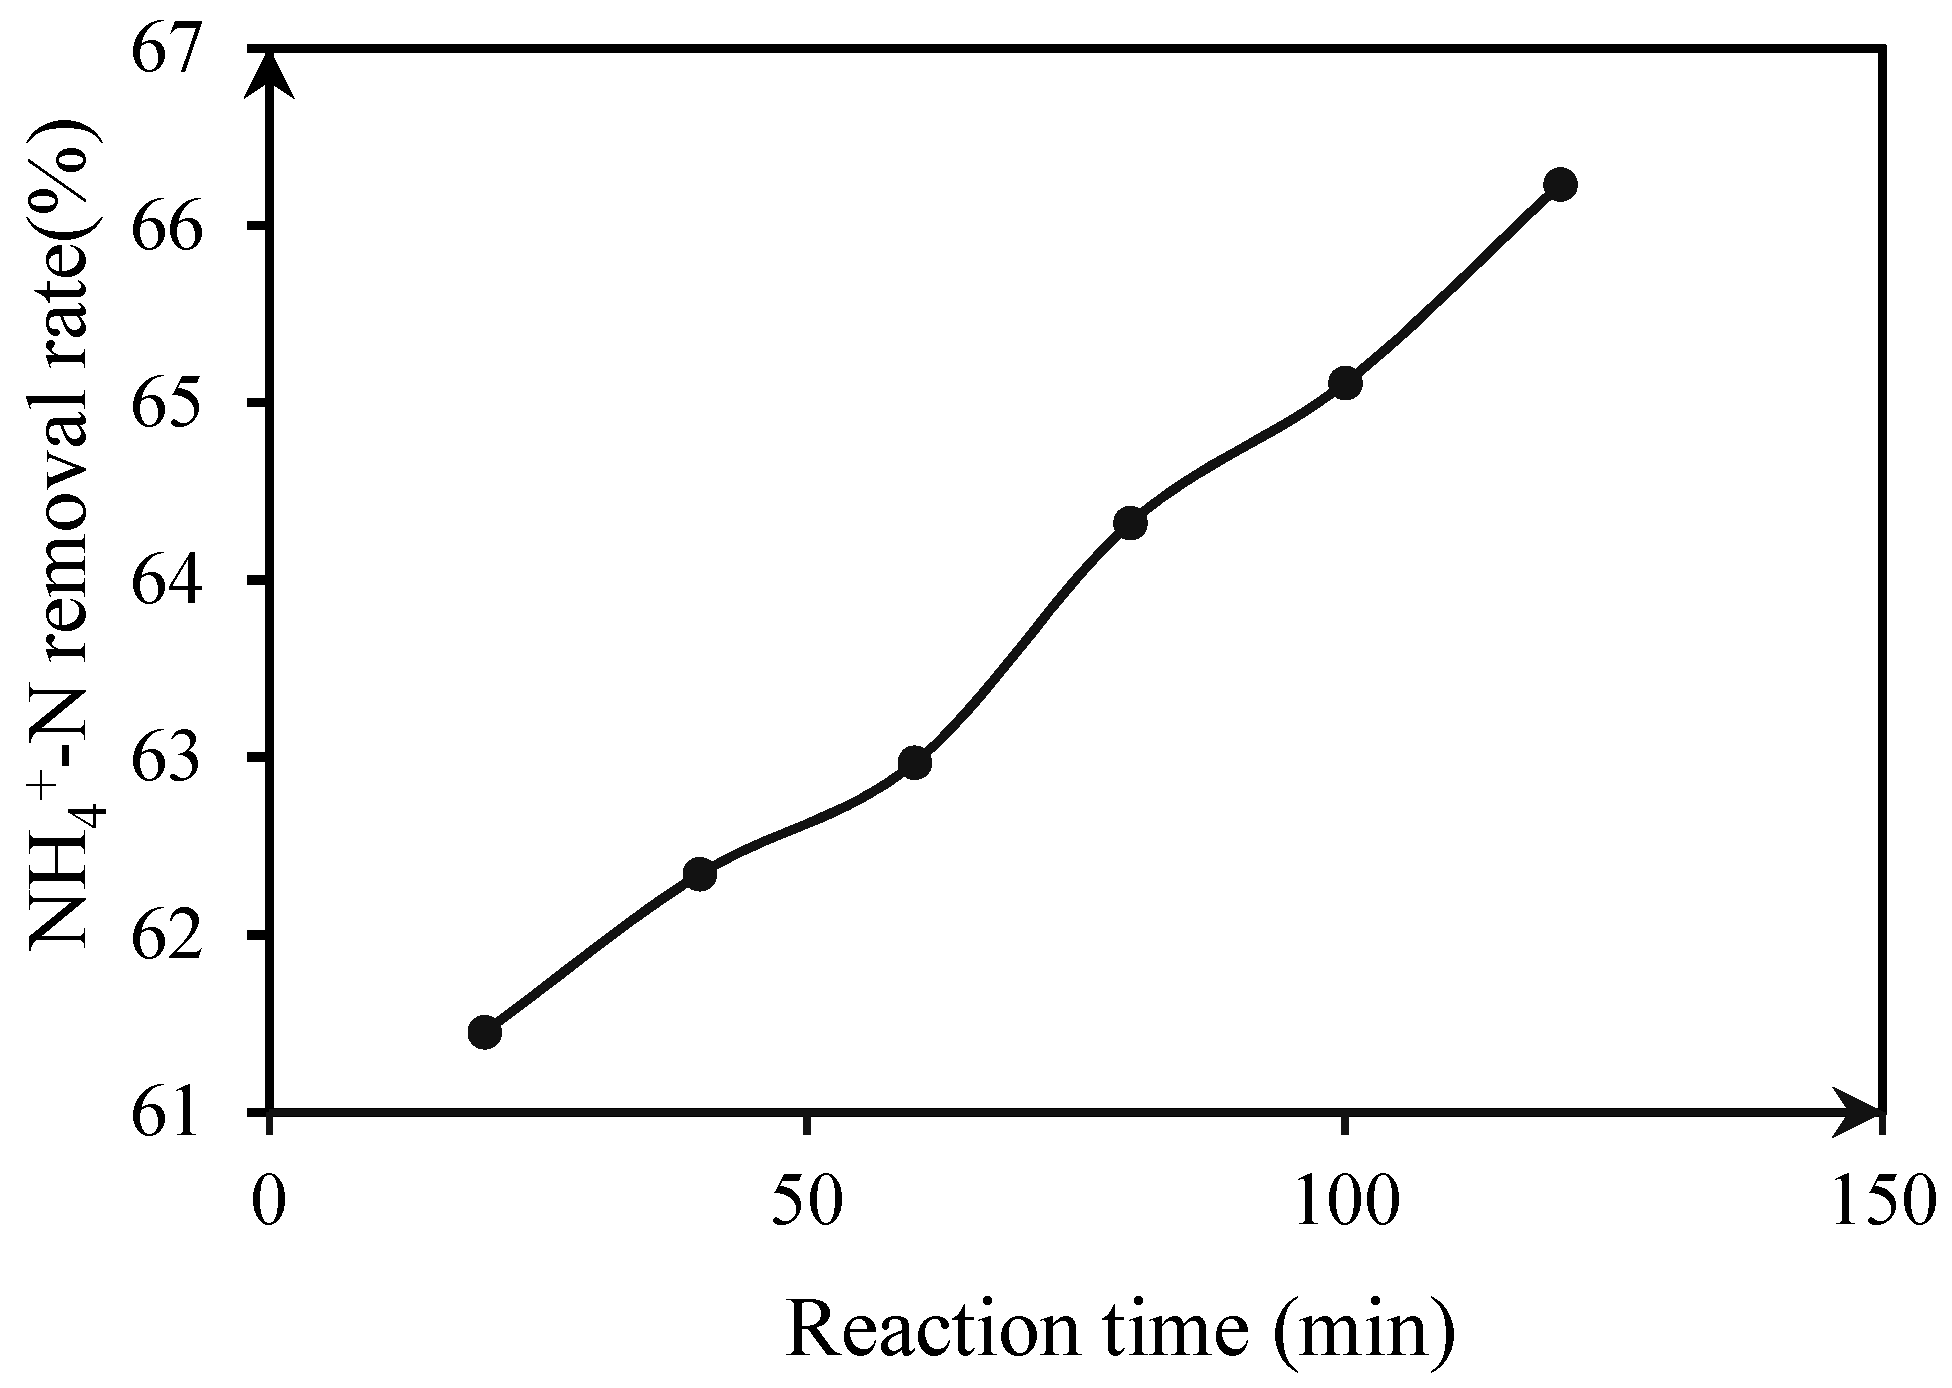
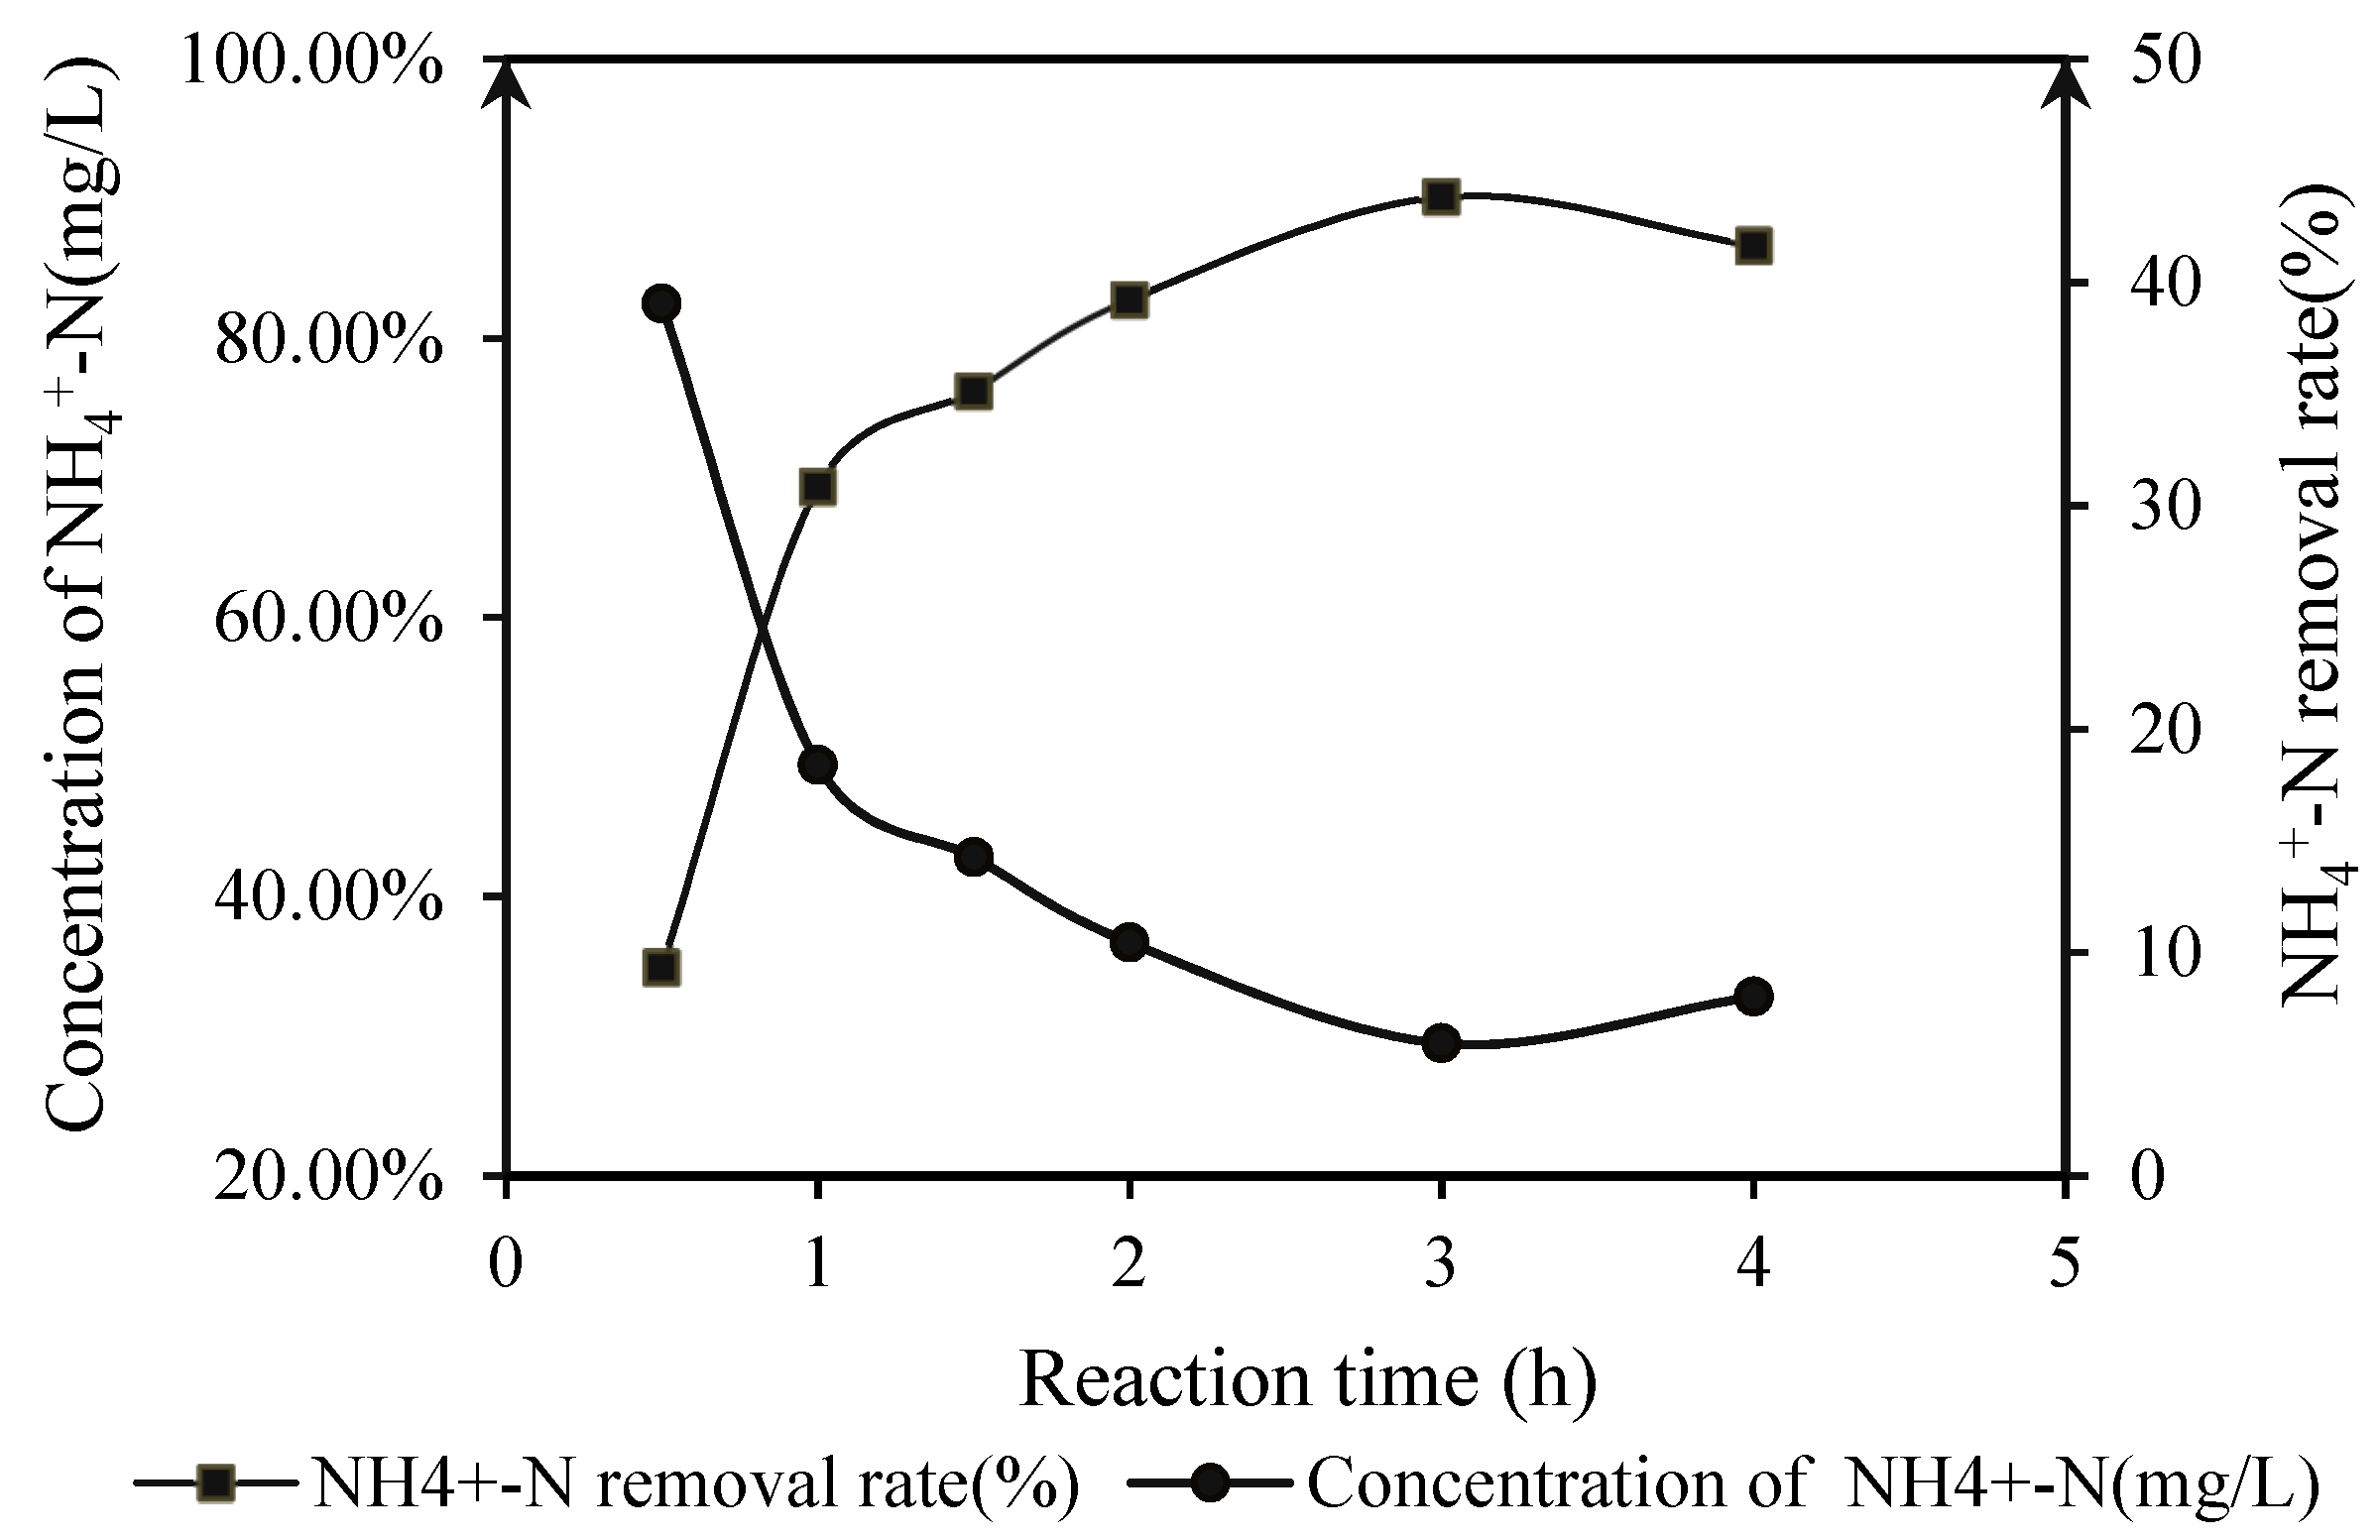
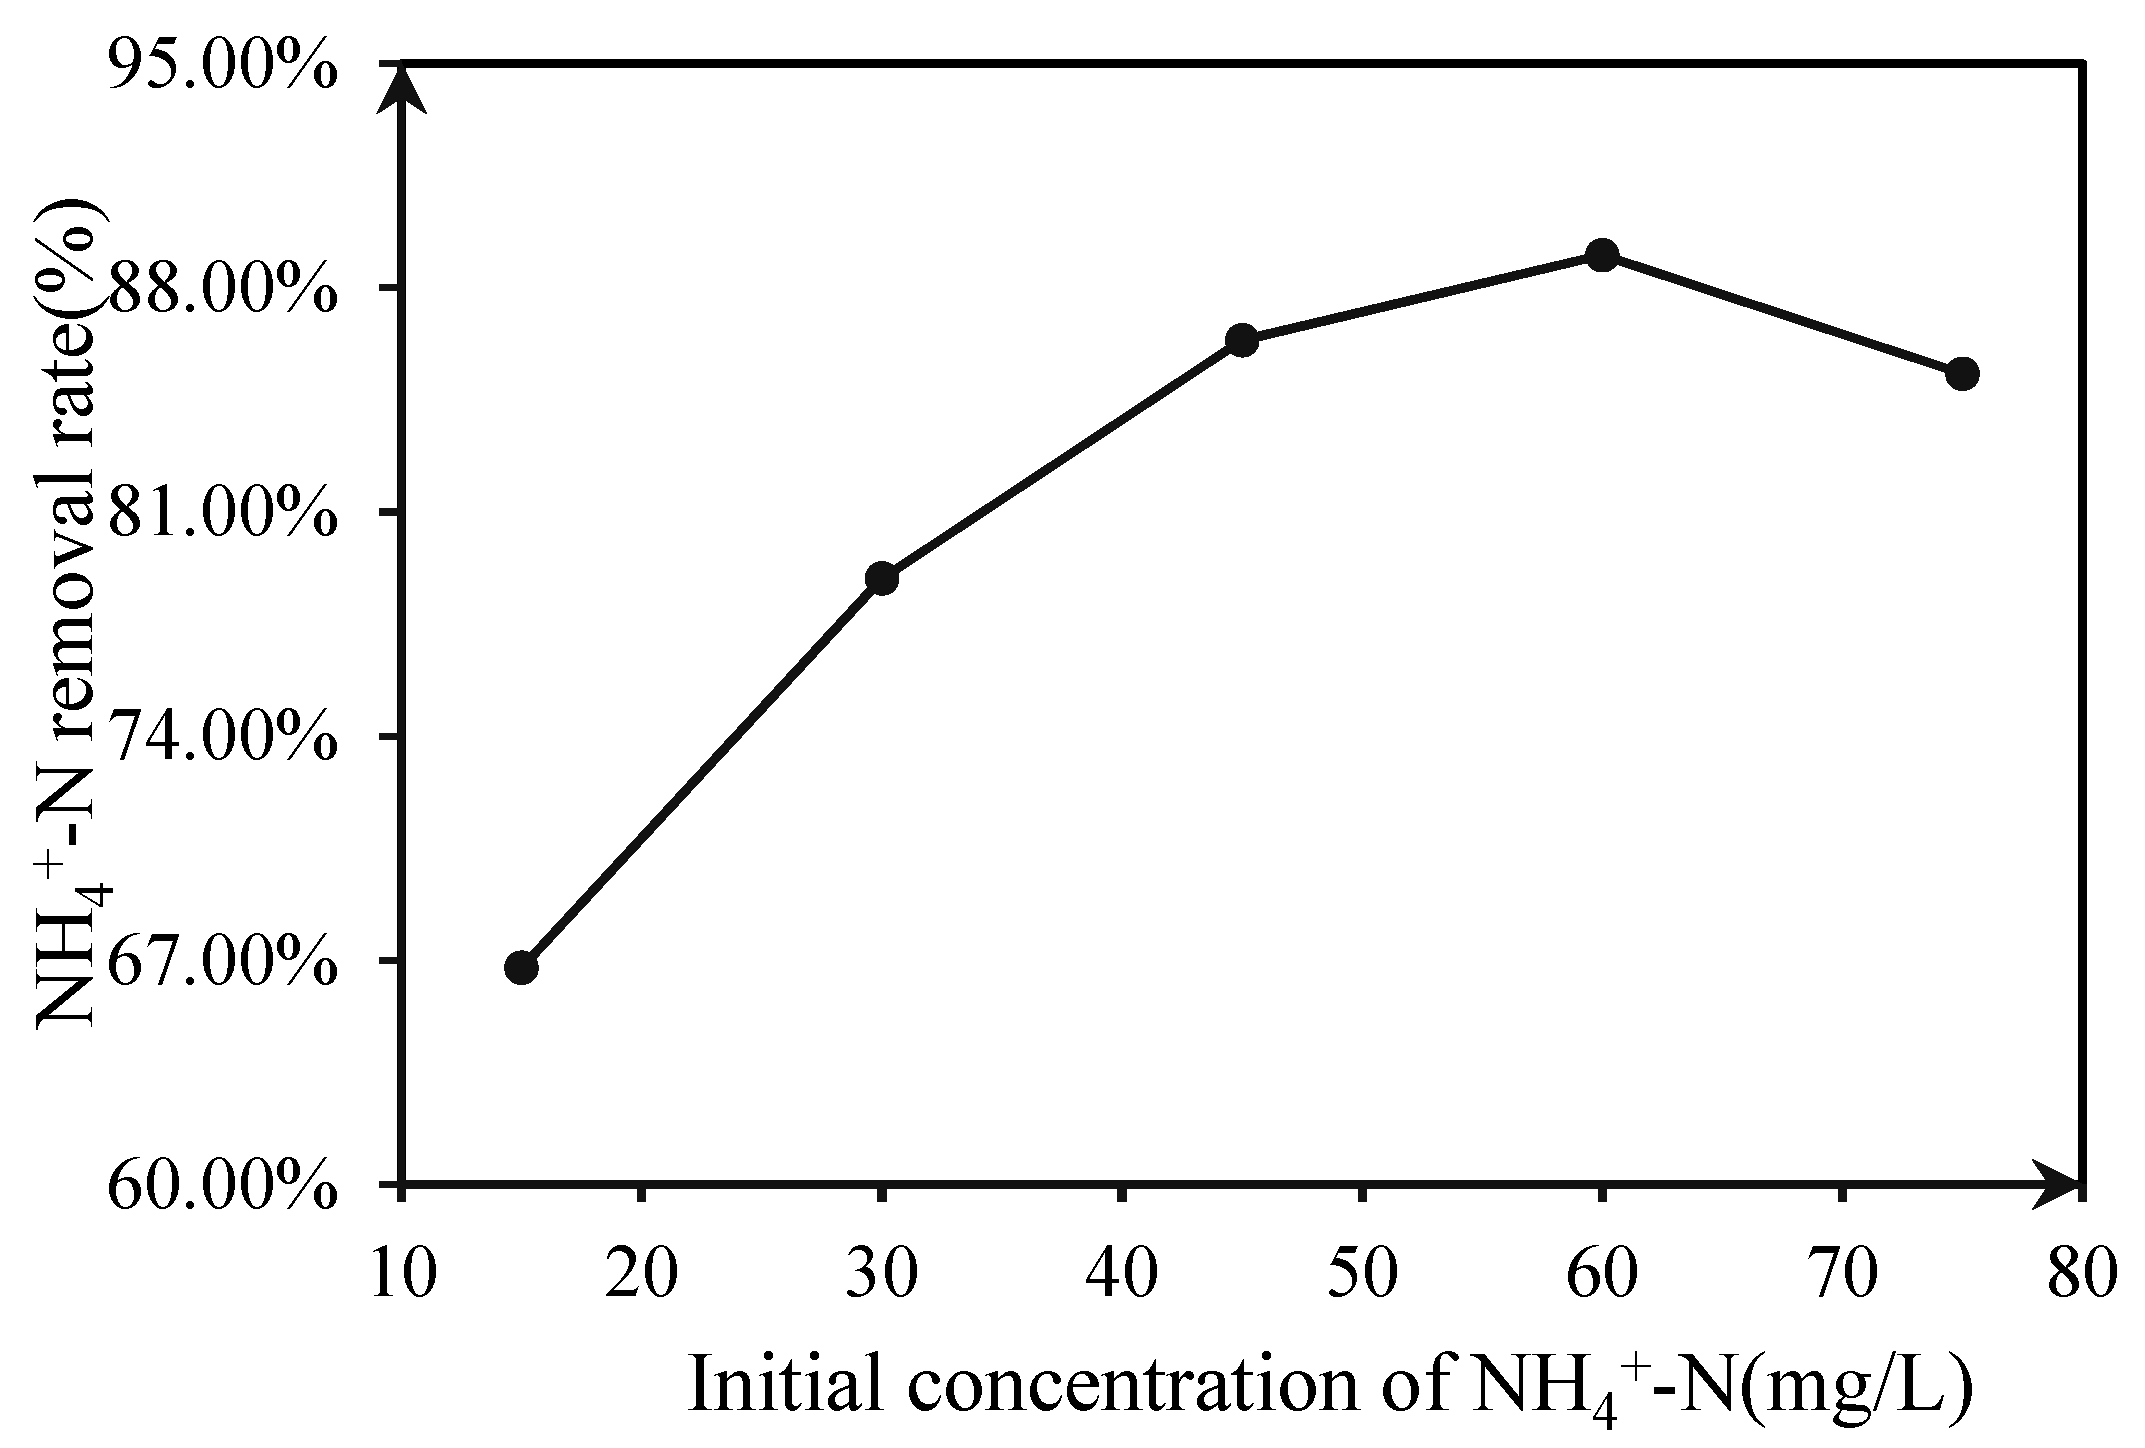
3.1.4. Effect of the Initial Concentration of NH4+–N

The effect of the initial NH4+–N concentration on the photocatalytic degradation reaction was investigated over the range of 15–75 mg/L, and the experimental results are presented in Figure 6.
Increasing the initial concentration logically enhances the probability of an interaction between the ammonia molecules and the oxidizing species, leading to an increase in the degradation efficiency [22]. However, the continuous increase of the initial NH4+–N concentration (more than 60 mg/L) would result in a rise in ammonia adsorption on the surface of photocatalysts, thereby increasing the occupancy of active sites as a whole [5]. A series of reactions between the pollutants (such as ammonia molecules) and radicals (such as ·OH, ·O2 and holes with positive points) would be inhibited to a certain extent, resulting in the degradation efficiency of ammonia nitrogen when the initial concentration is higher than 60 mg/L.

3.2. Effect of Light Conditions on Photocatalytic Degradation

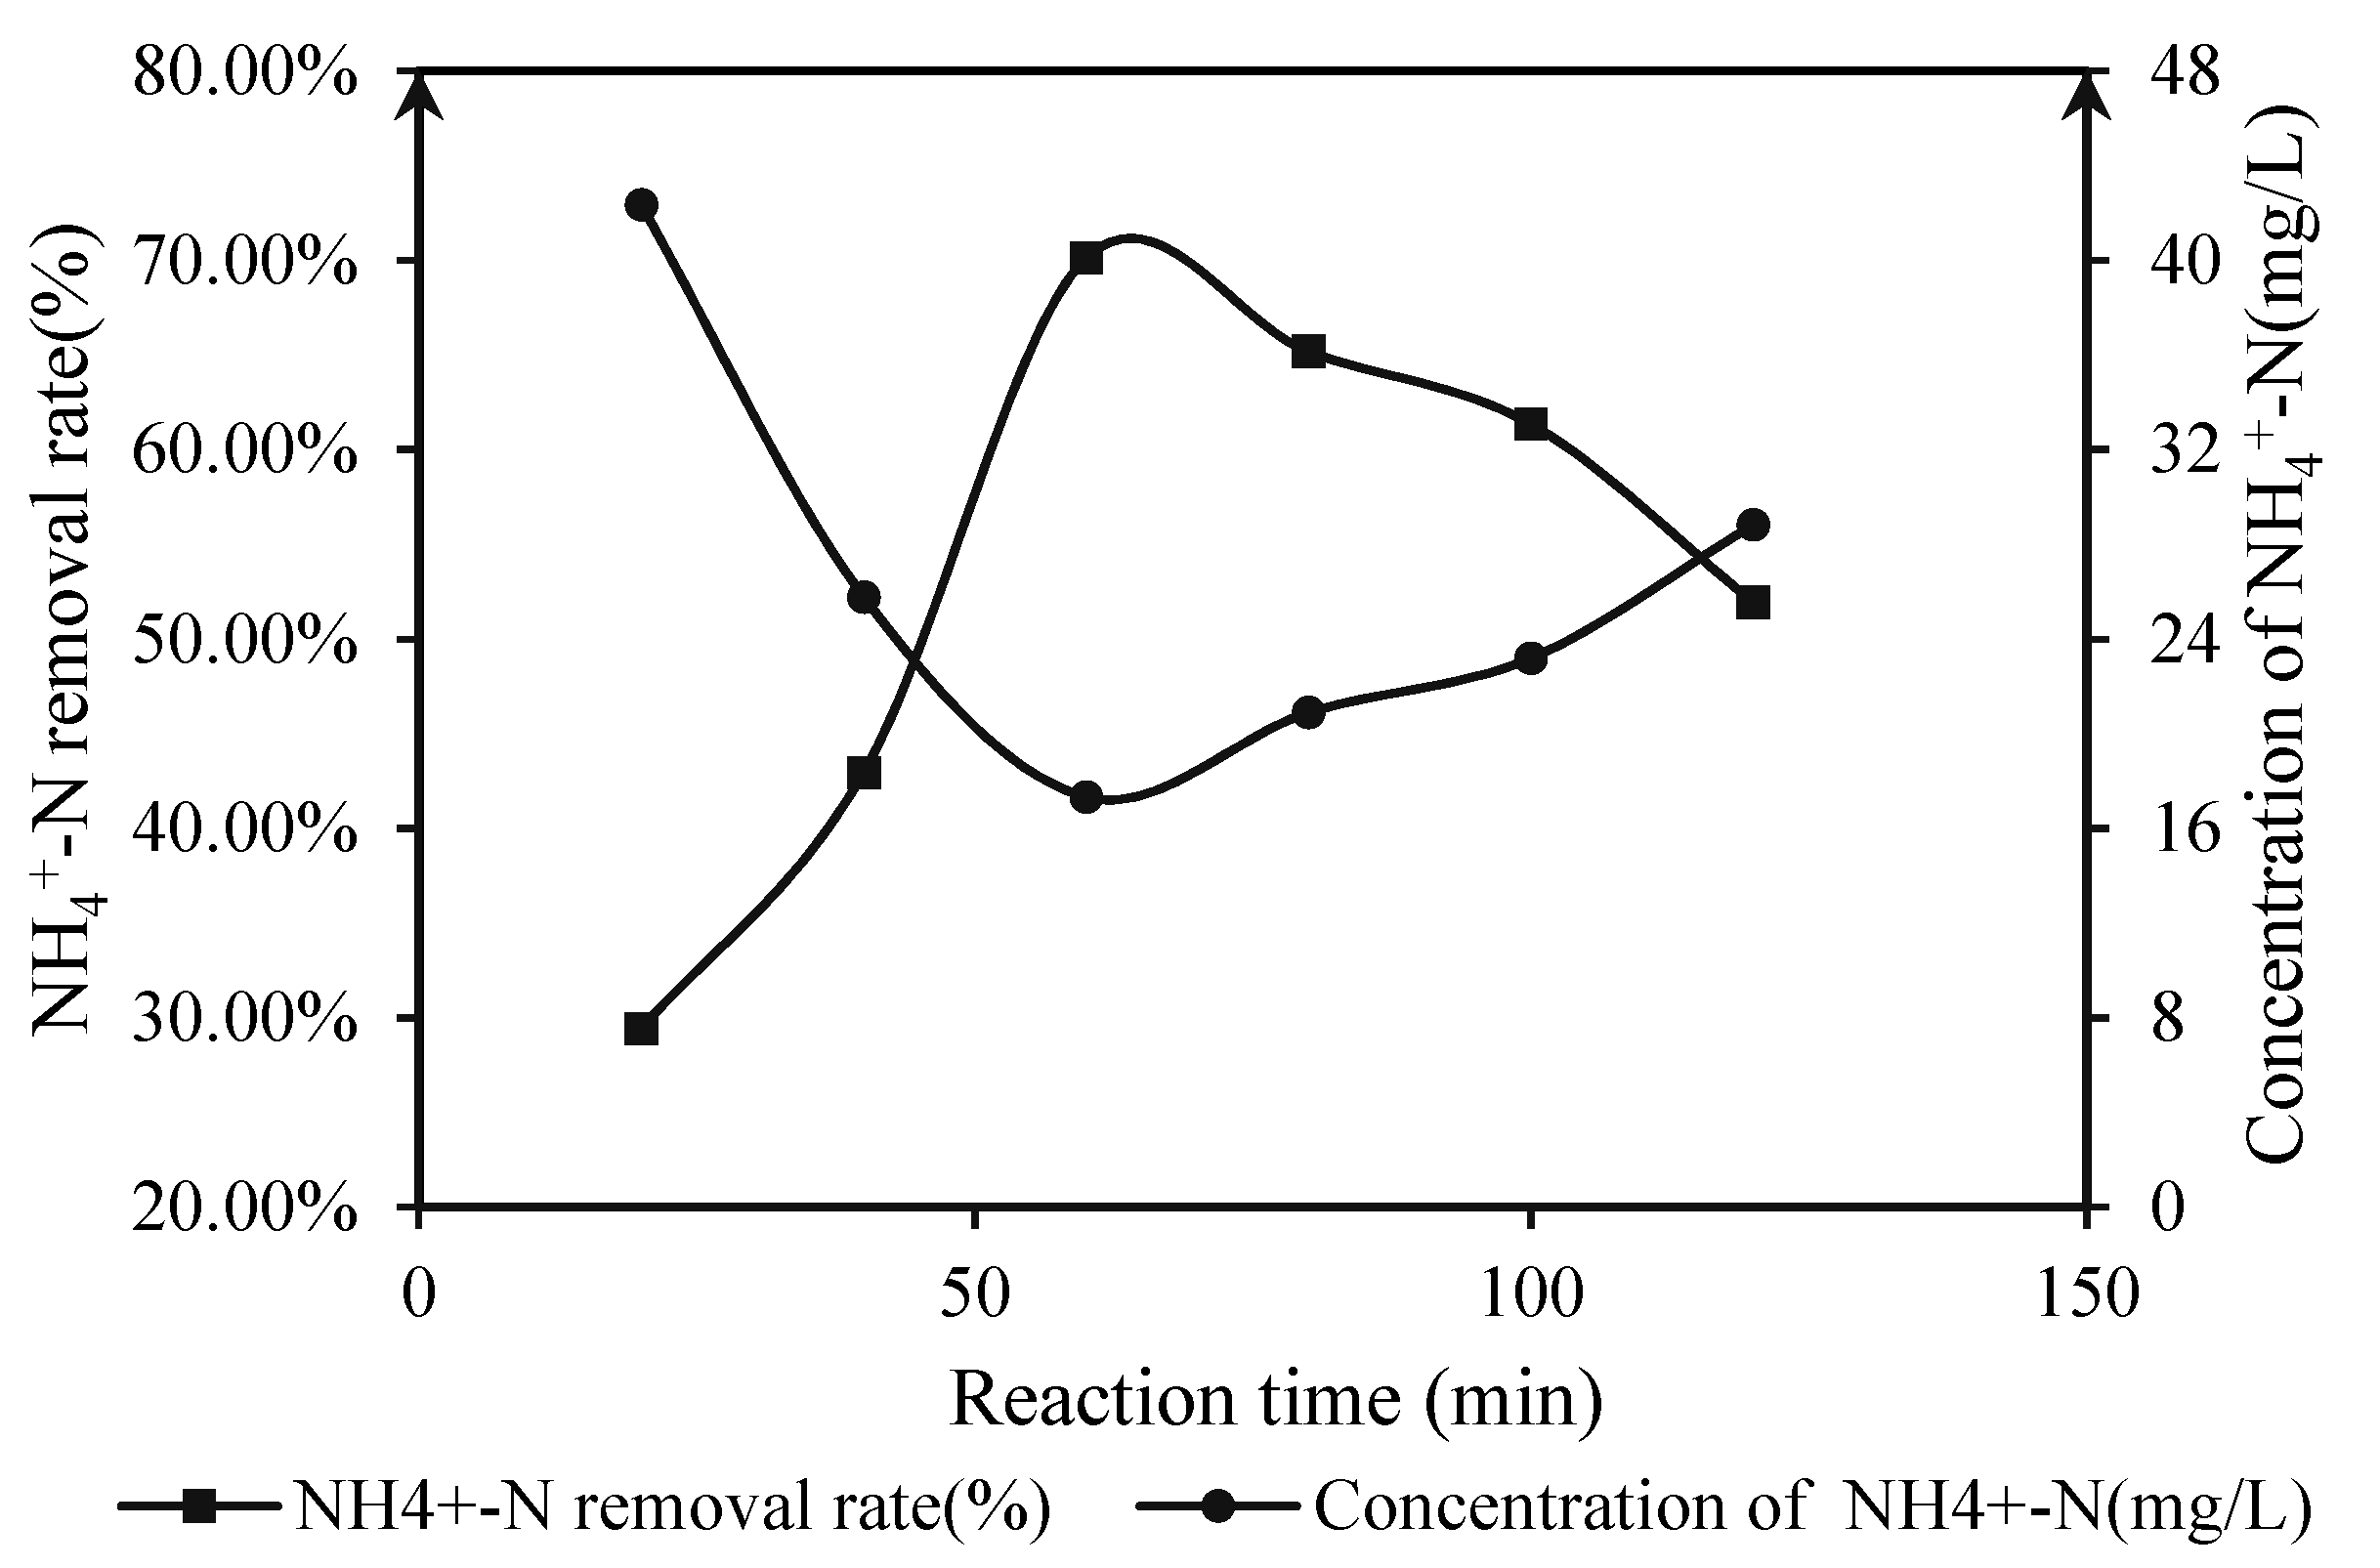
3.2.1. Under Dark Reaction Conditions

Under the dark reaction condition (the reaction was carried out in a closed and glassless environment with a sealed carton reactor), the initial concentration of ammonia nitrogen in the wastewater was controlled at 60 mg/L, the pH value of the water was adjusted to 8.0 and the mass ratio and the dosage of Chitin/ZnO was 2:3 and 0.5 g/L. The calcination temperature of Chitin/ZnO was 500 °C, and the ultraviolet photocatalysis time was 2 h. The experimental results are shown in Figure 7.
Under the dark reaction conditions, the composite the photocatalyst could not induce the formation of hydroxyl radicals with strong oxidation to achieve degradation as it lacked the excitation of the ultraviolet light on the semiconductor band. At the same time, under closed conditions, the composite photocatalyst lost the opportunity to fully interact with oxygen and to induce oxygen molecules to adsorb on the surface of the photocatalyst to capture photogenerated electrons in an illuminated atmosphere. Therefore, hydroxyl radical and superoxide anion radical would not be formed, and the concentration of NH4+–N in water increased consistently.

3.2.2. Under Natural Reaction Conditions

Under natural conditions (laboratory ventilation, no light and a room temperature environment [23]), the initial concentrations of NH4+–N were controlled at 60 mg/L, pH was 8.04 and the mixed mass ratio and the dosage were 2:3 and 0.5 g/L, respectively. The calcination temperature was 500 °C, and the ultraviolet photocatalysis lasted for 2 h. The experimental results are shown in Figure 8.
Figure 9 shows that the photocatalytic degradation efficiency can continuously increase within an hour in the absence of illumination (not sealed). The maximum degradation efficiency reached 70.11% at 60 min and then decreased with the rising reaction time. Compared with the degradation in the closed environment, the ventilation environment improved the removal rate of the target pollutants in a certain period of time and showed better removal effects. The reason may be that in an aqueous solution, ammonium ions (NH4+) can be partially ionized to ammonia and H+; ammonia molecules are oxidized by successive attacks of OH radicals [8,24,25].
NH 4 + + H 2 O NH 3 · H 2 O + H +
NH 3 . O H NH 2 + H 2 O . O H NH + H 2 O . O H N + H 2 O
NH x + NH y N 2 H x + y + H 2 O H + N 2 ( x , y = 0 , 1 , 2 )
NH 3 . O H HONH 2 . O H NO 2 NO 3
It can be observed that long-lived toxic substances are not formed in the treatment of NH4+. Even if NO2 is generated in the process, such ion could be quickly converted into harmless substances (N, H2O and N2) under photocatalytic conditions, mainly by the successive attacks of .OH and H+ radicals. Ammonia and ammonia molecules could be fully adsorbed on the surface of the catalyst when the photocatalyst with the optimum dosage was added to the water, thus reducing the overall NH4+–N concentration in the wastewater. With an increase of reaction time, the adsorption reaction of the catalyst reached equilibrium (the equilibrium time is about 1 h) and the concentration of NH4+–N in wastewater ought to be theoretically kept even. However, the reactor exposed to the air would absorb a small amount of NH4+–N molecules from the environment to some extent, leading to the concentration raised and the removal rate reduced.

3.2.3. Under UV Direct Irradiation Conditions
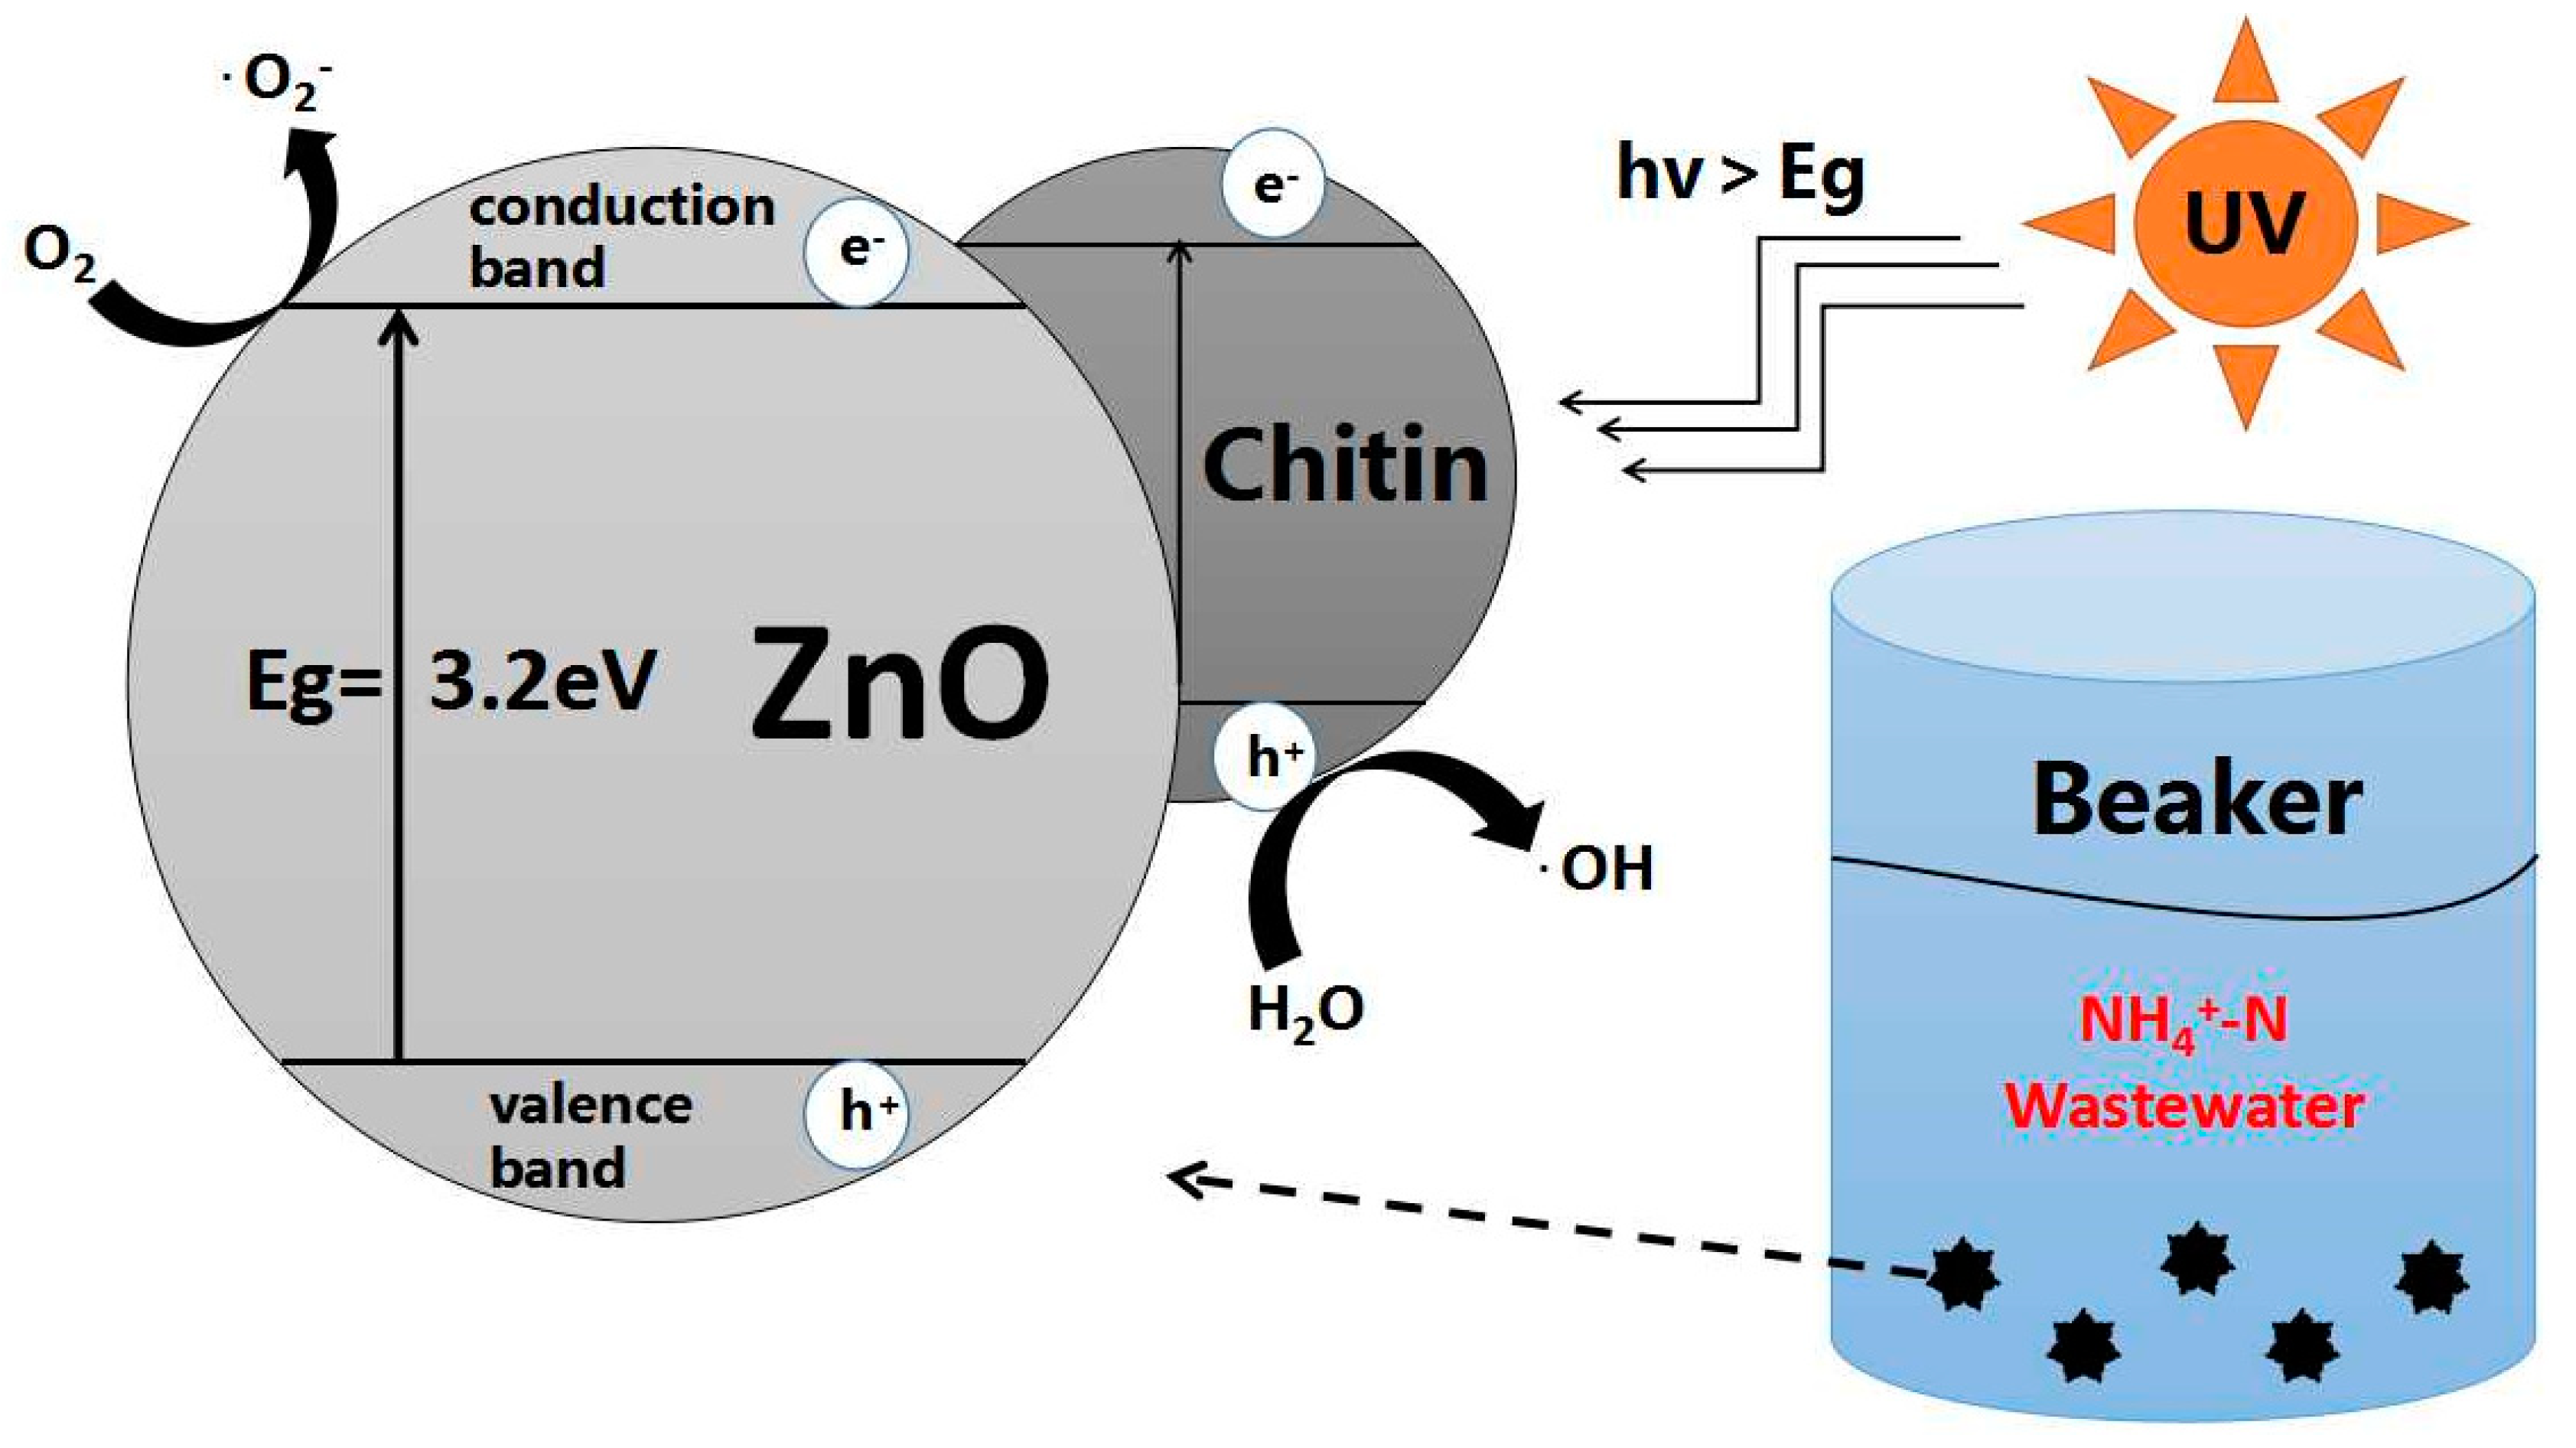
The reaction vessel and the built-in reaction liquid were under direct illumination. All experiments were carried out in the same conditions: initial NH4+–N concentration of 60 mg/L, pH of 8.12 and irradiation time of 2 h. The results are shown in Figure 9.
Compared with the experiment in the absence of illumination in Figure 9, when the reactor was directly irradiated by UV light, two simultaneous reactions were carried out in the wastewater solution, i.e., adsorption and catalytic oxidation. Because of the simultaneous reaction of two different properties, the reaction competitiveness of Chitin/ZnO was greatly enhanced. The comparison between Figure 9 and Figure 10 showed that the catalyst would not decrease the removal efficiency of NH4+–N after reaching equilibrium (1 h). The catalytic oxidation reaction, which played a leading role in the light condition, continued to accelerate the removal efficiency of the contaminant, reaching the peak value of 88.64% when the reaction time was 2 h. After 2 h, the efficiency and stability gradually declined.
In addition, the principle of the hydroxyl radical produced by a photocatalyst in a wastewater solution driven by UV light has been accepted by most scholars in the environmental field [26], which can be divided into two ways:
1)
When ZnO and other semiconductor particles are in close contact with the aqueous solution, the hydroxyl groups will form and adhere to the semiconductor surface. At the same time, owing to the valence band site of the semiconductor, ZnO is lower than the oxidation potential of the hydroxyl group [27]; the positively charged holes on the semiconductor surface will be first trapped by the surface hydroxyl radicals, producing hydroxyl radicals with strong oxidation via light irradiation:
ZnO + hv e + ZnO ( h + )
ZnO ( h + ) + H 2 O ZnO + H + + OH
ZnO ( h + ) + OH ZnO + · OH
2)
When the oxygen molecule exists in ammonia nitrogen wastewater, the photogenerated electron will be trapped by the oxygen molecule adsorbed on the surface of the Chitin–ZnO composite photocatalyst [28], resulting in a superoxide anion group and the hydroxyl radical:
O 2 + nZnO ( e ) nZnO + . O 2
O 2 + ZnO ( e ) + 2 H 2 O ZnO + H 2 O 2 + 2 OH
H 2 O 2 + ZnO ( e ) ZnO + OH + . O H
It proved that the catalytic oxidation performance of the Chitin/ZnO composite photocatalyst could be improved significantly under UV irradiation in comparison with two as-experiments without illumination. Photocatalysts, as a material activator, could convert ultraviolet light energy into the power needed for a series of chemical reactions, producing catalytic oxidation reactions [29]. Oxygen and water molecules in the vicinity of the catalysts are transformed into excited matter structures, forming free anions with strong oxidizing power, including hydroxyl radicals (OH) and superoxide radical anions (O2−) to remove pollutants from the water. Furthermore, the NH4+–N molecule could be directly converted into N2, which is friendly to the environment.

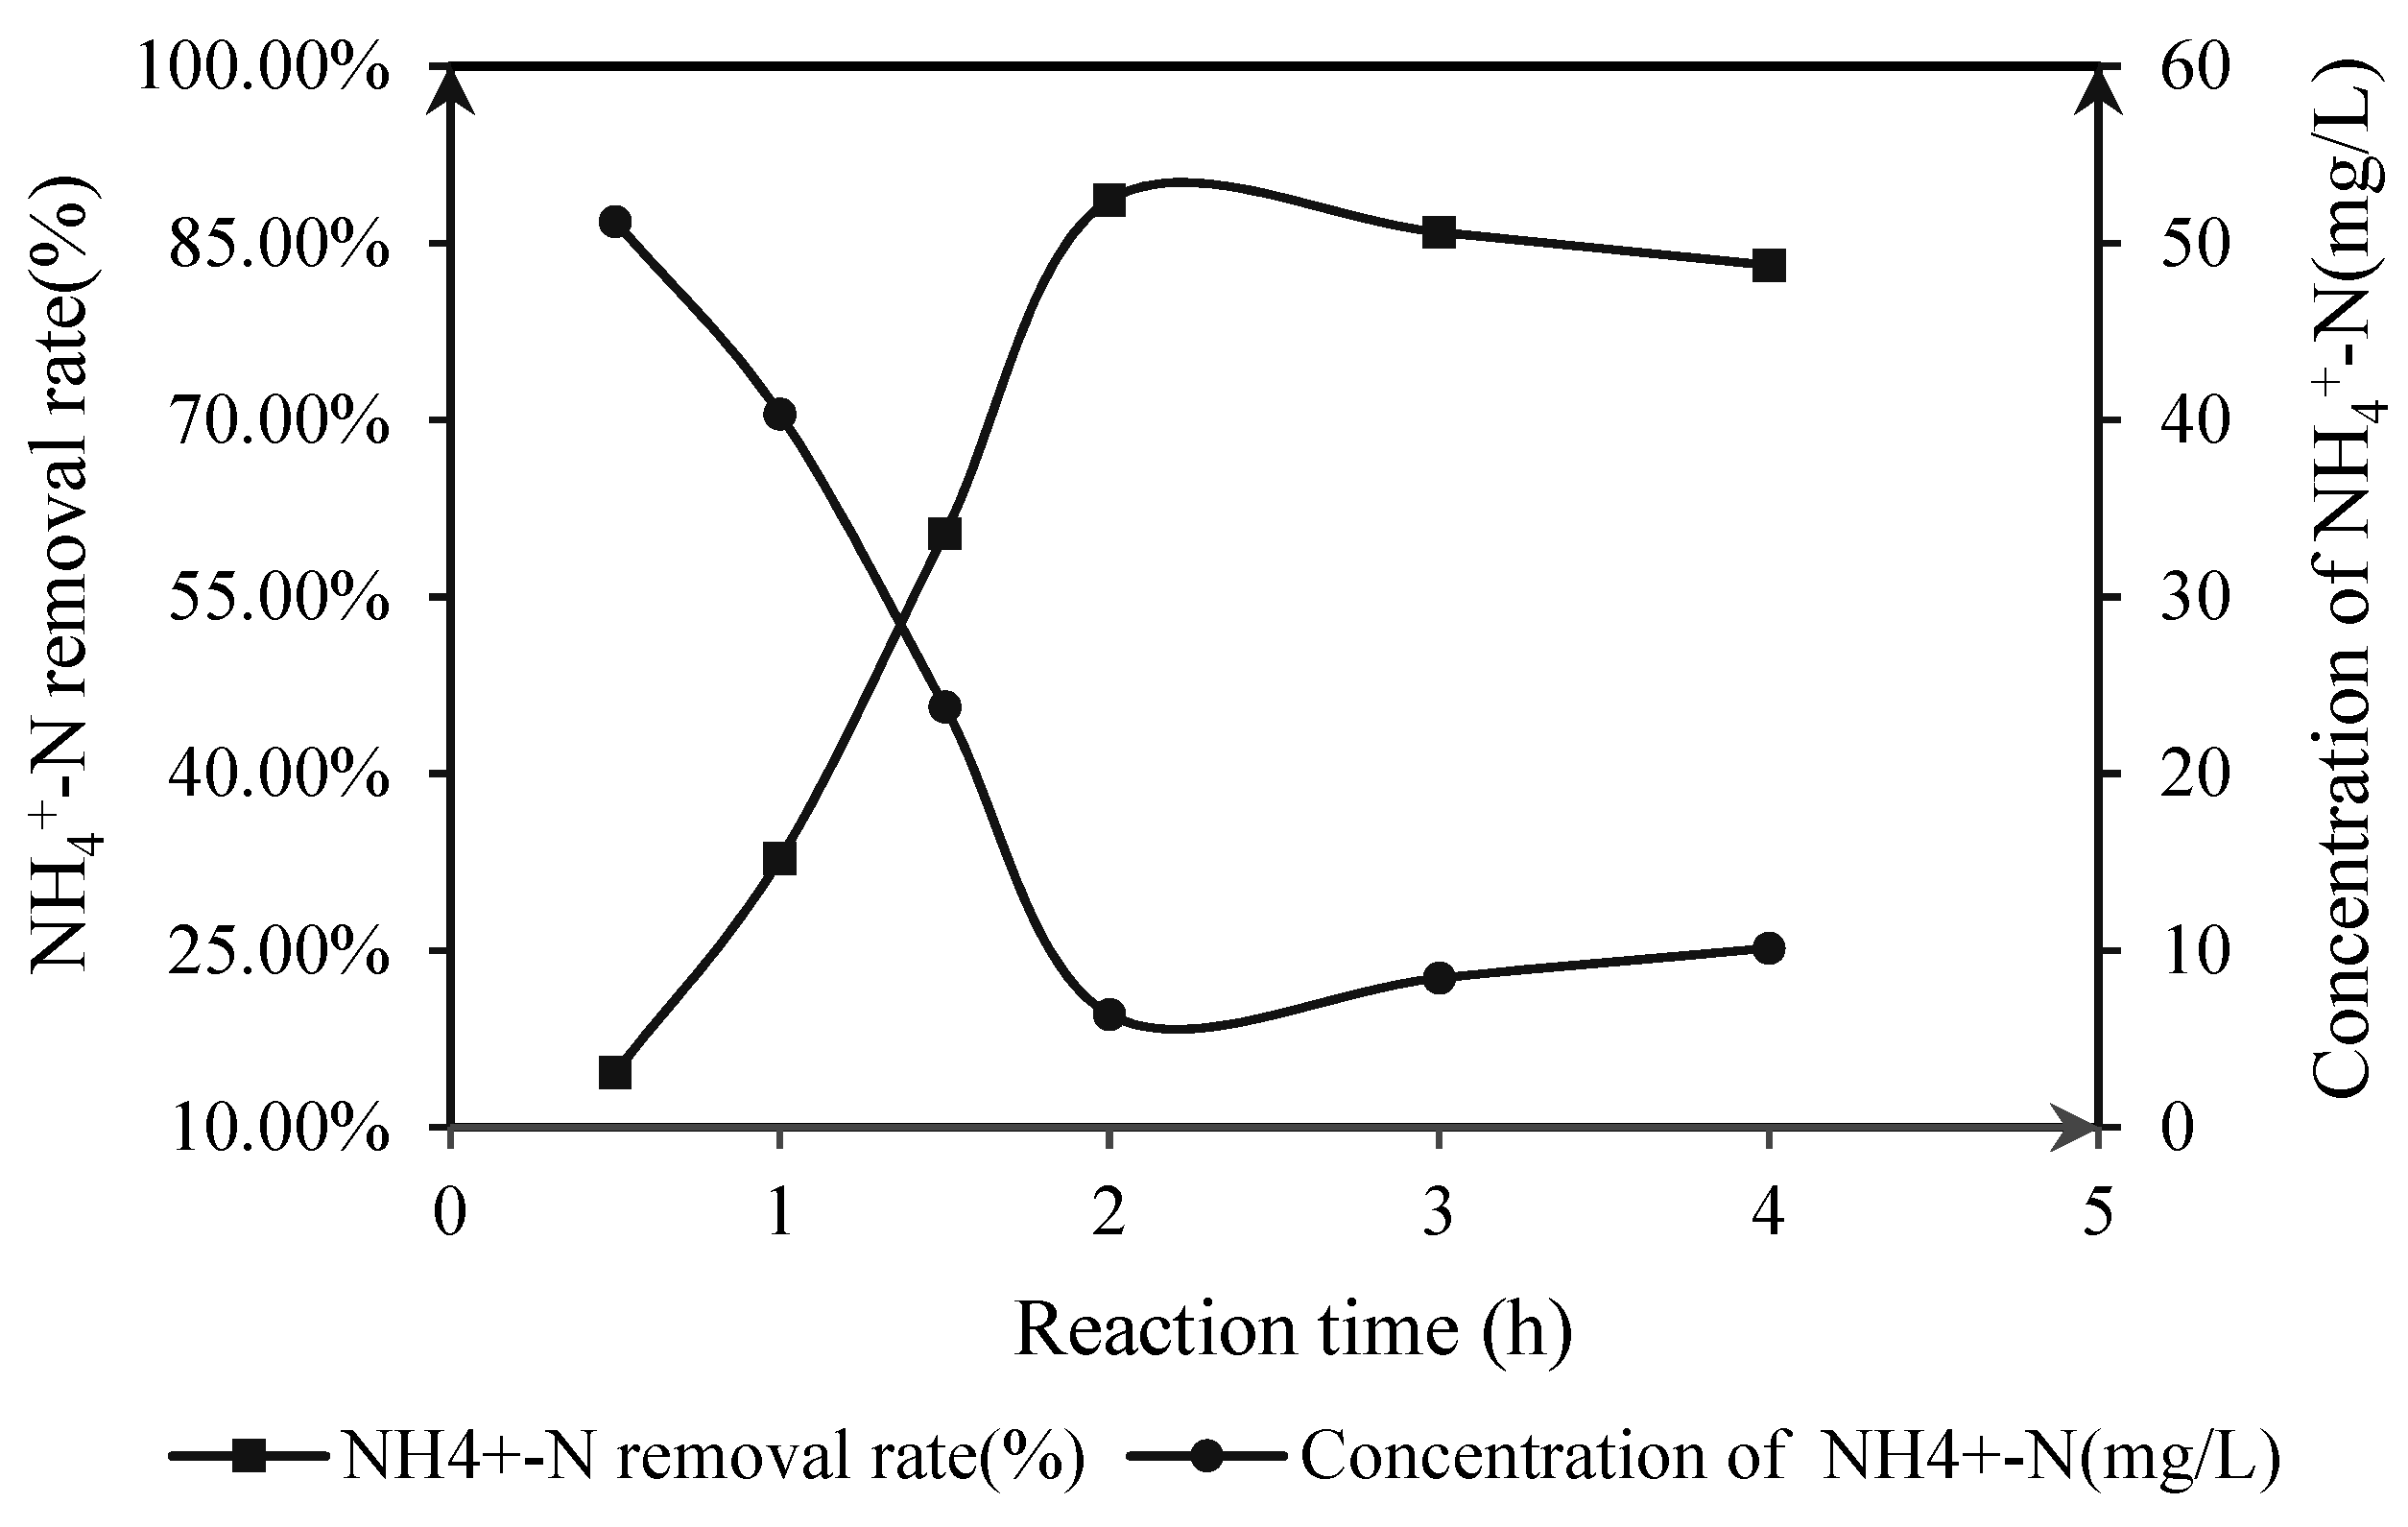
3.2.4. UV Irradiation after Adsorption

The composite photocatalyst was used to absorb contaminant NH4+–N for 1 h and then irradiated by ultraviolet light for 3 h under laboratory conditions. The experimental results are shown in Figure 10.
Figure 10 shows that the degradation efficiency of the ultraviolet photocatalytic oxidation reached its peak at 2 h, which was 90.12%. Compared with the figure for direct illumination (88.64%) in Figure 10, the efficiency of re-illumination after adsorption was slightly higher than that of direct illumination (less than 2%). However, considering the timing consumption, if the same removal time was given for 2 h, the optimal removal efficiency could be achieved via the way of direct illumination in this period, but the way of illumination after adsorption had poor time.

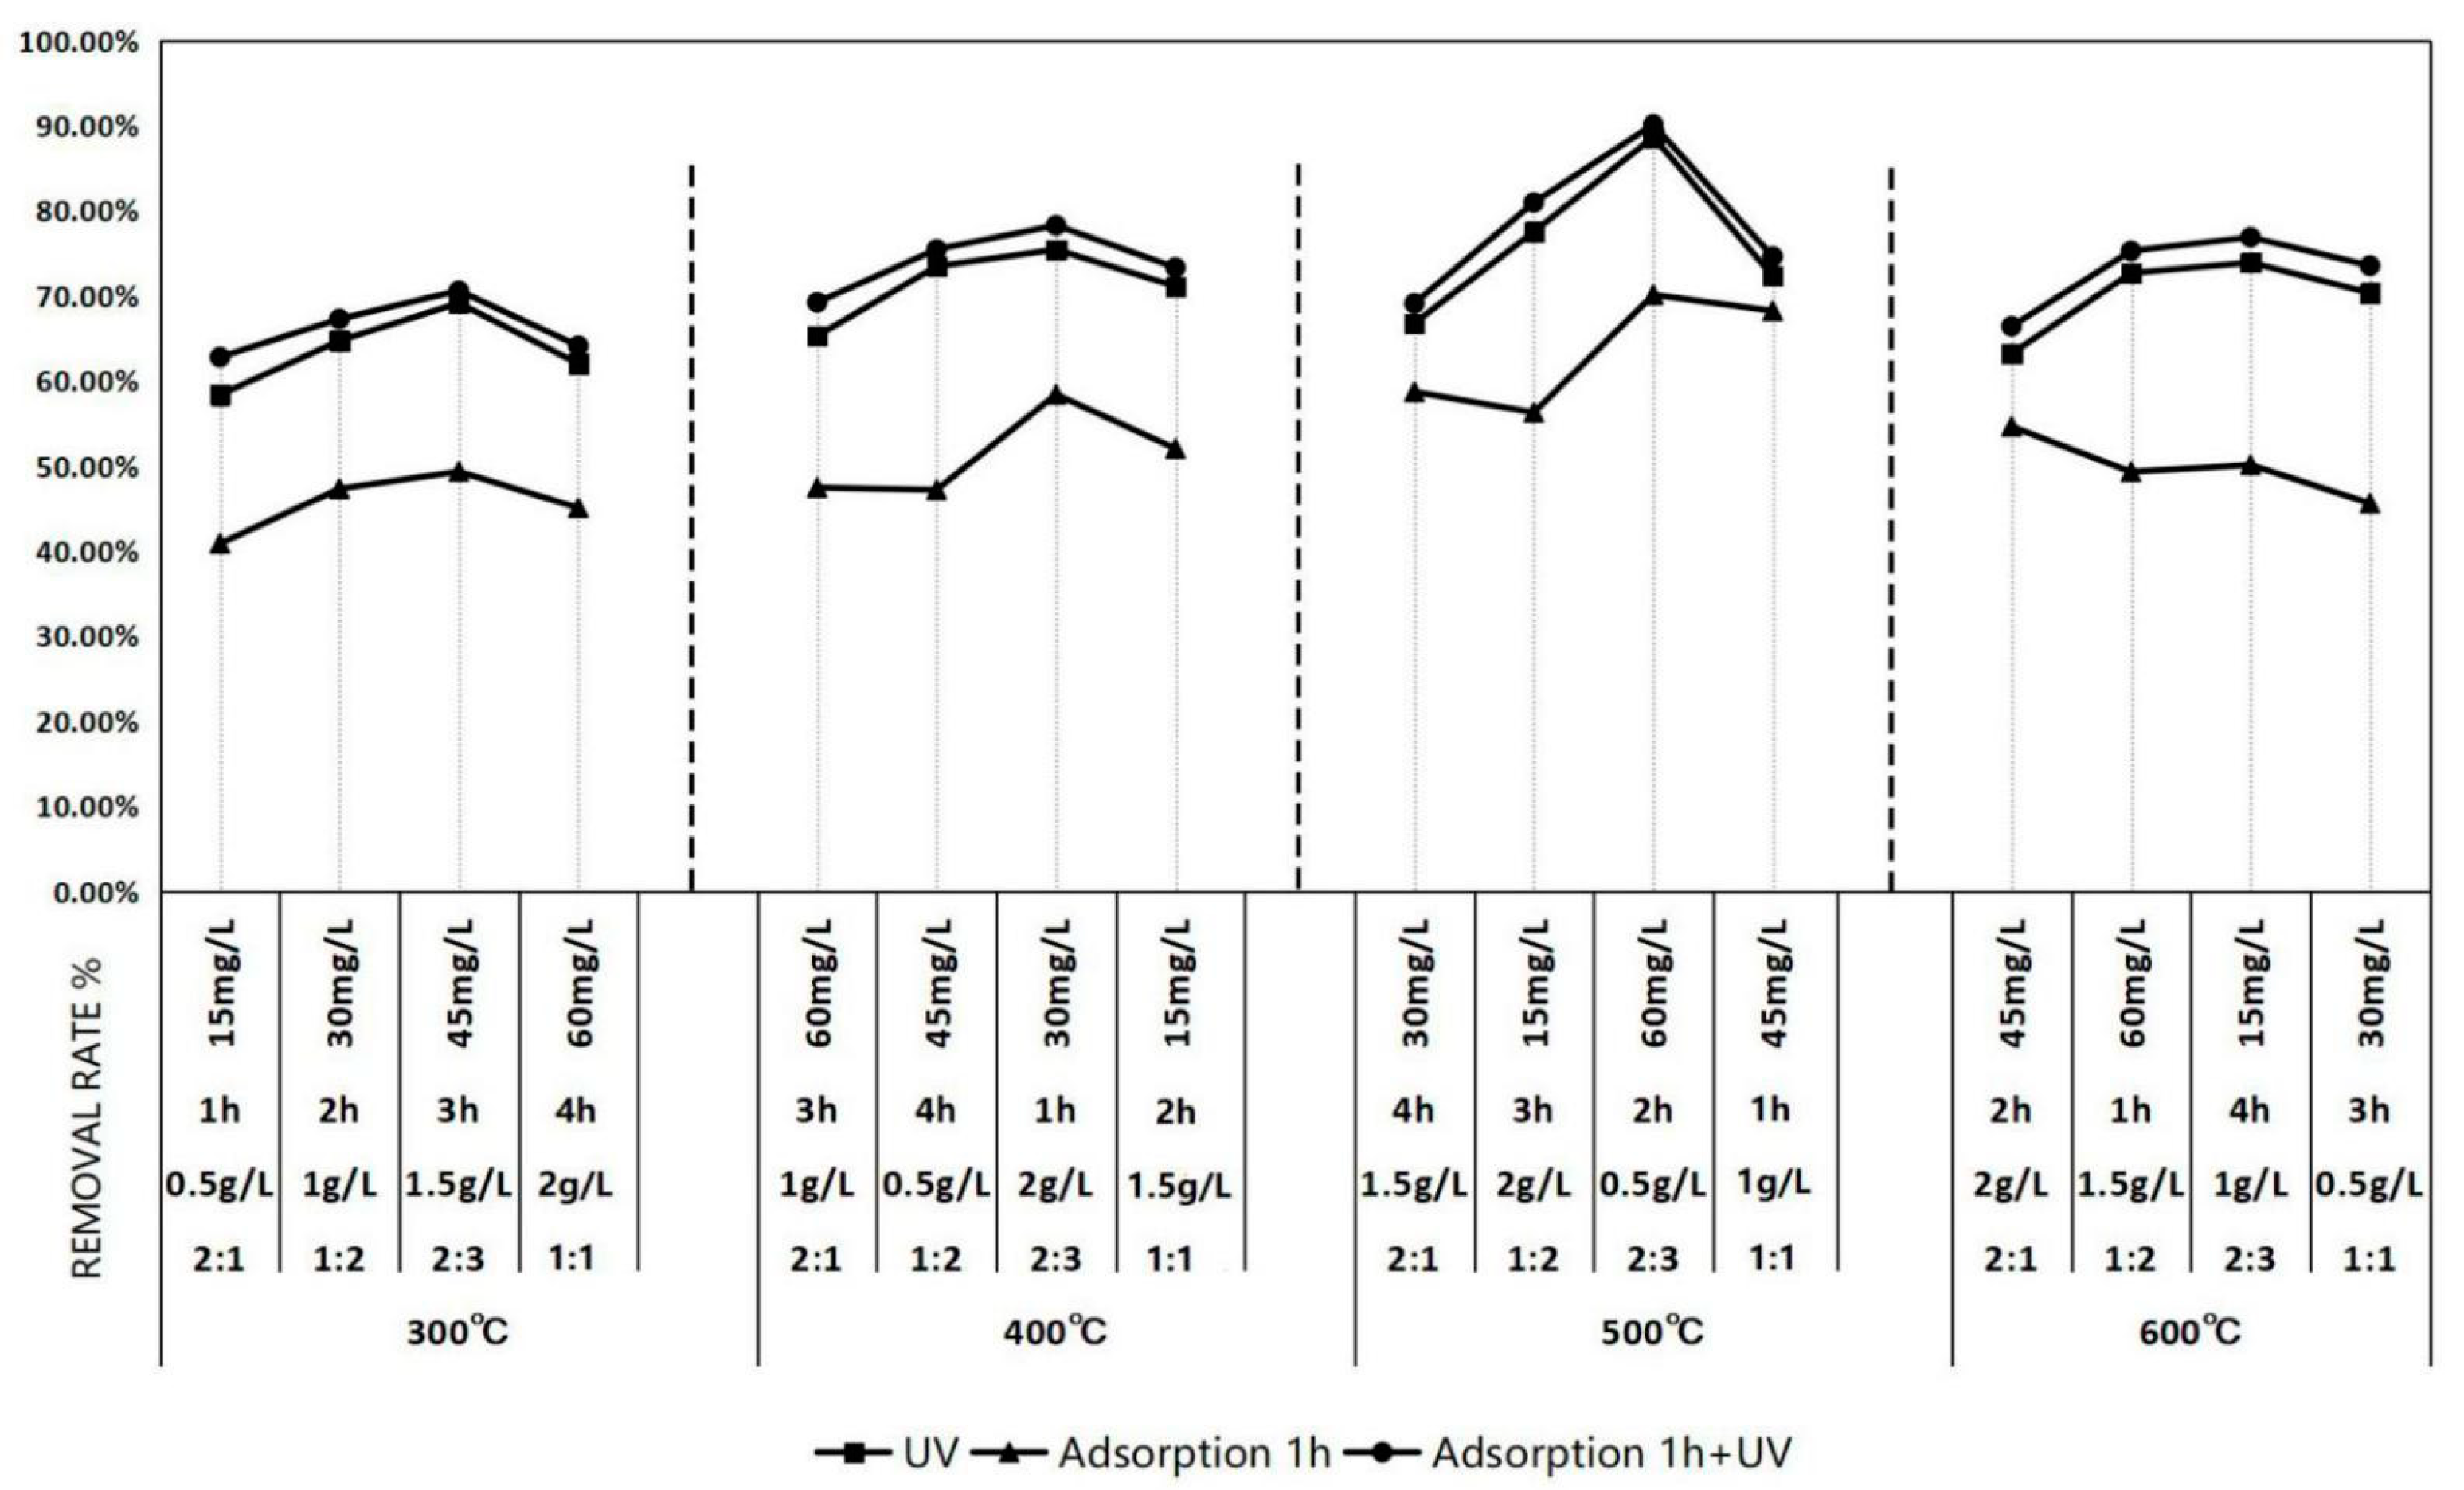
3.3. Orthogonal Test Under Ultraviolet Lamp Irradiation

3.3.1. Outline of the Orthogonal Test Scheme

A total of 16 orthogonal experimental groups were set up to study the optimal removal effect of the Chitin/ZnO composite photocatalyst under the condition of the cross action of various influencing factors, aiming to determine the optimum conditions for the degradation of NH4+–N in the simulated aquaculture wastewater.

3.3.2. Determination of the Optimal Reaction Conditions

The formula of variance analysis is as follows:
T = i = 1 n x i
C T = T 2 n
The sum of NH4+–N removal rates at all levels is k1j/2j/3j/4j, and its square k1/2/3/4j2.
The sum of squares of the column deviations is
S S j = 1 r i = 1 m K i j 2 C T
Among them, the total number of test levels is n, the number of test levels for each factor is m and the number of repeated tests for each level is r = n/m.
For the five factors and four levels, the 16 sets of orthogonal test results are shown in Table 3 and Figure 11.
The results showed that the optimum conditions for the degradation of NH4+–N pollutants in aquaculture wastewater were as follows: the initial concentration of NH4+–N in the simulated aquaculture wastewater solution was 60 mg/L, the mass ratio of chitin to ZnO was 2:3, the calcination temperature was 500 °C and the dosage was controlled at 0.1 g/L. The optimum removal efficiency was obtained by exposing the sample to UV light for 2 h in the laboratory. The direct illumination could reach 88.64%, while after 1 h adsorption and 2 h illumination, it could reach as high as 90.12%.
As shown in Table 3, the SSj value of the m(Chitin):m(ZnO) and the figure for the condition of adsorption for 1 h plus UV light were both the highest at 0.037 and 0.032, respectively, which indicated that the m(Chitin):m(ZnO) played the most critical role in the purification of simulated NH4+–N wastewater. Meanwhile, as the variance result (0.037) was greater than the latter (0.032), it is more conducive to improve the removal efficiency under the condition of direct UV light (adsorption and catalysis simultaneously). Similarly, the catalytic activity and adsorption performance were determined by the calcination temperature (SSj approximately 0.033) of the Chitin/ZnO in the muffle furnace, and the results illustrate the potential of using the calcination temperature and the UV-assisted thermal synthesis to shape and enhance the structure for wastewater treatment applications [20].
Three groups of parallel experiments were set up to verify the optimal experimental conditions. The results showed that the removal rate of ammonia nitrogen in the simulated wastewater could reach 85.44%, 87.60% and 88.73% respectively under direct illumination. The average removal rate of ammonia nitrogen under the optimal experimental conditions was 87.25%, and the highest removal rate of ammonia nitrogen was as high as 88.73%.

3.4. Characterization of Chitin/ZnO

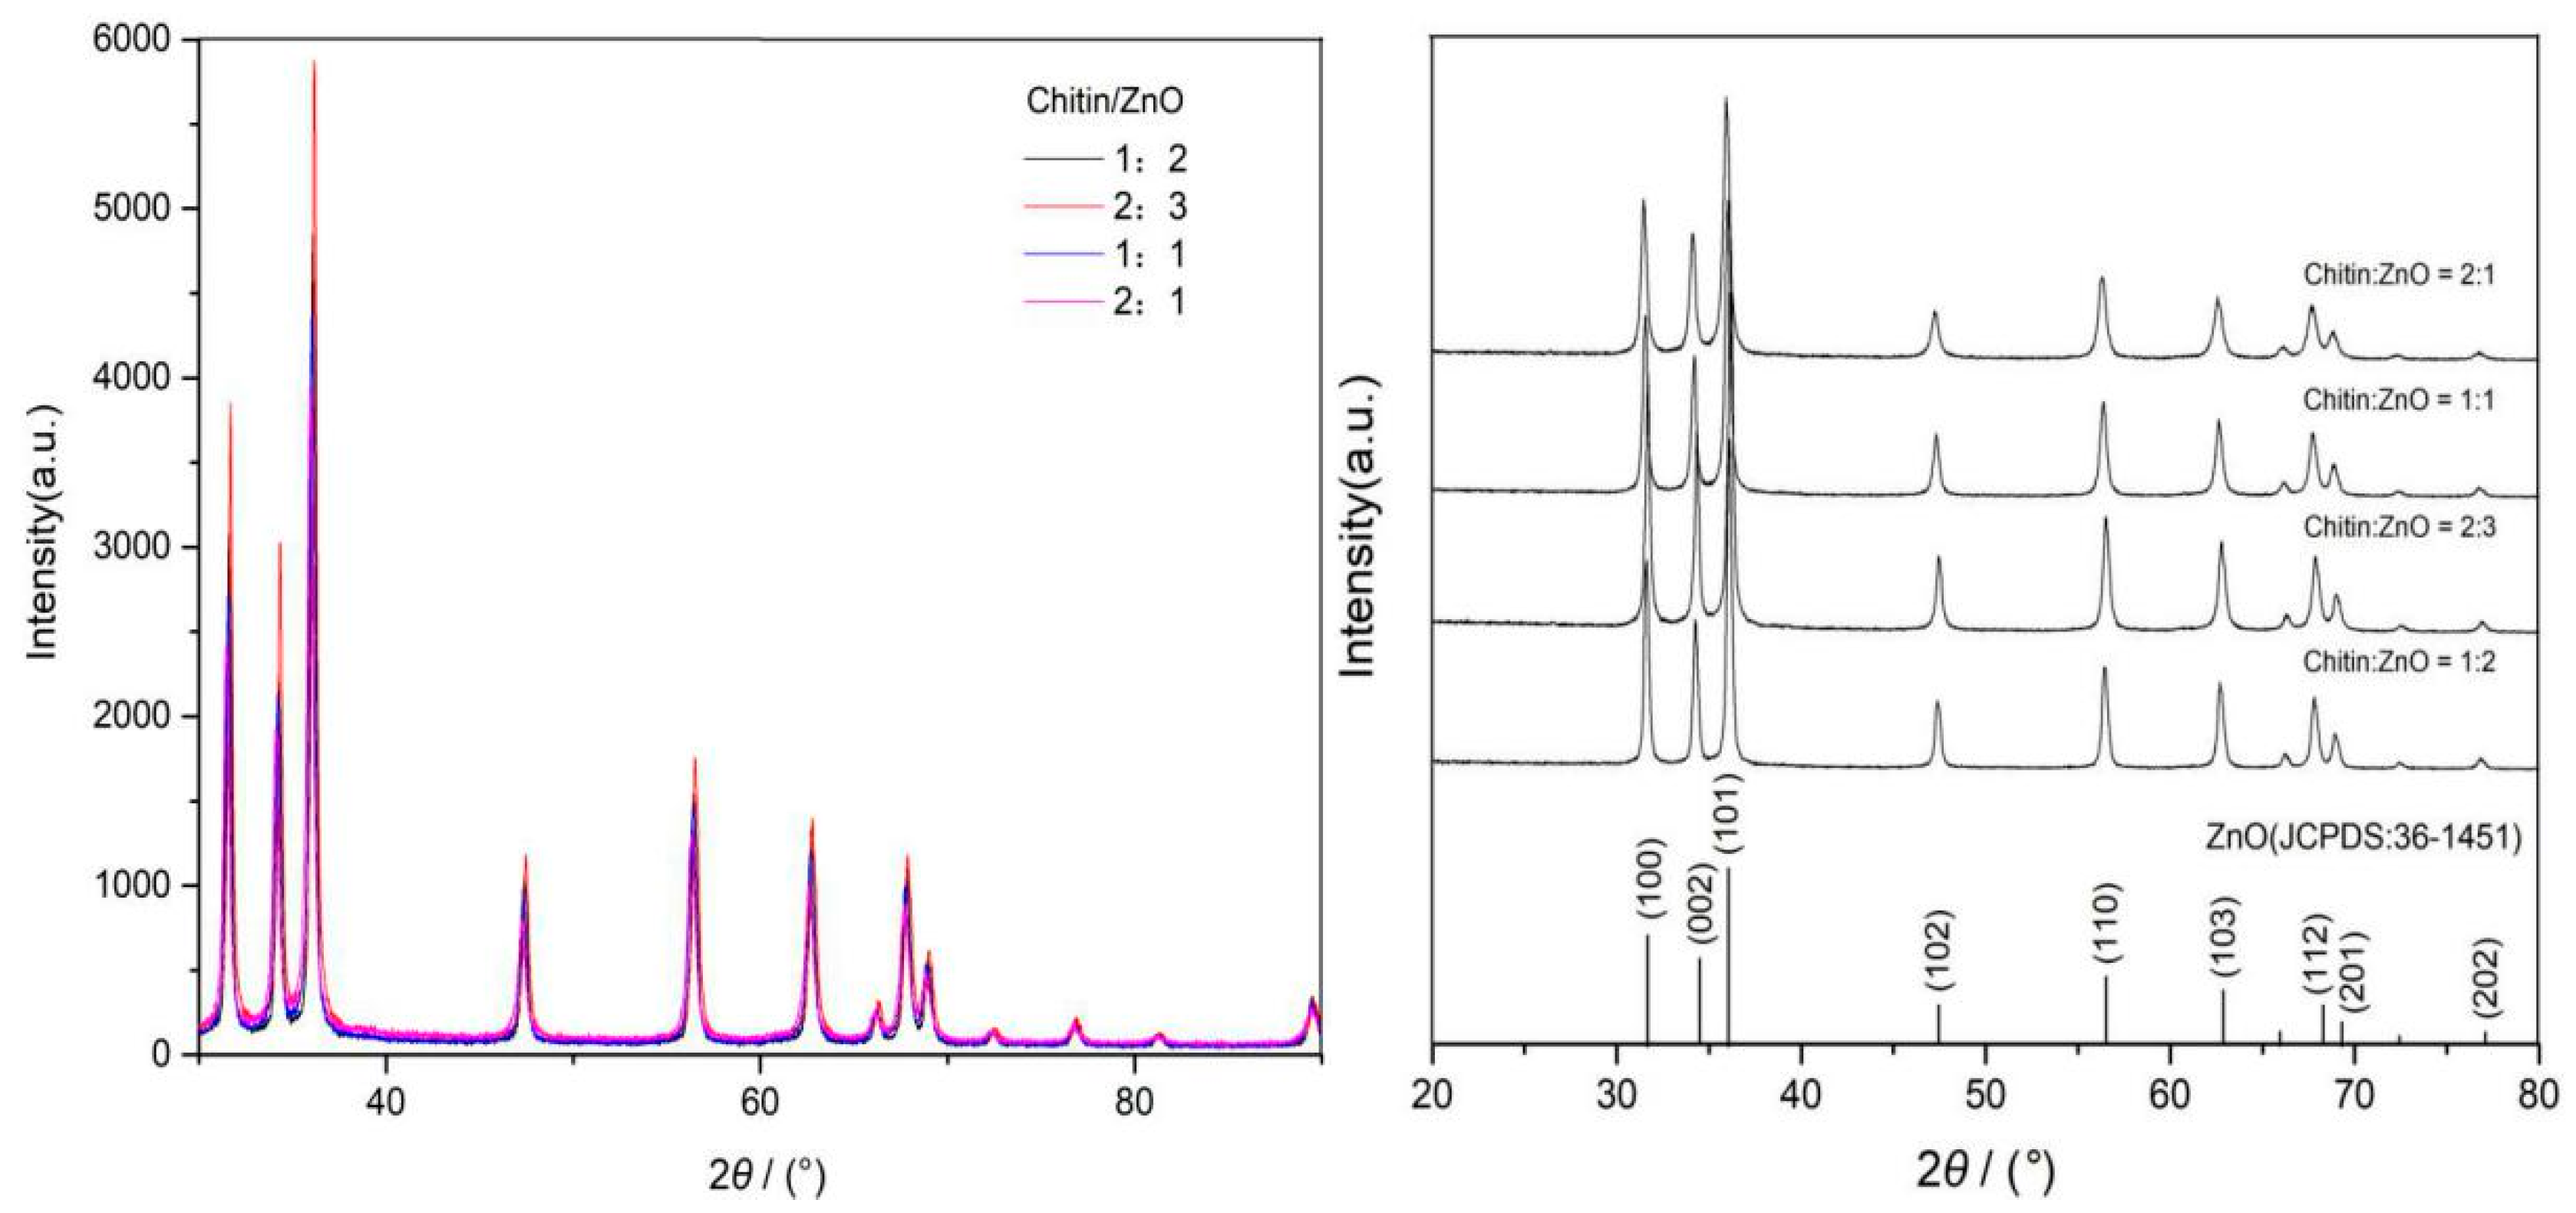
3.4.1. X-ray Diffraction Analysis of Chitin/ZnO

The X-ray diffraction patterns of four different Chitin/ZnO nanoparticles calcinated at 500 °C are shown in Figure 12. The diffraction peaks become sharp and significant when 2 theta are at 31.82° (100), 34.54° (002), 36.42° (101), 47.46° (102), 56.74° (110), 62.92° (103), 68.42° (112), 69.06° (201) and 78.82° (202) [30].
From the peak position, the diffraction peaks of the four kinds of Chitin/ZnO are slightly shifted toward a smaller angle with respect to the diffraction peaks of pure ZnO. As the doping ratio are at 2:3 (third curve in Figure 12), the peaks are indexed as 31.6832° (100), 34.3532° (002), 36.1649° (101), 47.4581° (102), 56.4790° (110), 62.7887° (103), 66.2845° (112), 68.9885° (201) and 76.8943° (202), which indicate the tendency of forming larger lattices of ZnO after doping with Chitin [31].
Overall, the diffraction peaks of the four samples were assigned to the (100), (002), (101), (110), (103) and (112) planes of the hexagonal wurtzite structure of ZnO with high crystallinity, and all appearing peaks are highly consistent with those of the hexagonal wurtzite structure of ZnO (JCPDS card 36-1451) [32].
It is noteworthy that the typical characteristic peaks of Chitin should theoretically appear at 10.67° and 19.99° [33], but there is no sign of Chitin characteristic peaks in the diffraction patterns. More than likely, Chitin in a highly dispersed state or at low concentrations would exceed the detection limit of XRD.

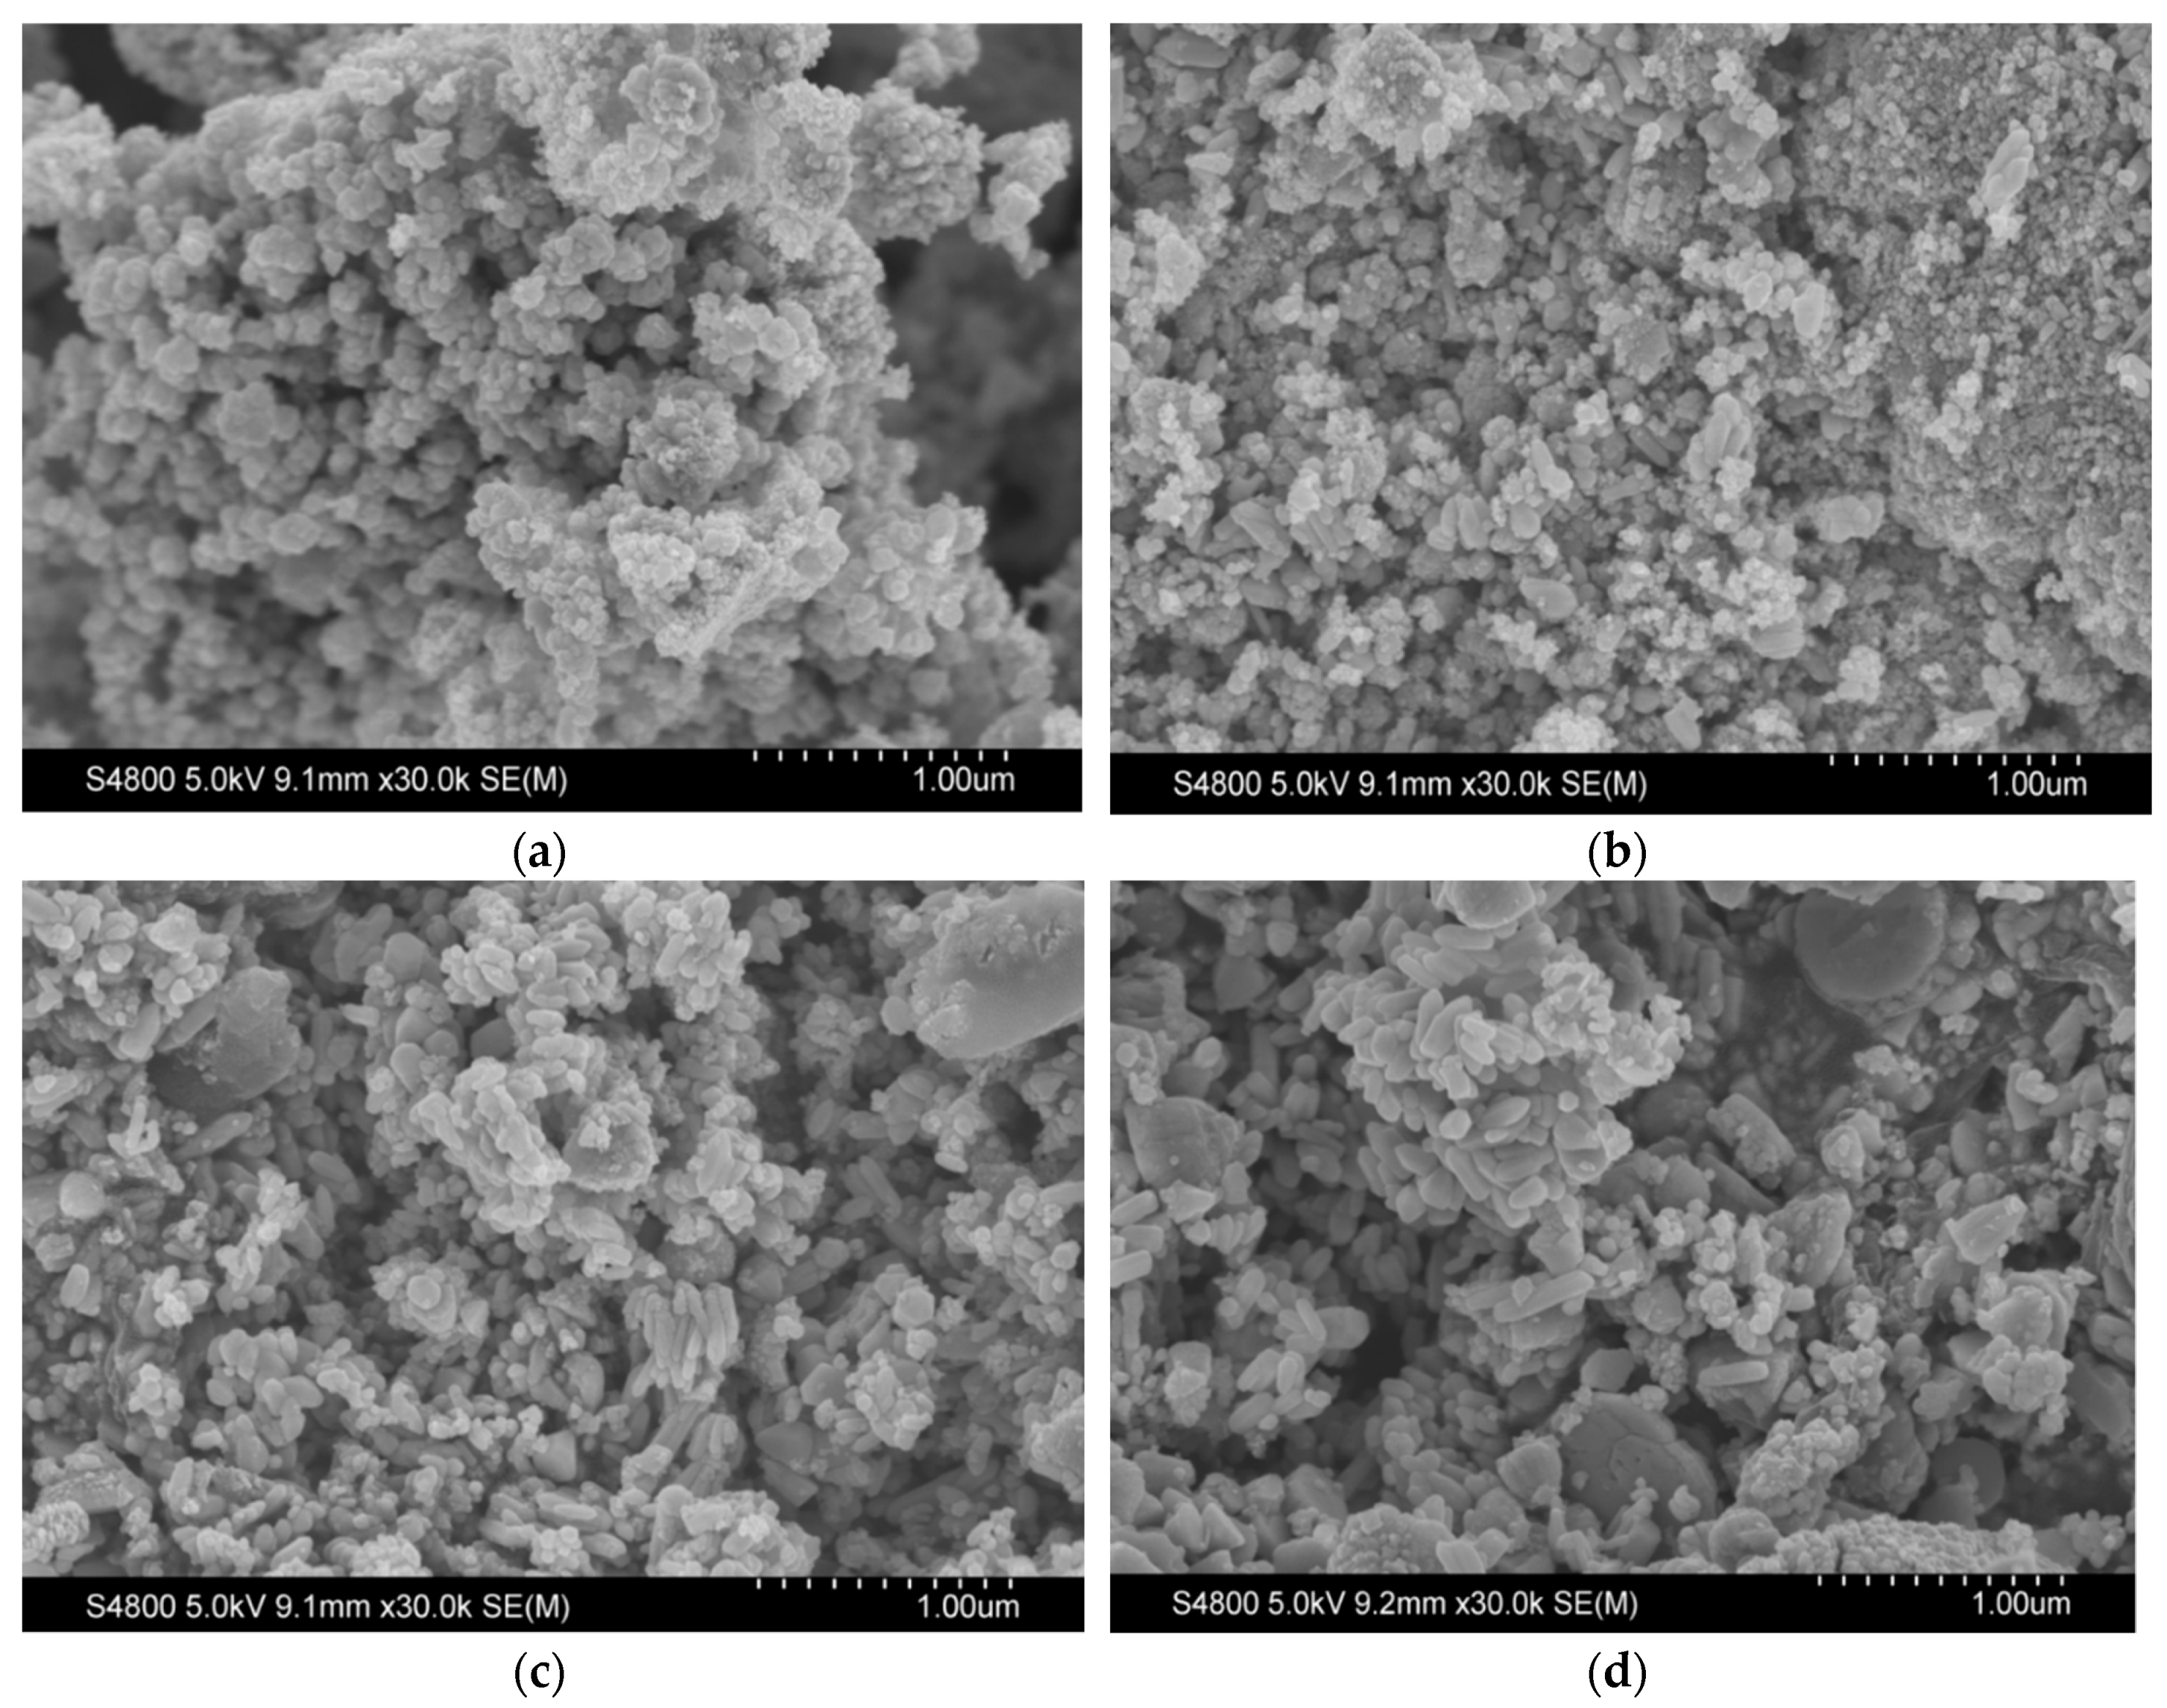
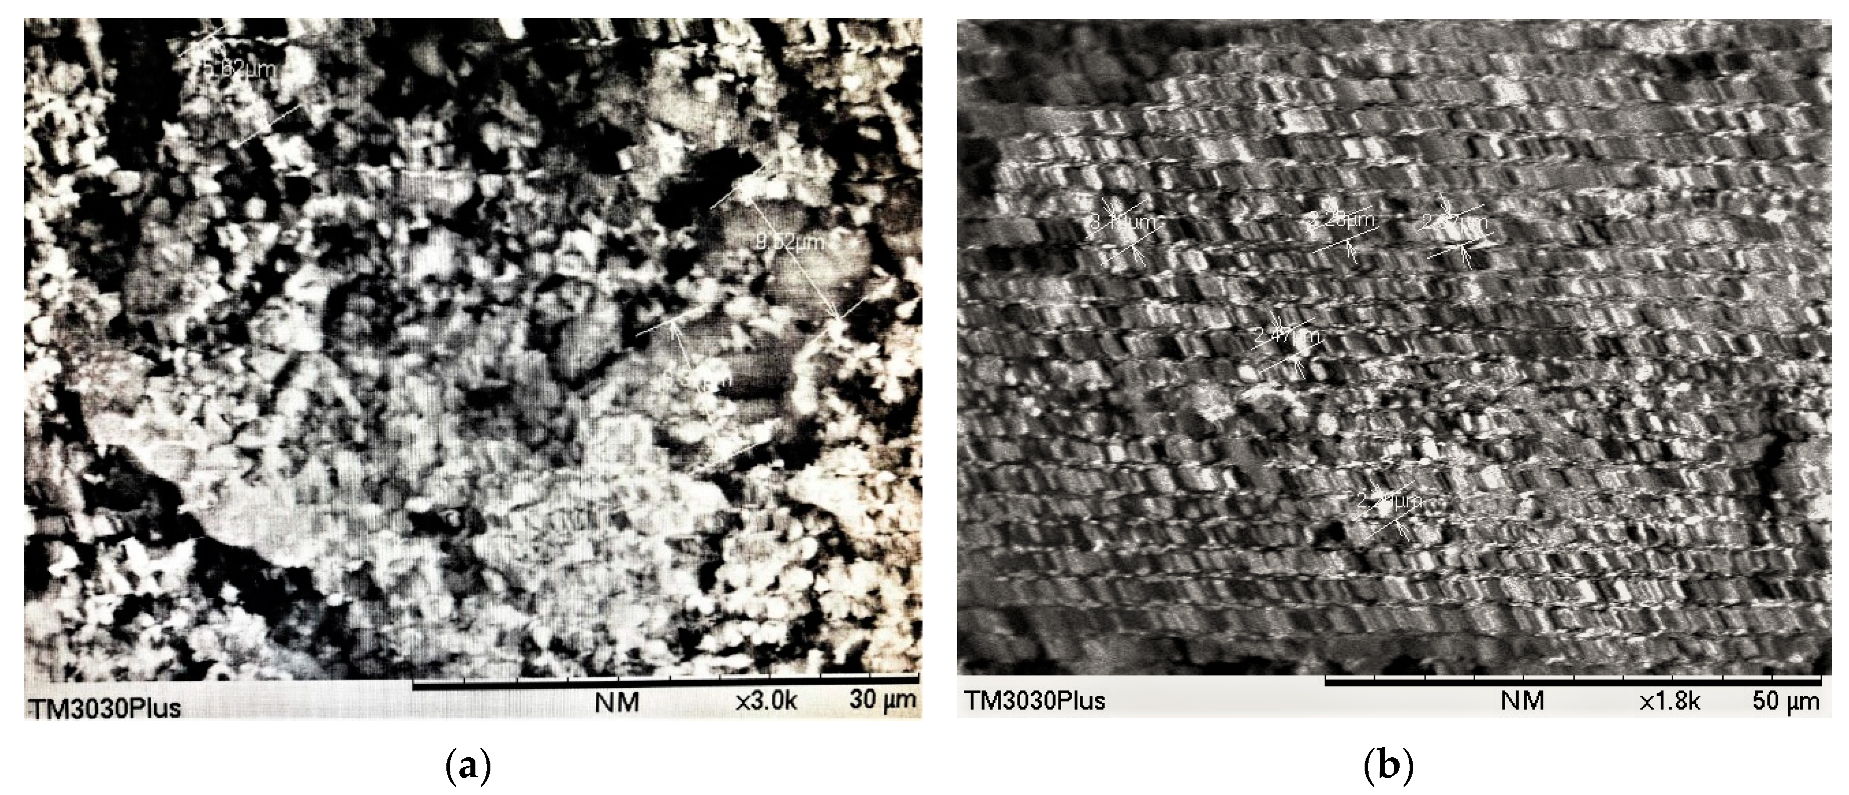
3.4.2. Scan Electron Microscope (SEM) Analysis of Chitin/ZnO

Morphology is an essential property to determining the effectiveness of the catalyst [29]. The SEM patterns of four Chitin/ZnO nanoparticles calcinated at 500 °C with different doping ratio and the patterns of Chitin/ZnO (2:3) calcinated at 400 and 500 °C were shown in Figure 13 and Figure 14, respectively.
Except for the slight agglomeration of the internal particles of ZnO doped with excessive chitin (Figure 13d), the internal structure of the four catalysts calcined at the same temperature is uniformly distributed and the particle gap is obvious (Figure 13a–c), which indicates that the proper amount of doped chitin would not destroy the internal structure of ZnO, and the results are consistent with the XRD analysis.
By comparing the catalysts calcined at different temperatures (Figure 14a,b), it was found that the increase of temperature would significantly alter the in-plane behavior of the crystal structure and the distribution ways [34]. In Figure 14a, the arrangement of the crystals is disordered and specific loose holes can be observed between nanoparticles.
From Figure 14b, the crystal bound morphology of ZnO calcinated at 500 °C and doped with a certain proportion of chitin (mixing mass ratio is 2:3) was observed as inclusion morphology, with well distribution and rule shape. Since Chitin and ZnO particles were highly similar in length–width ratio (average length 2.27 μm, average width 1.88 micron and ratio about 1.2) and had the distinct color difference (Chitin is black and ZnO is white), the overall array distribution is uniform. The arrangement and combination mode of Chitin/ZnO are closely adjacent. From left to right and up and down in turn, this black-and-white crystal particles have clear boundaries. At the same time, the agglomeration of the particles was not observed in SEM images under this condition, which indicated that this doping ratio would not destroy the overall structure of the ZnO lattice, resulting in morphological distortion or structural damage. Therefore, controlling the preparation conditions at 2:3 and 500 °C is beneficial to the loading of the Chitin in ZnO lattice.

4. Conclusions

We have fabricated the newly developed Chitin/ZnO composite photocatalyst powder with the cost-effective sol-gel method and investigated the potential of Chitin/ZnO degrading the key contaminants (NH4+–N) in the simulated aquaculture wastewater under ultraviolet irradiation. In comparison to the pure ZnO powder, proper doping of Chitin is the most conducive way to enhance the utilization of UV light and to broaden the responsive range of ZnO. It was observed that 88.64% of NH4+–N could be removed in a short period of irradiation time (2 h) when using a 0.5 g/L Chitin/ZnO (2:3) photocatalyst at a calcination temperature of 500 °C. Furthermore, the relationship between adsorption and the photocatalysis process was tested in this survey. After 1 h of adsorption, the illumination at 2 h can reach as high as 90.12%. In fact, the creation of Chitin/ZnO powder provides a practical approach for future research on the photocatalytic purification of aquaculture wastewater.
However, how to achieve catalyst cyclic utilization and to apply the proposed experimental design with the outperformed catalysts in the practical wastewater system for evaluation are issues that need to be further explored in the follow-up work. The experimental design in this paper could lay the foundation for the subsequent research.

Author Contributions

Conceptualization, X.L. and A.Y.; methodology, X.L. and A.Y.; validation, X.L., A.Y., G.H., X.Z., Y.Z., X.C. and E.M.; formal analysis, X.L.; investigation, X.L., A.Y.; data curation, X.L.; writing—original draft preparation, X.L.; writing—review and editing, X.L., A.Y., G.H., X.Z., Y.Z., X.C. and E.M.; supervision, A.Y., G.H.; funding acquisition, A.Y., G.H.

Funding

This research was supported by Xiamen Science and Technology Project (3502Z20179035), Key Laboratory of Environmental Biotechnology Open-ended Project (EBL2018002), the Natural Sciences Foundation (51520105013, 51679087), the National Key Research and Development Plan (2016YFC0502800, 2016YFA0601502), the 111 Program (B14008) and the Natural Science and Engineering Research Council of Canada.

Conflicts of Interest

The authors declare no conflict of interest.

References

  1. Liu, L.F.; Zhang, Y.; Yang, F.L.; Chen, G.; Jimmy, C.Y. Simultaneous photocatalytic removal of ammonium and nitrite in water using Ce3+–Ag+ modified TiO2. Sep. Purif. Technol. 2009, 67, 244–248. [Google Scholar] [CrossRef]
  2. Publicity and Education Center of the Ministry of Environmental Protection; Environmental Protection Foreign Cooperation Center of the Ministry of Environmental Protection. Persistent Organic Pollutants and Their Prevention and Control; China Institute of Environmental Management Cadres, Ed.; China Environment Press: Beijing, China, 2014; Volume 11, p. 152.
  3. Fang, S.Q.; Hu, X.F.; Wu, H.Y. Technology and Application of Aquaculture Wastewater Treatment. Technol. Equip. Environ. Pollut. Control 2004, 5, 51–55. [Google Scholar]
  4. Zhou, S.L.; Huang, T.L.; Zhang, H.H. Screening of poor nutrition aerobic denitrifying bacteria and characteristics of nitrogen removal from source water. J. Environ. Eng. 2016, 10, 2955–2961. [Google Scholar]
  5. Su, B.T.; Hu, C.L.; Zuo, X.W. Preparation of nanometer zinc oxide and its photocatalytic activity in sunlight. Acta Inorgan. Chem. 2010, 26, 96–100. [Google Scholar]
  6. Jin, X.J.; Yu, X.C.; Wu, Y.Y.; Shang, X.L.; Yin, D.N.; Xue, G.H. Preparation of nano-SnO2 photocatalyst and its application in aquaculture wastewater treatment. Oceanography 2015, 33, 64–69. [Google Scholar]
  7. Yu, X.C.; Shang, X.L.; Ji, Q.Y.; Zhang, J.; Qi, X.Y.; Jin, X.J. Photocatalytic performance of nano-Ce/SnO2 in aquaculture wastewater treatment. Mar. Environ. Sci. 2016, 35, 501–506. [Google Scholar]
  8. Shavisi, Y.; Sharifnia, S.; Mohamadi, Z. Solar-light-harvesting degradation of aqueous ammonia by CuO/ZnO immobilized on pottery plate: Linear kinetic modeling for adsorption and photocatalysis process. J. Environ. Chem. Eng. 2016, 4, 2736–2744. [Google Scholar] [CrossRef]
  9. Zhang, X.H.; Lu, L.C.; Yu, J.S. Preparation of modified nano ZnO/chitosan composite membrane and its adsorption on methyl orange. J. Yibin Univ. 2016, 16, 103–107. [Google Scholar]
  10. Farzana, M.H.; Meenakshi, S. Visible light-driven photoactivity of zinc oxide impregnated chitosan beads for the detoxification of textile dyes. Appl. Catal. A Gen. 2015, 503, 124–134. [Google Scholar] [CrossRef]
  11. Mao, X.C. Application of Chitosan and Nano-ZnO Composites in Antibacterial Packaging. Printed J. 2017, 7, 54–56. [Google Scholar]
  12. Diao, W.W.; An, X.H.; Wang, X.W.; Li, L.T. Isolation and identification of ammonia-degrading bacteria from mixed culture ponds of shrimp and crab. Aquat. Sci. 2015, 34, 83–88. [Google Scholar]
  13. Yang, Y.; Guan, F.; Zhang, S.M.; Qiu, J.K. Aquaculture wastewater treatment technology and research progress. Contemp. Chem. Res. 2017, 8, 73–75. [Google Scholar]
  14. Ning, G.H.; Lin, H.J. Preparation and Characterization of Chitosan/ZnO Composites. J. Sichuan Norm. Univ. 2011, 34, 864–868. [Google Scholar]
  15. Zhang, W.Q.; Zhu, Y. Advances in the study on the harm of ammonia nitrogen in aquaculture water and its detection methods. J. Environ. Hyg. 2012, 2, 324–327. [Google Scholar]
  16. Shi, Z.F.; Shen, Z.G.; Wu, Y.D.; Wang, J.C.; Yang, L.L. Photocatalytic degradation of organic compounds in shrimp wastewater and their sterilization. J. Sun Yat-sen Univ. 2009, 48, 60–64. [Google Scholar]
  17. Song, K.S.; Yu, X.C.; Hu, D.D. Photocatalytic Degradation of Ammonia Nitrogen in Aquaculture Wastewater by Using Nano-ZnO. Adv. Mater. Res. 2013, 2115, 564–568. [Google Scholar] [CrossRef]
  18. Sadeghzadeh-Attar, A. Efficient photocatalytic degradation of methylene blue dye by SnO2 nanotubes synthesized at different calcination temperatures. Sol. Energy Mater. Sol. Cells 2018, 183, 16–24. [Google Scholar] [CrossRef]
  19. Nandi, P.; Das, D. Photocatalytic degradation of Rhodamine-B dye by stable ZnO nanostructures with different calcination temperature induced defects. Appl. Surf. Sci. 2019, 465, 546–556. [Google Scholar] [CrossRef]
  20. Nasirian, M.; Bustillo-Lecompte, C.F.; Mehrvar, M. Photocatalytic efficiency of Fe2O3/TiO2 for the degradation of typical dyes in textile industries: Effects of calcination temperature and UV-assisted thermal synthesis. J. Environ. Manag. 2017, 196, 487–498. [Google Scholar] [CrossRef]
  21. He, L.H.; Song, R.; Liu, F.J. Preparation and characterization of ZnO/Chitosan composite. J. Zhengzhou Light Ind. Inst. 2008, 23, 16–20. [Google Scholar]
  22. Yu, X.C.; Zhu, P.F.; Zhang, M.; Guo, J.Y.; Zheng, X. Study on the Photocatalytic Degradation of Ammonia Nitrogen in Aquaculture Wastewater by Sn4+-Doped Nano-TiO2 under UV Irradiation. Adv. Mater. Res. 2011, 347, 2351–2355. [Google Scholar] [CrossRef]
  23. Ali, W.; Ullah, H.; Zada, A.; Alamgir, M.K.; Muhammad, W.; Ahmad, M.J.; Nadhman, A. Effect of calcination temperature on the photoactivities of ZnO/SnO2 nanocomposites for the degradation of methyl orange. Mater. Chem. Phys. 2018, 213, 259–266. [Google Scholar] [CrossRef]
  24. Altomare, M.; Selli, E. Effects of metal nanoparticles deposition on the photocatalytic oxidation of ammonia in TiO2 aqueous suspensions. Catal. Today 2013, 209, 127–133. [Google Scholar] [CrossRef]
  25. Ou, H.H.; Hoffmann, M.R.; Liao, C.H.; Hong, J.H.; Lo, S.L. Photocatalytic oxidation of aqueous ammonia over platinized microwave-assisted titanate nanotubes. Appl. Catal. B 2010, 99, 74–80. [Google Scholar] [CrossRef]
  26. Jin, X.J.; Liu, J.C.; Zhang, T.; Li, Y.; Wang, P.; Cheng, R.C. Photocatalytic degradation of ammonia nitrogen in marine aquaculture wastewater by nano-Fe2O3-SnO2. J. Appl. Oceanogr. 2018, 37, 77–83. [Google Scholar]
  27. Colombo, E.; Li, W.; Bhangu, S.K.; Ashokkumar, M. Chitosan microspheres as a template for TiO2 and ZnO microparticles: Studies on mechanism, functionalization and applications in photocatalysis and H2S removal. RSC Adv. 2017, 7, 19373–19383. [Google Scholar] [CrossRef]
  28. Jang, J.S.; Kim, H.K.; Lee, J.S. Heterojunction semiconductors: A strategy to develop efficient photocatalytic materials for visible light water splitting. Catal. Today 2012, 185, 270–277. [Google Scholar] [CrossRef]
  29. Nithya, A.; Jothivenkatachalam, K. Chitosan assisted synthesis of ZnO nanoparticles: An efficient solar light driven photocatalyst and evaluation of antibacterial activity. J. Mater. Sci. Mater. Electron. 2015, 26, 10207–10216. [Google Scholar] [CrossRef]
  30. Kumar, H.; Rani, R. Structural and Optical Characterization of ZnO Nanoparticles Synthesized by Microemulsion Route. Int. Lett. Chem. Phys. Astron. 2013, 19, 26–36. [Google Scholar] [CrossRef]
  31. Zhong, L.W. Nanostructures of zinc oxide. Mater. Today 2004, 7, 26–33. [Google Scholar]
  32. Guo, M.; Diao, P.; Cai, S. Hydrothermal growth of well-aligned ZnO nanorod arrays: Dependence of morphology and alignment ordering upon preparing conditions. J. Solid State Chem. 2005, 178, 1864–1873. [Google Scholar] [CrossRef]
  33. Li, L.H.; Deng, J.C.; Deng, H.R.; Liu, Z.L.; Xin, L. Synthesis and characterization of chitosan/ZnO nanoparticle composite membranes. Carbohydr. Res. 2010, 345, 994–998. [Google Scholar] [CrossRef] [PubMed]
  34. Liu, Q.; Roy, A.; Silberschmidt, V.V. Temperature-dependent crystal-plasticity model for magnesium: A bottom-up approach. Mech. Mater. 2017, 113, 44–56. [Google Scholar] [CrossRef]
Figure 1. The interaction mechanism of the chitin/ZnO composite photocatalyst.
Water 11 00310 g001
Figure 2. The technology roadmap for the preparation and degradation of Chitin/ZnO.
Water 11 00310 g002
Figure 3. The effect of the Chitin–ZnO dosage on the ammonia nitrogen removal efficiency.
Water 11 00310 g003
Figure 4. The effect of the mixture mass ratio of Chitin–ZnO.
Water 11 00310 g004
Figure 5. The effect of calcination temperature.
Water 11 00310 g005
Figure 6. The effect of the initial concentration.
Water 11 00310 g006
Figure 7. Under the dark reaction conditions.
Water 11 00310 g007
Figure 8. Under natural reaction conditions.
Water 11 00310 g008
Figure 9. Under UV direct irradiation conditions.
Water 11 00310 g009
Figure 10. UV irradiation after adsorption.
Water 11 00310 g010
Figure 11. The orthogonal test results via five factors and four levels.
Water 11 00310 g011
Figure 12. The XRD in the 2-theta region for the Chitin/ZnO.
Water 11 00310 g012
Figure 13. SEM diagrams of four types of Chitin/ZnO: (a) Chitin/ZnO = 1:2; (b) Chitin/ZnO = 2:3; (c) Chitin/ZnO = 1:1; (d) Chitin/ZnO = 2:1. Four samples were all calcinated at 500 °C (testing by Hitachi S4800).
Water 11 00310 g013
Figure 14. SEM diagrams of the optimized catalyst: (a) Chitin/ZnO = 2:3, calcinated at 400°C and (b) Chitin/ZnO = 2:3, calcinated at 500 °C. (Testing by TM3030plus.)
Water 11 00310 g014
Table 1. The detailed information on the experimental reagents.
Drug Reagent NameMolecular FormulaPurity
Zinc nitrate hexahydrateZnNO3·6H2OAR
Polyethylene glycolHO(CH2CH2O)nHAR
Sodium hydroxideNaOHAR
Deacetyl chitin(C8H13NO5)NAR
Acetic acidCH3COOHAR
Zinc sulfateZnSO4AR
Ammonium chlorideNH4ClGR
Sulfuric acid solutionH2SO4AR
Nessler’s reagent-AR
Potassium sodium tartrateC4H4KNaO6-4H2OAR
Table 2. The experimental instruments and equipment.
Instrument NameModel
Electronic balanceTE124S
Magnetic stirring apparatusCJ78-1
Chamber electric furnaceSX2-2.5-10A
DHG Series Heating and Drying OvenDHG-9146A
Vacuum pumpSHZ-D (III)
pH meterPHS-3C
Multiparameter water quality analyzer5B-3B (V8)
Ultraviolet visible photometerV-1100D
Medium pressure pump lampM-169H
SEM electron microscopeHitachiS4800 TM3030plus
X’Pert PowderPANalytical EPSILON5
Table 3. The orthogonal test results via five factors and four levels.
LevelCalcination Temperature/°Cm(Chitin)/m(ZnO)Dosage (g/L)Irradiation Time/hInitial Concentration of NH4+–N (mg/L)UV %Adsorption 1 h + UV %Adsorption 1 h %
1300 °C2:10.511558.37%62.80%40.90%
21:2123064.72%67.28%47.33%
32:31.534569.15%70.60%49.35%
41:1246062.03%64.13%45.10%
5 400 °C 2:1136065.29%69.23%47.48%
61:20.544573.46%75.45%47.21%
72:3213075.43%78.28%58.41%
81:11.521571.12%73.32%52.05%
9500 °C2:11.543066.78%69.11%58.72%
101:2231577.53%80.96%56.29%
112:30.526088.64%90.12%70.11%
121:1114572.33%74.61%68.23%
13 600 °C 2:1224563.21%66.42%54.64%
141:21.516072.67%75.27%49.32%
152:3141573.91%76.88%50.13%
161:10.533070.33%73.54%45.63%
k1j2.542.652.542.682.913.022.792.912.812.94T = 11.25
CT = T2/n = 7.9101
T = 11.68
CT = T2/n = 8.5264
Average = 52.56%
k2j2.852.962.882.992.762.882.882.972.772.88
k3j3.053.153.073.162.802.882.822.942.782.87
k4j2.802.922.762.862.782.902.762.862.892.99
k1j26.477.016.437.168.469.117.778.477.898.64
k2j28.148.788.328.947.638.298.288.837.698.31
k3j29.329.919.439.987.828.317.978.667.748.24
k4j27.858.537.618.167.748.407.638.168.338.93
SSj0.0330.0320.0370.0320.0030.0030.0010.0020.0020.002

