Abstract
Wastewater management in Latin America faces great challenges to reach a sustainable state. Although enough infrastructure has been built to treat around 40% of wastewater, only between 15–20% is effectively treated, and abandoned or defective infrastructure is a common sight. Data about current conditions at specific sites is quite fragmented, when existing. This leads to challenges in management, decision making and planning for sustainable options. We argue that a main obstacle is the lack of a regionally relevant sustainability assessment framework that allows for a holistic understanding of wastewater management as a nexus problem. We therefore developed a comprehensive framework to (1) understand current conditions (2) involve stakeholders and (3) point to pathways to improve wastewater management in the Americas. Building on literature review and stakeholder involvement, we constructed a multi-scalar extended dataset framework that is adaptable to different study sites using specific criteria. Sustainability was assessed through a “distance-to-target” approach. Social and economic variables were the lowest ranking in both cases, with technical variables generally performing better. Although some dimensions of sustainability are performing acceptably, others, such as social and economic, are general low to very low performing. This means, when looked at in an integrated manner, neither of the wastewater management systems analysed can be considered sustainable. Here we present the approach itself, the results of its application in two pilot sites in Latin America, and our recommendation to shift waste water management into sustainability.
1. Introduction
Wastewater and Its Management in Latin America
Wastewater management systems (WWMS) serve multiple functions within their cities. They channel and treat the wastewater produced by their customers, reduce the pollution load to the environment and the catchment they are embedded in and thus safeguard it and its inhabitants from detrimental health effects. Usually citizens only notice them when they do not provide those services. Wastewater treatment systems can, in addition, provide resources, such as bioenergy from biogas produced during the decomposition of organic matter, irrigation water or stabilized sludge to be used as fertilizer. Understanding the risks and benefits that a wastewater treatment system can offer to its community is not limited to the technical understanding of its components. It demands understanding the multiple dimensions of sustainability, understood as ‘the maintenance of economic well-being, protection of the environment and prudent use of natural resources, and equitable social progress which recognizes the just needs of all individuals, communities, and the environment’ [1].
In Latin America, 80% of the population lives in urban areas, with small cities (up to half a million inhabitants) growing the most rapidly [2]. Exact data on sanitation and treatment coverage are not readily available [3], but it is known that wastewater treatment is in general poor, with infrastructure to treat around 40% of municipal wastewater having been built, but less than 20% of that wastewater effectively being treated [4,5]. Commonly built solutions have been centralised wastewater treatment plants (WWTP), which may satisfy the demand of highly populated areas, but do not necessarily comply with the new expectations about water recycling and reuse, and of nutrient recovery [6], as requested by Sustainable Development Goal (SDG) 6.3 or the New Urban Agenda adopted at the latest Habitat III Conference [7].
Tackling the deficit of safely treated wastewater is an urgent matter: Clean water and access to safe sanitation for all is one of the targets decided by the global community within the Sustainable Development Goals (SDG 6.2) [8]. In Latin America large cities concentrate the largest shares of population, but when it comes to issues in the water management services, rural areas and small- and medium-sized cities are the most affected zones, especially regarding sanitation and wastewater treatment [4]. Small- and medium-sized cities are defined according to population, varying in proportion to each country’s size, with a maximum of 1 million inhabitants for Latin American cities [3]. These types of cities show high urbanization rates, being the fastest growing urban areas [9]. This means that the established urban management systems have to consider the growth projections and adapt to keep up with the growing water demand and wastewater generation. Therefore, sustainable options for wastewater management for small- to medium-sized cities are urgently needed.
The SludgeTec project, a multinational partnership (the United Nations University’s Institute for Integrated Management of Material Fluxes and of Resources—UNU FLORES, the Universidad de San Carlos de Guatemala—USAC, the Mexican Trust Fideicomiso de Infraestructura Ambiental de los Valles de Hidalgo in Tepeji, Mexico—FIAVHI, and the Technische Universität Dresden-TUD, aimed for international experts and local stakeholders to co-design a sustainable wastewater treatment and management options for two pilot areas in the Americas: Los Cebollales WWTP in Panajachel, Lake Atitlan, Guatemala and Tlaxinacalapan WWTP in Tepeji, State of Hidalgo, Mexico. Research was carried out between November 2017 and February 2019 by a multi-disciplinary and international team of researchers and practitioners.
To achieve the project’s objective (co-designing sustainable options), it was first necessary to accurately assess current sustainability, that is, to describe baseline conditions. Establishing baselines is crucial for scientifically sound sustainability interventions [10], and is a key practice in many environmental fields, as it allows to evaluate the change in time of given parameters and therefore to track project success, for example. Without a baseline, it is impossible to carry out “before and after” comparisons [11]. Furthermore, a baseline assessment can be very useful in informing and engaging stakeholders [9], and a powerful way to gather and centralize otherwise dispersed data, assess data availability for a given topic, and eventually, socialize knowledge. This is particularly relevant in a region where data scarcity is known to be an issue.
The importance of baseline setting being clear, we were confronted with the non-existence of a comprehensive guideline to describe baseline and assess the sustainability of WWMS. Guidelines exist on the broad and very general steps to be followed in establishing a baseline [12], and on the data items to be considered in the assessment of specific components of a WWMS, such as finance, technical issues, etc. [13,14]. There has also been some research to systematise the indicators and data items needed for technology options evaluation [15,16,17]. However, the guidelines analysed during our literature review focus mostly on single dimensions of sustainability (environmental, technical, social), and do not take into consideration broader scales of analysis beyond the WWTP itself (to include for example the impacts of the WWTP’s function on the watershed or the subcatchment). We posit that a sustainability assessment must be multi-scalar (considering several territorial scales or spatial boundaries in one same study) and multi-dimensional (considering the different dimensions of sustainability).
We therefore developed a method to describe baseline conditions of WWMS and determine the degree of sustainability by (1) constructing a comprehensive and adaptable dataset framework and (2) applying a “distance-to-target” approach (further described in the methods section).
The method is underpinned by an emphasis on participation and transdisciplinarity. Scientists in the field of Integrated Water Resources Management highlight that participation can have positive effects on finding integrated solutions, e.g., by gathering and exchanging knowledge between vital stakeholders [18,19]. In terms of specific WASH-related problems, participation can help identify acceptable solutions on the ground. Based on this knowledge, practitioners and especially international donor organisations, apply participatory approaches in various contexts [20,21].
A research approach in which scientific and non-scientific actors collaborate in a participatory manner with the aim of creating scientific knowledge meant to address practical problems is here understood as transdisciplinary research (e.g., Reference [22]). ‘Transdisciplinary’ generally refers to an intensive inclusion of practitioners in the research process. To conceptualize transdisciplinary research, research provides a set of design criteria that are likely to have an impact on addressing complex problems in practice. These design criteria refer to (i) the type of actors involved, (ii) the stage of the research process where these stakeholders are involved, (iii) the degree of their involved, and (iv) the respective methodology [23]. Hence, various actors have been involved at different stages of the research process, from the design of research projects, via the implementation of the research projects, up to the evaluation of research results. In doing so, research questions, methods, and results are possibly better adapted to local needs, accepted, and thus also implemented [22,24]. Transferred to the field of wastewater management, the involvement of different scientific disciplines and practitioners from different realms may enable an ecologically, economically, environmentally and socially sustainable treatment of wastewater.
Participation is however no panacea for successful solutions. To achieve the potential benefits of participation, the thoughtful design of participatory processes is essential, including the right mix of actors (e.g., households, farmers, public authorities), degrees of participation (e.g., information sharing or co-decision-making), at the right scale (e.g., local or basin scale) [22,25].
In brief, in order to codesign sustainable options for the WWMS at the pilot sites, we built a method to first assess baseline sustainability, considering different territorial scales and the environmental, technical, economic and social dimensions. To broaden the possibility of accurate understanding of the issue and successful outcomes of the project, we worked in a transdisciplinary manner, i.e., in a diverse scientific team which closely worked with stakeholders and local partners, in every stage of research.
2. Materials and Methods
The method consists of four ‘building blocks’: (1) A thorough understanding of baseline conditions, which are then assessed under three different but converging perspectives: (2) Sustainability Assessment (SA), (3) Stakeholder Analysis and (4) Wickedness Analysis (WA). Blocks 1 and 2 are consecutive, i.e., number one is needed to perform number two. Blocks 3 and 4 are carried out separately. The assessment is made more thorough and comprehensive by bringing in the specific knowledge of each building block. This facilitates the understanding of bottlenecks and pathways towards sustainability, and as a final outcome, makes it possible to envision and evaluate solution options (Figure 1).
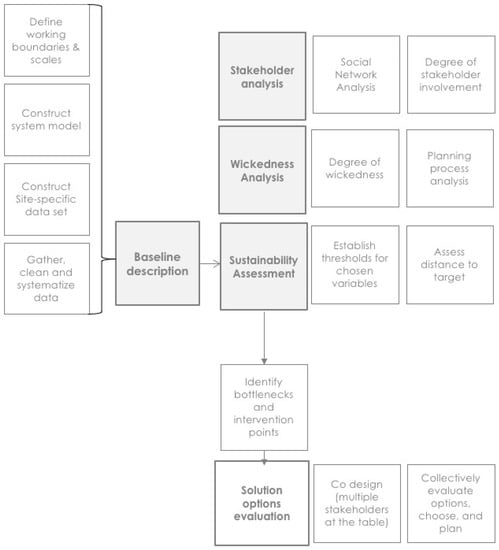
Figure 1.
The general method used in this research project. Highlighted blocks are the four building blocks in our method. This paper deals in detail with two blocks: Baseline Description and Sustainability Assessment.
This paper describes the first two building blocks in detail, while the remaining two are the object of future publications.
2.1. Pilot Sites
Pilot sites (Figure 2) were chosen by local project partners based on their knowledge of the reality on the ground.
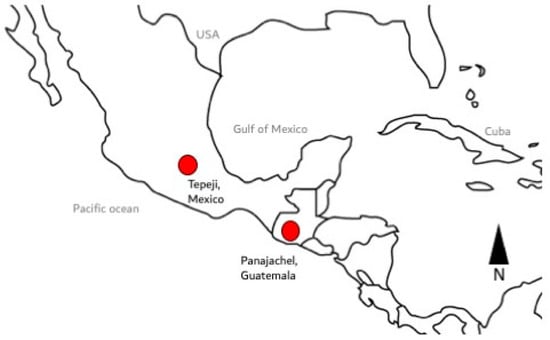
Figure 2.
Location of the pilot sites.
2.1.1. Panajachel Site description
At Panajachel, Guatemala, the pilot site is the Cebollales WWTP, an extended aeration, activated sludge plant built in 2013. The plant is operated by the municipality, with its financing sources being 100% public. The design flow is 37 liters per second (lps), and the current average flow is ~25 lps. It discharges into the San Francisco River, which, 200 m further downstream, feeds the Atitlan Lake. In the lake’s endorheic basin, 55% of households are connected to a sewage system, while the remaining 45% use latrines, septic tanks, or soak latrines. 45,500 m3 of wastewater is generated every day in the basin, and only approximately 20% receives treatment. Moreover, in the existing WWTPs, poor removal of pathogens and nutrients is a crucial challenge. These WWTPs face, among others, operation and maintenance problems.
2.1.2. Tepeji Site Description
At Tepeji, Mexico, the pilot site is the Tlaxinacalapan WWTP (built in 2017, started operations in January 2018). The WWTP has two treatment steps: a train of plastic anaerobic digestors built on site, followed by constructed wetlands. The design flow is 1.5 lps, and the current average flow is ~0.4 lps. It discharges into a tank from where water is taken to irrigate a football field and agricultural plots.
2.2. Dataset Framework
2.2.1. Preliminary Step. System Model: Boundaries and Scales of Analysis
Wastewater management is a wicked problem: a complex network of components, often interlinked in non-linear relationship and expanding across different territories. In addressing sustainability problems, systems approaches have been widely recognized to enable researchers to describe and understand reality more accurately, shedding light on a phenomenon’s structure and function [26,27,28], helping reveal otherwise “hidden” flows [29] and promoting the integrative thinking and interdisciplinary knowledge synthesis needed for sustainability [27,30]. System models are a key tool of systems approaches [27] and are widely used in cybernetics, physics, ecology and other fields where it is necessary to visually represent the complexity of real life networks and processes, in order to grasp the performance and behaviour patterns of systems. Our approach builds on systems thinking by using a system model as a fundamental research tool.
In building a system model, it is important to remember that, although WWMS are bound to human settlements, the sourcing of their inputs and the effluent and other outputs may have consequences well beyond their immediate geographical setting. Therefore, defining relevant scales of analysis and tracing analytical boundaries of the system is crucial. The choice of scales can determine the accuracy of diagnosis, and the effectiveness of projects [10,31]. Spatial resolution determines the visibility of objects and relations. If a model’s boundaries are too small, important factors influencing the model may be missed, whereas if they are too large, detail on specific processes may be lost. Avellán et al. [32] postulate that ‘the boundaries of the [Water-Soil-Waste Nexus] systems need to be (a) wide enough (to avoid microanalyses of plot levels as in some cases of INRM [Integrated Natural Resource Management]), (b) clear (to avoid confusion as in the WEF [Water-Energy-Food] Nexus), and (c) flexible enough to accommodate varying needs (to avoid geographic constrictions as is the case of the basin discussions in IWRM [Integrated Water Resources Management])’. By mixing in and contrasting different perspectives, a multi-scalar approach provides for more comprehensive analyses, which can lead to reduce biases caused by the use of a single “viewing-point” [10,33].
Different types of boundaries were identified: administrative (municipality, department, state, etc.), biophysical (catchments, geological, soil, etc.), and technical (treatment system, canal network, etc.). The relevance of each of these different spatial definitions was evaluated (Figure 3a), and four working scales were decided upon: 01 WWTP, 02 Municipality, 03 Subcatchment, 04 Watershed (Figure 3b). We argue that these scales together exhibit the needed specificity of the actual problem of wastewater treatment on the one hand but also enough scope to determine the impact that the system has on its surroundings.
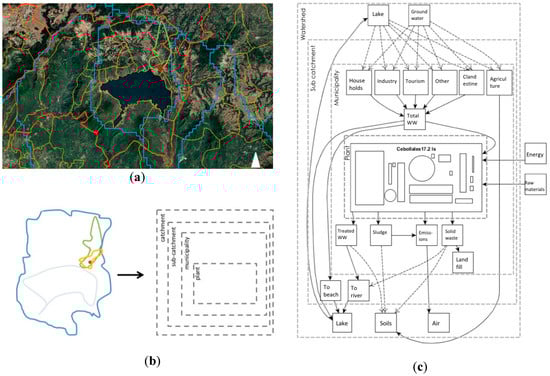
Figure 3.
(a) A first boundary explorations map for the Panajachel case, showing different scales of analysis that were initially found to be of interest: the plant scale (red dot), the subcatchment (light green), the municipality (yellow), the watershed (blue) and the province (orange). The large water body in the center is the Atitlan Lake. (b) The abstraction of “real-world” boundaries into boundaries for the modeling process. (c) The system model for the Panajachel case, showing the systems components in the scale they (mostly) operate in.
A system model for the WWMS was drafted for each study site, using these chosen boundaries. System components (stocks) are represented in boxes and relations between them (flows) with lines (Figure 3c). The first versions of the system model were refined with participation from stakeholders during an assessment workshop held in Panajachel, Guatemala, in March 2018 [34]. Figure 3c shows the final version of the system model for the Panajachel site, resulting from the participative work at the workshop.
2.2.2. Constructing the Dataset Framework
2.2.2.1. Extended Dataset Framework
We created the framework for a dataset that allows for a deep and holistic understanding of baseline conditions and sustainability performance, across scales and across the dimensions—environmental, and social, technical, economic—of the nexus problem of wastewater management, specifically in Latin America. To do so, we iterated between a top-down method (literature reviews) and a bottom-up method (working directly on the pilot sites, e.g., analysing the system model, asking stakeholders what sort of data is relevant to them) (Table 1). The result is an extended dataset framework (EF), which is described in more detail in the results section.

Table 1.
Steps followed in the construction of the extended dataset framework.
2.2.2.2. Site-Specific Dataset Framework
The EF was edited into a smaller, site-specific dataset framework for each site. This was necessary in order to respond to local data needs as expressed by stakeholders, as not all data items on the set were relevant for the specific sites. Additionally, to respond to the research priorities as established by the research team after assessing data availability and incorporating stakeholder input.
To edit the EF (with 492 variables) into the site-specific dataset frameworks (with 195 and 218 variables), we classified and prioritised each item on the EF according to the criteria in Table 2. Note that these criteria were chosen for these two project-specific pilot sites, but they could easily be applicable generically for other WWMS.
Table 2.
Criteria used to prioritize the data items in the extended dataset framework and to create a site-specific dataset framework.
Priority 1 (P1) was given to an item if two conditions are met: (a) that stakeholders had chosen it during the Assessment Workshop held in March 2018 in Panajachel, and (b) that the item had been found in wastewater management guidelines or other relevant literature during our literature review. Priority 2 (P2) was given when the data item is included in relevant local regulation, e.g., monitoring standards. Priority 3 (P3) was given when a threshold to compare current values to could be identified. Thresholds were found looking in:
- Local legislation (region, state, basin).
- National legislation.
- Legislation valid for the other case study of this project (in this case Mexico or Guatemala).
- International organisations (not legally binding but accepted as guidelines or recommendations).
In some cases, a data item is a “yes or no” question, and a threshold can be established with relative ease; for example, the existence of an operation manual for the plant, for which the threshold is “yes”, since that would be the desirable situation.
After the data gathering phase (see Section 2.4), these dataset frameworks were “filled in” with data, allowing to understand baseline conditions and perform a sustainability assessment.
2.3. Data Gathering
2.3.1. Identifying Data Holders
Possible data sources were identified through (1) an Assessment Workshop and (2) deskwork. The Assessment Workshop took place in March 2018 in Panajachel, Guatemala. Stakeholders from the Mexican cases were also present. More than 80 local stakeholders were invited, of which a total of 39 participated. The represented stakeholder groups were coming from Academia (43%), Federal officials (21%), Non-Governmental Oirganisations (NGOs) (20%), Municipal officials (8%), and Private enterprise (8%). Through the participatory activities crucial input needed to refine both the technical and the social assessment components of the project framework was obtained. A thorough comprehension of the current problem structure, made possible by including the views of key stakeholders in a very interactive and participatory manner [34]. Participants drafted lists with institutions and experts who they thought could have the information needed (or access to it) for each data item. The data holder lists made by the participants were screened, refined and complemented through desk work. The final list of data holders consulted or interviewed can be seen in Appendix C.
2.3.2. Data Collection
Part of the data needed was collected on the field. Fieldwork was carried out for two weeks at each site in August 2018, and included meetings with experts, practitioners and local authorities identified as data holders, as well as sampling and laboratory analysis. During the meetings, the interviewer (L. Benavides) went through the dataset with the stakeholder, who provided the answers he or she had available. Data holders were always asked to provide supporting documentation, but this was rarely available. In some cases, stakeholders did not have information at hand, but committed to sending it via email after the meeting.
For water quality parameters, sampling and laboratory analysis were carried out (Appendix D). Sampling and analysis were done in accordance to the norms in each country, in collaboration with certified local laboratories. In both cases, a composite sample of both the plant’s inflow and outflow was taken during a 24-h period. At the Panajachel site, sludge was also sampled. The sludge available had been stabilized on a covered drying yard for 28 days and was then piled up outdoors (i.e., under sun and rain) for at least two months prior to our visit. In Tepeji it was not possible to sample sludge, as according to the managers, the plant had not produced any in the 8 months of operation.
Further data was obtained from the revision of literature and documents produced by local and national authorities, which were made available to the research team during field work.
2.4. Sustainability Assessment
Sustainability Assessment (SA) processes aim at guiding decision-making towards sustainability [35] using different evaluative techniques [36] and definitions. ‘Sustainability Assessment’ can be considered a broad name tag for a series of methods and approaches: e.g., Sustainability Appraisal, Integrated Assessment, Integrated Sustainability Assessment, Sustainability Impact Assessment, Triple Bottom-Line Assessment, 3-E Integrated Assessment and Extended Integrated Assessment [35,36,37]. Methodologies found for SA include multicriteria approaches, systems analysis, life cycle analysis, economic analysis (cost-benefit analysis, life-cycle costing, etc.), weighting methods (exergy analysis, entropic weighing method), distance-to-target approaches, among others [15,38].
To determine the level of sustainability, we used a “distance-to-target” approach, comparing the current value of a variable with the threshold previously identified (see Section 2.2.2.2). The availability of a threshold finally defines whether a data item could be used in the sustainability assessment or not. Even though data for an item is available, if there is no appropriate threshold to compare it with, it is impossible to profit from this already existing data. Appendix E lists the variables for which thresholds could be identified and the thresholds values used to evaluate each variable of the site-specific dataset framework.
The “distance-to-target” was evaluated by adopting the “traffic light” method [39], where a variable is coded with green if it meets the threshold (good performance), with yellow when its performance does not meet ideal standards but is not far away from doing so, and red when it is performing sub-optimally. Table 3 discloses the quantitative criteria for each colour. Each variable was evaluated following these criteria. The result is a colour-coding of the data set (Appendix F).
Table 3.
Colour ranking in Sustainability Assessment.
Once the colour ranking was calculated for each variable, a colour ranking was also calculated for each of the three dimensions into which the variables are grouped in the sets: technical-environmental, economic, and social. To do this, we also followed the method described in Bertanza et al. (2016) [39], where a numeric value is assigned to each colour:
- Green = 1
- Yellow = 0
- Red = −1
- The colour-values are added, and a simple average in each category is calculated.
- The results are later presented again using the “traffic light” colour-coding for the performance of each dimension of sustainability, as follows: (see results section)
- Green: >0.33
- Yellow: between −0.33 and 0.33
- Red: ≤−0.33.
Although as stated in the introduction we believe a multi-scalar approach is necessary for a wide-enough perspective and an accurate understanding of a WWMS, due to the limited time scope of the SludgeTec project and the prolonged waiting periods to obtain data from data holders, it was only possible to perform a sustainability assessment on the first scale (WWTP, grey shaded areas on, and to include a multi-scalar social assessment of participation and social acceptance in the region where the WWTP operates (dataset IIb on Table 4 and Table 5).
Table 4.
Extended dataset framework, overview of subsets and number of data items in each.
Table 5.
Site-specific dataset frameworks for both pilot sites, after prioritizing the EF.
3. Results
3.1. Dataset Framework
3.1.1. Extended Dataset Framework
The iterative collection process of data items to describe the multi-scalar WWMS resulted in a large dataset framework with 492 data items (for an overview see Table 4, for the full content see SM 1). This comprehensive or “extended” dataset framework contains data items useful for the transdisciplinary study of WWMS (environmental and technical, economic, and social factors). It is organised into three datasets, namely: Dataset 0 which describes generic context data, Dataset I containing technical and environmental data, and Dataset II, containing socio-economic data. All datasets contain information across the four different spatial scales identified in Section 2.3.1. (WWTP, municipality, subcatchment, watershed) (see Table 4).
3.1.2. Site-Specific Dataset Framework
The EF proved too extensive to be used for the assessment of the sites, as time was a limiting factor, and also because not all variables on the set were necessarily a priority or the data for needed for all was not available at the different sites. Therefore, from the 492 data items in the EF, a site-specific dataset framework was created for the Panajachel pilot site with 218 data items, and for the Tepeji pilot site with 195 data items (Table 5). The full site-specific dataset frameworks can be found in Appendix A for Panajachel and in Appendix B for Tepeji.
3.2. Data Gathering
Figure 4a,b show the distribution of sources from which the data came from.
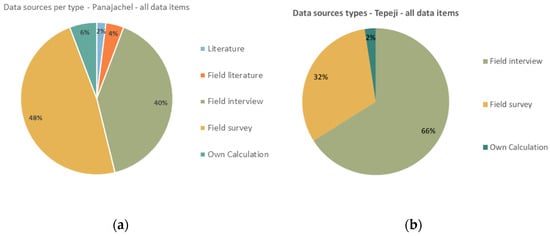
Figure 4.
Data sources per type. (a) Panajachel pilot site; (b) Tepeji pilot site.
About 77% of all data items in Scale 01 could be gathered for the Panajachel site, and ~76% for Tepeji (Table 6 and Table 7). However, out of the data that was gathered, only a fraction was of use, as can be seen in the last column of Table 6 and Table 7. The reasons why some of the data had to be discarded were:
Table 6.
Data gathered for all scales, data gathered specifically for Scale 01 and data finally computed into the sustainability assessment: Panajachel pilot site.
Table 7.
Data gathered for all scales, data gathered specifically for Scale 01 and data finally computed into the sustainability assessment: Tepeji pilot site.
- Data quality. Stakeholders sometimes provided no supporting facts or documentation for the data they provided, or there was a considerable difference between data found for the same item from various sources, with no straight-forward way to choose amongst them.
- No existing threshold. The data could be obtained but no threshold was found, and therefore the data was not used further.
This filtering process removed ~32% of the data for Panajachel and ~43% of the data gathered for Tepeji. With the remaining variables (62 variables for Panajachel, 55 variables for Tepeji) the sustainability assessment was performed.
3.3. Sustainability Assessment
3.3.1. Panajachel
Sustainability at the Cebollales WWTP in Panajachel was assessed with 62 variables: 52 in the technical-environmental dimension, three in the economic and seven in the social. All dimensions show a medium performance (yellow) except for the economic dimension, where the assessment is “poor” (coded with red). Just about half of the variables are performing relatively well (23 variables coded with green) and about half are coded in red (27), with two variables coded in yellow. Therefore, overall sustainability performance can be classified as medium to low (See Table 8. To see performance per variable, see Appendix F).
Table 8.
Sustainability performance per dimension: Panajachel site.
In the technical environmental dimension variables that performed well included heavy metal concentrations in the plant’s water outflow and sludge which were all found to comply with norms at the moment of sampling (except for Arsenic in the sludge). Additionally, the Sampling frequency is complied with. The plant is sampled with regularity. However, the results do not make it to on-the-ground stakeholders (plant operator, for example).
In contrast, variables performing sub-optimally include nutrients and organics: variables such as Total Nitrogen (TN), Total Phosphorus (TP), Biological Oxygen Demand (BOD), Chemical Oxygen Demand (COD), and Total Coliforms. The plant is not able to meet treated water outflow standards. This situation is likely partially driven by the fact that the inflow to the plant (municipal sewage) is already non-compliant as per regulations on discharges into the public sewage system. In addition, strong odours were detected while visiting and were also reported by local stakeholders. Lastly, maintenance is very irregular to non-existing; salaries are irregularly paid; no operation manual exists on site, the operators lack training and equipment. The risks that the WWTP and the treated water discharge into the nearby San Francisco river poses to health or to environment are unknown, as no risk assessment has been carried out, either for health or for ecosystems.
In the economic dimension there is no compliance. For example, the per capita cost of treatment is higher than the WHO illustrative value for activated sludge plants (upper limit set by WHO is 8 USD per capita per year. Using data provided by the municipality, we calculated 9.7 USD). The budget deficit is constant, i.e., the operating entity practically never has access to enough resources to cover operating costs or deliver worker’s salaries on time. There is also no valorisation of by products (biogas, sludge), nor has a plan for this purpose been outlined by managers.
In the social dimension stakeholders are generally aware and interested in wastewater-related issues and see opportunities for their suggestions to be heard. They however do no not perceive the solution(s) currently in place as acceptable, nor do they perceive that others accept them.
3.3.2. Tepeji
Sustainability at the Tlaxinacalpan WWTP in Tepeji was assessed with 55 variables: 48 in the technical-environmental dimension and 7 in the social dimension. No economic data was available from the WWTP managers at the time of data gathering, and therefore this dimension could not be evaluated. In the two dimensions evaluated, it shows a moderate to good performance (Table 9).
Table 9.
Sustainability performance per dimension: Tepeji site.
The technical-environmental dimension performance’ falls just above the border between medium and good performance, with 33 out of 48 being coded with green. Variables that perform well include compliance with heavy metal concentrations in the outflow (as established in local regulations, i.e., Norma Official Mexicana (NOM) 001), except for Cadmium (0.02 mg/L, which is double the allowed value). Additionally, all physical parameters are complied with (Total Suspended Solids (TSS), conductivity, colour, floating matter, grease and oils).
Variables that perform sub-optimally include nutrients and organics: TN, Faecal coliforms, pH, are not performing satisfactorily, neither when compared with the local norm (NOM 001) or with WHO standards for the use of treated wastewater use in agriculture. Odours were detected while visiting and were also reported by local stakeholders. No operation manual is available to key stakeholders such as the operator himself. No regular sampling seems to be occurring on the plant’s outflow, as although some interviewed stakeholders assured sampling has been done, no results were provided to us. Operators and managers lack adequate training on anaerobic plant operation. Standard design and operation practices are not being followed (such as an initial inoculation of the system with appropriate bacteria at the start of operations, assurance condition of air-tight conditions within anaerobic digestion tanks). Finally, the risks that the WWTP poses to health or to environment have not been studied, either prior to construction or once in operation, by any of the possibly interested parties.
In the social dimension stakeholders indicated that they are interested in and aware of wastewater related problems. They however do not feel that there is enough information available or opportunities to participate in decision making or to give recommendations to decision makers and managers. The current wastewater management system is generally not accepted or perceived as being accepted by interviewed stakeholders.
4. Discussion
4.1. Dataset Framework for Describing Wastewater Management Systems
We designed a transdisciplinary approach to assess baseline conditions and sustainability performance of wastewater management systems in Latin America, building on methods from both the social and the natural sciences (Figure 1), and with a heavy emphasis on stakeholder involvement and the understanding of baseline conditions. The approach was designed along with the development of a research project, in an iterative process between academic knowledge and the real experiences of what was possible to achieve within the conditions on the field.
We created an Extended dataset framework (EF, see Section 3.1), which we propose to be useful as a general guidance for data item selection for WWMS. It can be used as a sort of repertoire that can be “curated” or edited, choosing the items that are relevant to a specific site or research question, and thus creating a site-specific data framework.
4.1.1. Methodological Issues
The approach calls for not only a transdisciplinary but also a multi-scalar assessment. We attempted to simultaneously look at local scales within technical and administrative boundaries (the WWTP and the municipality), and ecological scales within hydrological boundaries (subcatchment and watershed). However, gathering, evaluating and processing the data required for a multi-scalar assessment was impracticable within our time scope. We therefore implemented the approach only on the scale of the WWTP (Scale 01) and were able to gather enough data to describe baseline conditions and to assess sustainability across all dimensions of sustainability in Panajachel and two out of three in Tepeji.
The approach proved to be practicable at one scale, with the strength of being able to incorporate local needs and conditions through the site-specific editing of the extended dataset framework (Table S1, see Section 2.2.2.2). The resulting datasets are useful as snapshots of the current status quo, and the data items can be used as a guideline for future data generation and periodical evaluation.
Building on a systems perspective, this approach calls for the construction of a system model as a tool: to identify important data items or variables to be investigated, or to localise “invisible” parts of the system, such as stakeholders, boundaries or legal frameworks. The tool proved useful not only for our own research process, but was also helpful during stakeholder involvement activities, where it helped structure the discussion. One example is that when discussing key stakeholders and responsibilities (“who is involved and who is responsible for what?”), the system model clearly depicts that, because the WWTP’s outflow eventually reaches the lake at the bottom of the basin, basin authorities (federal), river authorities (provincial) and tourists visiting the lake are involved, albeit to different degrees, in the problem. In other words, by explicitly linking upstream sewage system users to downstream fishermen affected, for example, the visual representations appeal strongly to very different stakeholders sitting around a discussion table, promoting a holistic and inclusive understanding of issues.
The same can be said for the boundaries discussion, also guided by the system model. By clearly illustrating which components fall into which boundary (e.g., the whole of the WWTP falls within the municipal boundary, but its outflow, ten meters ahead, falls into the river and thus provincial jurisdiction, while some of its inputs, such as pump parts, come from a different continent) administrative responsibilities can be made clearer and better understood; conflicting interests or overlapping mandates are made visually explicit and can therefore be more easily comprehended, and complexity is more easily grasped.
Finally, the combination of a technical-environmental assessment (Dataset I) with an economic (Dataset IIa) and a social (Dataset IIb) assessment proved not only enriching but allowed for insight into the drivers of the technical and environmental results. The technical-environmental variables provide an answer to the question “How is the system behaving?” while the social and economic data provide perspective into “Why the system is behaving so?” making the method better poised to identify bottlenecks and point to solution pathways. We see a challenge but a promising opportunity to improve sustainability thought and its tools in a more thorough transdisciplinary integration in the future. Overall, the approach showed potential for investigating the sustainability of WWMS. We see areas of improvement in, for example, reducing data intensity, systematising thresholds, and operationalizing the multi-scalar approach.
4.1.2. Data Availability
As shown in Table 6 and Table 7, roughly over 50% of the data we originally set out to gather for the multi-scalar site-specific dataset framework(s) was available with certain ease of access. Once we decided to focus on a single scale (WWTP), this proportion grew to ~75%, of which around a third had to be discarded due to quality issues.
Basic information such as monthly or yearly budgets and expenditures records, technical drawings and plans of the WWTP were for example not available for the Mexican case. In the Guatemalan site, non-continuous time series for monthly expenditures, inflow and outflow measurements were finally obtained via email after a waiting period following a stakeholder interview. Although indeed useful, the time series were neither long, nor gap-free, and data was not easily made available. In general, we found that stakeholders who, in theory, should have information (operating facilities, government bodies, WWTP managers) may be able to provide verbal answers in an interview, because of their empirical knowledge. The however very often lack supporting documentation, written records and systematic registries. In other cases, they lack the willingness or permission to share information. This is true mostly at the municipal and state levels, while federal agencies, particularly in the Mexican case, usually have well integrated and functional databases. The scale of federal-level data is however often not fine-grained or detailed enough to study a single treatment plant or even a municipal-level WWMS.
It is clear that large efforts are needed in terms of data generation, systematisation, sharing, and transparency. Examples would be digitising written records, using same standards throughout the region, information sharing between institutions, researchers and stakeholders or placing documents and data on the internet. Good starting points already exist, such as the National System for Water Information, kept by the National Water Commission in Mexico (CONAGUA), where geo-referenced information on water quality and quantity, irrigation, and watersheds is disclosed. We suggest that an immediate area of work should be furthering the capacity of key stakeholders, such as municipal and state or provincial governments to generate data, and the integration of all data generators into more detailed and/or numerous data bases, or conversely the creation of citizen-led observatories that foster awareness raising and demand and contribute to regular environmental and economic monitoring.
A significant issue to meaningfully assess sustainability stems from the still incipient integration of social indicators into sustainability. In the extended dataset framework 10 indicators (versus 380 for the environmental-technical dimension) across all scales could be identified from the literature or the stakeholder discussions. They are often linked to information that is not readily available but has to be generated via questionnaires and on-site interviews, coded analysis and other qualitative research methods. In order to strengthen future sustainability assessments of WWMS it is imperative to continue work on the integration of social indicators and methods to streamline the collection and analysis of these.
4.2. Sustainability of the Pilot Wastewater Management Systems
Our analyses show that the wastewater treatment systems currently in place in Panajachel, Guatemala, and Tepeji, Mexico, although performing well in various selected parameters, cannot be considered sustainable when looked at in a multidimensional manner, i.e., in terms of technical, environmental, economic, and social factors.
4.2.1. Technical-Environmental Issues
Both plants treat a municipal wastewater flow of domestic origin, with low to negligible heavy metal and metalloids content. In both cases, the quality of the inflowing wastewater is already below locally applicable standards for discharges into the public sewage network (Total Nitrogen and Total Coliforms in both cases, and Total Phosphorus, Biological Oxygen Demand, Chemical Oxygen Demand, and Total Suspended Solids (TSS) in Guatemala as well) meaning the plants are receiving a low-quality inflow from the start (see results per variable in Appendix F).
Once within the WWTPs, processes show different efficiency levels. Omitting metals, in which both plants practically fully comply (arguably because of an original low-metal content), the WWTP in Panajachel does not comply with virtually any of the examined physical, chemical or biological parameters, while the Tepeji WWTP performs slightly better, complying with half of them. Both plants, however, are performing poorly in the treatment of faecal coliforms, a crucial variable in terms of human and ecosystem health. In the particular case of Tepeji, where the water is being used for irrigation and the de-centralised, small-scale technology is being introduced to the community, a low quality and potentially risky outflow is not only a health risk, but an important hinderance to the success of the de-centralised treatment project, which has the aim of fostering wastewater use for agricultural irrigation. Social acceptance is key to the success of such new technology, and thus trust among the community has to be gained by the promoting entities.
Technical efficiency and environmental compliance are a major issue in both plants. Although visibly more critical in the Mexican case, lack of training of the operating and management personnel is a shared issue that is contributing to the situation. Systematic data generation and environmental monitoring, particularly in the Mexican case, are a challenge. Guatemalan managers were keeping a more detailed track of the WWTP performance. This may have to do with the fact that the WWTP in Guatemala has been in operation for a longer period (5 years versus 8 months), and also that it is operated by the municipality (vs a Trust).
4.2.2. Management Issues
In management-related issues both WWTPs perform the same, with only 2 out 7 management variables evaluated as positive, even though the systems operate at different scales (design flows of 1.5 lps in Tepeji vs 37 lps in Panajachel on average). Both plants lack operation manuals accessible to the operator, personnel lack training and capacities and laboratory analyses are not accessible and hassle-free in any of the cases (although in Panajachel sampling is carried out with norm-compliant frequency by a federal authority, key stakeholders—such as the plant’s operator—do not have access to the results and have therefore no feedback on their work).
In terms of risk and safety, operators in both pilot sites lack appropriate working conditions, (clothing, equipment, adequate-hand-washing-facilities). In neither of the cases had the risks posed to the environment or surrounding populations by malfunctioning of the WWTP been studied. Panajachel stakeholders manifested that environmental risk assessment is relatively new in public administration, and that they hope it will be integrated along with, for example, Environmental Impact Assessment (EIA), soon.
In Latin America in general, investments are often made to build an infrastructure project, but the funding for its long-term operation and maintenance (including equipping operators, performing routine samplings, etc.) is not secured, and nor are income generating options (resource recovery, for instance) duly considered [40]. Although this is a known issue, new infrastructure is being built as we write in Panajachel, while in Tepeji funds are being sought for the building of a large scale WWTP, still without a clear idea of how current infrastructure will continue to be financed or maintenance challenges faced (e.g., equipment repairs, salaries). Without a change towards adequate financial planning it is likely that both existing and new WWTPs at the studied sites will continue to operate sub-optimally.
4.2.3. Social Issues
The overarching recommendation, applicable to both sites, is to facilitate stakeholders the access to the information about their own social network. A common understanding of the problem itself is lacking. Who should be contacted with which need, or as formulated by Reed et al. “who is in and why?” [23] is a key question with a high degree of influence on the social development in both pilot sites. A common understanding of the problem is the basis for facilitating social interaction among the involved stakeholders. Economic and human resources should be provided to conduct an in-depth Stakeholder and Social Network Analysis in both pilot sites.
5. Conclusions
To advance towards sustainability in the urgent topic of wastewater management in the Americas, data scarcity and scatteredness must be overcome to allow for precise understanding of current or baseline sustainability performance. From such an understanding, bottlenecks can be made visible, and pathways towards sustainability can be envisioned. To increase the accuracy of the assessment and the adequacy of proposed solutions, research should go beyond one single perspective. To this end, we have proposed a multi-scalar data framework that includes variables for four different territorial scales: the WWTP, the municipality, the subcatchment and the watershed. Other scales could be chosen in other projects, what we propose is the multiscalar approach, not necessarily the scales themselves. Additionally, we propose to assess sustainability across four dimensions (environmental, technical, economic and social), and to incorporate other strands of scientific practice into the assessment (stakeholder analysis and wickedness analysis).
Transdisciplinarity is also a tool for improved success of research projects in this topic (see introduction). Throughout this project, we worked closely with local stakeholders and non-scientific practitioners. Their input was crucial in tailoring the framework to be locally relevant (see Section 2.2.2.2), and in the process of envisioning and evaluating solution options.
In this paper we present the method itself (Section 2) and partial results of its application in two pilot sites (Section 3). We also discuss the benefits and limitations of the method, and point to ideas for its future improvement and further application (Section 4.1).
As to the method itself, we found the multiscalar approach to enrich assessment and to allow to make visible issues that are not shown by single scale analysis, namely the interconnections of the technical system (WWTP) with ecological systems (watershed, riparian areas) and social systems (government, public administration, community dynamics, social perception). Shedding light on these interconnections, bottlenecks and obstacles to achieve sustainability are understood in a deeper and more detailed way, as many of the bottlenecks would be invisible when looking only at one scale or one dimension. The main limitations of the method are data and time intensity. Good planning, working closely with engaged local partners and performing a preliminary screening of data availability and data holders is recommended.
As to the results of the assessment presented here, Sustainability Assessment showed that technical and environmental variables tend in general to perform medianly to well, with microbiological parameters performing below the norms in both cases. Social and economic variables are the weakest spot of both of the WWMS analysed (Section 3.3). The results of the other two components of the method (stakeholder analysis and wickedness analysis) will be the object of future publications.
Supplementary Materials
The following are available online at http://www.mdpi.com/2073-4441/11/2/249/s1, Table S1: Extended Framework.
Author Contributions
Conceptualization, L.B. and T.A.; Data curation, A.M.; Formal analysis, L.B. and A.M.; Funding acquisition, T.A. and S.C.; Investigation, L.B. and A.H.; Methodology, L.B., T.A., S.C., A.H., S.K. and A.M.; Project administration, T.A., S.C. and A.H.; Supervision, T.A.; Visualization, L.B.; Writing—original draft, L.B.; Writing—review & editing, L.B., T.A., A.H. and A.M. With the exception of the first author, alphabetical order was applied for the remaining authorship’s order.
Funding
This research was funded by the German Bundesministerium für Bildung und Forschung, (BMBF) under the grant number 01DF17001. The Guatemalan Consejo Nacional de Ciencia y Tecnología provided support to the researchers of the University of San Carlos de Guatemala and financed, in part, the Assessment Workshop in Panajachel in March 2018. The Fideicomiso de Infraestructura Ambiental para los Valles de Hidalgo (FIAVHI) provided support to the participation of Mexican stakeholders to the Assessment Workshop and access to their premises. The APC was funded by the German Bundesministerium für Bildung und Forschung, (BMBF) under the grant number 01DF17001.
Acknowledgments
The authors wish to acknowledge the project’s partners: Ing. Jorge Cifuentes (USAC), and his students, Ing. Carlos Paillés and staff at FIAVHI, and our partners from the Technische Universität Dresden. Many thanks to AMSCLAE, the municipal authorities in Panajachel and Tepeji who kindly supported our research, and all stakeholders who accepted to be interviewed. Special thanks to Enrique Cosenza and Thelma Lopez for making the field in Panajachel possible. Finally, we wish to thank Laura Ferrans, Leon Zimmermann and Nestor de la Paz for their preliminary work into pilot sites, as well as Guido Bartolini for his support in the preparation of the final manuscript.
Conflicts of Interest
The authors declare no conflict of interest. The funders had no role in the design of the study; in the collection, analyses, or interpretation of data; in the writing of the manuscript, or in the decision to publish the results.
Appendix A
| Prioritised (Site-Specific) Dataset Framework—Panajachel | ||||||||
| Total Data Items | 218 | |||||||
| PS = Prioritised by stakeholders | LI = Data Item comes from the literature | |||||||
| RG = Included in Guatemala regulation | RM = Included in Mexican regulation | |||||||
| The numbers in the ID column refer to those of the extended set. | ||||||||
| DATASET 0—Context Data—WWTP Scale | ||||||||
| Category | ID | PS | LI | RG | RM | Data Item | Item Description | Notes |
| GEOGRAPHY A | A0.003 | 1 | Map | Cartography at the adequate scale to understand the location of the plant in relation to nearest population settlement, water resources and other relevant features. | All non-domestic wastewater generators have to prepare a technical study including this item. Acuerdo Gubernativo 12-2011, article 5 and 6 | |||
| DATASET I.01—Technical Environmental Data—WWTP Scale | ||||||||
| Category | ID | PS | LI | RG | RM | Data Item | Item Description | Notes |
| GENERAL A | A0.001 | x | x | 1 | Technology used | Technical procedure with which the plan treats wastewater. Note any relevant particularities. If needed, include a diagram of the process in an annex. | All non-domestic wastewater generators have to prepare a technical study including this item. Acuerdo Gubernativo 12-2011, article 5 and 6 | |
| A0.005 | x | x | Number of people served | |||||
| INPUTS B | B0.001 | x | x | Design inflow | Flow capacity that the plant was originally designed for. | |||
| 68 | B0.002 | x | x | Volume wastewater input | Total volume of water entering the plant in the reporting year | |||
| B0.005 | x | x | Average plant capacity utilization | Percent of design capacity being used, on average, during the reporting year | ||||
| B0.006 | x | x | Volumetric Efficiency | Total wastewater entering the plant/Treated Wastewater (100) | ||||
| Inflow quality parameters | B1.001 | x | x | Temperature | ||||
| B1 | B1.002 | x | x | BOD | Biological Oxygen demand | |||
| B1.003 | x | x | COD | Chemical oxygen demand | ||||
| Inflow Nutrients | B1.004 | x | x | Total Nitrogen | ||||
| B1.008 | x | x | Total Phosphorus | |||||
| B1.015 | x | Faecal coliforms | ||||||
| Pathogens inflow | B1.016 | x | E.Coli | |||||
| B1.021 | x | TSS | Total suspended solids | |||||
| B1.023 | x | pH | ||||||
| Other inputs B2 | B2.001 | x | x | Raw materials used | Raw materials as inputs necessary for the plant to function (e.g., machine oils, fuel, chemicals for the flocculation phase or other stages of the process, etc.), as well as office supplies and such. When data available is in other units, make sure to note so in the units column. Tonnes per year is a recommended unit. | |||
| B2.003 | x | x | Total energy consumed | Energy consumed in the reporting year, all energy carriers together and all energy uses considered. | ||||
| OUTPUTS C | C0.001 | x | x | Total volume Treated Water produced | Total Outflow of wastewater from the plant, in yearly total average. | |||
| C1.001 | x | x | 1 | 1 | Temperature | |||
| C1.002 | x | x | 1 | 1 | BOD | Biological Oxygen demand | ||
| C1.003 | x | x | 1 | COD | Chemical oxygen demand | |||
| C1.004 | x | x | 1 | 1 | Total Nitrogen | |||
| C1.008 | x | x | 1 | 1 | Total Phosphorus | |||
| Pathogens in outflow | C1.015 | x | x | 1 | Faecal coliforms | |||
| C1.016 | x | x | E.coli | |||||
| C1.017 | x | x | Helminths | |||||
| C1.019 | x | x | Organic Matter | |||||
| C1.021 | 1 | Sedimentable solids | ||||||
| C1.022 | x | x | 1 | 1 | TSS | |||
| C1.023 | x | x | Turbidity | |||||
| C1.024 | x | x | 1 | 1 | pH | |||
| Metals, metalloids and trace elements in outflow | C1.025 | x | x | Al | ||||
| C1.026 | x | x | 1 | 1 | As | |||
| C1.027 | x | x | Cd | |||||
| C1.028 | 1 | 1 | Cyanide (CN) | |||||
| C1.029 | x | x | Co | |||||
| C1.030 | x | x | 1 | 1 | Cr | |||
| C1.031 | x | x | 1 | 1 | Cu | |||
| C1.032 | x | x | Fe | |||||
| C1.033 | x | x | Mn | |||||
| C1.034 | x | x | 1 | 1 | Ni | |||
| C1.035 | x | x | Ti | |||||
| C1.036 | x | x | 1 | 1 | Zn | |||
| C1.037 | x | x | 1 | 1 | Hg | |||
| C1.038 | x | x | 1 | 1 | Pb | |||
| C1.039 | x | x | Se | |||||
| C1.040 | x | x | B | |||||
| C1.041 | x | x | Mo | |||||
| C1.043 | x | 1 | 1 | Grease and oils | ||||
| C1.044 | x | 1 | 1 | Floating matter | ||||
| C1.045 | 1 | Colour | ||||||
| Wastewater Reuse C2 | C2.001 | x | x | Percentage of wastewater output being recycled or reused | ||||
| Sludge C3 | C3.001 | x | x | Total Sludge produced yearly | Total amount of sludge produced in the reporting year. | |||
| Sludge Quality parameters | C3.002 | x | x | Al | ||||
| Metals, metalloids and trace elements in sludge | C3.003 | x | x | 1 | 1 | As | ||
| C3.004 | x | x | 1 | 1 | Cd | |||
| C3.005 | x | x | Co | |||||
| C3.006 | x | x | 1 | 1 | Cr | |||
| C3.007 | x | x | 1 | 1 | Cu | |||
| C3.008 | x | x | Fe | |||||
| C3.009 | x | x | Mn | |||||
| C3.010 | x | x | 1 | 1 | Ni | |||
| C3.011 | x | x | Ti | |||||
| C3.012 | x | x | 1 | 1 | Zn | |||
| C3.013 | x | x | 1 | 1 | Hg | |||
| C3.014 | x | x | 1 | 1 | Pb | |||
| C3.015 | x | x | Se | |||||
| C3.016 | x | x | B | |||||
| C3.017 | x | x | Mo | |||||
| C3.030 | x | x | Calorific value | |||||
| Pathogens in sludge | C3.031 | x | x | 1 | 1 | Helminths | ||
| C3.032 | x | x | 1 | 1 | Total coliforms | |||
| C3.033 | x | x | E.coli | |||||
| C3.034 | 1 | Salmonella sp. | ||||||
| Organics | C3.035 | x | x | Organic Matter | ||||
| Sludge use C4 | C4.001 | x | x | Scope of sludge management | % of sludge that is managed, including treatment in different ways, such as use in agriculture, thermal disposal, landfills, etc. As proposed by Popovic & Kraslawski (2018). | |||
| C4.002 | x | x | Current use/management of sludge | What is done with sludge once it is dried at the plant? | ||||
| C4.004 | x | x | Potential sludge users | |||||
| Emissions C5 | C5.001 | x | x | Total Biogas production | How much biogas was produced in the reporting year? | |||
| C5.005 | x | x | GHG emissions | Can be divided into GHG emissions linked to plant operation and maintenance, and emissions produced by the wastewater itself. Specify and disclose method for Calculations performed in an annex. The online tool ECAM (wacclim.org/ecam) is an option for estimation. | ||||
| Management D2 | D0.001 | x | x | Number of operators | ||||
| Staff D0 | D0.003 | x | x | Employee/inhabitant ratio | Number of employees per 1000 inhabitants served by the plant. | |||
| Management D1 | D1.001 | x | x | Existence Operation manual | Does a clear, up to date operations manual exist on site, and available to all people operating the plant? | |||
| D1.002 | x | x | Regularity of maintenance | |||||
| Capacities D2 | D2.001 | x | x | Capacity sufficiency | Does all the personnel involved have the knowledge and skills they need to have? | |||
| D2.003 | x | x | Accessible sampling and processing equipment | Does the plant have its own equipment or easy and hassle-free access to sample and analyse incoming wastewater, treated water and by-products quality? | ||||
| Compliance and certification D3 | D3.001 | x | Discharge standards compliance | Percent of time that the plant’s outflow complies with applicable regulations. State the regulations are being considered. | ||||
| D3.002 | x | 1 | Analysis frequency compliance | Ratio of number of effluent samplings per month to number of effluent sampling per month required by law of wastewater treatment policy (as proposed by Popovic & Kraslawski (2018). | ||||
| D3.003 | x | Certification | Does the plant have some quality certification (ISO, or other national/international standards)? | |||||
| RISK E1 | E0.001 | x | Has a health risk assessment related to wastewater been performed at the site? | |||||
| E0.002 | x | x | Are health risks being managed? | |||||
| Health E0 | E0.003 | x | x | Do the operators have the necessary health and safety equipment? | ||||
| E1.001 | Has a natural hazard risk assessment been performed at the facility? | |||||||
| E1.002 | Are natural hazard risks being managed? | |||||||
| E1.003 | Has an environmental impact study relating wastewater with ecosystem health been performed at the site? | |||||||
| Other hazards E1 | E1.004 | x | x | What efforts are being made to reduce or manage environmental impacts? | ||||
| E1.005 | Presence or risk of groundwater pollution | |||||||
| E1.006 | Presence or risk of surface water pollution | |||||||
| DATASET IIA.01—Economic Data—WWTP Scale | ||||||||
| Category | ID | PS | LI | Data Item | Item Description | Notes | ||
| Costs A0 | A0.002 | x | Cost per m3 of water treated | Cost of producing one cubic meter of water | ||||
| A0.003 | x | Cost per inhabitant served | ||||||
| A0.006 | x | x | Proportion of costs: maintenance and repairs | What proportion of the total expenses corresponds to energy? | ||||
| A0.009 | Proportion of costs: training, capacity building | What proportion of the total expenses corresponds to energy? | ||||||
| Income A1 | A1.001 | x | Total plant income | Total income of the plant yearly. Specify currency used under ‘units’ | ||||
| A1.002 | x | Real financial availability per inhabitant served | ||||||
| A1.003 | Budget deficit | |||||||
| A1.006 | x | Valorisation of by products | Are products of the plant being valorised (sold, recycled, etc.) | |||||
| DATASET IIB.01—Social Acceptance—Multi-Scalar | ||||||||
| Category | ID | PS | IL | Data Item | Item Description | Notes | ||
| SOCIAL B | B0.001 | Personal interest in wastewater management problems | ||||||
| Inclusion/Participation | B0.002 | Personal awareness of wastewater management problems | ||||||
| B0.003 | Willingness to be informed about the wastewater management problems | |||||||
| B0.004 | Accessibility to information | |||||||
| B0.005 | Possibilities for providing a recommendation | |||||||
| B0.006 | Recommendations are considered? | |||||||
| B0.007 | Willingness to participate in decision-making | |||||||
| B0.008 | Participative decision-making | |||||||
| B0.009 | Personal acceptance of the current wastewater management | |||||||
| B0.010 | Perception of social acceptance of the current wastewater management | |||||||
Appendix B
| Prioritised (Site-Specific) Dataset Framework—Tepeji | ||||||||
| Total Data Items | 195 | |||||||
| PS = Prioritised by stakeholders | LI = Data Item comes from the literature | |||||||
| RG = Included in Guatemala regulation | RM = Included in Mexican regulation | |||||||
| The numbers in the ID column refer to those of the extended set. | ||||||||
| DATASET 0.1—Context Data—WWTP Scale | ||||||||
| Category | ID | PS | LI | RG | RM | Data Item | Item Description | Notes |
| GEOGRAPHY A | A0.003 | 1 | Map | Cartography at the adequate scale to understand the location of the plant in relation to nearest population settlement, water resources and other relevant features. | All non-domestic wastewater generators have to prepare a technical study including this item. Acuerdo Gubernativo 12-2011, article 5 and 6. | |||
| A0.006 | x | Land uses in 1 km radius | ||||||
| A0.007 | x | Distance to nearest house | ||||||
| DATASET I.01—Technical Environmental Data—WWTP Scale | ||||||||
| Category | ID | PS | LI | RG | RM | Data Item | Item Description | Notes |
| GENERAL A | A0.001 | x | Technology used | Technical procedure with which the plan treats wastewater. Note any relevant particularities. If needed, include a diagram of the process in an annex. | All non-domestic wastewater generators have to prepare a technical study including this item. Acuerdo Gubernativo 12-2011, article 5 and 6 | |||
| A0.002 | x | Construction year | Year of construction. When construction lasted more than one year, state ending year. | |||||
| A0.005 | x | Number of people served | ||||||
| INPUTS B | B0.001 | x | Design inflow | Flow capacity that the plant was originally designed for. | ||||
| B0.002 | x | Volume wastewater input | Total volume of water entering the plant in the reporting year | |||||
| Inflow B0 | B0.003 | Average inflow (AF) | Average flow (in a year) of wastewater into WWTP. | |||||
| B0.005 | x | Average plant capacity utilization | Percent of design capacity being used, on average, during the reporting year | |||||
| B0.006 | x | Volumetric Efficiency | Total incoming wastewater/total treated water | |||||
| Inflow quality parameters | B1.001 | x | Temperature | |||||
| B1 | B1.002 | x | BOD | Biological oxygen demand | ||||
| B1.003 | x | COD | Chemical oxygen demand | |||||
| Inflow Nutrients | B1.004 | x | Total Nitrogen | |||||
| B1.008 | x | Total Phosphorus | ||||||
| Salts inflow | B1.009 | x | K | |||||
| B1.010 | x | Ca | ||||||
| B1.011 | x | Mg | ||||||
| B1.012 | x | Na | ||||||
| B1.014 | x | Electric conductivity | Useful when data for Na and other related parameters is not available, as general guidance of salts contents. | |||||
| B1.015 | x | Faecal coliforms | ||||||
| Pathogens inflow | B1.016 | x | E.coli | |||||
| B1.021 | x | TSS | Total suspended solids | |||||
| B1.023 | x | pH | ||||||
| B1.025 | x | As | ||||||
| B1.026 | x | Cd | ||||||
| B1.028 | x | Cr | ||||||
| B1.029 | x | Cu | ||||||
| B1.030 | x | Fe | ||||||
| B1.031 | x | Mn | ||||||
| B1.032 | x | Ni | ||||||
| B1.033 | x | Ti | ||||||
| B1.034 | x | Zn | ||||||
| B1.035 | x | Hg | ||||||
| B1.036 | x | Pb | ||||||
| B1.037 | x | Se | ||||||
| B1.038 | x | B | ||||||
| B1.039 | x | Mo | ||||||
| Others | B1.040 | x | Residual chlorine | |||||
| B1.041 | Grease and oils | |||||||
| B1.042 | Floating matter | |||||||
| B1.043 | Colour | |||||||
| B2.003 | x | Total energy consumed | Energy consumed in the reporting year, all energy carriers together and all energy uses considered. | |||||
| B2.004 | x | Energy/m3 treated water | ||||||
| OUTPUTS C | C0.001 | x | Total volume Treated Water produced | Total Outflow of wastewater from the plant, in yearly total average. | ||||
| C1.001 | x | Temperature | ||||||
| C1.002 | x | BOD | Biological oxygen demand | |||||
| C1.003 | x | COD | Chemical oxygen demand | |||||
| C1.004 | x | Total Nitrogen | ||||||
| Nutrients in outflow | C1.006 | x | Nitrates | |||||
| C1.007 | x | Nitrites | ||||||
| C1.008 | x | Total Phosphorus | ||||||
| Salts in outflow | C1.009 | x | K | |||||
| C1.010 | x | Ca | ||||||
| C1.011 | x | Mg | ||||||
| C1.012 | x | Na | ||||||
| C1.014 | x | Electric conductivity | Useful when data for Na and other related parameters is not available, as general guidance of salts contents. | |||||
| Pathogens in outflow | C1.015 | x | Faecal coliforms | |||||
| C1.016 | x | E.coli | ||||||
| C1.017 | x | Helminths | ||||||
| C1.021 | Sedimentable solids | |||||||
| C1.022 | x | TSS | Total suspended solids | |||||
| C1.024 | x | pH | ||||||
| C1.026 | x | As | ||||||
| C1.027 | x | Cd | ||||||
| C1.028 | Cyanide (CN) | |||||||
| C1.030 | x | Cr | ||||||
| C1.031 | x | Cu | ||||||
| C1.034 | x | Ni | ||||||
| C1.036 | x | Zn | ||||||
| C1.037 | x | Hg | ||||||
| C1.038 | x | Pb | ||||||
| C1.043 | Grease and oils | |||||||
| C1.044 | Floating matter | |||||||
| C1.045 | Colour | |||||||
| Wastewater Reuse C2 | C2.001 | x | Percentage of wastewater output being recycled or reused | |||||
| Sludge C3 | C3.001 | x | Total Sludge produced yearly | Total amount of sludge produced in the reporting year. | ||||
| Metals, metalloids and trace elements in sludge | C3.003 | x | As | |||||
| C3.004 | x | Cd | ||||||
| C3.006 | x | Cr | ||||||
| C3.007 | x | Cu | ||||||
| C3.010 | x | Ni | ||||||
| C3.012 | x | Zn | ||||||
| C3.013 | x | Hg | ||||||
| C3.014 | x | Pb | ||||||
| Pathogens in sludge | C3.031 | x | Helminths | |||||
| C3.032 | x | Total coliforms | ||||||
| C3.034 | Salmonella sp. | |||||||
| sludge use C4 | C4.001 | x | Scope of sludge management | % of sludge that is managed, including treatment in different ways, such as use in agriculture, thermal disposal, landfills, etc. As proposed by Popovic & Kraslawski (2018) | ||||
| GHG Emissions | C5.006 | x | Are there complaints regarding odours? | E.g., neighbours | ||||
| C5.007 | x | Strength of odour in the treated wastewater | high, medium, low | |||||
| Solid Waste | C6.002 | x | Solid waste sustainable management plan | Is there a waste management programme in place that considers reuse and/or recycling of solid waste, and/or plans to reduce waste or eliminate it, e.g. by changing inputs? | ||||
| Staff D0 | D0.003 | x | Employee/inhabitant ratio | Number of employees per 1000 inhabitants served by the plant. | ||||
| Management D1 | D1.001 | x | Existence Operation manual | Does a clear, up to date operations manual exist on site, and available to all people operating the plant? | ||||
| D1.002 | x | Regularity of maintenance | ||||||
| Capacities D2 | D2.001 | x | Capacity sufficiency | Does all the personnel involved have the knowledge and skills they need to have? | ||||
| D2.003 | x | Accessible Sampling and processing equipment | Does the plant have its own equipment or easy and hassle-free access to sampling and analysis to monitor wastewater, treated water and by-products quality? | |||||
| Compliance and certification D3 | D3.001 | x | Discharge standards compliance | Percent of time that the plant’s outflow complies with applicable regulations. State which regulations are being considered | ||||
| D3.002 | x | Analysis frequency compliance | Ratio between the number of effluent samplings per month and number of effluent sampling per month required by law of wastewater treatment policy (as proposed by Popovic & Kraslawski (2018)) | |||||
| D3.003 | Certification | Does the plant have some quality certification (ISO, or other national/international standards) | ||||||
| RISK E1 | E0.001 | x | Has a health risk assessment related to wastewater been performed at the site? | |||||
| E0.002 | x | Are health risks being managed? | ||||||
| Health E0 | E0.003 | x | Do the operators have the necessary health and safety equipment? | |||||
| E1.001 | Has a natural hazard risk assessment been performed at the facility? | |||||||
| E1.002 | Are natural hazard risks being managed? | |||||||
| E1.003 | Has an environmental impact study relating wastewater with ecosystem health been performed at the site? | |||||||
| Other hazards E1 | E1.004 | x | What efforts are being made to reduce or manage environmental impacts? | |||||
| E1.005 | Presence or risk of groundwater pollution | |||||||
| E1.006 | Presence or risk of surface water pollution | |||||||
| DATASET IIA.01—Social Economic Data—WWTP Scale | ||||||||
| Category | ID | PS | LI | Data Item | Item Description | Notes | ||
| Costs A0 | A0.002 | x | Cost per m3 of water treated | Cost of producing one cubic meter of water | ||||
| 16 | A0.003 | x | Cost per inhabitant served | |||||
| A0.009 | Proportion of costs: training, capacity building | What proportion of the total expenses corresponds to energy? | ||||||
| Income A1 | A1.001 | x | Total plant income | Total income of the plant yearly. Specify currency used under ‘units’ | ||||
| A1.002 | x | Real financial availability per inhabitant served | ||||||
| A1.003 | Budget deficit | |||||||
| A1.006 | x | Valorisation of by products | Are products of the plant being valorised (sold, recycled, etc.) | |||||
| DATASET IIB.01—Social Acceptance—Multi-Scalar | ||||||||
| Category | ID | PS | LI | Data item | Item description | Notes | ||
| SOCIAL B | B0.001 | Personal interest in wastewater management problems | ||||||
| Inclusion/Participation | B0.002 | Personal awareness of wastewater management problems | ||||||
| B0.003 | Willingness to be informed about the wastewater management problems | |||||||
| B0.004 | Accessibility to information | |||||||
| B0.005 | Possibilities for providing a recommendation | |||||||
| B0.006 | Recommendations are considered? | |||||||
| B0.007 | Willingness to participate in decision-making | |||||||
| B0.008 | Participative decision-making | |||||||
| B0.009 | Personal acceptance of the current wastewater management | |||||||
| B0.010 | Perception of social acceptance of the current wastewater management | |||||||
Appendix C
| Dataholders for the Panajachel Study Site—Final List | |||||||||
| 1—Stakeholder Local/Municipality | 2—Stakeholder Provincial or National | 3—Own Calculations | 4—Scientist Interview or Scientific Literature | 5—NGO Interview or Report | |||||
| 1 | Plant operator Julio Pablo de León | 1 | AMSCLAE interviews | 1 | Sampling and analysis | 1 | UVG—CEA | 1 | Amigos del Lago |
| 2 | Encargado de la planta Cebollales Ing. Genaro Umul | 2 | AMSCLAE reports | 2 | Calculations | 2 | Laura Ferrans | 2 | Mancomunidad (Mankatitlán). Delvín Rolón, gerente |
| 3 | Environmental office (oficina municipal del medio ambiente)/DIGAM | 3 | NE | 3 | ERIS | 3 | Proyecto ProAtitlán | ||
| 4 | Reports, monographs, other documentation published by municipality | 4 | MARN—provincial delegation at Sololá | 4 | Elisandra Hernandez USAC | 4 | ANACAFE | ||
| 5 | DGP—Planning authority at the municipality. Oficina Municipal de Agua | 5 | Ministerio de Salud | 5 | Puravida | ||||
| 6 | Agua | 6 | MAGA—Ministerio de agricultura y ganadería | 6 | Vivamos mejor | ||||
| 7 | Instituto Nacional de Estadística | ||||||||
| 8 | Energuate | ||||||||
| Dataholders for the Tepeji Study Site—Final List | |||||||||
| 1—Stakeholder Local/Municipality | 2—Stakeholder Provincial or National | 3—Own Calculations | 4—Scientist Interview or Scientific Literature | 5—NGO Interview or Report | |||||
| 1 | CAAMTROH director | 1 | CONAGUA at state capital Pachuca | 1 | Sampling and analysis | 1 | Research by UNAM | ||
| 2 | CAAMTROH/Field personnel | 2 | CONAGUA central office Mexico City | 2 | Calculations | ||||
| 3 | Dirección de ecología municipal | 3 | INEGI | ||||||
| 4 | FIAVHI director | ||||||||
| 5 | FIAVHI technical staff | ||||||||
| 6 | Plant operator | ||||||||
| 7 | Urban development office at the municipality | ||||||||
| 8 | Owner of agricultural field who will receive treated WW | ||||||||
Appendix D
| Water Quality Parameters Analyzed in Panajachel—Field Campaign 08.2018 | |||
| Raw (WW) and Treated Wastewater (TWW) | Sludge | ||
| 1 | Temperature | 1 | Fecal coliforms |
| 2 | pH | 2 | Helminth eggs |
| 3 | Grease and oils | 3 | Al |
| 4 | Floating matter | 4 | As |
| 5 | BOD | 5 | Ca |
| 6 | COD | 6 | Cd |
| 7 | TSS | 7 | Co |
| 8 | Total Nitrogen | 8 | Cr |
| 9 | Total Phosphorus | 9 | Cu |
| 10 | Fecal coliforms | 10 | Fe |
| 11 | Apparent Color | 11 | Hg |
| 12 | Al | 12 | K |
| 13 | As | 13 | Mn |
| 14 | Ca | 14 | Na |
| 15 | Cd | 15 | Ni |
| 16 | Co | 16 | P |
| 17 | Cr | 17 | Pb |
| 18 | Cu | 18 | Se |
| 19 | Fe | 19 | Zn |
| 20 | Hg | ||
| 21 | K | ||
| 22 | Mn | ||
| 23 | Na | ||
| 24 | Ni | ||
| 25 | P | ||
| 26 | Pb | ||
| 27 | Se | ||
| 28 | Zn | ||
| Water Quality Parameters Analyzed in Tepeji—Field Campaign 08.2018 | |
| Raw and Treated Wastewater | |
| 1 | Grease and oils |
| 2 | Floating matter |
| 3 | BOD |
| 4 | COD |
| 5 | Suspended solids |
| 6 | TN |
| 7 | TP |
| 8 | pH |
| 9 | Fecal coliforms |
| 10 | Apparent color |
| 11 | Al |
| 12 | As |
| 13 | Ca |
| 14 | Cd |
| 15 | Co |
| 16 | Cr |
| 17 | Cu |
| 18 | Fe |
| 19 | Hg |
| 20 | K |
| 21 | Mn |
| 22 | Na |
| 23 | Ni |
| 24 | P |
| 25 | Pb |
| 26 | Se |
| 27 | Zn |
| 27 | Cn |
| 28 | Sedimentable solids |
| 29 | Nitrites |
| 30 | Nitrates |
Appendix E
Variables and threshold values considered for the Sustainability Assessment at the two study sites (Panajachel, Guatemala and Tepeji, Mexico). This table discloses the values and sources of the thresholds used in the Sustainability Assessment.
| Variables and Thresholds for SA in Panajachel | ||||||||
| Gt: Guatemala Regulation Mx: Mexican Regulation ST-Team: SludgeTec Team WHO (2006): Guidelines for SUWA—Vol 2 | ||||||||
| No. | Code (ID) | Variable | Unit | Threshold Value | Source | Red | Yellow | Green |
| 1 | TE7B | Temperature—WW | °C | 40 | AG 12-2011 Art. 14 (p.10) Gt | >44 | >40 and ≤44 | ≤40 |
| 2 | TE8B | Biological Oxygen Demand (BOD)—WW | mg/L | 100 | AG 12-2011 Art. 14 (p.10) Gt | >110 | >100 and ≤110 | ≤100 |
| 3 | TE9B | Chemical Oxygen Demand (COD)—WW | mg/L | 200 | AG 12-2011 Art. 14 (p.10) Gt | >220 | >200 and ≤220 | ≤200 |
| 4 | TE10B | Total Nitrogen—WW | mg/L | 20 | AG 12-2011 Art. 14 (p.10) Gt | >22 | >20 and ≤22 | ≤20 |
| 5 | TE11B | Total Phosphorus—WW | mg/L | 10 | AG 12-2011 Art. 14 (p.10) Gt | >11 | >10 and ≤11 | ≤10 |
| 6 | TE12B | Faecal coliforms—WW | MPN/100 mL | 100,000 | AG 12-2011 Art. 14 (p.10) Gt | >110,000 | >100,000 and ≤110,000 | ≤100,000 |
| 7 | TE14B | Total Suspended Solids (TSS)—WW | mg/L | 125 | AG 12-2011 Art. 14 (p.10) Gt | >137.5 | >125 and ≤137.5 | ≤125 |
| 8 | TE15B | pH—WW | pH unit | between 6–9 | AG 12-2011 Art. 14 (p.10) Gt | <6 and >9 | - | ≥6 and ≤9 |
| 9 | TE19C | Temperature—TWW | °C | TRWB ±3 | AG 12-2011 Art. 11 (p.7) Gt | <20 and >26 | - | ≥20 and ≤26 |
| 10 | TE20C | Biological Oxygen Demand (BOD)—TWW | mg/L | 30 | AG 12-2011 Art. 11 (p.7) Gt | >33 | >30 and ≤33 | ≤30 |
| 11 | TE21C | Chemical Oxygen Demand (COD)—TWW | mg/L | 60 | AG 12-2011 Art. 11 (p.7) Gt | >66 | >60 and ≤66 | ≤60 |
| 12 | TE22C | Total Nitrogen—TWW | mg/L | 5 | AG 12-2011 Art. 11 (p.7) Gt | >5.5 | >5 and ≤5.5 | ≤5 |
| 13 | TE23C | Total Phosphorus—TWW | mg/L | 3 | AG 12-2011 Art. 11 (p.7) Gt | >3.3 | >3 and ≤3.3 | ≤3 |
| 14 | TE24C | Faecal coliforms—TWW | MPN/100 mL | 500 | AG 12-2011 Art. 11 (p.7) Gt | >550 | >500 and ≤550 | ≤500 |
| 15 | TE26C | Helminths—TWW | - | 5 | NOM-003-SEMARNAT-1997 Mx | >5.5 | >5 and ≤5.5 | ≤5 |
| 16 | TE29C | Total Suspended Solids (TSS)—TWW | mg/L | 40 | AG 12-2011 Art. 11 (p.7) Gt | >44 | >40 and ≤44 | ≤40 |
| 17 | TE31C | pH—TWW | pH units | between 6–9 | AG 12-2011 Art. 11 (p.7) Gt | <6 and >9 | - | ≥6 and ≤9 |
| 18 | TE33C | Arsenic (As)—TWW | mg/L | 0.1 | AG 12-2011 Art. 11 (p.10) Gt | >0.11 | >0.1 and ≤0.11 | ≤0.1 |
| 19 | TE34C | Cadmium (Cd)—TWW | mg/L | 0.1 | AG 12-2011 Art. 11 (p.10) Gt | >0.11 | >0.1 and ≤0.11 | ≤0.1 |
| 20 | TE37C | Chromium (Cr)—TWW | mg/L | 0.1 | AG 12-2011 Art. 11 (p.10) Gt | >0.11 | >0.1 and ≤0.11 | ≤0.1 |
| 21 | TE38C | Copper (Cu)—TWW | mg/L | 0.5 | AG 12-2011 Art. 11 (p.10) Gt | >0.55 | >0.5 and ≤0.55 | ≤0.5 |
| 22 | TE41C | Nickel (Ni)—TWW | mg/L | 0.5 | AG 12-2011 Art. 11 (p.10) Gt | >0.55 | >0.5 and ≤0.55 | ≤0.5 |
| 23 | TE43C | Zinc (Zn)—TWW | mg/L | 1 | AG 12-2011 Art. 11 (p.10) Gt | >1.1 | >1 and ≤1.1 | ≤1 |
| 24 | TE44C | Mercury (Hg)—TWW | mg/L | 0.01 | AG 12-2011 Art. 11 (p.10) Gt | >0.011 | >0.01 and ≤0.01 | ≤0.01 |
| 25 | TE45C | Lead (Pb)—TWW | mg/L | 0.1 | AG 12-2011 Art. 11 (p.10) Gt | >0.11 | >0.1 and ≤0.11 | ≤0.1 |
| 26 | TE49C | Grease and oils—TWW | mg/L | 15 | NOM-001-SEMARNAT-1996 (p.15) Mx | >16.5 | >15 and ≤16.5 | ≤15 |
| 27 | TE50C | Floating matter—TWW | Present-Absent | Present-Absent | AG 12-2011 Art. 11 (p.10) Gt | Present | - | Absent |
| 28 | TE51C | Colour—TWW | PCU | 400 | AG 12-2011 Art. 11 (p.10) Gt | >440 | >400 and ≤440 | ≤400 |
| 29 | TE52C | Water reuse | YES-NO | YES-NO | ST team | NO | - | YES |
| 30 | TE55C | Arsenic (As)—Sludge | mg/kg dry matter (104 °C) | 50 | AG 236-2006 para lodos—Application in soil Gt | >55 | >50 and ≤55 | ≤50 |
| 31 | TE56C | Cadmium (Cd)—Sludge | mg/kg dry matter (104 °C) | 50 | AG 236-2006 para lodos Gt | >55 | >50 and ≤55 | ≤50 |
| 32 | TE58C | Chromium (Cr)—Sludge | mg/kg dry matter (104 °C) | 1500 | AG 236-2006 para lodos Gt | >1650 | >1500 and ≤1650 | ≤1500 |
| 33 | TE59C | Copper (Cu)—Sludge | mg/kg (dry weight) | 1500 | NOM-004-SEMARNAT-2002 (p.6)—Excellent Biosolid Mx | >1650 | >1500 and ≤1650 | ≤1500 |
| 34 | TE62C | Nickel (Ni)—Sludge | mg/kg (dry weight) | 420 | NOM-004-SEMARNAT-2002 (p.6)—Excellent Biosolid Mx | >462 | >420 and ≤462 | ≤420 |
| 35 | TE64C | Zinc (Zn)—Sludge | mg/kg (dry weight) | 2800 | NOM-004-SEMARNAT-2002 (p.6)—Excellent Biosolid Mx | >3080 | >2800 and ≤3080 | ≤2800 |
| 36 | TE65C | Mercury (Hg)—Sludge | mg/kg dry matter (104 °C) | 25 | AG 236-2006 para lodos—Application in soil Gt | >27.5 | >25 and ≤27.5 | ≤25 |
| 37 | TE66C | Lead (Pb)—Sludge | mg/kg dry matter (104 °C) | 500 | AG 236-2006 para lodos—Application in soil Gt | >550 | >500 and ≤550 | ≤500 |
| 38 | TE71C | Helminths—Sludge | egg/g (dry weight) | 10 | NOM-004-SEMARNAT-2002 (p.6) Mx | >11 | >10 and ≤11 | ≤10 |
| 39 | TE72C | Total coliforms—Sludge | MPN/g (dry weight) | 1000 | NOM-004-SEMARNAT-2002 (p.6) Mx | >1100 | >1000 and ≤1100 | ≤1000 |
| 40 | TE74C | Salmonella—Sludge | - | 300 | NOM-004-SEMARNAT-2002 (p.6) Mx | >330 | >300 and ≤330 | ≤300 |
| 41 | TE76C | Scope of sludge management | % | 100 | ST team | <33.33 | ≥33.33 and <66.67 | ≥66.67 and ≤100 |
| 42 | TE78C | Identification of potential sludge consumers/users | YES-NO | YES-NO | ST team | NO | - | YES |
| 43 | TE80C | Quantification of GHG emissions | YES-NO | YES-NO | ST team | NO | - | YES |
| 44 | TE83D | Operation Manual | YES-NO | YES-NO | ST team | NO | - | YES |
| 45 | TE84D | Regular maintenance | YES-NO | YES-NO | ST team | NO | - | YES |
| 46 | TE85D | Capacity sufficiency | YES-NO | YES-NO | ST team | NO | - | YES |
| 47 | TE86D | Accessible Sampling and processing equipment | YES-NO | YES-NO | ST team | NO | - | YES |
| 48 | TE87D | Discharge standards compliance | YES-NO | YES-NO | ST team | NO | - | YES |
| 49 | TE88D | Analysis frequency compliance—water | samples/year | 2 | AG 236-2006 para lodos Gt | <2 | - | ≥2 |
| 50 | TE89D | Analysis frequency compliance—sludge | samples/year | 2 | AG 236-2006 para lodos Gt | <2 | - | ≥2 |
| 51 | TE90D | Certification | YES-NO | YES-NO | ST team | NO | - | YES |
| 52 | TE91D | Health risk assessment | YES-NO | YES-NO | ST team | NO | - | YES |
| 53 | TE92E | Current management of health risks | YES-NO | YES-NO | ST team | NO | - | YES |
| 54 | TE93E | Health and safety equipment | YES-NO | YES-NO | ST team | NO | - | YES |
| 55 | TE94E | Performance of risk assessment | YES-NO | YES-NO | ST team | NO | - | YES |
| 56 | TE95E | Current management of risks | YES-NO | YES-NO | ST team | NO | - | YES |
| 57 | TE96E | Environmental impact assessment (EIA) | YES-NO | YES-NO | ST team | NO | - | YES |
| 58 | TE97E | Efforts to reduce or manage environmental impacts | YES-NO | YES-NO | ST team | NO | - | YES |
| 59 | TE98E | Presence or risk of groundwater pollution | YES-NO | YES-NO | ST team | YES | - | NO |
| 60 | TE99E | Presence or risk of surface water pollution | YES-NO | YES-NO | ST team | YES | - | NO |
| 61 | Ec2A | Per capita cost of WWT | USD/hab (inhabitants)/year | 4–8 | WHO | >8.8 | >8 and ≤8.8 | ≤8 |
| 62 | Ec7A | Budget deficit | YES-NO | YES-NO | ST team | YES | - | NO |
| 63 | Ec8A | Valorisation of by-products | YES-NO | YES-NO | ST team | NO | - | YES |
| 64 | S1B | Personal interest in wastewater management problems | scale 1–4 | between 1–4 | ST team | ≥1 and <2 | ≥2 and <3 | ≥3 and ≤4 |
| 65 | S2B | Personal awareness of wastewater management problems | scale 1–4 | between 1–4 | ST team | ≥1 and <2 | ≥2 and <3 | ≥3 and ≤4 |
| 66 | S3B | Willingness to be informed about the wastewater management problems | scale 1–4 | between 1–4 | ST team | ≥1 and <2 | ≥2 and <3 | ≥3 and ≤4 |
| 67 | S4B | Accessibility to information | scale 1–4 | between 1–4 | ST team | ≥1 and <2 | ≥2 and <3 | ≥3 and ≤4 |
| 68 | S5B | Possibilities for providing a recommendation | scale 1–4 | between 1–4 | ST team | ≥1 and <2 | ≥2 and <3 | ≥3 and ≤4 |
| 69 | S9B | Personal acceptance of the current wastewater management | scale 1–4 | between 1–4 | ST team | ≥1 and <2 | ≥2 and <3 | ≥3 and ≤4 |
| 70 | S10B | Perception of social acceptance of the current wastewater management | scale 1–4 | between 1–4 | ST team | ≥1 and <2 | ≥2 and <3 | ≥3 and ≤4 |
| Variables and Thresholds for SA in Tepeji | ||||||||
| Gt: Guatemala Regulation Mx: Mexican Regulation ST-Team: SludgeTec Team WHO (2006): Guidelines for SUWA—Vol 2 | ||||||||
| No. | Code (ID) | Variable | Unit | Threshold Value | Source | Red | Yellow | Green |
| 1 | TE9B | Temperature—WW | °C | 40 | AG 236-2006 Art. 28 Gt | >44 | >40 and ≤44 | ≤40 |
| 2 | TE12B | Total Nitrogen—WW | mg/L | 80 | AG 236-2006 Art. 28 Gt | >88 | >80 and ≤88 | ≤80 |
| 3 | TE13B | Total Phosphorus—WW | mg/L | 20 | AG 236-2006 Art. 28 Gt | >22 | >20 and ≤22 | ≤20 |
| 4 | TE19B | Faecal coliforms—WW | MPN/100 mL | 10,000 | AG 236-2006 Art. 28 Gt | >1100 | >1000 and ≤1100 | ≤1000 |
| 5 | TE22B | pH—WW | pH unit | between 6–9 | AG 236-2006 Art. 28 Gt | <6 and >9 | - | ≥6 and ≤9 |
| 6 | TE23B | Arsenic (As)—WW | mg/L | 0.5 | NOM-002-SEMARNAT-1996 (p.41) Mx | >0.55 | >0.5 and ≤0.55 | ≤0.5 |
| 7 | TE24B | Cadmium (Cd)—WW | mg/L | 0.5 | NOM-002-SEMARNAT-1996 (p.41) Mx | >0.55 | >0.5 and ≤0.55 | ≤0.5 |
| 8 | TE25B | Chromium (Cr)—WW | mg/L | 0.5 | NOM-002-SEMARNAT-1996 (p.41) Mx | >0.55 | >0.5 and ≤0.55 | ≤0.5 |
| 9 | TE26B | Copper (Cu)—WW | mg/L | 10 | NOM-002-SEMARNAT-1996 (p.41) Mx | >11 | >10 and ≤11 | ≤10 |
| 10 | TE29B | Nickel (Ni)—WW | mg/L | 4 | NOM-002-SEMARNAT-1996 (p.41) Mx | >4.4 | >4 and ≤4.4 | ≤4 |
| 11 | TE31B | Zinc (Zn)—WW | mg/L | 6 | NOM-002-SEMARNAT-1996 (p.41) Mx | >6.6 | >6 and ≤6.6 | ≤6 |
| 12 | TE32B | Mercury (Hg)—WW | mg/L | 0.01 | NOM-002-SEMARNAT-1996 (p.41) Mx | >0.011 | >0.01 and ≤0.01 | ≤0.01 |
| 13 | TE33B | Lead (Pb)—WW | mg/L | 1 | NOM-002-SEMARNAT-1996 (p.41) Mx | >1.1 | >1 and ≤1.1 | ≤1 |
| 14 | TE38B | Grease and oils—WW | mg/L | 50 | NOM-002-SEMARNAT-1996 (p.41) Mx | >55 | >50 and ≤55 | ≤50 |
| 15 | TE39B | Floating matter—WW | Absent-Present | Absent | AG 236-2006 Art. 28 Gt | Present | - | Absent |
| 16 | TE40B | Colour—WW | PCU | 500 | AG 236-2006 Art. 28 Gt | >550 | >500 and ≤550 | ≤500 |
| 17 | TE47C | Total Nitrogen—TWW | mg/L | 30 | WHO | >33 | >30 and ≤33 | ≤30 |
| 18 | TE54C | Sodium (Na)—TWW | meq/l | 9 | WHO | >9.9 | >9 and ≤9.9 | ≤9 |
| 19 | TE55C | Electric conductivity—TWW | µS/cm | 30 | WHO | >33 | >30 and ≤33 | ≤30 |
| 20 | TE56C | Faecal coliforms—TWW | MPN/100 mL | 1000 | NOM-003-SEMARNAT-1997 Mx | >1100 | >1000 and ≤1100 | ≤1000 |
| 21 | TE58C | Helminths—TWW | egg/L | 5 | NOM-003-SEMARNAT-1997 Mx | >5.5 | >5 and ≤5.5 | ≤5 |
| 22 | TE60C | Total Suspended Solids (TSS)—TWW | mg/L | 100 | WHO | >110 | >100 and ≤110 | ≤100 |
| 23 | TE61C | pH—TWW | pH units | between 6.5–8 | WHO | <6.5 and >8 | - | ≥6.5 and ≤8 |
| 24 | TE62C | Arsenic (As)—TWW | mg/L | 0.1 | WHO | >0.11 | >0.1 and ≤0.11 | ≤0.1 |
| 25 | TE63C | Cadmium (Cd)—TWW | mg/L | 0.01 | WHO | >0.011 | >0.01 and ≤0.01 | ≤0.01 |
| 26 | TE64C | Cyanide (CN)—TWW | mg/L | 2 | NOM-001-SEMARNAT-1996 (p.14) Mx | >2.2 | >2 and ≤2.2 | ≤2 |
| 27 | TE65C | Chromium (Cr)—TWW | mg/L | 0.1 | WHO | >0.11 | >0.1 and ≤0.11 | ≤0.1 |
| 28 | TE66C | Cupper (Cu)—TWW | mg/L | 0.2 | WHO | >0.11 | >0.1 and ≤0.11 | ≤0.1 |
| 29 | TE67C | Nickel (Ni)—TWW | mg/L | 0.2 | WHO | >0.11 | >0.1 and ≤0.11 | ≤0.1 |
| 30 | TE68C | Zinc (Zn)—TWW | mg/L | 2 | WHO | >2.2 | >2 and ≤2.2 | ≤2 |
| 31 | TE69C | Mercury (Hg)—TWW | mg/L | 0.005 | NOM-001-SEMARNAT-1996 (p.14) Mx | >0.0055 | >0.01 and ≤0.01 | ≤0.01 |
| 32 | TE70C | Lead (Pb)—TWW | mg/L | 5 | WHO | >5.5 | >5 and ≤5.5 | ≤5 |
| 33 | TE71C | Grease and oils—TWW | mg/L | 15 | NOM-001-SEMARNAT-1996 (p.14) Mx | >16.5 | >15 and ≤16.5 | ≤15 |
| 34 | TE72C | Floating matter—TWW | Absent-Present | Absent | NOM-001-SEMARNAT-1996 (p.14) Mx | Present | - | Absent |
| 35 | TE73C | Colour—TWW | PCU | 400 | AG 12-2011 Art. 11 (p.10) Gt | >440 | >400 and ≤440 | ≤400 |
| 36 | TE74C | Water reuse | % | between 0–100 | ST team | <33.33 | ≥33.33 and <66.67 | ≥66.67 and ≤100 |
| 37 | TE88C | Odours | YES-NO | YES-NO | ST team | YES | - | NO |
| 38 | TE89C | Solid waste management | - | YES-NO | ST team | NO | - | YES |
| 39 | TE91C | Operation Manual | YES-NO | YES-NO | ST team | NO | - | YES |
| 40 | TE92C | Regular Maintenance | YES-NO | YES-NO | ST team | NO | - | YES |
| 41 | TE93C | Capacity sufficiency | YES-NO | YES-NO | ST team | NO | - | YES |
| 42 | TE94C | Accessible Sampling and processing equipment | YES-NO | YES-NO | ST team | NO | - | YES |
| 43 | TE95C | Discharge standards compliance | YES-NO | YES-NO | ST team | NO | - | YES |
| 44 | TE96C | Analysis frequency compliance—water | YES-NO | YES-NO | ST team | NO | - | YES |
| 45 | TE98C | Certification | YES-NO | YES-NO | ST team | NO | - | YES |
| 46 | TE99C | Health risk assessment | YES-NO | YES-NO | ST team | 0 | - | - |
| 47 | TE100C | Current management of health risks | YES-NO | YES-NO | ST team | NO | - | YES |
| 48 | TE101C | Health and safety equipment | YES-NO | YES-NO | ST team | NO | - | YES |
| 49 | TE102C | Performance of risk assessment | YES-NO | YES-NO | ST team | NO | - | YES |
| 50 | TE103C | Current management of risks | YES-NO | YES-NO | ST team | 0 | - | - |
| 51 | TE104C | Environmental impact assessment (EIA) | YES-NO | YES-NO | ST team | NO | - | YES |
| 52 | TE105C | Efforts to reduce or manage environmental impacts | YES-NO | YES-NO | ST team | 0 | - | - |
| 53 | TE106C | Presence or risk of groundwater pollution | YES-NO | YES-NO | ST team | 0 | - | - |
| 54 | TE107C | Presence or risk of surface water pollution | YES-NO | YES-NO | ST team | YES | - | NO |
| 55 | Ec2A | Per capita cost of WWT | USD/hab/year | 1–1.5 | WHO | >8.8 | >8 and ≤8.8 | ≤1.5 |
| 56 | Ec6A | Budget deficit | YES-NO | YES-NO | ST team | YES | - | NO |
| 57 | Ec7A | Valorisation of by-products | YES-NO | YES-NO | ST team | NO | - | YES |
| 58 | S1B | Personal interest in wastewater management problems | scale 1–4 | between 1–4 | ST team | ≥1 and <2 | ≥2 and <3 | ≥3 and ≤4 |
| 59 | S2B | Personal awareness of wastewater management problems | scale 1–4 | between 1–4 | ST team | ≥1 and <2 | ≥2 and <3 | ≥3 and ≤4 |
| 60 | S3B | Willingness to be informed about the wastewater management problems | scale 1–4 | between 1–4 | ST team | ≥1 and <2 | ≥2 and <3 | ≥3 and ≤4 |
| 61 | S4B | Accessibility to information | scale 1–4 | between 1–4 | ST team | ≥1 and <2 | ≥2 and <3 | ≥3 and ≤4 |
| 62 | S5B | Possibilities for providing a recommendation | scale 1–4 | between 1–4 | ST team | ≥1 and <2 | ≥2 and <3 | ≥3 and ≤4 |
| 63 | S9B | Personal acceptance of the current wastewater management | scale 1–4 | between 1–4 | ST team | ≥1 and <2 | ≥2 and <3 | ≥3 and ≤4 |
| 64 | S10B | Perception of social acceptance of the current wastewater management | scale 1–4 | between 1–4 | ST team | ≥1 and <2 | ≥2 and <3 | ≥3 and ≤4 |
Appendix F
| Sustainability Assessment Results Per Variable (Panajachel, Guatemala) | |||||
| R: Red Y: Yellow G: Green | |||||
| No. | Code (ID) | Variable | Unit | Measured/Gathered Data | Category |
| 1 | TE7B | Temperature—WW | °C | 23.50 | G |
| 2 | TE8B | Biological Oxygen Demand (BOD)—WW | mg/L | 1060.00 | R |
| 3 | TE9B | Chemical Oxygen Demand (COD)—WW | mg/L | 1150.00 | R |
| 4 | TE10B | Total Nitrogen—WW | mg/L | 33.05 | R |
| 5 | TE11B | Total Phosphorus—WW | mg/L | 26.65 | R |
| 6 | TE12B | Faecal coliforms—WW | MPN/100 mL | 2.75 × 10¹⁵ | R |
| 7 | TE14B | Total Suspended Solids (TSS)—WW | mg/L | 610.00 | R |
| 8 | TE15B | pH—WW | pH unit | 7.27 | G |
| 9 | TE19C | Temperature—TWW | °C | 22.68 | G |
| 10 | TE20C | Biological Oxygen Demand (BOD)—TWW | mg/L | 287.50 | R |
| 11 | TE21C | Chemical Oxygen Demand (COD)—TWW | mg/L | 224.00 | R |
| 12 | TE22C | Total Nitrogen—TWW | mg/L | 33.50 | R |
| 13 | TE23C | Total Phosphorus—TWW | mg/L | 16.19 | R |
| 14 | TE24C | Faecal coliforms—TWW | MPN/100 mL | 1.32 × 10¹¹ | R |
| 15 | TE29C | Total Suspended Solids (TSS)—TWW | mg/L | 565.00 | R |
| 16 | TE31C | pH—TWW | pH units | 6.80 | G |
| 17 | TE33C | Arsenic (As)—TWW | mg/L | Not detectable | G |
| 18 | TE34C | Cadmium (Cd)—TWW | mg/L | Not detectable | G |
| 19 | TE37C | Chromium (Cr)—TWW | mg/L | 0.10 | G |
| 20 | TE38C | Copper (Cu)—TWW | mg/L | 0.01 | G |
| 21 | TE41C | Nickel (Ni)—TWW | mg/L | Not detectable | G |
| 22 | TE43C | Zinc (Zn)—TWW | mg/L | 0.12 | G |
| 23 | TE44C | Mercury (Hg)—TWW | mg/L | Not detectable | G |
| 24 | TE45C | Lead (Pb)—TWW | mg/L | Not detectable | G |
| 25 | TE49C | Grease and oils—TWW | mg/L | 367.50 | R |
| 26 | TE50C | Floating matter—TWW | Present-Absent | Present | R |
| 27 | TE51C | Colour—TWW | PCU | 648.00 | R |
| 28 | TE52C | Water reuse | YES-NO | NO | R |
| 29 | TE55C | Arsenic (As)—Sludge | mg/kg dry matter (104 °C) | 53.00 | Y |
| 30 | TE56C | Cadmium (Cd)—Sludge | mg/kg dry matter (104 °C) | 1.00 | G |
| 31 | TE58C | Chromium (Cr)—Sludge | mg/kg dry matter (104 °C) | 60.00 | G |
| 32 | TE59C | Copper (Cu)—Sludge | mg/kg (dry weight) | 100.00 | G |
| 33 | TE62C | Nickel (Ni)—Sludge | mg/kg (dry weight) | 21.00 | G |
| 34 | TE64C | Zinc (Zn)—Sludge | mg/kg (dry weight) | 0.15 | G |
| 35 | TE65C | Mercury (Hg)—Sludge | mg/kg dry matter (104 °C) | Not detectable | G |
| 36 | TE66C | Lead (Pb)—Sludge | mg/kg dry matter (104 °C) | 61.00 | G |
| 37 | TE71C | Helminths—Sludge | egg/g (dry weight) | 9.00 | G |
| 38 | TE72C | Total coliforms—Sludge | MPN/g (dry weight) | 9 × 10¹³ | R |
| 39 | TE76C | Scope of sludge management | % | Negligible | R |
| 40 | TE78C | Identification of potential sludge consumers/users | YES-NO | 0.00 | G |
| 41 | TE83D | Operation Manual | YES-NO | NO | Y |
| 42 | TE84D | Regular maintenance | YES-NO | NO | R |
| 43 | TE85D | Capacity sufficiency | YES-NO | NO | R |
| 44 | TE86D | Accessible Sampling and processing equipment | YES-NO | NO | R |
| 45 | TE88D | Analysis frequency compliance—water | samples/year | 2 | G |
| 46 | TE89D | Analysis frequency compliance—sludge | samples/year | 2 | G |
| 47 | TE90D | Certification | YES-NO | NO | R |
| 48 | TE91D | Health risk assessment | YES-NO | NO | R |
| 49 | TE93E | Health and safety equipment | YES-NO | NO | R |
| 50 | TE94E | Performance of risk assessment | YES-NO | NO | R |
| 51 | TE96E | Environmental impact assessment (EIA) | YES-NO | NO | R |
| 52 | TE99E | Presence or risk of surface water pollution | YES-NO | YES | R |
| 53 | Ec2A | Per capita cost of WWT | USD/hab/year | 1.00 | R |
| 54 | Ec7A | Budget deficit | YES-NO | Yes | R |
| 55 | Ec8A | Valorisation of by-products | YES-NO | No | R |
| 56 | S1B | Personal interest in wastewater management problems | scale 1–4 | 4.00 | G |
| 57 | S2B | Personal awareness of wastewater management problems | scale 1–4 | 4.00 | G |
| 58 | S3B | Willingness to be informed about the wastewater management problems | scale 1–4 | 3.60 | G |
| 59 | S4B | Accessibility to information | scale 1–4 | 2.40 | Y |
| 60 | S5B | Possibilities for providing a recommendation | scale 1–4 | 3.40 | G |
| 61 | S9B | Personal acceptance of the current wastewater management | scale 1–4 | 1.20 | R |
| 62 | S10B | Perception of social acceptance of the current wastewater management | scale 1–4 | 1.30 | R |
| Sustainability Assessment Results Per variable (Tepeji, Mexico) | |||||
| R: Red Y: Yellow G: Green | |||||
| No. | Code (ID) | Variable | Unit | Measured/Gathered Data | Category |
| 1 | TE9B | Temperature—WW | °C | 21.00 | G |
| 2 | TE12B | Total Nitrogen—WW | mg/L | 115.38 | R |
| 3 | TE13B | Total Phosphorus—WW | mg/L | 4.71 | G |
| 4 | TE19B | Faecal coliforms—WW | MPN/100 mL | 2.40 × 10³ | R |
| 5 | TE22B | pH —WW | pH unit | 8.85 | G |
| 6 | TE23B | Arsenic (As)—WW | mg/L | 0.00 | G |
| 7 | TE24B | Cadmium (Cd)—WW | mg/L | 0.02 | G |
| 8 | TE25B | Chromium (Cr)—WW | mg/L | 0.05 | G |
| 9 | TE26B | Cupper (Cu)—WW | mg/L | 0.02 | G |
| 10 | TE29B | Nickel (Ni)—WW | mg/L | 0.05 | G |
| 11 | TE31B | Zinc (Zn)—WW | mg/L | 0.02 | G |
| 12 | TE32B | Mercury (Hg)—WW | mg/L | 0.00 | G |
| 13 | TE33B | Lead (Pb)—WW | mg/L | 0.00 | G |
| 14 | TE38B | Grease and oils—WW | mg/L | 5.41 | G |
| 15 | TE39B | Floating matter—WW | Absent-Present | Absent | G |
| 16 | TE40B | Colour—WW | PCU | 100.00 | G |
| 17 | TE47C | Total Nitrogen—TWW | mg/L | 120.62 | R |
| 18 | TE55C | Electric conductivity—TWW | µS/cm | 1.84 | G |
| 19 | TE56C | Faecal coliforms—TWW | MPN/100 mL | 2400.00 | R |
| 20 | TE60C | Total Suspended Solids (TSS)—TWW | mg/L | 46.00 | G |
| 21 | TE61C | pH —TWW | pH units | 8.32 | R |
| 22 | TE62C | Arsenic (As)—TWW | mg/L | 0.00 | G |
| 23 | TE63C | Cadmium (Cd)—TWW | mg/L | 0.02 | R |
| 24 | TE64C | Cyanide (CN)—TWW | mg/L | 0.64 | G |
| 25 | TE65C | Chromium (Cr)—TWW | mg/L | 0.05 | G |
| 26 | TE66C | Cupper (Cu)—TWW | mg/L | 0.02 | G |
| 27 | TE67C | Nickel (Ni)—TWW | mg/L | 0.05 | G |
| 28 | TE68C | Zinc (Zn)—TWW | mg/L | 0.02 | G |
| 29 | TE69C | Mercury (Hg)—TWW | mg/L | 0.00 | G |
| 30 | TE70C | Lead (Pb)—TWW | mg/L | 0.10 | G |
| 31 | TE71C | Grease and oils—TWW | mg/L | 5.00 | G |
| 32 | TE72C | Floating matter—TWW | Absent-Present | Absent | G |
| 33 | TE73C | Colour—TWW | PCU | 100.00 | G |
| 34 | TE74C | Water reuse | % | 100.00 | G |
| 35 | TE88C | Odours | YES-NO | YES | R |
| 36 | TE89C | Solid waste management | - | NO | R |
| 37 | TE91C | Operation Manual | YES-NO | NO | R |
| 38 | TE92C | Regular Maintenance | YES-NO | Daily | G |
| 39 | TE93C | Capacity sufficiency | YES-NO | NO | R |
| 40 | TE94C | Accessible Sampling and processing equipment | YES-NO | NO | R |
| 41 | TE95C | Discharge standards compliance | YES-NO | NO | R |
| 42 | TE96C | Analysis frequency compliance—water | YES-NO | NO | R |
| 43 | TE98C | Certification | YES-NO | YES | G |
| 44 | TE100C | Current management of health risks | YES-NO | YES | G |
| 45 | TE101C | Health and safety equipment | YES-NO | YES | G |
| 46 | TE102C | Performance of risk assessment | YES-NO | NO | R |
| 47 | TE104C | Environmental impact assessment (EIA) | YES-NO | NO | R |
| 48 | TE107C | Presence or risk of surface water pollution | YES-NO | NO | G |
| 49 | S1B | Personal interest in wastewater management problems | scale 1–4 | 3.71 | G |
| 50 | S2B | Personal awareness of wastewater management problems | scale 1–4 | 3.57 | G |
| 51 | S3B | Willingness to be informed about the wastewater management problems | scale 1–4 | 3.29 | G |
| 52 | S4B | Accessibility to information | scale 1–4 | 1.86 | R |
| 53 | S5B | Possibilities for providing a recommendation | scale 1–4 | 2.71 | Y |
| 54 | S9B | Personal acceptance of the current wastewater management | scale 1–4 | 2.64 | Y |
| 55 | S10B | Perception of social acceptance of the current wastewater management | scale 1–4 | 1.64 | R |
References
- Muga, H.E.; Mihelcic, J.R. Sustainability of wastewater treatment technologies. J. Environ. Manag. 2008, 88, 437–447. [Google Scholar] [CrossRef] [PubMed]
- UN Habitat. Water and Sanitation in Latin America and the Caribbean; UN Habitat: Nairobi, Kenya, 2010; ISBN 978-92-1-132300-9. [Google Scholar]
- UN Habitat. Estado de las Ciudades de América Latina y el Caribe; UN Habitat: Nairobi, Kenya, 2012. [Google Scholar]
- Ballestero, M.; Arroyo, V.; Mejía, A. Inseguridad Económica del Agua en Latinoamérica: de la abundancia a la inseguridad; CAF: Caracas, Venezuela, 2015. [Google Scholar]
- Mateo-Sagasta, J. Reutilización de Aguas para Agricultura en América Latina y el Caribe: Estado, Principios y Necesidades; FAO: Santiago, Chile, 2017. [Google Scholar]
- Libralato, G.; Volpi Ghirardini, A.; Avezzù, F. To centralise or to decentralise: An overview of the most recent trends in wastewater treatment management. J. Environ. Manag. 2012, 94, 61–68. [Google Scholar] [CrossRef] [PubMed]
- UN General Assembly A/RES/71/256—New Urban Agenda GA Adopted 68th Plenary N1646655-E. Available online: http://habitat3.org/wp-content/uploads/New-Urban-Agenda-GA-Adopted-68th-Plenary-N1646655-E.pdf (accessed on 3 May 2017).
- UN. Transforming our World: The 2030 Agenda for Sustainable Development: Sustainable Development Knowledge Platform; United Nations: New York, NY, USA, 2015. [Google Scholar]
- UN-Habitat. Urbanization and Development: Emerging Futures; World Cities Report; UN-Habitat: Nairobi, Kenya, 2016; ISBN 978-92-1-132708-3. [Google Scholar]
- Alcamo, J.; Bennet, E. Ecosystems and Human Well-Being: A Framework for Assessment; Millenium Ecosystem Assessment, World Resources Institute, Eds.; Island: Washington, DC, USA, 2003; ISBN 978-1-55963-402-1. [Google Scholar]
- Ghodeif, K. Baseline Assessment Study for Wastewater Treatment Plant for Al Gozayyera Village, West Kantara City, Ismailia Governorate, Egypt; Network of Demonstration Activities for Sustainable Integrated Wastewater Treatment and Reuse in the Mediterranean: Cairo, Egypt, 2013. [Google Scholar]
- Seecon Sustainable Sanitation and Water Tool 2017. Available online: URL (accessed on 10 May 2018).
- Deutsche Gesellschaft für Technische Zusammenarbeit (GTZ). Ministry of Construction-Hanoi Asset Management Guideline for Drainage Sewerage System; Ministry of Construction: Hanoi, Vietnam, 2009.
- GIZ. IWA The Energy Performance and Carbon Emissions Assessment and Monitoring (ECAM) Tool; Deutsche Gesellschaft für Internationale Zussamenarbeit: Eschborn, Germany, 2017. [Google Scholar]
- Balkema, A.J.; Preisig, H.A.; Otterpohl, R.; Lambert, F.J. Indicators for the sustainability assessment of wastewater treatment systems. Urban Water 2002, 4, 153–161. [Google Scholar] [CrossRef]
- Quadros, S.; João Rosa, M.; Alegre, H.; Silva, C. A performance indicators system for urban wastewater treatment plants. Water Sci. Technol. 2010, 62, 2398–2407. [Google Scholar] [CrossRef] [PubMed]
- Lundin, M.; Olofsson, M.; Pettersson, G.; Zetterlund, H. Environmental and economic assessment of sewage sludge handling options. Resour. Conserv. Recycl. 2004, 41, 255–278. [Google Scholar] [CrossRef]
- Özerol, G.; Newig, J. Evaluating the success of public participation in water resources management: Five key constituents. Water Policy 2008, 10, 639–655. [Google Scholar] [CrossRef]
- Mostert, E. The challenge of public participation. Water Policy 2003, 5, 179–197. [Google Scholar] [CrossRef]
- Millington, P. Integrated River Basin Management: From Concepts to Good Practice; The World Bank: Washington, DC, USA, 2006; pp. 1–20. [Google Scholar]
- Agarwal, A. Integrated Water Resources Management; Global Water Partnership: Stockholm, Sweden, 2000; ISBN 978-91-630-9229-9. [Google Scholar]
- Lang, D.J.; Wiek, A.; Bergmann, M.; Stauffacher, M.; Martens, P.; Moll, P.; Swilling, M.; Thomas, C.J. Transdisciplinary research in sustainability science: Practice, principles, and challenges. Sustain. Sci. 2012, 7, 25–43. [Google Scholar] [CrossRef]
- Reed, M.S.; Graves, A.; Dandy, N.; Posthumus, H.; Hubacek, K.; Morris, J.; Prell, C.; Quinn, C.H.; Stringer, L.C. Who’s in and why? A typology of stakeholder analysis methods for natural resource management. J. Environ. Manag. 2009, 90, 1933–1949. [Google Scholar] [CrossRef] [PubMed]
- Zscheischler, J.; Rogga, S. Transdisciplinarity in land use science—A review of concepts, empirical findings and current practices. Futures 2015, 65, 28–44. [Google Scholar] [CrossRef]
- Von Korff, Y.; d’Aquino, P.; Daniell, K.A.; Bijlsma, R. Designing Participation Processes for Water Management and Beyond. Synthesis, part of a special feature on implementing participatory water management: Recent advances in theory, practice and evaluation. Ecol. Soc. 2010, 15. [Google Scholar] [CrossRef]
- Grant, W.E.; Grant, W.E.; Pedersen, E.K.; Marin, S.L.; Marín, S.L. Ecology and Natural Resource Management: Systems Analysis and Simulation; John Wiley & Sons: New York, NY, USA, 1997; ISBN 978-0-471-13786-3. [Google Scholar]
- Grant, W.E. Ecology and natural resource management: reflections from a systems perspective. Ecol. Model. 1998, 108, 67–76. [Google Scholar] [CrossRef]
- Odum, H.T. General and Ecological Systems; University Press of Colorado: Niwot, CO, USA, 1980. [Google Scholar]
- Schmidt-Bleek, F. The Factor 10/MIPS-Concept: Bridging Ecological, Economic, and Social Dimensions with Sustainability Indicators; ZEF: Tokyo, Japan; Berlin, Germany, 1999. [Google Scholar]
- Ehrenfeld, J.R. The roots of sustainability. MIT Sloan Manag. Rev. 2005, 46, 23. [Google Scholar]
- Kissinger, M.; Rees, W.E. An interregional ecological approach for modelling sustainability in a globalizing world—Reviewing existing approaches and emerging directions. Ecol. Model. 2010, 221, 2615–2623. [Google Scholar] [CrossRef]
- Avellan, T.; Koester, K.; Selvam, V.; Brueggemann, K.; Ruiz, N. Understanding the Water-Soil-Waste Nexus. In Proceedings of the Constructed Wetland Knowledge Platform Meeting 2017, Dresden, Germany, 10 November 2017. [Google Scholar]
- Loiseau, E.; Junqua, G.; Roux, P.; Bellon-Maurel, V. Environmental assessment of a territory: An overview of existing tools and methods. J. Environ. Manag. 2012, 112, 213–225. [Google Scholar] [CrossRef] [PubMed]
- UNU-FLORES. Sustainability of Wastewater Systems: Current and Future Perspectives—An Assessment Workshop; United Nations University Institute for Integrated Management of Material Fluxes and of Resources (UNU-FLORES): Dresden, Germany, 2018. [Google Scholar]
- Hacking, T.; Guthrie, P. A framework for clarifying the meaning of Triple Bottom-Line, Integrated, and Sustainability Assessment. Environ. Impact Assess. Rev. 2008, 28, 73–89. [Google Scholar] [CrossRef]
- Pope, J.; Bond, A.; Hugé, J.; Morrison-Saunders, A. Reconceptualising sustainability assessment. Environ. Impact Assess. Rev. 2017, 62, 205–215. [Google Scholar] [CrossRef]
- Pope, J.; Annandale, D.; Morrison-Saunders, A. Conceptualising sustainability assessment. Environ. Impact Assess. Rev. 2004, 24, 595–616. [Google Scholar] [CrossRef]
- Toumi, O.; Le Gallo, J.; Ben Rejeb, J. Assessment of Latin American sustainability. Renew. Sustain. Energy Rev. 2017, 78, 878–885. [Google Scholar] [CrossRef]
- Bertanza, G.; Baroni, P.; Canato, M. Ranking sewage sludge management strategies by means of Decision Support Systems: A case study. Resour. Conserv. Recycl. 2016, 110, 1–15. [Google Scholar] [CrossRef]
- Fay, M.; Andres, L.A.; Fox, C.; Narloch, U.; Straub, S.; Slawson, M. Rethinking Infrastructure in Latin America and the Caribbean; International Bank for Reconstruction and Development/The World Bank: Washington, DC, USA, 2017. [Google Scholar]
© 2019 by the authors. Licensee MDPI, Basel, Switzerland. This article is an open access article distributed under the terms and conditions of the Creative Commons Attribution (CC BY) license (http://creativecommons.org/licenses/by/4.0/).