Use of Alternative Hydrogeological Conceptual Models to Assess the Potential Impact of Climate Change on Groundwater Sustainable Yield in Central Huai Luang Basin, Northeast Thailand


Abstract
1. Introduction
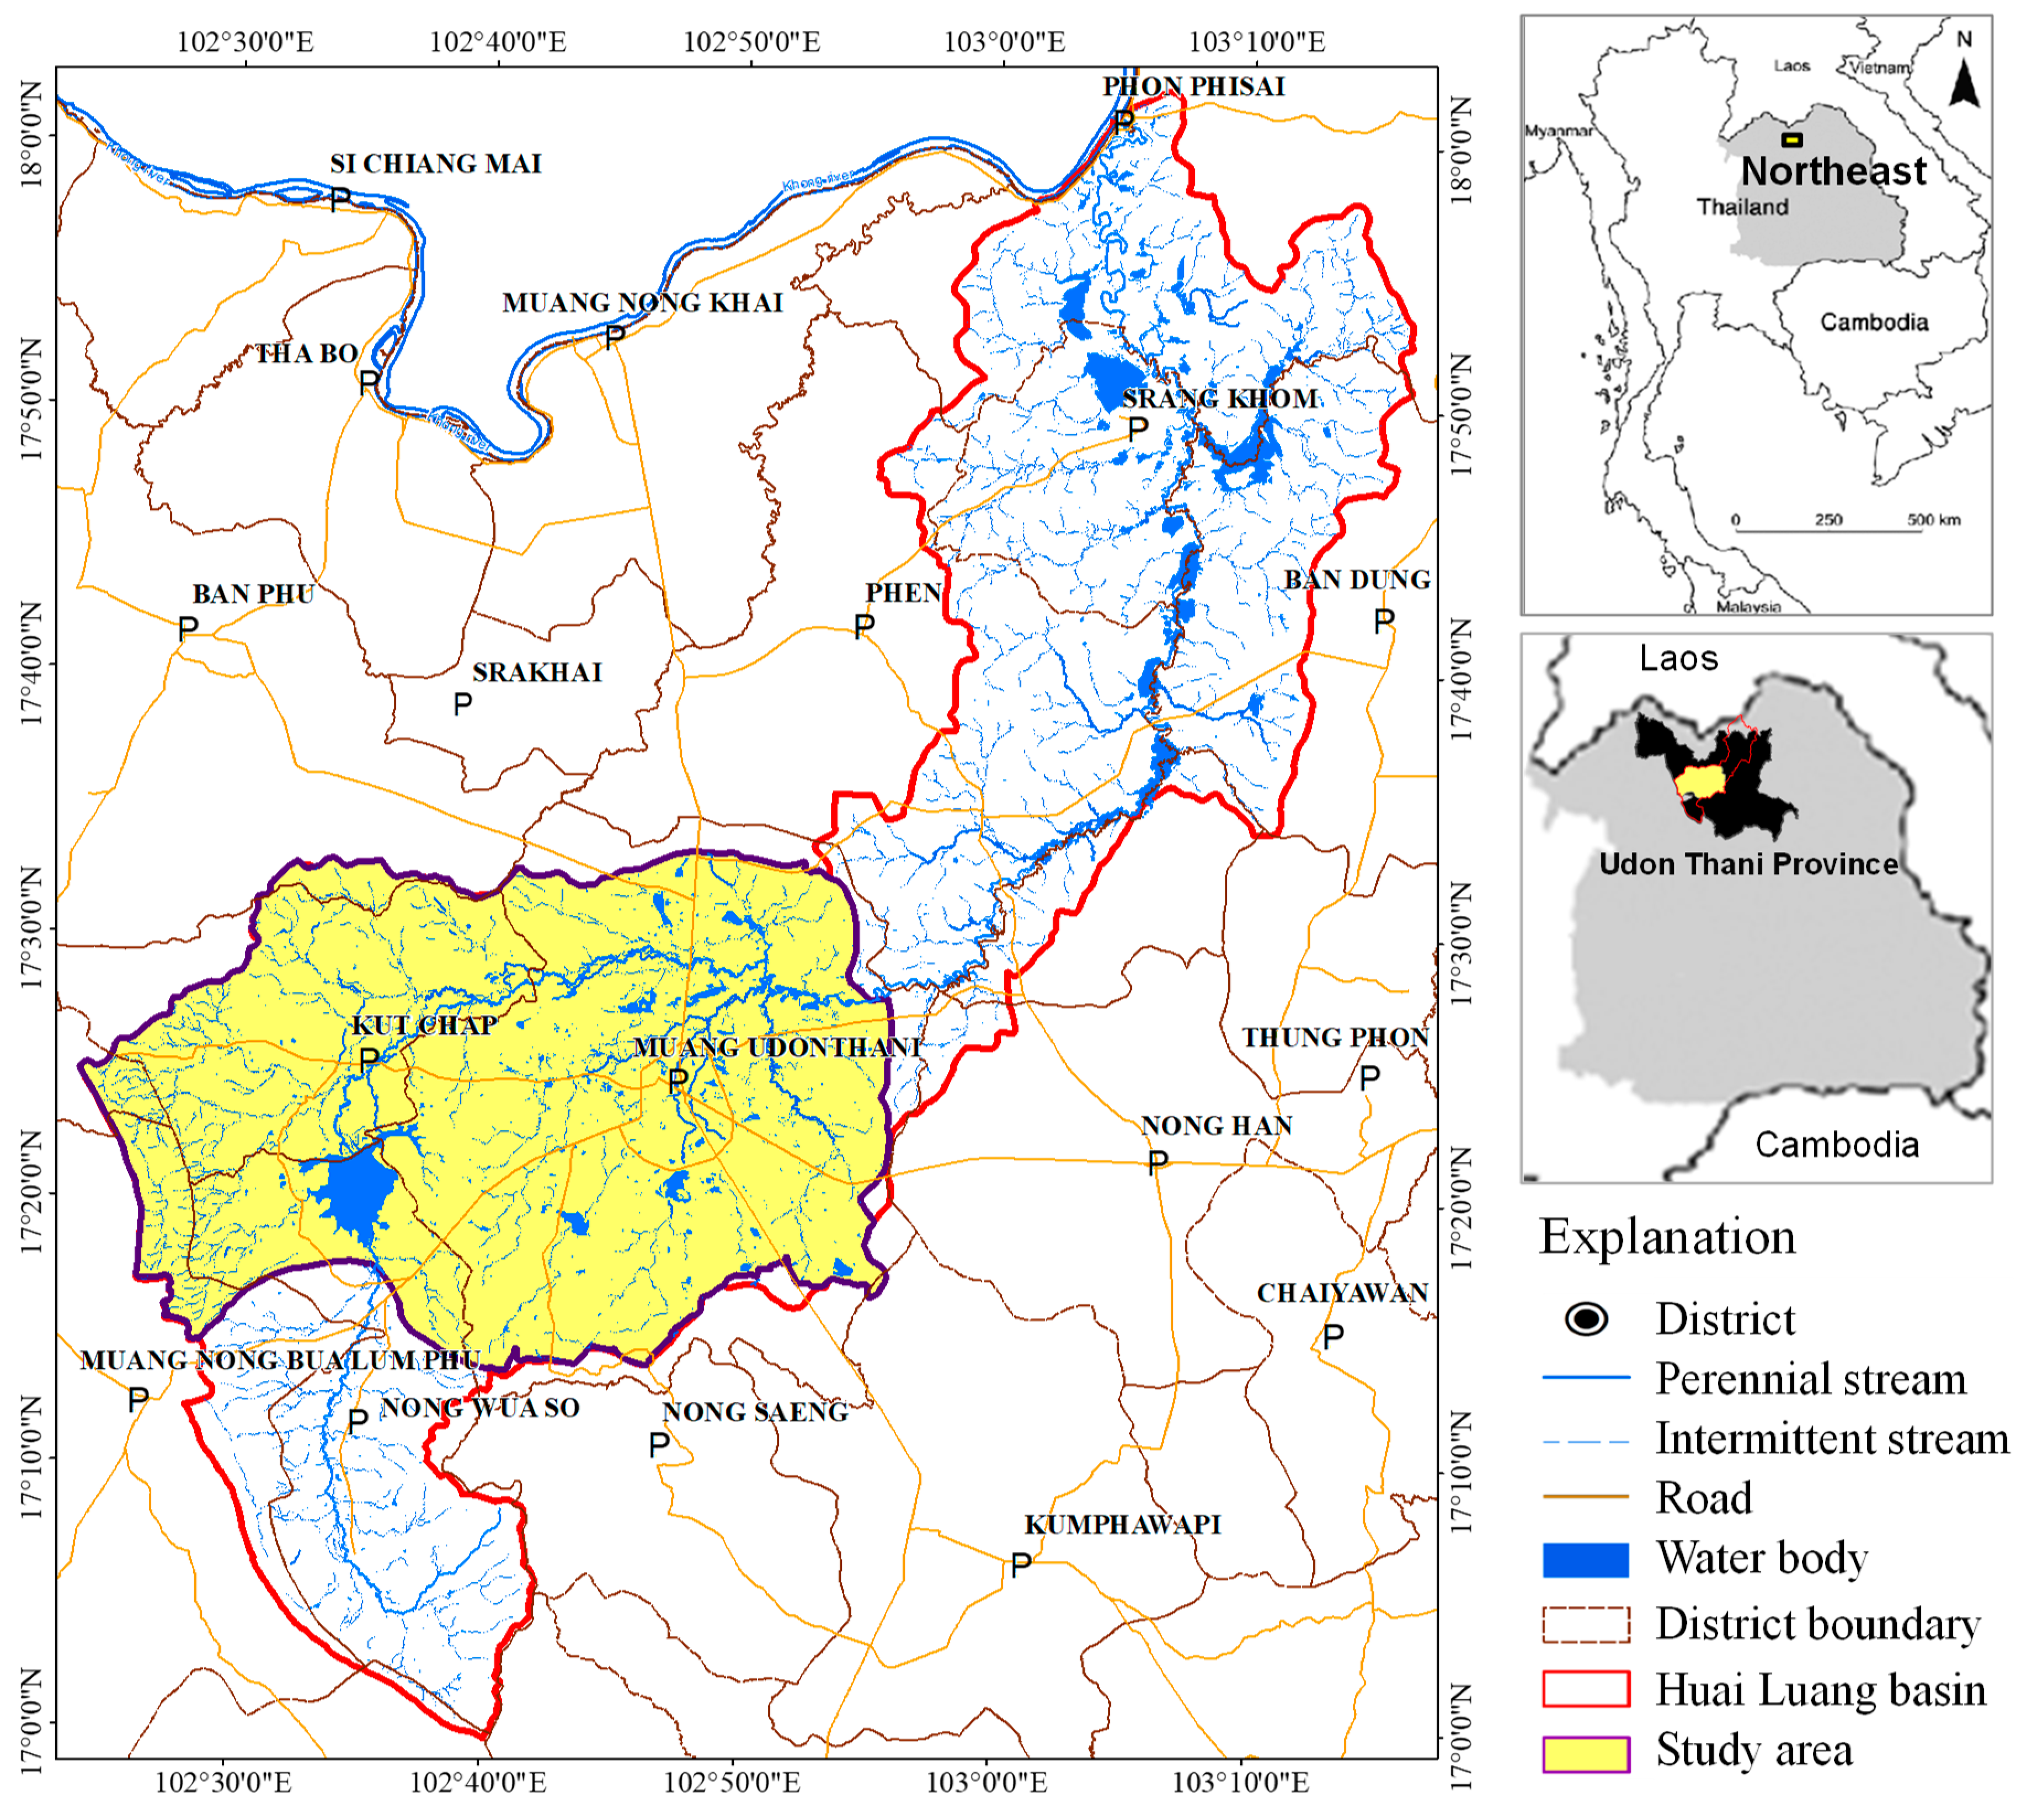
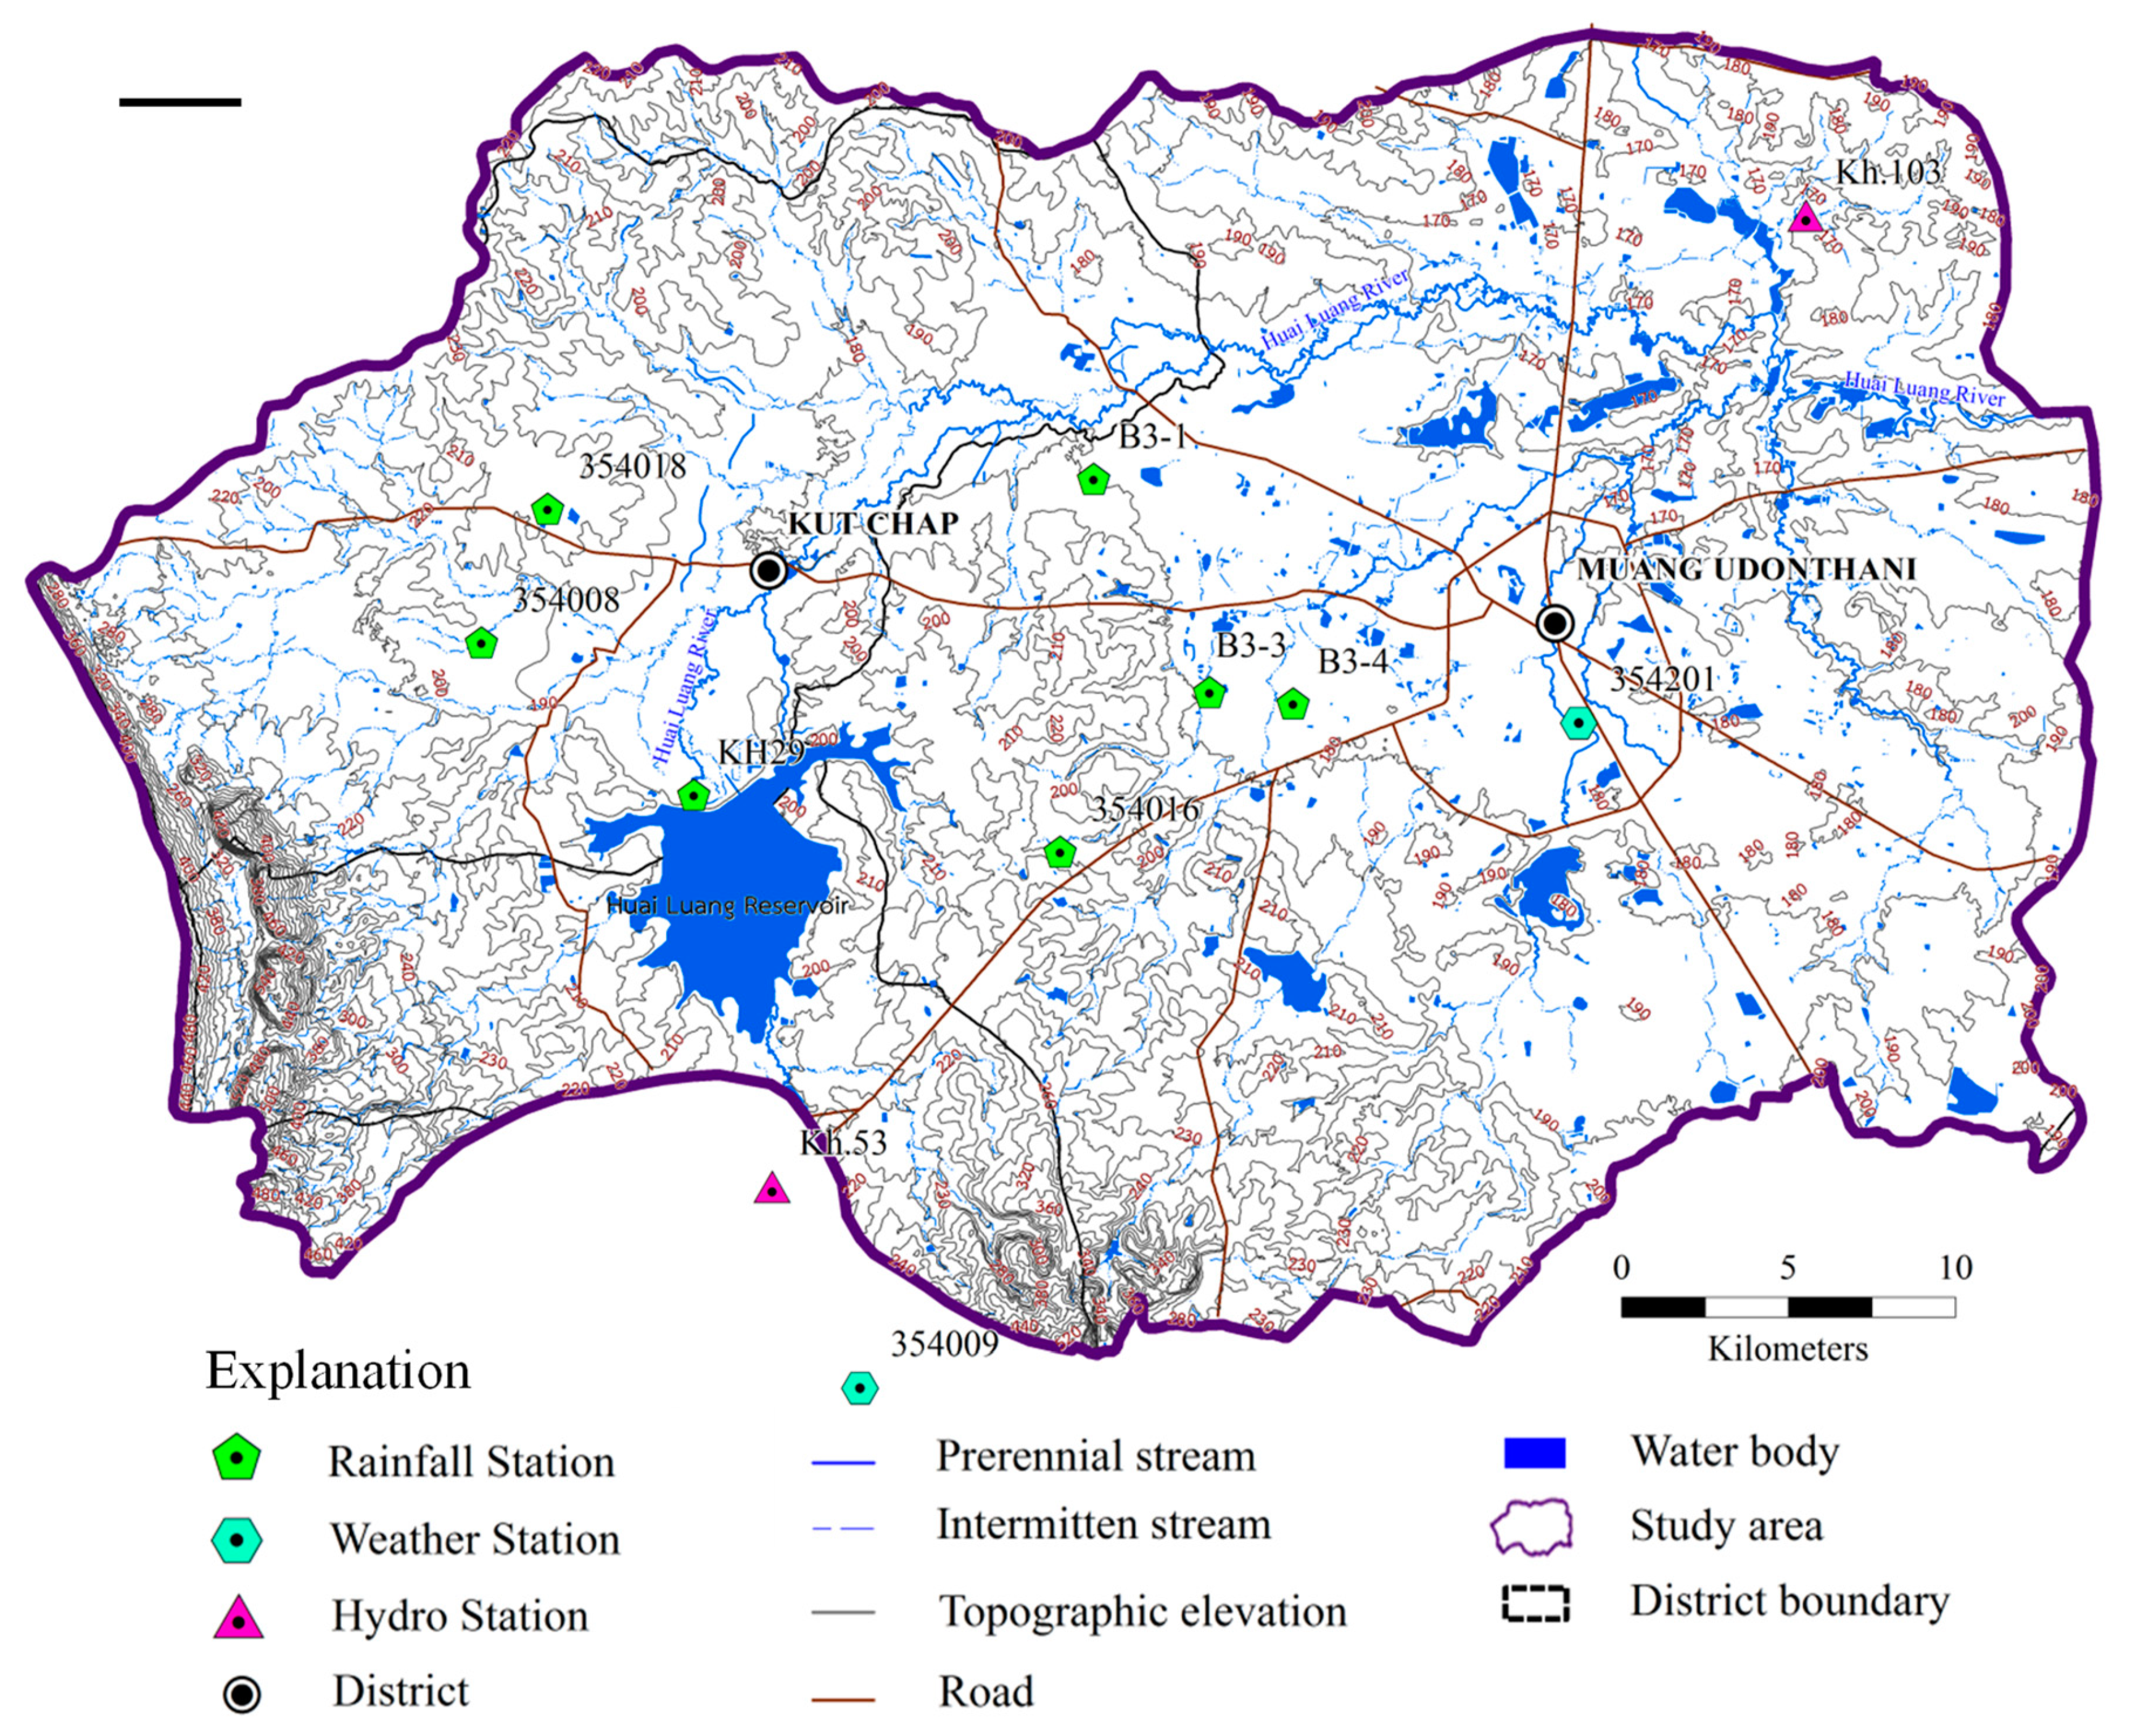
2. The Study Area
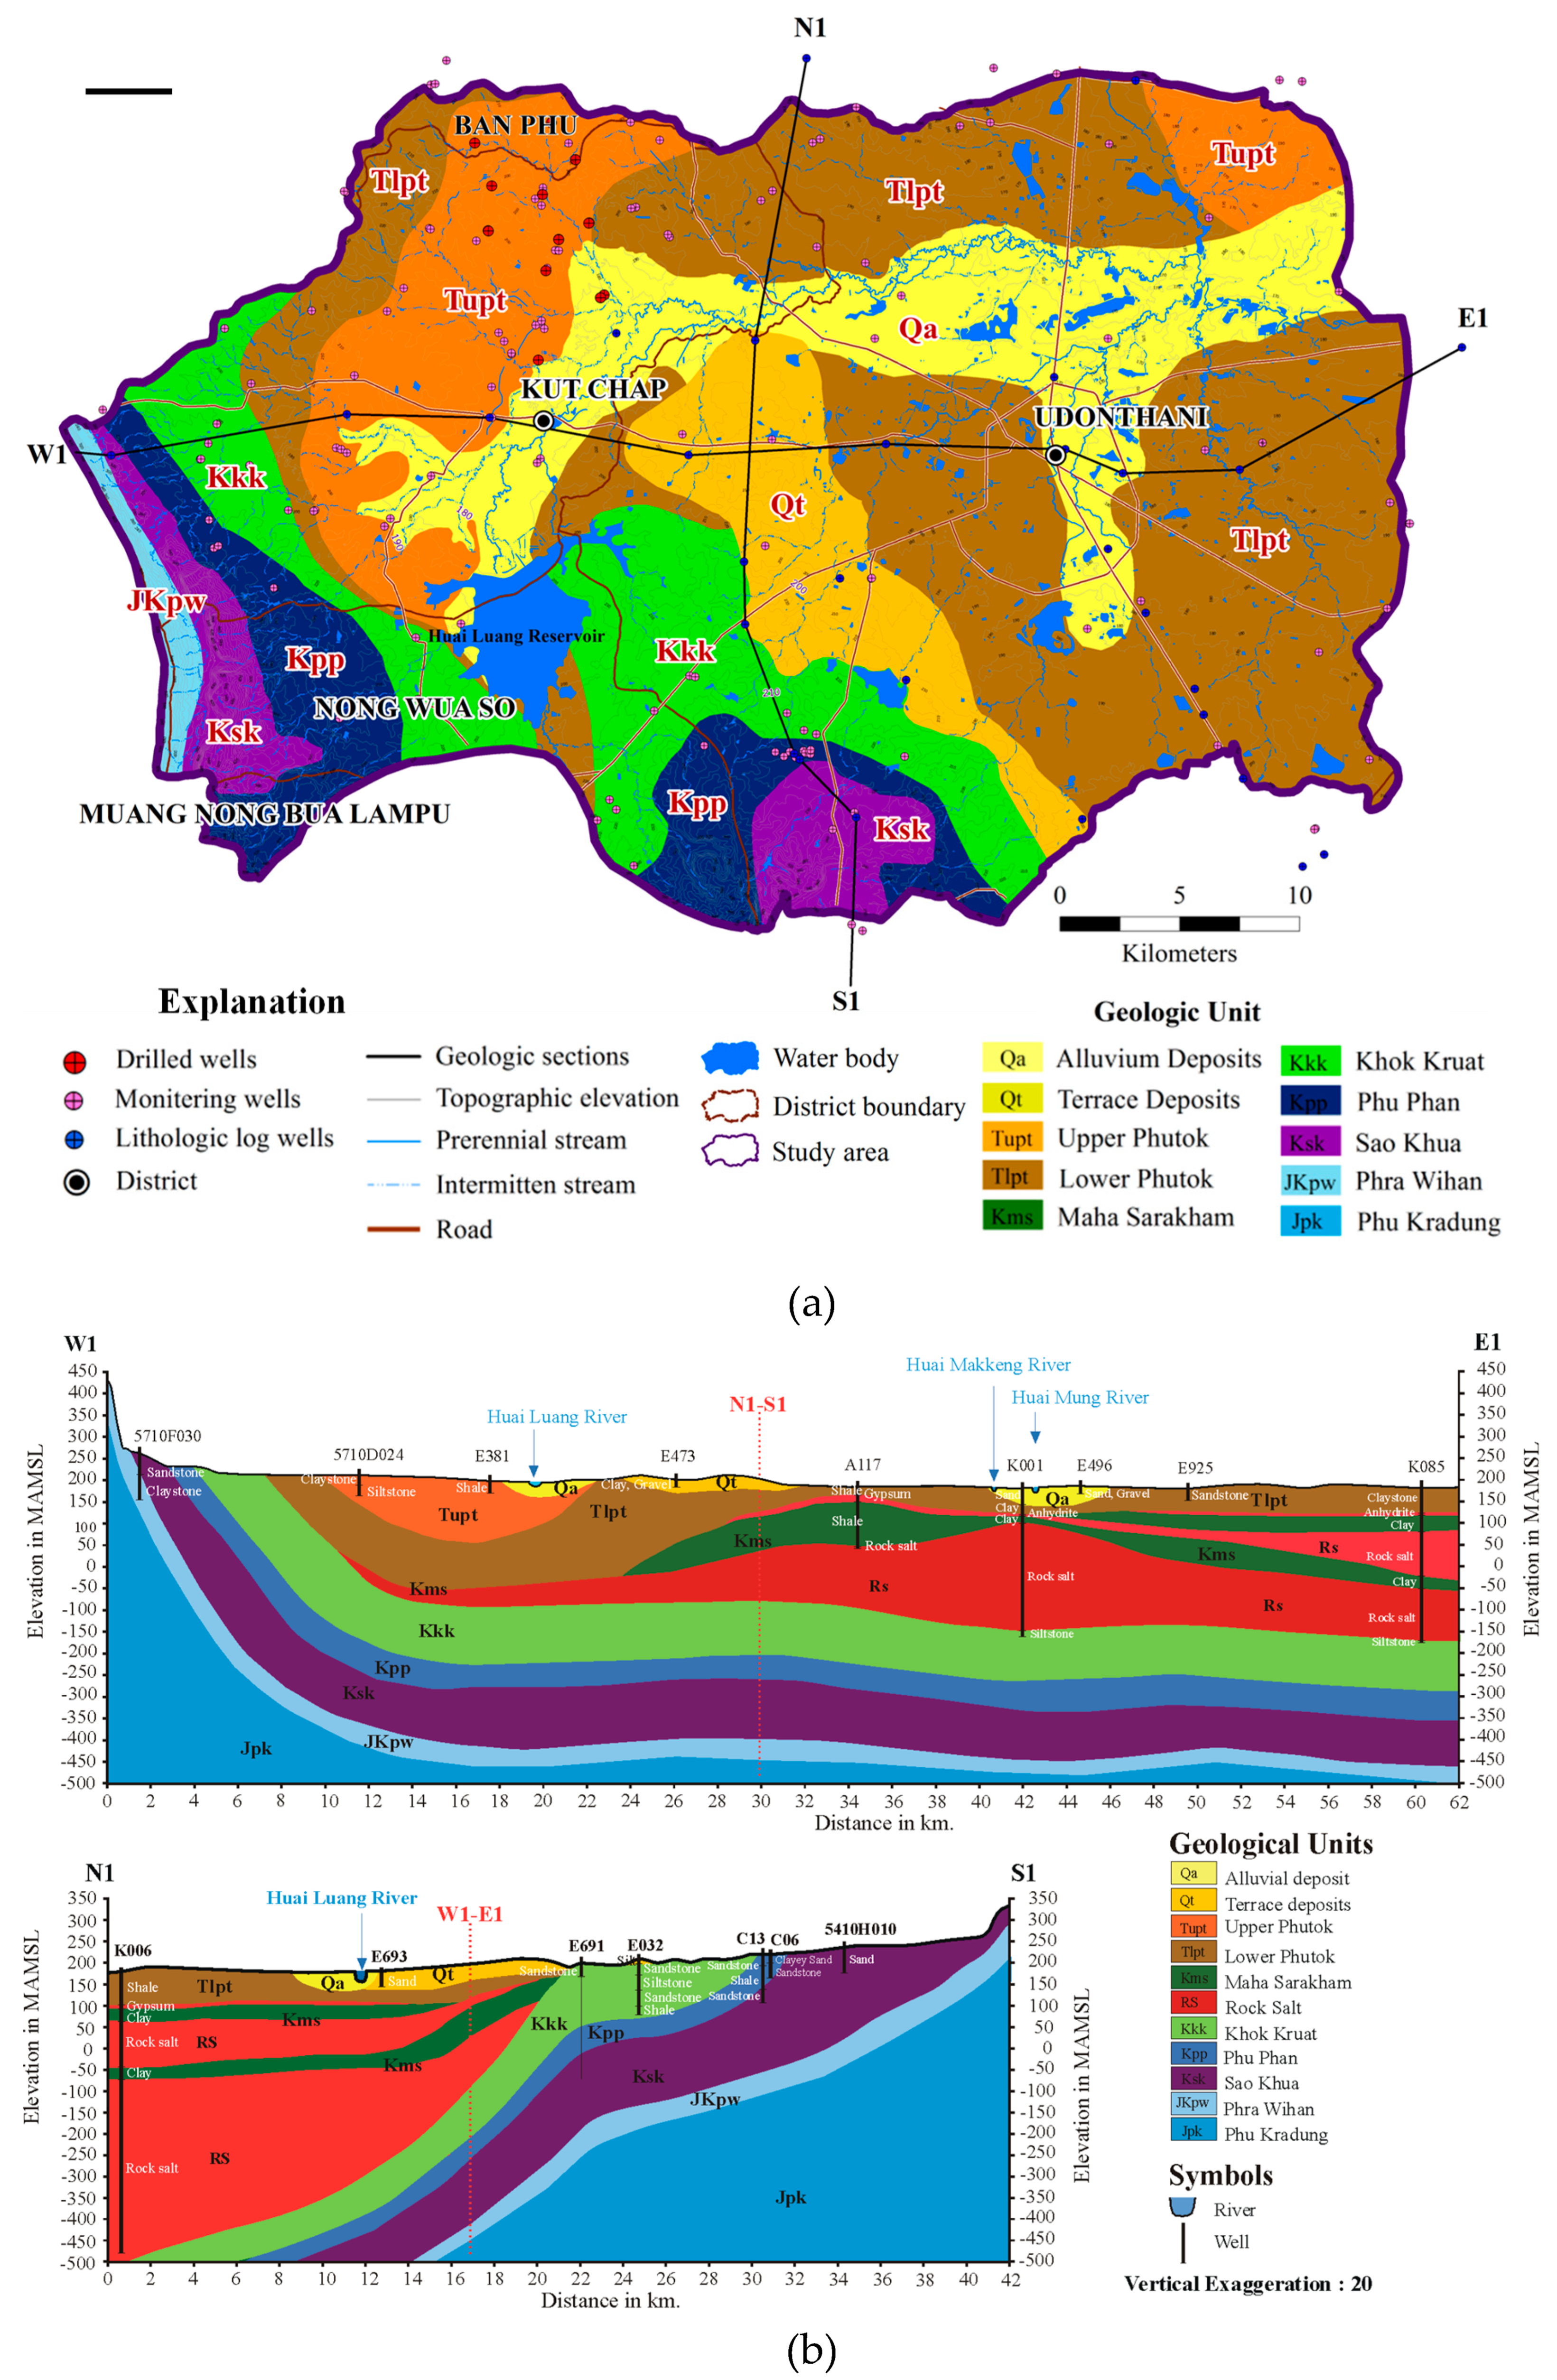
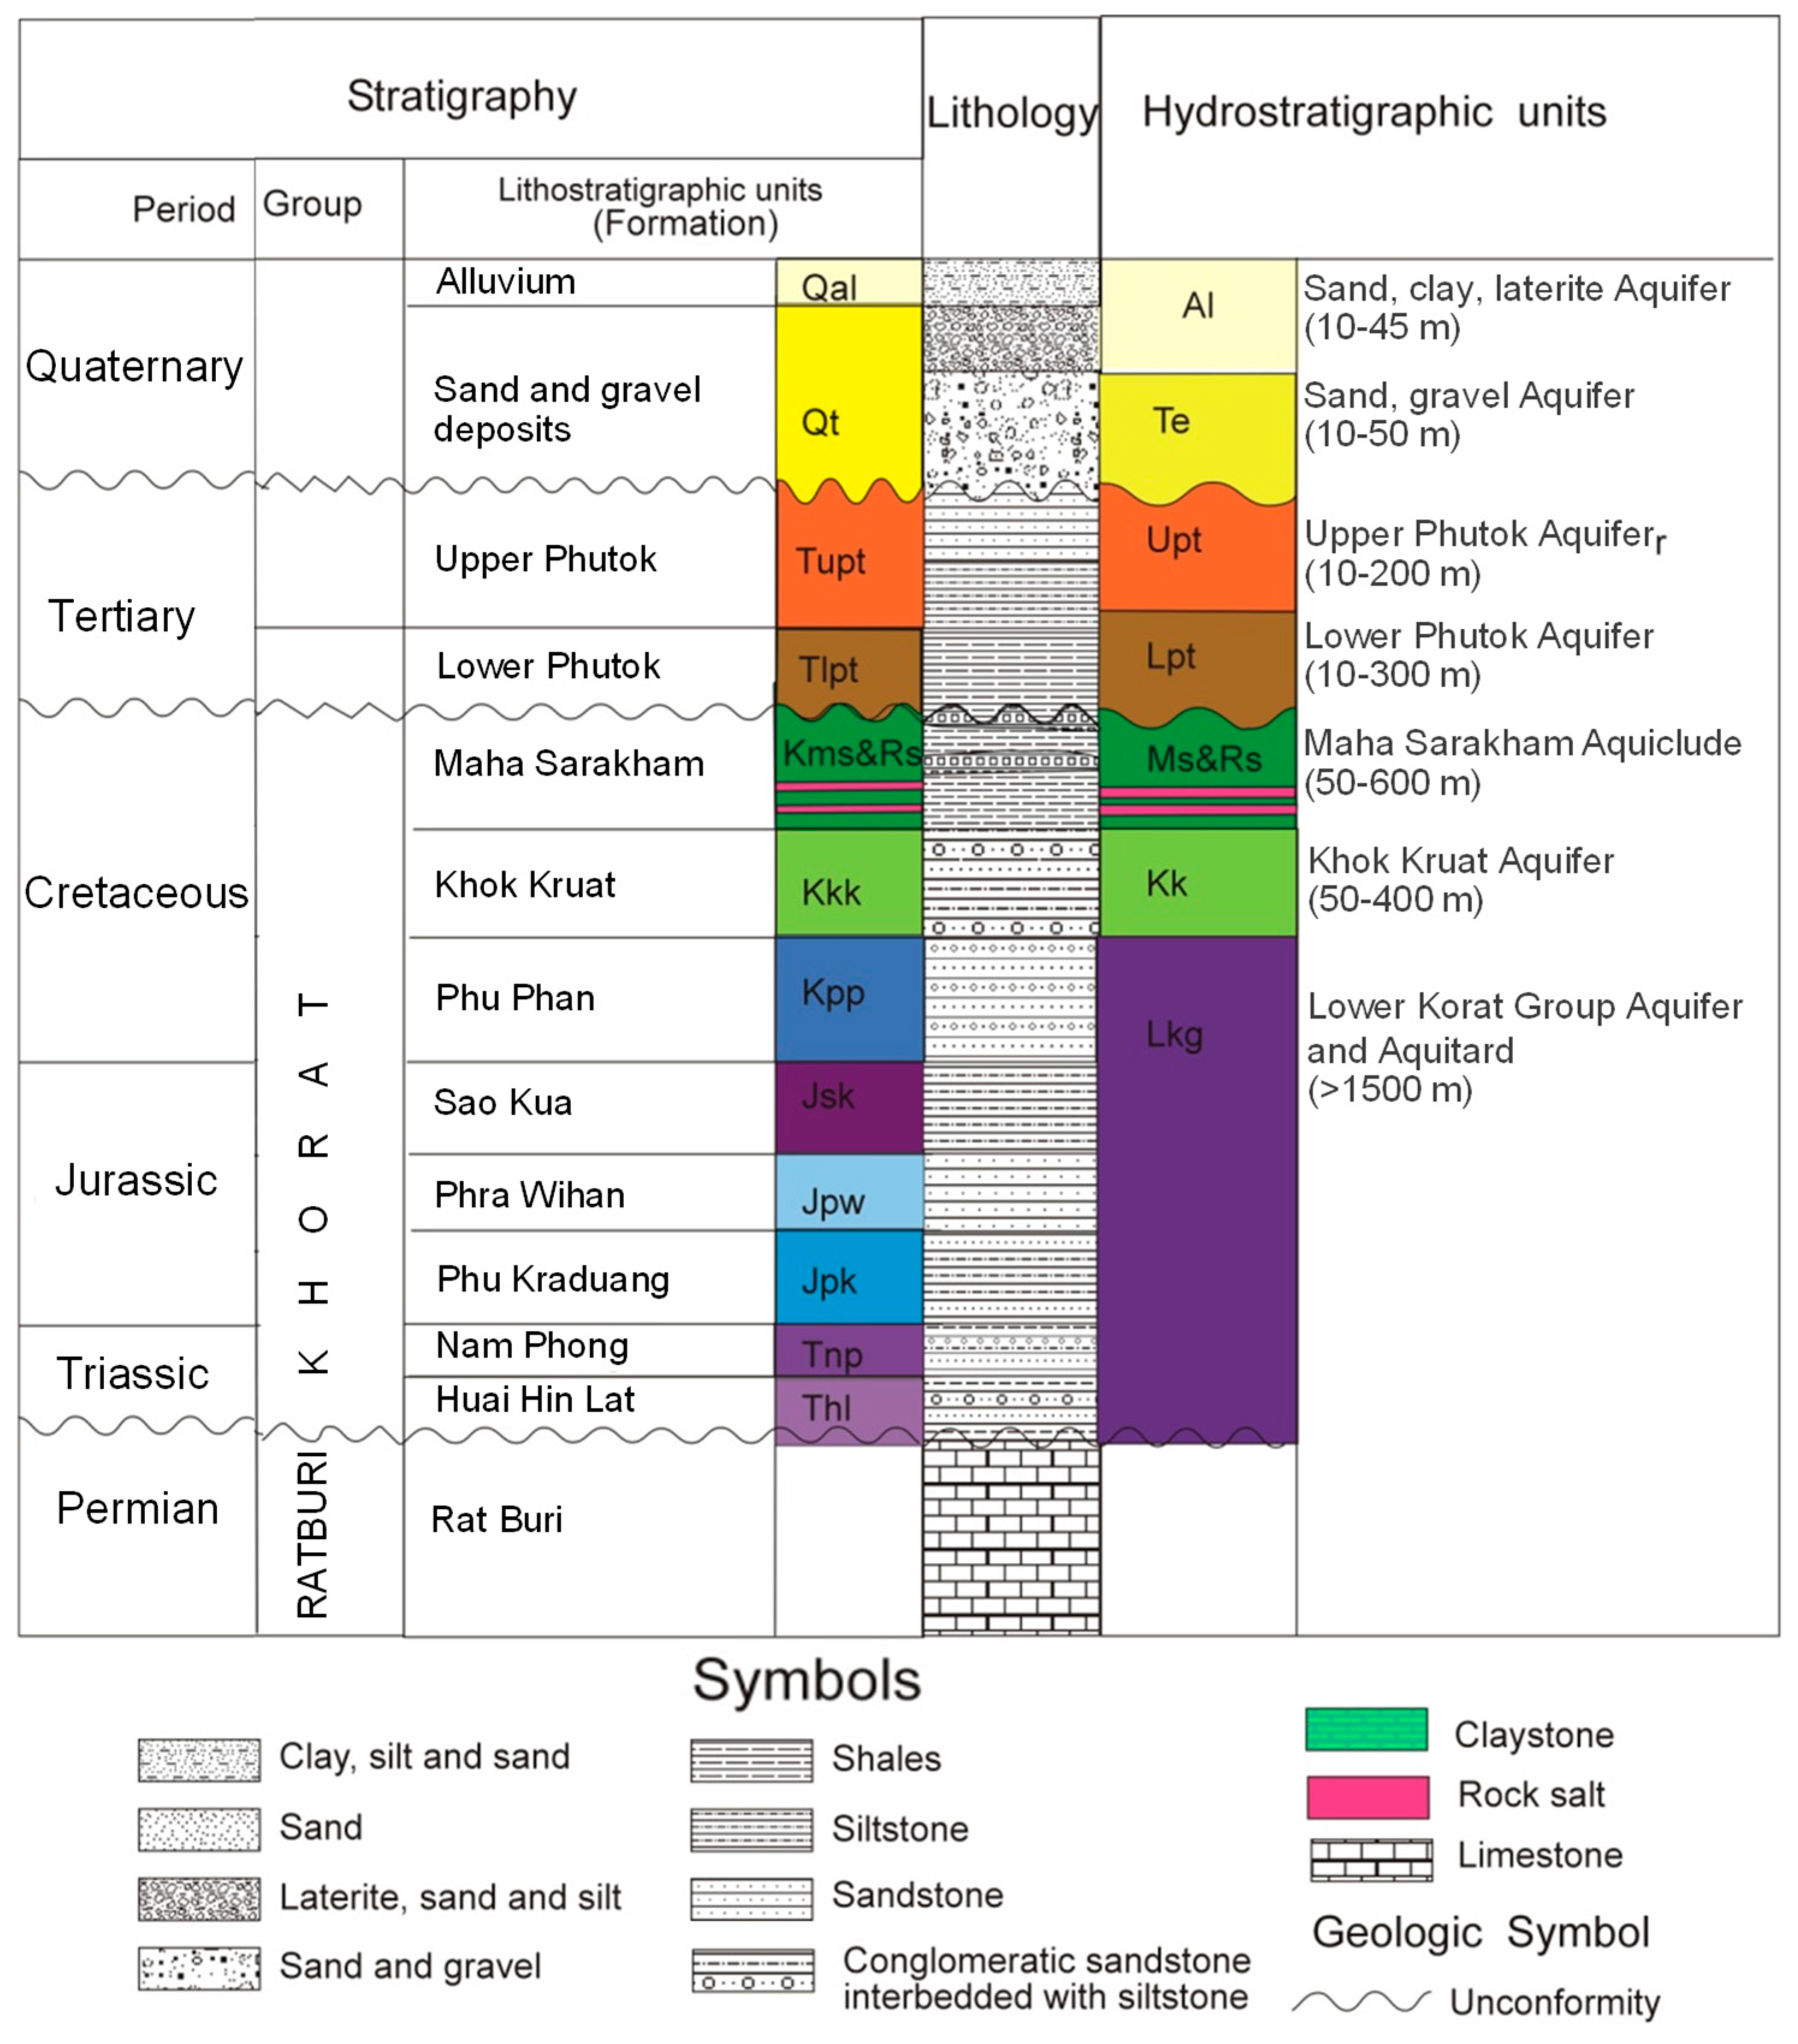
2.1. Geology
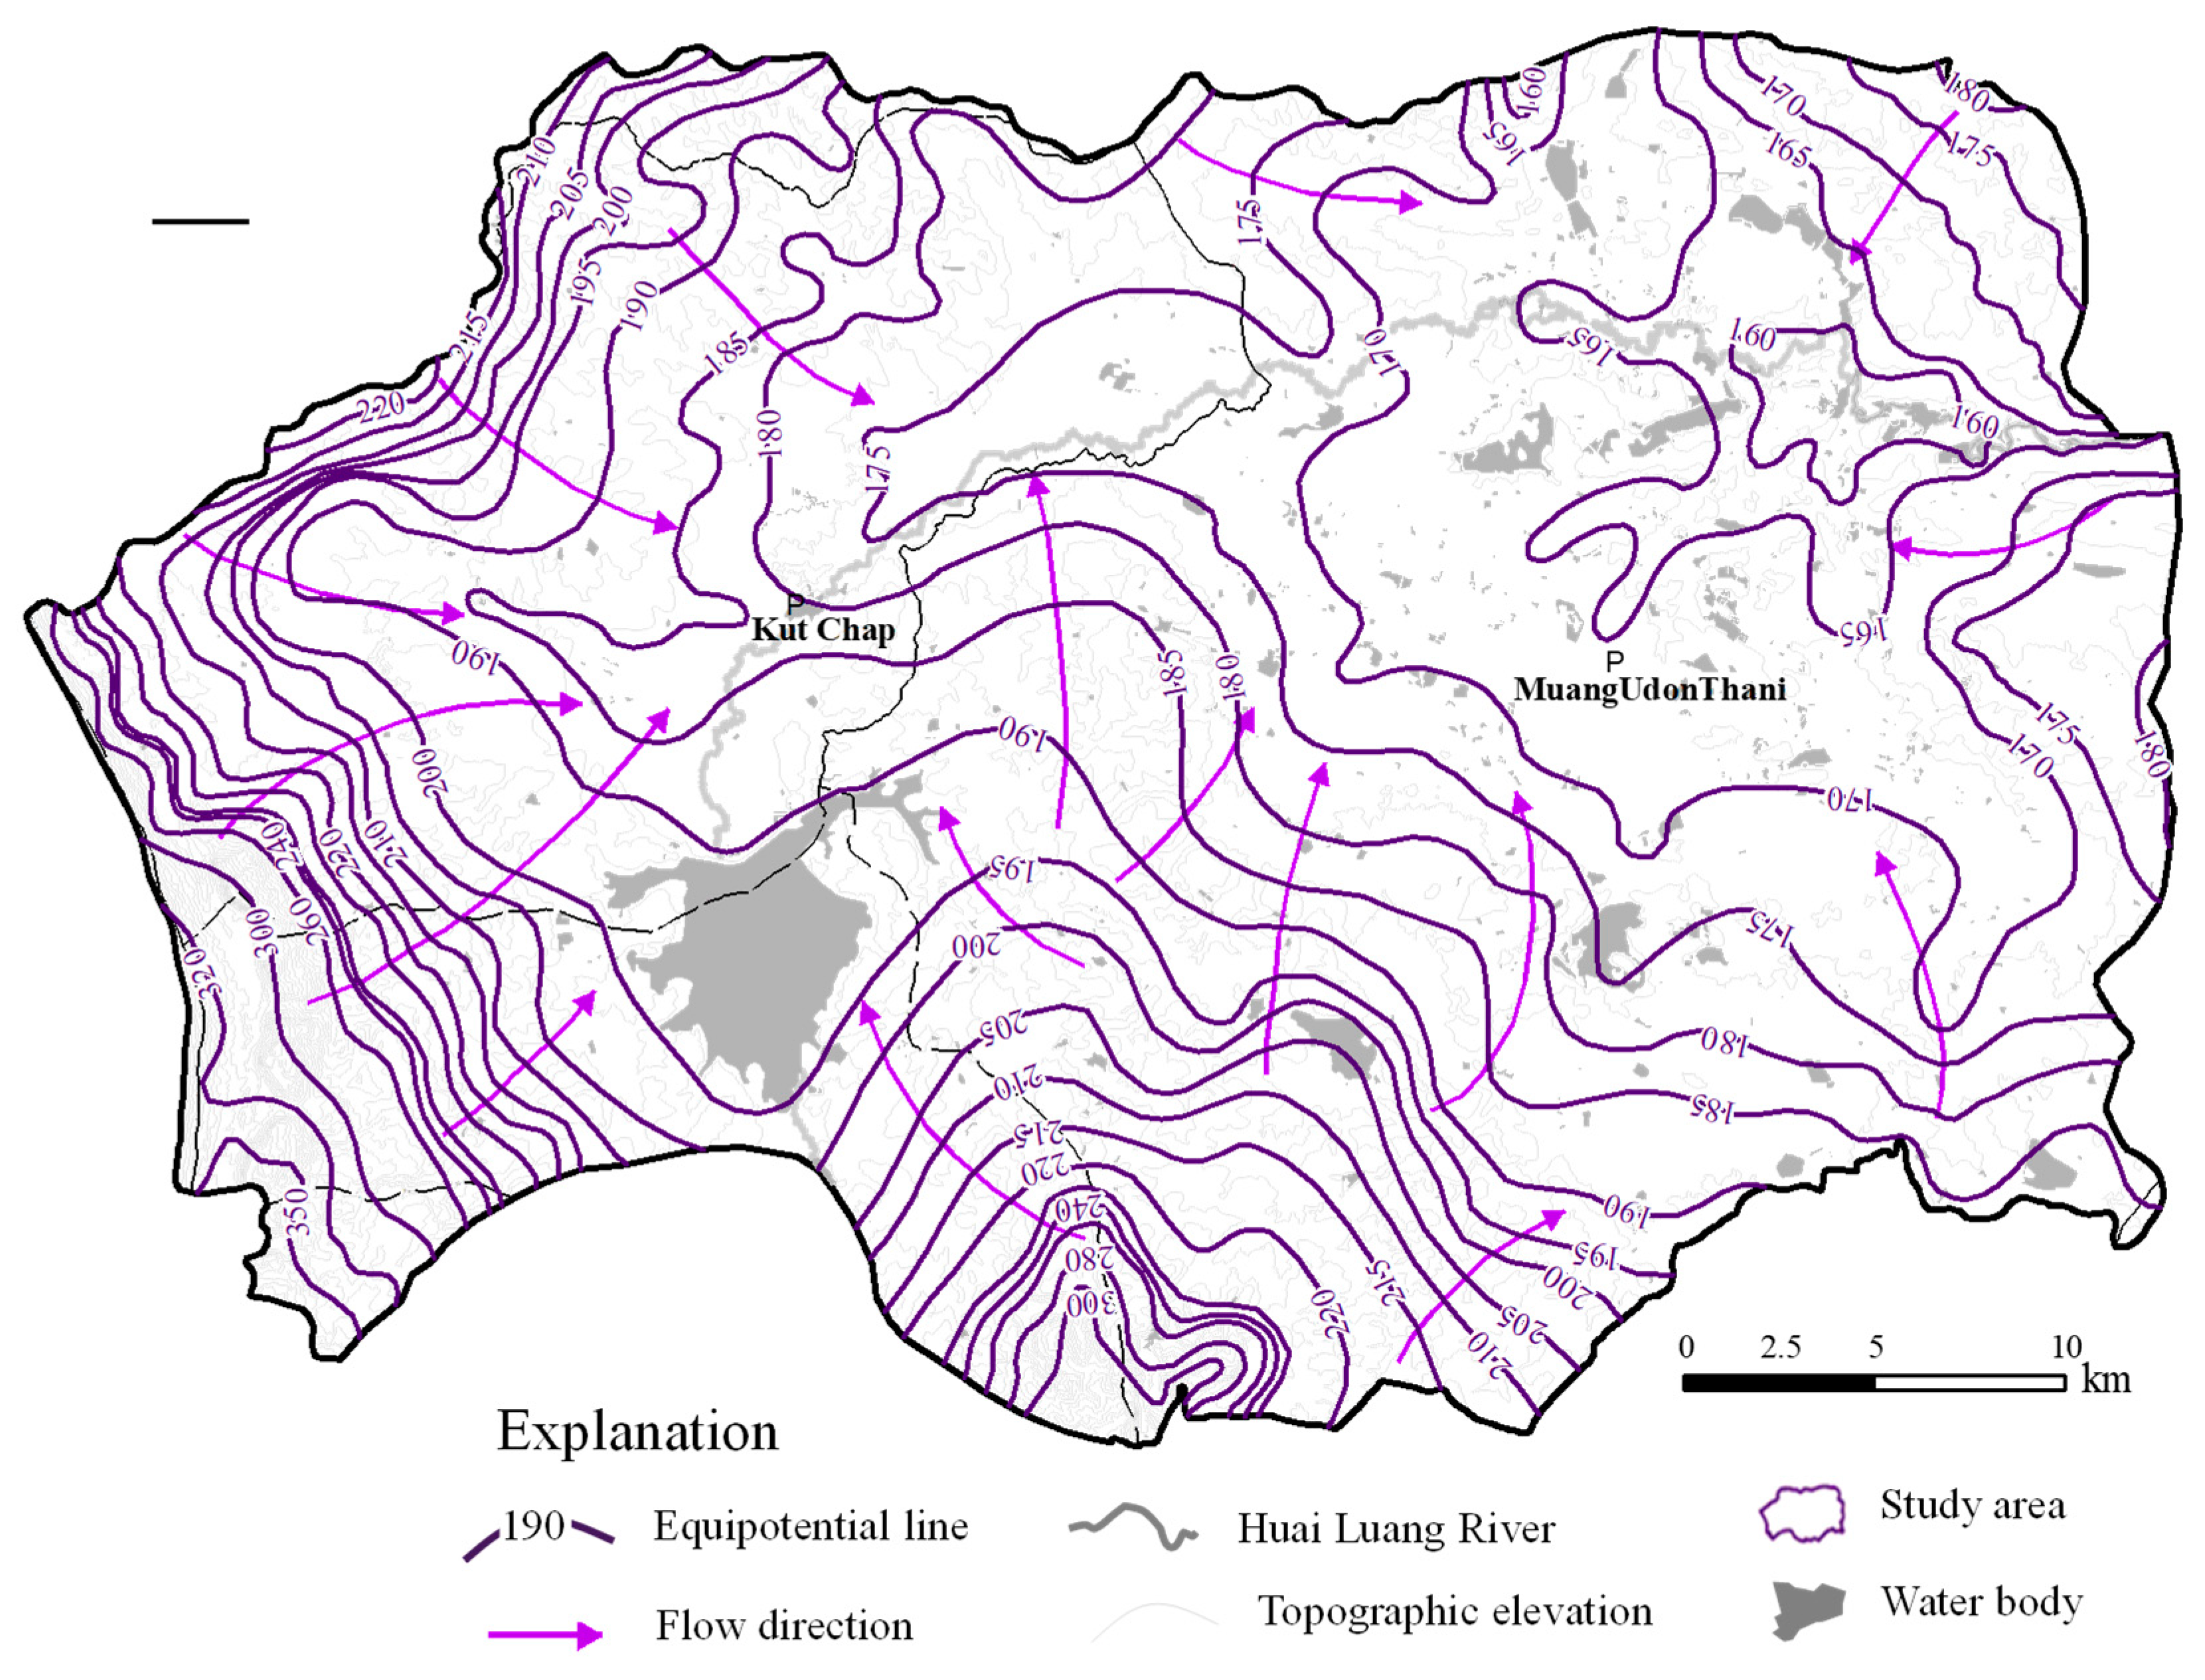
2.2. Hydrogeology
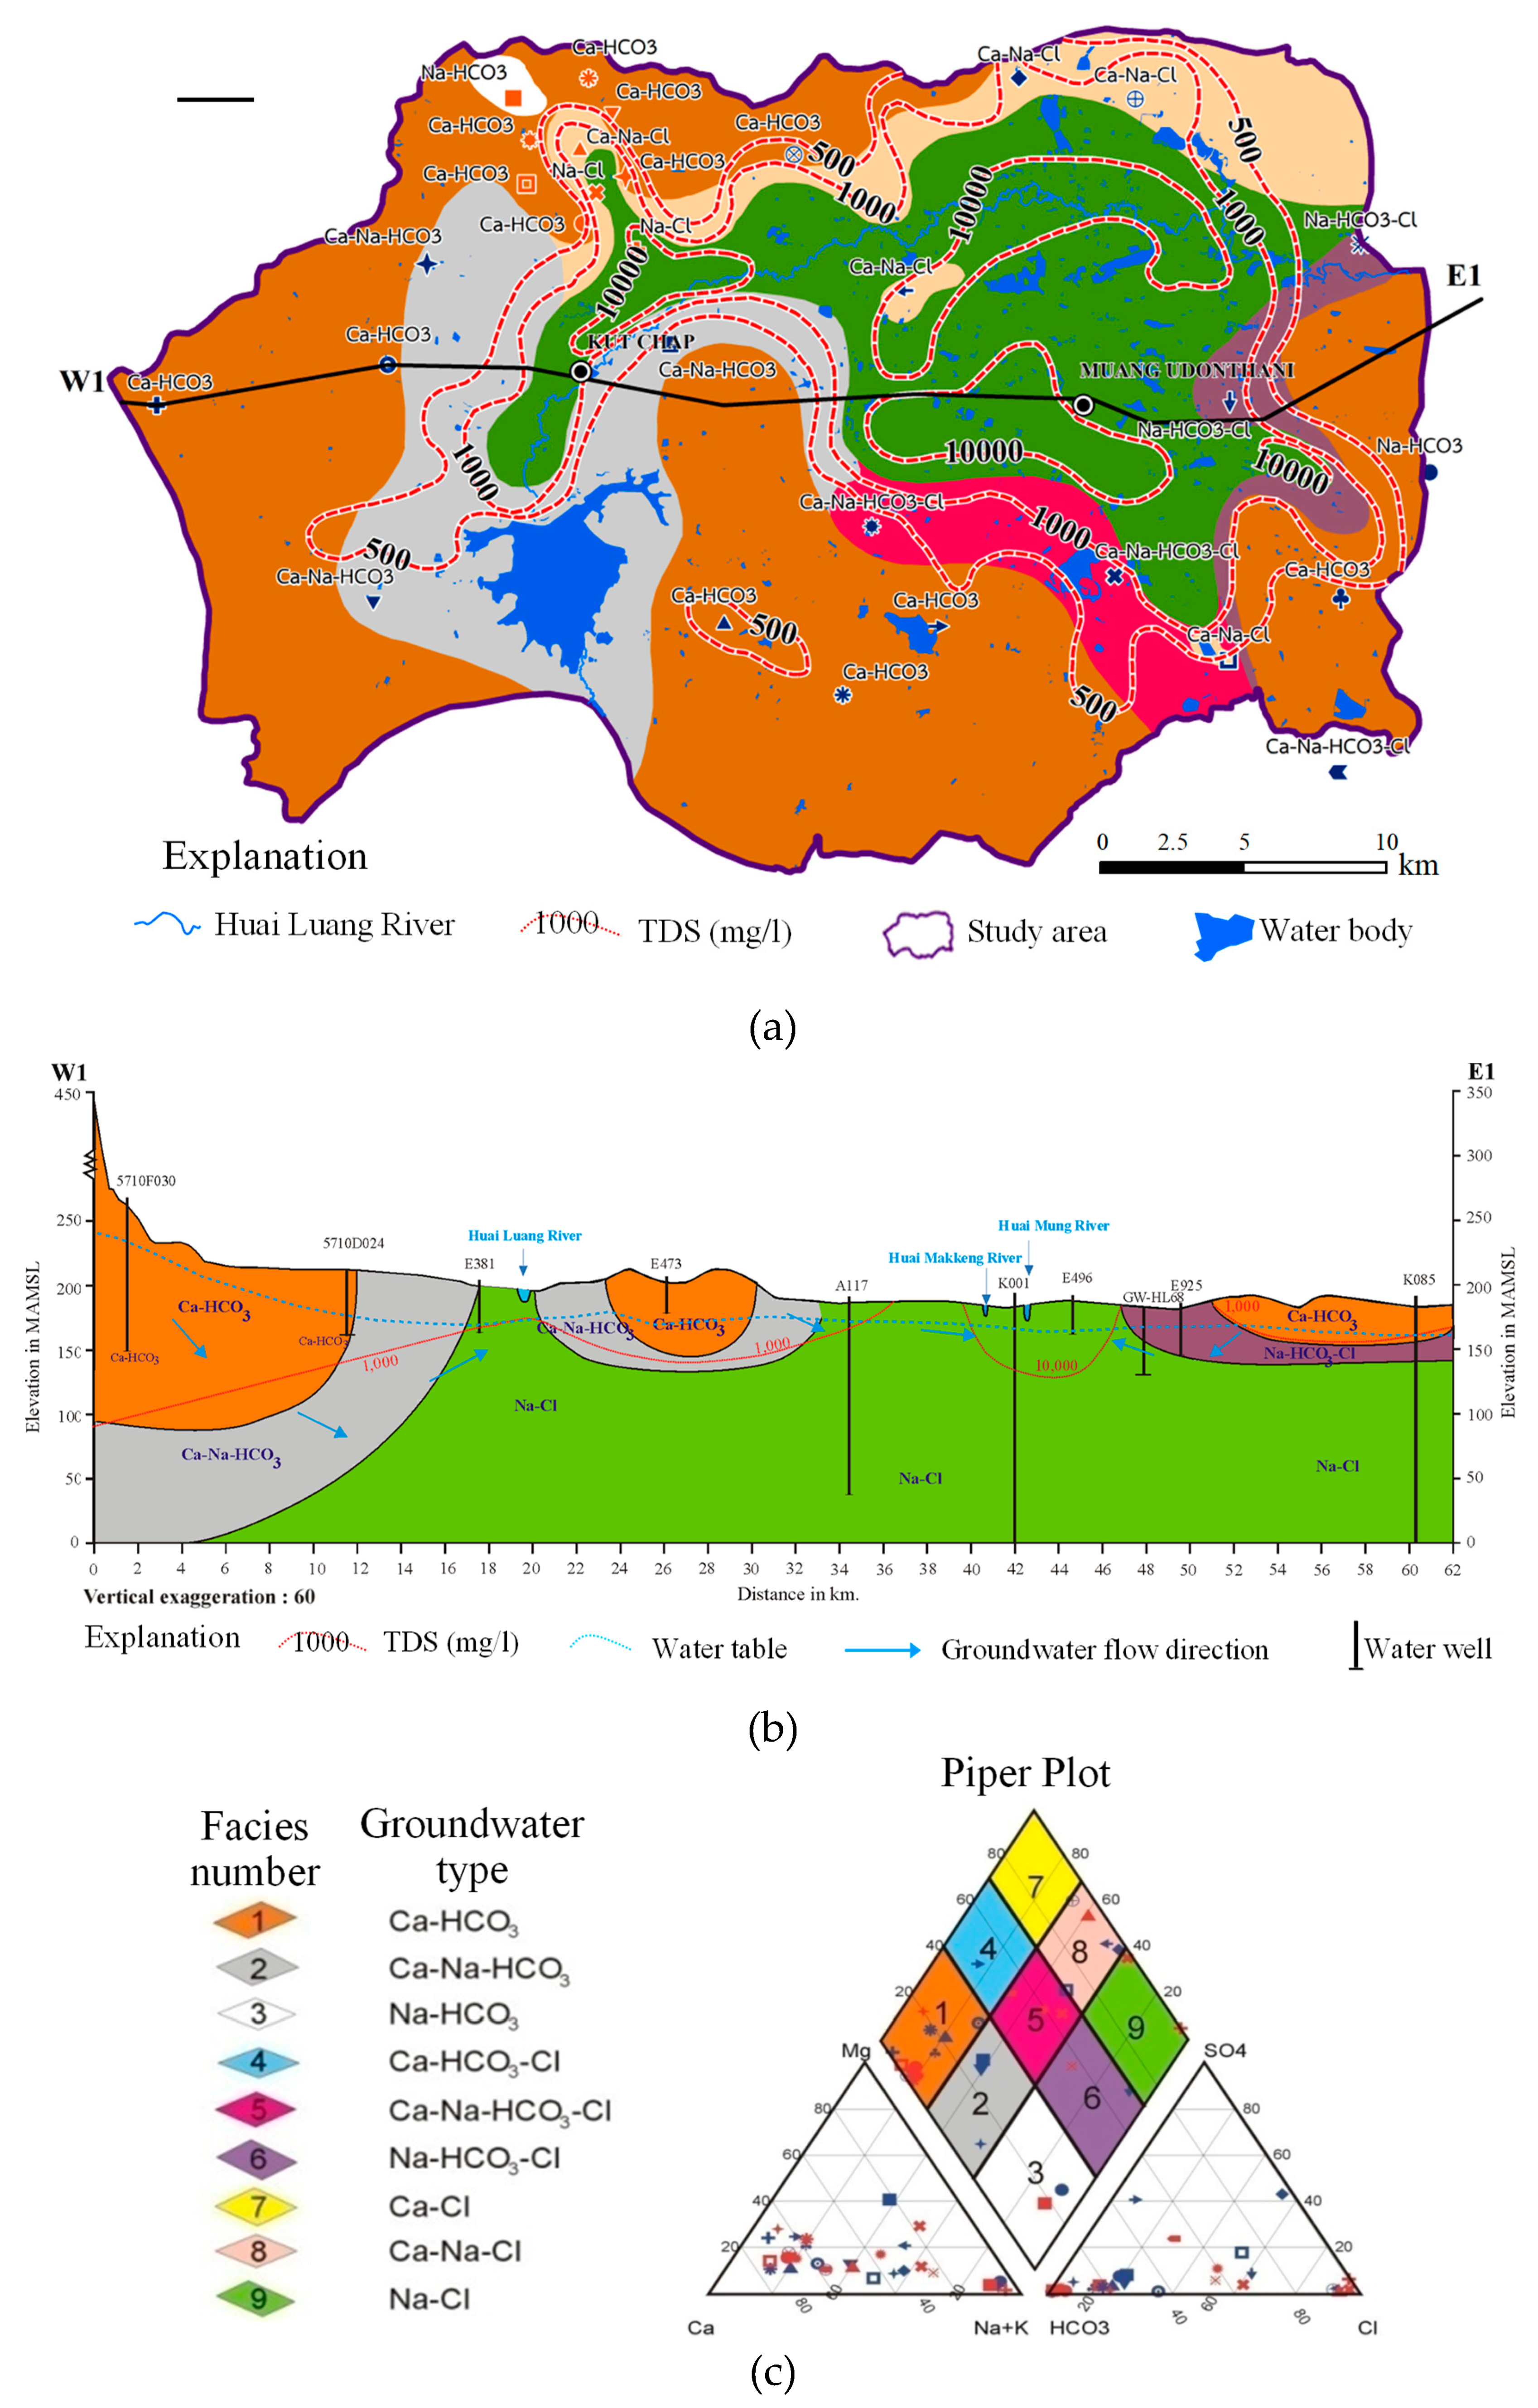
2.3. Groundwater Quality
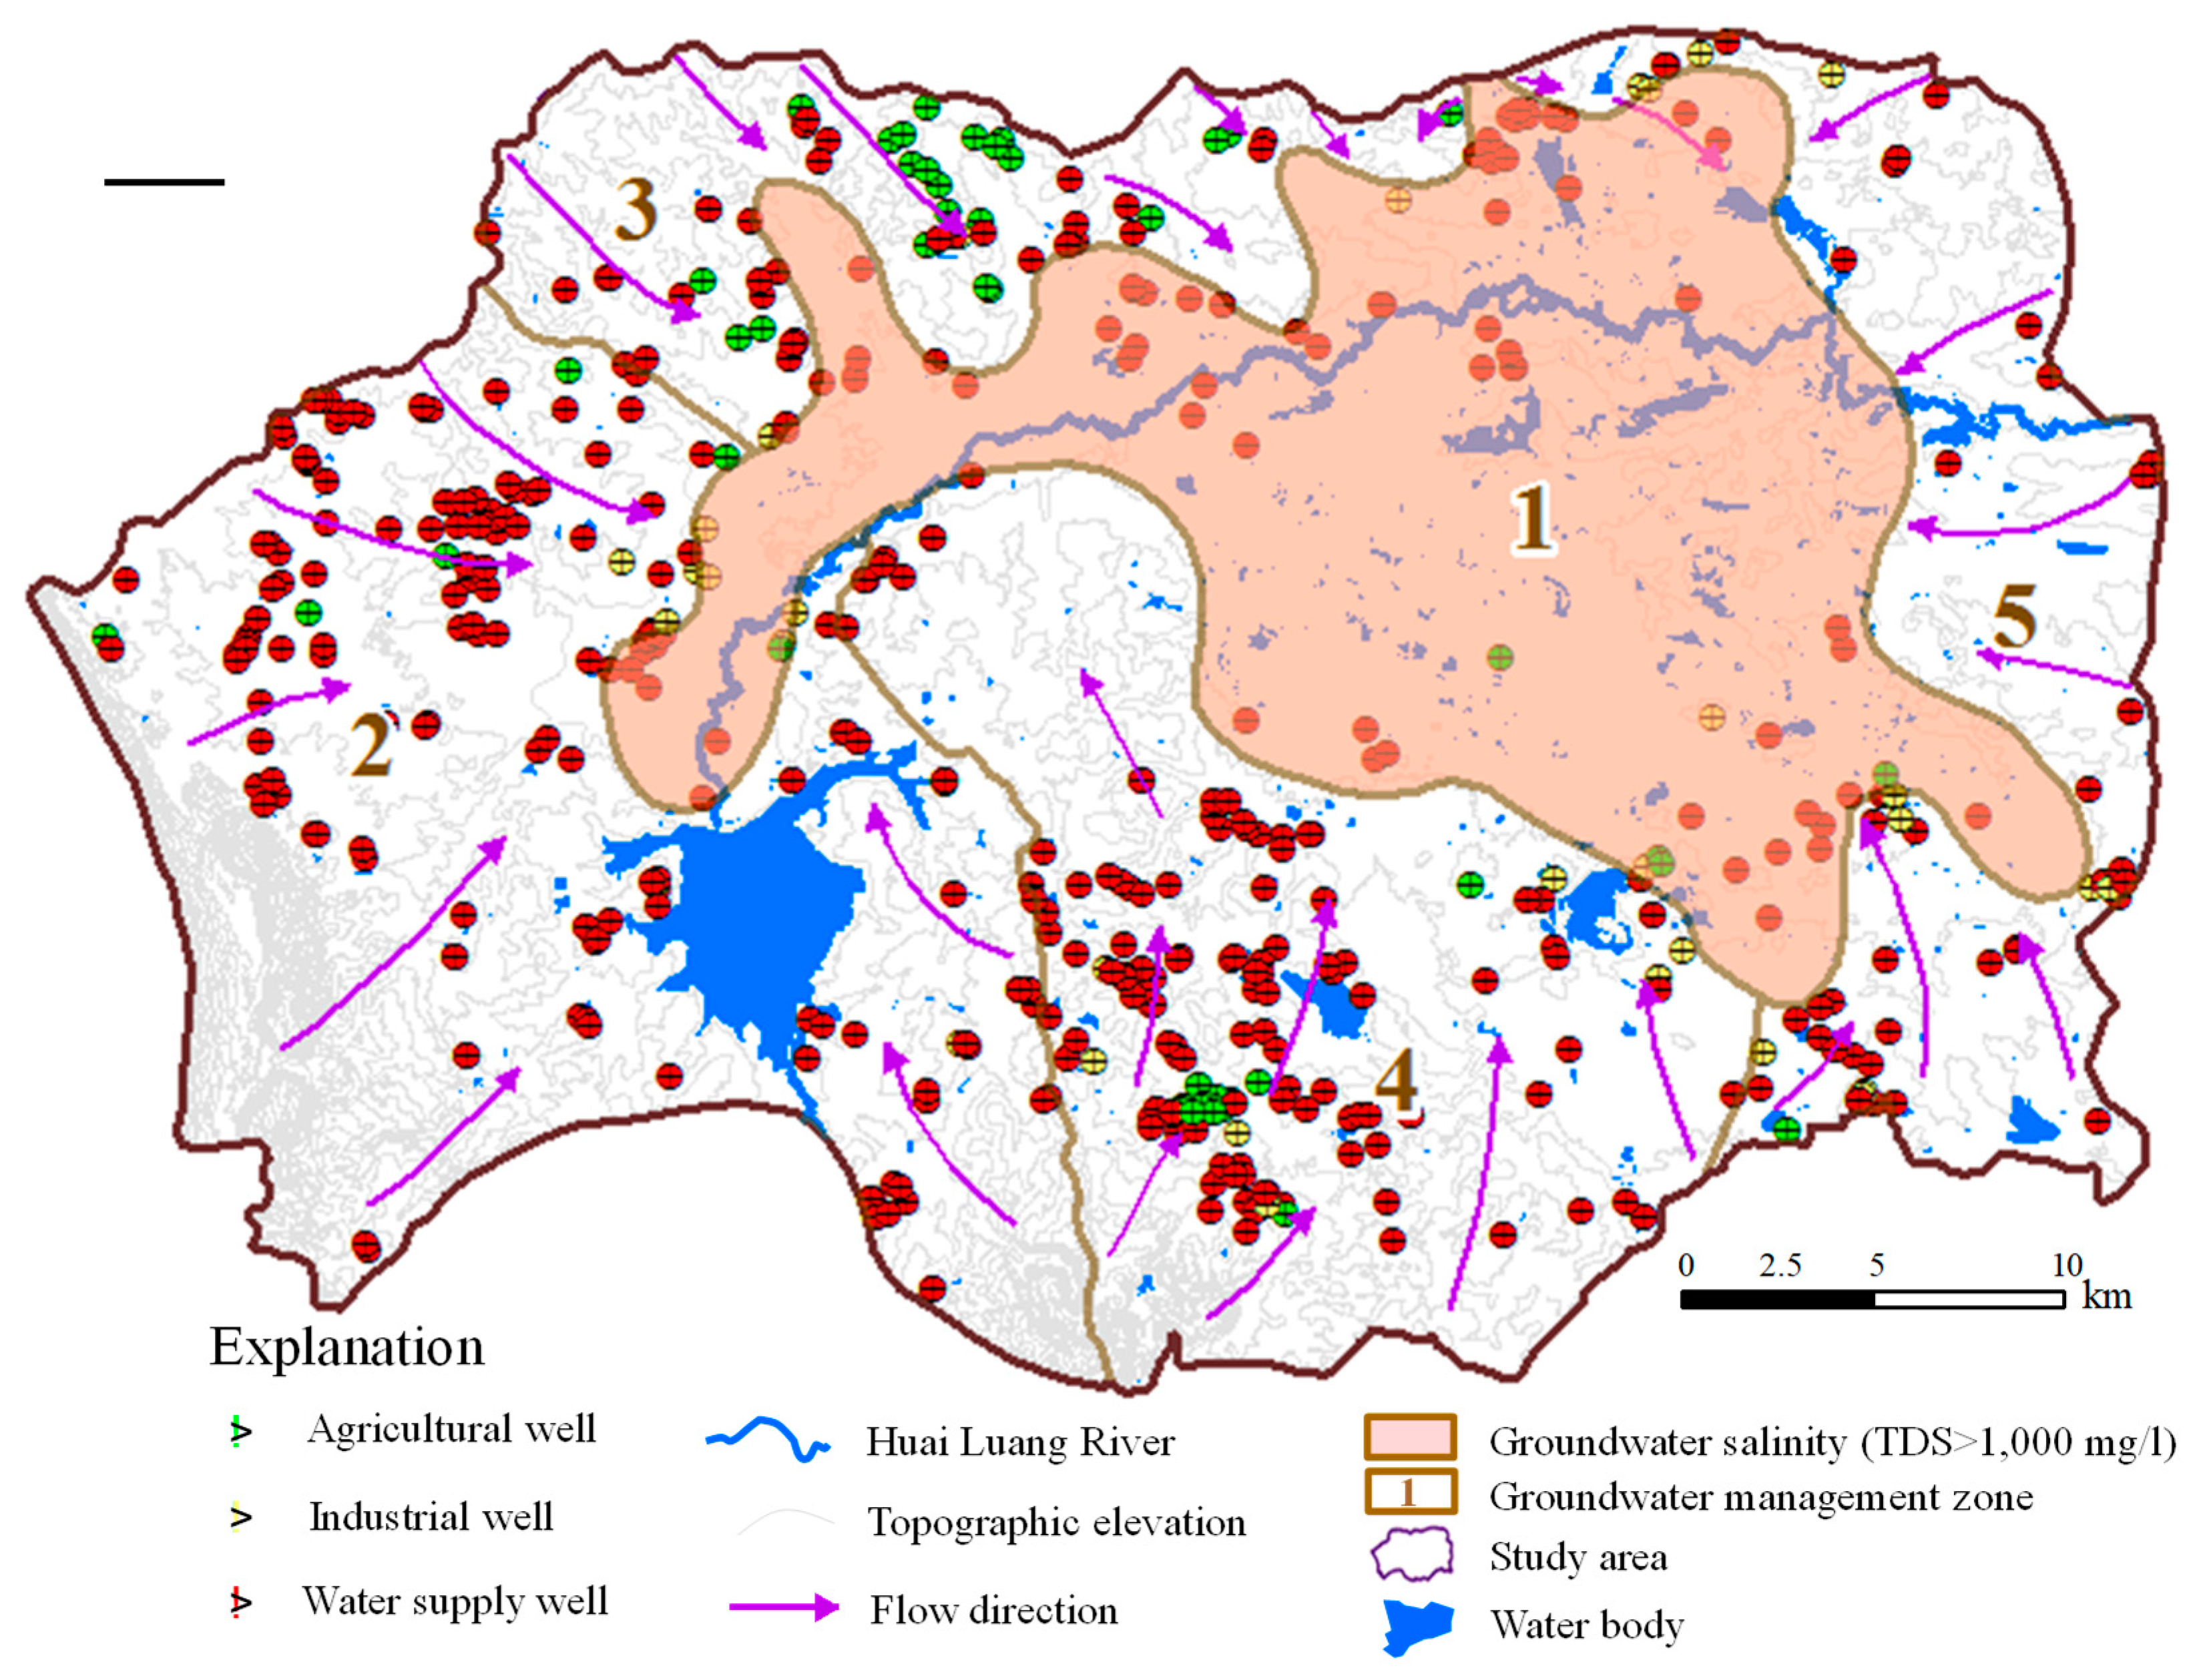
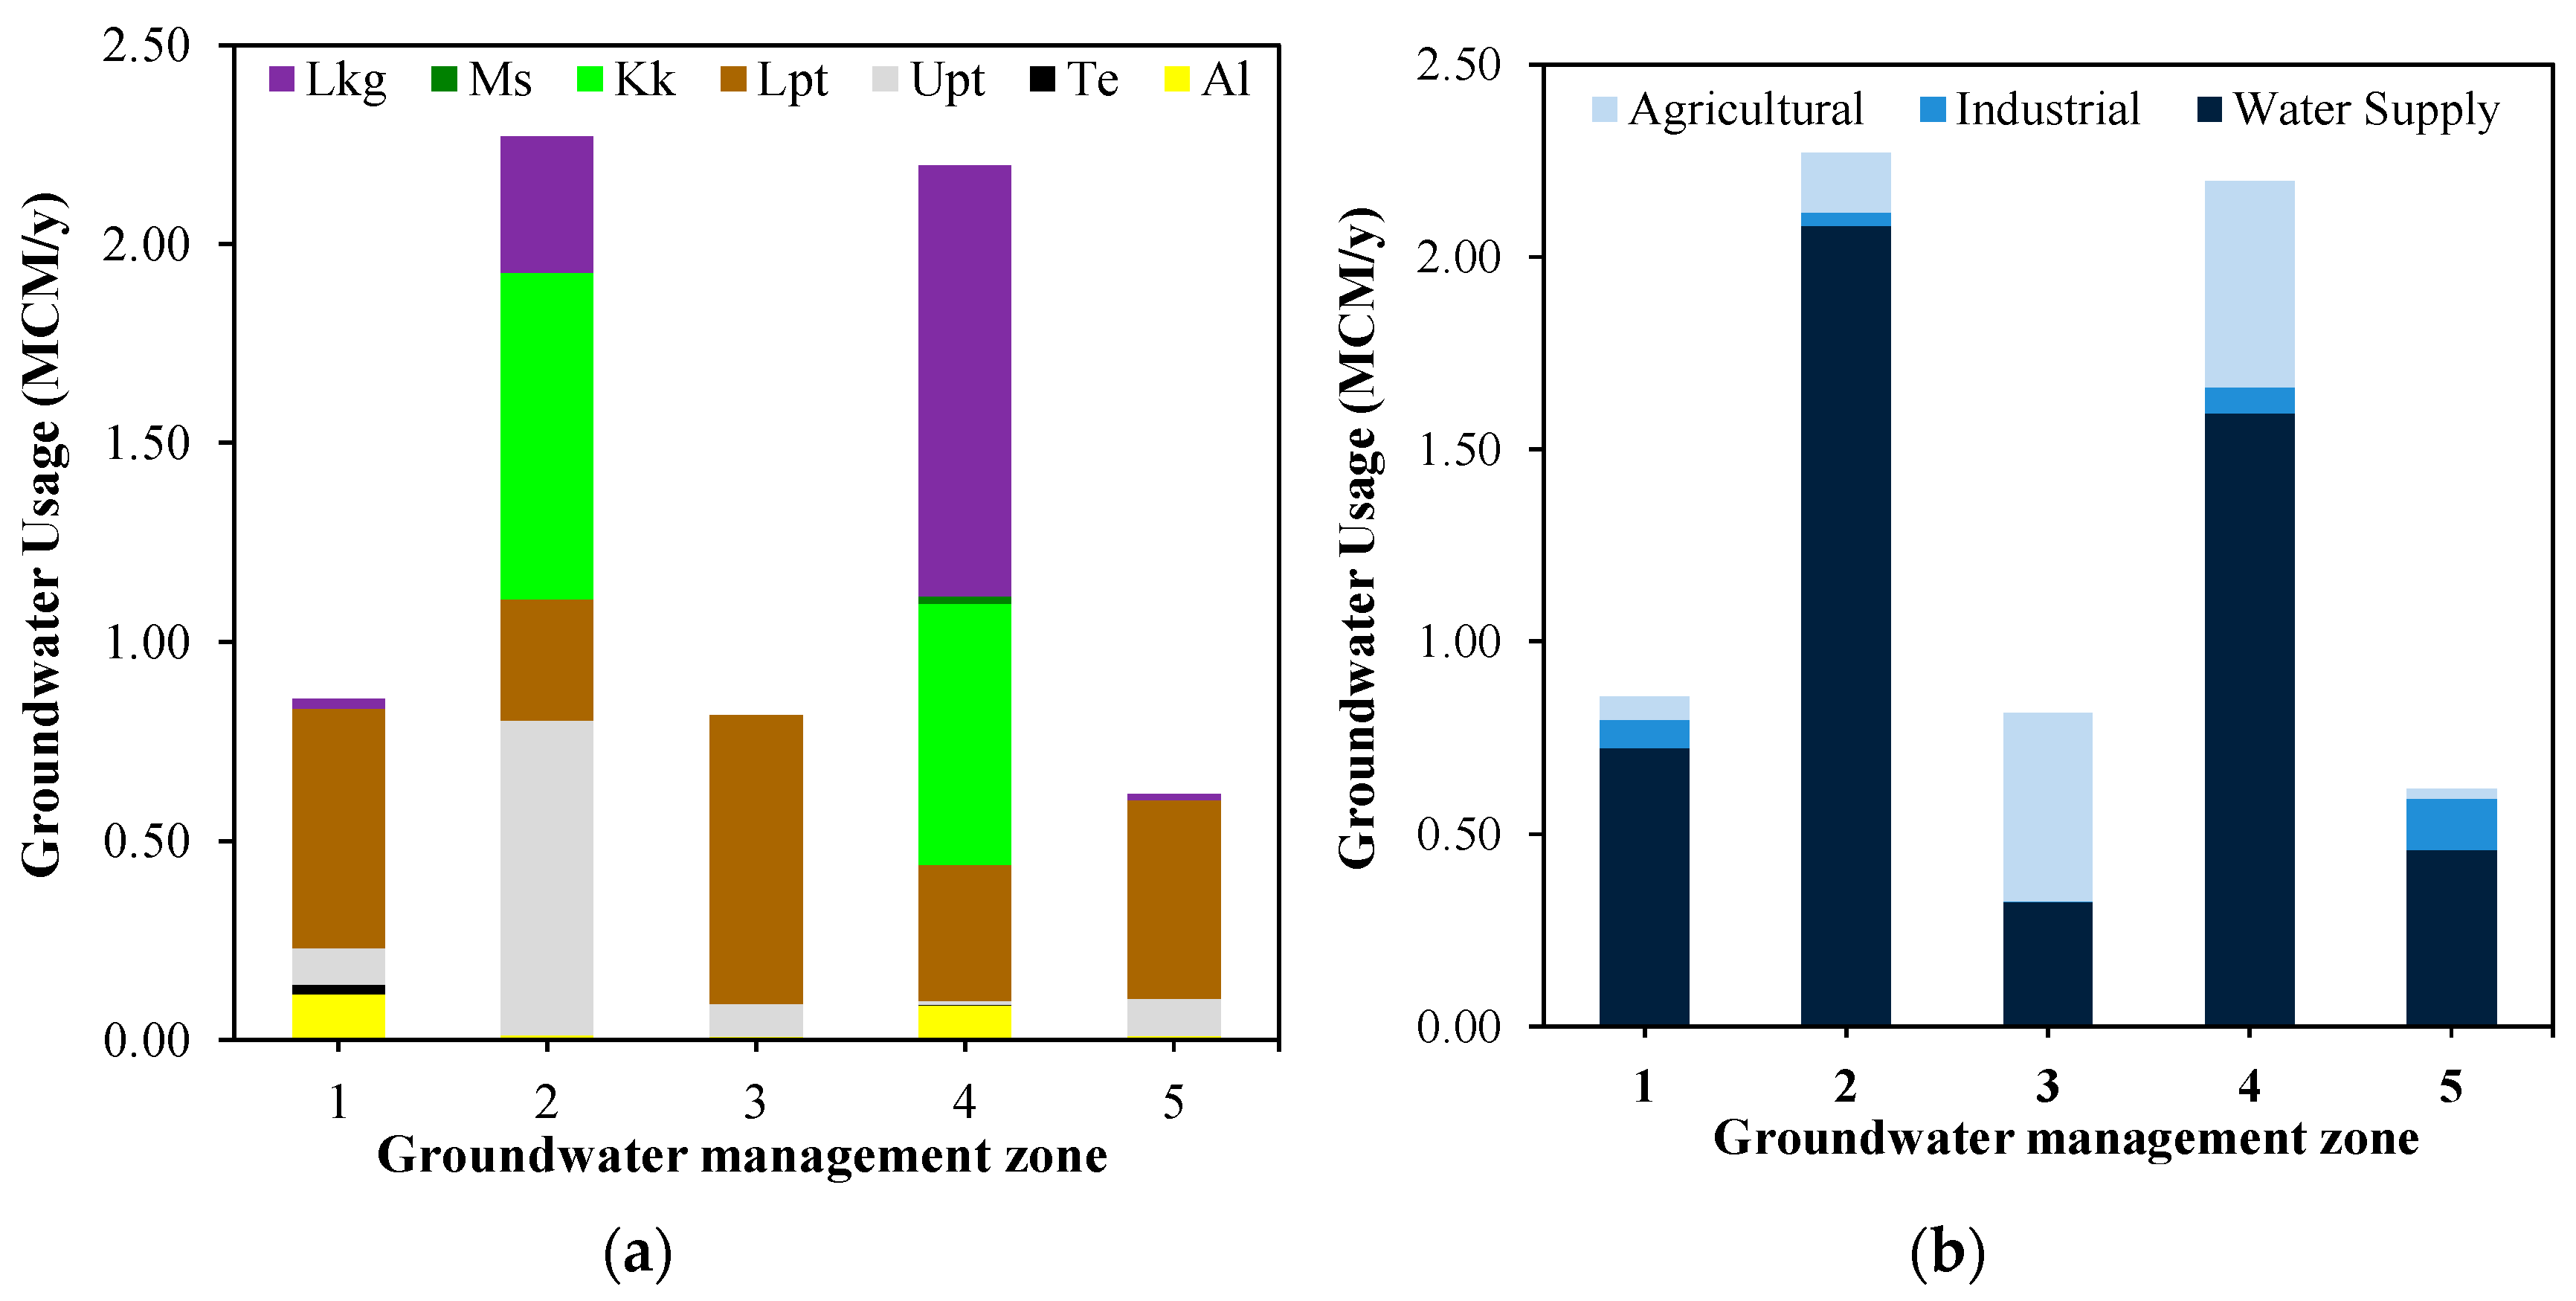
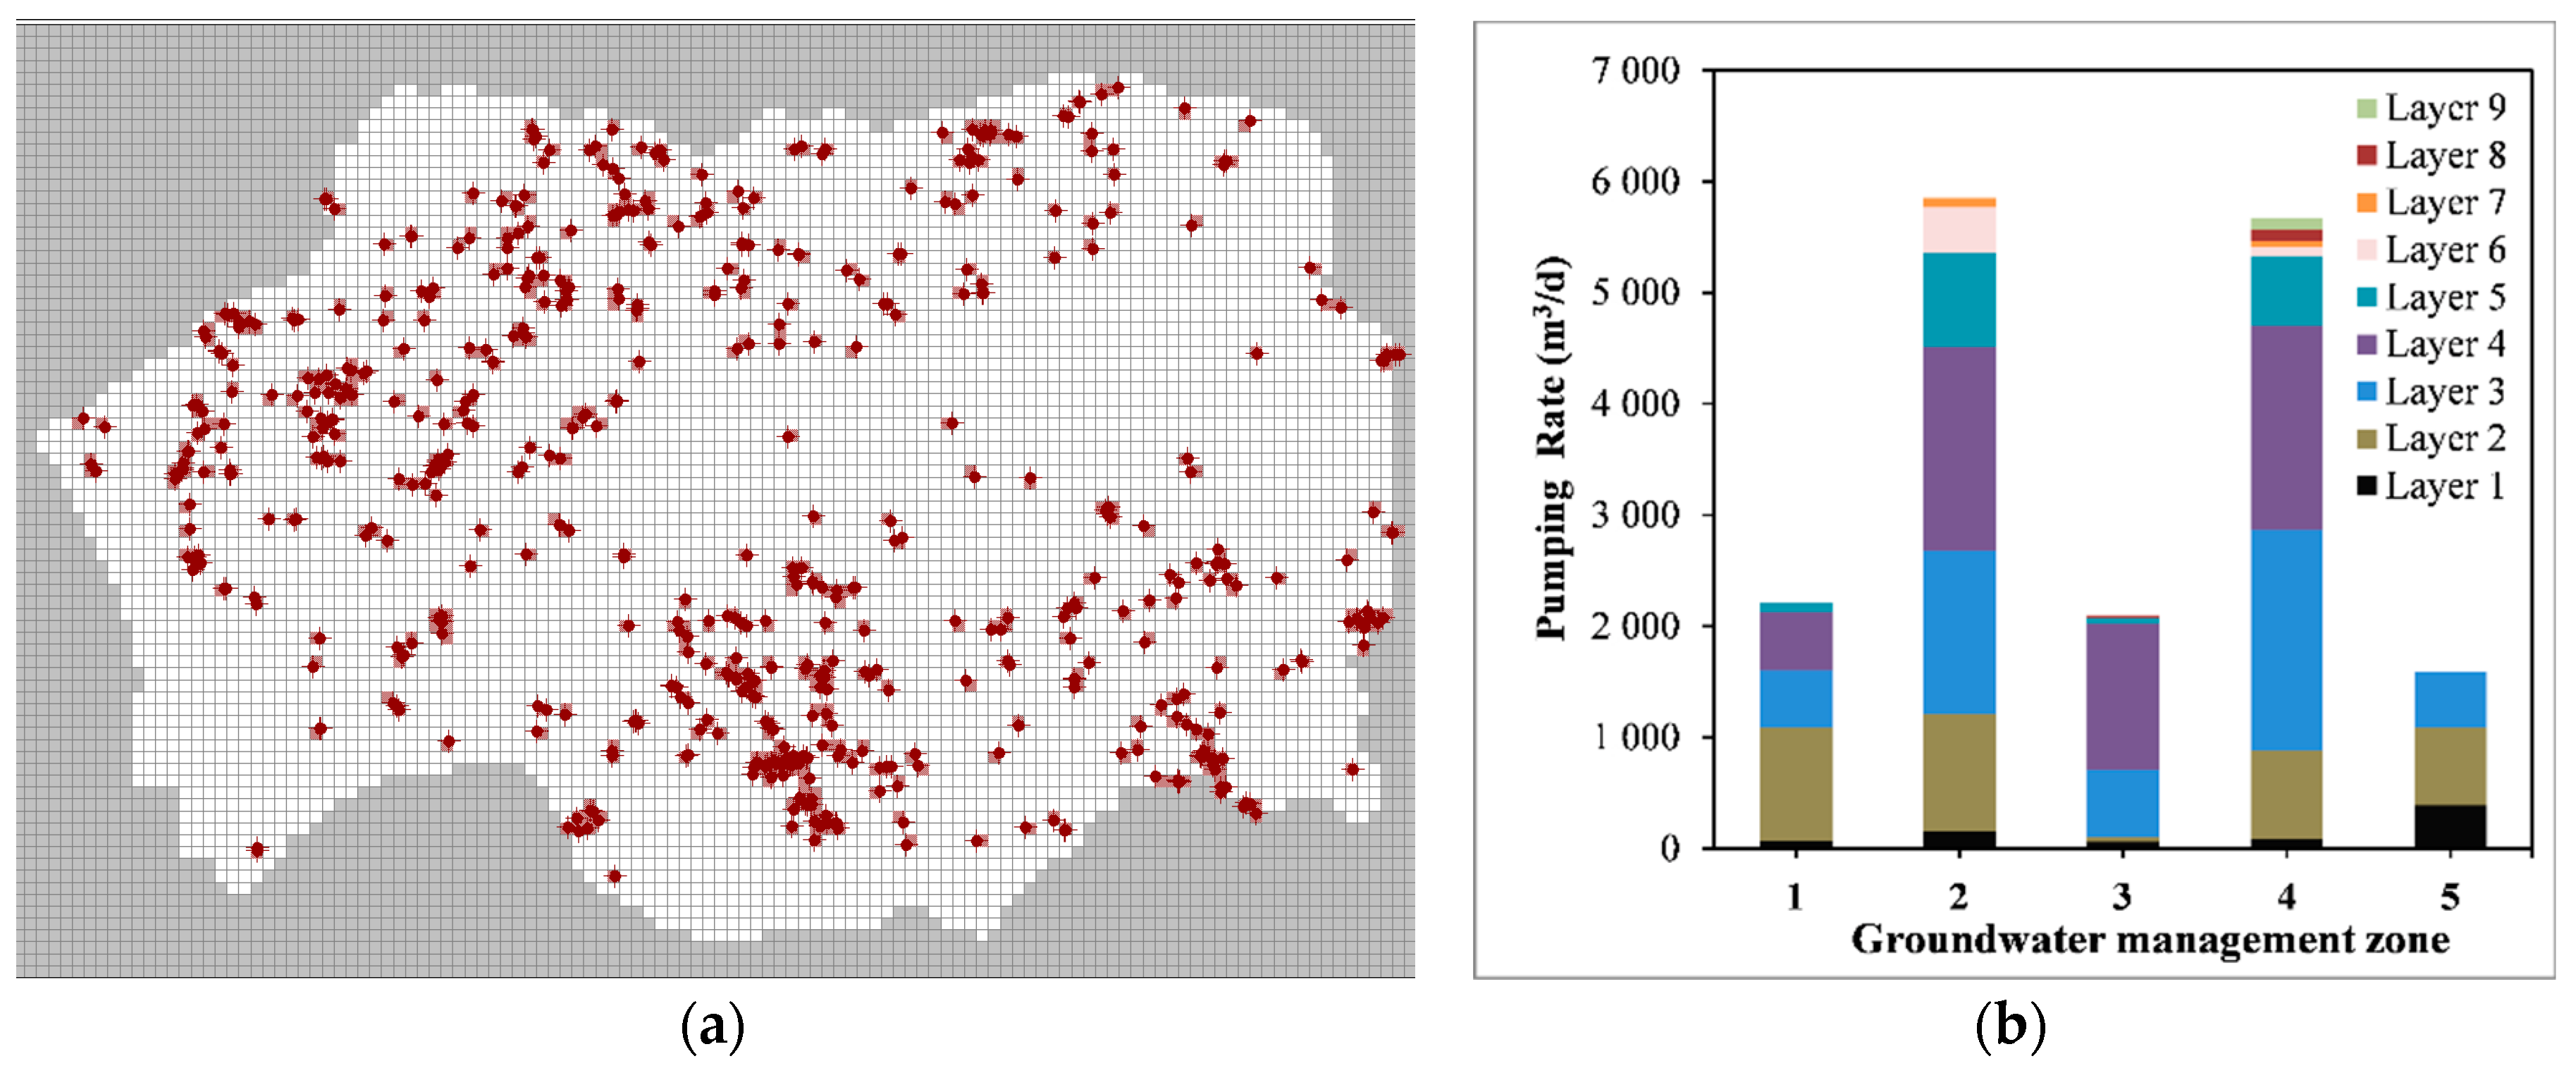
2.4. Groundwater Abstraction
3. Numerical Groundwater Model
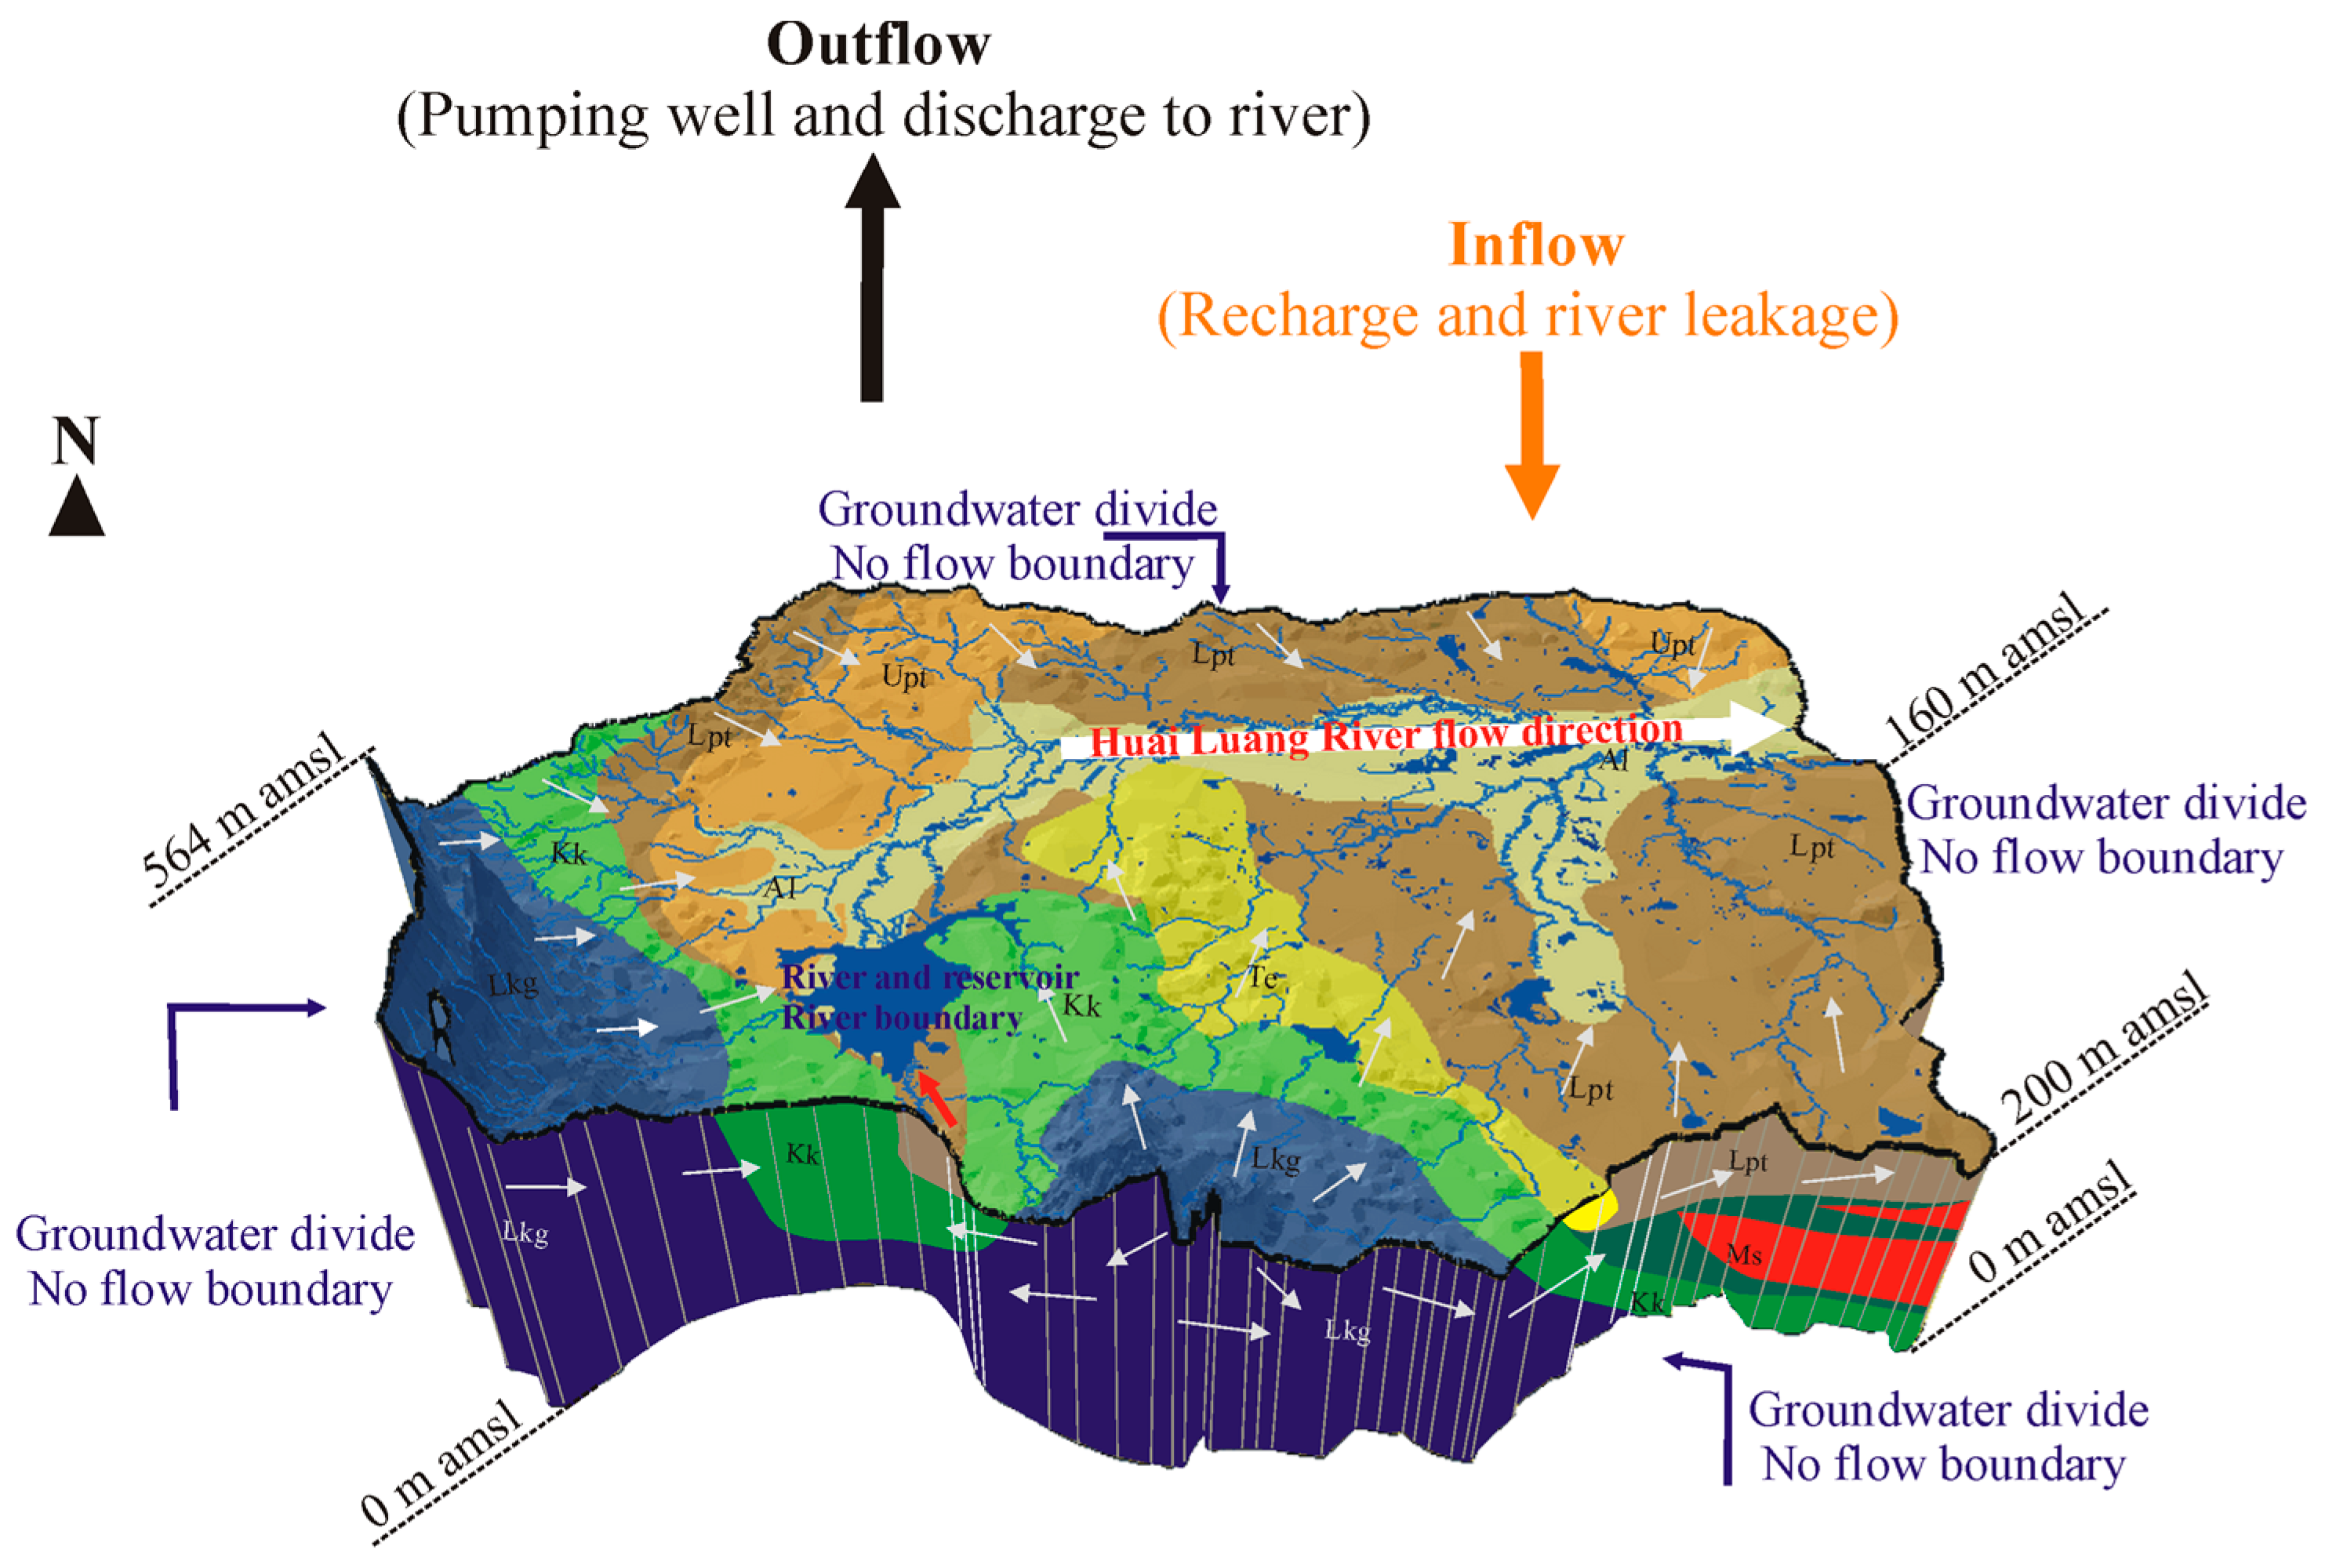
3.1. Hydrogeological Conceptual Model of CHLB Aquifers
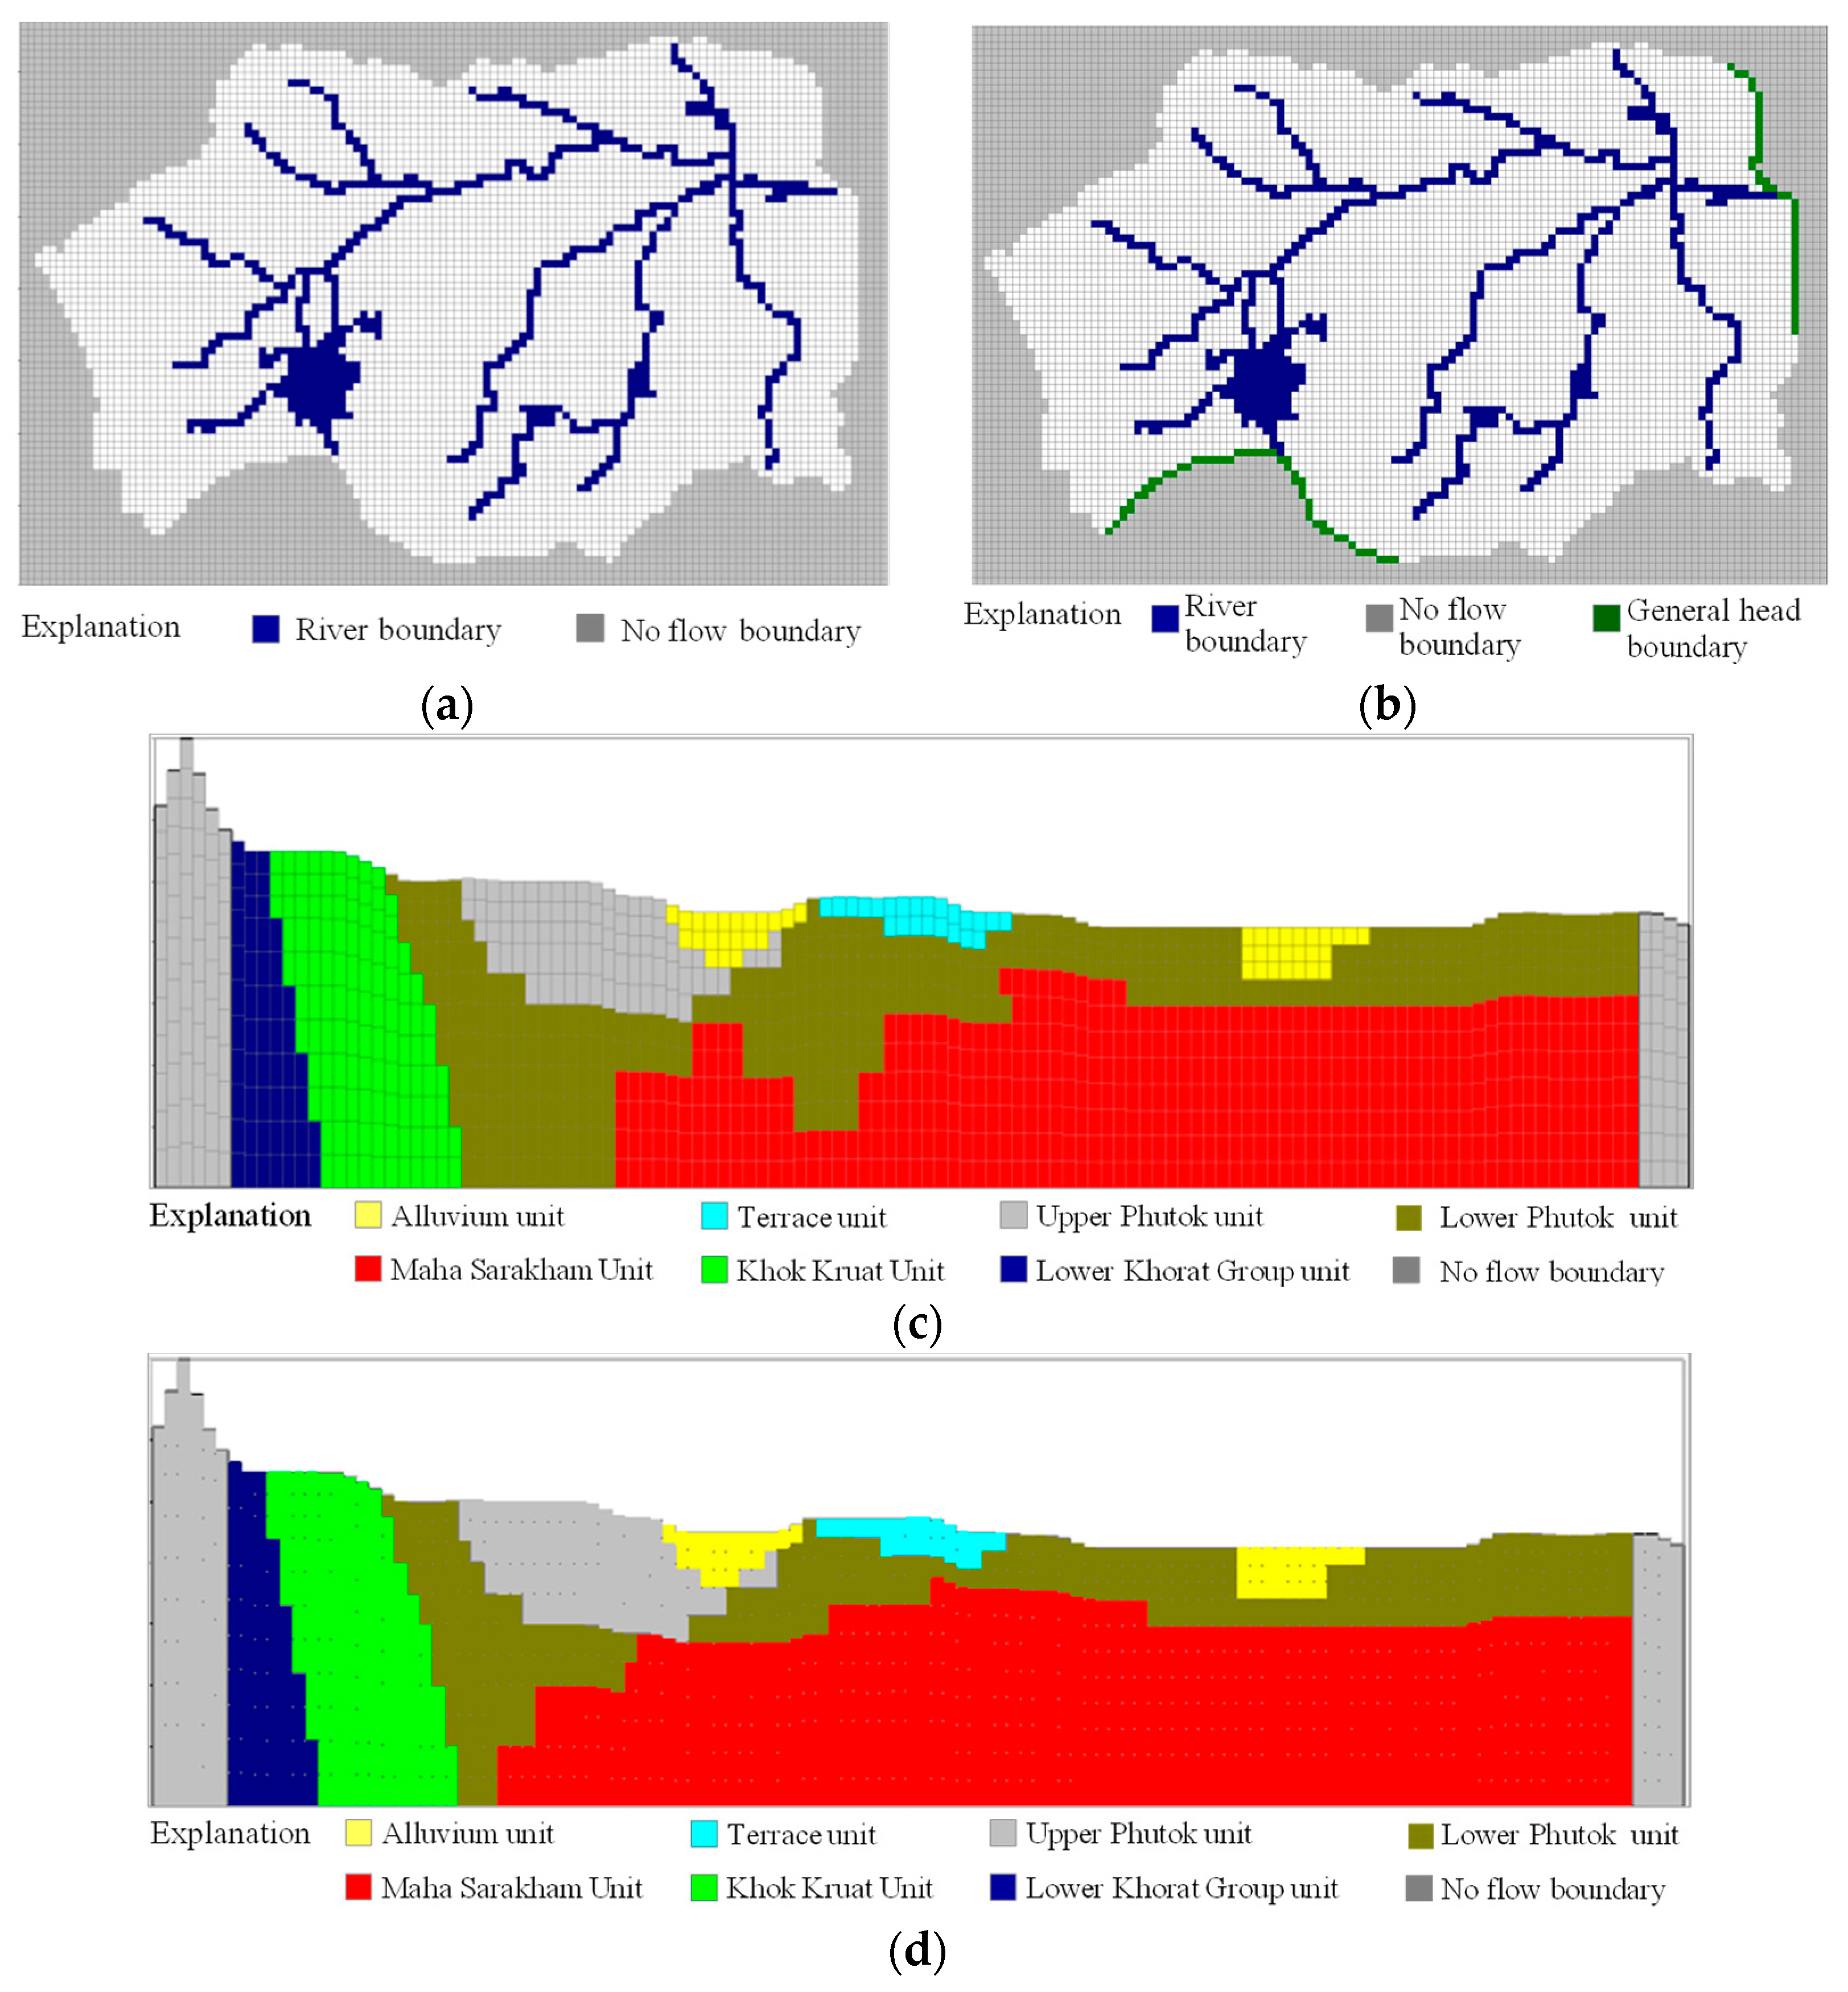
3.2. Groundwater Model Design
3.3. Model Calibration and Sensitivity Analysis
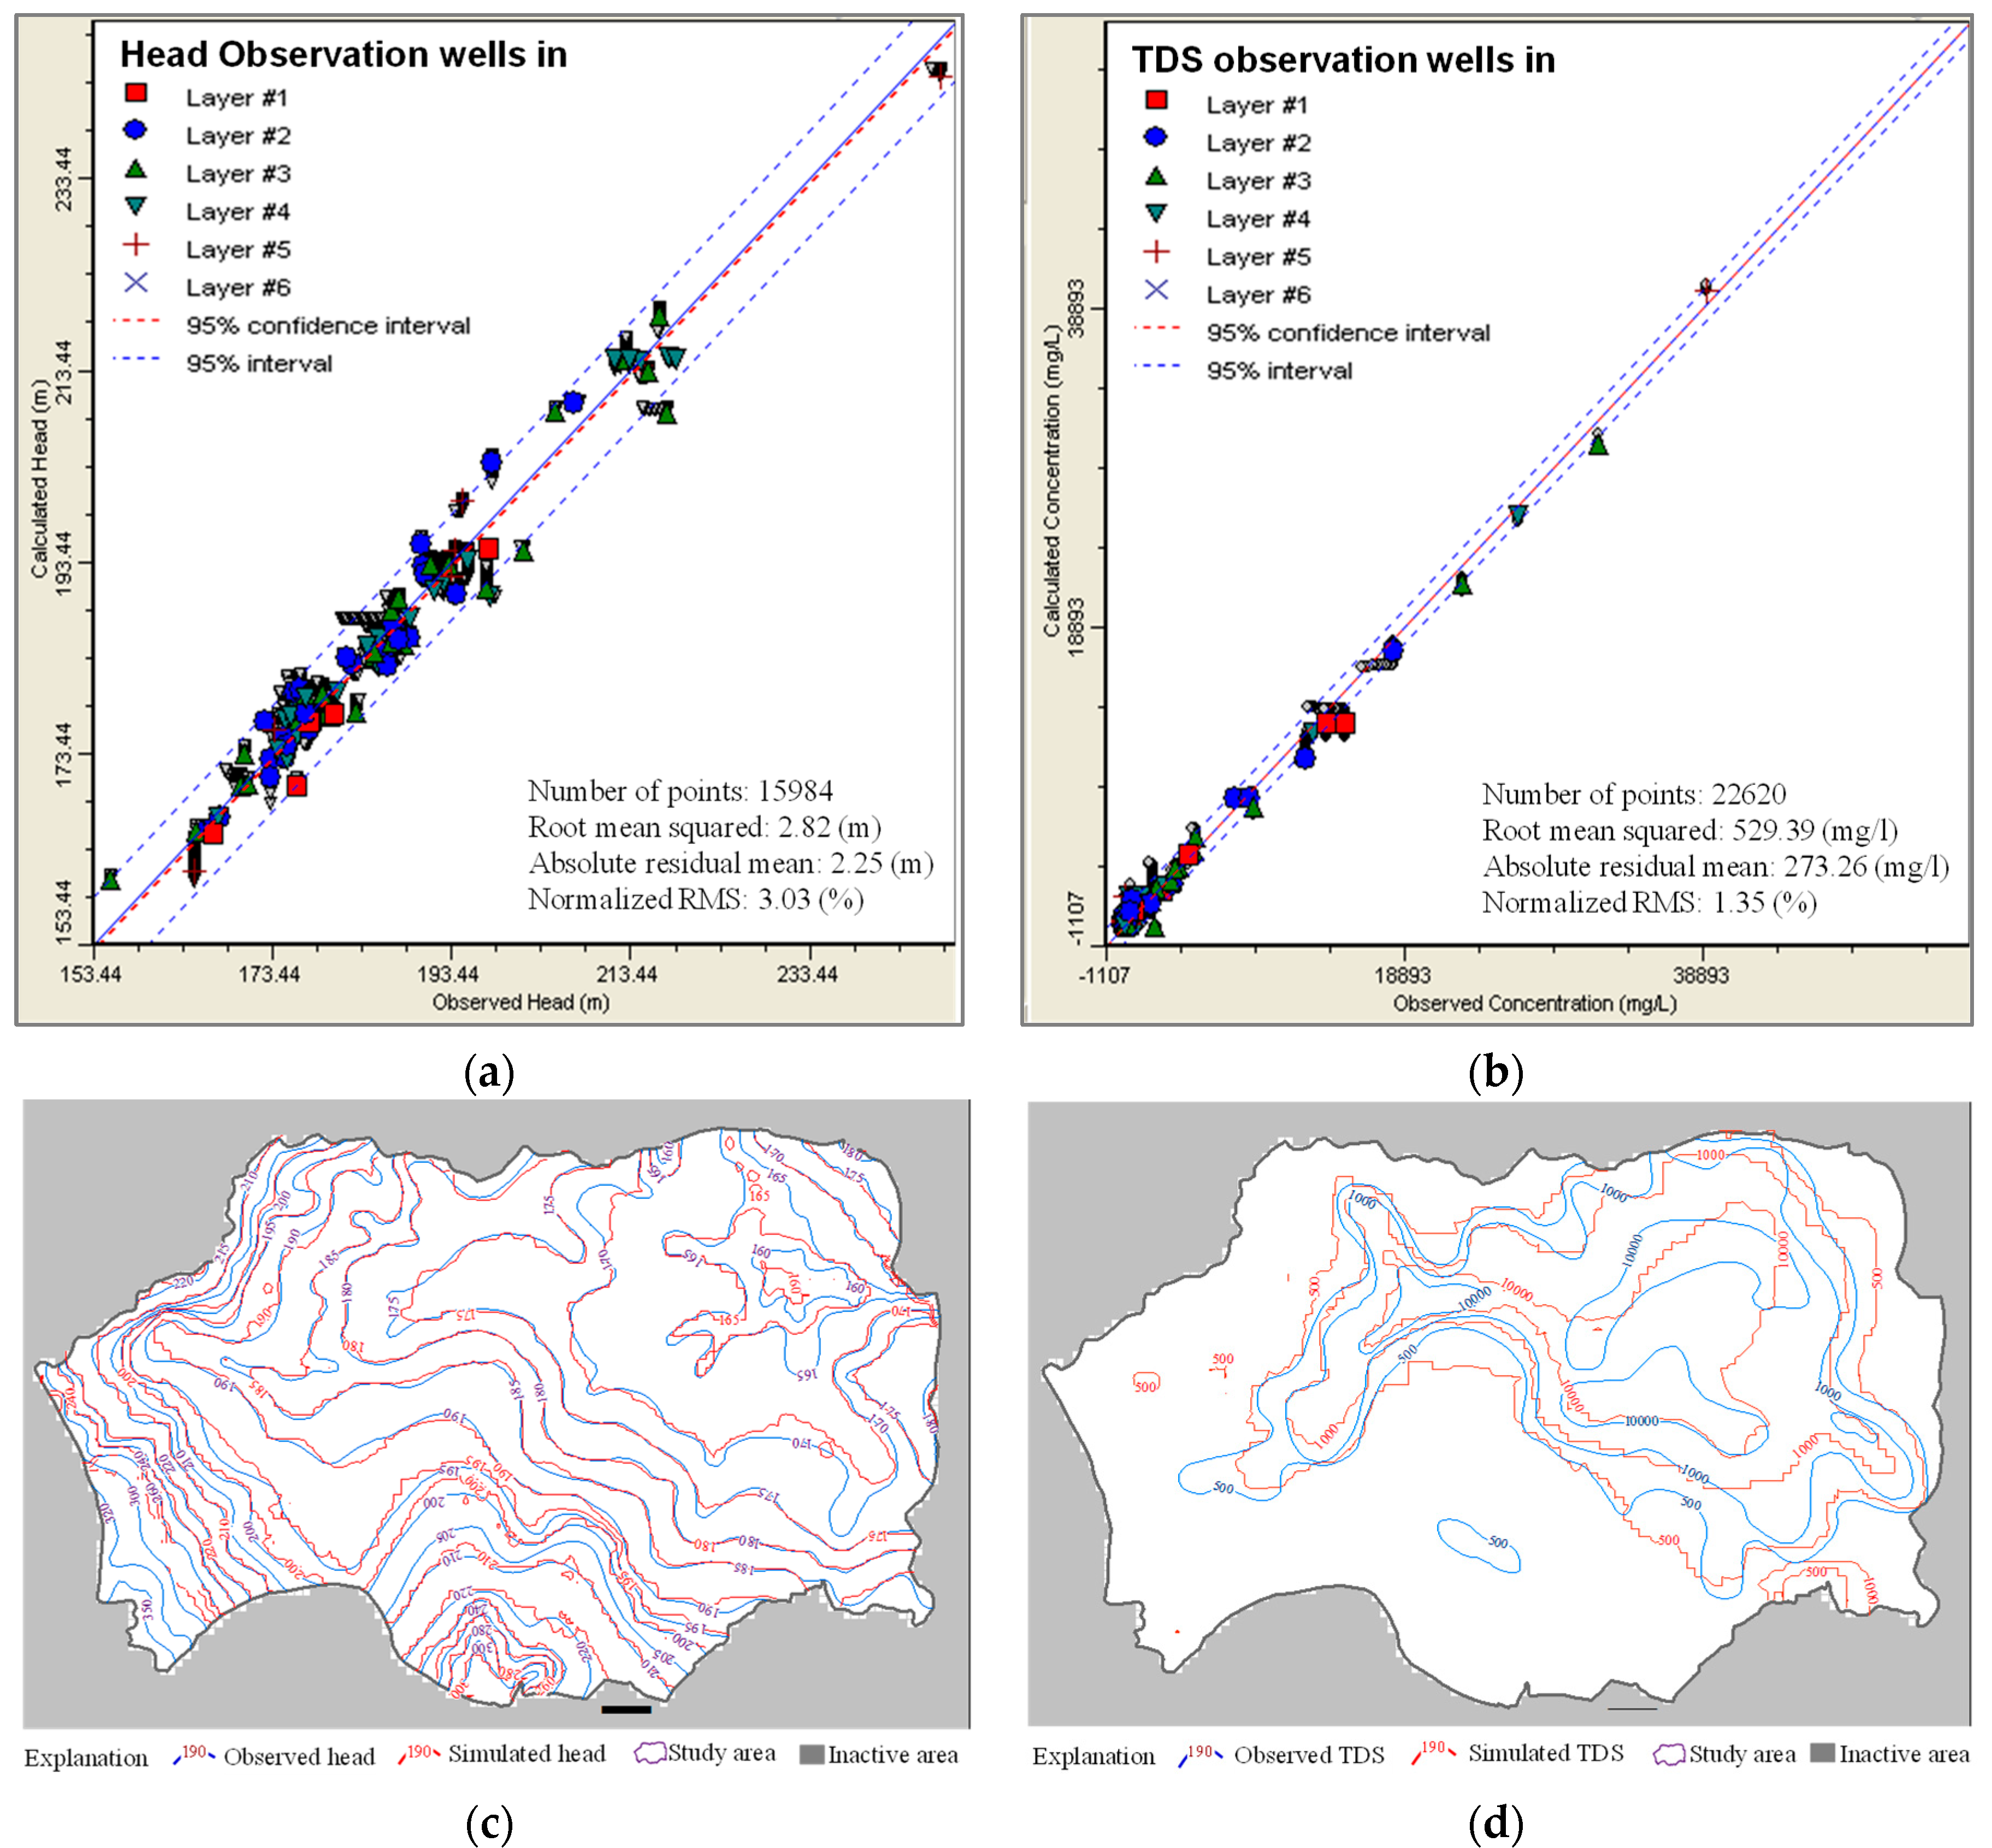
3.3.1. Model Calibration
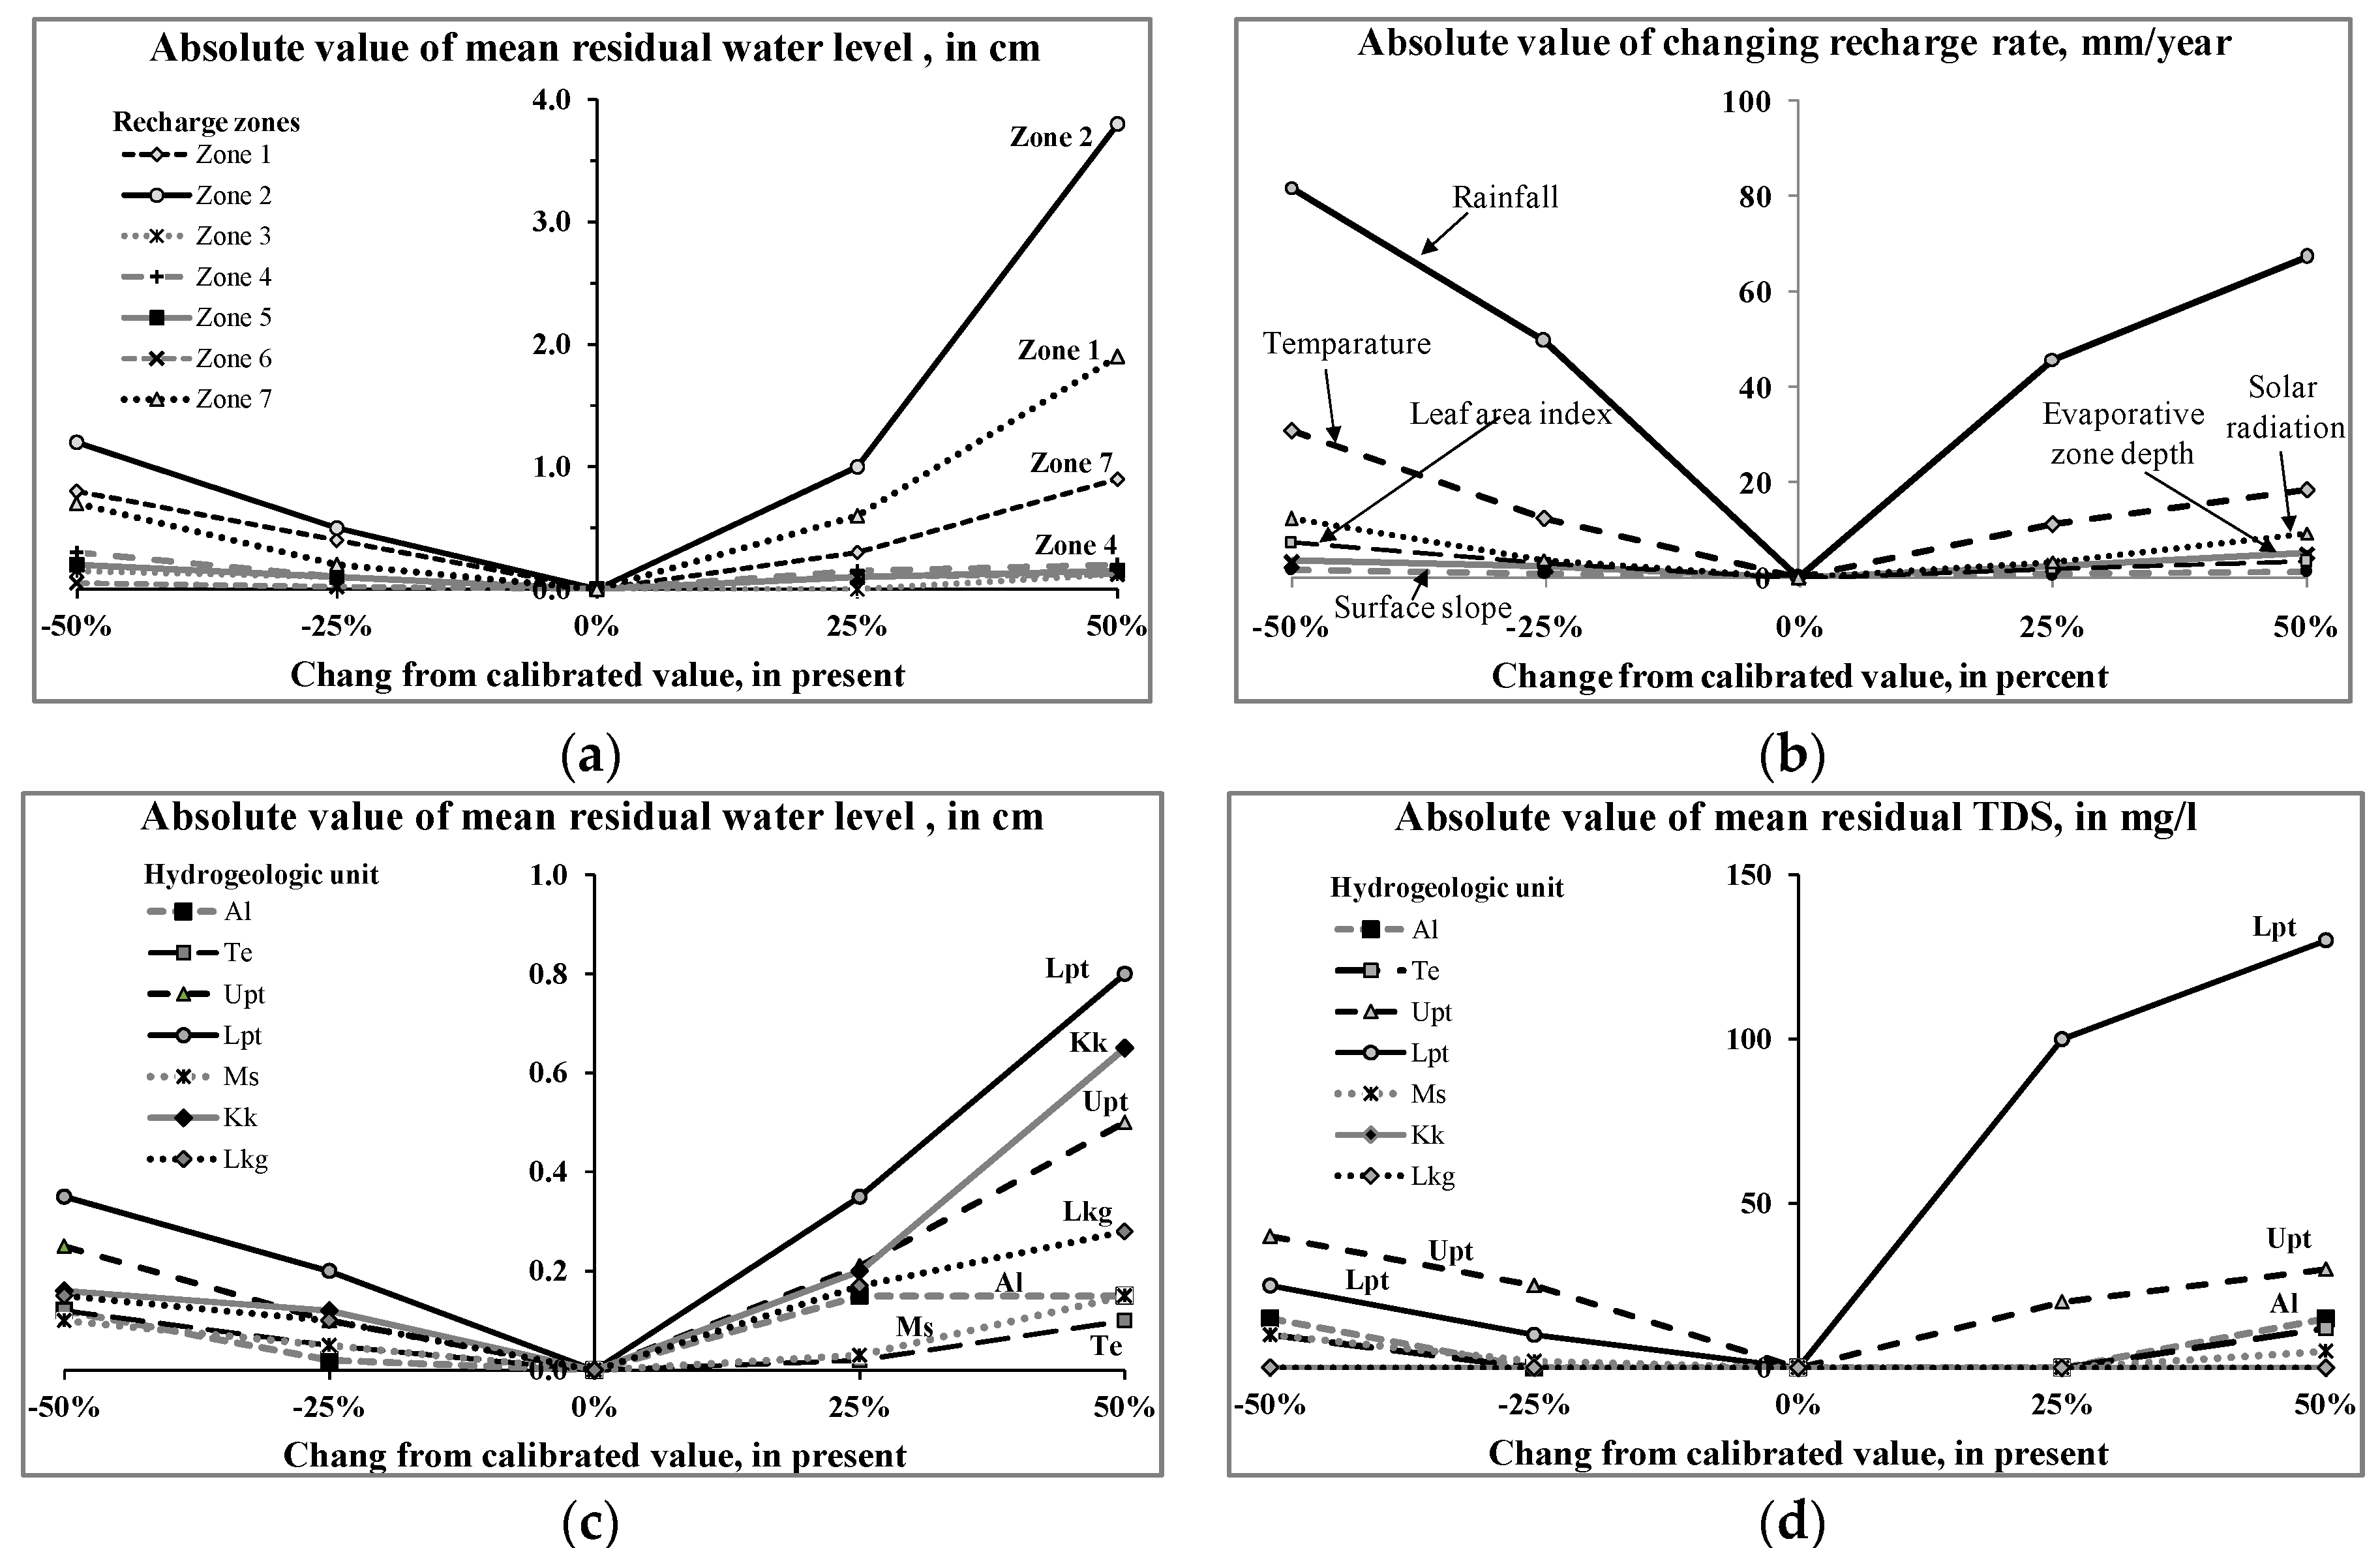
3.3.2. Model Sensitivity Analysis
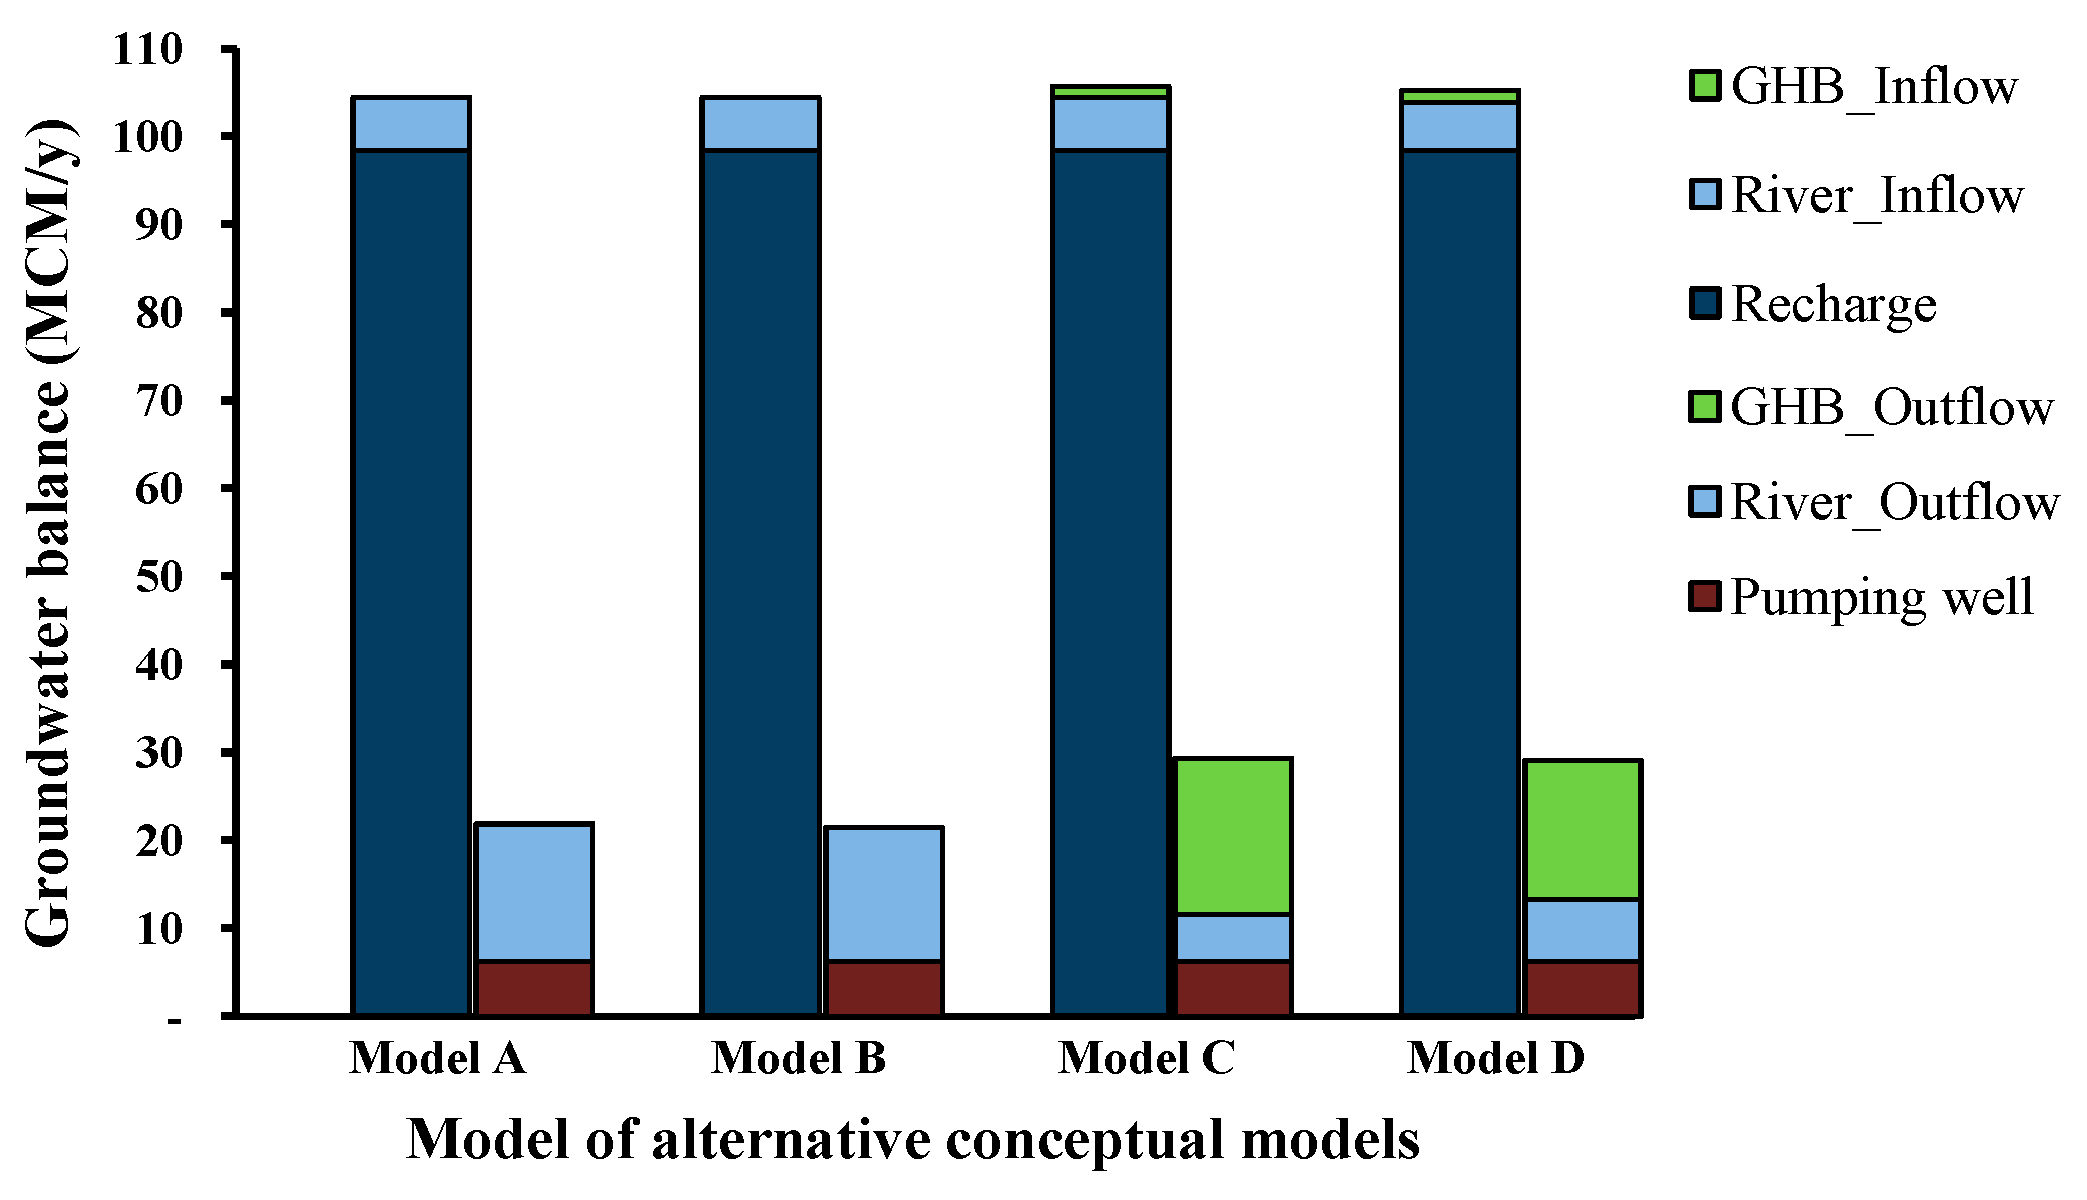
3.3.3. Model Aquifer Balance
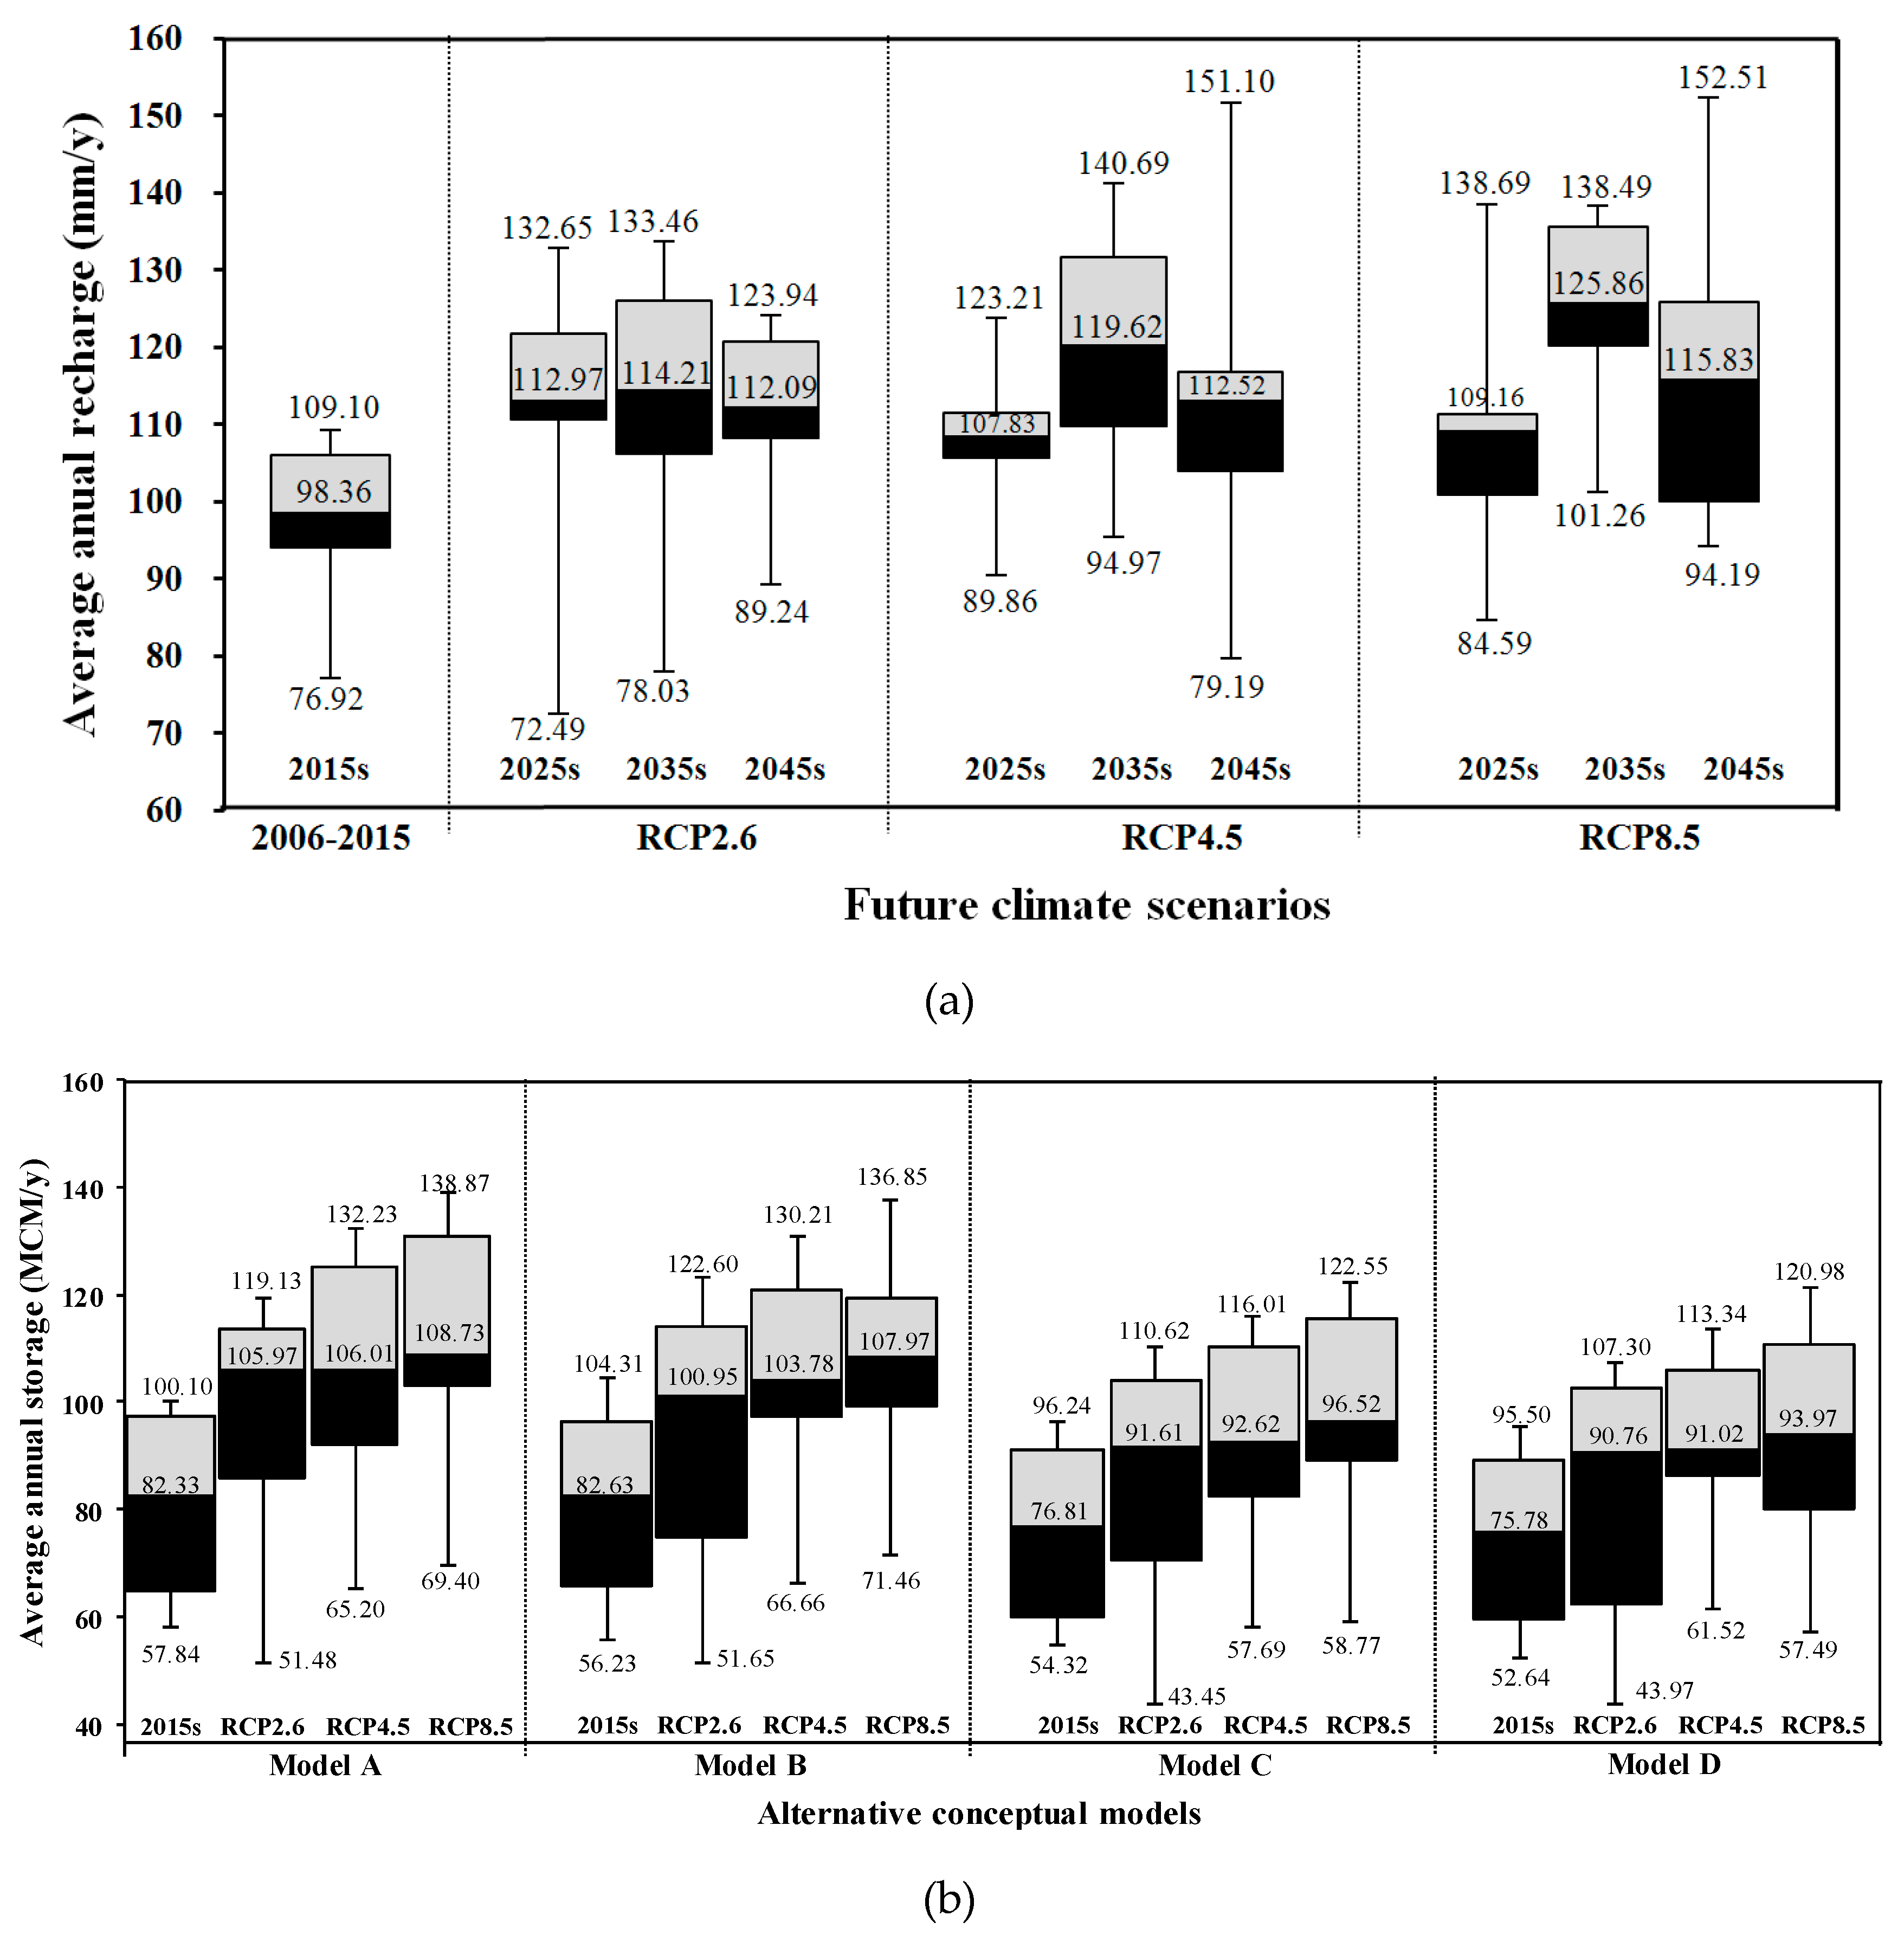
4. Future Climate Change
5. Impact of Conceptual Models and Climate Changes on Groundwater Systems
6. Sustainable Groundwater Yield
7. Conclusions and Recommendations
Author Contributions
Funding
Acknowledgments
Conflicts of Interest
References
- National Statistical Office (NSO). Gross Provincial Product in Thailand; National Statistical Office: Bangkok, Thailand, 2017.
- Department of Groundwater Resources (DGR). Groundwater situation of Thailand Report; Department of Groundwater Resources: Bangkok, Thailand, 2016; 253p.
- Kresic, N.; Mikszewski, A. Hydrogeological Conceptual Site Models: Data Analysis and Visualization; Tayler & Francis Group: Boca Raton, FL, USA, 2013; 584p. [Google Scholar]
- Nettasana, T. Conceptual Model Uncertainty in the Management of the Chi River Basin, Thailand. Ph.D. Thesis, University of Waterloo, Waterloo, ON, Canada, 2012. [Google Scholar]
- Wu, J.C.; Zeng, X.K. Review of the uncertainty analysis of groundwater numerical. Chin. Sci. Bull. 2013, 58, 3044–3052. [Google Scholar] [CrossRef]
- Lukjan, A.; Swasdi, S.; Chalermyanont, T. Importance of Alternative Conceptual Model for Sustainable Groundwater Management of the Hat Yai Basin, Thailand. Procedia Eng. 2016, 154, 308–316. [Google Scholar] [CrossRef]
- Rojas, R.; Feyen, L.; Dassargues, A. Conceptual model uncertainty in groundwater modeling: Combining generalized likelihood uncertainty estimation and Bayesian model averaging. Water Resour. Res. 2008, 44. [Google Scholar] [CrossRef]
- Bredehoeft, J. The conceptualization model problem—Surprise. Hydrogeol. J. 2005, 13, 37–46. [Google Scholar] [CrossRef]
- Anderson, M.P.; Woessner, W.W.; Hunt, R.J. Applied Groundwater Modeling: Simulation of Flow and Advective Transport; Elsevier Academic Press: Amsterdam, The Natherlands, 2015; 516p. [Google Scholar]
- Troldborg, L.; Refsgaard, J.C.; Jensen, K.H. The importance of alternative conceptual models for simulation of concentrations in a multi-aquifer system. Hydrogeol. J. 2007, 15, 843–860. [Google Scholar] [CrossRef]
- The Intergovernmental Panel on Climate Change (IPCC). Managing the Risks of Extreme Events and Disasters to Advance Climate Change Adaptation. In A Special Report of Working Groups I and II of the Intergovernmental Panel on Climate Change; Cambridge University Press: Cambridge, UK, 2012. [Google Scholar]
- The Intergovernmental Panel on Climate Change (IPCC). Climate Change 2007: The Physical Science Basis. In Contribution of Working Group I to the Fourth Assessment Report of the Intergovernmental Panel on Climate Change; Cambridge University Press: Cambridge, UK, 2007. [Google Scholar]
- Kundzewicz, Z.W.; Mata, L.J.; Arnell, N.W.; Döll, P.; Kabat, P.; Jiménez, B. Freshwater Resources and Their Management; Cambridge University Press: Cambridge, UK, 2007. [Google Scholar]
- Bates, B.C.; Kundzewicz, Z.W.; Wu, S.; Palutikof, J.P. Climate Change and Water. In Technical Paper of the Intergovernmental Panel on Climate Change; IPCC Secretariat: Geneva, Switzerland, 2008; 210p. [Google Scholar]
- Loaiciga, H.A.; Maidment, D.R.; Valdes, J.B. Climate-change impacts in a regional karst aquifer, Texas, USA. J. Hydrol. 2000, 227, 173–194. [Google Scholar] [CrossRef]
- Yusoff, I.; Hiscock, K.M.; Conway, D. Simulation of the impacts of climate change on groundwater resources in Eastern England. Geol. Soc. Spec. Publ. 2002, 193, 325–344. [Google Scholar] [CrossRef]
- Jyrkama, M.I.; Sykes, J.F. The impact of climate change on spatially varying groundwater recharge in the Grand River watershed (Ontario). J. Hydrol. 2007, 338, 237–250. [Google Scholar] [CrossRef]
- Green, T.R.; Taniguchi, M.; Kooi, H.; Gurdak, J.J.; Allen, D.M.; Hiscock, K.M. Beneath the surface of global change: Impacts of climate change on groundwater. Review papers. J. Hydrol. 2011, 405, 532–560. [Google Scholar] [CrossRef]
- Kløve, B.; Ala-aho, P.; Okkonen, J.; Rossi, P. Possible effects of climate change on hydrological systems: Results from research on Esker aquifers in northern Finland. In Climate Change Effects on Groundwater Resources: A Global Synthesis of Findings and Recommendations; CRC Press, Tayler & Francis Group: Boca Raton, FL, USA, 2011. [Google Scholar]
- Saraphirom, P.; Wirojanagud, W.; Srisuk, K. Impact of climate change on waterlogging and salinity distributions in Huai Khamrian subwatershed, NE Thailand. Environ. Earth Sci. 2013, 70, 887–900. [Google Scholar] [CrossRef]
- Pratoomchai, W.; Kazama, S.; Hanasaki, N.; Ekkawatpanit, C.; Komori, D. A projection of groundwater resources in the Upper Chao Phraya River basin in Thailand. Hydrol. Res. Lett. 2014, 8, 20–26. [Google Scholar] [CrossRef]
- Shrestha, S.; Bach, V.T.; Pandey, P.V. Climate change impacts on groundwater resources in Mekong Delta under representative concentration pathways (RCPs) scenarios. Environ. Sci. Policy J. 2016, 61, 1–13. [Google Scholar] [CrossRef]
- Pholkern, K.; Saraphirom, P.; Srisuk, K. Potential Impacts of Climate Change on Groundwater Resources in the Central Huai Luang Basin, Northeast Thailand. Sci. Total Environ. J. 2018, 633, 1518–1535. [Google Scholar] [CrossRef] [PubMed]
- Zektser, I.S.; Loaiciga, H.A. Groundwater fluxes in global hydrologic cycle: Past, present, and future. J. Hydrol. 1993, 144, 405–427. [Google Scholar] [CrossRef]
- Chinvanno, S.; Laung-Aram, V.; Sangmanee, C.; Thanakitmetavut, J. Future climate projection for Thailand and Mainland Southeast Asia using PRECIS and ECHAM4 climate models. In Technical Report 18; Southeast Asia START Regional Center: Bangkok, Thailand, 2009. [Google Scholar]
- Manomaiphiboon, K.; Octaviani, M.; Torsri, K. Regional climate modeling using RegCM3 for Thailand: Past and ongoing activities. In Proceedings of the First China-Thailand Joint Seminar on Climate Change, Bangkok, Thailand, 23–24 March 2009. [Google Scholar]
- Santisirisomboon, J. Statistical Downscaling of GFDL-R30 in the area of Thailand. In Proceedings of the First China-Thailand Joint Seminar on Climate Change, Bangkok, Thailand, 23–24 March 2009. [Google Scholar]
- Thailand Research Fund (TRF). IPCC &TARC Report: State of Knowledge on the World and Thailand’s Climate Change; Thailand Research Fund: Bangkok, Thailand, 2011. [Google Scholar]
- Chinvanno, S. Adaptation to Climate Change and Strategic for Developing, Projection for Building Capacity for Adaptation to Climate Change: Case Study of in Huai Luang River Basin Thailand; Southeast Asia START Regional Center: Bangkok, Thailand, 2014. [Google Scholar]
- Hydro and Agro Informatics Institute (HAII). The context of climate change in Thailand. In Proceedings of the ASEAN Application of Science and Technology in Disaster Risk Resilience Water Management Workshop, Bangkok, Thailand, 4 April 2016. [Google Scholar]
- Chaowiwat, W.; Danusatianpong, P.; Sarinnapakorn, K.; Boonya, S. Extreme climate prediction for water management community network under changing climate. In Proceedings of the 22nd National Convention on Civil Engineering, Nakhon Ratchasima, Thailand, 18–20 July 2017. [Google Scholar]
- Thai Meteorological Department (TMD). Weather Data of Udon Thani Province; Thai Meteorological Department: Bangko, Thailand, 2016.
- Royal Irrigation Department (RID). Rainfall, Steam Flow and Irrigation Data of Udon Thani Province; Royal Irrigation Department: Udon Thani Province, Thailand, 2015.
- Department of Mineral Resources (DMR). Geological Map of Thailand 1:250,000; Department of Mineral Resources: Bangkok, Thailand, 2009.
- Suwanich, P. Potash and Rock salt in Thailand. In Nonmetallic Minerals Bulletin No.2; Economic Geology Division, Department of Mineral Resources: Bangkok, Thailand, 1986. [Google Scholar]
- Cotanont, T. The Application of Environmental Isotopes and Fractured Analysis for Sustainable Groundwater Development: A Case Study of Fractured Sandstone and Siltstone Aquifers, Udon Thani Province. Ph.D. Dissertation, Department of Geotechnology, Khon Kaen University, Khon Kaen, Thailand, 2014. [Google Scholar]
- Thailand Research Fund (TRF). Potential Impact of Climate Change on Salt-Affected Areas in Important Rice Production Areas of Udon Thani Province; Thailand Research Fund: Bangkok, Thailand, 2017. [Google Scholar]
- Srisuk, K. Genetic Characteristics of the Groundwater Regime in the Khon Kaen Drainage Basin, Northeast Thailand; The Department of Geology, University of Alberta: Edmonton, AB, Canada, 1994. [Google Scholar]
- Water Quality Association. Glossary of Salt Water. Available online: http://www.wqa.org/glossary.cfmgl1874 (accessed on 25 January 2016).
- Salinity and Contaminant Hydrology Group (SalCon). Salinity Management Handbook; Salinity and Contaminant Hydrology Group, Department of Natural Resources: Queensland, Australia, 1997.
- The Australian and New Zealand Environment Conservation Council (ANZECC). Australian and New Zealand Guidelines for Fresh and Marine Water Quality; National Water Quality Management Strategy; Australian Water Association: New South Wales, Australia, 2000; Volume 1.
- Deutsch, W.J. Groundwater Chemistry-Fundamentals and Applications to Contamination; Lewis Publishers: Boca Raton, FL, USA; New York, NY, USA, 1997. [Google Scholar]
- Langevin, C.D.; Thorne, D.T., Jr.; Dausman, A.M.; Sukop, M.C.; Guo, W. SEAWAT Version 4: A computer program for simulation of multi-species solute and heat transport. In US Geological Survey Techniques and Methods Book 6, Chapter A22; U.S. Geological Survey, Florida Integrated Science Center: St. Petersburg, FL, USA, 2008; 39p. [Google Scholar]
- Harbaugh, A.W.; Banta, E.R.; Hill, M.C.; McDonald, M.G. MODFLOW-2000, The US Geological Survey Modular Ground-Water Model-User Guide to Modularization Concepts and the Ground-Water Flow Process; U.S. Geological Survey: Reston, VA, USA, 2000; 127p.
- Zheng, C.; Wang, P.P. MT3DMS: A Modular Three Dimensional Multispecies Transport Model for Simulation of Advection, Dispersion, and Chemical Reactions of Contaminants in Groundwater Systems; US Army Engineer Research and Development Center, University of Alabama: Washington, DC, USA, 1999; 219p. [Google Scholar]
- Schroeder, P.R.; Dozier, T.S.; Zappi, P.A.; McEnroe, B.M.; Sjostrom, J.W.; Peyton, R.L. The Hydrologic Evaluation of Landfill Performance (HELP) Model: Engineering Documentation for Version 3; Environmental Protection Agency Office of Research and Development: Washington, DC, USA, 1994.
- Tsai, F.; Li, X. Inverse groundwater modeling for hydraulic conductivity estimation using Bayesian model averaging and variance window. Water Resour. Res. 2010, 46, W02802. [Google Scholar] [CrossRef]
- Jyrkama, M.I.; Sykes, J.F.; Normani, S.D. Recharge estimation for transient ground water modeling. Ground Water 2002, 40, 638–648. [Google Scholar] [CrossRef] [PubMed]
- Scibek, J.; Allen, D.M.; Cannon, A.J.; Whitfield, P.H. Groundwater–surface water interaction under scenarios of climate change using a high-resolution transient groundwater model. J. Hydrol. 2007, 333, 165–181. [Google Scholar] [CrossRef]
- Chylek, P.; Li, J.; Dubey, M.K.; Wang, M.; Lesins, G. Observed and model simulated 20th century Arctic temperature variability. Canadian Earth System Model CanESM2. Atmos. Chem. Phys. Discuss. 2011, 11, 22893–22907. [Google Scholar] [CrossRef]
- Van Vuuren, D.; Edmonds, J.; Kainuma, M.; Riahi, K.; Thomson, A.; Hibbard, K. The representative concentration pathways: An overview. Clim. Chang. 2011, 109, 5–31. [Google Scholar] [CrossRef]
- Alley, W.M.; Reilly, T.E.; Franke, O.E. Sustainability of Groundwater Resources; U.S. Geological Survey: Denver, CO, USA, 1999; 79p.
- Nettasana, T.; Craig, J.; Tolson, B. Conceptual and numerical models for sustainable groundwater management in the Thaphra Area, Chi River Basin, Thailand. Hydrogeol. J. 2012, 20, 1355–1374. [Google Scholar] [CrossRef]


| Hydrogeologic Units | Kh (m/s) | Kv (m/s) | s (m−1) | S (-) | Sy (-) | DI (m) |
|---|---|---|---|---|---|---|
| Alluvium (Al) | 1.1 × 10⁻⁷–1.1 × 10⁻⁵ | 1.1 × 10⁻⁷–1.1 × 10⁻⁵ | 1.0 × 10⁻²–1.0 × 10⁻⁵ | - | 0.01–0.35 | 30–500 |
| Terrace Deposit (Te) | 1.0 × 10⁻⁵–5.0 × 10⁻² | 5.0 × 10⁻⁶–5.0 × 10⁻³ | 1.0 × 10⁻²–1.0 × 10⁻⁵ | - | 0.01–0.30 | 40–600 |
| Upper phutok (Upt) | 3.7 × 10⁻⁷–1.8 × 10⁻⁶ | 3.7 × 10⁻⁸–4.8 × 10⁻⁷ | 1.0 × 10⁻³–1.0 × 10⁻⁵ | 0.01–0.20 | - | 30–200 |
| Lower phutok (Lpt) | 1.1 × 10⁻⁷–2.7 × 10⁻⁴ | 1.1 × 10⁻⁸–2.7 × 10⁻⁵ | 1.0 × 10⁻³–1.0 × 10⁻⁵ | 0.01–0.20 | - | 20–100 |
| Rock salt (RS) | 1.0 × 10⁻¹⁴–1.0 × 10⁻¹⁵ | 1.0 × 10⁻¹⁴–1.0 × 10⁻¹⁶ | 1.0 × 10⁻⁵–1.0 × 10⁻⁸ | 0.01–0.10 | - | 3–50 |
| Khok Kruat (Kk) | 7.5 × 10⁻⁸–5.8 × 10⁻⁵ | 7.5 × 10⁻⁹–5.8 × 10⁻⁶ | 1.0 × 10⁻³–1.0 × 10⁻⁵ | 0.01–0.25 | - | 20–100 |
| Lower Khorat Group (Lkg) | 5.0 × 10⁻⁹–5.0 × 10⁻⁷ | 5.0 × 10⁻¹⁰–5.0 × 10⁻⁸ | 1.0 × 10⁻³–1.0 × 10⁻⁵ | 0.01–0.25 | - | 30–200 |
| Model | General Design | Model Layers | No-flow Boundary | General Head Boundary (GHBs) |
|---|---|---|---|---|
| A | The initial model, constructed under the conceptual model of Figure 10. | Seven hydrostratigraphic units | All layers at the edge of boundary of study area and the bottom of model | - |
| B | Same as model A | The rock salt layers are shallower than model A for at least 1 layer | Same as model A | Same as model A |
| C | Same as model A | Same as model A | The bottom of model and all layer at the edge of boundary of study area, excepted where the study area boundary cut off Huai Luang River at the east and southwest | All layers at east and southwest, where the study area boundary cut off Huai Luang River |
| D | Same as model A | Same as model B | Same as model C | Same as model C |
| Hydrogeologic Units | Kh (m/s) | Kv (m/s) | Ss (m−1) | S or Sy (-) | Eff.P (-) | Tot.P (-) | DI (m) |
|---|---|---|---|---|---|---|---|
| Alluvium (Al) | 8.8 × 10⁻⁶ | 8.8 × 10⁻⁷ | 1.0 × 10⁻² | 0.30 | 0.35 | 0.40 | 500 |
| Terrace Deposit (Te) | 2.1 × 10⁻⁵ | 2.1 × 10⁻⁶ | 8.0 × 10⁻³ | 0.25 | 0.30 | 0.40 | 600 |
| Upper phutok (Upt) | 2.0 × 10⁻⁶ | 2.0 × 10⁻⁷ | 3.0 × 10⁻³ | 0.15 | 0.25 | 0.30 | 150 |
| Lower phutok (Lpt) | 5.1 × 10⁻⁶ | 5.1 × 10⁻⁷ | 1.7 × 10⁻³ | 0.17 | 0.22 | 0.31 | 70 |
| Rock salt (RS) | 2.0 × 10⁻¹⁴ | 2.0 × 10⁻¹⁵ | 1.0 × 10⁻⁵ | 0.01 | 0.02 | 0.10 | 50 |
| Khok Kruat (Kk) | 9.5 × 10⁻⁷ | 9.5 × 10⁻⁸ | 5.0 × 10⁻³ | 0.20 | 0.25 | 0.30 | 70 |
| Lower Khorat Group (Lkg) | 7.7 × 10⁻⁷ | 7.7 × 10⁻⁸ | 2.0 × 10⁻³ | 0.20 | 0.25 | 0.30 | 150 |
| Model State | Parameter | Model A | Model B | Model C | Model D | ||||
|---|---|---|---|---|---|---|---|---|---|
| RMS | NRMS | RMS | NRMS | RMS | NRMS | RMS | NRMS | ||
| Calibration | Hydraulic Head (m) | 2.28 | 3.03% | 3.05 | 3.29% | 2.84 | 3.06% | 3.51 | 3.78% |
| TDS (mg/L) | 529.39 | 1.35% | 538.25 | 1.38% | 547.81 | 1.40% | 646.46 | 1.65% | |
| Validation | Hydraulic Head (m) | 2.99 | 4.14% | 3.76 | 4.40% | 3.55 | 4.17% | 4.22 | 4.89% |
| TDS (mg/L) | 444.35 | 3.22% | 453.21 | 3.25% | 462.77 | 3.27% | 561.42 | 3.52% | |
| Climate | Scenarios | Jan | Feb | Mar | Apr | May | Jun | Jul | Aug | Sep | Oct | Nov | Dec | Annual |
|---|---|---|---|---|---|---|---|---|---|---|---|---|---|---|
| T (°C) | 2006-2015 | 22.4 | 25.6 | 28.1 | 29.8 | 29.1 | 29.0 | 28.3 | 27.8 | 27.8 | 27.2 | 25.7 | 22.4 | 25.6 |
| RCP2.6 | 25.0 | 27.5 | 30.4 | 31.9 | 31.1 | 30.3 | 30.6 | 30.1 | 29.4 | 28.0 | 25.3 | 23.7 | 28.6 | |
| RCP4.5 | 25.0 | 27.6 | 30.5 | 31.9 | 31.1 | 30.3 | 30.6 | 30.1 | 29.4 | 28.0 | 25.4 | 23.7 | 28.6 | |
| RCP8.5 | 25.6 | 27.7 | 30.2 | 32.1 | 31.0 | 30.5 | 31.1 | 30.5 | 29.5 | 27.8 | 25.8 | 23.6 | 28.8 | |
| P (mm) | 2006-2015 | 10.1 | 20.2 | 23.3 | 50.8 | 156.6 | 143.9 | 219.2 | 304.2 | 239.9 | 65.8 | 22.0 | 12.6 | 1268.6 |
| RCP2.6 | 8.9 | 26.3 | 44.7 | 85.7 | 198.0 | 194.6 | 172.3 | 257.3 | 233.9 | 82.1 | 31.3 | 9.2 | 1344.2 | |
| RCP4.5 | 8.5 | 16.8 | 33.3 | 80.9 | 206.0 | 214.7 | 171.7 | 267.4 | 227.6 | 91.9 | 31.4 | 6.4 | 1356.6 | |
| RCP8.5 | 8.2 | 29.0 | 38.3 | 79.2 | 216.8 | 241.6 | 169.9 | 266.0 | 241.2 | 83.7 | 27.3 | 3.5 | 1404.7 |
| Model | Saline Groundwater Areas | Shallow Water Table Areas | ||||||||||
|---|---|---|---|---|---|---|---|---|---|---|---|---|
| RCP2.6 | RCP4.5 | RCP8.5 | RCP2.6 | RCP4.5 | RCP8.5 | |||||||
| km2 | % | km2 | % | km2 | % | km2 | % | km2 | % | km2 | % | |
| 2015 | 435.77 | - | 435.77 | - | 435.77 | - | 566.98 | - | 566.98 | - | 566.98 | - |
| A | 482.57 | 10.74 | 487.93 | 11.97 | 493.78 | 13.31 | 865.86 | 52.71 | 938.14 | 65.46 | 985.02 | 73.73 |
| B | 521.43 | 19.66 | 534.74 | 22.71 | 543.41 | 24.70 | 853.02 | 50.45 | 905.16 | 59.65 | 947.45 | 67.10 |
| C | 457.88 | 5.07 | 465.87 | 6.91 | 476.52 | 9.35 | 762.78 | 34.53 | 839.98 | 48.15 | 883.79 | 55.88 |
| D | 479.37 | 10.01 | 489.11 | 12.24 | 499.26 | 14.57 | 788.20 | 39.02 | 847.16 | 49.42 | 893.29 | 57.55 |
| Climate | Model | Zone 1 | Zone 2 | Zone 3 | Zone 4 | Zone 5 | Total | ||||||
|---|---|---|---|---|---|---|---|---|---|---|---|---|---|
| m3/d | % | m3/d | % | m3/d | % | m3/d | % | m3/d | % | m3/d | % | ||
| 2015 | 2384 | - | 6309 | - | 2263 | - | 6104 | - | 1712 | - | 18,771 | - | |
| RCP 2.6 | A | 10,962 | 359.9 | 25,771 | 308.5 | 9923 | 338.5 | 27,425 | 349.3 | 7515 | 338.9 | 81,595 | 334.7 |
| B | 5159 | 116.4 | 22,100 | 250.3 | 7005 | 209.6 | 20,194 | 230.8 | 7472 | 336.4 | 61,929 | 229.9 | |
| C | 13,760 | 477.3 | 20,854 | 230.6 | 13,113 | 479.5 | 22,799 | 273.5 | 5010 | 192.6 | 75,536 | 302.4 | |
| D | 4283 | 79.7 | 11,454 | 81.6 | 7210 | 218.6 | 16,900 | 176.9 | 5266 | 207.6 | 45,113 | 140.3 | |
| RCP 4.5 | A | 11,089 | 365.2 | 27,782 | 340.4 | 10,921 | 382.6 | 28,453 | 366.1 | 8716 | 409.1 | 86,960 | 363.3 |
| B | 5093 | 113.7 | 23,295 | 269.2 | 8345 | 268.8 | 23,019 | 277.1 | 8047 | 370.0 | 67,799 | 261.2 | |
| C | 13,784 | 478.3 | 22,779 | 261.1 | 14,041 | 520.5 | 24,411 | 299.9 | 6772 | 295.6 | 81,786 | 335.7 | |
| D | 4295 | 80.2 | 12,309 | 95.1 | 7993 | 253.2 | 18,212 | 198.4 | 6197 | 262.0 | 49,007 | 161.1 | |
| RCP 8.5 | A | 10,289 | 331.7 | 30,817 | 388.5 | 11,151 | 392.8 | 31,660 | 418.7 | 10,528 | 514.9 | 94,444 | 403.1 |
| B | 5140 | 115.6 | 26,942 | 327.1 | 10,457 | 362.1 | 25,429 | 316.6 | 8190 | 378.4 | 76,157 | 305.7 | |
| C | 13,889 | 482.7 | 24,308 | 285.3 | 15,073 | 566.1 | 28,505 | 367.0 | 7755 | 353.0 | 89,529 | 377.0 | |
| D | 4202 | 76.3 | 13,678 | 116.8 | 8803 | 289.0 | 20,542 | 236.5 | 6971 | 307.2 | 54,197 | 188.7 | |
© 2019 by the authors. Licensee MDPI, Basel, Switzerland. This article is an open access article distributed under the terms and conditions of the Creative Commons Attribution (CC BY) license (http://creativecommons.org/licenses/by/4.0/).
Share and Cite
Pholkern, K.; Saraphirom, P.; Cloutier, V.; Srisuk, K. Use of Alternative Hydrogeological Conceptual Models to Assess the Potential Impact of Climate Change on Groundwater Sustainable Yield in Central Huai Luang Basin, Northeast Thailand. Water 2019, 11, 241. https://doi.org/10.3390/w11020241
Pholkern K, Saraphirom P, Cloutier V, Srisuk K. Use of Alternative Hydrogeological Conceptual Models to Assess the Potential Impact of Climate Change on Groundwater Sustainable Yield in Central Huai Luang Basin, Northeast Thailand. Water. 2019; 11(2):241. https://doi.org/10.3390/w11020241
Chicago/Turabian StylePholkern, Kewaree, Phayom Saraphirom, Vincent Cloutier, and Kriengsak Srisuk. 2019. "Use of Alternative Hydrogeological Conceptual Models to Assess the Potential Impact of Climate Change on Groundwater Sustainable Yield in Central Huai Luang Basin, Northeast Thailand" Water 11, no. 2: 241. https://doi.org/10.3390/w11020241
APA StylePholkern, K., Saraphirom, P., Cloutier, V., & Srisuk, K. (2019). Use of Alternative Hydrogeological Conceptual Models to Assess the Potential Impact of Climate Change on Groundwater Sustainable Yield in Central Huai Luang Basin, Northeast Thailand. Water, 11(2), 241. https://doi.org/10.3390/w11020241