1. Introduction
One of the biggest challenges for hydrologists is the reliable estimation of extreme flood events. These estimations are crucial for the design and operation of flood control structures (dams, retaining basins) infrastructure objects (flood defenses, bridges, roads and dams), as well for flood risk management, planning, flood risk mapping and improvement of alert methods within a region [
1,
2]. Extreme flood events are a shared problem across Europe; nevertheless, there is a noticeable lack of cross-boundary cooperation (on an international and regional level), and this has led to individual efforts in each country towards investigative research programs and the development of national guidelines for flood frequency estimation [
1]. Some of these national projects and studies in Europe are conducted in Italy [
3,
4], the Czech Republic [
5], Austria [
6], Spain [
7], Norway [
8] and in Poland [
9]. The results of such programs are hard to compare in order to determine a consistent picture, since different flood indicators, methods and time periods have been used. As a result of this lack of cooperation, no unified European approach to, or even guidelines for, flood frequency estimation yet exists [
1]. In recent years, there has been an increasing realization of the advantages of tackling this problem at a larger geographical scale that is not limited by administrative or political boundaries [
10]. That is why the European Flood Directive is set towards the assessment and management of flood risks and requires the development of management plans for areas at river basin scale. The main focus is on the reduction of flooding probability, potential consequences to human health, economic activity and the environment [
11]. What is noticeable from the literature is that there is a clear absence of regional hydrological studies for some parts of Southeastern Europe. In other parts of the continent, there have been several examples of regional hydrological studies, such as those conducted in the Nordic countries [
12], the Baltic states [
13], Central Europe [
14], and the Danube River Basin [
15]. A study conducted by Villarini et al. [
14] analyzed regional discharge records in Central European countries—Germany, Czech Republic, Switzerland and Slovakia. However, our study area consists of different Central European countries (Hungary, Croatia, Slovakia, Slovenia and Serbia). In a paper presented by Mediero et al. [
10], these countries were not included in the identification of coherent flood regions across Europe.
For flood risk evaluation, Annual Maximum Series (AMS) are often used. One of the advantages of this method is that it ensures that chosen events are independent from each other. Furthermore, AMS are easily extracted and are directly related to the return period of the design events. Results obtained by Urošev et al. [
16] show that AMS are better for estimating return periods of flood volumes, such as hundred-year flood volume (V
100), two-hundred-year volume (V
200), five-hundred-year volume (V
500) and thousand-year volume (V
1000).
Regional Flood Frequency Analysis (RFFA) is a widespread approach for estimating the magnitude of flood events of various return periods in homogeneous regions. Assuming floods are stochastic processes, their magnitudes and frequencies are predicted by using certain probability distributions, usually characterized by one to three parameters. RFFA provides flood quantile estimates, which are then used as the basis for designing flood defense infrastructure. In this paper, a regional frequency analysis of the Pannonian Basin, which is located in Central Europe, was performed by using the L-moments method. An important aim of this study was to detect whether the region can be considered hydrologically homogeneous and to determine the distribution function that best fits the observed data. RFFA methods can be classified into two approaches. The first approach is the rainfall-based approach, which combines flood peak discharges with rainfall generators. The second is the discharge-based approach; the RFFA based on historical discharge data. The discharge-based approach, which is known as Bulletin 17B [
17] and, more recently, Bulletin 17C [
18], is the most direct and hence standard method for determining design flood.
The results of this study can be applied for the investigation of ungauged or poorly gauged rivers within the Pannonian Basin, and therefore for improving decision-making under uncertainties. The goal of the regionalization process is defined as the identification of catchments that are similar enough to corroborate the combination of extreme flow information on all sites in the region. That is why a RFFA could increase limited at-site systematic records using the principle of “trading space for time”, thus providing a more reliable estimation of higher quantiles and more precise prediction for ungauged basins [
8]. In recent years, analyses based on risk have been becoming more and more important in flood risk hydrology [
19]; consequently, there is an increase in the number of flood risk assessment studies [
20,
21,
22]. The methods presented are used for the first time for designing flood estimation in this geographical region. The main objectives of present study are to: (1) investigate the homogeneity of Pannonian Basin; (2) estimate regionalized parameters; and (3) identify the best-fit distributions of the flood volumes and duration in this geographical region.
3. Materials and Methods
One of the most important and significant fields of flood hydrology is Flood Frequency Analysis (FFA), which requires evaluation of distributional parameters as well as estimation of cumulative distribution functions to calculate extreme flood values.
The goal of RFFA is to reduce sampling uncertainties in calculations of extreme flood events. To achieve this, it is necessary to combine streamflow data records from different sites in a geographical region that has similar flood characteristics and can provide the basis for computation of extreme flood events at ungauged sites within the same geographical region. Several approaches to the regional frequency analysis exist, but three are used most frequently: regionalization based on at-site parameters, regionalization based on regional shape parameter (
σR), and the index-flood method [
25,
26]. The first method, at-site regional estimation, involves the use of at-site estimates for all of the parameters of distribution. The second method, regional shape parameter method, is a result of averaging shape parameters for all the sites in the region, and the mean and dispersion are estimated from at-site statistics [
25]. The third, consisting of index-flood method dispersion and shape parameters, is estimated by regional averaging, and the mean is still estimated from at-site data [
27]. Regional shape estimation should be used in geographical regions with stations that have long data series (over thirty years). This approach represents an intermediate method between at-site estimation and index-flood method.
3.1. Data
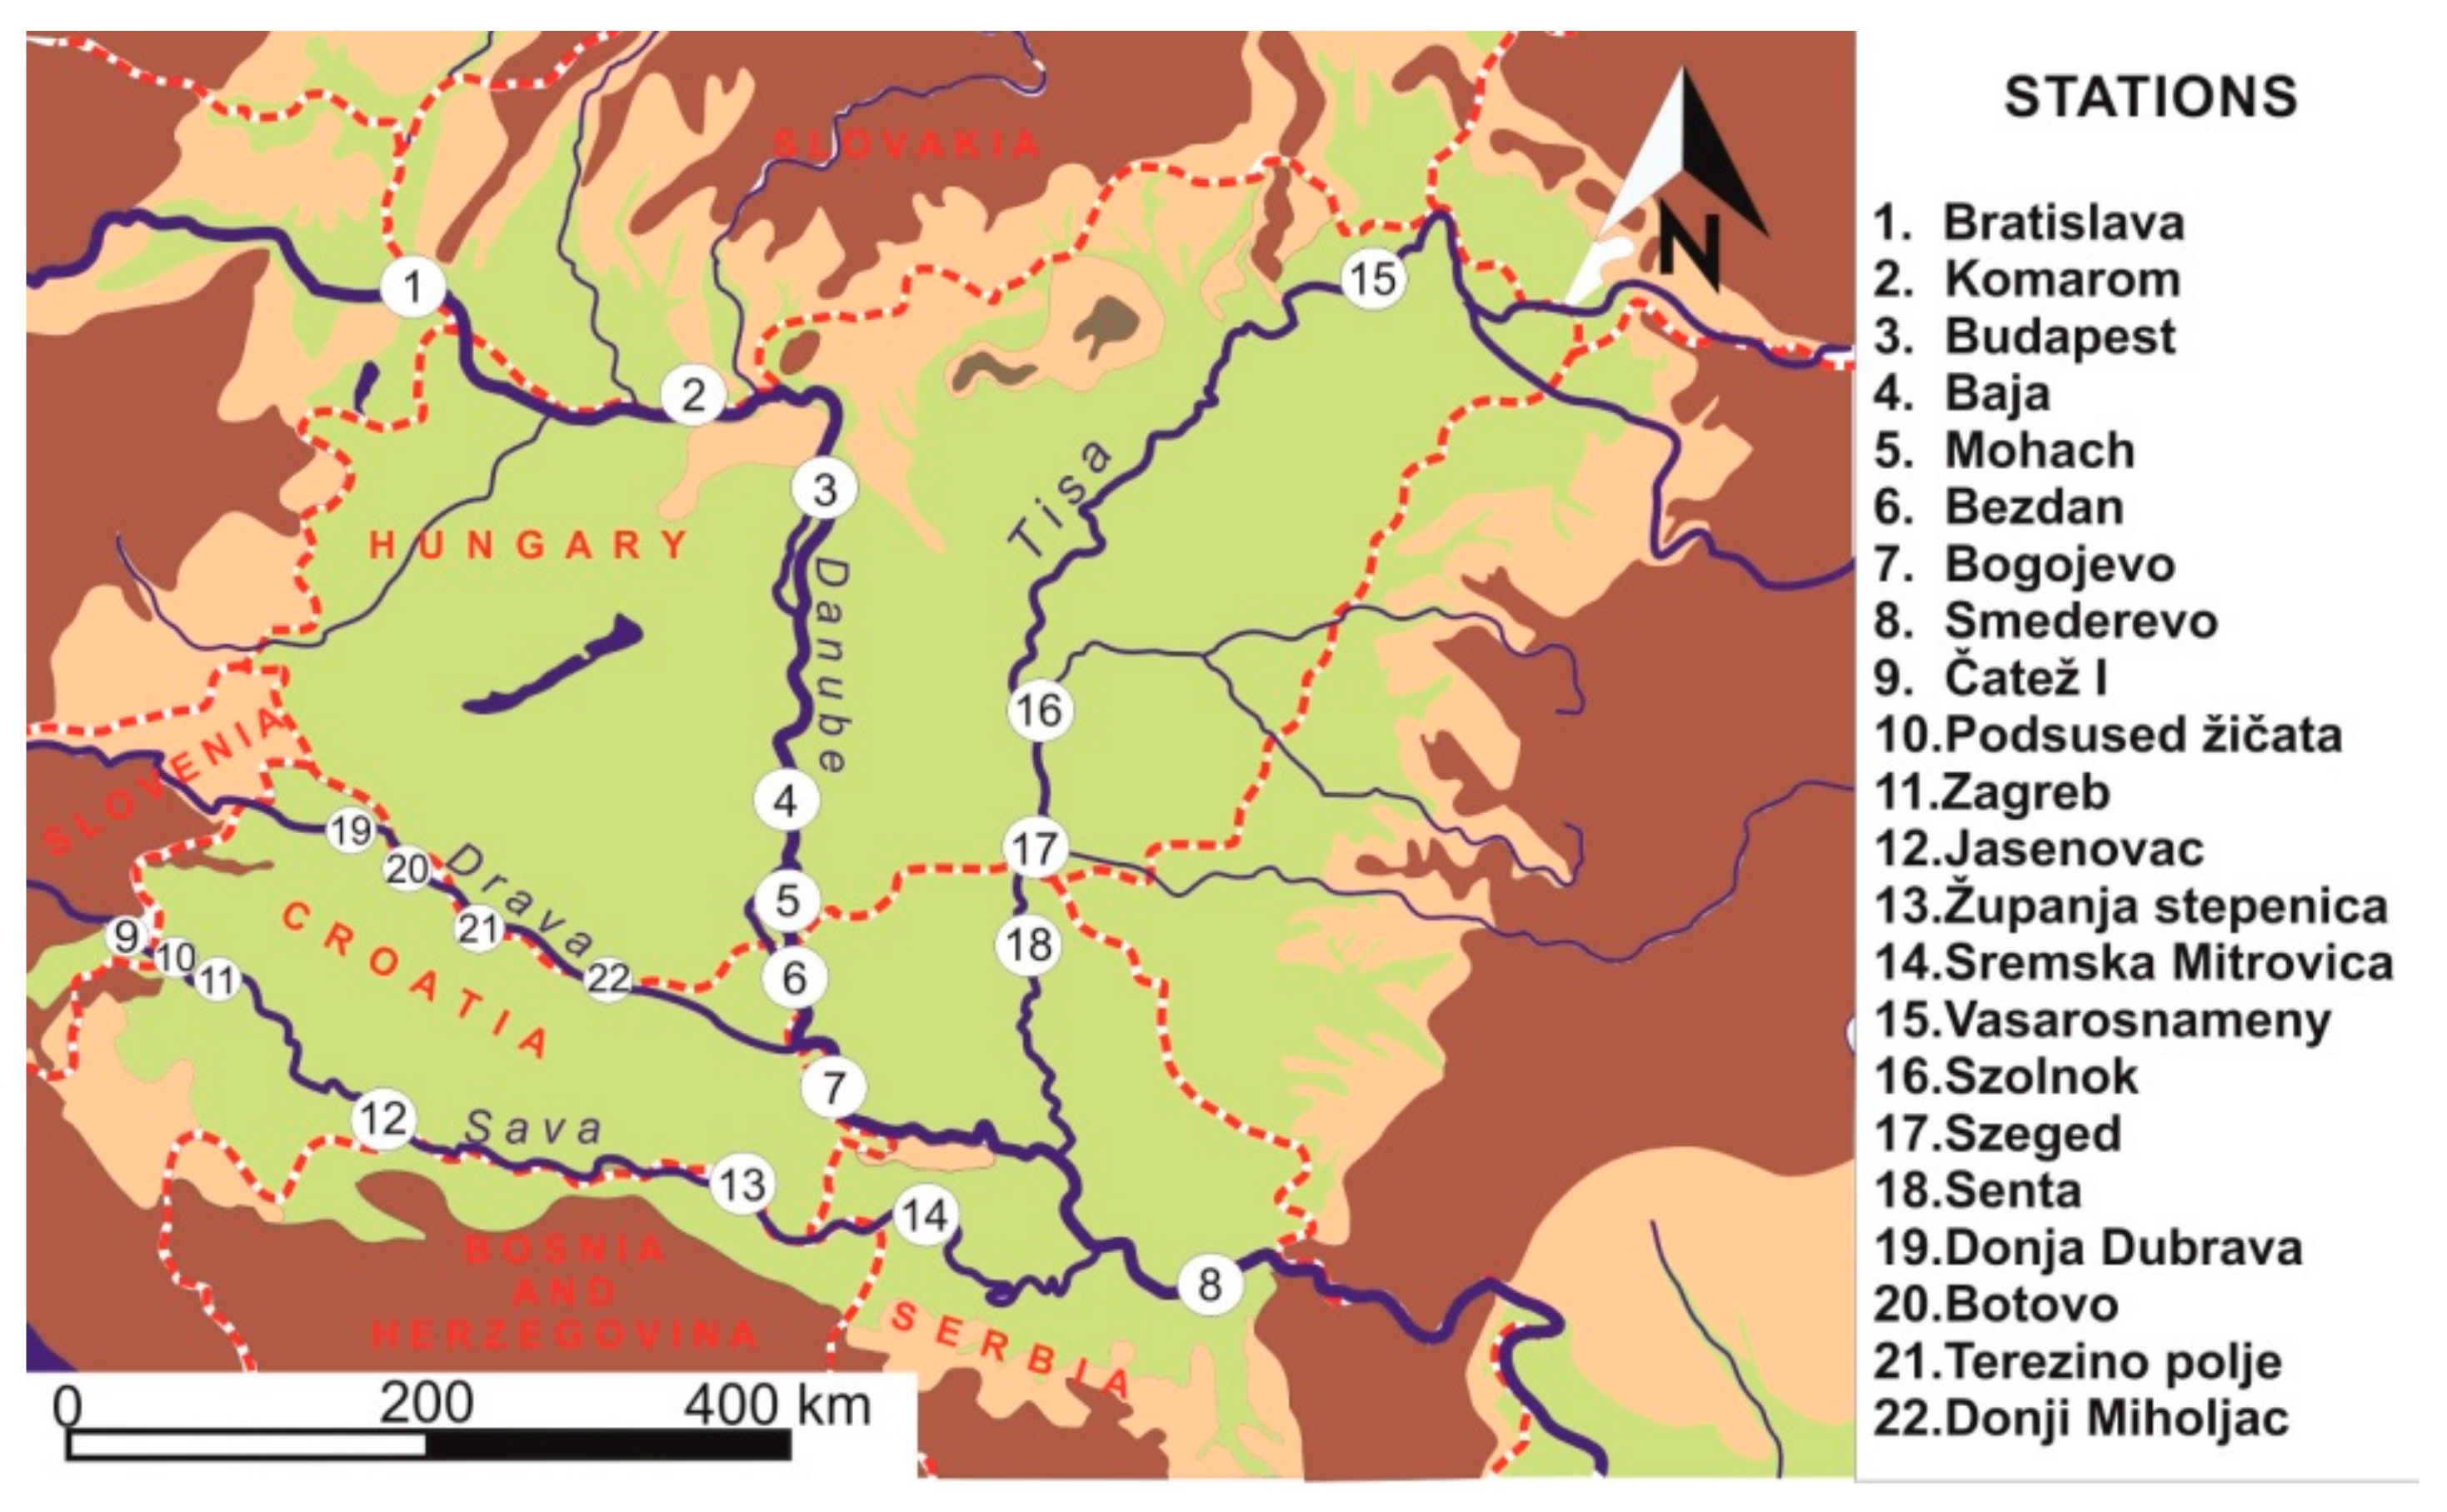
The critical issue during data collection was to find sufficient data of good quality. The flood data set consists of mean daily discharge records for fifty years period (1964–2013) and for 22 selected stations (
Figure 1 and
Table 1). Considering that the average record length used for flood frequency analysis is usually between 20–40 years, our fifty-year data set will provide reliable results. Data was obtained from different national water authorities of the countries within the investigated region. For Slovakia, data was obtained from the Slovak Hydrometeorological Institute, for Hungary from the General Directorate of Water Management, for Slovenia from the Slovenian Environment Agency, for Croatia from the Meteorological and Hydrological Service, and for Serbia from the Republic Hydrometeorological Service of Serbia.
For defining the flood events, two random variables were used: volumes and durations. This kind of definition is more useful to geographers, hydrologists and engineers than the usual data, which consists of a single value of extreme water discharge. Estimation of these two variables is important for the design of spillways of reservoirs and retention basins, and for the resilience of any other hydraulic structure, mainly dikes. Construction of these structures requires the volumes and duration of floods for the calculation of effect on the storage capacity and thus failure probability. Although volumes and duration of floods are highly applicable in hydrology, not many scientific articles have been devoted to their joined estimation.
The threshold level (“truncation level”) method, discussed in detail in Zelenhasić and Salvai [
28] and Tallaksen et al. [
29], was used for selection of floods. Predefined threshold value (Q
0) is applied on the observed daily hydrograph. Flood begins when discharge goes above threshold (Q(t) > Q
0) and flood ends when discharge returns below it (Q(t) < Q
0). The choice of threshold is a very sensitive matter. A higher threshold reduces the number of events included in the series, but on the other hand, increases the likelihood of independence of peaks [
30]. A lower threshold level means a larger number of events in the series, and thus enables more reliable parameter estimation, but increases the chance of serial dependence [
31]. The threshold selection process thus remains a subjective choice [
30]. Therefore, thresholds are often derived from percentiles of the flow duration curve. In this paper, we used Q
10 as the threshold for selecting floods, as recommended by Urošev et al. [
16]. Selection of this high threshold is done for two reasons: the first is that the obtained data series of flood volumes and durations are sufficiently long for frequency analysis; and the second is that our goal is to model extreme flood events that have moderate and long return periods.
Annual Maximum Series (AMS) are the most frequently used method for flood frequency analysis, and they are a typical example of the block maxima method of the extreme value theorem [
26]. This method selects maximum extreme events for each block. In most cases of FFA, a block is considered to be a year, and thus the highest discharge value within each year is chosen [
8,
26]. In this study, the AMS method was applied on selected floods. The length of AMS series for both flood volumes and flood durations is presented in
Table 1. The L-moment method was used for parameter estimation.
3.2. Homogenity Test
The first step in RFFA is to determine the level of regional homogeneity. To identify the homogeneity of the study area, a homogeneity test was first applied to stations data within the Panonnian Basin. A group of gauging stations is classified to be homogeneous if at-site frequency distributions within the group pass a statistical significance test on the similarity of the at-site L-Cv statistic based on the heterogeneity measure
Vi. The homogeneity test checks whether the selected group of stations can be considered a random realization of the same dimensionless distribution in terms of L-Cv (
V1), L-Cv and L-Cs (
V2) and L-Cs and L-Ck (
V3).
V1 represents the Euclidean distance between the L-Cv values for each station individually and the regional mean L-Cv, while
V2 and
V3 represent the distances in L-Cs–L-Cv and L-Ck–L-Cs, respectively. For the sample and simulated regions,
Vi is calculated as:
where
N is the number of sites;
ni is the record length at site
i;
t(i),
t3(i),
t4(i) are the samples L-Cv, L-Cs, L-Ck at site
i; and
tR,
t3R,
t4R are the regional average samples of L-Cv, L-Cs, L-Ck, respectively [
32]. Region is regarded as “acceptably homogeneous” if
Vi < 1, “possibly heterogeneous” if 1 ≤
Vi < 2 and “definitely heterogeneous” if
Vi ≥ 2 [
27]. As mentioned,
V1 statistics measure heterogeneity based on the difference between samples of L-Cv in the region. The drawback is that it is insensitive to heterogeneity between sites that have equal L-Cv but different L-Cs. Because of this limitation, we used
V2 and
V3, as suggested by Hosking and Wallis [
27]. The
V2 and
V3 have also had the same limits for acceptable homogeneity as
V1. If the region is not homogeneous, the group of stations is regarded as heterogeneous, and as such, they are not suitable for RFFA.
3.3. L-moments
re detailed information about the L-moments method can be found in Hosking and Wallis [
27]. This method represents a modification of the Probability Weighted Moments (PWM) method explored by Greenwood et al. [
33]. The main advantages of L-moments over conventional moments are that they are able to characterize a wider range of distributions, they are less subject to bias in estimation and more robust to the presence of the data outliers [
27]. L-moments can be calculated by using probability-weighted moments (PWM):
where
βr is the
rth order PWM and
FX(
x) is the cumulative distribution function of
X. The unbiased sample estimators (b
i) of the first four PWMs are given as [
27]:
where
X(
j) represents the rank of AMS, with
X(1) being the highest value and
X(
n) the lowest value. The first four L-moments, expressed as linear combinations of PWMs, are [
27]:
L-moments are more convenient to use, because they can be directly interpreted as measures of location (
), scale (
), shape (
) and kurtosis (
) of distribution functions. The ratio of L-moments is calculated as:
where L-Cv represents Coefficient of variation, L-Cs (L-Coefficient of skewness) and L-Ck (L-Coefficient of kurtosis). The application of L-moments consists of four steps. The first is screening of the data, the second is identification of homogeneous regions, the third is selection of a regional frequency distribution, and the fourth is parameter estimation of the frequency distribution [
27].
3.4. L-moments Ratio Diagram
After the homogeneity of the region has been determined, the next step is the selection of the best distribution for each of the study variables within the study area. To determine the distribution that will yield the accurate quantiles widely accepted L-moments ratio diagram method was firstly applied. Which distribution will be selected and used for FFA in some countries is defined by official guidelines. For example, in the USA, a Log-Pearson type III distribution is suggested [
34]; for Great Britain, the Flood Estimation Handbook suggests the Generalized Extreme Value (GEV) or Generalized Logistic (GL) distributions [
35]. For Poland, the Pearson III distribution is recommended [
36]. In Russia, three-parameter generalized gamma (GGIII) (also known as Kritsky-Menkel distribution) should be used [
16]. For countries in the investigated region, there is still no official guideline for FFA, but the unwritten rule is to use six common distributions: Normal (N), Log-Normal (LN), Gumbel (G), Generalized Pareto (GP) Pearson type III (PIII) and Log-Pearson type III (LPIII). Therefore, these six distributions were used for AMS modeling of flood volumes and durations in this paper.
F visual estimation of homogeneous regions and determination of regional distribution, the L-moment ratio diagram was used (
Figure 2 and
Figure 3), since this method is widely used for selection of probability distribution for regional data [
37]. Appropriate distribution is selected by comparing the closeness of the sample values L-Cs and L-Ck to a theoretical line of distributions (for three parameter distributions) or sample mean to the theoretical points (for two parameter distributions) [
38]. If the region is homogeneous, L-moment ratio diagrams tend to group together. Hosking and Wallis [
27] proposed statistical tests for homogeneity of region, as well as for determination of regional distribution, in order to quantitatively check results obtained by L-moments ratio diagram. Nevertheless, the L-moment diagram may not clearly show which probability distribution is the best-fit when many distributions are suitable for the sample data. Because of this, a numerical goodness-of-fit test is applied to choose the best frequency distribution. The Z-statistic was used as goodness-of-fit measure for identification of the appropriate regional distribution. Hosking and Wallis [
27] described the goodness-of-fit test based on a comparison between sample L-kurtosis and population L-kurtosis for different distributions. The test statistic
Z is given as:
where
t4DIST is the population L-kurtosis of selected distribution,
t4R is the regional average sample L-Ck for all stations, and
σ4 is the standard deviation of regional average sample L-Ck [
39]. These results were compared with quantiles of standardized normal distribution, at the significance level of 5%. The distribution is considered appropriate if
The best fit to the observed data indicates the most appropriate distribution.
4. Results and Discussion
Homogeneity test results for the Pannonian Basin are presented in
Table 2. According to these results, it can be concluded that the investigated region is acceptably homogeneous for both variables, flood duration and volumes, as all the
Vi values are smaller than 1 (critical value).
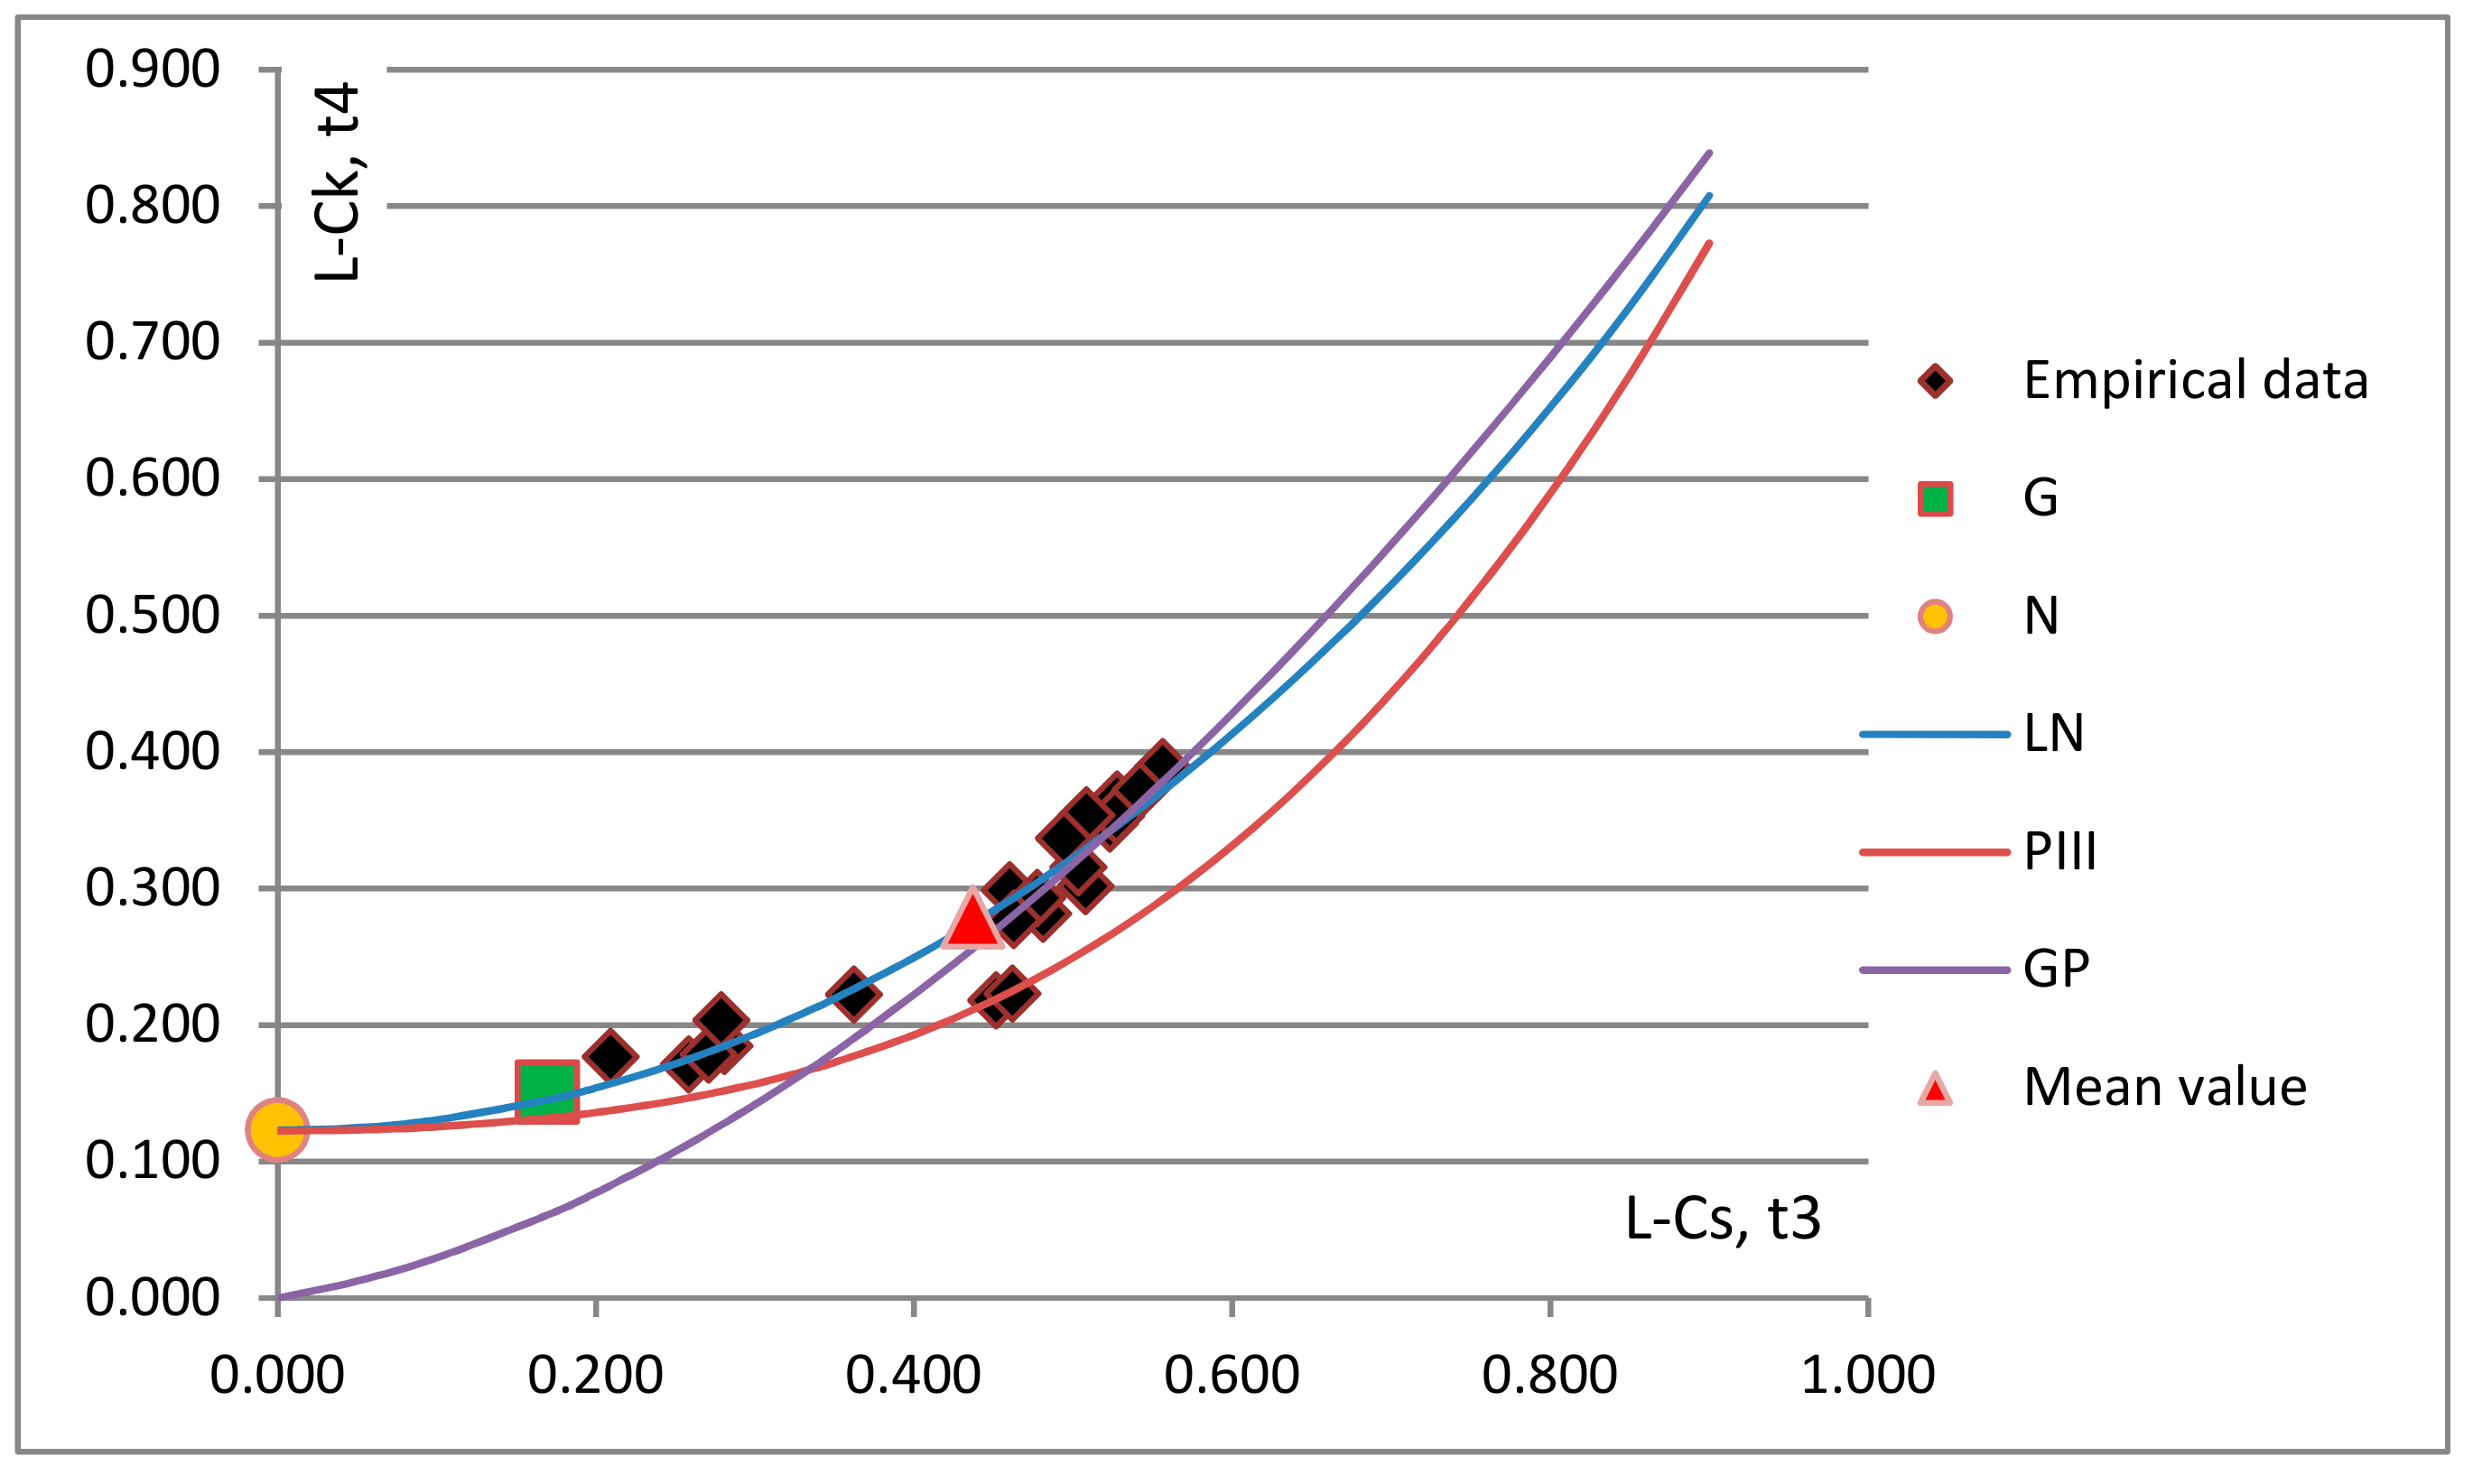
After the homogeneity of the region is confirmed, the next step towards regional frequency analysis is the selection of the appropriate distribution. L-moment ratio diagrams for the flood volumes and durations are presented in
Figure 2 and
Figure 3. The distribution that shows the best fit to the empirical data indicates the appropriate distribution. Since the sample L-moments are unbiased, the sample points should be distributed above and below the theoretical line of the suitable distribution. The L-Cv values for the region were between 0.35 and 0.69, with a mean value of 0.57. The L-Cs range was between 0.21 and 0.56, with a mean value of 0.44; whereas the L-Ck range was 0.14 and 0.39, with a mean value of 0.28 (
Figure 2).
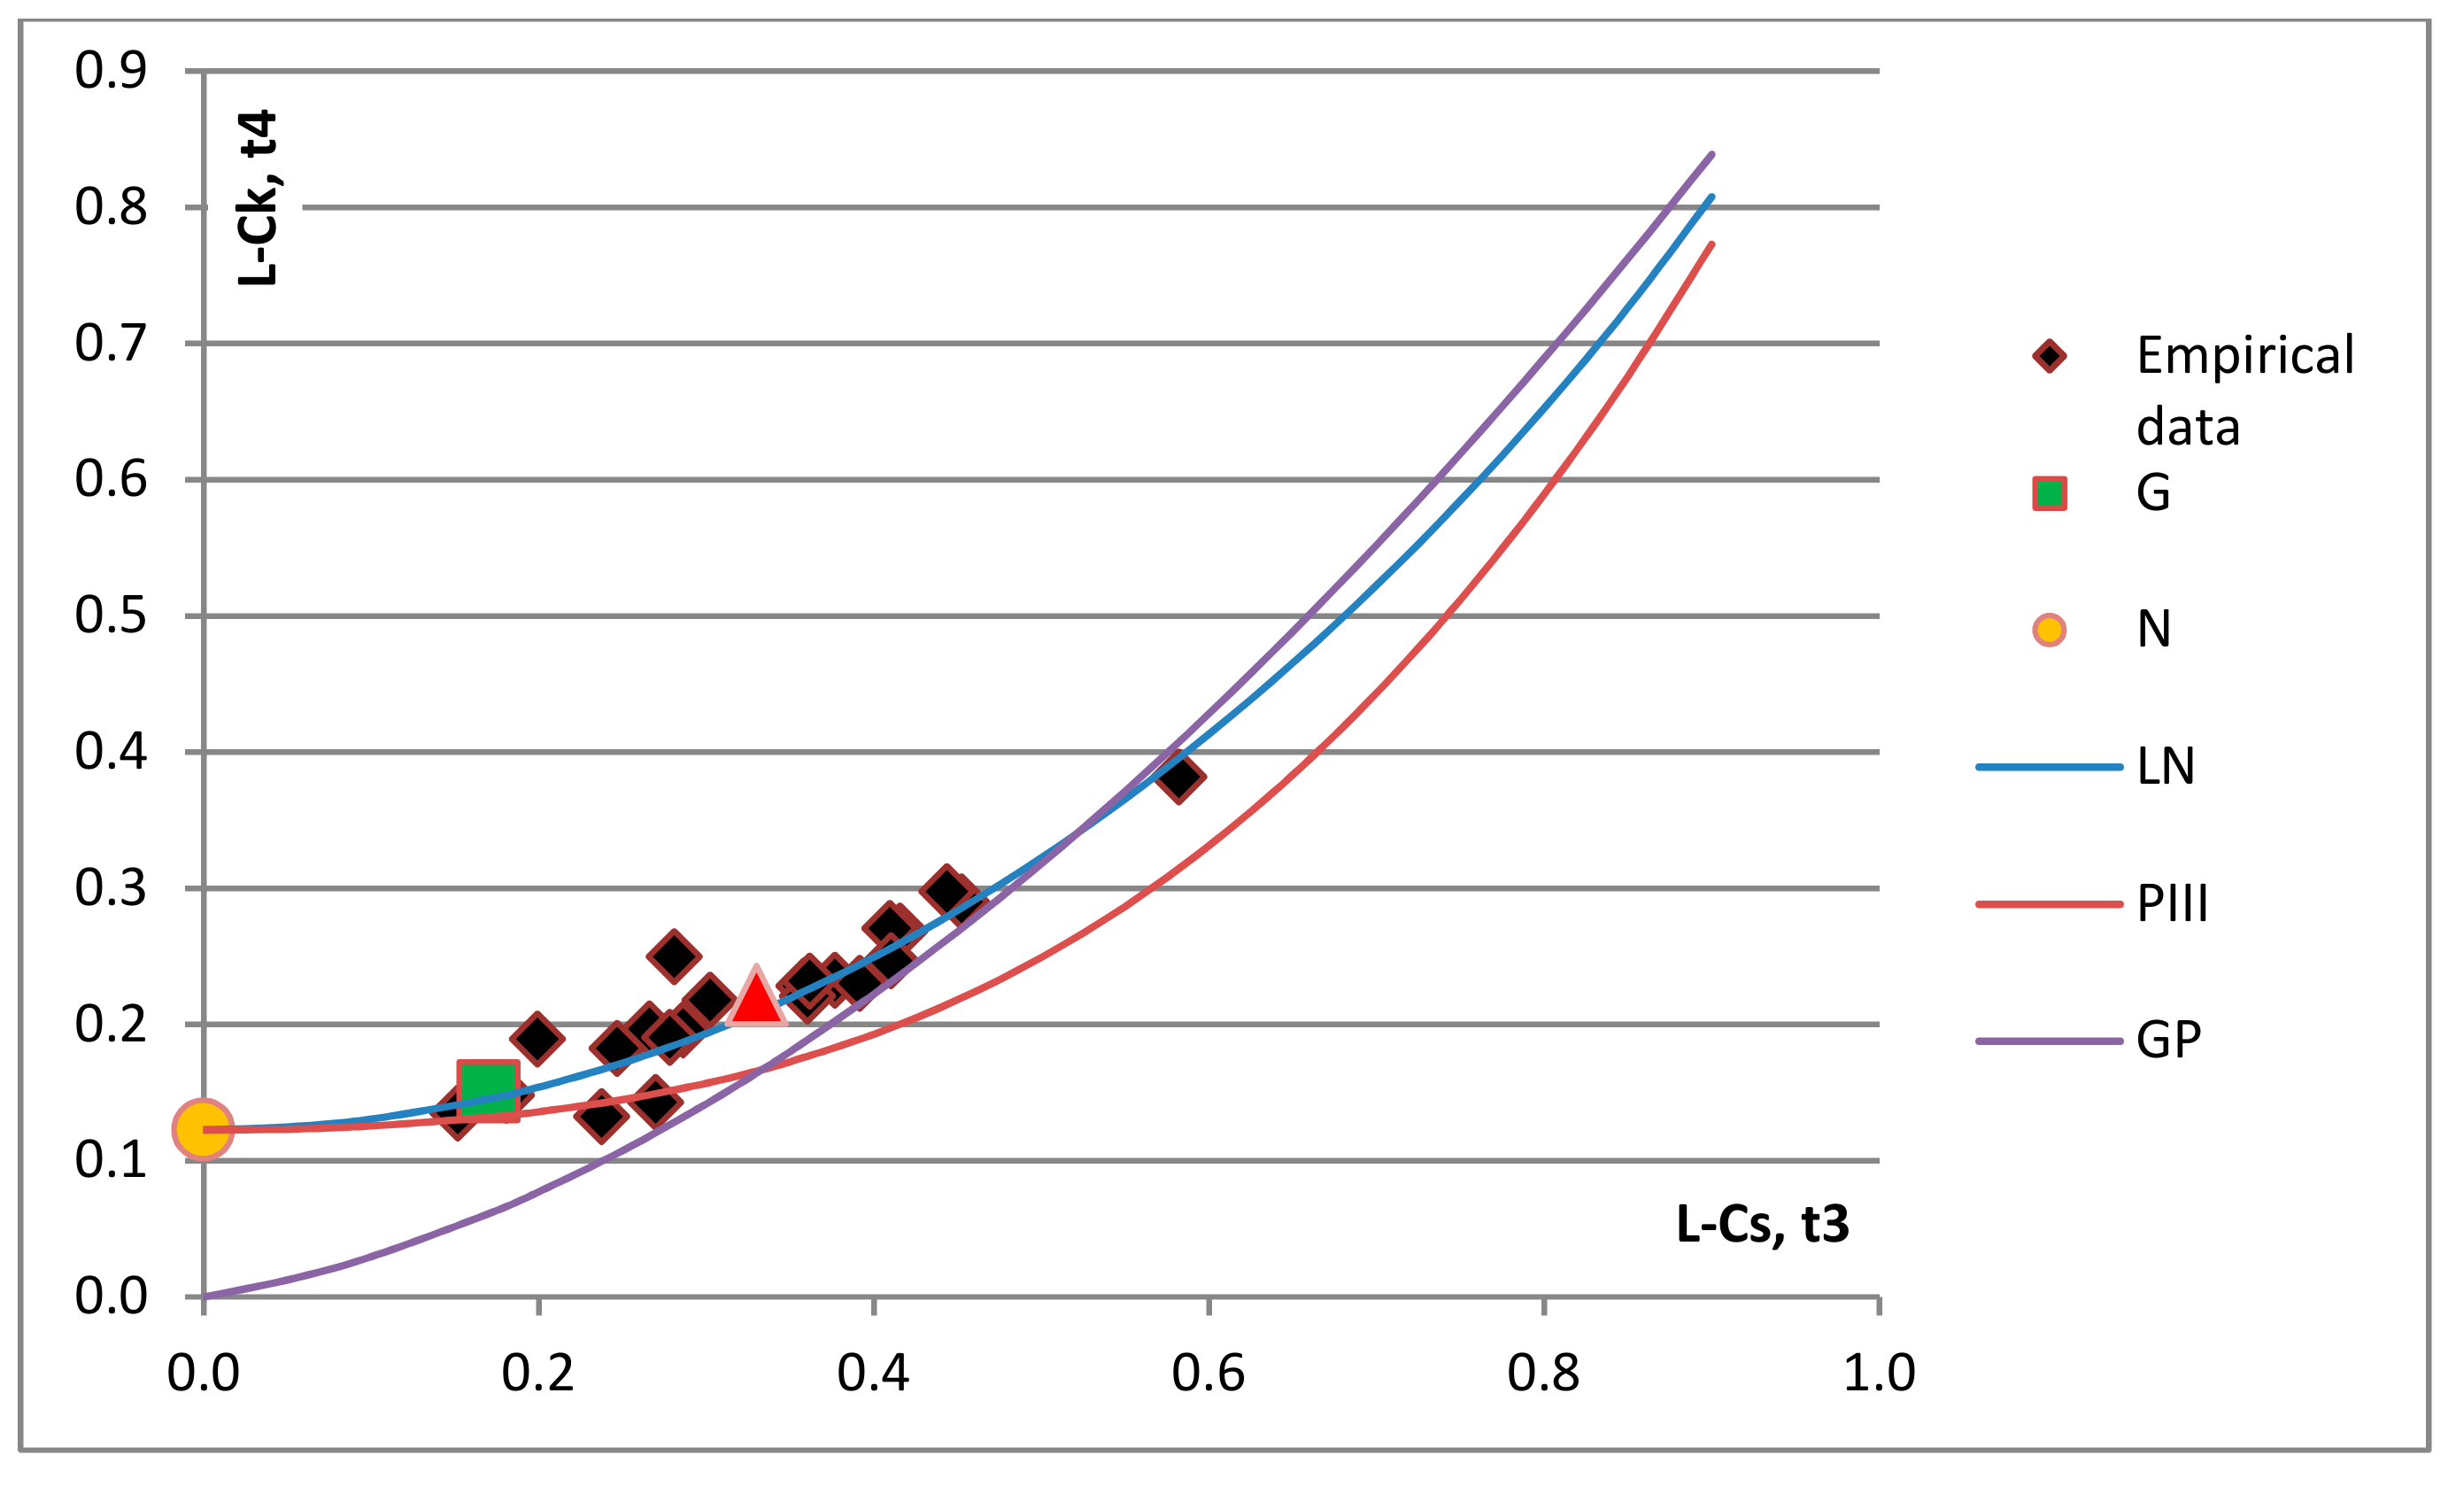
Considering durations, L-Cv values were between 0.12 and 0.52, with a mean value of 0.38. The L-Cs values ranged between −0.15 and 0.58, and the mean value was 0.33, the L-Ck range was between 0.13 and 0.38, with a mean value of 0.22 (
Figure 3).
In
Figure 2 and
Figure 3, visual observation indicates that the LN distribution can be selected as the best distribution for the four major rivers in the Pannonian Basin for both volumes and durations of high waters. From these figures, it is noticeable that there is no considerable variation of L-Ck and L-Cs within the study area. For both variables, most data points show a tendency to group around the LN and GP distributions, especially data with higher values of L-Ck. A case can be made that for volumes, GP distribution can also be selected as the best-fitted distribution, because average points were always near the LN and GP distributions, thus indicating that each distribution provides a good fit to the data. In this case, the mean value provides a good indication of the best distribution for homogeneous regions [
40], and this value points towards the LN distribution. For further confirmation of the results obtained from the L-moments ratio diagram, a goodness-of-fit test was conducted. This provided us with a good indication of the level at which the theoretical L-Ck of the fitted distributions matches the regional average L-Ck of observed data series. For all six distributions, the
Z statistics for flood volumes showed that the distributions satisfied the test criteria
, N (1.54), LN (0.12), G (1.23), GP (0.33), PIII (0.58) and LPIII (1.52). In this case, when all distributions satisfy the goodness-of-fit test, the distribution closest to zero will be considered as the best fit [
41]. As presented, the LN distribution has the value closest to zero, so it can be selected as the appropriate distribution for the flood volumes. For the duration of floods, the
Z test results also showed that LN (0.25) has the best fit with the empirical data, and that other distributions have also satisfied the homogeneity criteria
, N (1.25), G (0.90), GP (0.98), PIII (0.76) and LPIII (1.24). Our results show that the best-fit regional distribution, for both variables, for the major rivers in the Pannonian Basin is LN, because its value of
is the lowest. The results of this study indicate that data from the gauging stations within a homogeneous region can be pooled for RFFA and used to enhance the reliability of the quantile estimation in the gauged and ungauged basin.
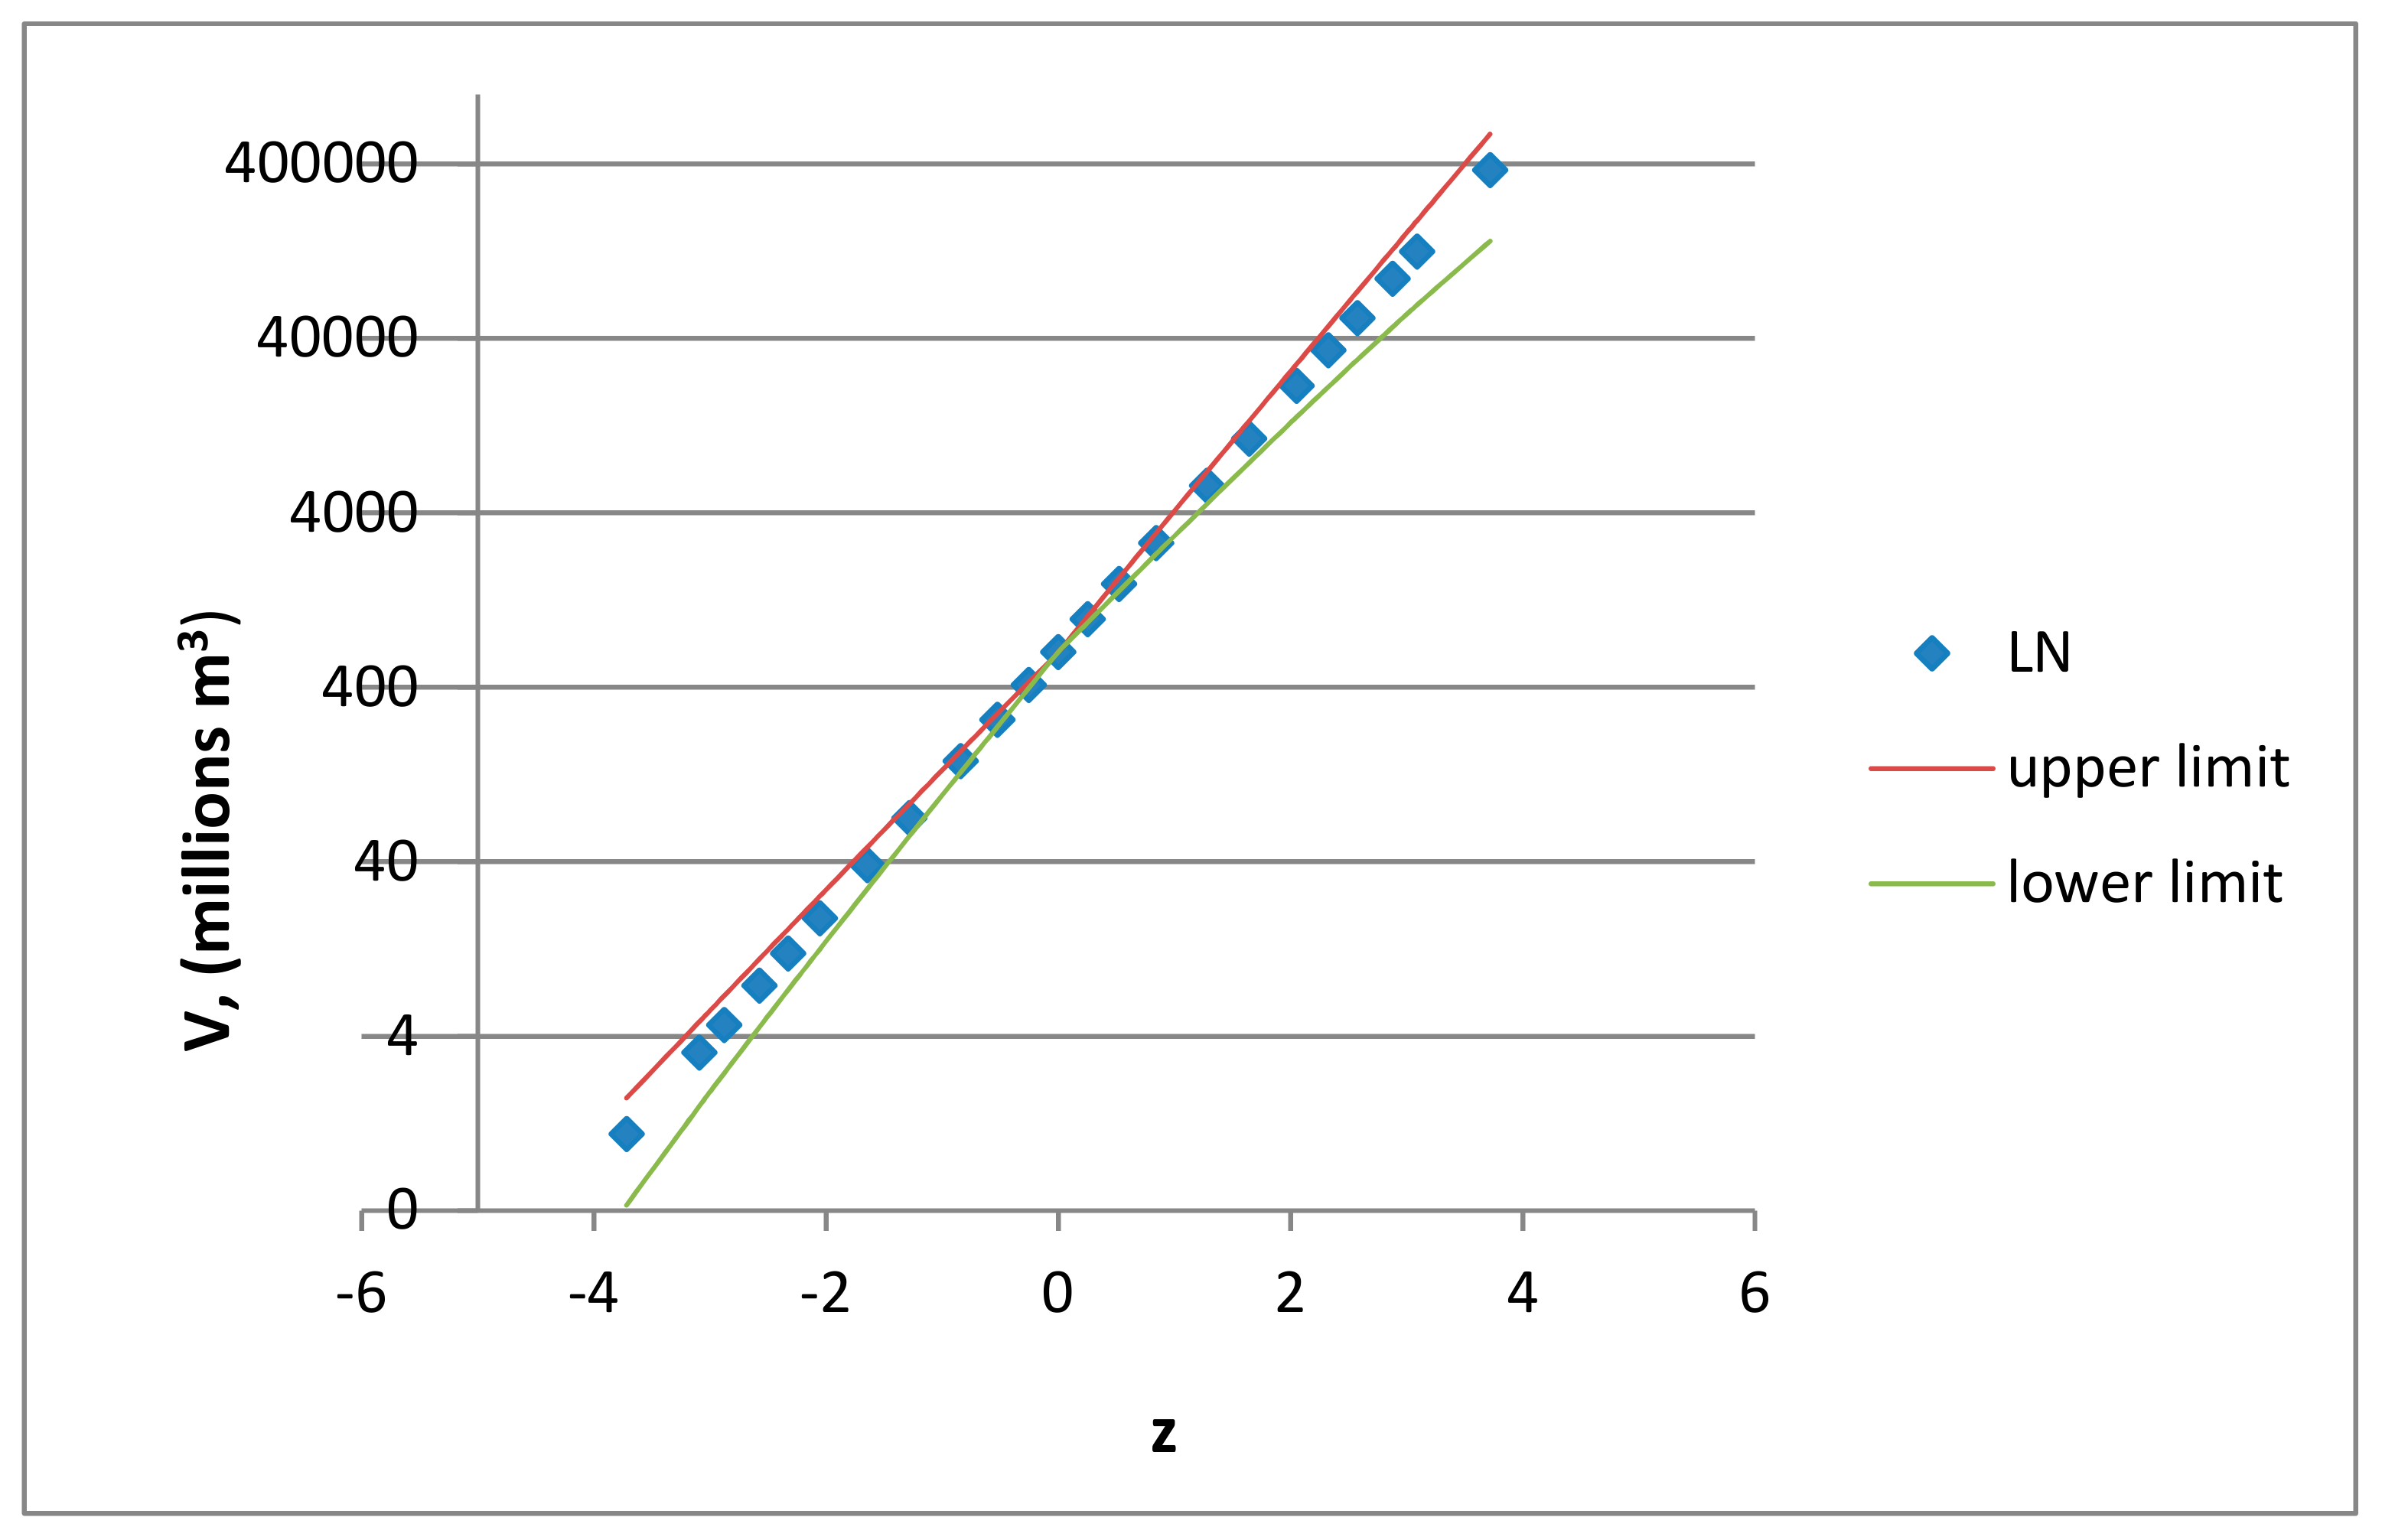
The cumulutive distribution function (CDF) of flood volumes at Smederevo station was created for the purpose of examination of goodness-of-fit of the selected distribution to the empirical data (
Figure 4). This station is the last station on the Danube River in the Pannonian Basin, and as such has the highest values of both investigated variables.
Figure 4 shows that while several distributions have a good alignment with empirical data at the highest values, LN distribution has the best fit for the entire range of empirical data. This is in good accordance with the results presented by Bačova-Mitkova et al. [
42], where the LN distribution also presented as the best-fit distribution with the empirical data at the Danube River. They also suggested using the LPIII distribution; however, our results showed that GP is a better fit for the rivers in the Panonnian Basin.
Estimation of floods with long return periods has high uncertainty due to factors like length of series and the shape parameter of the chosen distribution. This is why one should be very cautious when estimating floods with long return periods, for example, one in 10,000 years, as can be seen in
Figure 5.
After the regional distribution is selected, the quantiles with different exceedance probability were estimated using the regional shape parameters
σR = 0.936 for volumes and
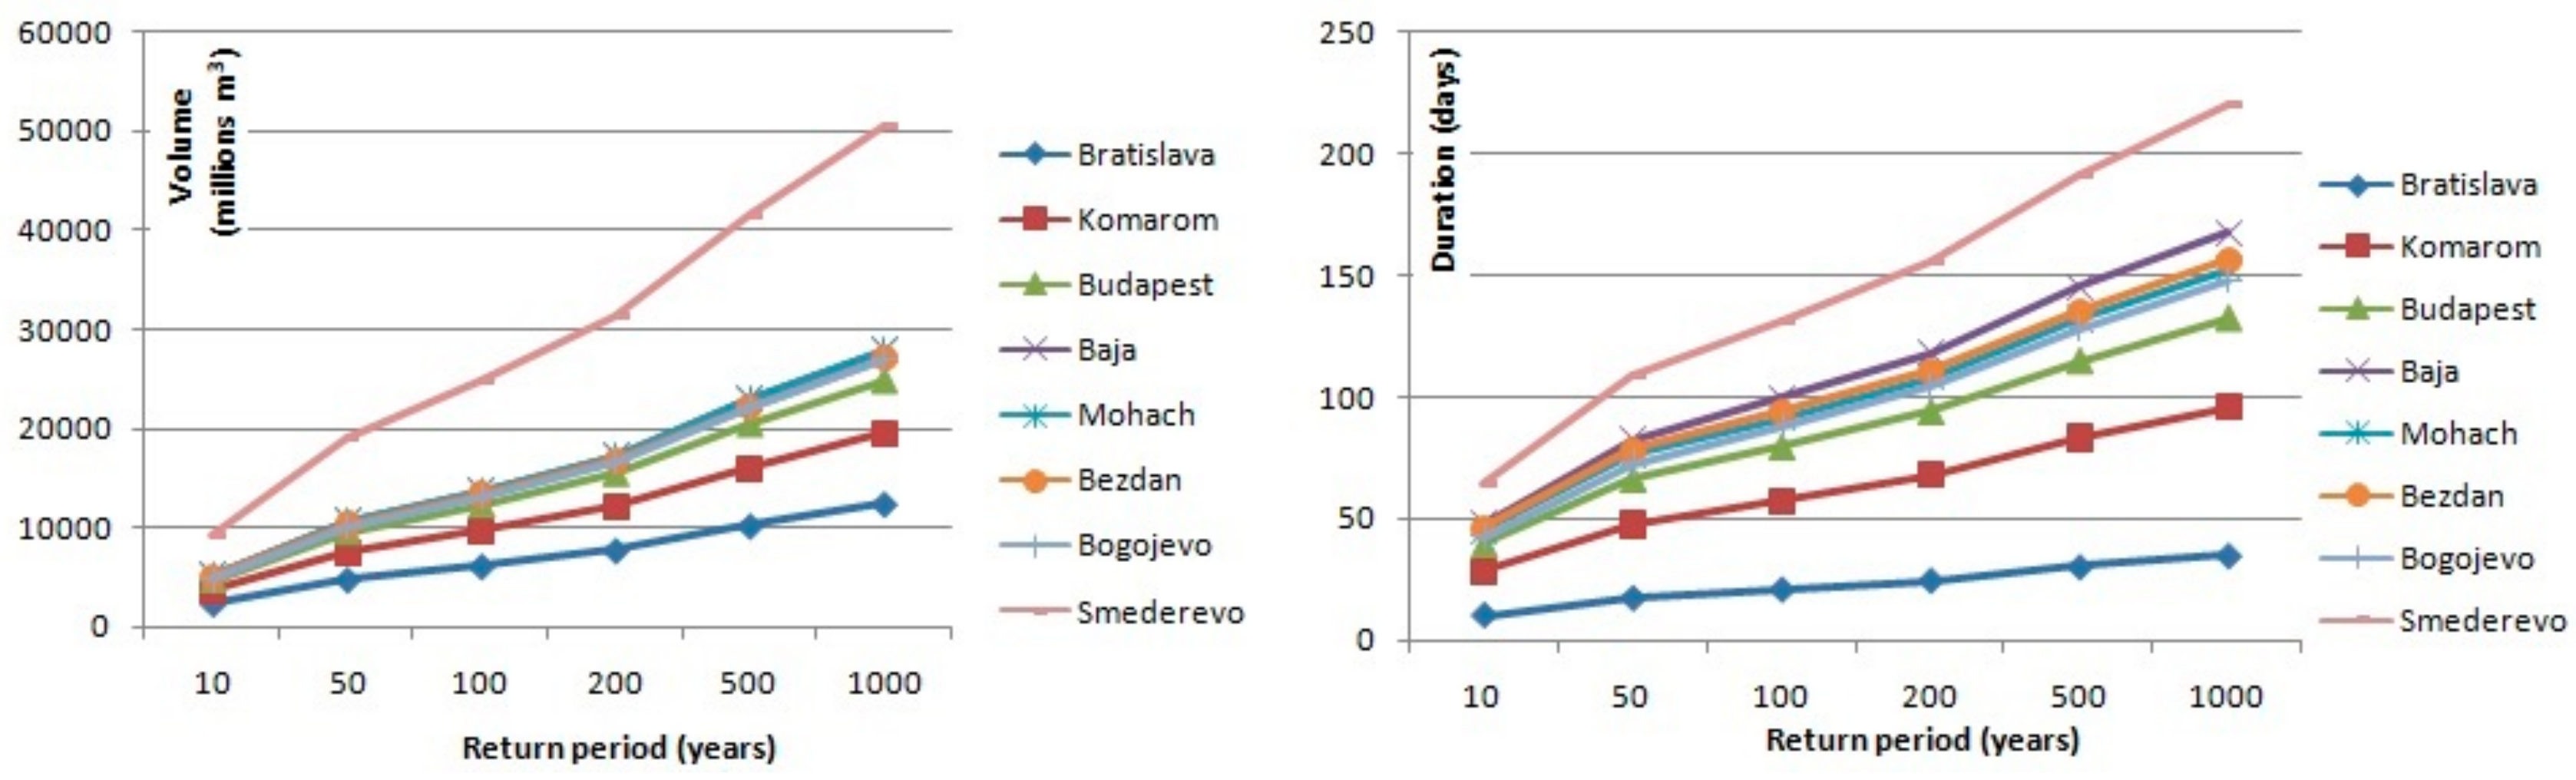
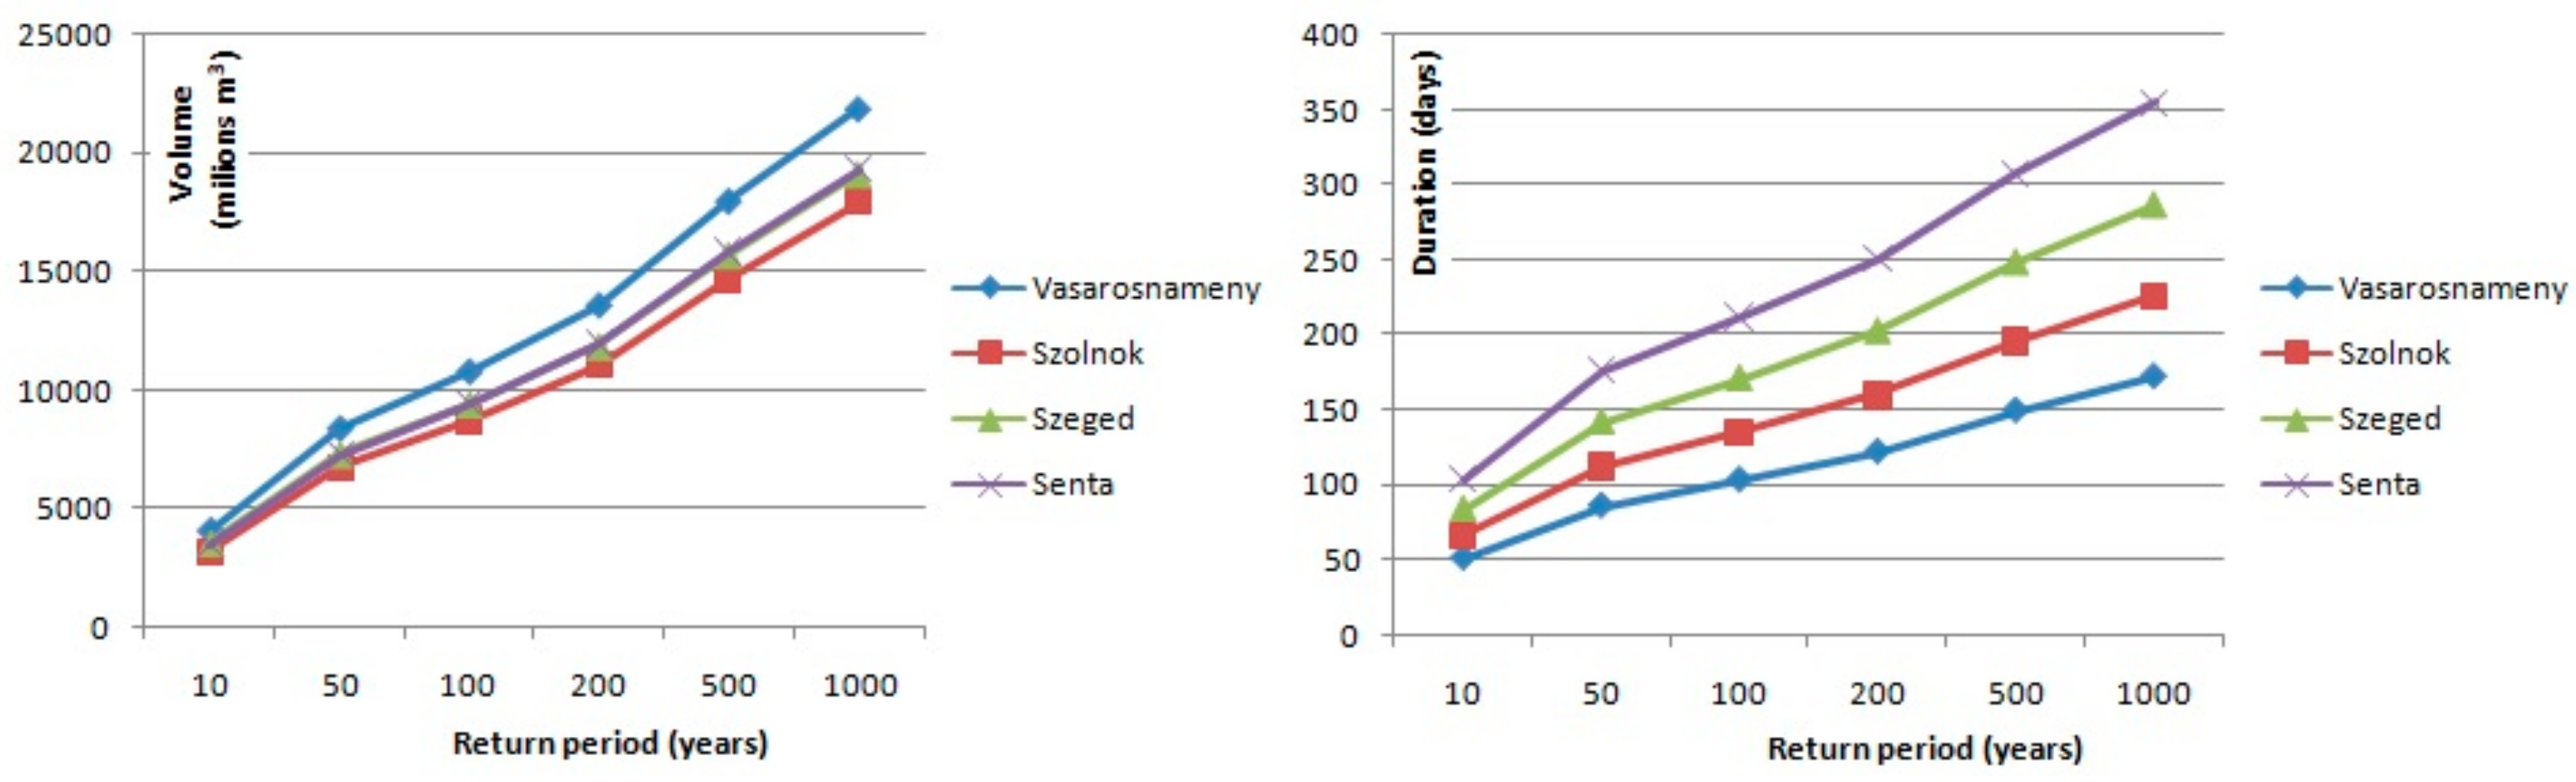
σR = 0.691 for durations. Results of regional flood frequency analysis for flood volumes and durations are presented in
Figure 6,
Figure 7,
Figure 8 and
Figure 9 for each river within the Pannonian Basin. When the mentioned figures were created, the interval of uncertainties and recommendations by Urošev et al. [
16] were considered. As
Figure 5 shows, when the return period increases, so does the uncertainty of estimation; this is why values of investigated variables with return periods longer than 1000 years were not estimated. The results presented in these figures show that the volume of floods with different return periods increase, as expected, downriver at all stations for all return periods. These results coincide with results presented by the Danube River Basin project [
15].
Considering that the duration of floods does not show as much regularity as volume, we analyzed the geographical characteristics of each station to find reasons for this phenomenon. As an example, we considered 100-year durations of large waters. For example, the 100-year duration of large waters at Danube stations increases from 21 days at Bratislava station to 99 days at Baja station. At the next station, Mohach, the duration of 100-year large water is 91 days; at Bezdan station, 94 days; but at Bogojevo station, 88 days. Large waters with 100-year return periods are the longest at Smederevo station, 131 days, as it is the most downstream station of the Danube River. On the Sava River, Čatež I station has a higher duration of large waters than Podsused žičara station, which is located downriver. This is due to different river regime, as the Čatež is influenced by Peripannonian pluvial-nival regime, while Podsused žičara and other stations that are located further downriver have a Pannonian pluvial-nival regime [
43]. After Podsused Žičara, durations of 100-year large water show a decrease from 119 days at Županja station to 88 days at Sremska Mitrovica station. This can be explained by the geographical characteristics of the riverbed; at Županja station, the width of the Sava River is 146 m, and the gauging station is located after a great meander that decreases the flow speed of the river and thus causing the longer duration of high waters. On the other hand, at Sremska Mitrovica, the width of the river at the gauging station is 183 m, and the riverbed is lineal. On the Tisa River, both variables show an increase from the first station (Vasarosnameny) downriver to the last station (Senta). At Vasarosnameny station, the duration of 100-year flood is 104 days, at Szolnok 135 days, at Szeged 171 days and at Senta station 212 days. Durations on the Drva River also show the influence of Peripannonian pluvial-nival regime, as the duration of large waters decreases downriver, from Donja Dubrava, where the duration is 72 days and the width of the riverbed is 96 m, to Botovo, where the duration is 51 days and the width is 160 m. At Terezino Polje gauging station, the duration of the 100-year flood is 47 days and the width of the river is 210 m, and at the last station, the duration increases to 64 days, but the width decreases to 150 m. On the Sava and Drava Rivers, the duration of the 100-year flood at gauging stations that are located upstream, Čatež I and D. Dubrava, can be explained by the influence of Peripanonnian pluvial and by changes in the width of the riverbed. It can be concluded that the duration of floods is under the influence of river regime, precipitation regime and riverbed morphology such as width and altitude.
One characteristic of RFFA is that it uses the homogeneity of the region to produce quantile estimates which are, in most cases, more reliable than those obtainable only from at-site data. Generally, the more homogeneous the region, the greater the benefit of using regional instead of at-site estimation [
44]. What is regarded as an advantage can also be viewed as a disadvantage of RFFA. As defined by Kidson et al. [
45], “one size fits nobody”, and that one regional model could result in poor-quality accuracy of flood predictions. So in order to achieve greater certainty of flood prediction both at-site and regional FFA should be taken into consideration. That is why, for the purpose of more reliable flood predictions, our future work will focus on both at-site and regional flood frequency analysis.
5. Conclusions
In this paper, a flood estimation procedure for the Pannonian Basin using RFFA methods based on L-moments is presented. Selection of the best-fitting distribution was based on identification of homogeneous regions as suggested by Hosking and Wallis [
27]. Since the homogeneity test showed that the entire basin could be considered homogeneous,
Vi < 1 (Volumes 0.097; Duration 0.074), there was no need for further investigation of the homogeneity of smaller geographical regions or sub-basins. Furthermore, for identification of best fitting distribution both L-moments ratio diagram and Z-statistic test were used. Flood quantiles were modeled and based on the significance threshold α = 0.05, and it can be concluded that all distributions agree with the empirical value (|
Z| < 1.96). Based on the
Z statistic, six distributions N, LN, G, GP, PIII and LPIII were identified as suitable candidates for regional analysis. However, as the LN distribution has the value closest to zero, and regional mean lies on the LN distribution, on L-moment ratio diagrams, it can be concluded that distribution selection indicates that Log Normal distribution is the best-fit regional distribution for the Pannonian Basin, both for volumes and duration of floods. There are many applications of FFA for large waters that are defined this way. The information about flood volumes and durations of different return periods is very important for organizing and coordinating flood defenses, because regional policy measures lead to desired results in some areas only if they are implemented in geographical regions that have similar flood characteristics. For example, estimation of designed flood has great importance in water resources management for future hydrological projects, such as economical design and successful operation of different hydrological structures (bridges, spillways, reservoirs, dams and urban drainage systems). Within the Pannonian Basin, there are 38 cities with more than 40,000 inhabitants that are located on the banks of Danube, Sava, Tisa and Drava rivers. Along with great population density, most of the regional industrial facilities are located in these cities and major traffic infrastructure leads towards them. Based on the results presented in this study, a higher level of protection of human life, defense of property and industrial facilities against floods within this geographical region could be provided. Therefore, correlation, communication and international spatial planning between countries in this geographical area (Slovakia, Hungary, Serbia, Croatia and Slovenia) is of crucial importance in prevention and preparedness measures of damage that flood, as a natural disaster, could bring. Results showed that application of L-moments in a regionalization approach for estimating the flood volumes and durations with a specific reoccurrence interval is convenient in geography and water resources management. The value of the results presented in this paper is that they provide more reliable flood estimates for the design and upgrade of flood defensive structures that will reduce the risk of failure and minimize the impact of environmental damage caused by flooding in the Pannonian Basin.


