Article

Evaluation of Water Resources Carrying Capacity and Its Obstruction Factor Analysis: A Case Study of Hubei Province, China

1
School of Hydropower and Information Engineering, Huazhong University of Science and Technology, Wuhan 430074, China
2
College of Environment and Ecology, Chongqing University, Chongqing 400000, China
3
Changjiang River Scientific Research Institute of Changjiang Water Resources Commission, Wuhan 430010, China
*
Author to whom correspondence should be addressed.
Water 2019, 11(12), 2573; https://doi.org/10.3390/w11122573
Submission received: 2 September 2019 / Revised: 16 October 2019 / Accepted: 19 November 2019 / Published: 6 December 2019

Abstract

:
The carrying capacity of water resources can provide a reference index for regional economic construction and development. Hubei produces 13.2% of China’s hydroelectric energy and 4% of China’s water resources, highlighting that the reservoir group in Hubei province is relatively developed. In the current research on water resources carrying capacity, only the amount of water resources was considered; the benign mutual feeding effect of regional reservoirs on regional water resources carrying capacity was not reflected upon. In order to guide social and economic activities better, this paper proposes the addition of reservoir water storage to the calculation of water resources carrying capacity as a separate indicator. In this paper, the cloud model method was used to calculate the water resources carrying capacity of Hubei province and the Dematel method was used to determine the degree of importance of reservoir water storage. Finally, the degree of obstacles was also considered to discuss the main factors affecting the water resources carrying capacity of Hubei province. In the system discussed in this paper, the degree of influence and the affected degree of reservoir water storage were found to be 1.2915 and 0.5759, respectively. The calculation results showed that Hubei province’s water resources carrying capacity has been increasing every year and the amount of water resources per unit area was the main restricting factor, with the obstacle degree reaching 19.24% of the average annual level.

1. Introduction

The carrying capacity of water resources describes the ability of a region’s water resources to support the socio-economic environment and human life. Water resource carrying capacity is a comprehensive index concerning the internal characteristics and interrelations of population, water resource, social economy and ecological environment [1,2]. The concept of water carrying capacity was first proposed in the field of ecosystems in the 1970s [3]. Current popular research methods of water resources carrying capacity were developed, such as the fuzzy analysis method, the principal component analysis method [4], the cloud model method [5], etc. These methods comprehensively consider various factors affecting the carrying capacity of water resources, basically covering the influence factor of regional water resources carrying capacity. However, provinces that are rich in water resources and who built a large number of reservoirs for water regulation have not fully considered the role of reservoirs in the supply of water in the region and the effect of water storage and release. The regulation of regional reservoirs with abundant reservoir resources could promote the water resources carrying capacity of the whole region.
Ren [6] proposed combining metabolism theory with the calculation of water resources carrying capacity and implemented this in a case study. The proposed theory reflected the intensity of water use and the efficiency of output, and this research provided early warning for water resources development and utilization policies. Wang Chuanghai [7], based on Beijing’s wetland water resources system, established a system dynamics model and used a computer simulation based on this model to view the changing trends related to population, economy, water supply and demand, and water environment pressure in Beijing from 2006 to 2030. In his paper, the comprehensive carrying capacity of water resources was divided into three aspects, namely, water resource balance capacity, water resource pressure and driving force, and water resource development and utilization capacity. These aspects were discussed by constructing a spatial Durbin model. Song Xiaomeng [8], taking Tianjin as an example, selected population scale and economic scale as the main indicators. On the basis of historical statistical data describing Tianjin’s water resources bearing capacity index (CI), the balance between the supply and demand index (IWSD) was evaluated and the relative resources carrying capacity (CCRR) method was adopted to the current water resources carrying capacity in Tianjin. The authors evaluated the dynamic trend and discovered that the utilization efficiency of water resources in Tianjin was poor, calling on the government to adopt more reasonable management measures.
In most studies, the availability of water resources is expressed in terms of annual average; however, the overall water resource system changes after the construction of the reservoir, and the impact of reservoirs on the water resource system may be ignored. In order to solve this problem, this paper proposes a method to analyze the water resources carrying capacity of the region by adding the reservoir water storage factor to Hubei province in central China.
In this paper, reservoir water storage capacity was taken as an important part of the regional water resources system. It was believed that the effect of reservoir storage on the water resources carrying capacity of the region should not be neglected, and a new evaluation model was established.
This paper collected basic data, such as water resources data, social development data, and ecological data, from various prefecture-level cities, districts, and county-level cities in Hubei province since the beginning of the 21st century. Firstly, the Dematel method was used to study the degree of influence of reservoir water storage and other candidate factors on water resources carrying capacity [9]. Then, indicators with large impact factors were selected to be used in the cloud model to cloud the various indicators and solve their evaluation grades. An evaluation system for reservoir water storage was added to verify the model. Then, the obstacle degree was considered to identify the factors that had the greatest influence on water resources carrying capacity. The major contributions of this paper are outlined as follows:
(1)
The composition indicators of the water resources carrying capacity calculation system in the developed areas of reservoir construction were updated.
(2)
The theory was verified using the Dematel method, with the results showing that the hypothesis is feasible.
(3)
The water resources carrying capacity of Hubei province was calculated using the cloud model with the hope to provide references for local economic development and construction. Following this, the obstacle degree was added to identify the factors with the greatest influence on the water resources carrying capacity.
Section 2 briefly describes the geographical features of Hubei province and introduces the methods adopted in this paper. In Section 3, the data analysis of the sample areas and the evaluation results of the water resources carrying capacity are obtained. Finally, in Section 4, the improved model proposed in this paper is discussed and the development status of the water resources carrying capacity in Hubei province is analyzed.

2. Research Area and Analysis Methods
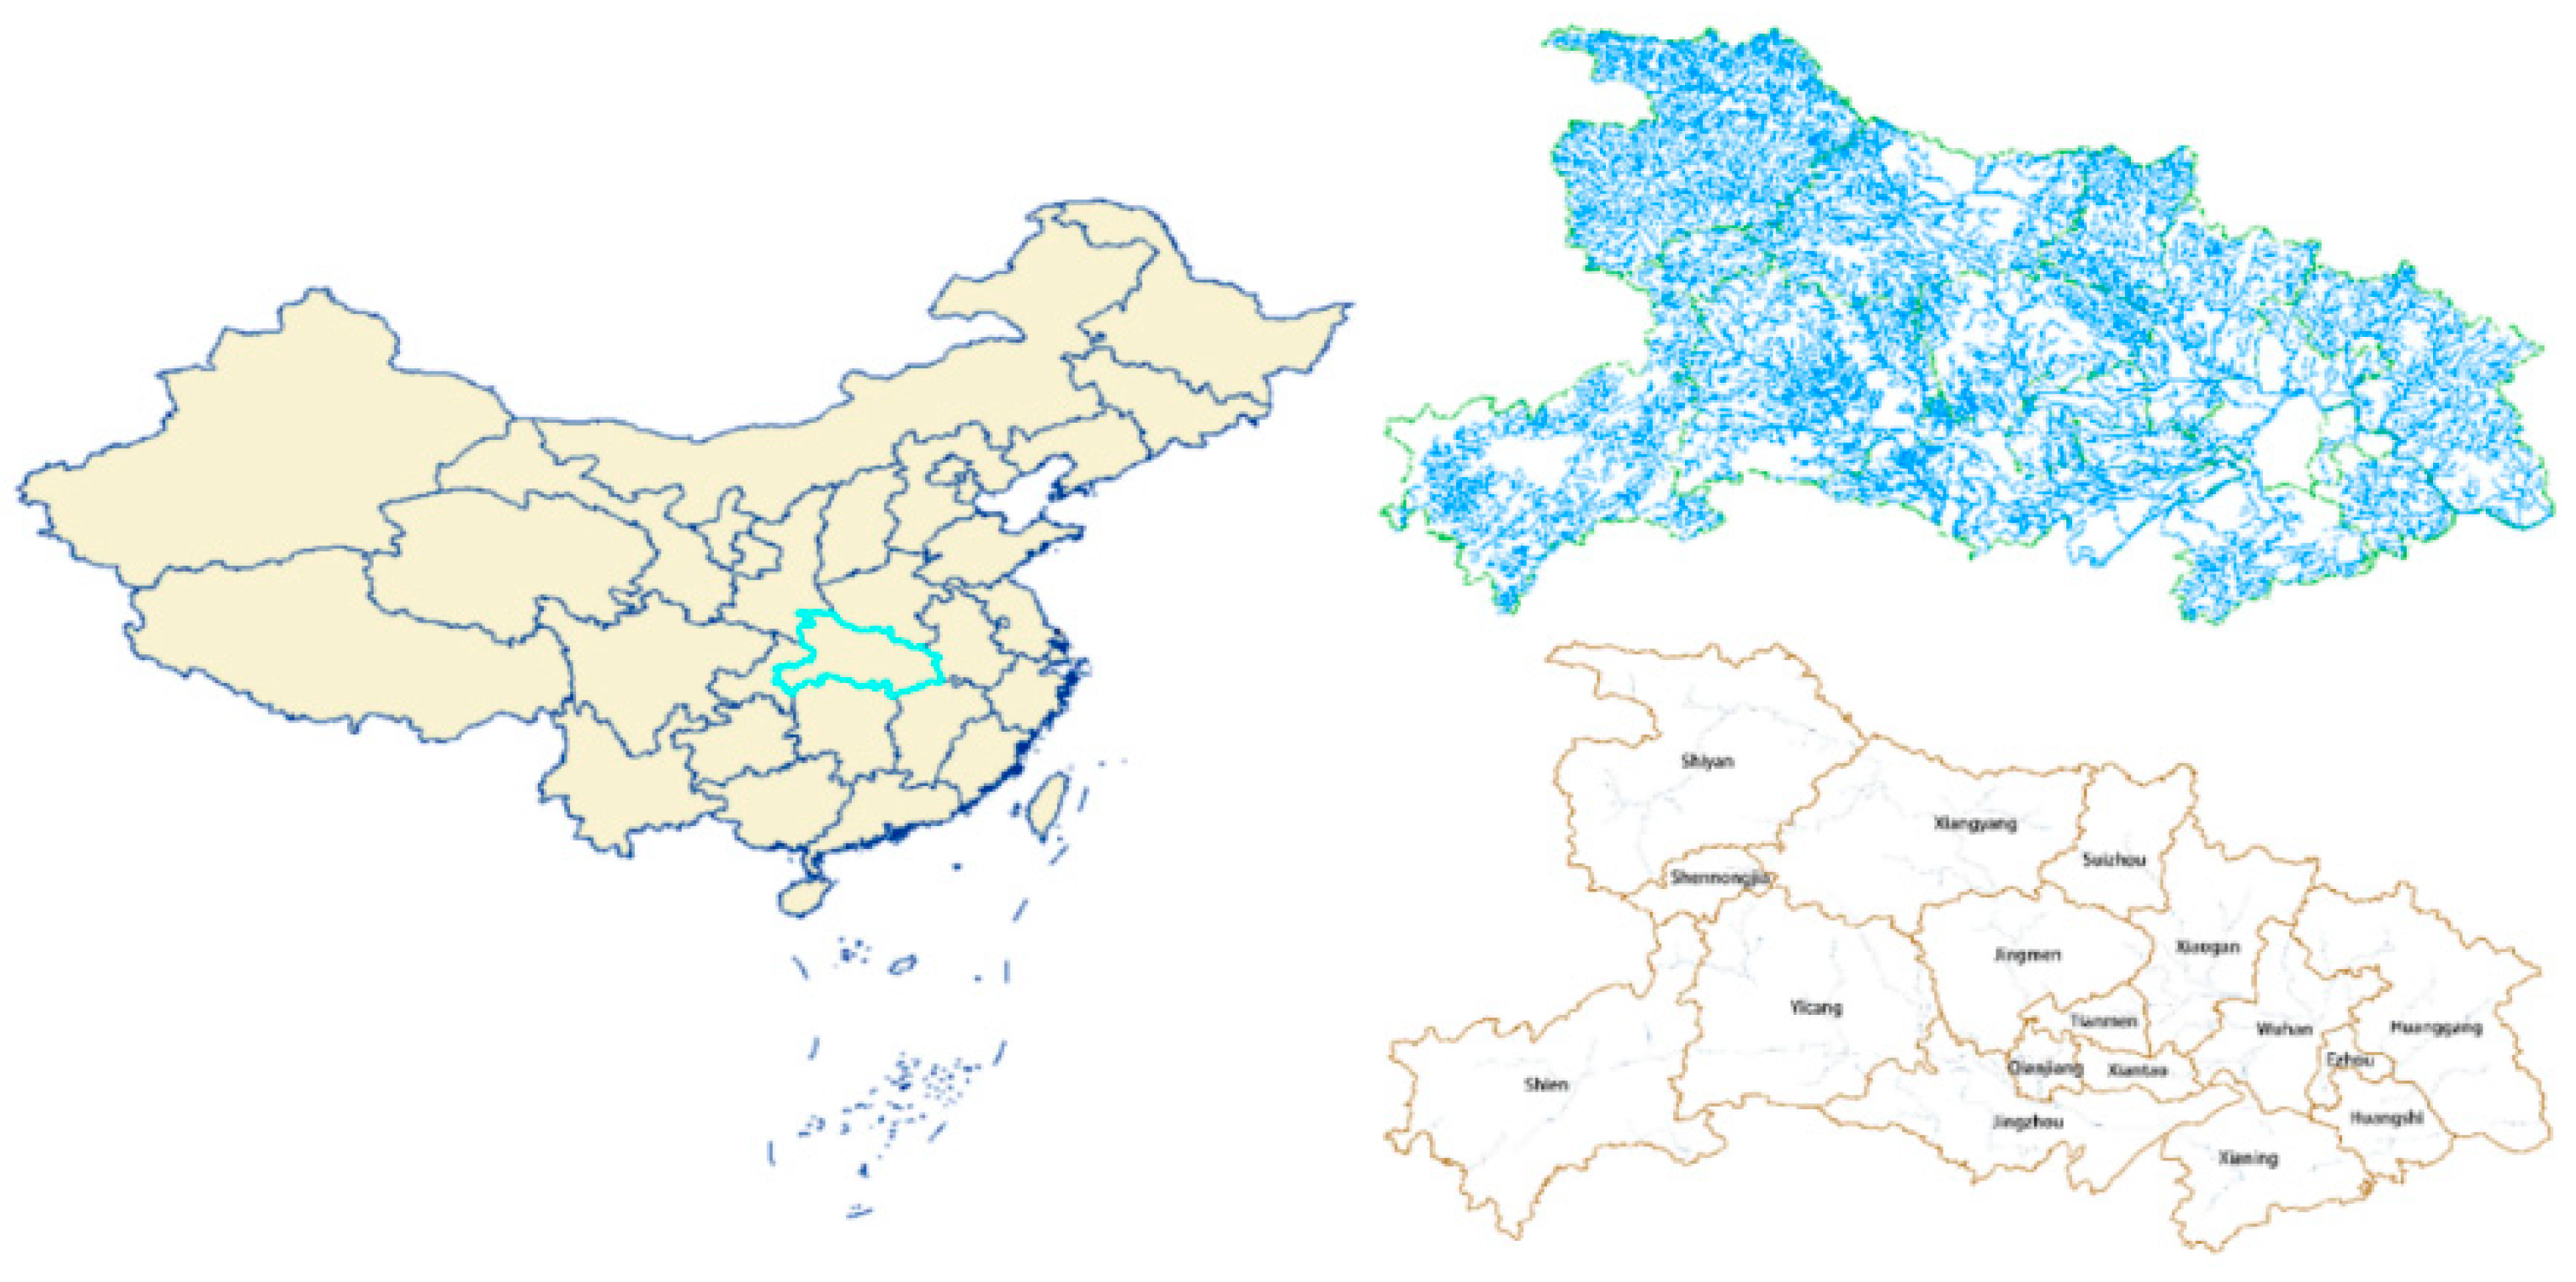
2.1. Research Area

Hubei province is located in the Yangtze River system in a subtropical zone (latitude 29°01′53′′–33°06′47′′, longitude 108°21′42′′–116°07′50′′) (Figure 1), Its position in China and the water system are shown in Figure 1. Most areas in Hubei province are sub-tropical monsoon humid climates. The average rainfall is generally between 800 mm and 1600 mm, and rainfall gradually decreases from south to north. There are two main streams in Hubei province, namely, the Yangtze River and the Han River. There are more than 4228 rivers in the province that are more than 5 km long, and 41 rivers are at least 100 km long. According to the latest Hubei province Water Resources Bulletin, there are 350 reservoirs in Hubei, including 72 large reservoirs and 278 medium-sized reservoirs. At the end of the year, the total storage capacity of large and medium-sized reservoirs in the province totaled 50.496 billion cubic meters. Large reservoirs accounted for 46.225 billion m3, accounting for 91.54% of the total. In the same period, 13 typical lakes in the province had a water storage capacity of only 2.225 billion m3 at the end of the year, 45% of the reservoirs were built in the 1970s, and about 8.5% after 2000s. Hubei has the largest number of reservoirs in China, and reservoir water storage plays an important role in the ecosystem of the water of the whole province. Therefore, we believe that this study on water resources carrying capacity in Hubei province should not ignore the influence of a large amount of reservoir water storage on the water resources carrying capacity in the region.

2.2. Analysis Methods

Figure 2 shows a flow chart of the water resources carrying capacity when the reservoir storage factor was added to the calculation.
Firstly, the Dematel method was used to judge the relationship between reservoir water storage and other selected indicators (in Table 1) [10] according to the AHP (Analytic Hierarchy Process) method [11], it is a decision analysis method combining qualitative and quantitative analysis, AHP can be used as a decision-making tool to achieve better results when combined with other methods. The Analytic Hierarchy Process is an easy method to determine weights, according to the subjective judgment structure (mainly two-two comparison) of certain objective reality; expert opinions and the objective judgment results of the analysts are directly and effectively combined, and the importance of the comparison of the two elements is quantitatively described. This method was used to determine the weight of each factor influencing regional water resources carrying capacity. The cloud model was also used to quantitatively describe the water resources carrying capacity [12]. In order to reflect the scientific nature of the evaluation system, consideration was given to the natural resource system (reflecting the availability of natural resources), water quantity and efficiency system (reflecting water quantity and efficiency), and social economic system (reflecting the consumption of water resources in economic and social development). ‘Utilization’ in the table below refers to what can be mined, not consumed.

2.2.1. The Centrality of Each Indicator Was Verified Using the Dematel Method

The Dematel method is widely used in management decision-making and has been widely applied in the field of economic management. In recent years, it has also been extensively used in multiple disciplines [13,14]. This method is mainly based on graph theory and matrix. By dividing the involved factors into cause and effect groups, Dematel translates the relationships between the various factors into visible data forms. Although previous research regarding water resources carrying capacity mostly put reservoir water storage capacity into the existing water resources index (such as the total amount of water in the area) to calculate the water resources carrying capacity, this paper creatively argues that the reservoir system should be calculated as a single factor affecting the carrying capacity of water resources. In order to verify this point of view, Dematel was used to obtain the centrality of reservoir impoundment. The greater the centrality, the greater the impact of reservoir impoundment on the water resources carrying capacity. After verification using the Dematel method, this paper adopted the cloud model for the calculations. The process of calculating the carrying capacity of water resources in Hubei province by adding water storage index was as follows:
(1)
Count each indicator as a 1 , a 2 , a 3 c 1 , c 2 , c 2 , c 4
(2)
Analyze the correlation between indicators according to existing data results and relevant research experience, and construct a straight line between the indicators according to the obtained results. Then, the influence matrix A was used to mark the direct influence degree of each index using the “0/1 scale method”.
A = [ 0 a 12 a 1 n a 21 0 a 2 n a n 1 a n 2 0 ]
a i j was used to indicate the degree of direct influence between the indicators. When there was a direct influence, a i j was equal to 1, and when there was no direct influence, it was equal to 0.
(3)
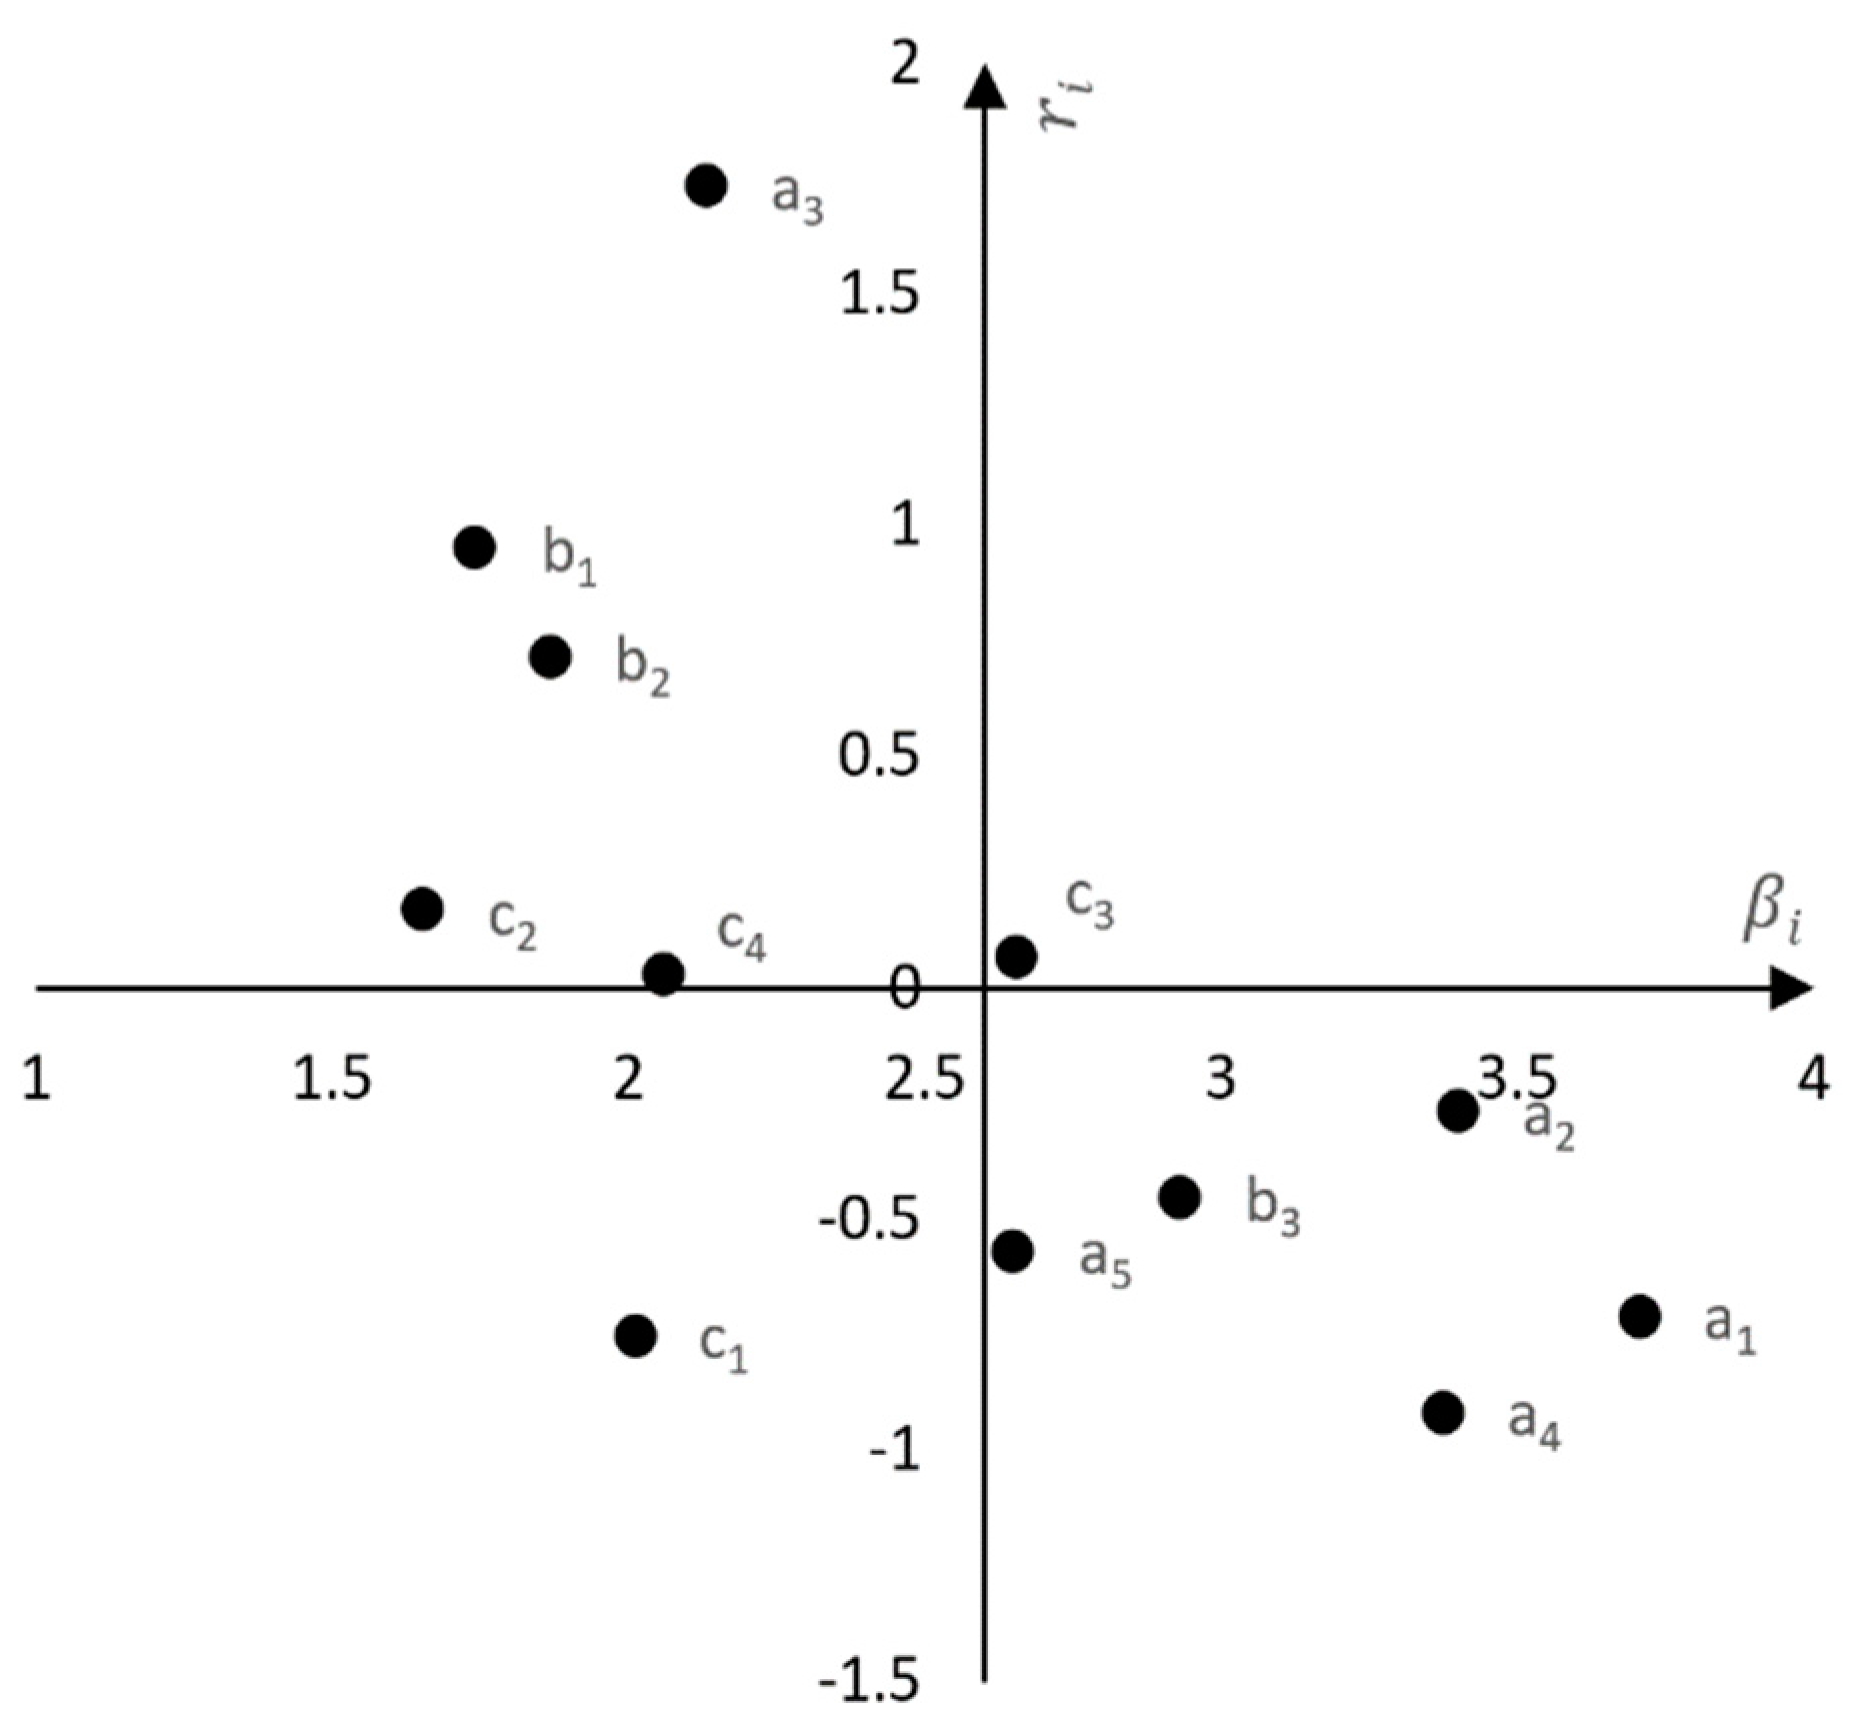
According to the three types of system calculations, as shown in Table 1, matrix A was standardized to establish a comprehensive influence matrix. Then, influence degree x i of each index, affected degree y i , central degree β i , and cause degree r i were calculated.

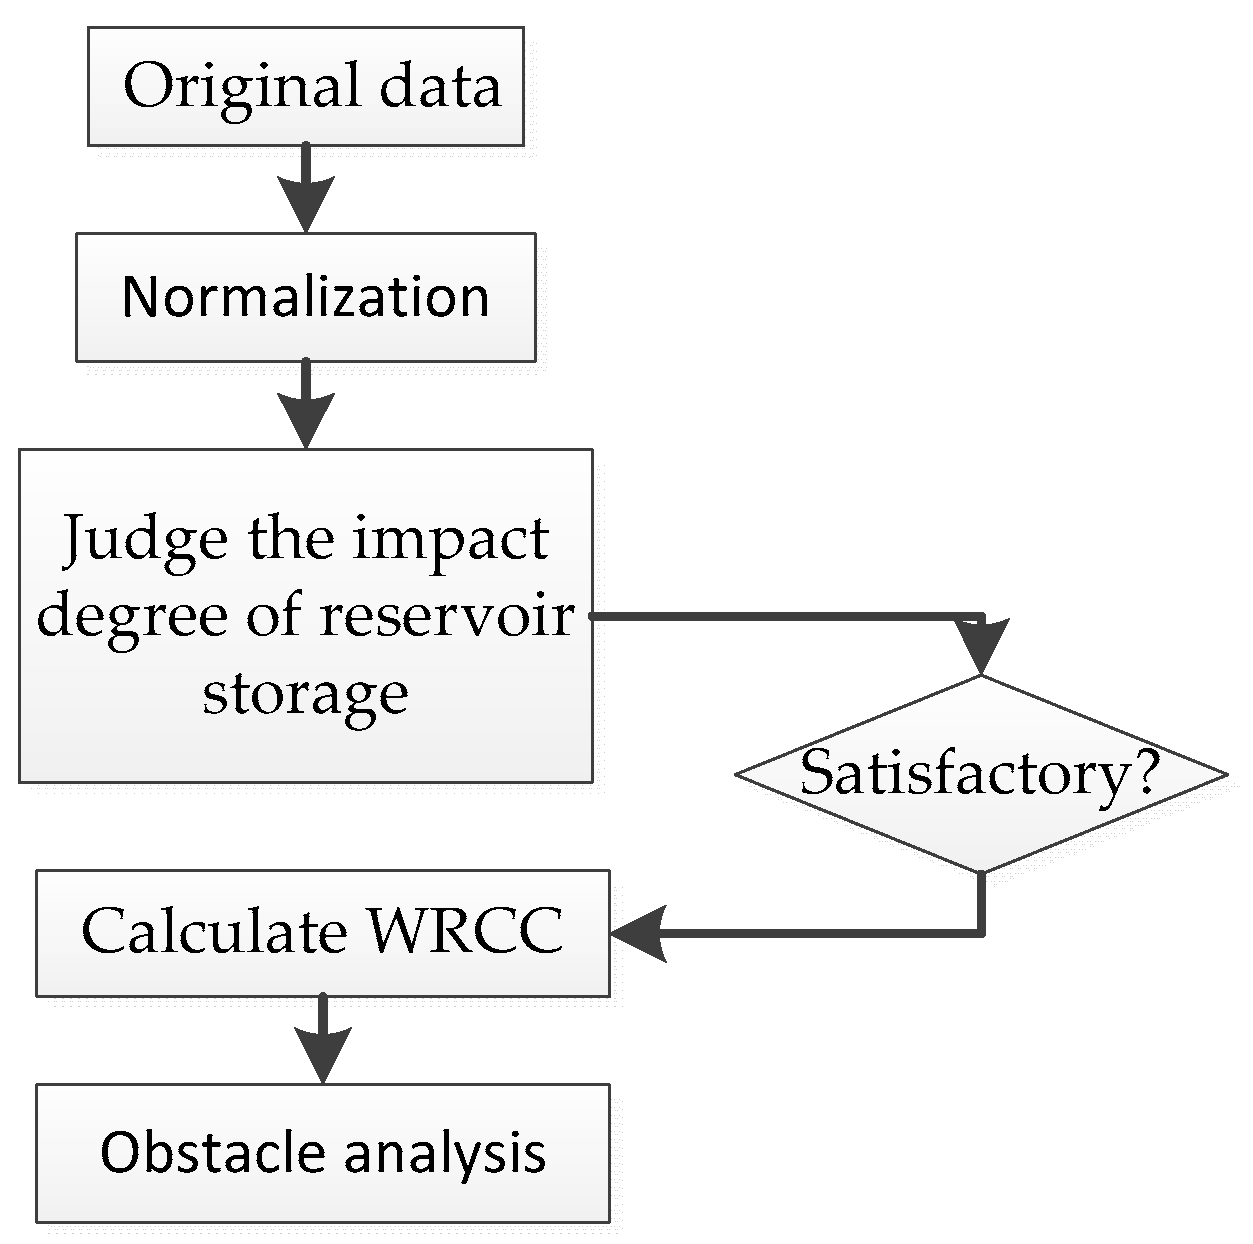
2.2.2. Using the Cloud Model Method to Calculate Water Resources Carrying Capacity in Hubei Province

In the calculation of water resources carrying capacity, it was necessary to use fuzzy mathematics to describe the carrying capacity of water resources. However, the randomness of the membership led to an uncertainty regarding the degree of membership [15,16,17]. The cloud model method uses a stochastic model to describe the membership degree, thus linking the two characteristics of random and fuzzy. Assuming that the quantitative domain is numerically represented as U , C represents a qualitative concept on the quantitative domain. For a certain quantitative value x   U , x is a random implementation with its certainty μ ( x )   [ 0 , 1 ] , and has a stable tendency random number μ : U [0,1],   x   U , x   μ ( x ) . When this condition is met, x is called a cloud droplet in the theory field.
The cloud model uses expectation E x , entropy E n , and hyper entropy H e to characterize the overall system characteristics. Entropy E n refers to the uncertainty measure of the qualitative concept, which was determined by the randomness and fuzziness of the concept, while excess entropy H e refers to the uncertainty measure of the entropy, which was determined by the randomness and fuzziness of the entropy.
The calculation process using the cloud model to evaluate the regional water resources carrying capacity was as follows:
{ E x ( j ) = 1 n i = 1 i = n x   n j E n ( j ) = 1 n × π 2 × i = 1 i = n | E x ( j ) x n j | H e ( j ) = E x + 3 E n E x ( j ) 6 E n
In the cloud model, H e ( j ) was used to determine the membership degree and E n ( j ) was expected to be the corresponding evaluation for water resources carrying capacity evaluation.

2.2.3. Introducing the Concept of Obstacle Degree to Identify Water Resources Carrying Capacity

The purpose of the evaluation of water resources carrying capacity is not only to evaluate the current situation of water resources in the area of evaluation, but also to identify the key factors restricting the development of water resources carrying capacity in the region. Therefore, the obstacle degree model was added to further diagnose the obstacle factors affecting the water resources carrying capacity in Hubei province [18,19]. The calculation method was as follows:
D i j = ω i × ( 1 x i j ) i = 1 n ( 1 x i j ) × ω i × 100 %
In this formula, D i j is the obstacle degree and ω i is the weight of each factor. According to the above formula, the most significant factor affecting the regional water resources carrying capacity was found, thereby providing a theoretical basis for better development of regional water resources management. The higher the D i j , the greater the constraint effect.

3. Data and Results Analysis

This paper collected data of various regions from 2001 to 2017, including annual precipitation, surface water resources, total water resources, population, etc. The data were obtained from the official Water Resources Bulletin and statistical data. Unlike previous research on water resources carrying capacity, this paper also collected the reservoir water storage capacity in diverse regions since the beginning of this century.
According to the above table, in addition to Xiantao and Tianmen regions that have not yet had their reservoir water storage data calculated, the reservoir water storage in most areas accounted for a considerable amount of water resources in the area, that can see in the Table 2, especially Shiyan city, because of the large amount of water storage in the reservoir, even more than the total amount of other water resources in addition to the reservoir storage. After the construction of a reservoir, this portion of water resources is expected to no longer participate in the same hydrological cycle system as before (for example, with evaporation increase, the surrounding air humidity is significantly higher) [20,21,22]. Taking Qianjiang as an example, according to statistical data, the reservoir water storage in 2016 accounted for 15.73% of the annual water storage in this region, and in 2017 this value was 24.50%. It can be seen that reservoir water storage has a great impact on the distribution of local water resources; when a large amount of water is stored in the reservoir, storing abundance and replenishing drought within the affected area is achieved, and local irrigation conditions, drinking water conditions, and water diversion to replenish the local ecosystem are all improved [23,24]. If the reservoir only exists as part of the regional water resources for ordinary analysis, this would greatly influence the water resources carrying capacity and therefore the objectivity of the results. Based on the above facts, this paper creatively puts forward reservoirs as a single indicator alongside the analysis of the water resources carrying capacity in the region, in order to achieve sustainable development in society, while accurately evaluating water resources, subsequently achieving a rise more in line with the actual guiding role.
In Table 3, the center degree β i and the cause degree r i of each index were plotted in the coordinate system, with the center degree β i as the horizontal axis and the reason degree r i as the vertical axis, as shown in Figure 3. The reservoir water storage factor b 2 had a low center degree in the second quadrant and a high cause degree, indicating that although the reservoir water storage was far from the first quadrant, it had a significant influence on the other indexes in the selected system. Therefore, this was an indicator that required attention regarding the evaluation system of the water resources carrying capacity. This also verified what this paper proposes—that reservoir water storage should be used as an important impact indicator for the evaluation of water resources carrying capacity in areas that are rich in both water resources and reservoir water storage.
According to the evaluation index classification table (Table 4), the weight of each index’s influence on the water resource carrying capacity was determined to be (0.0945 0.0897 0.1372 0.136 0.0373 0.0479 0.0255 0.1967 0.0836 0.0422 0.0673 0.042). The change in water resources carrying capacity in Hubei province over the past 17 years was subsequently calculated; the carrying capacity is a relative value and all the original data in the calculation process have been dimensionless, so there are no units (Figure 4).
The above picture shows the changes in water resources carrying capacity in 17 regions of Hubei province from 2001 to 2017. Since the beginning of the century, the government and the public have shown concerns about water resources, although the overall situation has revealed a good trend. The overall score distribution in the scoring results gradually increased from 0.4 in the early 21st century to around 0.6 in more recent years. According to these data, the water resources carrying capacity is bound to move forward in a better direction, the main reason being index obstacle degree decrease (Figure 5).
In order to more intuitively observe the impact of reservoir impoundment on water resources carrying capacity, the trend of reservoir water storage for various years of obstacle level changes in various regions is shown in Figure 5. The green line, representing the Shiyan area, is relatively low, and is related to the huge amount of water storage in Shiyan. On this basis, the water storage capacity basically did not constitute a negative impact on the regional water resources carrying capacity. The degree of station change was also kept relatively stable over the years.
The above picture clearly shows a 3 , a 4 , and b 3 with high degrees of disorder, with b 3 ’s degree level obviously higher than the other indexes and a 3 ’s obstacle degree being slightly lower than a 4 . b 3 maintained a high level, showing that the b 3 indicator (water resources per unit area) is the main factor restricting the development of regional water resources carrying capacity out of the evaluation indicators formulated in this paper. For storage index b 1 proposed in this paper, the obstacle degree is in the middle, around 6%. According to the low obstacle degree of b 1 in Shiyan area in the Figure 6, it can also be inferred that storage is not the main index affecting the regional water resources carrying capacity.
According to the three subsystems described in the previous section, this paper draws attention to the main obstacles to water resources carrying capacity in various regional subsystems for many years (Figure 7); the X-axis is the year and the Y-axis the degree of obstacle, and since the obstacle degree is a relatively dimensionless value, there are no units.
It can be clearly seen from the above figures that subsystem A is the greatest hindrance to the water resources carrying capacity of Hubei province as per the evaluation system selected in this paper, and is an important impact system when considering further improvement of water resources carrying capacity. The impact of B subsystem on water resources carrying capacity is also large, indicating that further improvement regarding water use efficiency is a very important measure that requires promotion. The low obstacle degree of sub-system C on water resource carrying capacity may be mainly caused by the low ecological water consumption in C and the low impact on the overall water consumption of sub-system C.

4. Discussion and Conclusions

Reservoirs store water in the high season and replenish water in the low season, and have the ability to withstand floods in radiation areas and provide reliable water resources protection for regions in the dry season. The data presented in Table 2 show that in water-rich areas, the adjustable water volume of the reservoir accounts for a large part of the total water resources in the region. In some areas, the reservoir water storage capacity is even greater than the total water resources outside the reservoir (such lakes, groundwater, etc.). In addition, large reservoirs may even affect meteorological conditions in the surrounding areas [24,25]. Therefore, this paper proposes that when analyzing the carrying capacity of water resources in areas with abundant water resources and many reservoirs, the water volume of the reservoir should be taken as a single index factor in calculations to improve the reliability of the calculation results.
(1)
The calculation of the water resources carrying capacity evaluation system was updated. b 1 had an influence degree of 1.3483, an affected degree of 0.3964, a center degree of 1.7447, and a cause degree of 0.9519. This indicated that the reservoir water volume should be considered as an important factor affecting other indexes in the evaluation of water resources carrying capacity in developed areas of reservoir construction proposed in this paper. The regulating function of reservoirs should be strengthened in future water resource management to better distribute water resources.
(2)
According to expert opinions and analyses of the existing results, the weight of each index was determined reasonably. The fuzzy and deterministic relationships between the evaluation indexes was solved using the cloud model, which made the water resources carrying capacity calculation more reliable.
(3)
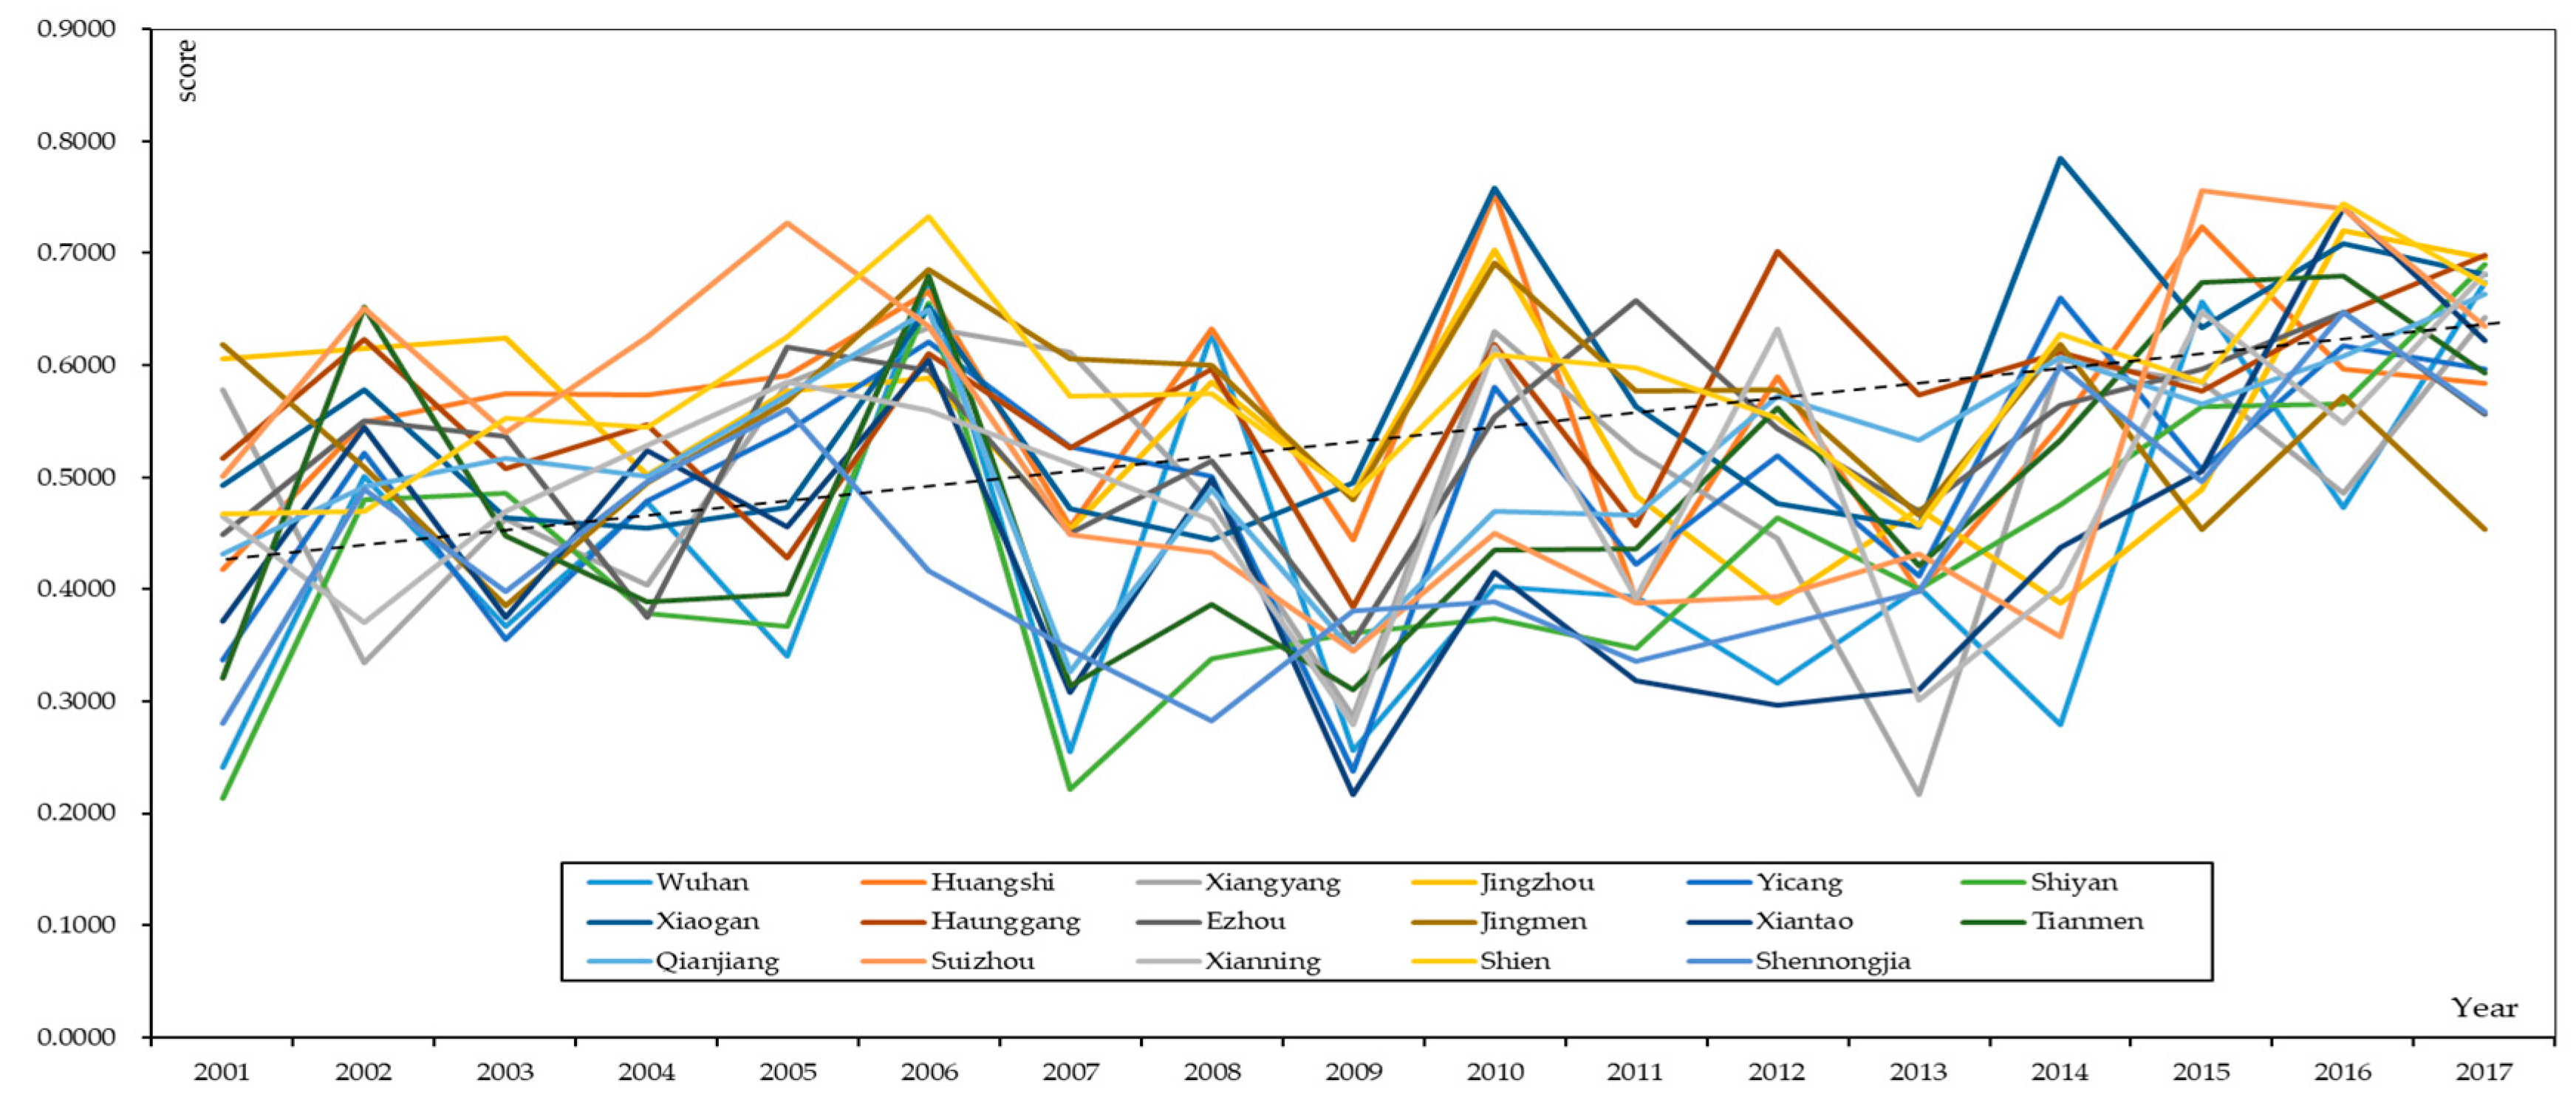
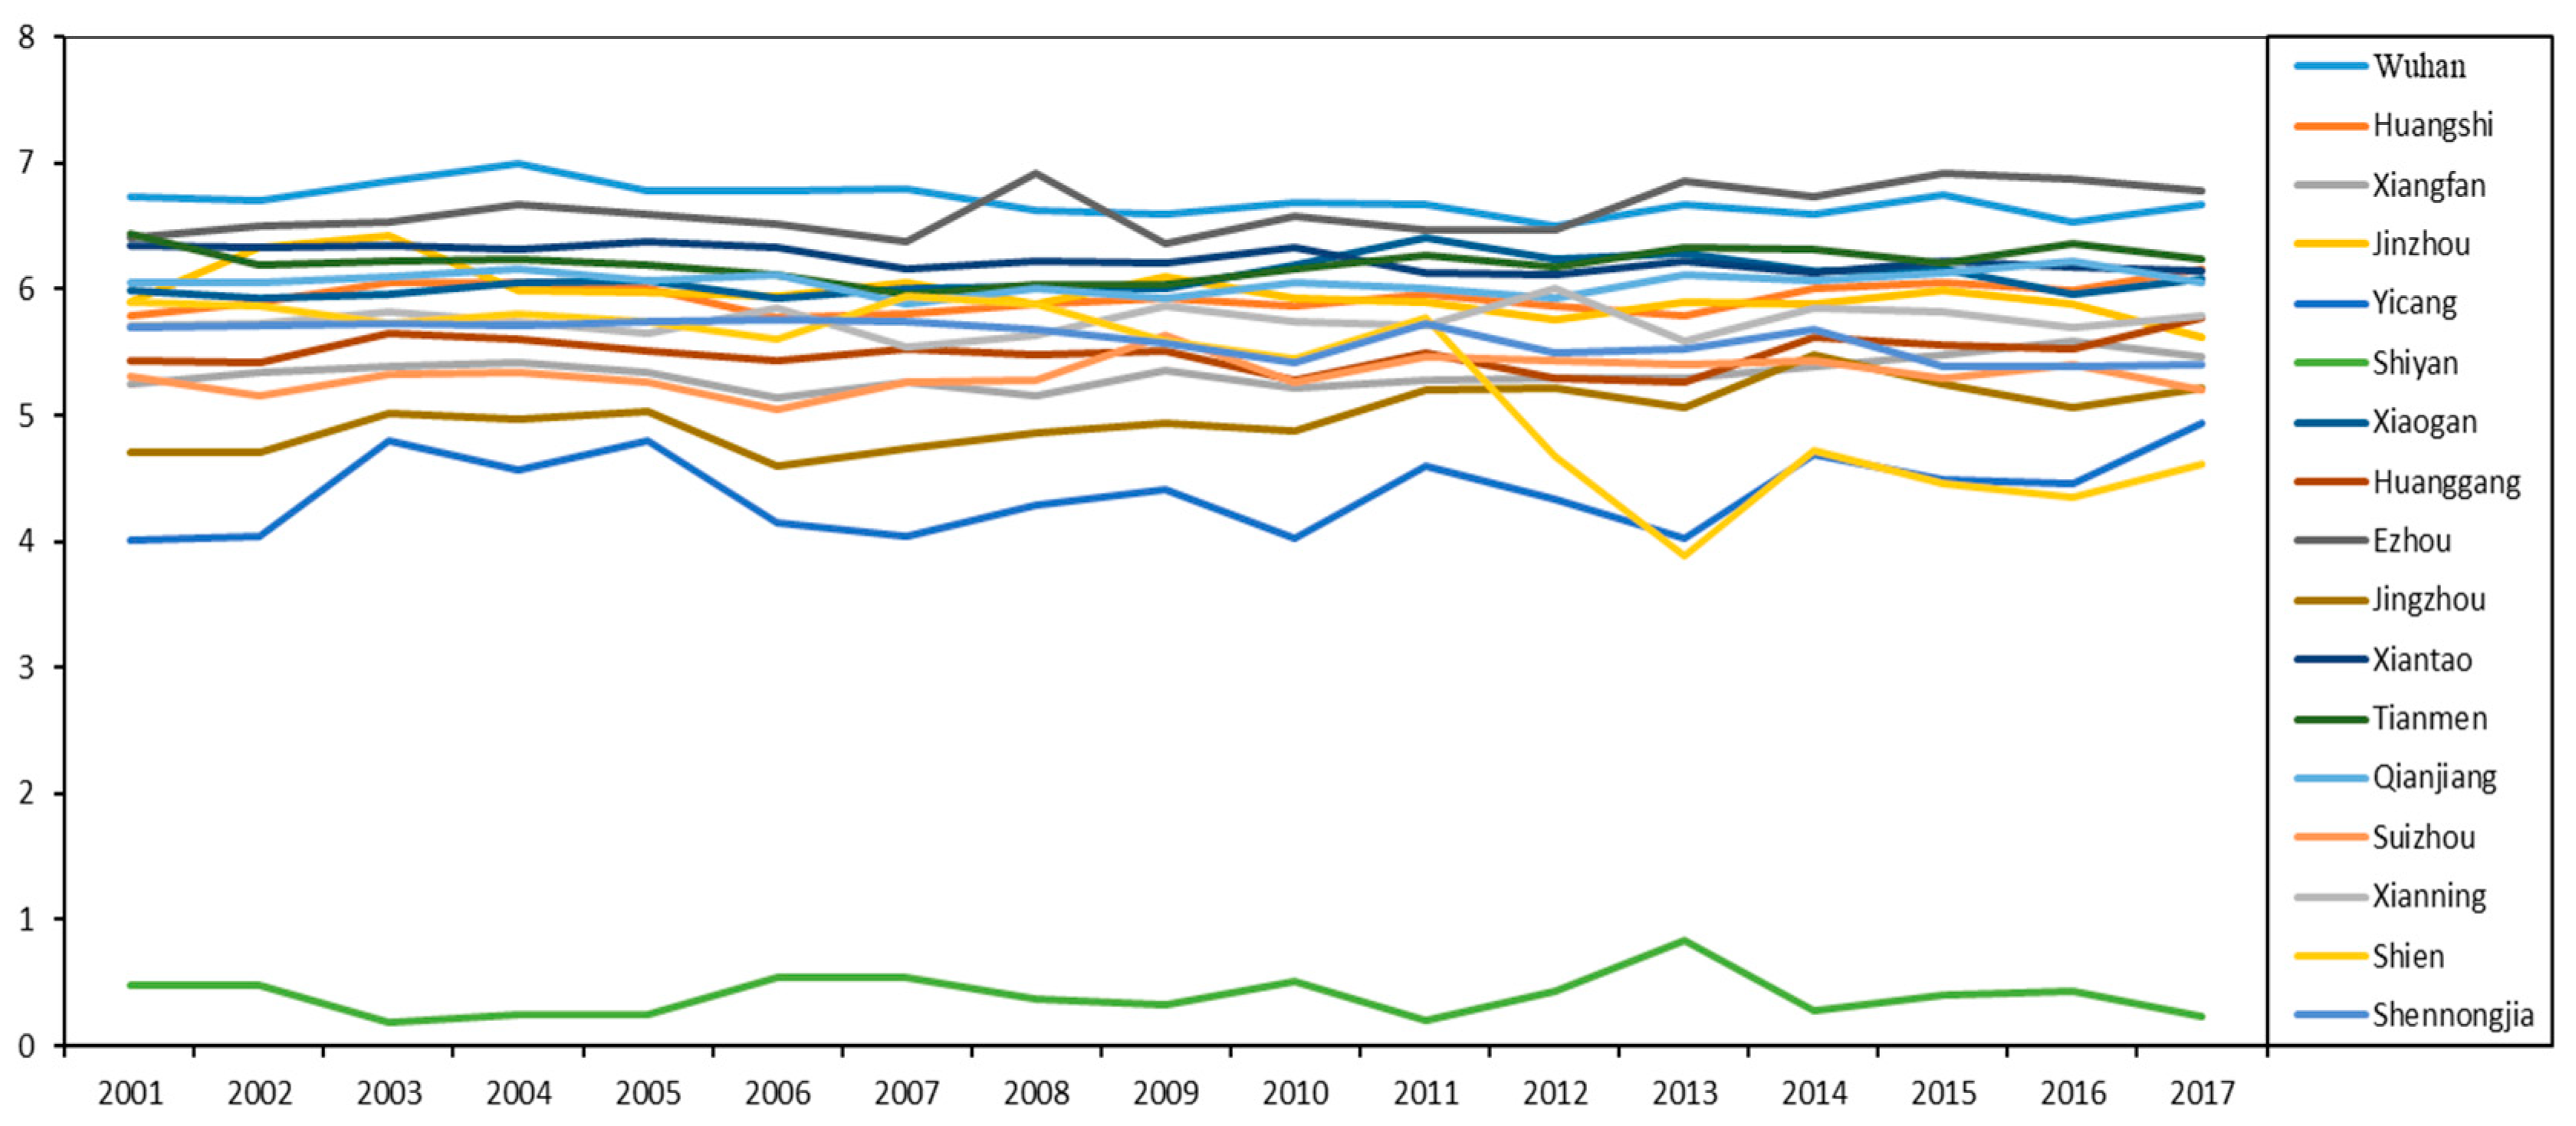
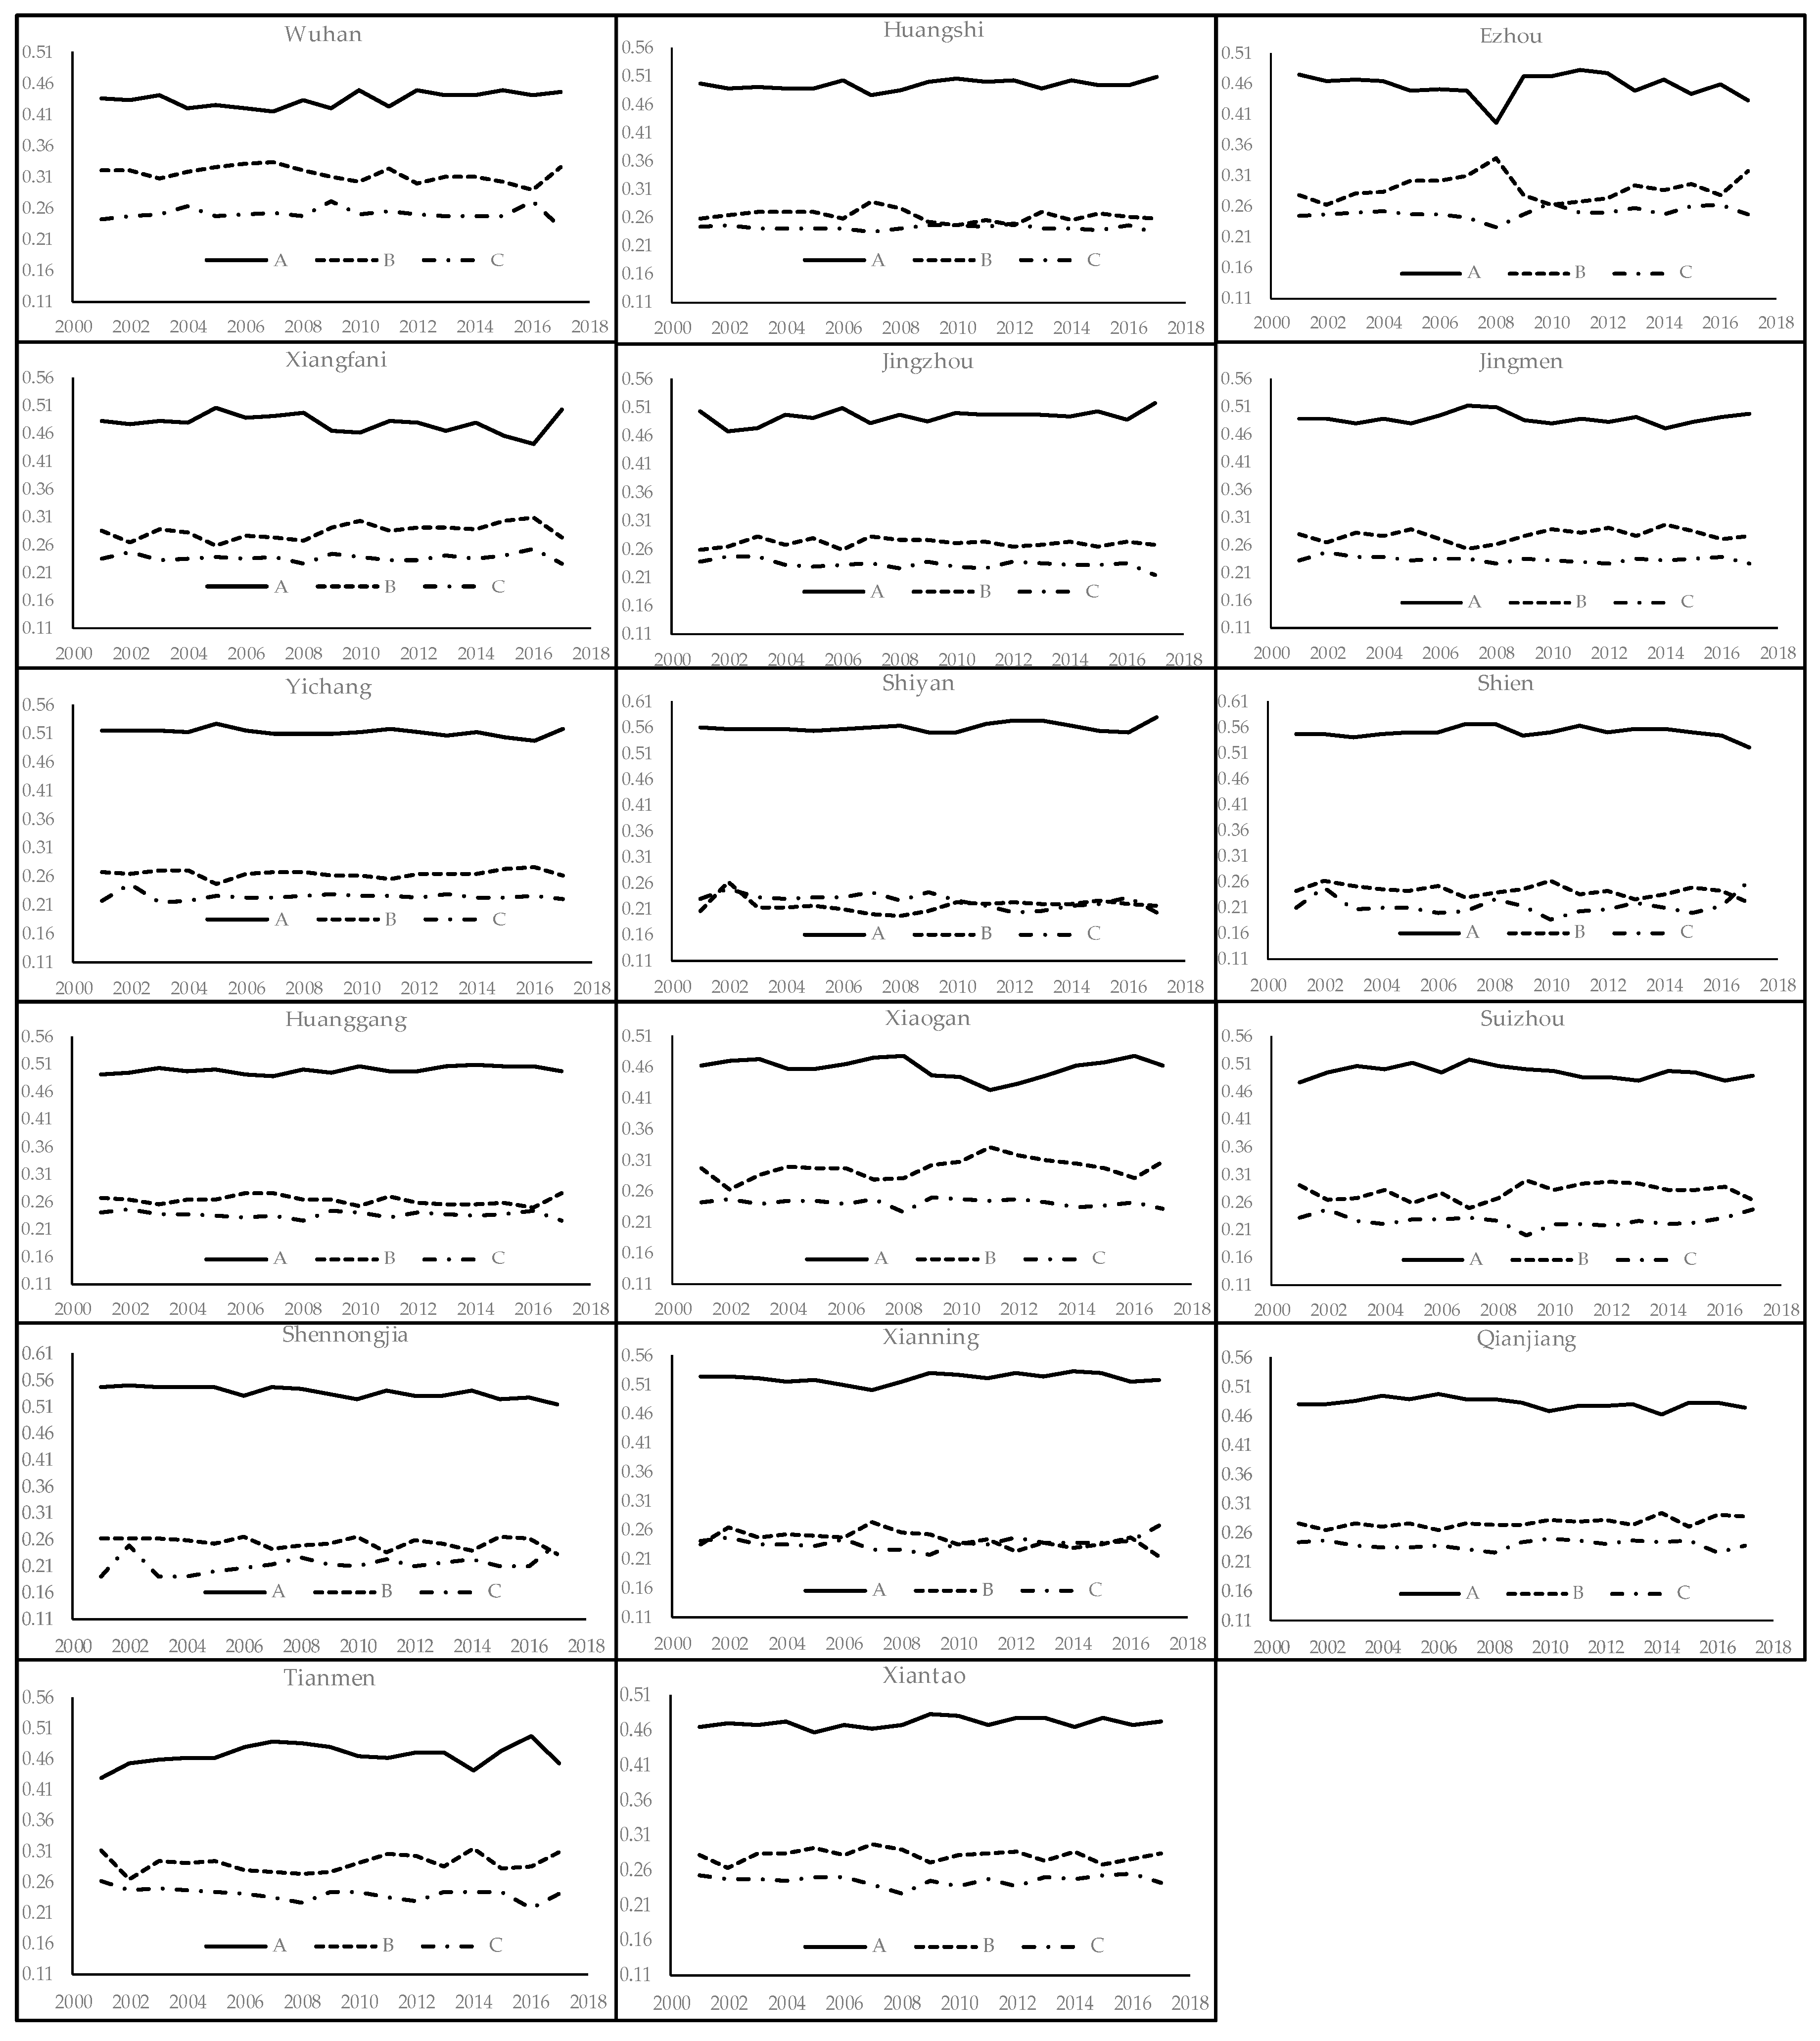
The water resources carrying capacity in Hubei province is generally developing steadily. The transformation of the water resources protection policy presented by the government in the beginning of the century (such as the State Council of China’s opinions on the implementation of strict water resource management systems), has been very effective. The Chinese society no longer trades in the environment for rapid economic development.
(4)
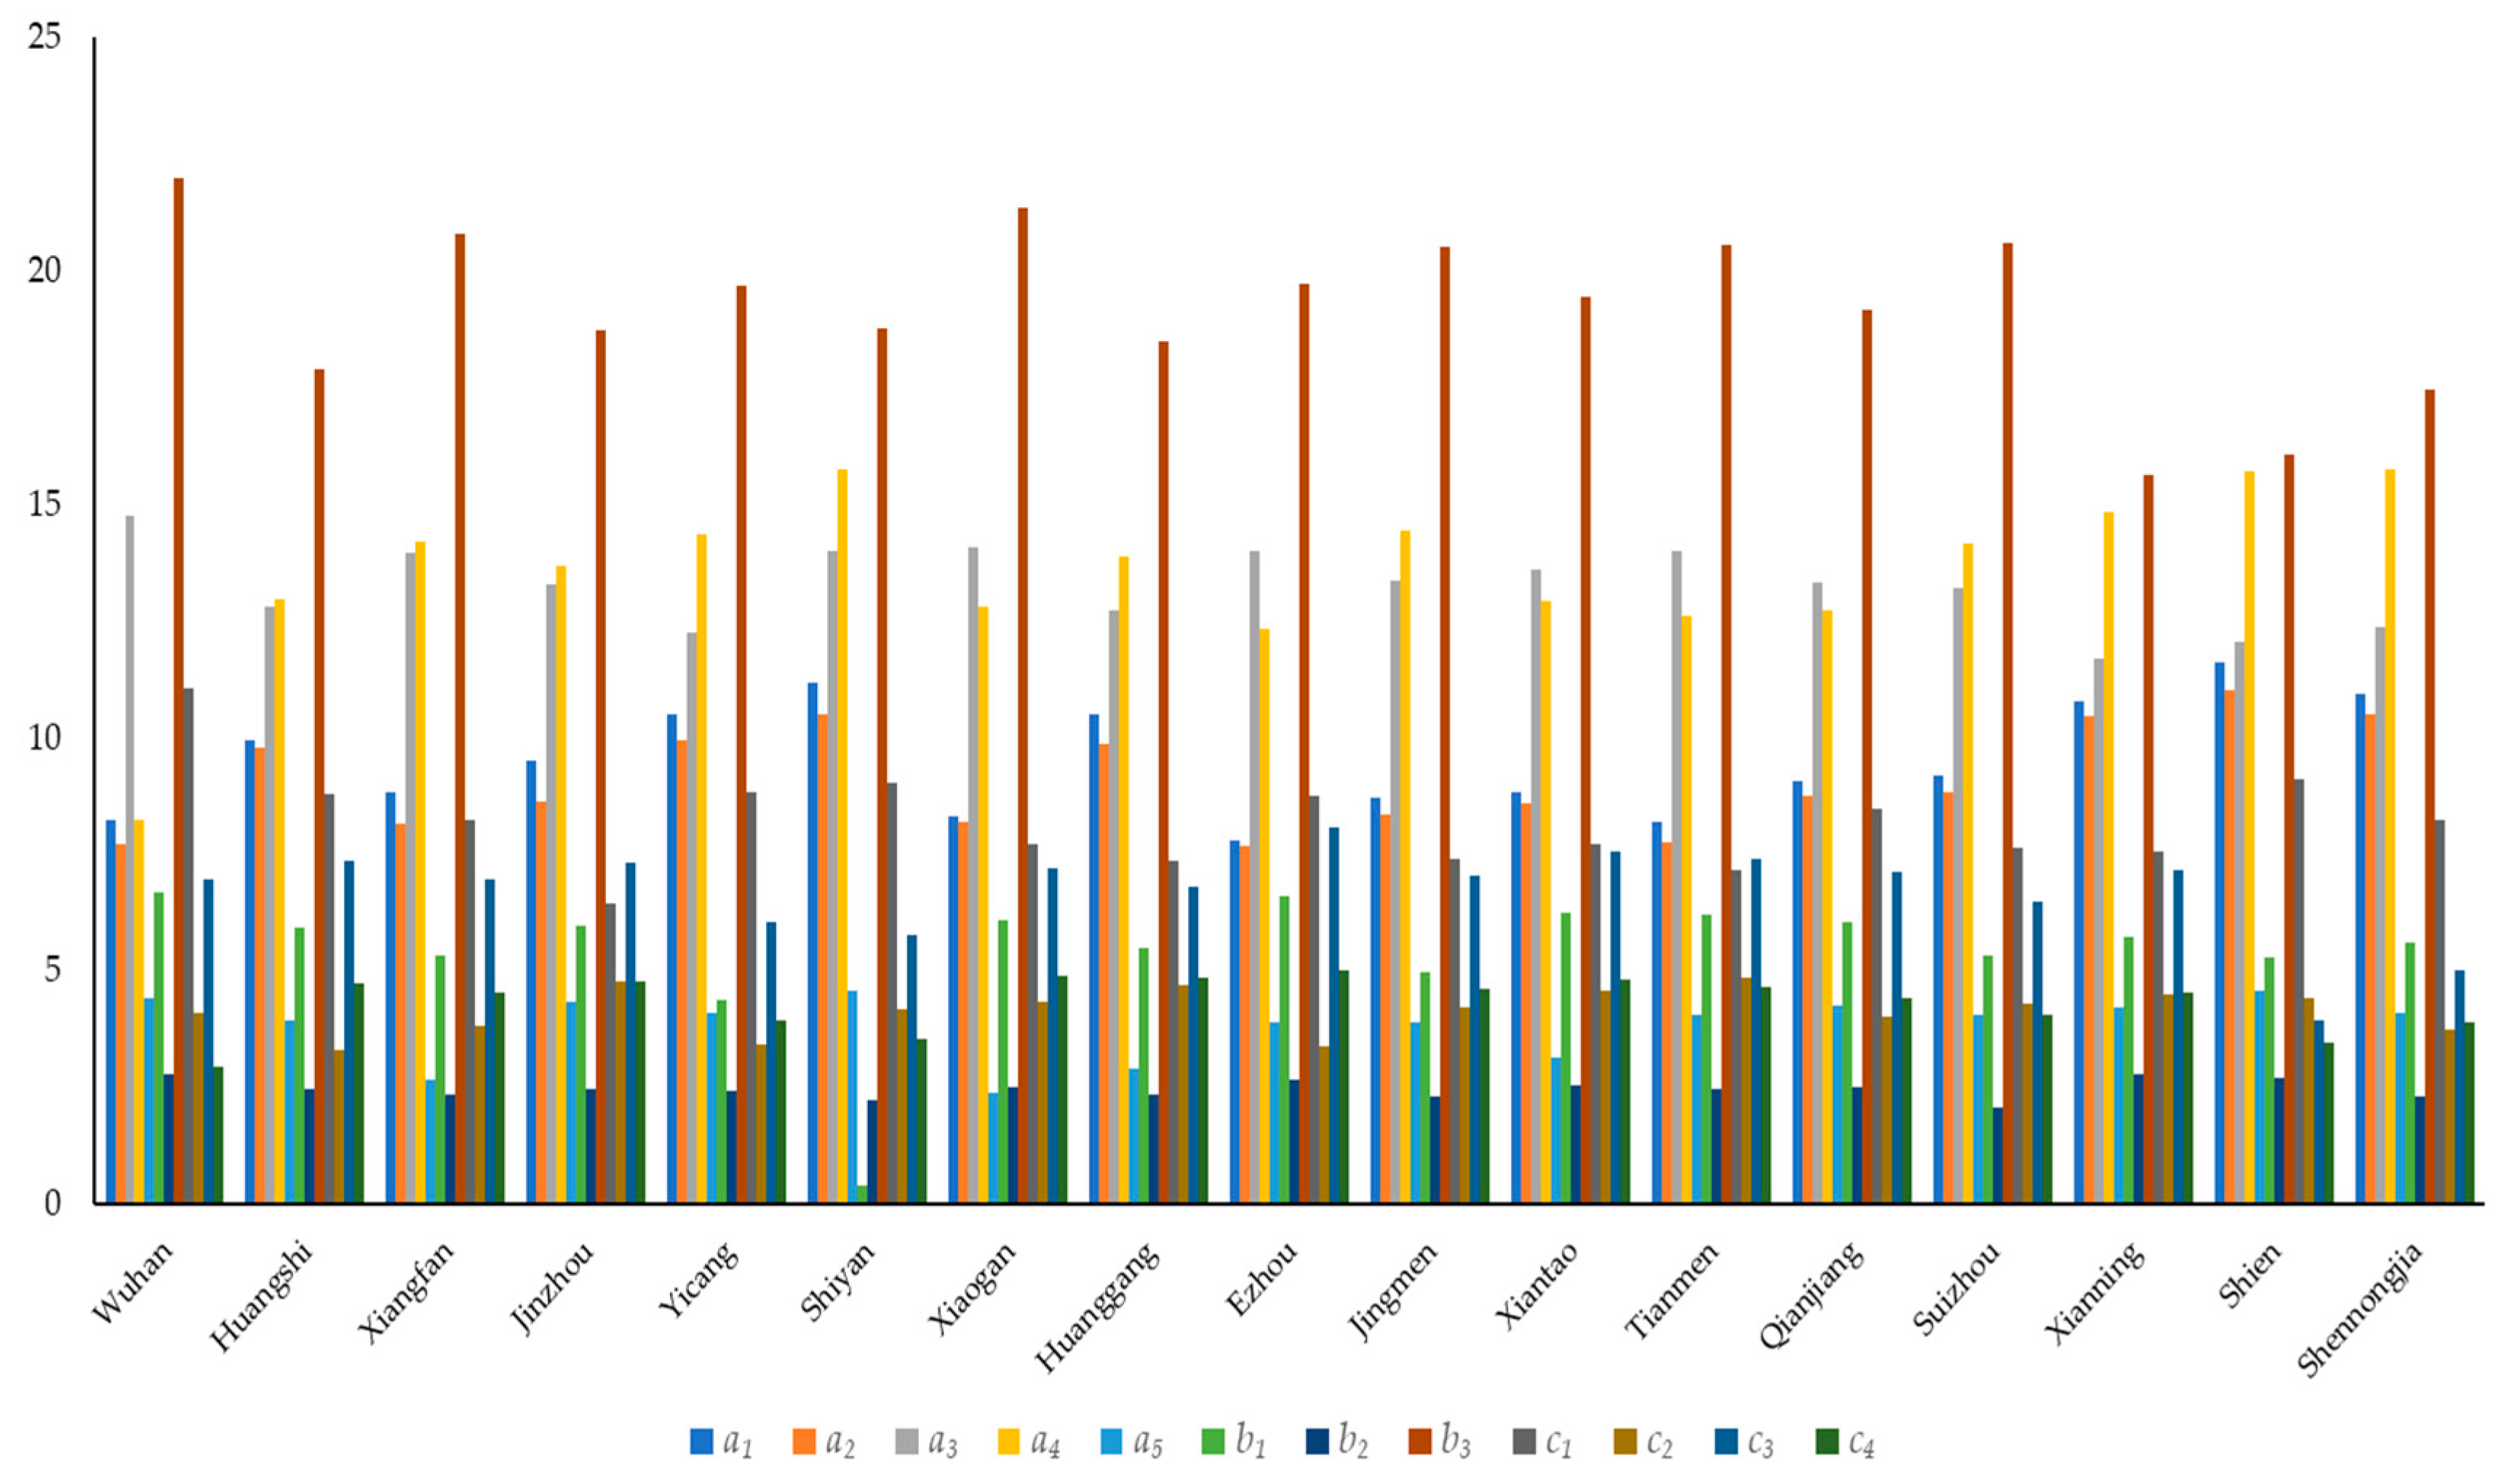
The amount of water per unit area is the main factor restricting the water resources carrying capacity of Hubei province. The obstacle degree has been high for many years, reaching 19.24%. Rainfall and population density are also important factors that restrict the carrying capacity of water resources. The average annual obstacle degree reached 13.27% and 13.62%. Furthermore, the obstacle degree of reservoir water storage capacity for water resources has been 5.44% for many years. According to the evaluation system proposed in this paper, this is at the intermediate level, indicating that reservoir water storage is also an important factor that cannot be ignored. Among the subsystems outlined in this paper, the natural resource system had the strongest inhibition on the water resources carrying capacity of Hubei province, indicating that the natural resources in Hubei province could not meet the needs of the rapid development of the socio-economic environment in the country; therefore, more efficient utilization measures are needed.
Finally, in the course of this research, we found that there were more interpretations and research methods for water resources carrying capacity. Other related research works currently being conducted by the author describe the high demand for water resources, such as ecology and hydropower generation. Coupling analysis of factors shows that water resources carrying capacity has a close relationship with other factors. Researchers from different countries in relevant fields could further explore the connotation of water resources carrying capacity for the future, thereby providing a better support basis for its stable and sustainable development (regional and global) through the diversification of bearing capacity.

Author Contributions

L.Z. identified the main points of the research work and wrote this paper. Y.B. and X.L. helped write the paper and collected large amounts of relevant data. T.Y. also helped collect the data. L.Y. provided some data.

Funding

This work was supported by the National Key R&D Program of China (2016YFC0402209), National Natural Science Foundation of China (No. 91647114, No.51979113, and NO. 91547208). The authors are thankful to the anonymous reviewers and editors for their constructive comments.

Conflicts of Interest

The authors declare no conflict of interest.

References

  1. Qin, G.; Li, H.; Wang, X.; Ding, J. Research on Water Resources Design Carrying Capacity. Water 2016, 8, 157. [Google Scholar] [CrossRef] [Green Version]
  2. Xu, Y.P. A study of comprehensive evaluation of the water resource carrying capacity in the arid area—A case study in the Hetian river basin of Xinjiang. J. Nat. Resour. 1993, 3, 229–237. [Google Scholar]
  3. Berger, A.R.; Hodge, R.A. Natural Change in the Environment: A Challenge to the Pressure-State-Response Concept. Soc. Indic. Res. 1998, 44, 255–265. [Google Scholar] [CrossRef]
  4. Zhang, J.; Zhang, C.; Shi, W.; Fu, Y. Quantitative evaluation and optimized utilization of water resources-water environment carrying capacity based on nature-based solutions. J. Hydrol. 2019, 568, 96–107. [Google Scholar] [CrossRef]
  5. Cheng, K.; Fu, Q.; Meng, J.; Li, T.X.; Pei, W. Analysis of the spatial variation and identification of factors affecting the water resources carrying capacity based on the cloud model. Water Resour. Manag. 2018, 32, 2767–2781. [Google Scholar] [CrossRef]
  6. Ren, C.; Guo, P.; Li, M.; Li, R. An innovative method for water resources carrying capacity research—Metabolic theory of regional water resources. J. Environ. Manag. 2016, 167, 139–146. [Google Scholar] [CrossRef]
  7. Wang, C.; Hou, Y.; Xue, Y. Water resources carrying capacity of wetlands in Beijing: Analysis of policy optimization for urban wetland water resources management. J. Clean. Prod. 2017, 161, 1180–1191. [Google Scholar] [CrossRef]
  8. Song, X.M.; Kong, F.Z.; Zhan, C.S. Assessment of Water Resources Carrying Capacity in Tianjin City of China. Water Resour. Manag. 2011, 25, 857–873. [Google Scholar] [CrossRef]
  9. Kijewska, K.; Torbacki, W.; Iwan, S. Application of AHP and DEMATEL Methods in Choosing and Analysing the Measures for the Distribution of Goods in Szczecin Region. Sustainability 2018, 10, 2365. [Google Scholar] [CrossRef] [Green Version]
  10. Govindan, K.; Kannan, D.; Shankar, K.M. Evaluating the drivers of corporate social responsibility in the mining industry with multi-criteria approach: A multi-stakeholder perspective. J. Clean. Prod. 2014, 84, 214–232. [Google Scholar] [CrossRef]
  11. Saaty, T.L. Fundamentals of Decision Making and Priority Theory with the Analytic Hierarchy Process; RWS Publications: Pittsburgh, PA, USA, 2000. [Google Scholar]
  12. Wang, G.; Xu, C.; Li, D. Generic normal cloud model. Inf. Sci. 2014, 280, 1–15. [Google Scholar] [CrossRef]
  13. Gupta, H.; Barua, M.K. A grey DEMATEL-based approach for modeling enablers of green innovation in manufacturing organizations. Environ. Sci. Pollut. Res. 2018, 25, 9556–9578. [Google Scholar] [CrossRef] [PubMed]
  14. Lee, H.S.; Tzeng, G.H.; Yeih, W. Revised DEMATEL: Resolving the infeasibility of DEMATEL. Appl. Math. Model. 2013, 37, 6746–6757. [Google Scholar] [CrossRef]
  15. Cui, Y.; Feng, P.; Jin, J.; Liu, L. Water resources carrying capacity evaluation and diagnosis based on set pair analysis and improved the entropy weight method. Entropy 2018, 20, 359. [Google Scholar] [CrossRef] [Green Version]
  16. Zhou, X.; Lei, G.; Xu, S. An Evaluation of Urban Land Use Performance and Diagnosis of Its Obstacle Degree—A Case Study of Harbin City. Res. Soil Water Conserv. 2012, 2, 126–130. [Google Scholar]
  17. Guo, M.; Bu, Y.; Cheng, J.; Jiang, Z. Natural Gas Security in China: A Simulation of Evolutionary Trajectory and Obstacle Degree Analysis. Sustainability 2018, 11, 96. [Google Scholar] [CrossRef] [Green Version]
  18. Wanders, N.; Wada, Y. Human and climate impacts on the 21st century hydrological drought. J. Hydrol. 2015, 526, 208–220. [Google Scholar] [CrossRef]
  19. Wang, M.; Du, L.; Ke, Y. Impact of Climate Variabilities and Human Activities on Surface Water Extents in Reservoirs of Yongding River Basin, China, from 1985 to 2016 Based on Landsat Observations and Time Series Analysis. Remote Sens. 2019, 11, 560. [Google Scholar] [CrossRef] [Green Version]
  20. Liu, Y.; Qin, H.; Mo, L.; Wang, Y.; Chen, D.; Pang, S.; Yin, X. Hierarchical flood operation rules optimization using multi-objective cultured evolutionary algorithm based on decomposition. Water Resour. Manag. 2019, 33, 337–354. [Google Scholar] [CrossRef]
  21. Balzannikov, M.I.; Vyshkin, E.G. Hydroelectric power plants reservoirs and their impact on the environment. In Proceedings of the 8-th International Scientific and Practical Conference, Rezekne, Latvia, 20–22 June 2011; Volume 1, pp. 171–174. [Google Scholar]
  22. Degu, A.M.; Hossain, F.; Niyogi, D.; Pielke Sr, R.; Shepherd, J.M.; Voisin, N.; Chronis, T. The influence of large dams on surrounding climate and precipitation patterns. Geophys. Res. Lett. 2011, 38. [Google Scholar] [CrossRef]
  23. Zhang, Q.; Lou, Z. The environmental changes and mitigation actions in the Three Gorges Reservoir region, China. Environ. Sci. Policy 2011, 14, 1132–1138. [Google Scholar] [CrossRef]
  24. Stone, R. Three Gorges Dam: Into the Unknown. Science 2008, 321, 628–632. [Google Scholar] [CrossRef] [PubMed]
  25. Liu, Y.; Ye, L.; Qin, H.; Hong, X.; Ye, J.; Yin, X. Monthly streamflow forecasting based on Hidden Markov Model and Gaussian Mixture Regression. J. Hydrol. 2018, 561, 146–159. [Google Scholar] [CrossRef]
Figure 1. Schematic representation of the Hubei province river.
Water 11 02573 g001
Figure 2. Flow chart.
Water 11 02573 g002
Figure 3. Index calculation.
Water 11 02573 g003
Figure 4. Results of changes in water resources carrying capacity.
Water 11 02573 g004
Figure 5. Degree of obstacles of reservoir water storage.
Water 11 02573 g005
Figure 6. Multi-year averages of the obstacle degree in each region.
Water 11 02573 g006
Figure 7. Obstacle degree of the subsystems affecting regional water resources carrying capacity.
Water 11 02573 g007
Table 1. Evaluation index classification table.
SystemIndicators
Resource system (A)Water resource utilization rate a 1 (%)
Surface water utilization a 2 (%)
Precipitation a 3 (mm)
Population density a 4 (person/km2)
Groundwater utilization rate a 5 (%)
Water quantity and efficiency system (B)Storage of reservoir b 1 (108 m3)
Average water consumption per mu of farmland b 2 (m3)
Water resources per unit area b 3 (m3/km2)
Socio-economic system (C)10,000 yuan of GDP water consumption   c 1 (m3)
Industrial water consumption c 2 (%)
Domestic water consumption c 3 (%)
Ecological water consumption c 4 (%)
Table 2. The proportion of reservoir water storage from total water resources (%).
WuhanHuangshiXiangfanJinzhouYicangShiyanXiaoganHuanggangEzhouJingzhouXiantaoTianmenQianjiangSuizhouXianningShienShennongjia
20014.9135.5927.054.5933.10194.877.0613.590.3381.0070.589.651.11
20025.4123.8621.302.2320.33160.038.248.070.2655.6526.786.021.07
20035.4522.3320.6219318.51156.478.357.550.2552.4324.645.531.06
20047.2627.7422.863.8827.94201.1913.2811.660.3653.1445.708.781.09
200510.7629.8117.493.7829.14115.5913.7514.320.7982.0432.3313.722.91
20069.1236.3728.233.6231.96163.6818.0816.580.5668.6865.2811.714.59
20079.0341.1519.854.5126.09160.909.0514.790.5335.7821.4514.422.710.29
200810.4437.5524.464.6626.82214.838.8415.140.5642.5830.7511.823.270.85
20097.2827.1229.484.1729.64159.7723.5214.700.3559.2041.519.954.221.07
20105.2620.9833.182.9530.20116.649.4710.520.1056.8031.617.035.150.88
201110.6529.4440.025.3142.99209.6014.8720.160.3166.6462.9612.305.851.13
20128.8436.4734.265.3938.40222.029.0017.750.2870.1362.159.9621.450.56
20139.2735.1233.675.4834.74191.966.9317.570.2243.6046.5311.4126.670.55
20149.8032.5537.826.6439.74279.338.0416.210.4666.2732.0111.0827.840.90
20157.1128.6340.263.5137.03285.297.7013.650.3146.1744.308.1529.001.17
20164.3822.1433.343.1023.56297.476.309.700.1331.3015.7330.226.8620.470.39
20179.9826.8023.764.6525.79225.5414.4715.690.5452.8724.5035.095.9021.910.69
Table 3. Index calculation.
x i y i β i r i
a 1 1.49952.20623.7057−0.7067
a 2 1.56671.83313.3998−0.2664
a 3 1.93220.19962.13181.7326
a 4 1.22812.14623.3743−0.9181
a 5 1.04161.60912.6507−0.5675
b 1 1.34830.39641.74470.9519
b 2 1.29150.57591.86740.7156
b 3 1.23881.69272.9315−0.4539
c 1 0.62961.38122.0108−0.7516
c 2 0.90950.74471.65420.1648
c 3 1.36151.29182.65330.0697
c 4 1.04331.01372.05700.0296
Table 4. System classification standard table.
IndicatorsExtremely DangerousDangerousNormalSafeVery Safe
Water resource utilization rate a 1 (%)>9060–9050–6040–50<40
Surface water utilization a 2 (%)>8060–8045–6045–30<30
Precipitation a 3 (mm)<8888–607607–11261126–1607>2087
Population density a 4 (person/km2)>600500–600200–600100–200<10
Groundwater utilization rate a 5 (%)>8560–8550–6030–60<30
Storage of reservoir b 1 (108 m3)<33–1010–2020–30>30
water consumption per mu of farmland b 2 (m3)>500450–350250–350250–150>150
Water resources per unit area b 3 (m3/km2)<310,000310,000–545,000545,000–740,000740,000–890,000>890,000
10,000 yuan of GDP water consumption c 1 (m3)>500500–400400–300300–200200–100
Industrial water consumption c 2 (%)>6045–6035–4525–35<25
Domestic water consumption c 3 (%)>2520–2515–2010–15>5
Ecological water consumption c 3 (%)>5050–4030–2020–10>10

