Hydrological Drought Regimes of the Huai River Basin, China: Probabilistic Behavior, Causes and Implications


1
Anhui Province Key Laboratory of Water Conservancy and Water Resources, Anhui and Huaihe River Institute of Hydraulic Research, Bengbu 233000, China
2
School of Geography and Tourism, Anhui Normal University, Wuhu 241002, China
3
Key Laboratory of Environmental Change and Natural Hazard, Ministry of Education, Beijing Normal University, Beijing 100875, China
4
State Key Laboratory of Surface Process and Ecology Resource, Beijing Normal University, Beijing 100875, China
5
Faculty of Geographical Science, Academy of Disaster Reduction and Emergency Management, Beijing Normal University, Beijing 100875, China
6
Key Laboratory of Virtual Geographic Environment for the Ministry of Education, Nanjing Normal University, Nanjing 210023, China
7
State Key Laboratory of Simulation and Regulation of Water Cycle in River Basin, China Institute of Water Resources and Hydropower Research, Beijing 100038, China
*
Authors to whom correspondence should be addressed.
Water 2019, 11(11), 2390; https://doi.org/10.3390/w11112390
Submission received: 28 August 2019
/
Revised: 29 October 2019
/
Accepted: 9 November 2019
/
Published: 14 November 2019
(This article belongs to the Section Hydrology)
Abstract
:Hydrological droughts were characterized using the run-length theory and the AIC (Akaike information criterion) techniques were accepted to evaluate the modeling performance of nine probability functions. In addition, the copula functions were used to describe joint probability behaviors of drought duration and drought severity for the major tributaries of the Huai River Basin (HRB) which is located in the transitional zone between humid and semi-humid climates. The results indicated that: (1) the frequency of hydrological droughts in the upper HRB is higher than that in the central HRB, while the duration of the hydrological drought is in reverse spatial pattern. The drought frequency across the Shiguan River along the south bank of the HRB is higher than the other two tributaries; (2) generalized Pareto distribution is the appropriate distribution function with the best performance in modelling the drought duration over the HRB; while the Generalized Extreme Value (GEV) distribution can effectively describe the probabilistic properties of the drought severity. Joe copula and Tawn copula functions are the best choices and were used in this study. Given return periods of droughts of <30 years, the droughts in the upper HRB are the longest, and the shortest are in the central HRB; (3) the frequency of droughts along the mainstream of the HRB is higher than tributaries of the HRB. However, concurrence probability of droughts along the mainstream of the HRB is lower than the tributaries of the HRB. The drought resistance capacity of HRB has been significantly improved, effectively reducing the impact of hydrological drought on crops after 2010.
1. Introduction
According to the IPCC (Intergovernmental Panel on Climate Change) report, with climate change and human activities, climate extreme events such as droughts and floods are a significantly increasing trend [1,2,3]. Drought is the below-average water storage conditions for a prolonged period in a given basin [4,5]. Droughts include meteorological droughts, hydrological droughts, agriculture droughts, and socio-economic droughts. Great importance is attached to hydrological drought due to its tremendous impact on human society [6,7]. In general, scholars usually focus on droughts that are related to economic losses and dramatic hazards. Severe droughts have occurred in seven major river basins of China in the past few decades [8,9,10]. Due to global warming and intensifying human activities, hydrological drought events have significantly increased all over the world, which will pose a threat to ecosystems, agriculture development, and local socio-economic development [11,12,13]. Hydrological drought events were characterized by duration, severity and drought area, and multi-dimensional hazardous phenomena [14,15]. If the individual drought characterization was analyzed, drought, in reality, cannot be revealed the serious consequence of drought in reality [16,17].
The Huai River Basin (HRB) plays an important role in agricultural development in China. The HRB provides 20% of the total agricultural products with 10% of the total cropland of China, feeding 20.4% of the total population [18]. Therefore, agricultural development in the HRB is important to the food security of China. However, the basin is located in the transitional zone between humid and semi-humid climates. Increased drought frequency had affected agriculture development. Hence, a lot of researches focused on hydrological extremes in the HRB. Previous researches had concentrated on the spatiotemporal patterns of precipitation and streamflow extremes [19], abrupt change of streamflow, long-term monotonic trend, related periodicity properties of streamflow variations, and so on [18,20].
Sun et al. (2018) showed that decreased streamflow could be observed in the HRB, with significantly decreased streamflow detected during April and May, which was likely the results of precipitation change and increased irrigation demand [18]. Yan et al. (2014) analyzed the daily precipitation and showed that the precipitation of most months in drought years was reduced, therefore the relevant strategies (“annual basin-wide of long-term drought prevention”) should be carried out [21]. Shi et al. (2014) showed that the reservoir regulations had apparently altered the monthly and seasonal streamflow in the upper HRB. The decreasing trend of the annual streamflow was found, and human activities were proven to be the dominant driving factor behind the decreasing annual streamflow [22]. Wu et al. (2017) showed that seasonal alternation of droughts and flood events most probably occurred near the mainstream of the HRB, and drought and flood events were more likely to occur in summer-autumn than in spring-summer time intervals [23]. Ji et al. (2017) analyzed the drought/flood disasters for the sudden alternations in the HRB [24]. Wen et al. (2018) estimated soil moisture with various drought indices in the HRB of East China using the MODIS (Moderate Resolution Imaging Spectroradiometer) data [25]. Geng et al. (2017) simulated maize yield losses caused by drought stress using the DSSAT-CERES-Maize (Decision Support System for Agrotechnology Transfer-Crop Environment Resource Syntheses- Maize) model and found a higher risk of high loss percentage in southern China, with a higher risk of low-mid loss percentage in northeastern China, and a higher risk of mid-high loss percentage in western China [26].
However, most reports focused on the meteorological drought such as SPI (Standardized Precipitation Index), SPEI (Standardized Precipitation Evapotranspiration Index), and so on. Relatively few reports were available addressing the hydrological drought in the HRB. Hydrological droughts of the HRB are important for water resource and agricultural irrigation management. In this study, the daily streamflow at seven stations was collected, and hydrological droughts were identified using the run-length theory, and the AIC was accepted to evaluate the best fitting of the nine probability functions. The multivariate analysis methods, 26 copula functions, were used in this study with the aim of investigating joint probability behaviors of drought severity and drought duration. Therefore, the objectives of this study are to analyze the probability behaviors of hydrological droughts over the HRB. Then, the joint probability of drought severity and drought duration in the HRB were quantified using the best fitting Copula. Finally, possible reasons of hydrological droughts were discussed and explored.
2. Study Region and the Data
The HRB, one of the seven largest rivers in China, is located in the humid and semi-humid monsoon climate region of eastern China (Figure 1). The HRB is also an important energy source and commodity grain base in China [18,27]. The population density of 662 persons per km2 is the highest out of the seven largest rivers in China [17]. Particularly, the precipitation period, influenced by the East Asian monsoon, is mainly between May and September in the HRB. The unique climate has caused natural disasters such as floods, waterlogging, and drought [28,29].
The daily streamflow series from 1964 to 2016 at seven hydrological stations (Xixian, Wangjiaba, Lutaizi, Bengbu, Bantai, Jiangjiaji, and Fuyang) were selected to identify hydrological drought events in the HRB (Table 1). These data were obtained from the Water Resources Research Institute of Anhui Province and Huai River China. Land use data were sourced from Resources and Environmental Data Cloud Platform, Chinese Academy of Sciences (RESDC) [30], and the dataset comprised a series of land use from 2000, 2005, and 2010–2015. The data were extracted from Landsat TM, ETM+, and OLI remote sensing images and generated through artificial visual interpretation with a spatial resolution of 1 km. Land use types included six primary types (cultivated land, forest, grassland, water bodies, artificial surfaces, and unused land) and 25 secondary types.
3. Methods
The identification of droughts is a prerequisite for drought character. Based on the daily streamflow, the drought event is mainly identified, which includes drought duration and drought severity, and the marginal distributions of drought duration and severity are subsequently evaluated, respectively. Finally, the joint probability of the two marginal distributions is constructed by the copula functions with the best performance.
3.1. Identification of a Drought Event
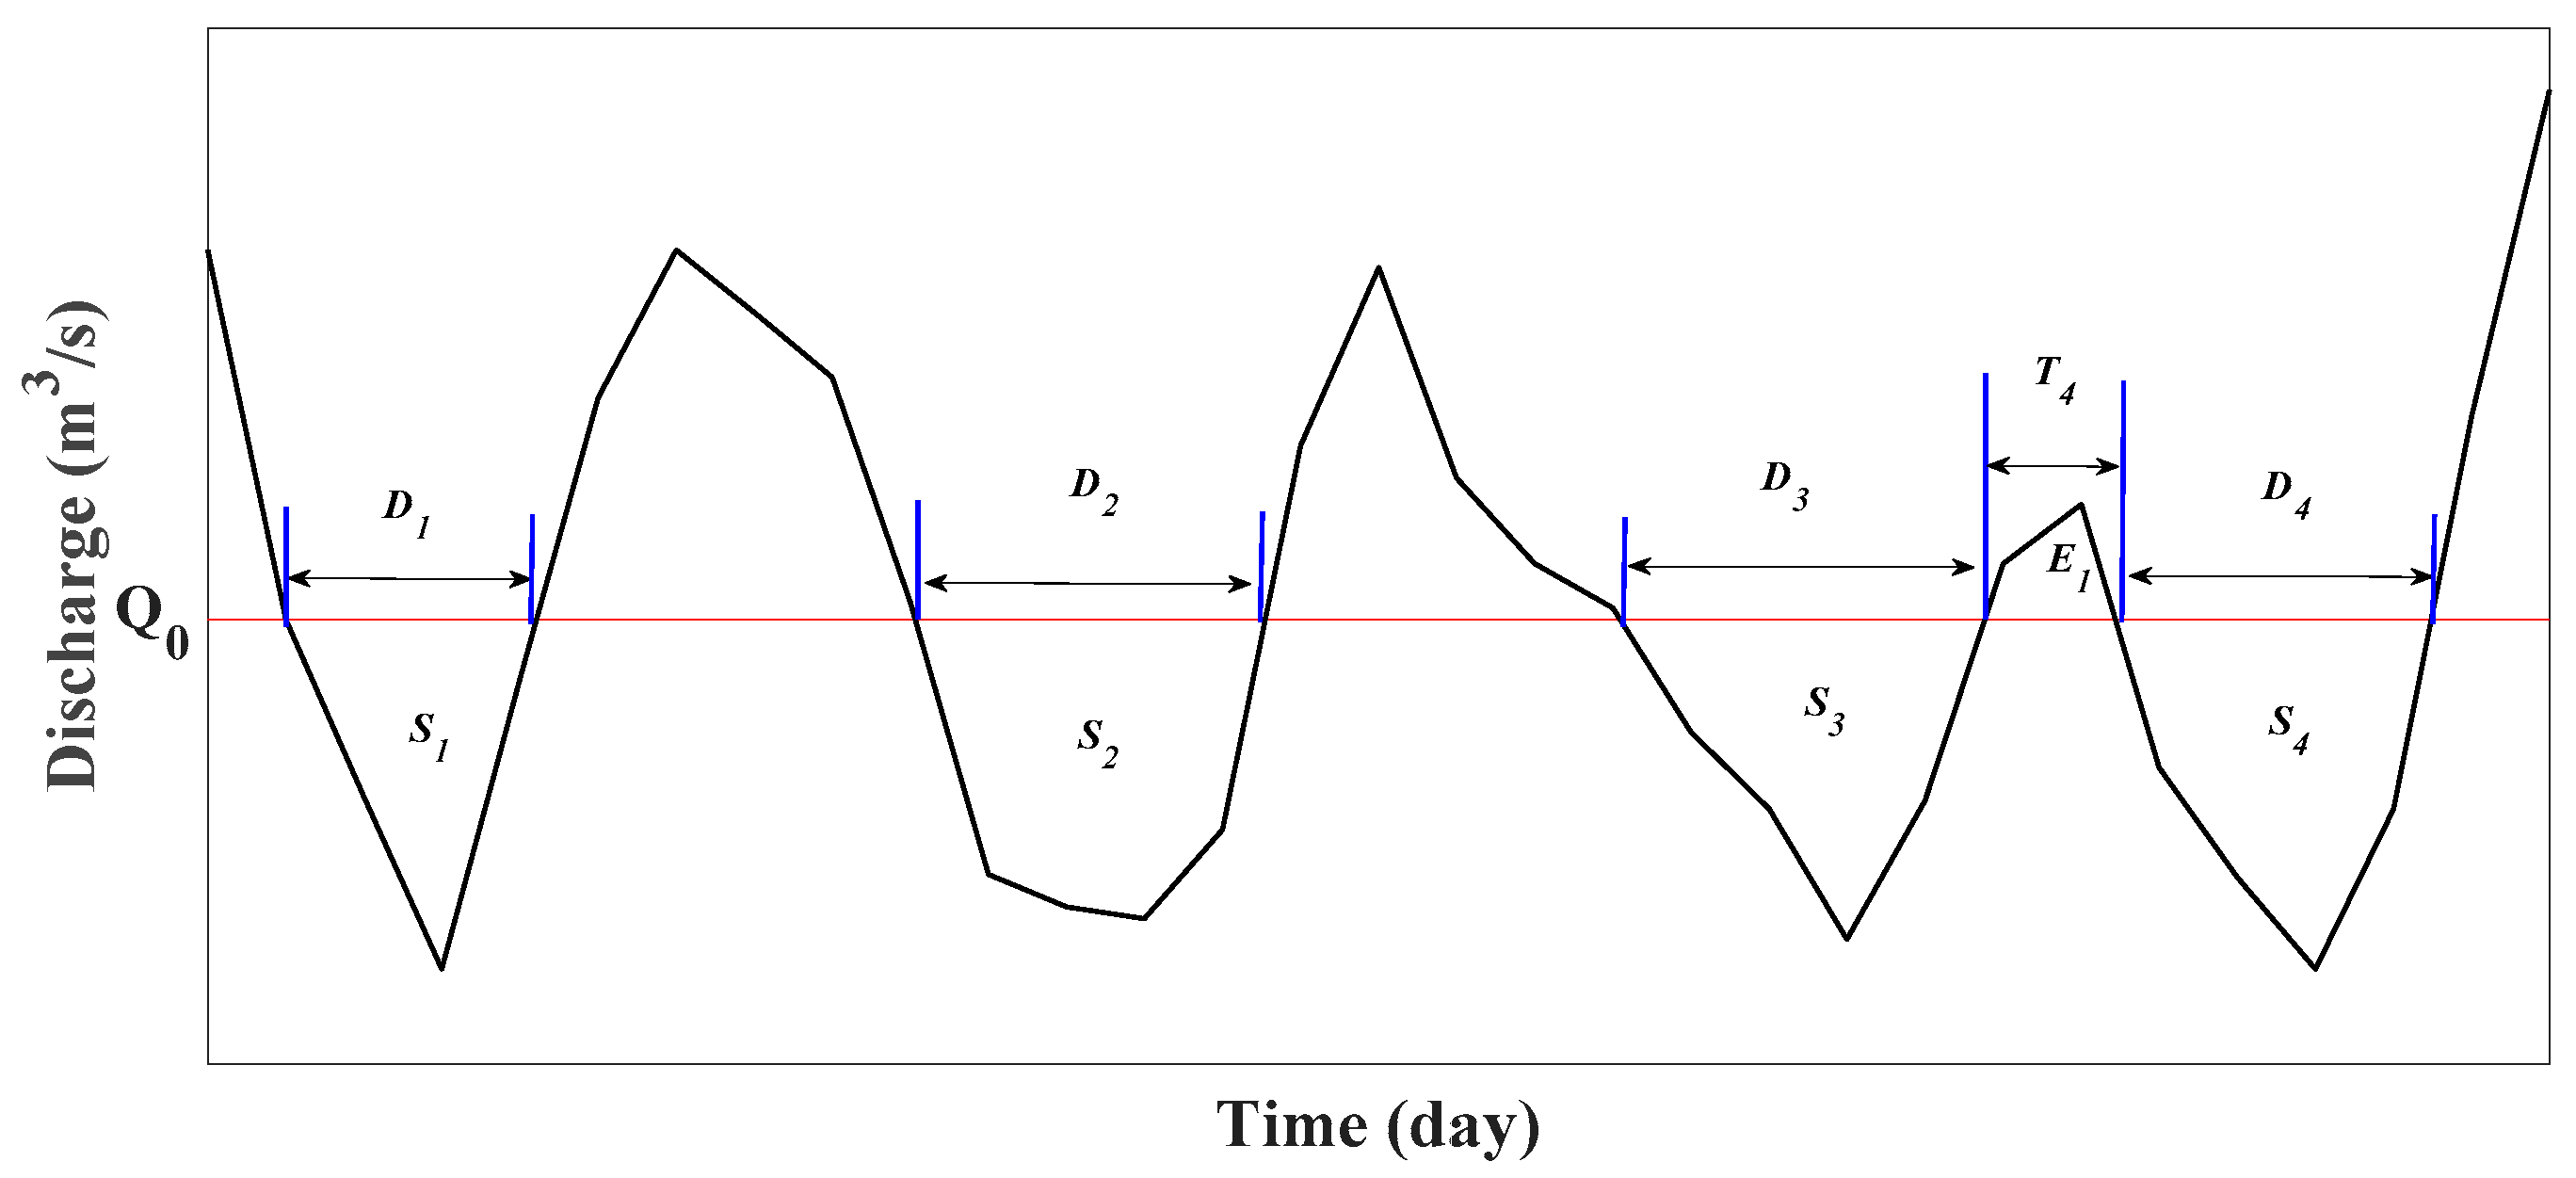
In this study, the duration and severity of hydrological droughts are defined by the threshold level method [31], i.e., a hydrological drought is defined as a period during which flow is below the specified threshold level. The drought duration (D) is the number of consecutive days for which streamflow is below the referenced discharge, and the drought severity (S) is the cumulative deficit of streamflow for that duration. The drought severity is also called the total deficit or the negative run sum [32]. When the threshold level is set to represent the boundary between normal and unusually low streamflow, it is chosen based on the characteristics of streamflow. In this case, low flow indices, such as percentiles from the flow duration curve (FDC), are frequently applied for both perennial and intermittent streams. For perennial streams, threshold levels between the 70-percentile flow (Q70) and the 95-percentile flow (Q95) from the FDC are frequently applied, which are the flows that are exceeded 70–95% of the time [33]. In this study, the threshold level Q0 was defined as the 75-percentile flow (Q75).
The threshold level method was developed for discharge series with a time resolution of one month or longer, but it has also been applied to daily discharge series [32,34]. When the temporal resolution is high in view of the droughts to be studied, a problem arises that has to be considered (see Figure 2). During a prolonged dry period, it is often observed that the hydrological determinant exceeds the truncation level in a short period of time, thus we subdivided a large drought into a number of minor dry spells that are mutually dependent. Thus, a consistent definition of drought events should include some kind of pooling in order to define an independent sequence of droughts. Tallaksen et al. (1997) introduced an inter-event time and volume-based criterion for the pooling of mutually dependent droughts [34]. The two dry spell periods with characteristics (D1, S1) and (D2, S2), respectively, are assumed to be mutually dependent, given:
- (a)
- the inter-event time Ti is less than a critical value Tc;
- (b)
- the ratio between the excess volume Ei and the preceding deficit volume is less than a critical value pc.
Then, the two dry spell periods are pooled into a single drought event with the characteristics as:
Statistical analysis of drought characteristics may be complicated by a large number of minor droughts that are usually present in the drought series. In this study, a more consistent approach, as suggested by Madsen and Rosbjerg (1995) was used [35]. It is based on predefined percentages, Rd and Rs, of the mean values E{D} and E{S} of duration and severity, respectively, i.e., droughts with duration less than Rd × E{D} or severity less than Rs × E{S} are excluded. Tallaksen et al. (1997) and Zhang et al. (2013) recommend that Rd = Rs = 0.3 [34,36]. As with d0, droughts with duration less than Rd × E{D} or severity less than Rs × E{S}, the drought day is still regarded as one drought event with D = d1 + d2 + d0.
3.2. Marginal Distribution
The probabilistic behavior of drought severity and drought duration are analyzed as follows: firstly, nine probability distribution functions, widely used in drought character analysis, are selected [15,27]; Secondly, nine probability distribution functions are fitted for the drought duration and drought characteristics in the HRB respectively. Meanwhile, parameters of nine probability distribution functions are estimated by the L-moment estimation [37]; Thirdly, the AIC is used to select the appropriate marginal distribution. The smaller the value of AIC values, the better appropriate marginal distribution fitting; Finally, the appropriate marginal distribution that described the probabilistic characteristics of drought severity and drought duration is selected for seven stations based on AIC values.
3.3. Joint Probability Distribution
The copula function, commonly used in hydrology such as drought and flood, can couple two or three marginal distributions to the multivariate joint probability distribution [28,38]. In previous studies, Archimedean copula family includes a range of copula functions and are easy to be constructed, the copula family has been widely used to analyze the joint probabilistic behavior of hydrological extremes [39,40]. In this study, 26 copula functions were used to analyze the joint probabilistic behavior of hydrological drought. Sadegh et al. (2017) found that only the Tawn and Marshall–Olkin copulas can allow for characterizing the asymmetric dependence structure of precipitation and soil moisture [41]. The Tawn copula performance is better than the Archimedean copula family. Therefore, in this study, we used 26 copula families to construct the joint distribution of drought severity and drought duration based on 26 copulas. Twenty-six copula families are selected and explained in detail in Table 2. We have selected copula families with simple closed-form mathematical formulation, which is amenable for model inference.
The copula function is used to construct the drought probability model with the following formula:
where Cθ(S, D) is the copula function combined with the drought severity Fs(s) and drought duration FD(d).
Two cases of drought risk probability should be calculated, as follows (Zhang et al. 2013):
Case 1: “and ()”:
Case 2: “or ()”:
3.4. Bayesian Analysis
The 26 Copula parameters can be estimated by Markov Chain Monte Carlo (MCMC) simulation within a Bayesian framework [42,43]. Bayesian analysis has been successfully employed in different fields [43,44,45], including hydrology [46,47,48], for model inference and uncertainty quantification purposes. Bayes’ theorem updates the prior probability (belief) of a certain hypothesis when new information is acquired. Bayes’ law conveniently attributes all modeling uncertainties to the parameters and estimates the posterior distribution of model parameters through
in which and signify prior and posterior distribution of parameters, respectively. denotes likelihood function, and is coined evidence. Evidence, being a constant value in each modeling practice, can be simply removed from the analysis if the main goal is to estimate the posterior distribution of parameters, and posterior parameter distributions can be estimated through
In the absence of useful information regarding the prior distribution of parameters, one may employ a flat uniform prior [49]. Assuming error residuals are uncorrelated, homoscedastic, and Gaussian-distributed with mean zero, the likelihood function can be formulated as [50]:
where is an estimate of standard deviation of measurement error. For simplicity and numerical stability, this equation is usually logarithmically transformed to
Given the underlying assumptions about error residuals, can be estimated as
We can, then, further simplify Equation (9) to
For comparison purposes, we can conveniently remove the constants and present log-likelihood function as,
Bayes’ Equation (7) is usually difficult, if not impossible, to solve analytical and numerical methods, such as MCMC simulation, are adopted to sample from the posterior distribution.
Further clarification is warranted here that we impose no assumption whatsoever on the posterior distribution of parameters. The aforementioned assumptions of “homoscedasticity, no correlation, and Gaussian distribution with mean zero” only apply to the distribution of error residuals which is used to construct the likelihood function that summarizes the distance between observations (empirical bivariate probability values) and model simulations (copula predicted bivariate probability values) into a single scalar.
Markov Chain Monte Carlo (MCMC) algorithms are a class of statistical methods to sample from high-dimensional complex distributions [51]. The equilibrium state of MCMC, if the transition kernel warrants ergodicity, represents the target distribution. A newly developed hybrid evolution MCMC approach is employed adaptive proposal distributions to delineate the posterior parameter region in a Bayesian context.
3.5. Goodness of Fit Measures
In this study, we use several goodness-of-fit measures to evaluate the performance of different copula models, including likelihood value, AIC, BIC (Bayesian Information Criterion), RMSE (Root mean square error), and NSE (Nash-Sutcliff Efficiency). A parameter set that provides the maximum likelihood minimizes the residuals between model simulations and observations. It, therefore, provides, in this sense, the best fit to the observed data.
Higher model complexity (more degrees of freedom) provides the advantage of greater model flexibility and hence usually results in a better fit to the observed data. However, this might stimulate over conditioning of the model. AIC, in contrast to the ad hoc likelihood value, takes into account both the complexity of the model and minimization of error residuals and provides a more robust measure of the quality of model predictions. AIC avoids the problem of over conditioning by adding a penalty term based on the number of parameters. AIC is formulated as [52,53]
in which Q is the number of parameters of the statistical model and l is the log-likelihood value of the best parameter set (Equation (7)). This equation can be simplified to
given the Gaussian assumption of error residuals, , and a constant CS. A lower AIC value associates with a better model fit.
4. Results
4.1. Basic Statistical Properties of the Hydrological Drought
It can be observed from Table 3 that the frequency of drought (about 190) in the upper Huai River is higher than that in the middle Huai River (about 154). However, drought duration (about 22 days) in the upper Huai River is shorter than that in the middle Huai River (about 28 days) which lead to the maximum duration of drought in the upper reaches (198 days) far less than that in the middle reaches (246 days). The frequency of drought in the Shiguanhe River is the largest across the three tributaries. Table 3 shows significant relations between drought severity and drought duration in the Huai River. The absolute Pearson-statistics of drought severity and drought duration in the Huai River are observed >0.67 and the p-values are far <0.05, which indicates that there are significant statistical correlations between drought severity and drought duration. However, the correlation coefficient of D and S is the lowest in the Shiguan River. Pishihang irrigation district, with a total designed irrigation area of 7987 square kilometers, is one of the three largest irrigation districts in China. The drought duration of normal dry years cannot lead to high drought intensity, which is caused by the significant increase in irrigation of rivers, lakes, and large reservoirs. This is the main reason for the low correlation coefficient between drought severity and drought duration in Jiangjiaji station. The drought duration in the Huai River basin has no significant trends, and the drought intensity in the middle Huai River has a predominantly decreasing tendency, but the decreasing trend is not significant at the 5% level.
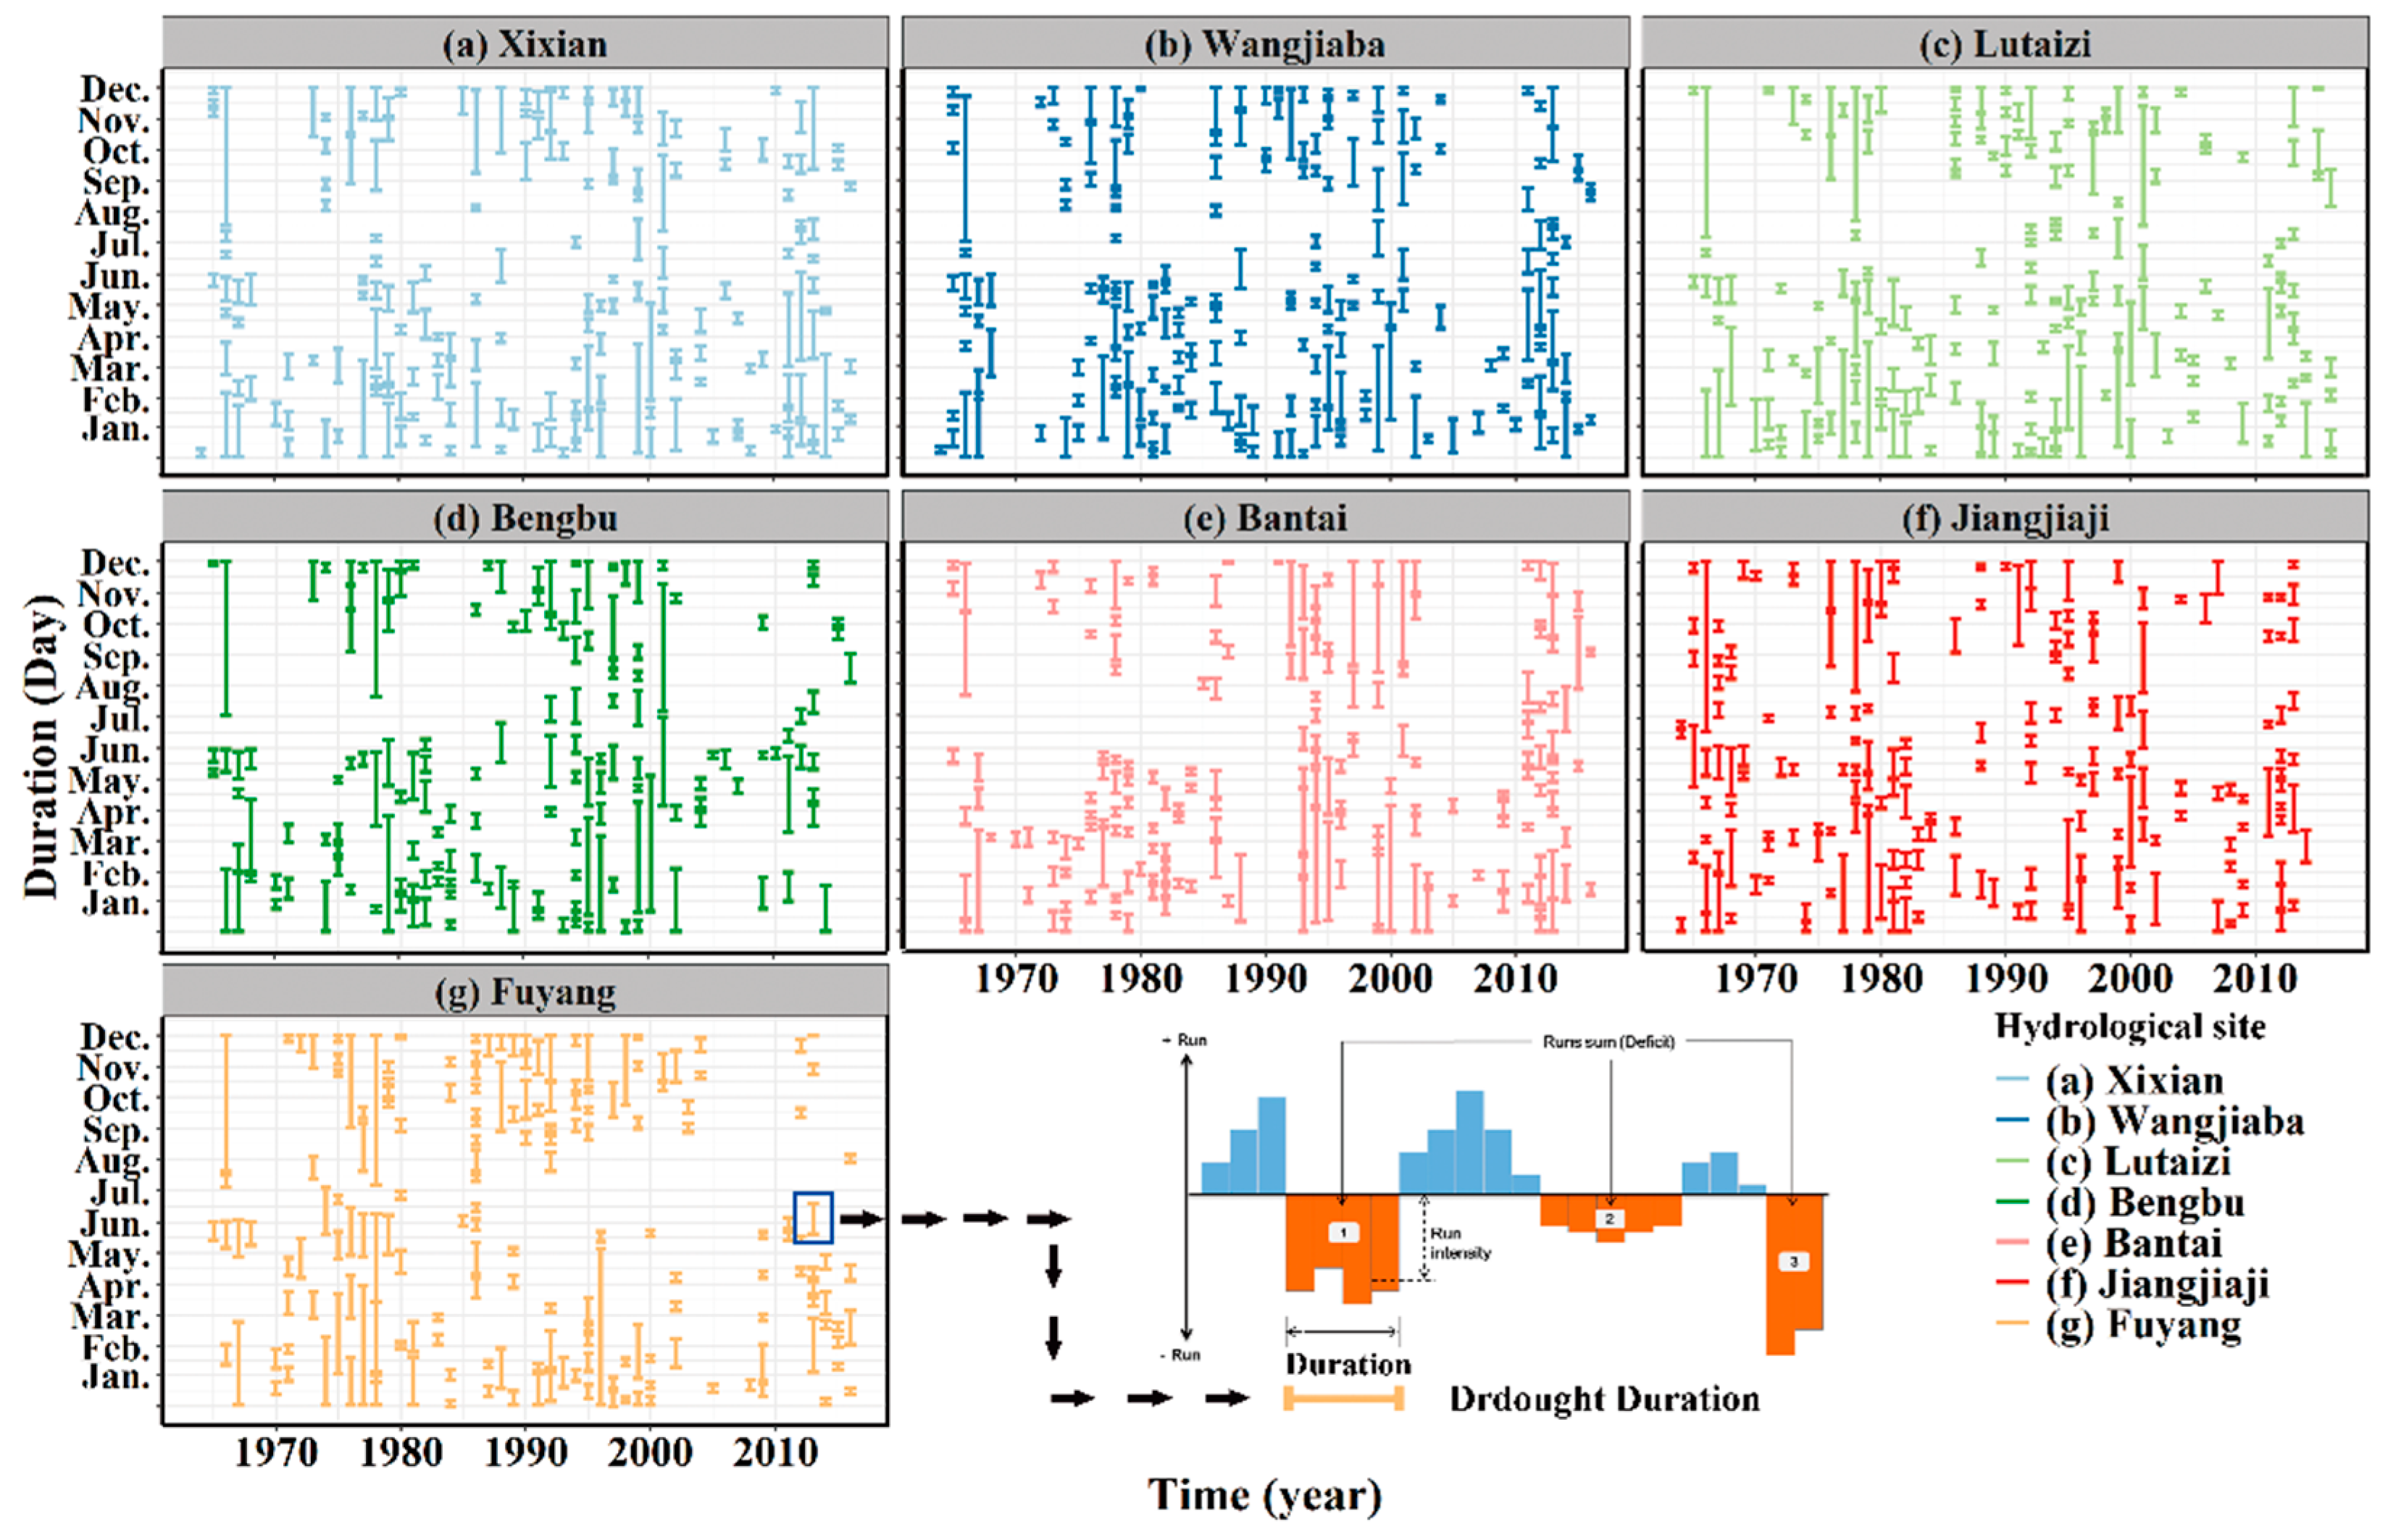
The results of drought duration are shown in Figure 3. The bar represents the drought event and the length of the bar indicates the drought duration. While the Y-axis represents the beginning and end of the drought. The hydrological drought occurred mostly in the 1st–150th day and 270th–365th day of a year in the Huai River basin. That means that drought appeared mainly from October to May. The jointing and heading stage of winter wheat is during April and May in the Huai River basin. Therefore, the water requirements of winter wheat are mostly during April and May; irrigation of winter wheat in spring consumed large amounts of water resources. While drought occurring in spring is one of the major natural disasters, the proportion of water resources and precipitation during March–June is less than water supply and demand contradictory is increasingly prominent [18]. Hydrological drought also shows obvious decadal changes, the duration of drought from 1975 to 1985 is the longest, accounting for a quarter of the total duration of drought. In addition, in the 1990s and early 21st century, a drought occurred frequently. What’s more, drought duration accurately reflects historical drought, such as 1973, 1978, 1992, 1994, and so on.
China’s urbanization level increased steadily after 2000 [54], while the level of rural development showed a declining trend at first and then a rising trend. Therefore, Table 4 and Figure 4 show the variation of land-use of the Huai River Basin from 2000 to 2015. Land cover change analysis between the periods of 1995 and 2015 has shown that the artificial surfaces area has increased from 11.73% to 12.91%, grassland from 3.20% to 3.24%, and water bodies from 2.71% to 2.89%, while forest area has decreased from 10.86% to 10.83%, and cropland from 71.43% to 70.14%. The area of grassland and forestland had little change in HRB. However, from 2000 to 2015, this can be most obviously observed in farmland, with 1400 km2 of farmland converted Forestland and Artificial surfaces (accounting for 1.1% total HRB basin area), mainly transforming to artificial surfaces (urban, industrial land, and residential land). Fuyang station, belonging to the Shaying river, has the maximum farmland transforming to artificial surfaces (Figure 4), This may be the cause of drought duration increasing in the Shaying river. The area of farmland transformed to forestland is maximum (56 km2), but the area of forestland transformed to artificial surfaces is minimum (55 km2) from 2005 to 2010. Therefore, drought duration from 2005 to 2010 is far less than that from 2010 to 2015.
4.2. Probability of Hydrological Drought in HRB
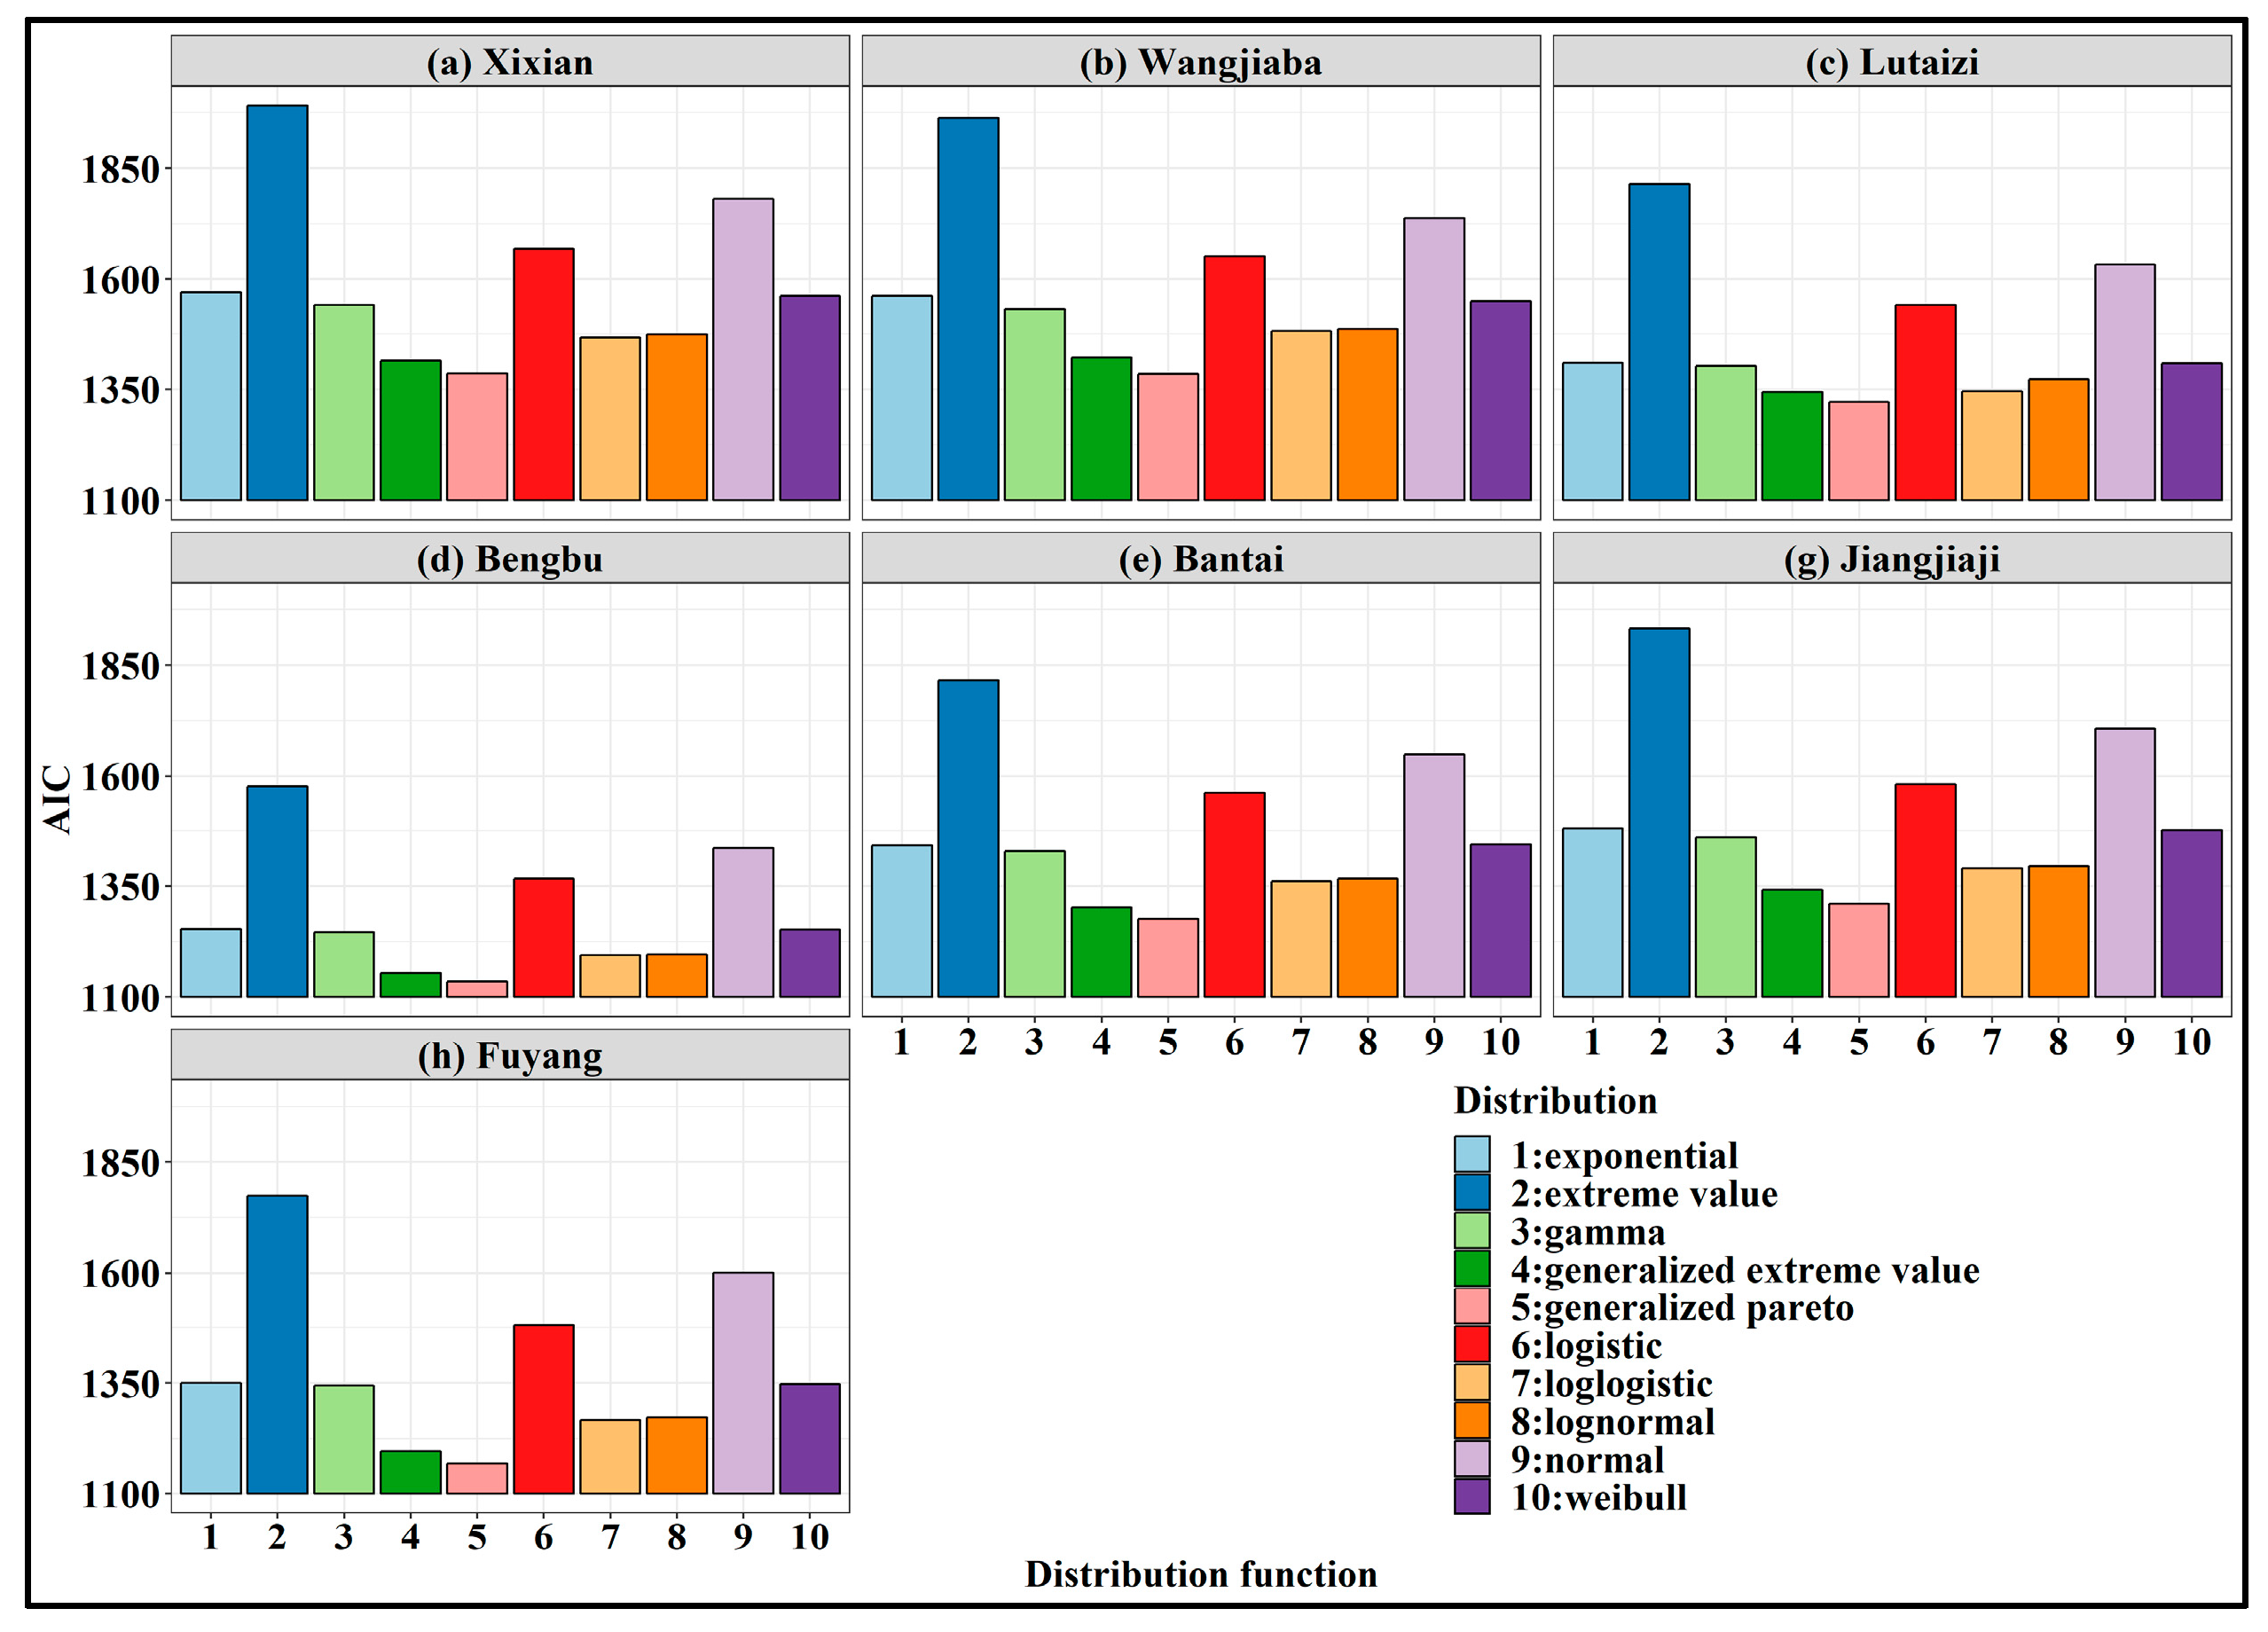
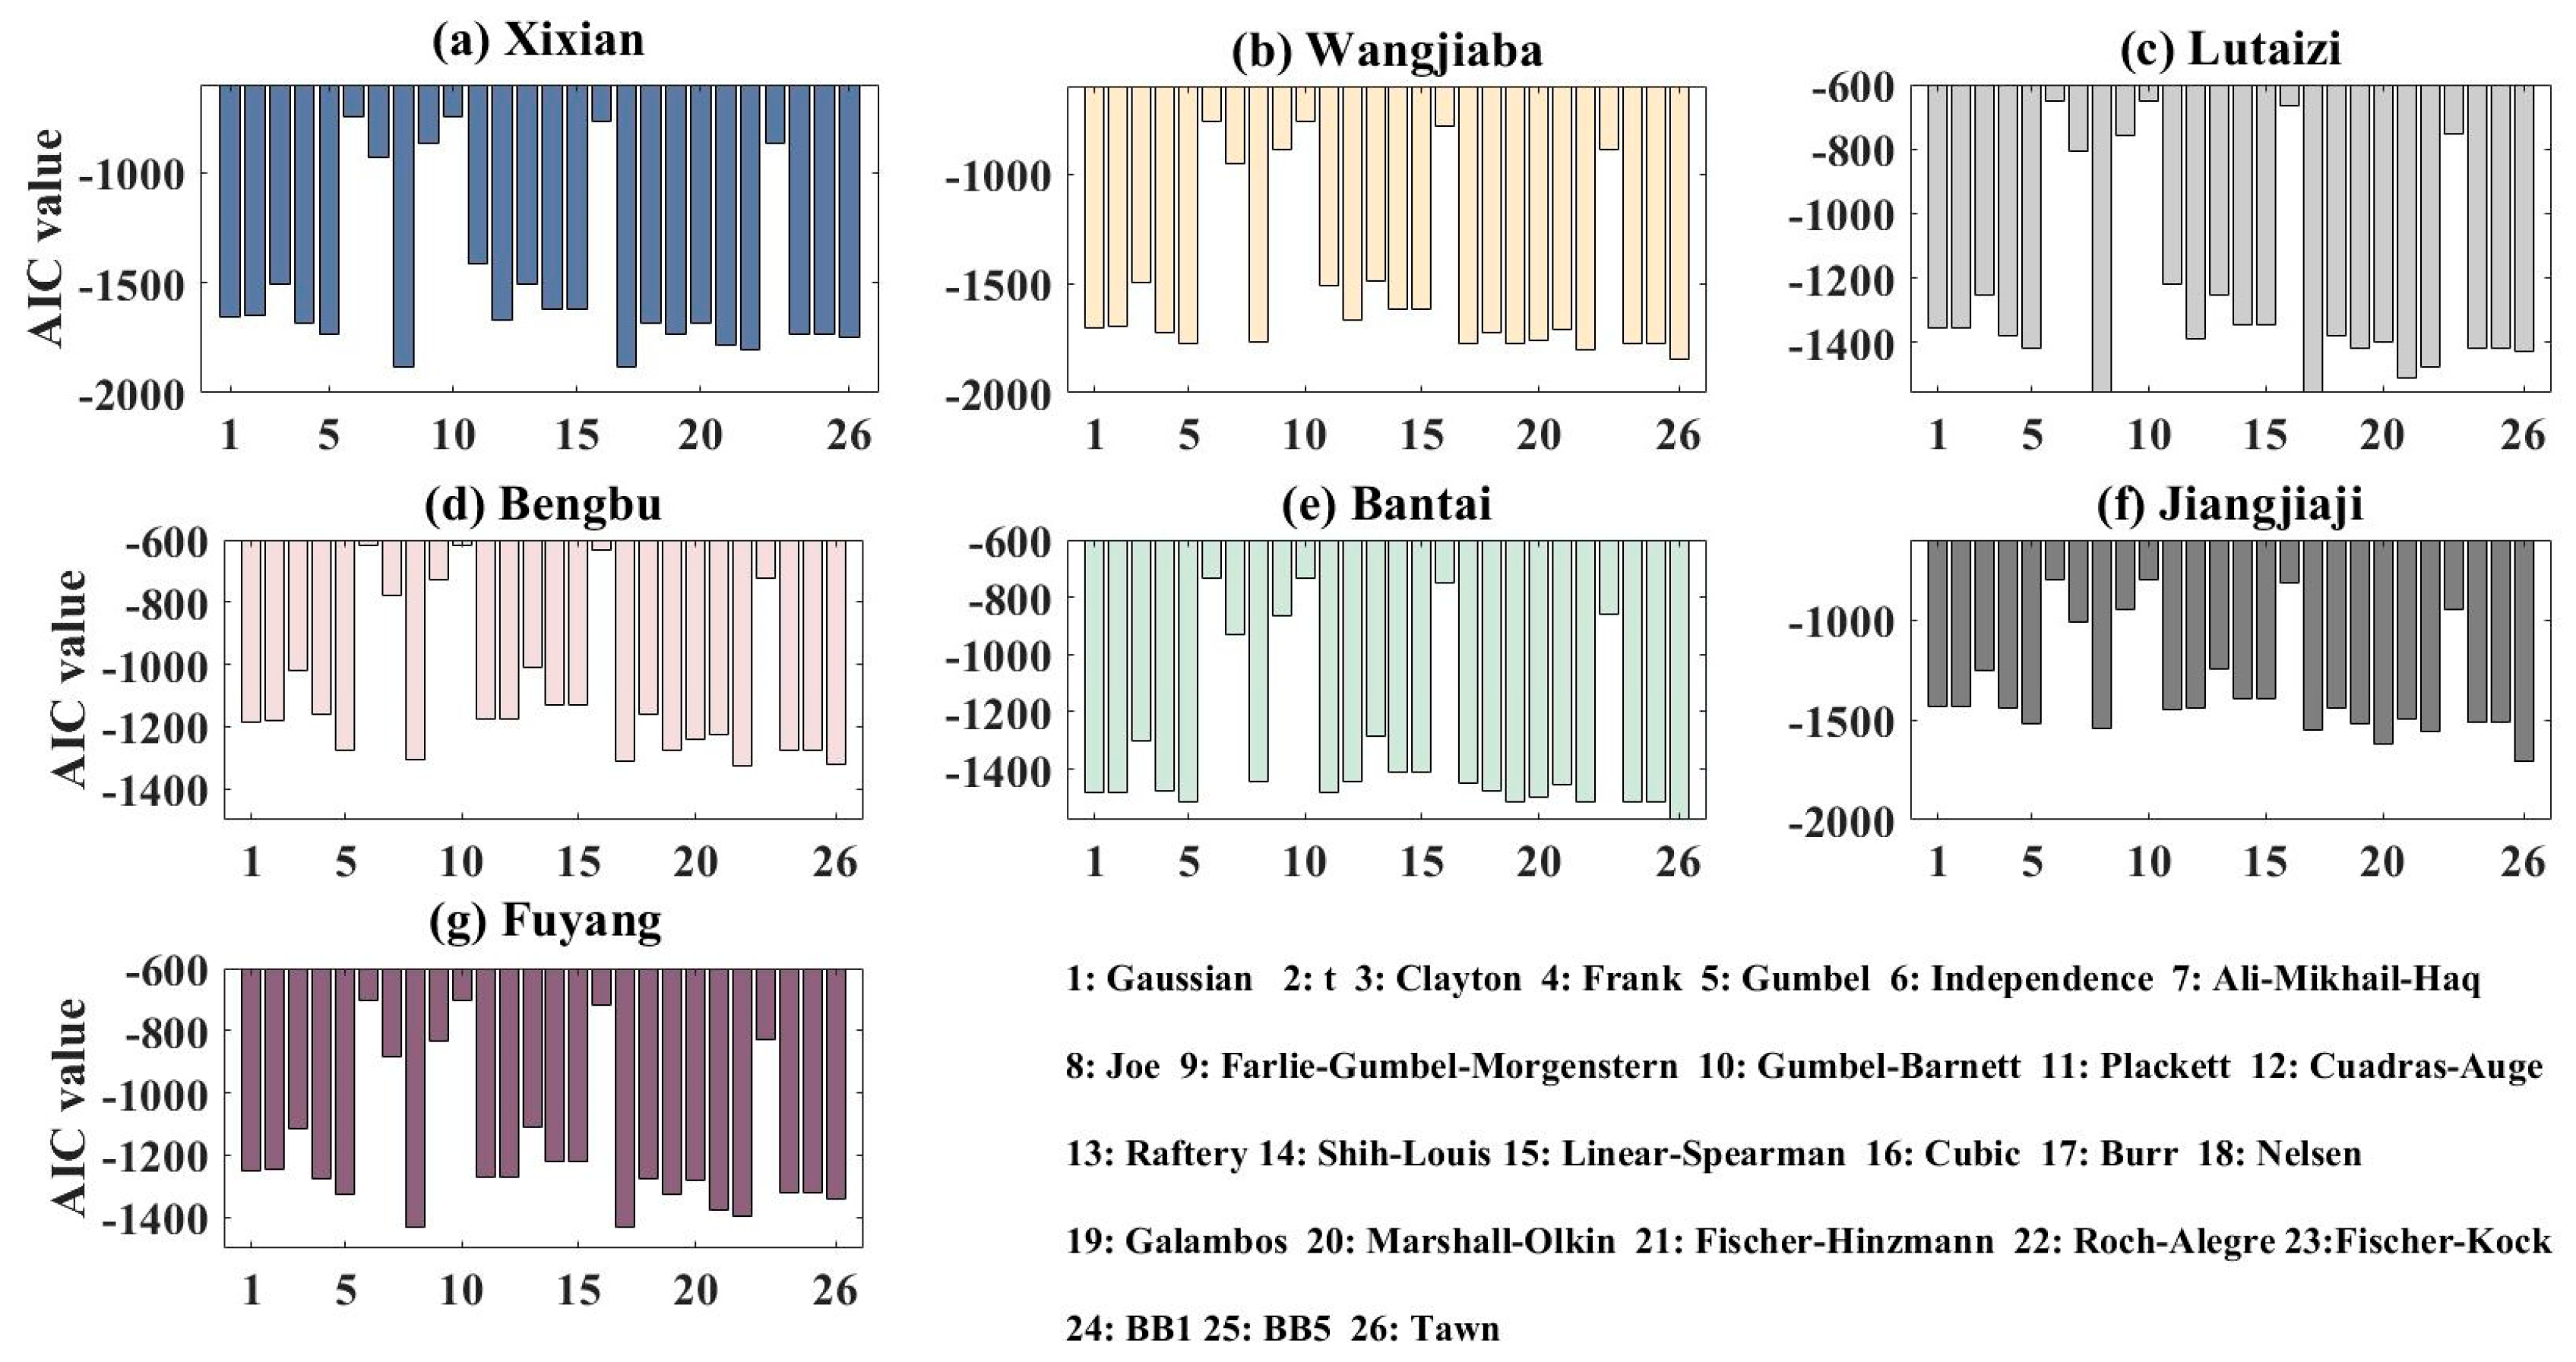
The parameters of the nine probability distributions were estimated by the L-moment technique and Optimal fitting of probability distributions were selected with the NLogL (Negative of the log likelihood), BIC, AIC, and AICc (AIC with a correction for finite sample sizes) ( Figure 5; Figure 6). The result of the best distribution with NLogL, BIC, AIC, and AICc is the same in seven hydrological stations. For example, the value of goodness-of-fit based on AIC for nine probability distribution functions in Xixian station are Generalized Pareto < Generalized Extreme Value < Loglogistic < Lognormal < Gamma < Weibull < Exponential < Logistic < Normal < Extreme Value. The same with NLogL, BIC, and AICc. Therefore, in this study, AIC is used to select the appropriate marginal distribution. It can be seen from Figure 4 and Figure 5 that, according to the AIC values, the value of Generalized Pareto (Generalized Extreme Value) is minimum in the drought-duration (drought severity). Therefore, the appropriate marginal distributions of the drought severity and drought duration in the Huai River are Generalized Extreme Value and Generalized Pareto, respectively.
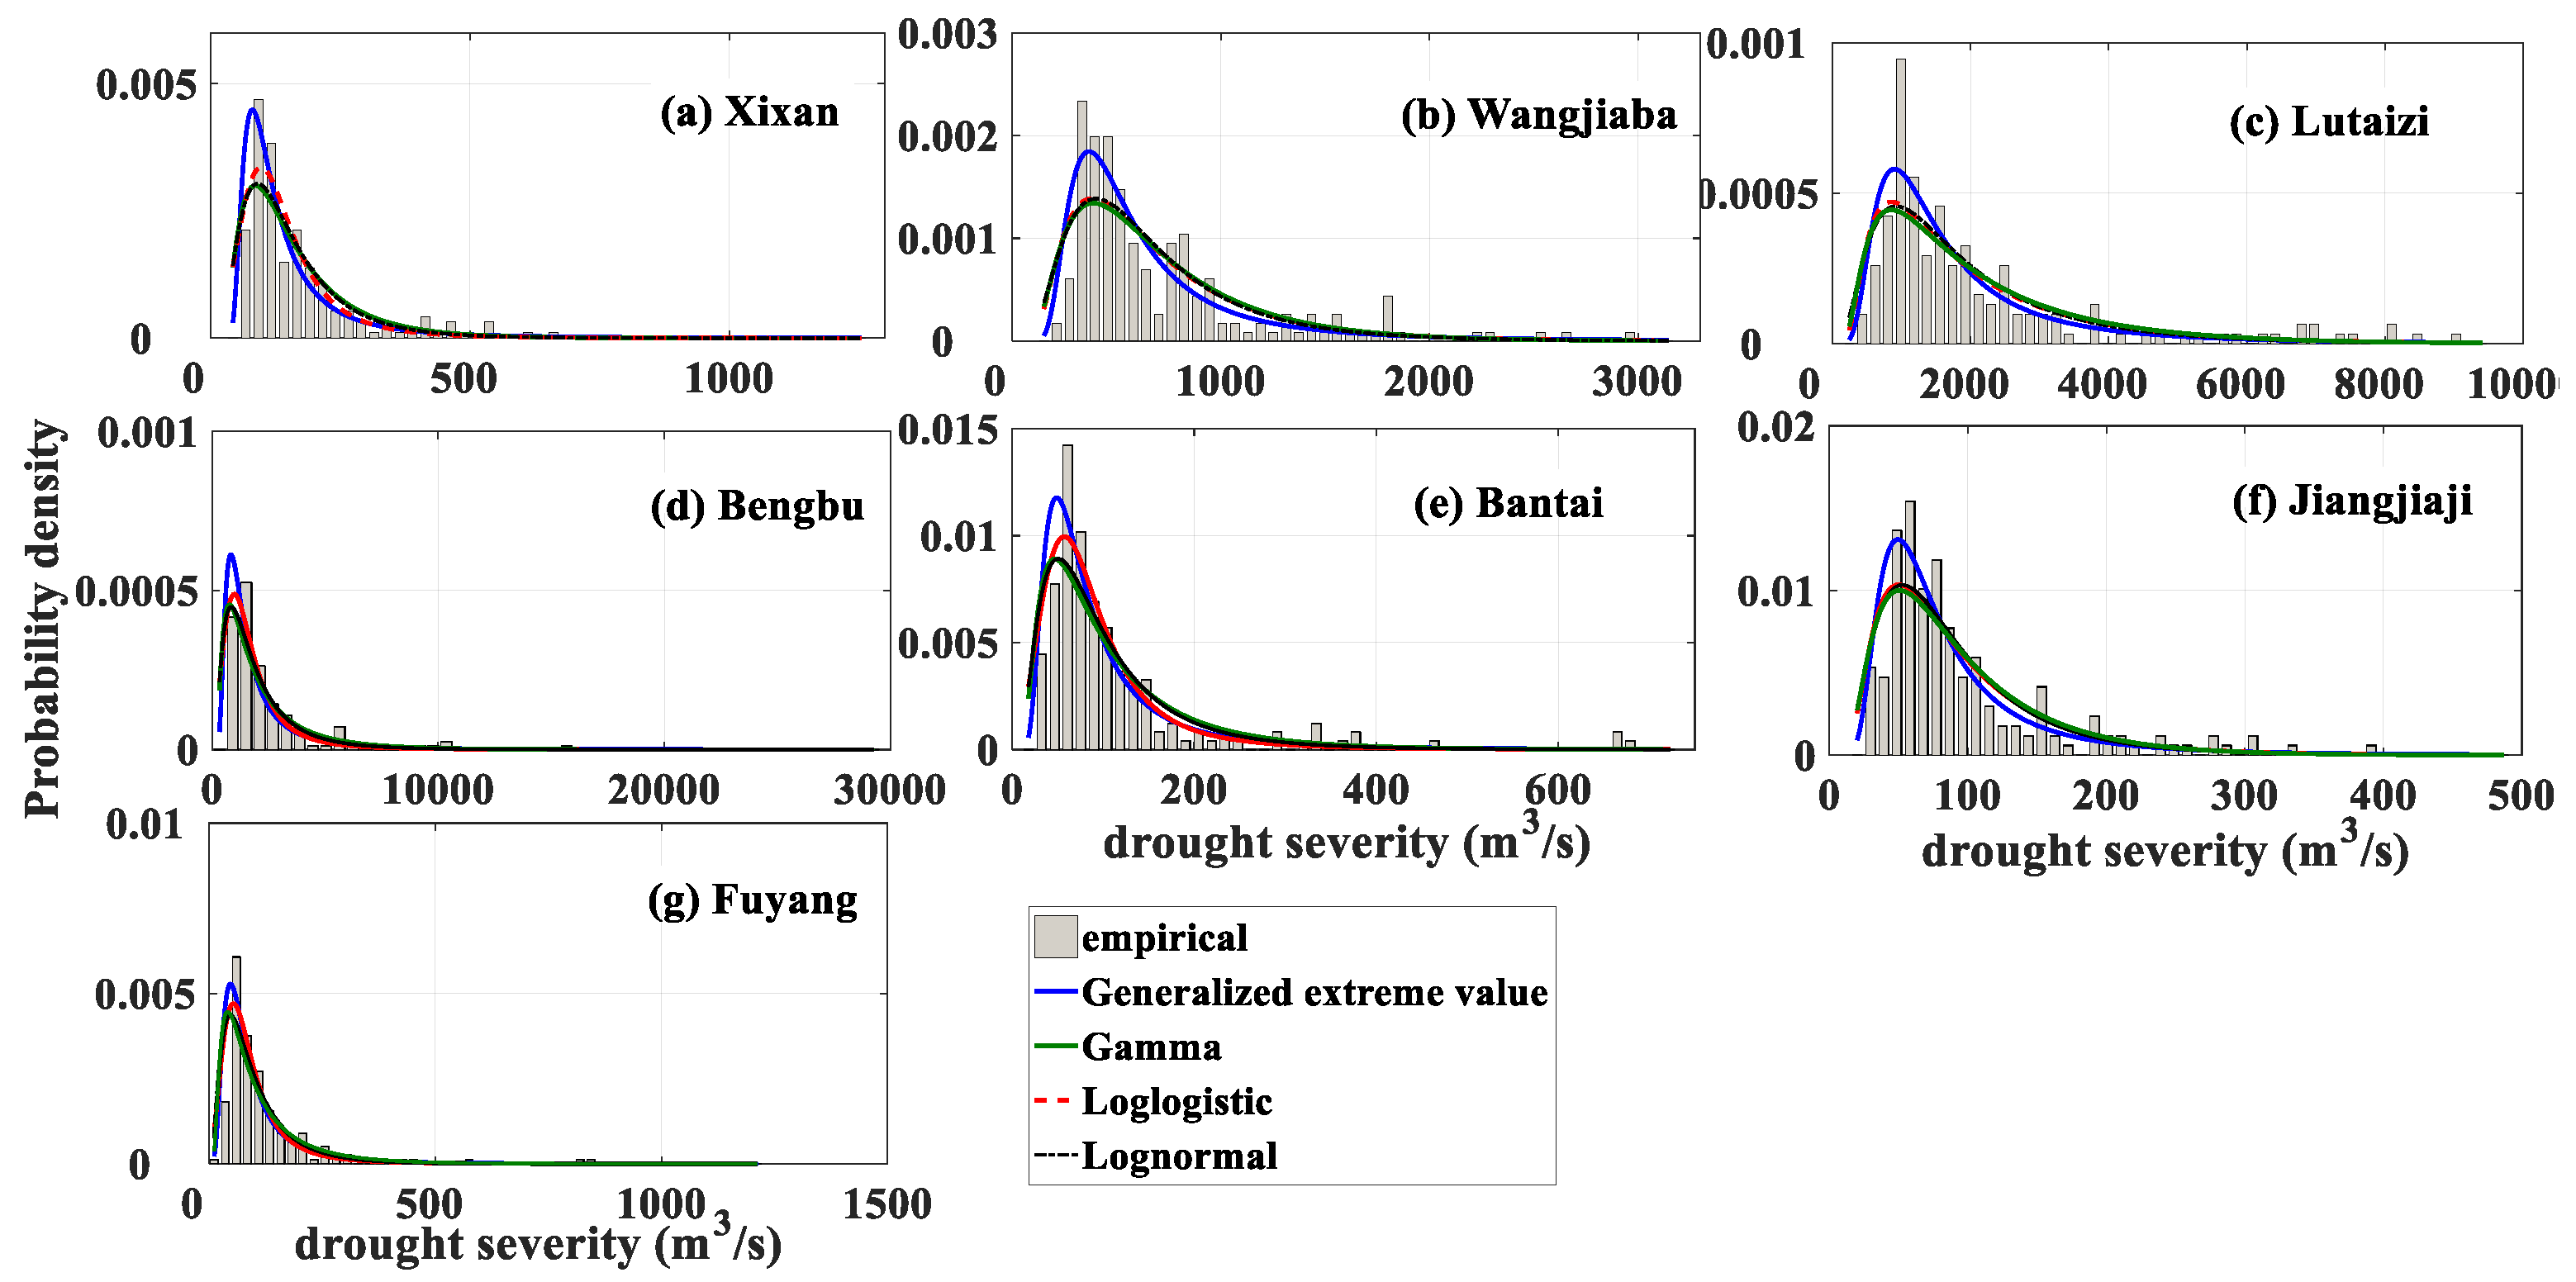
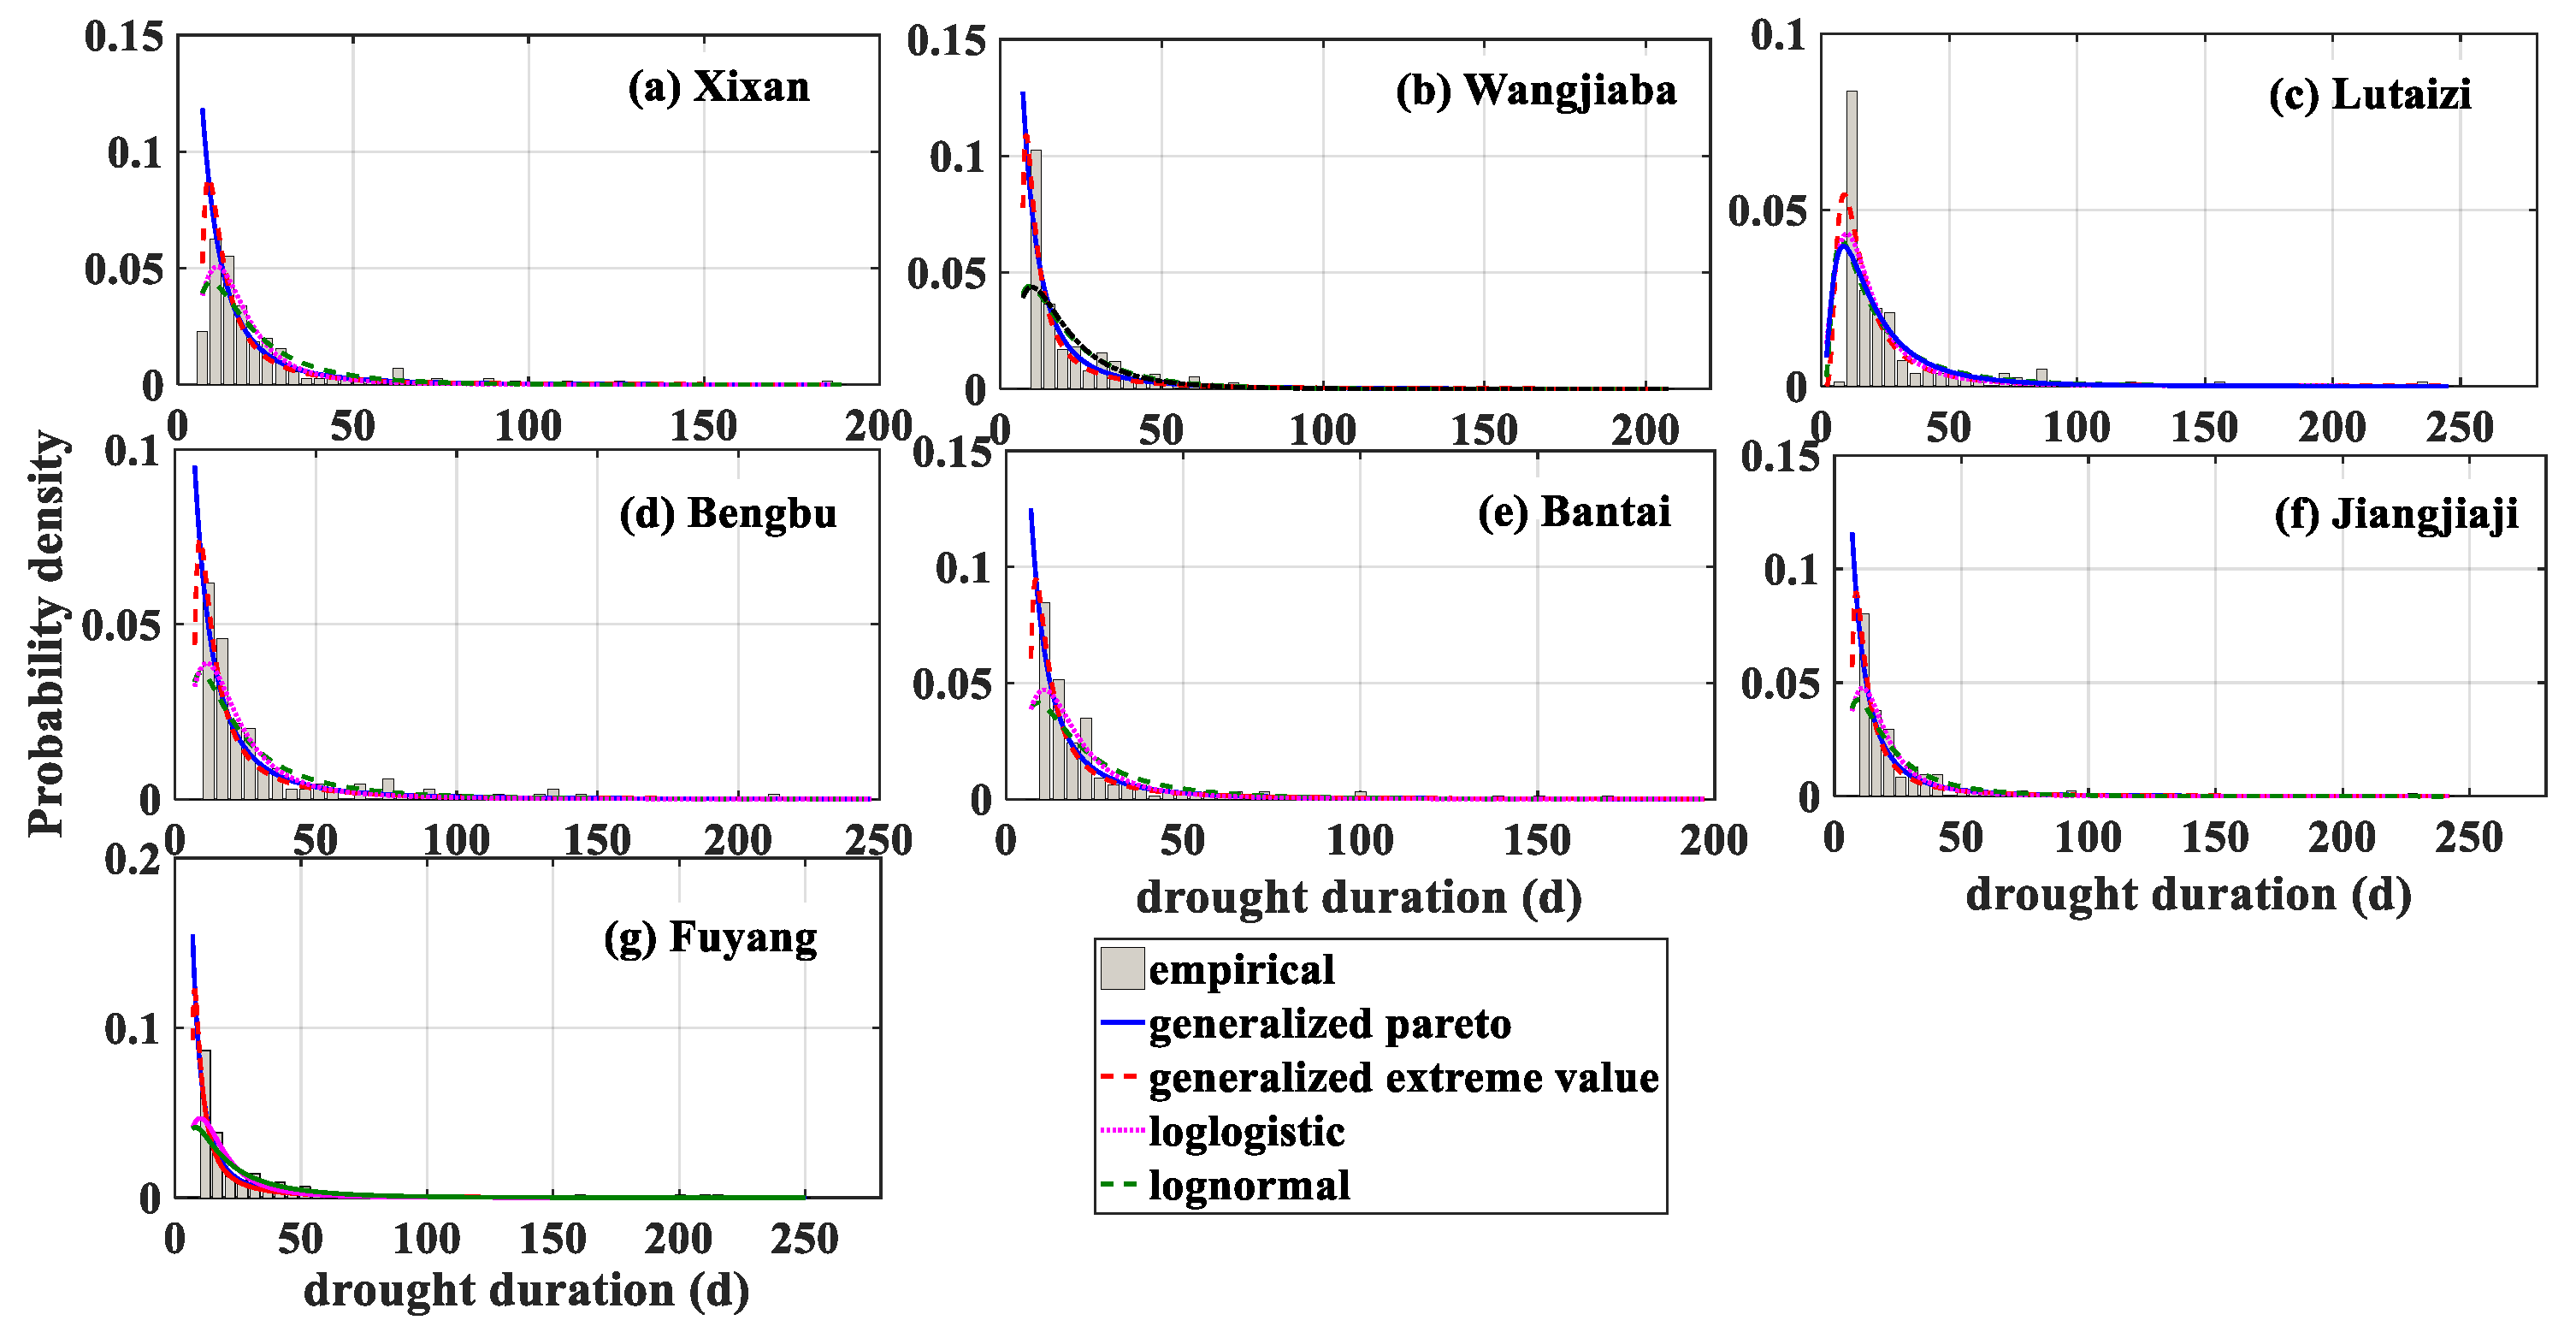
Figure 7 and Figure 8 also demonstrates the ideal performance of Generalized Extreme Value and Generalized Pareto distribution in terms of description of probability properties of drought severity and drought duration. Although the lognormal and loglogistic distribution functions could give a description of the probabilistic behavior of the drought severity and drought duration. It should also be noted that Generalized Pareto (GP) and Generalized Extreme Value (GEV) had three parameters and were widely used in hydrometeorological extreme value analysis [17]. As a result of this, the GP and GEV distribution were usually considered as appropriate distribution in hydrological drought character analysis. Table 5 lists the estimated GP and GEV distribution parameters.
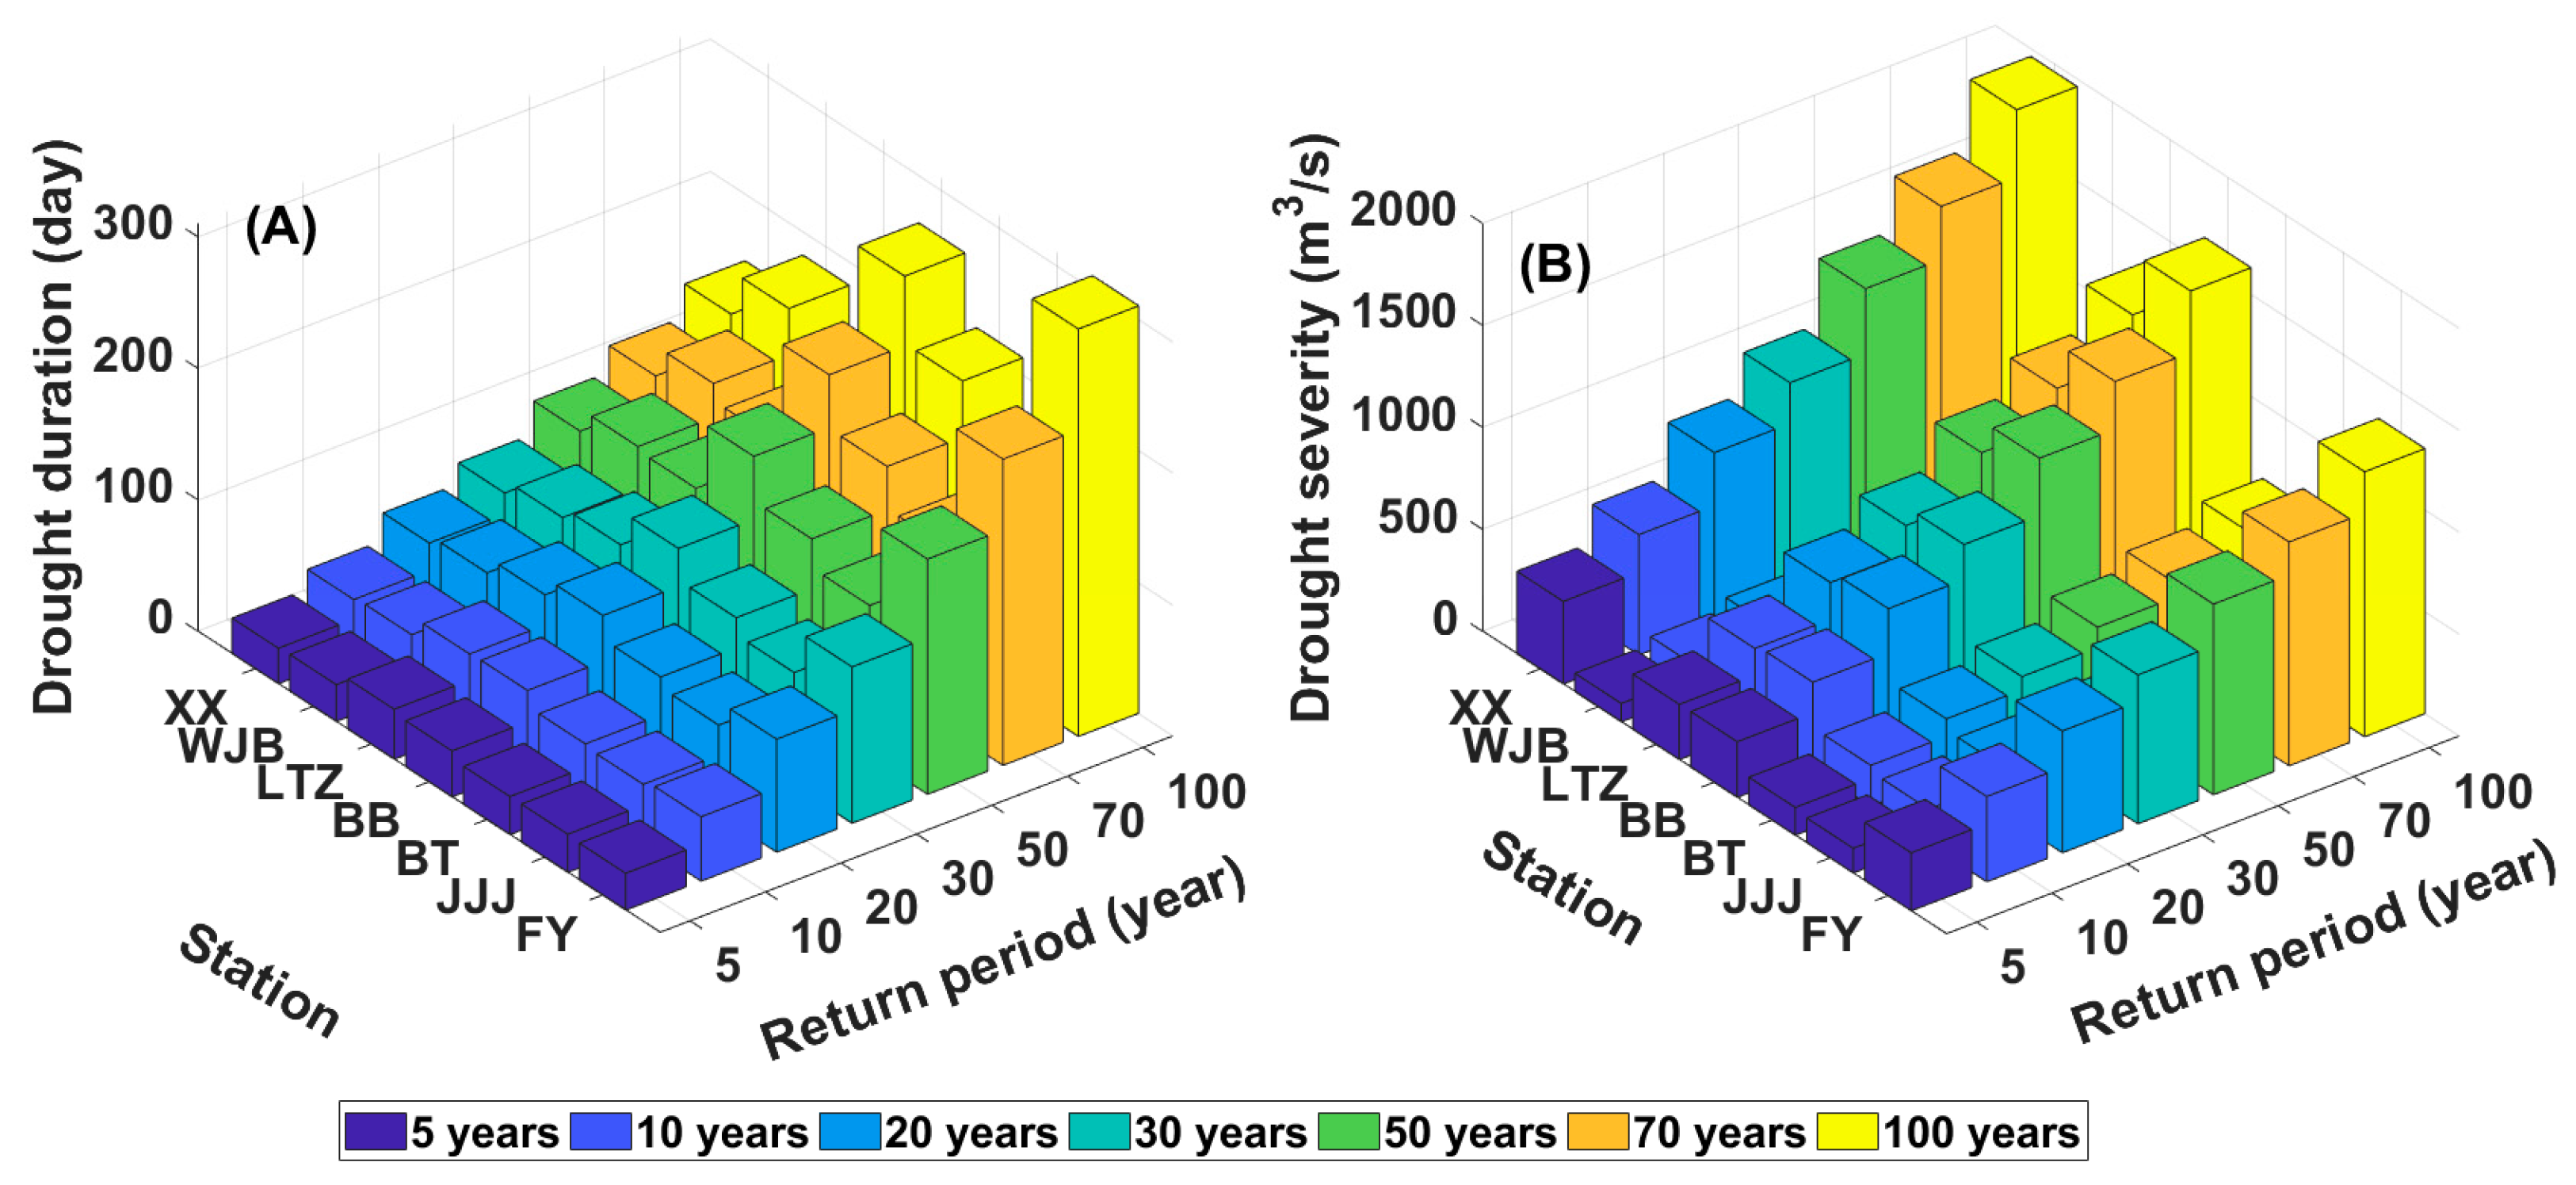
Table 6 and Figure 9 show the drought duration in a different return period which is calculated by Generalized Pareto. It can be seen in Figure 3, and Table 4 and Table 5 that the drought duration is changing with different return periods in the middle reaches and tributary of the HRB. Drought duration has no significant differences for return periods of <10 years. Drought duration of return periods <30 years is the longest in the middle reaches of the HBR and is the shortest in the upper reaches of the HRB. However, the trends of drought duration at seven stations are significantly different due to the increase in the return period. For example, Fuyang, a tributary of the north bank of the Huai River, has an obviously increasing trend. The change of drought severity is similar to drought duration. (Figure 5 and Figure 9).
4.3. Joint Probabilistic Behaviors of Hydrological Droughts Across the HRB
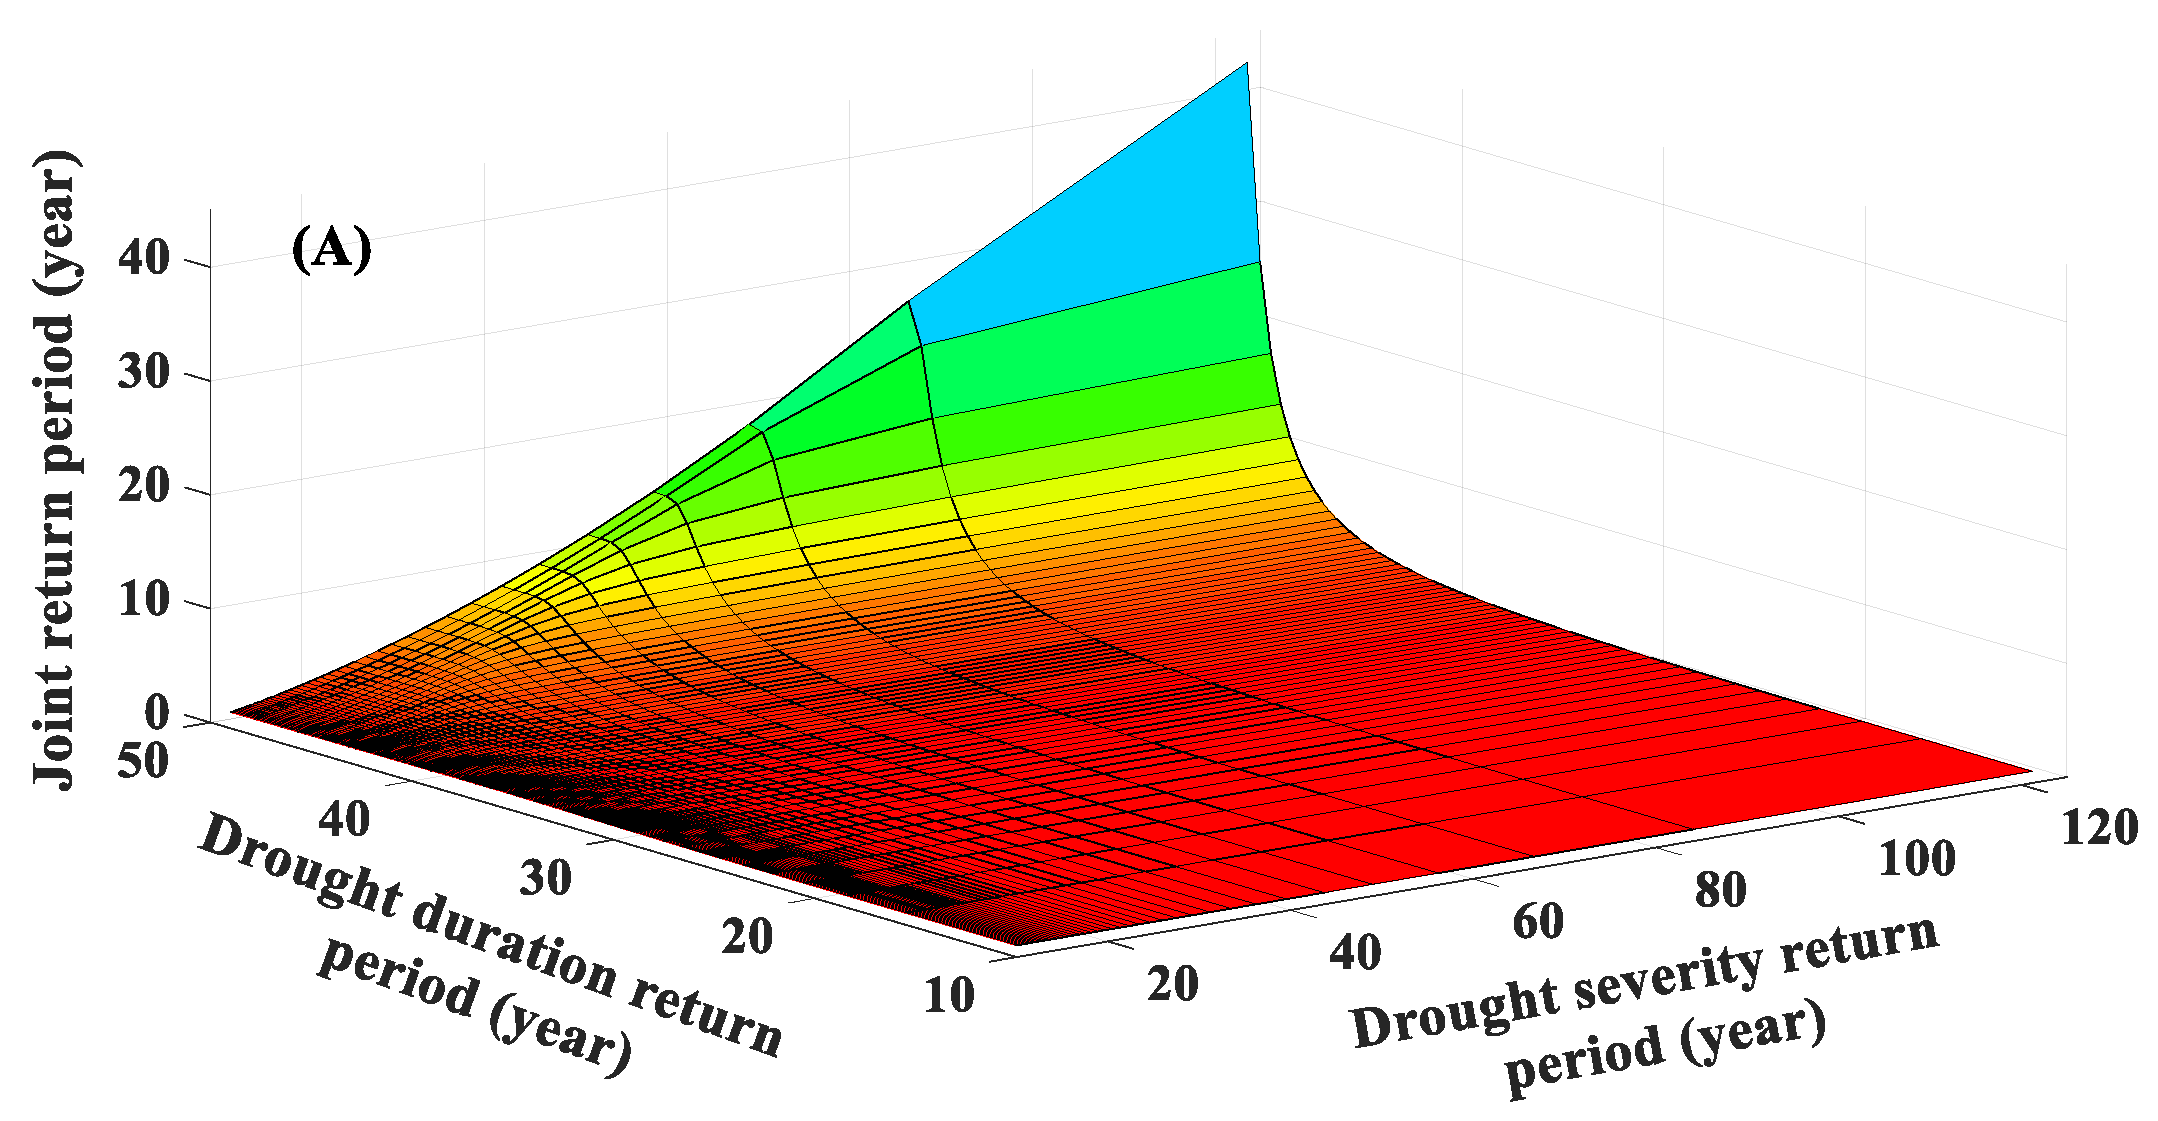
The joint distributions of drought severity and drought duration at all the stations are calculated by copulas. In total, the 26 candidate copulas [41] were used for the joint distribution of drought severity and drought duration in the HRB. The parameters of the 26 copula distributions were estimated by the Markov Chain Monte Carlo (MCMC) simulation within a Bayesian framework. It can be seen in Figure 10 that the best copula functions were selected using the AIC. It is worthy to note that the Tawn copula shows the maximum value of AIC. Therefore, the Twan copula function was selected as the appropriate copula for drought severity and drought duration at the Wangjiaba, Bengbu, Bantai and Jiangjiaji stations. Joe copula exhibits minimum value of AIC in Xixian, Lutaizi, and Fuyang. Table 7 shows the parameters of Twan and Joe copulas which are the appropriate copulas across the HRB using MCMC.
The best marginal distribution functions are the Generalized Pareto and Generalized Extreme Value functions, while parameters were estimated by the L-moment technique (Table 4). Figure 11 shows the joint probabilistic behavior of the drought severity and drought duration at the Wangjiaba station. The joint probability of droughts at other stations was calculated and results at other stations are similar to the Wangjiaba station. It can be seen in Figure 11 that the probability was relatively small when long drought duration with a small magnitude of drought severity occurred concurrently at one station. The probability is small when a large magnitude of drought severity occurred and a short duration at one station, however, the probability is progressively higher when the drought duration and drought severity both increased.
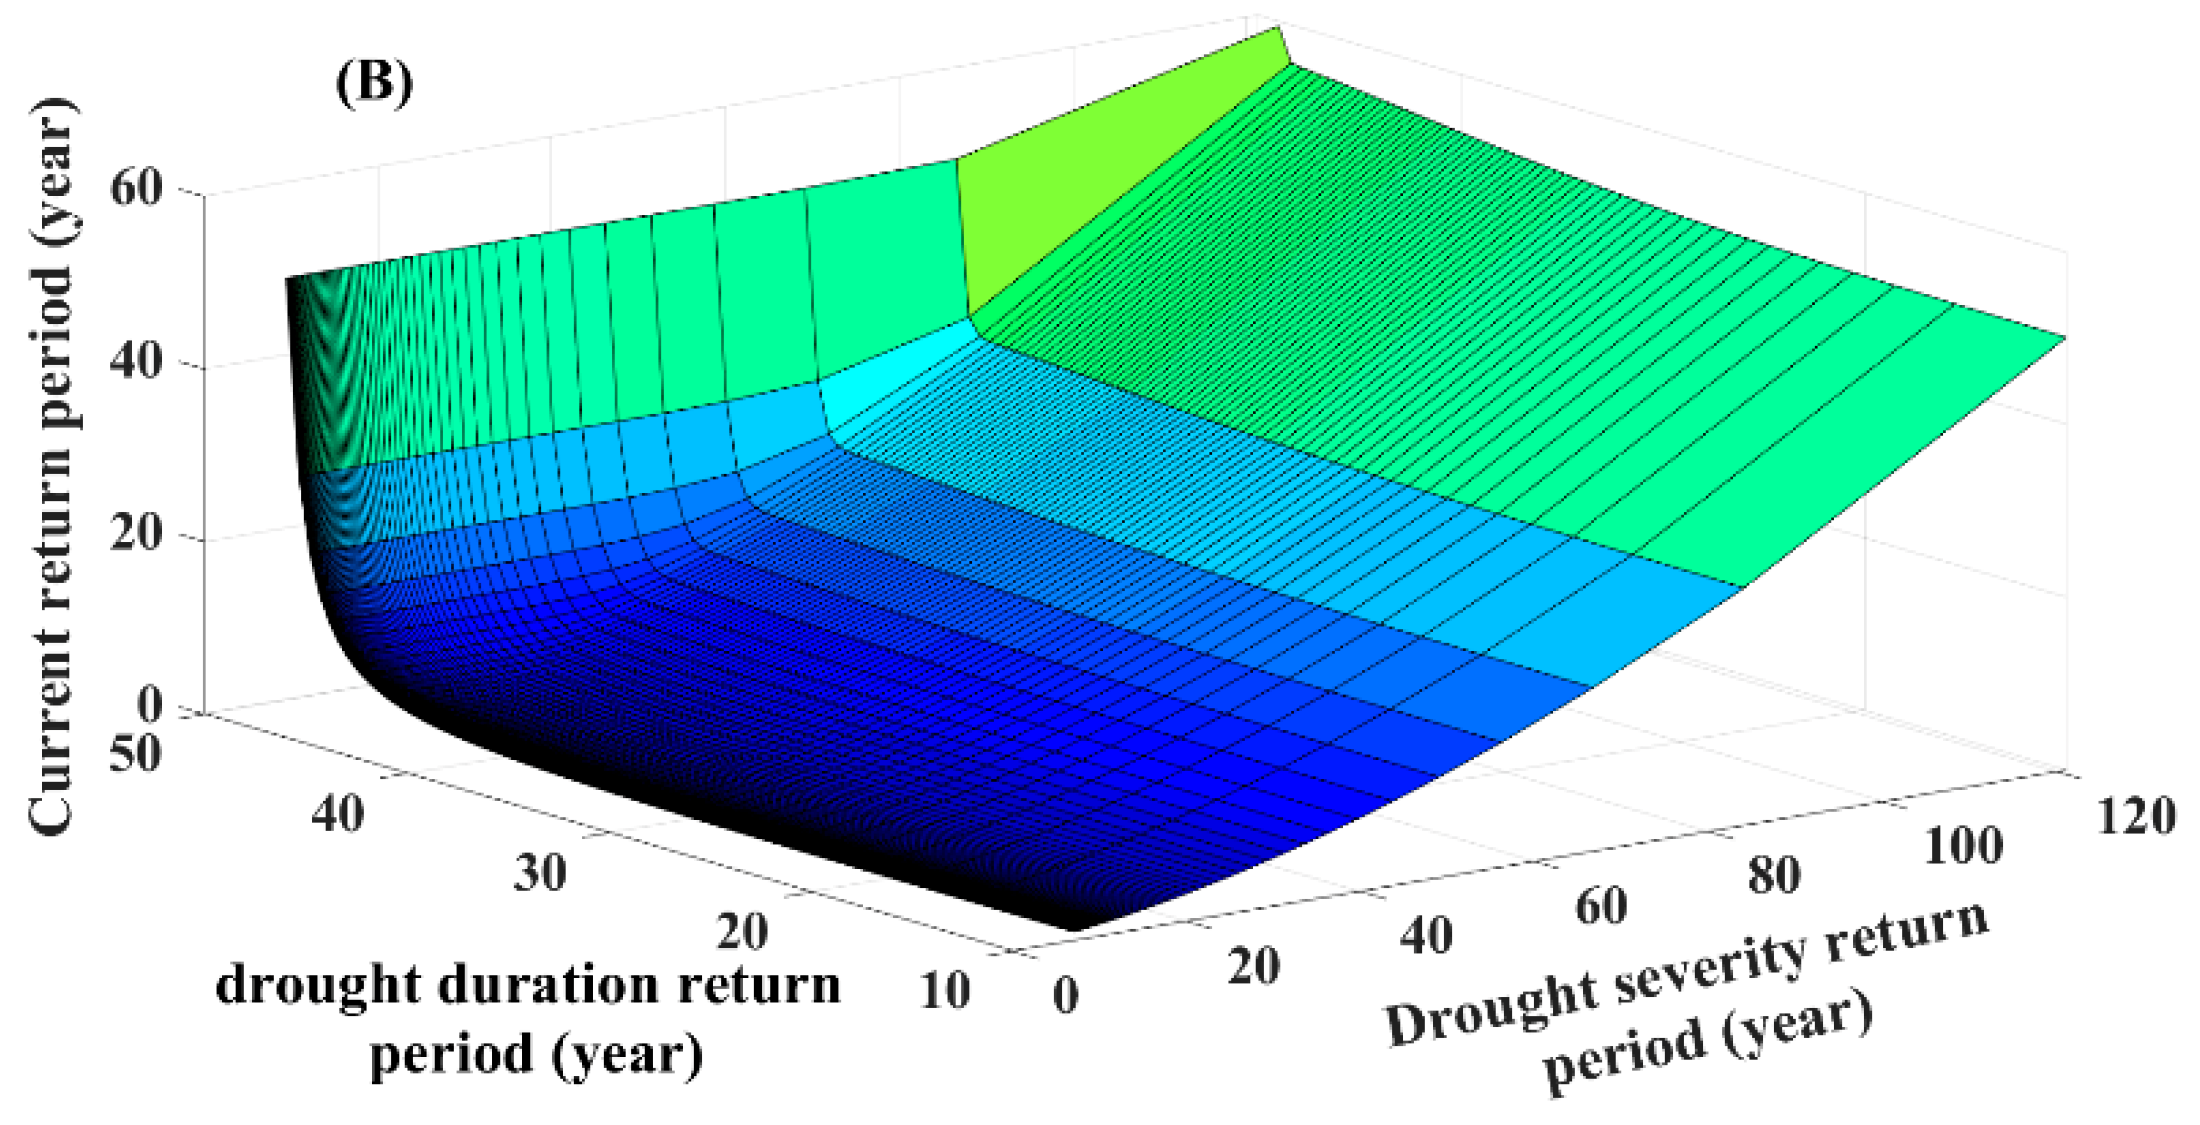
Figure 12 shows concurrence return periods and joint return periods with different drought severity and drought duration at hydrological stations in different groups of return periods. It can be seen that concurrence return periods were larger than the designed return period (Figure 12B), and the joint return periods is smaller than the designed return period (Figure 12A). Changes in concurrence return periods and joint return periods of drought severity and drought duration in the mainstream of the HRB are largely in the tributary of the HRB. However, the current return period of drought severity and drought duration in the mainstream of the Huai River is smaller than that in the tributary of the Huai River (Figure 12B). With return periods of <2 years, the concurrent occurrence probability of hydrological droughts is higher at the Jiangjiaji and Fuyang. What’s more, the joint return periods of droughts in the tributary of the Huai River are shorter than those along the mainstream of the Huai River, implying a lower frequency of hydrological droughts at the Xixian, Wangjiaba, Lutaizi, and Bengbu stations when compared to other stations (Figure 12A). However, the concurrence return periods of droughts at the Bantai, Jiangjiaji, and Fuyang station are larger in the tributary of HRB than that along the mainstream of HRB, implying a lower frequency of hydrological droughts in the mainstream of HRB.
5. Discussions and Conclusions
The frequency of hydrological droughts in the upper HRB is higher than that in the middle HRB. While the duration of the hydrological drought is in reverse spatial pattern. Zhang et al. (2011) showed that the rainfall-runoff relationship was significant in both highly-regulated rivers and less-regulated rivers [29]. The runoff of the Huai River basin is mainly from rainfall. Therefore, runoff is mainly influenced by precipitation in the HRB [55,56]. Xia et al. (2019) showed that the drought severity in the southwest is higher than that in other regions, and meteorological drought has a decreasing trend in the southwest of HRB [57]. Therefore, the decrease of precipitation and the increase of drought intensity lead to the high frequency of hydrologic drought. Figure 1 shows the spatial distribution of irrigated areas in the HRB. There are irrigated areas with the area (2230 km2) in the upper reaches of HRB, which is lower than the irrigated area (2.2 × 10⁴ km2) in the middle reaches of HRB. However, hydrological droughts occurred frequently in winter and spring in HRB, with more than a quarter of the drought events occurring in these seasons. Water conservancy projects such as reservoirs in irrigated area can store water from October to March. Crop irrigation can consume a lot of water resources in spring, although water conservancy projects can effectively reduce the occurrence of hydrologic droughts. Hydrology stations such as Lutaizi and Bengbu have a large drainage area in the middle reaches of HRB. Water conservancy projects can be more effective in reducing drought duration in small drainage areas than that in large drainage areas.
The correlation coefficient between drought duration and drought intensity is the minimum in the Shiguan River. This is because the Shiguan river is located in the Pishihang irrigation district, one of the three largest irrigation districts in Chia. While water reservoirs were built across the HRB during late 1950s and early 1960s, the Xianghongdian, Mozitan, and Shishan water reservoirs were built during 1958, 1958, and 1962 respectively in the Shiguan River. These water reservoirs can help to decrease peak flood flow and increase low flow [18]. Hence, irrigation districts and small drainage areas lead to the correlation coefficient minimum.
The frequency of droughts along the mainstream of the HRB is higher than the tributaries of the HRB. However, concurrence probability of droughts along the mainstream of the HRB is lower than the tributaries of the HRB. Compared to the mainstream of HRB, tributary of HRB, such as Hongru River, Shiguan River, and Shaying River, have small irrigation areas and small storage capacity. The drainage area of the Shiguan River on the south bank of HRB is the smallest among the tributaries and has a high proportion of irrigated area, so that the probability of joint return periods is the maximum in the tributaries of HRB. Furthermore, the drainage area with more irrigation area (2.2 × 10⁴ km2) is the largest in Bengbu station in the mainstream of HRB, the probability of joint return periods is the minimum, implying the probability of drought duration or drought severity is highest. Furthermore, the larger drainage area has more arable land for agriculture, people, and industry. However, water demand is significantly increasing due to the rapid development of agricultural irrigation and industry in the dry season. While the drainage area of Bantai in the Hongru river is larger than that in the Shiguan river, the irrigation area (635 km2) in the Hongru river is less than the irrigation area (3867 km2) in the Shiguan river [58]. Therefore, because of agricultural irrigation, the probability of drought duration or drought severity is larger in the Jiangjiaji than that in the Bantai.
The days of hydrological drought in HRB accounted for 21.4% of the total days. The results indicated that precipitation could be detected with larger fluctuations in the last 50 years with intensifying precipitation processes [18,59,60]. The precipitation amount from June to September accounts for 50–75% of the annual total precipitation amount [61], which causes largely uneven annual distribution of runoff. The variation coefficient of streamflow ranges from 0.16 to 0.85, and the annual extremum ratio of the streamflow between 1.7 and 23.9 in the HRB [18,62]. Meanwhile, results showed that the HRB was characterized by the highest population density with the heavy responsibility of supplier of agricultural products. The crop areas during 1983–2014 increased from 16.4 × 10⁴ to 19.2 × 10⁴ km2. Besides, there were more than 5700 water reservoirs built with a total water capacity of 2.72 × 10¹⁰ m3 [62]. Human interferences on streamflow changes render hydrological processes larger fluctuations in both space and time [18,62]. Although runoff has a decreasing trend, drought duration is basically unchanged, and the drought intensity in middle HRB shows a decreasing trend, but the decreasing trend is not significant.
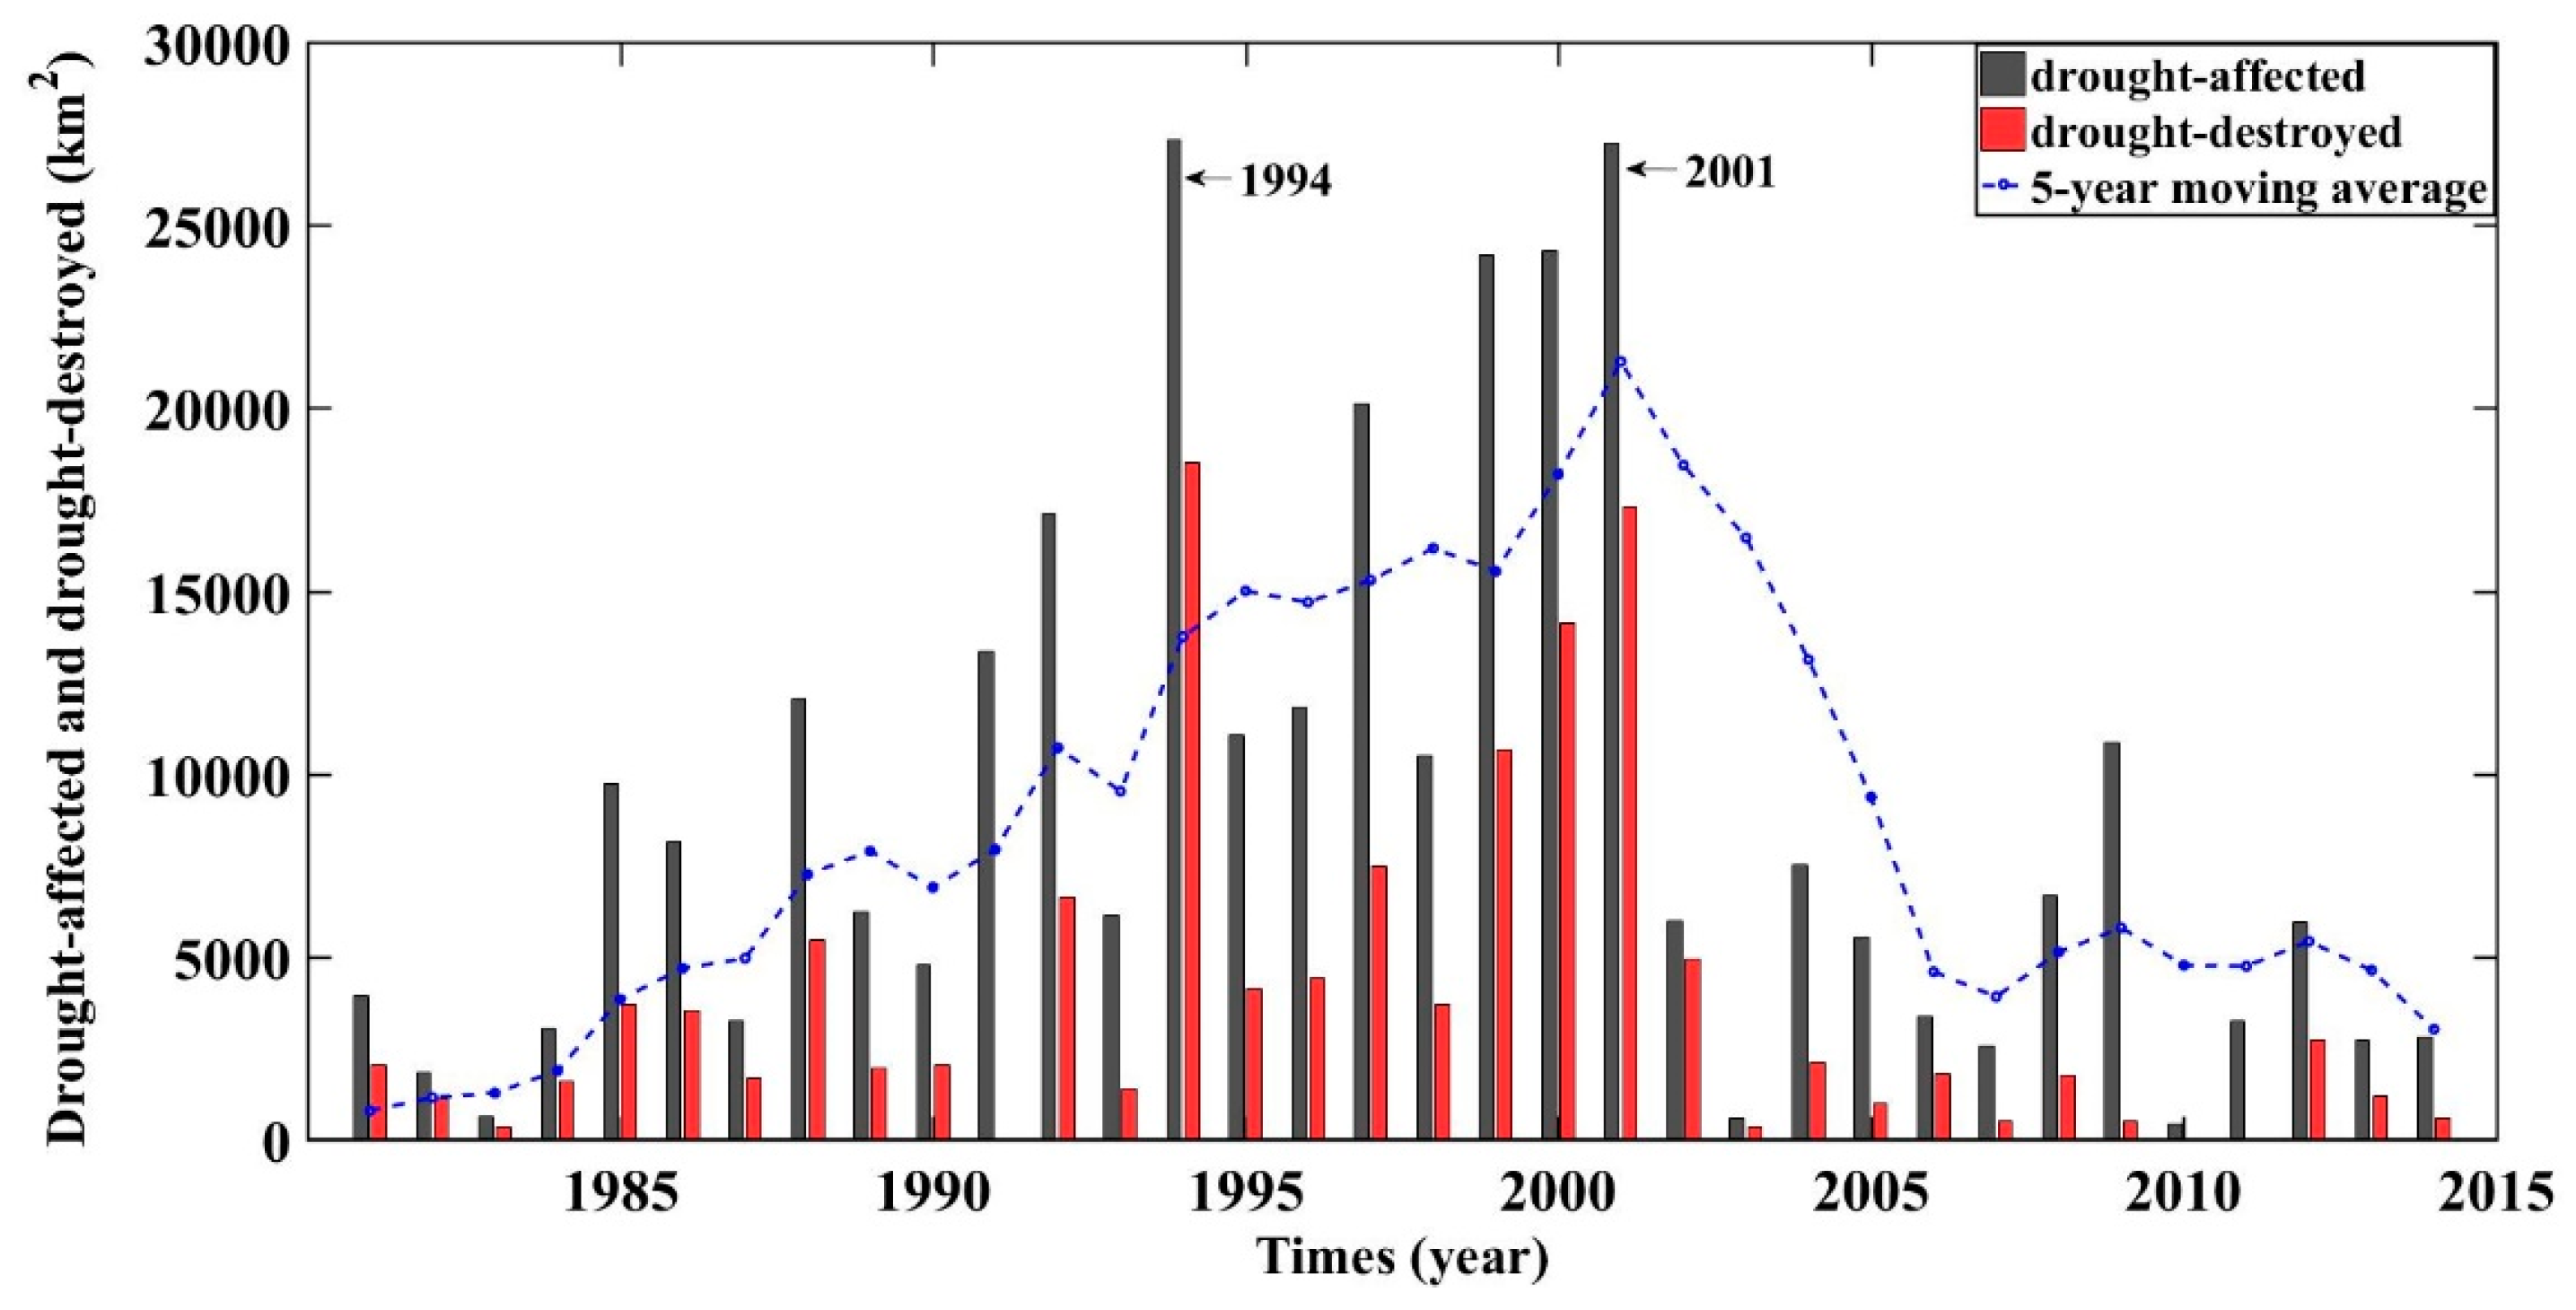
Notably, hydrological droughts occurred frequently during the period of 1975–1985, especially in winter and spring, with more than a quarter of the drought events occurring in these seasons. Droughts occurred frequently in the 1990s and early 21st century. Figure 13 shows that drought-affected crop areas and drought-destroyed crop areas have a significantly increasing trend from 1981 to 2001. Especially, the drought-affected areas were 27.33 × 10⁴ km2 and 27.24 × 10⁴ km2 respectively, while the ratio of the disaster area to the drought-affected area was 67.7% and 63.4% in 1994 and 2001, respectively. The annual distribution of precipitation in the HRB is extremely uneven, with spring precipitation amount accounting for only 19% of the annual precipitation amount when the winter wheat demand peaks and is an important period of growth. Spring precipitation decreased significantly in the 1990s [29,56], which is largely the main reason for the drought-affected areas in the 1990s. However, the increasing trend of hydrological droughts had not cause drought-affected crop significantly increase area after 2010. The main reason is that the Chinese government required strengthening of the construction of water conservancy facilities. The drought resistance capacity of HRB has been significantly improved, effectively reducing the impact of hydrological drought on crops.
In summary, some interesting and important conclusions can be drawn as follows:
- The frequency of hydrological droughts in the upper Huai River is more than in the middle of the Huai River Basin, while the duration of hydrological drought is just the opposite. The drought frequency and drought duration of the three major tributaries are between the upper and middle of the mainstream. What’s more, the drought frequency of the Shiguan River on the south bank is higher than that of the other two tributaries.
- Generalized Pareto distribution is the right distribution function with the lowest of AIC in the study of drought duration over the Huai River Basin. The Generalized Extreme Value distribution satisfactorily described the probabilistic behavior of the drought severity. Joe copula and Tawn copula were the right choice and used in this current study. Given the return period of droughts less than 30 years, the day of drought duration in the upper Huai River is the maximum and is the minimum in the middle Huai river. However, the drought duration in Fuyang station is increasing based on the increase of the return period. The ratio of drought intensity to flow is negatively correlated with basin area.
- The frequency of the Joint return period of drought severity and drought duration in the mainstream of the Huai River is higher than the tributary of the Huai River. The frequency of the concurrent return period of drought severity and drought duration in the mainstream of the Huai River is lower than that of the tributary of the Huai River Basin. The drought resistance capacity of HRB has been significantly improved, effectively reducing the impact of hydrological drought on crops after 2010.
Author Contributions
P.S., Q.Z., R.Y. and Q.W. conceived and designed the experiments; P.S., Q.Z. and R.Y. performed the experiments; P.S., Q.Z. and R.Y. analyzed the data; P.S., Q.Z., R.Y., and Q.W. contributed analysis tools; P.S., Q.Z., R.Y. and Q.W. wrote the paper.
Funding
This work is financially supported by China National Key R&D Program (Grant No.: 2019YFA0606900), the National Natural Science Foundation of China (No. 41601023, No. 41771536), National Science Foundation for Distinguished Young Scholars of China (Grant No.: 51425903), State Key Laboratory of Earth Surface Processes and Resource Ecology (Grant No. 2017-KF-04), Open Research Fund of State Key Laboratory of Simulation and Regulation of Water Cycle in River Basin (China Institute of Water Resources and Hydropower Research) (Grant No. IWHR-SKL-201720) and Natural Science Foundation of Anhui province (Grant No.: 1808085QD117).
Conflicts of Interest
The authors declare no conflict of interest.
References
- Allen; Barros, V.R.; Broome, J.; Cramer, W. Climate Change 2014. Synthesis Report; Environmental Policy Collection; IPCC: Geneva, Switzerland, 2014; Volume 27, p. 408. [Google Scholar]
- Sun, H.; Wang, A.; Zhai, J.Q.; Huang, J.L.; Wang, Y.J.; Wen, S.S.; Zeng, X.F.; Su, B.D. Impacts of global warming of 1.5 °C and 2.0 °C on precipitation patterns in China by regional climate model (COSMO-CLM). Atmos. Res. 2017, 203, 83–94. [Google Scholar] [CrossRef]
- Huang, J.P.; Yu, H.P.; Dai, A.G.; Yun, W.; Kang, L.T. Drylands face potential threat under 2 °C global warming target. Nat. Clim. Chang. 2017, 7, 417–422. [Google Scholar] [CrossRef]
- Akyuz, D.E.; Bayazit, M.; Onoz, B. Markov Chain Models for Hydrological Drought Characteristics. J. Hydrometeorol. 2012, 13, 298–309. [Google Scholar] [CrossRef]
- Zhang, Q.; Xiao, M.Z.; Singh, V.P.; Li, J.F. Regionalization and spatial changing properties of droughts across the Pearl River basin, China. J. Hydrol. 2012, 472–473, 355–366. [Google Scholar] [CrossRef]
- Long, D.; Scanlon, B.R.; Longuevergne, L.; Sun, A.; Fernando, N.D.; Save, H. GRACE satellite monitoring of large depletion in water storage in response to the 2011 drought in Texas. Geophys. Res. Lett. 2013, 40, 3395–3401. [Google Scholar] [CrossRef]
- Sun, P.; Zhang, Q.; Wen, Q.Z.; Singh, V.P.; Shi, P.J. Multisource data based integrated agricultural drought monitoring in the Huai River basin, China. J. Geophys. Res. Atmos. 2017, 122, 10751–10772. [Google Scholar] [CrossRef]
- Sun, S.L.; Li, Q.Q.; Li, J.J.; Wang, G.J.; Zhou, S.J.; Chai, R.F.; Hua, W.J.; Deng, P.; Wang, J.; Lou, W.P. Revisiting the evolution of the 2009–2011 meteorological drought over Southwest China. J. Hydrol. 2019, 568, 385–402. [Google Scholar] [CrossRef]
- Zhang, Q.; Yu, H.Q.; Sun, P.; Singh, V.P.; Shi, P.J. Multisource data based agricultural drought monitoring and agricultural loss in China. Glob. Planet. Chang. 2019, 172, 298–306. [Google Scholar] [CrossRef]
- Wang, Y.D.; Liu, X.L.; Ren, G.X.; Yang, G.H.; Feng, Y.Z. Analysis of the spatiotemporal variability of droughts and the effects of drought on potato production in northern China. Agric. For. Meteorol. 2019, 264, 334–342. [Google Scholar] [CrossRef]
- Hao, Z.C.; Singh, V.P. Drought characterization from a multivariate perspective: A review. J. Hydrol. 2015, 527, 668–678. [Google Scholar] [CrossRef]
- Vicent-eserrano, S.M.; Beguería, S.; Lópezmoreno, J.I.; Angulo-Martinez, M.; Kenawy, A. A new global 0.5° gridded dataset (1901–2006) of a multiscalar drought index: Comparison with current drought index datasets based on the Palmer drought severity index. J. Hydrometeorol. 2010, 11, 1033–1043. [Google Scholar] [CrossRef]
- Wu, Z.; Xu, H.; Li, Y.; Wen, L.; Li, J.Q.; Lu, G.H.; Li, X.Y. Climate and drought risk regionalisation in China based on probabilistic aridity and drought index. Sci. Total Environ. 2018, 612, 513–521. [Google Scholar] [CrossRef] [PubMed]
- Montaseri, M.; Amirataee, B.; Rezaie, H. New Approach in Bivariate Drought Duration and Severity Analysis. J. Hydrol. 2018, 559, 166–181. [Google Scholar] [CrossRef]
- Sun, P.; Zhang, Q.; Yao, R.; Singh, V.P.; Song, C.Q. Low Flow Regimes of the Tarim River Basin, China: Probabilistic Behavior, Causes and Implications. Water 2018, 10, 470. [Google Scholar] [CrossRef]
- Liu, Y. Hydroclimatological influences on recently increased droughts in China’s largest freshwater lake. Hydrol. Earth Syst. Sci. 2016, 20, 93–107. [Google Scholar] [CrossRef]
- Zhang, D.; Chen, P.; Zhang, Q.; Li, X.H. Copula-based probability of concurrent hydrological drought in the Poyang lake-catchment-river system (China) from 1960 to 2013. J. Hydrol. 2017, 553, 773–784. [Google Scholar] [CrossRef]
- Sun, P.; Sun, Y.Y.; Zhang, Q.; Yao, R. Hydrological processes in the Huaihe River Basin, China: Seasonal variations, causes and implications. Chin. Geogr. Sci. 2018, 28, 636–653. [Google Scholar] [CrossRef]
- Zhang, Q.; Wang, Y.; Singh, V.P.; Gu, X.H.; Kong, D.D.; Xiao, M.Z. Impacts of ENSO and ENSO Modoki+A regimes on seasonal precipitation variations and possible underlying causes in the Huai River basin, China. J. Hydrol. 2016, 533, 308–319. [Google Scholar] [CrossRef]
- Pan, Z.; Ruan, X.H.; Xu, J. Spatio-temporal variability of streamflow in the Huaihe River basin, China: Climate variability or human activities? Hydrol. Res. 2018, 49, 177–193. [Google Scholar] [CrossRef]
- Yan, D.H.; Wu, D.; Huang, R.; Wang, L.N.; Yang, G.Y. Drought evolution characteristics and precipitation intensity changes during alternating dry–wet changes in the Huang-Huai-Hai River basin. Hydrol. Earth Syst. Sci. 2013, 17, 2859–2871. [Google Scholar] [CrossRef]
- Shi, P.; Wu, M.; Ma, X.X.; Qu, S.M.; Qiao, X.Y. Stream-Flow Response to Climate Change and Human Activities in an Upstream Catchment of Huai River. J. Geophys. Res. Atmos. 2014, 119, 10702–10719. [Google Scholar] [CrossRef]
- Wu, S.F.; Zhang, X.; She, D.X. Joint pattern of seasonal hydrological droughts and floods alternation in China’s Huai River Basin using the multivariate L-moments. J. Earth Syst. Sci. 2017, 126, 48. [Google Scholar] [CrossRef]
- Ji, Z.; Li, N.; Wu, X. Threshold determination and hazard evaluation of the disaster about drought/flood sudden alternation in Huaihe River basin, China. Theor. Appl. Climatol. 2017, 133, 1–11. [Google Scholar] [CrossRef]
- Wen, Z.; Yan, R.; Ma, X.L.; Hu, Y.J. Estimation of soil moisture with drought indices in Huaihe River Basin of East China. Remote Sens. Land Resour. 2018, 30, 73–79. [Google Scholar]
- Geng, S.; Yan, D.H.; Yang, Z.Y.; Zhang, Z.B.; Yang, M.J.; Kan, G.Y. Characteristics Analysis of Summer Maize Yield Loss Caused by Drought Stress in the Northern Huaihe Plain, China. Irrig. Drain. 2017, 67. [Google Scholar] [CrossRef]
- Dodangeh, E.; Shahedi, K.; Shiau, J.T.; MirAkbari, M. Spatial hydrological drought characteristics in Karkheh River basin, southwest Iran using copulas. J. Earth Syst. Sci. 2017, 126, 80. [Google Scholar] [CrossRef]
- Chang, J.X.; Li, Y.Y.; Wang, Y.M.; Yuan, M. Copula-based drought risk assessment combined with an integrated index in the Wei River Basin. China J. Hydrol. 2016, 540, 824–834. [Google Scholar] [CrossRef]
- Zhang, Y.Y.; Shao, Q.X.; Xia, J.; Stuart, E.B.; Zuo, Q.T. Changes of flow regimes and precipitation in Huai River Basin in the last half century. Hydrol. Process. 2011, 25, 246–257. [Google Scholar] [CrossRef]
- Resources and Environmental Data Cloud Platform. Available online: http://www.resdc.cn (accessed on 28 October 2019).
- Yevjevich, V.M. An Objective Approach to Definitions and Investigations of Continental Hydrologic Droughts; Hydrologic Paper; Colorado State University: Fort Collins, CO, USA, 1967. [Google Scholar]
- Zelenhasic, E.; Salvai, A. A method of streamflow drought analysis. Water Resour. Res. 1987, 23, 156–168. [Google Scholar] [CrossRef]
- Fleig, A.K.; Tallaksen, L.M.; Hisdal, H.; Demuth, S. A global evaluation of streamflow drought characteristics. Hydrol. Earth Syst. Sci. 2006, 10, 535–552. [Google Scholar] [CrossRef]
- Tallaksen, L.M.; Madsen, H.; Clausen, B. On the definition and modelling of streamflow drought duration and deficit volume. Hydrol. Sci. J. 1997, 42, 15–33. [Google Scholar] [CrossRef]
- Madsen, H.; Rosbjerg, D. On the modelling of extreme droughts. IAHS Publ. Ser. Proc. Rep. Intern. Assoc. Hydrol. Sci. 1995, 231, 377–386. [Google Scholar]
- Zhang, Q.; Xiao, M.Z.; Singh, V.P.; Chen, X.H. Copula-based risk evaluation of hydrological droughts in the East River basin, China. Stoch. Environ. Res. Risk Assess. 2013, 27, 1397–1406. [Google Scholar] [CrossRef]
- Hosking, J.R.M. L-moments: Analysis and estimation of distributions using linear combinations of order statistics. J. R. Stat. Soc. 1990, 52, 105–124. [Google Scholar] [CrossRef]
- Zhang, L.; Singh, V.P. Bivariate rainfall frequency distributions using Archimedean copulas. J. Hydrol. 2007, 332, 93–109. [Google Scholar] [CrossRef]
- Genest, C.; Mackay, L. The joy of copulas: Bivariate distributions with uniform marginals. Am. Stat. 1986, 40, 280–283. [Google Scholar]
- Zhang, Q.; Sun, P.; Chen, X.H.; Jiang, T. Hydrological extremes in the Poyang Lake basin, China: Changing properties, causes and impacts. Hydrol. Process. 2011, 25, 3121–3130. [Google Scholar] [CrossRef]
- Sadegh, M.; Ragno, E.; Aghakouchak, A. Multivariate Copula Analysis Toolbox (MvCAT): Describing dependence and underlying uncertainty using a Bayesian framework. Water Resour. Res. 2017, 53, 5166–5183. [Google Scholar] [CrossRef]
- Geweke, J. Bayesian inference in econometric models using Monte Carlo integration. Econometrica 1989, 57, 1317–1339. [Google Scholar] [CrossRef]
- Geweke, J. Exact predictive densities for linear models with arch disturbances. J. Econ. 1989, 40, 63–86. [Google Scholar] [CrossRef]
- Jarrell, M.; Gubernatis, J.E. Bayesian inference and the analytic continuation of imaginary-time quantum Monte Carlo data. Phys. Rep. 1996, 269, 133–195. [Google Scholar] [CrossRef] [Green Version]
- Ellison, A.M. Bayesian inference in ecology. Ecol. Lett. 2004, 7, 509–520. [Google Scholar] [CrossRef]
- Wood, E.F.; Rodriguez-Iturbe, I. Bayesian inference and decision making for extreme hydrologic events. Water Resour. Res. 1975, 11, 533–542. [Google Scholar] [CrossRef]
- Kavetski, D.; Kuczera, G.; Franks, S.W. Bayesian analysis of input uncertainty in hydrological modeling: 2. Appl. Water Resour. Res. 2006, 42, W03408. [Google Scholar] [CrossRef]
- Cheng, L.; AghaKouchak, A.; Gilleland, E.; Katz, R.W. Non-stationary extreme value analysis in a changing climate. Clim. Chang. 2014, 127, 353–369. [Google Scholar] [CrossRef]
- Thiemann, M.; Trosset, M.; Gupta, H.; Sorooshian, S. Bayesian recursive parameter estimation for hydrologic models. Water Resour. Res. 2001, 37, 2521–2535. [Google Scholar] [CrossRef]
- Sorooshian, S.; Dracup, J.A. Stochastic parameter estimation procedures for hydrologie rainfall-runoff models: Correlated and heteroscedastic error cases. Water Resour. Res. 1980, 16, 430–442. [Google Scholar] [CrossRef]
- Andrieu, C.; Thoms, J. A tutorial on adaptive MCMC. Stat. Comput. 2008, 18, 343–373. [Google Scholar] [CrossRef]
- Akaike, H. A new look at the statistical model identification. IEEE Trans. Autom. Control 1974, 19, 716–723. [Google Scholar] [CrossRef]
- Akaike, H. Information theory and an extension of the maximum likelihood principle. Int. Symp. Inf. Theory 2012, 1, 610–624. [Google Scholar]
- Feng, W.L.; Liu, Y.S.; Qu, L.L. Effect of land-centered urbanization on rural development: A regional analysis in China. Land Use Policy 2019, 87, 104072. [Google Scholar] [CrossRef]
- Yan, D.H.; Han, D.M.; Wang, G.; Yuan, Y.; Hu, Y.; Fang, Y. The evolution analysis of flood and drought in huai river basin of china based on monthly precipitation characteristics. Nat. Hazards 2014, 73, 849–858. [Google Scholar] [CrossRef]
- Wang, Y.; Zhang, Q.; Singh, V.P. Spatiotemporal patterns of precipitation regimes in the Huai River basin, China, and possible relations with ENSO events. Nat. Hazards 2016, 82, 2167–2185. [Google Scholar] [CrossRef]
- Xia, M.; Sun, P.; Zhang, Q.; Yao, R.; Wang, Y.Z.; Wen, Q.Z. Temporal and spatial characteristic of drought in Huai River Basin based on standardized precipitation evapotranspiration index. Acta Ecol. Sin. 2019, 39, 3643–3654. [Google Scholar]
- Liu, Y.N.; Gu HZhang, M.; Wang, J.D.; Wang, H. Handbook of Irrigation Area in Huaihe River Basin; Water&Power Press: Beijing, China, 2014. [Google Scholar]
- Chen, Y.; Gao, G.; Ren, G.Y.; Liao, Y.M. Spatial and temporal variation of precipitation over ten major basins in China between 1956 and 2000. J. Nat. Resour. 2005, 20, 637–643. [Google Scholar]
- Zheng, Y.J.; Zhang, Q.; Chen, X.H. Changing properties of precipitation structure during 1961–2005 across the Huaihe Basin. J. Wuhan Univ. 2015, 61, 247–254. [Google Scholar]
- Tan, Y.J.; Qiu, X.F.; Zeng, Y. Variation trend of precipitation in different river basins in recent 50 years. J. Meteorol. Sci. 2016, 36, 494–501. [Google Scholar]
- Ning, Y.; Qian, M.; Wang, Y.T. Handbook of Water Conservancy in Huaihe Basin; Science Press: Beijing, China, 2003; pp. 25–33. [Google Scholar]
Figure 1.
Locations of the hydrological stations and irrigation area.
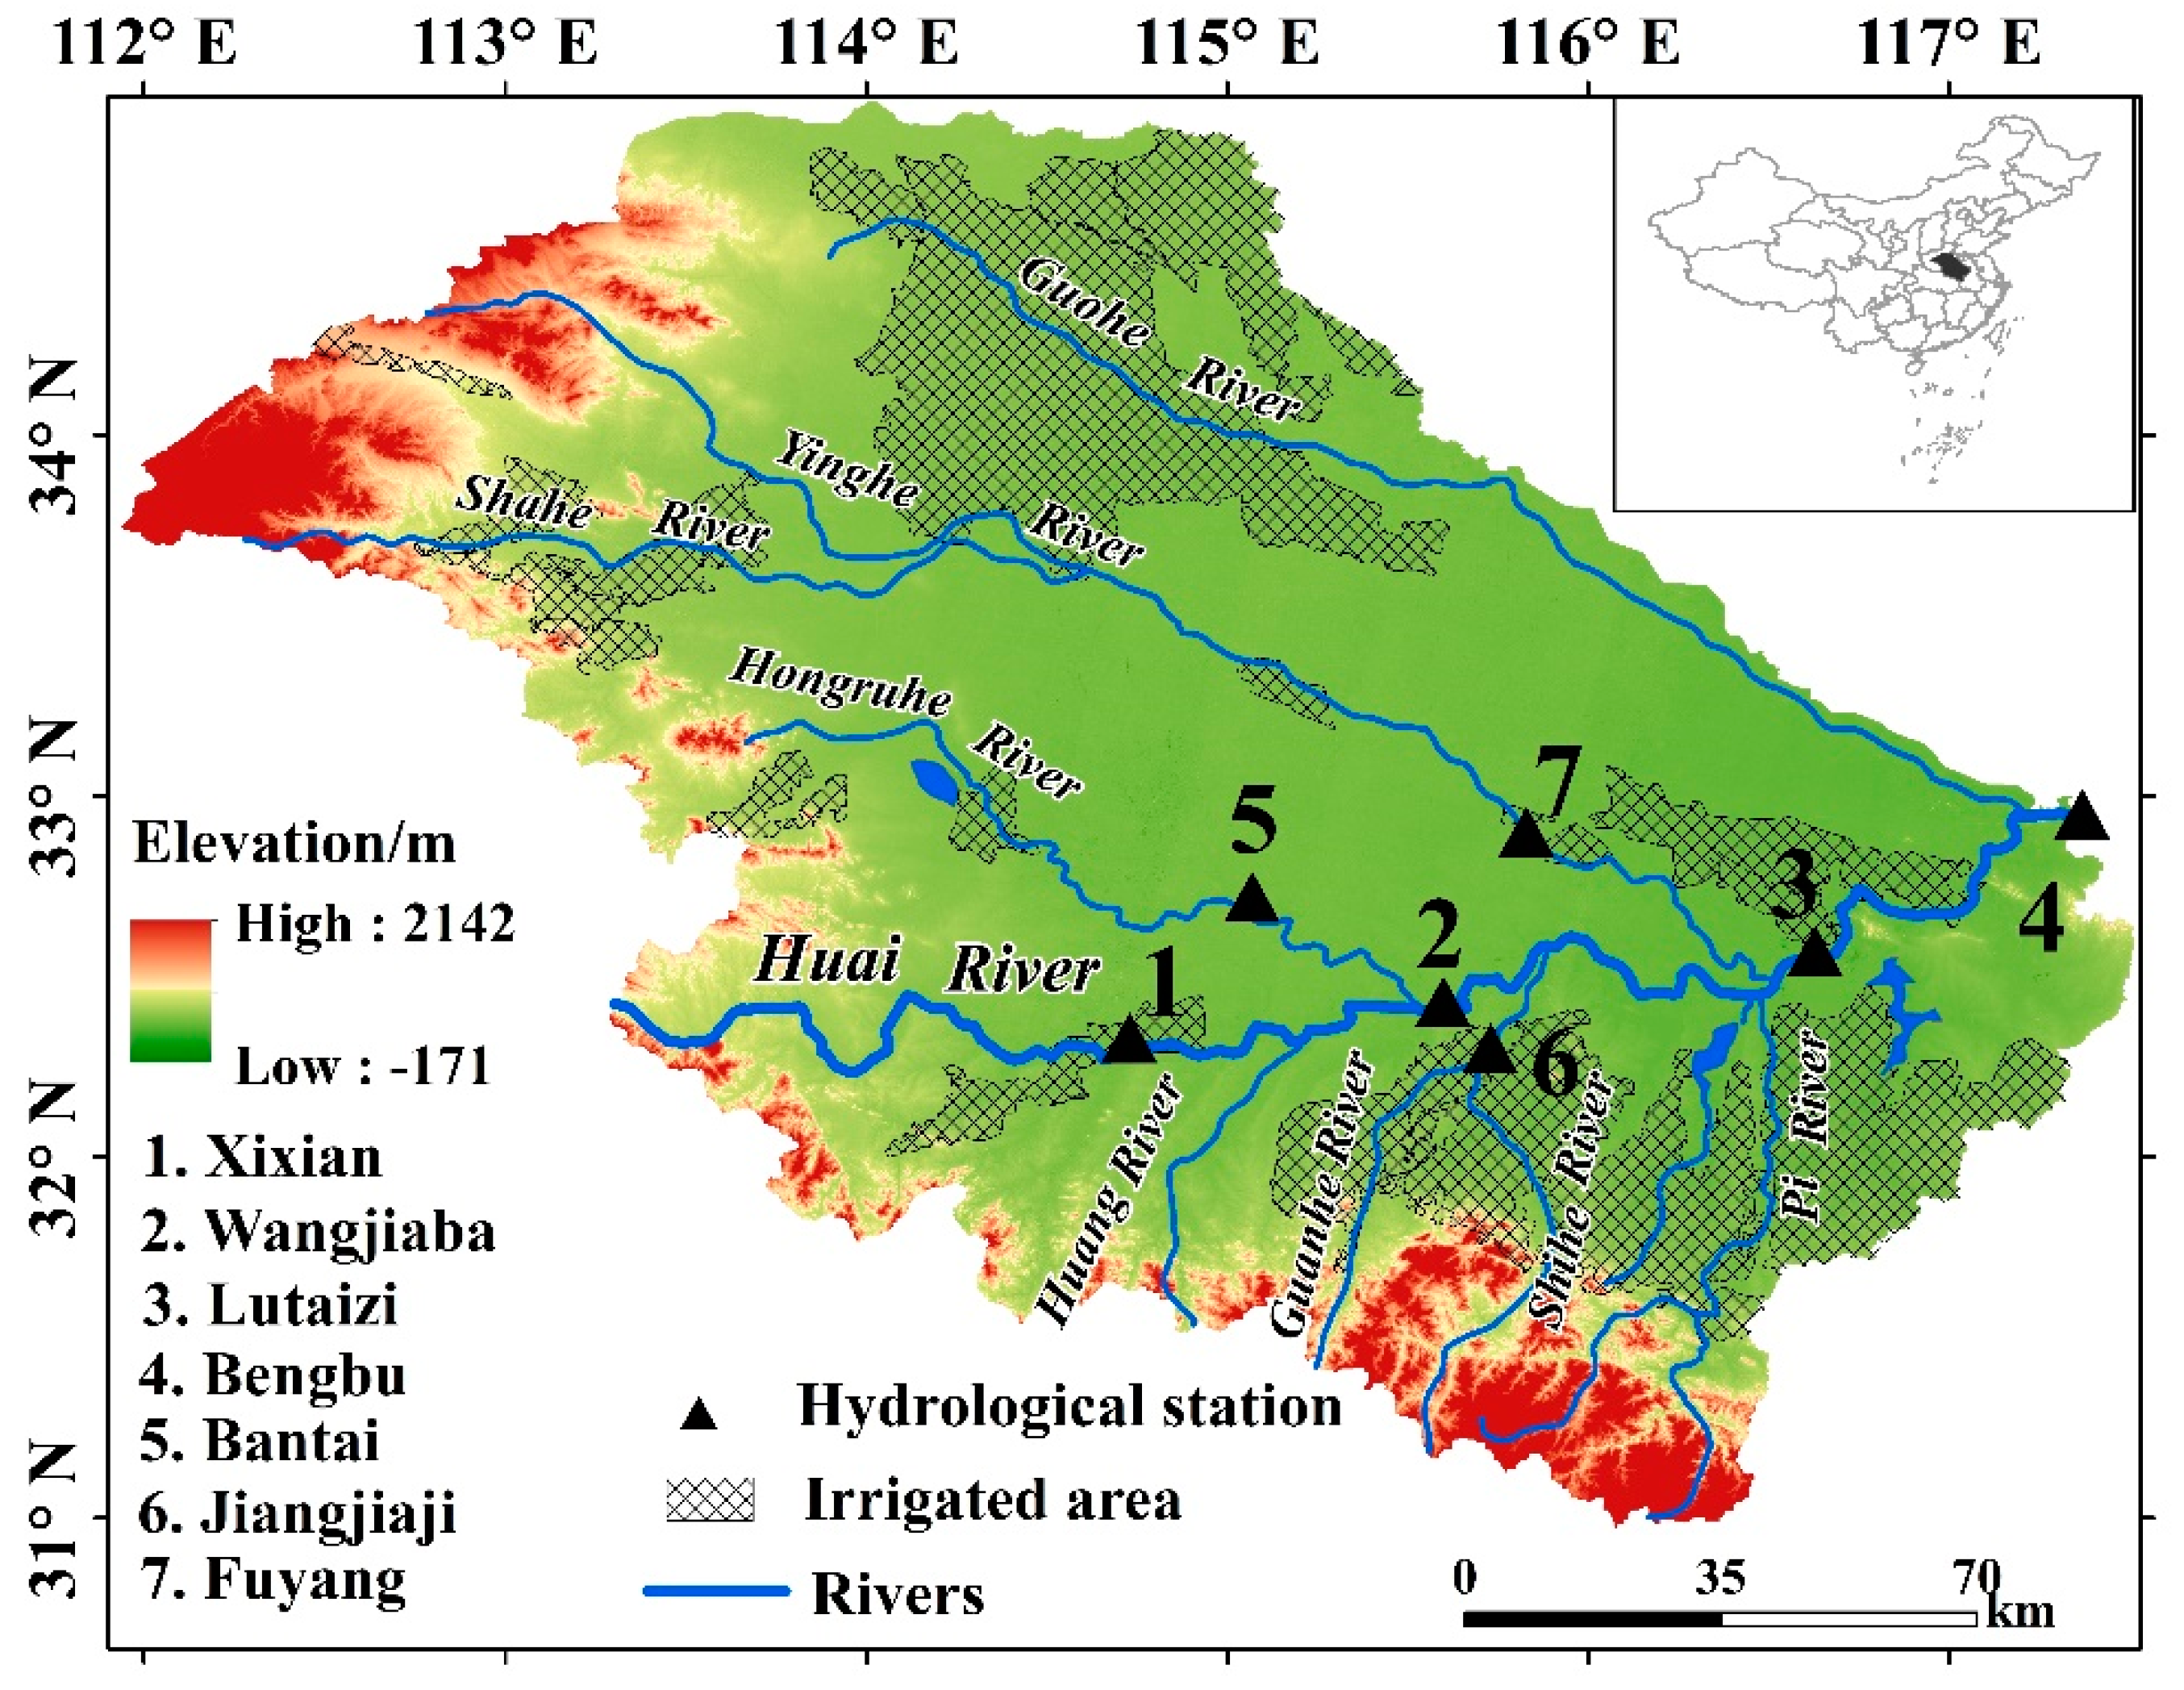
Figure 2.
Definition of drought events using run theory.

Figure 3.
Hydrological drought duration in the Huai River Basin.

Figure 4.
Spatial transformation variation map of land-use type of the Huai River Basin.
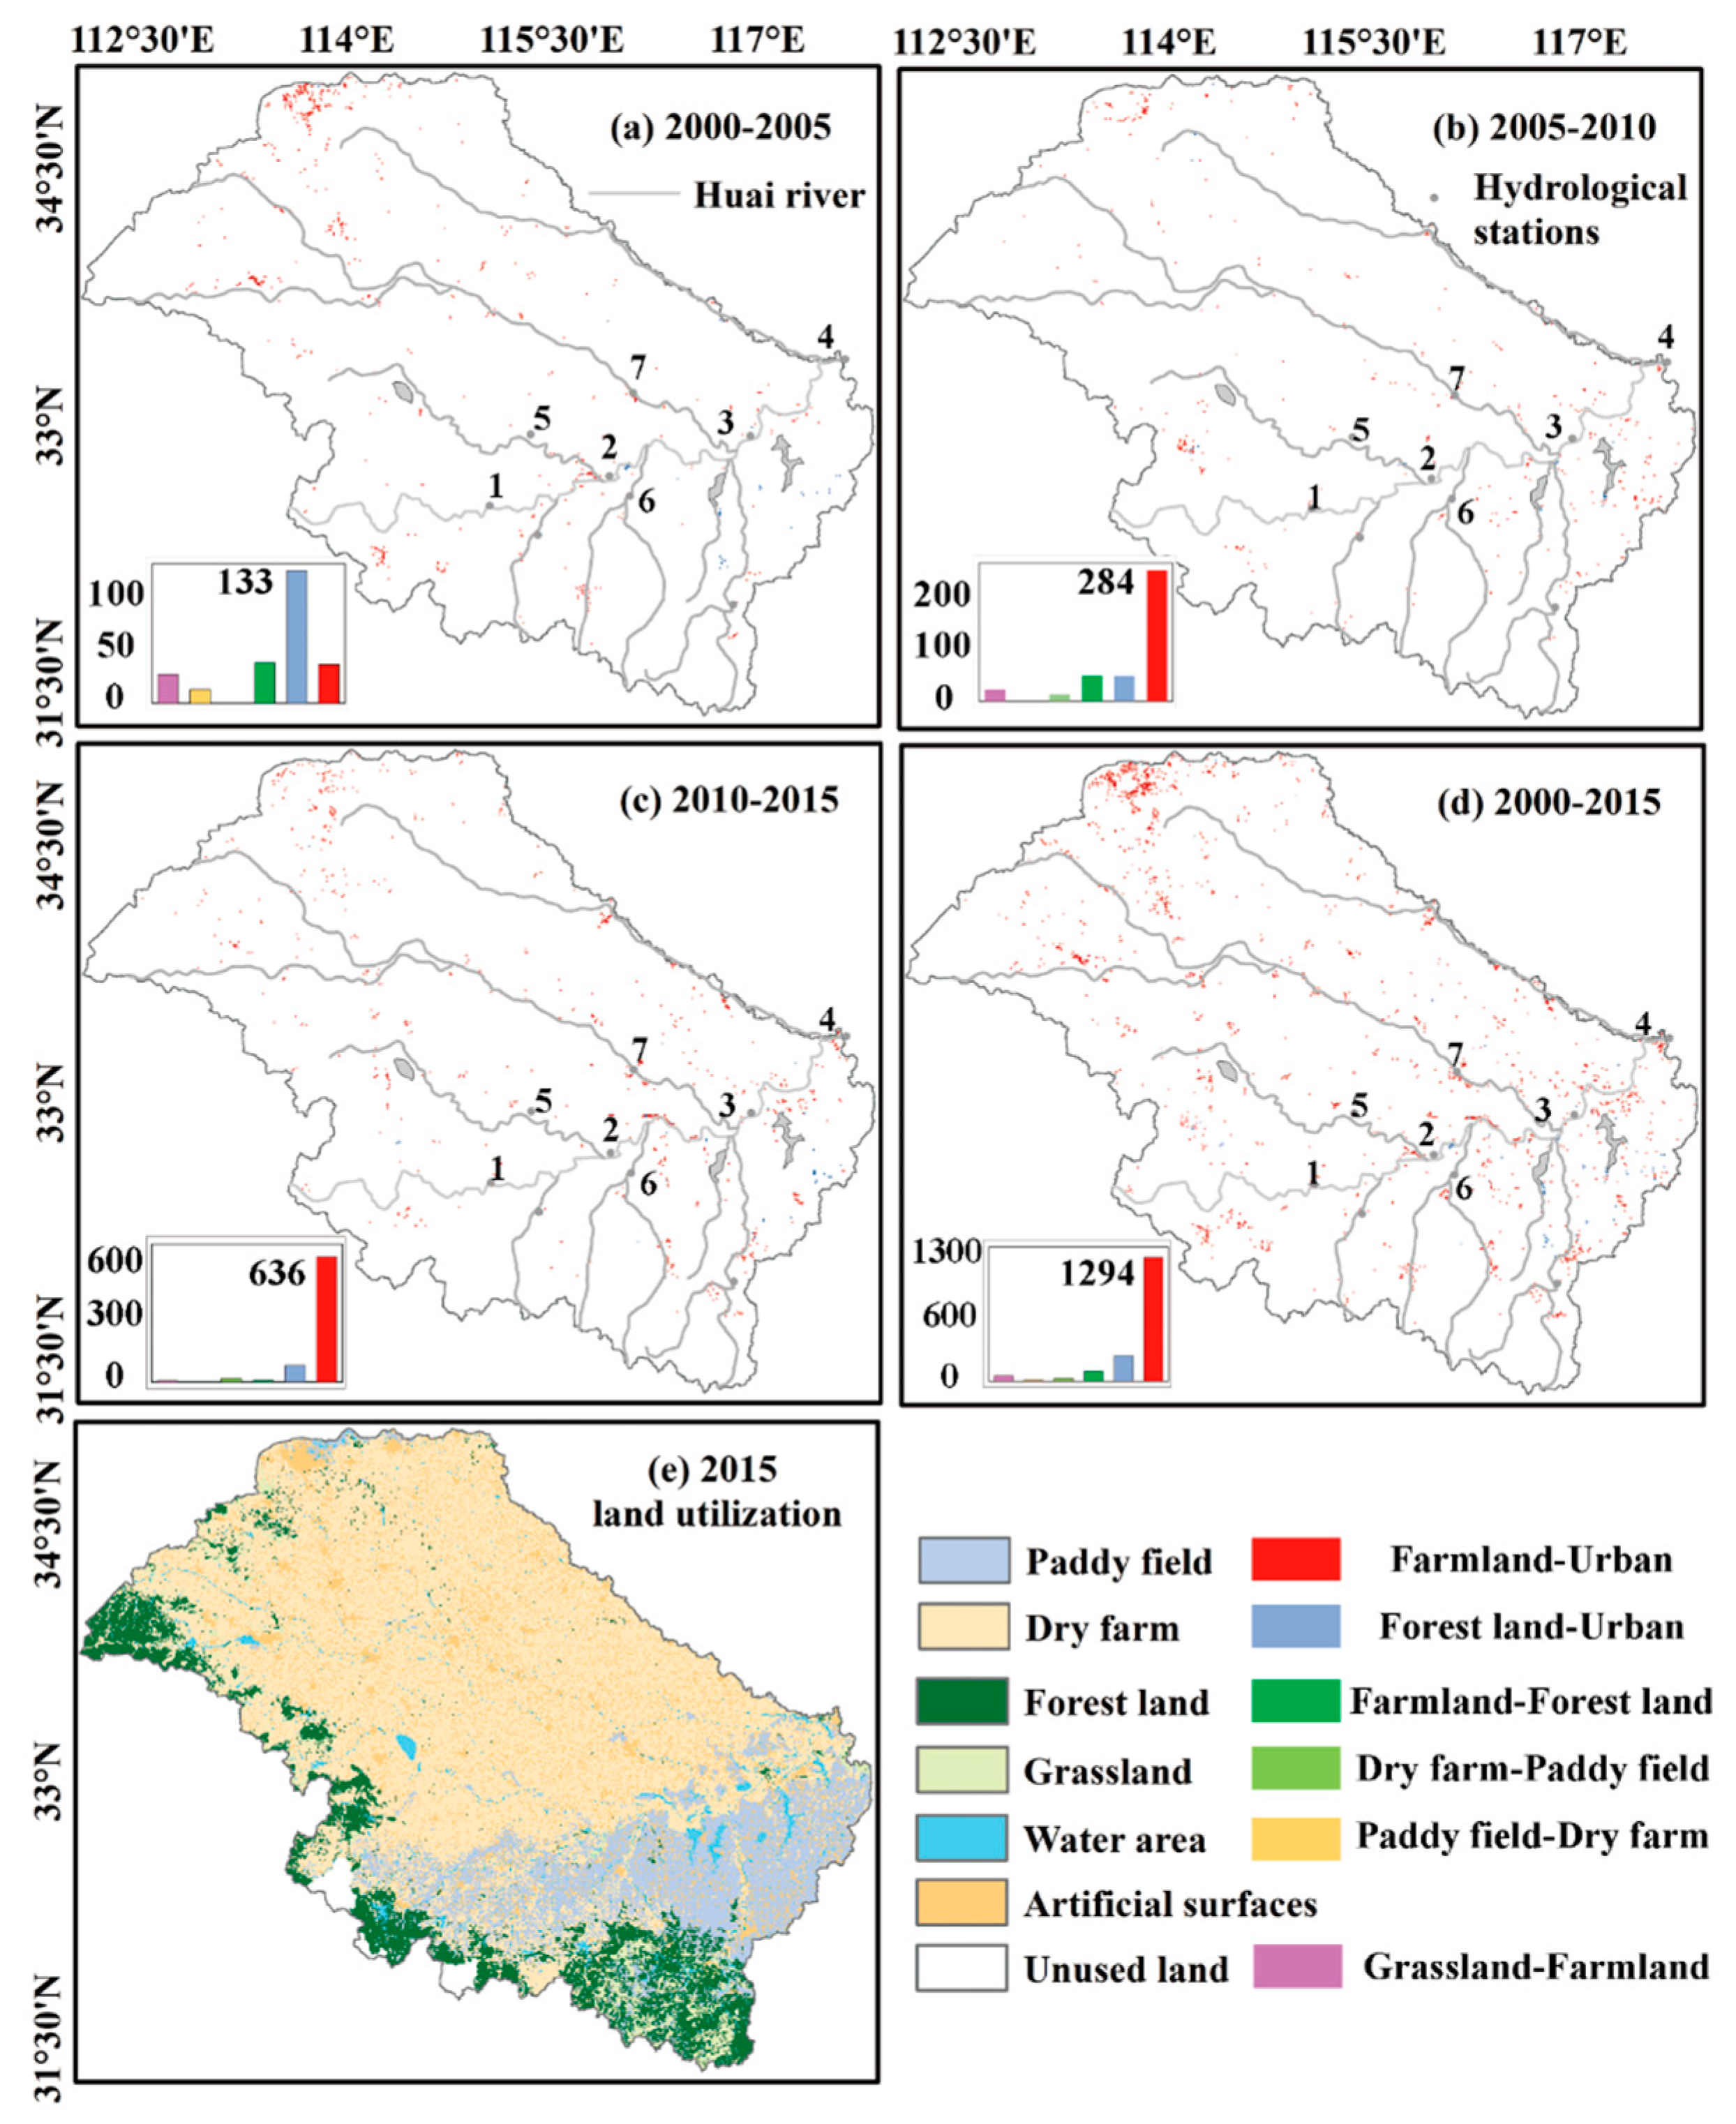
Figure 5.
The value of goodness-of-fit based on AIC for nine probability distribution functions describing the statistical properties of drought-duration in the Huaihe river basin.
Figure 5.
The value of goodness-of-fit based on AIC for nine probability distribution functions describing the statistical properties of drought-duration in the Huaihe river basin.

Figure 6.
The value of goodness-of-fit based on AIC for nine probability distribution functions describing the statistical properties of drought-severity in Huaihe river basin.
Figure 6.
The value of goodness-of-fit based on AIC for nine probability distribution functions describing the statistical properties of drought-severity in Huaihe river basin.

Figure 7.
Frequency distribution of drought severity.

Figure 8.
Frequency distribution of drought duration.

Figure 9.
Return periods of drought duration (A) and drought-severity (B). XX: Xixian; WJB: Wangjiaba; LTZ: Lutaizi; BB: Bengbu; BT: Bantai; JJJ: Jiangjiaji; FY: Fuyang.
Figure 9.
Return periods of drought duration (A) and drought-severity (B). XX: Xixian; WJB: Wangjiaba; LTZ: Lutaizi; BB: Bengbu; BT: Bantai; JJJ: Jiangjiaji; FY: Fuyang.

Figure 10.
The value of goodness-of fit based on AIC in the Tarim River Basin.

Figure 11.
Joe Copula’s Joint return period (A) and the current return period (B) in Wangjiaba station.
Figure 11.
Joe Copula’s Joint return period (A) and the current return period (B) in Wangjiaba station.


Figure 12.
Different frequency combinations of drought duration and drought severity return period and with Joint return period (A) and the current return period (B). 1: Xixian; 2: Wangjiaba; 3: Lutaizi; 4: Bengbu; 5: Bantai; 6: Jiangjiaji; 7: Fuyang.
Figure 12.
Different frequency combinations of drought duration and drought severity return period and with Joint return period (A) and the current return period (B). 1: Xixian; 2: Wangjiaba; 3: Lutaizi; 4: Bengbu; 5: Bantai; 6: Jiangjiaji; 7: Fuyang.

Figure 13.
Affected area and disaster area of crop from 1981 to 2014 in the Anhui province.


Table 1.
Information of hydrological station in Huai River Basin.
| River | Station | Basin Area (km2) | Length (km) | Slope of River (%) | Runoff (108 m3) | Runoff Depth (mm) | |
|---|---|---|---|---|---|---|---|
| Main stream | Upper | Xixian | 10,190 | 250 | 4.9 | 62.2 | 60.8 |
| Upper | Wangjiaba | 30,630 | 364 | 0.35 | 99.8 | 32.5 | |
| Middle | Lutaizi | 88,630 | 529 | 0.3 | 250 | 28.2 | |
| Middle | Bengbu | 121,330 | 651 | 0.3 | 299 | 24.6 | |
| Tributary | Hongru | Bantai | 11,663 | 240 | 1 | 28.1 | 24.0 |
| Shiguan | Jiangjiaji | 5930 | 172 | 9.2 | 31.5 | 53.1 | |
| Shaying | Fuyang | 35,250 | 490 | 0.03 | 55.6 | 15.7 | |
Table 2.
Copula families and their closed-form mathematical description.
| Name | Mathematical Descriptiona | Parameter Range |
|---|---|---|
| Gaussian | ||
| t | ||
| Clayton | ||
| Frank | ||
| Gumbel | ||
| Independence | ||
| Ali-Mikhail-Haq (AMH) | ||
| Joe | ||
| Farlie-Gumbel-Morgenstern (FGM) | ||
| Gumbel-Barnett | ||
| Plackett | ||
| Cuadras-Auge | ||
| Raftery | ||
| Shih-Louis | ||
| Linear-Spearman | ||
| Cubic | ||
| Burr | ||
| Nelsen | ||
| Galambos | ||
| Marshall-Olkin | ||
| Fischer-Hinzmann | ||
| Roch-Alegre | ||
| Fischer-Kock | ||
| BB1 | ||
| BB5 | ||
| Tawn |
Table 3.
Basic drought statistical properties of drought-duration (D) and drought-severity (S) at the seven stations of the Huaihe River Basin.
Table 3.
Basic drought statistical properties of drought-duration (D) and drought-severity (S) at the seven stations of the Huaihe River Basin.
| Stations | Times | D | Maximum D | S | Correlation of D and S | Trend of D | Trend of S |
|---|---|---|---|---|---|---|---|
| Xixian | 191 | 22 | 189 | 323 | 0.92 | 0.01 | 0.3 |
| Wangjiaba | 190 | 22 | 207 | 702 | 0.84 | 0.01 | 0.50 |
| Lutaizi | 165 | 26 | 245 | 2095 | 0.83 | −0.03 | −1.49 |
| Bengbu | 143 | 29 | 247 | 2268 | 0.90 | 0.00 | −1.17 |
| Bantai | 172 | 24 | 197 | 110 | 0.89 | 0.01 | 0.08 |
| Jiangjiaji | 178 | 23 | 242 | 94 | 0.67 | 0.00 | 0.03 |
| Fuyang | 159 | 25 | 250 | 228 | 0.80 | −0.04 | −0.13 |
Table 4.
Dynamic variation of land-use of the Huai River Basin from 2000 to 2015 (km2).
| Land Use Change | 2000–2005 | 2005–2010 | 2010–2015 | 2000–2015 |
|---|---|---|---|---|
| Grassland-Farmland | 29 | 26 | 7 | 60 |
| Paddy field-Dry farm | 14 | 0 | 0 | 14 |
| Dry farm-Paddy field | 0 | 16 | 18 | 34 |
| Farmland-Forestland | 41 | 56 | 10 | 106 |
| Forest land-Artificial surfaces | 133 | 55 | 84 | 268 |
| Farmland-Artificial surfaces | 39 | 284 | 636 | 1294 |
Table 5.
Parameters estimated by L-Moment for the Generalized Pareto and the Generalized Extreme Value functions in terms of drought duration and drought severity.
Table 5.
Parameters estimated by L-Moment for the Generalized Pareto and the Generalized Extreme Value functions in terms of drought duration and drought severity.
| Stations | Drought Duration | Drought Severity | ||||
|---|---|---|---|---|---|---|
| Generalized Pareto | Generalized Extreme Value | |||||
| k | σ | θ | k | σ | μ | |
| Xixian | 0.48 | 8.44 | 7.00 | −0.55 | 3.42 | 15.56 |
| Wangjiaba | 0.57 | 7.85 | 7.00 | −0.62 | 9.71 | 34.73 |
| Lutaizi | 0.79 | 7.12 | 7.00 | −0.57 | 25.08 | 89.98 |
| Bengbu | 0.60 | 10.49 | 7.00 | −0.44 | 28.82 | 77.89 |
| Bantai | 0.61 | 8.00 | 7.00 | −0.50 | 1.61 | 4.76 |
| Jiangjiaji | 0.51 | 8.62 | 7.00 | −0.55 | 1.75 | 4.57 |
| Fuyang | 0.79 | 6.46 | 7.00 | −0.39 | 3.85 | 9.47 |
Table 6.
Return periods of drought duration.
| Return Period | Xixian | Wangjiaba | Lutaizi | Bengbu | Bantai | Jiangjiaji | Fuyang |
|---|---|---|---|---|---|---|---|
| 5 | 27 | 28 | 38 | 35 | 29 | 29 | 28 |
| 10 | 42 | 44 | 58 | 59 | 47 | 45 | 49 |
| 20 | 63 | 69 | 81 | 94 | 76 | 68 | 86 |
| 30 | 79 | 89 | 97 | 123 | 99 | 86 | 119 |
| 50 | 104 | 121 | 118 | 171 | 137 | 115 | 179 |
| 70 | 124 | 147 | 134 | 211 | 170 | 138 | 233 |
| 100 | 149 | 182 | 152 | 264 | 213 | 168 | 310 |
Table 7.
Estimated parameters of the best copula function.
| Station | Copula Fuction | θ1 | θ2 | θ3 |
|---|---|---|---|---|
| Xixian | Joe | 9.43 | — | — |
| Wangjiaba | Tawn | 0.90 | 1.00 | 6.85 |
| Lutaizi | Joe | 8.57 | — | — |
| Bengbu | Tawn | 0.85 | 1.00 | 4.51 |
| Bantai | Tawn | 0.85 | 1.00 | 5.14 |
| Jiangjiaji | Tawn | 0.72 | 1.00 | 5.60 |
| Fuyang | Joe | 4.61 | — | — |
© 2019 by the authors. Licensee MDPI, Basel, Switzerland. This article is an open access article distributed under the terms and conditions of the Creative Commons Attribution (CC BY) license (http://creativecommons.org/licenses/by/4.0/).
Share and Cite
MDPI and ACS Style
Sun, P.; Zhang, Q.; Yao, R.; Wen, Q. Hydrological Drought Regimes of the Huai River Basin, China: Probabilistic Behavior, Causes and Implications. Water 2019, 11, 2390. https://doi.org/10.3390/w11112390
AMA Style
Sun P, Zhang Q, Yao R, Wen Q. Hydrological Drought Regimes of the Huai River Basin, China: Probabilistic Behavior, Causes and Implications. Water. 2019; 11(11):2390. https://doi.org/10.3390/w11112390
Chicago/Turabian StyleSun, Peng, Qiang Zhang, Rui Yao, and Qingzhi Wen. 2019. "Hydrological Drought Regimes of the Huai River Basin, China: Probabilistic Behavior, Causes and Implications" Water 11, no. 11: 2390. https://doi.org/10.3390/w11112390
Note that from the first issue of 2016, this journal uses article numbers instead of page numbers. See further details here.