Article

Interactive Effect of Meteorological Drought and Vegetation Types on Root Zone Soil Moisture and Runoff in Rangeland Watersheds

1
Tianjin Key Laboratory of Water Resources and Environment, Tianjin Normal University, No. 393 Binshuixi Road, Xiqing District, Tianjin 300387, China
2
College of Life Science and Technology, Jinan University, Tianhe District, Guangzhou 510632, China
3
School of Geographic and Environmental Sciences, Tianjin Normal University, No. 393 Binshuixi Road, Xiqing District, Tianjin 300387, China
4
Department of Environmental Sciences, Texas Christian University, Fort Worth, TX 76129, USA
5
Tianjin Key Laboratory of Wireless Mobile Communications and PowerTransmission, Tianjin Normal University, No. 393 Binshuixi Road, Xiqing District, Tianjin 300387, China
6
Department of Natural Resource Ecology and Management, Oklahoma State University, Stillwater, OK 74078, USA
*
Author to whom correspondence should be addressed.
Water 2019, 11(11), 2357; https://doi.org/10.3390/w11112357
Submission received: 22 September 2019 / Revised: 7 November 2019 / Accepted: 7 November 2019 / Published: 10 November 2019
(This article belongs to the Section Hydrology)

Abstract

:
The meteorological droughts in the climate transition zone of the Great Plains of the USA are projected to intensify, potentially leading to major shifts in water provisioning services in rangelands. To understand how meteorological drought interacts with vegetation to regulate runoff response, we collected precipitation, root zone soil moisture, and runoff data from experimental grassland and juniper (Juniperus virginiana L., redcedar) woodland watersheds for five years encompassing a drought year to pluvial year cycle. We contrasted the frequency distribution of precipitation intensities and applied wavelet analysis to reveal the coherence between precipitation and root zone soil moisture patterns. Compared with grassland, the root zone soil moisture in woodland had a narrower range, with the peak frequency skewed to a lower soil moisture content. The conversion of herbaceous vegetation to evergreen juniper woodland results in a delayed response of runoff to precipitation due to reduced antecedent soil moisture. The reduction of streamflow from the woodland watershed was greater in the normal and pluvial years than in the drought year. Thus, conversion from grassland to evergreen woody vegetation prolongs the impact of meteorological drought on soil moisture and streamflow. Restoring prairie that is heavily encroached by woody species may serve as an adaptive measure to mitigate the climate change impact on water resources and other ecosystem services provided by rangeland.

1. Introduction

Root zone soil moisture is positively correlated with streamflow potential in semiarid and subhumid rangelands [1,2,3]. For these rangelands, streamflow is an important ecosystem service dominated by surface runoff generated from infiltration excess or saturation excess overland flow [4,5]. The amount and the partition of those two overland flow processes are largely controlled by antecedent soil moisture conditions [6], climate (e.g., precipitation), and land surface permeability (e.g., vegetation type). The precipitation in rangelands is generally pulsed [7], and the magnitude and frequency of storm intensity vary greatly both spatially and temporally. As a result, the climate-change-induced precipitation anomalies and vegetation-induced changes in land surface permeability and plant water use will interact to control root zone soil moisture evolution and dynamics. These interactions alter the streamflow generation mechanism and ultimately modify the water resources provided by rangeland watersheds.
The Great Plains of the United States is susceptible to great climate anomalies, and any unusual sequences of rainfall events may flip a region from a drought condition in one year to a pluvial condition in the next year or even in the same year [8,9,10,11]. Projections that precipitation will increase during both winter and spring but decrease during summer and autumn [12] may mean that drought conditions will become more prevalent. A shift from pluvial condition to drought intensifies the root zone soil moisture stress and may translate a meteorological drought to a hydrological drought [13,14]. The temporal dynamics of root zone soil moisture are heavily influenced by changes in vegetation functional types [15,16]. The propagation of a precipitation pulse towards soil moisture is attenuated by the vegetation canopy interception and root zone water uptake [17,18,19].
During the last several decades, rangeland in the south-central Great Plains has been under a progressive transition from herbaceous towards woody dominance primarily due to the encroachment of shrubs and tree species [20], particularly eastern redcedar (Juniperus sp.) [21]. This process alters soil hydrological properties [22]. The soil infiltration capacity of 25.2 mm h−1 reported for restored grassland [23] is much less than the report of nearly 100 mm h−1 capacity for redcedar woodland [22]. Although an increase in soil infiltration capacity may assist conservation of water in the ecosystem by reducing overland flow from high-intensity storm events and may improve percolation of soil moisture to the deep soil layers [24], an increase in rooting zone soil moisture uptake and transpiration by woody plants may actually result in a reduction or depletion of rooting zone soil moisture [25,26]. For both grassland and juniper woodland watersheds, a decrease in root zone soil moisture is directly correlated with the reduction of runoff [6]. How, and if, woody plant encroachment affects root zone soil moisture differently during drought, normal, or pluvial years remains largely unexplored in the climate transition zone.
Root zone soil moisture is a transient property primarily controlled by stochastic precipitation forcing, antecedent soil moisture condition, topography, soil surface evaporation, and vegetation water uptake [27,28,29]. As a result, soil moisture exhibits stochastic behavior, and analysis in the frequency domain may provide an insightful assessment of the mean condition of soil moisture stress over a range of spatial and temporal scales. For the same reason, coherence analysis illustrates the probability or continuity of precipitation propagation through the soil profile and the potential for surface runoff and deep recharge.
The goal of this study is to reveal the vegetation and soil moisture interaction and streamflow responses during a period encompassing a transition from drought to the pluvial condition in the climate transition zone of the south-central Great Plains of the USA. We intend to answer three questions—1. How does the vegetation impact on soil moisture conditions in the drought, normal, and pluvial years? 2. How does the coherence of precipitation and soil moisture vary along with soil depth between grassland and woodland and evolve with the meteorological condition at the sub-seasonal scale? 3. How will precipitation and vegetation interact to dictate the annual runoff depth? In this study, we collected precipitation, soil moisture, and runoff data from a grassland watershed and an adjacent redcedar watershed for five years, encompassing a fast transition from a drought episode to a pluvial condition. We analyzed and contrasted the precipitation regimes and soil moisture dynamics at the sub-seasonal scale (weekly to bi-weekly) using frequency distribution and wavelet analysis. We analyzed the relationship between precipitation and streamflow for grassland and woodland watershed at an annual scale to illustrate the climatic dependence of vegetation impact on streamflow.

2. Method

2.1. Study Site

The study site is located in the Oklahoma State University Range Research Station, about 11 km southwest of Stillwater, Oklahoma, USA. The climate is continental with a long-term (1950 to 2016) mean annual precipitation of approximately 894 mm. The study site is mostly covered by a mosaic of grassland and oak woodland, with increasing areas being converted to evergreen woodland after decades-long encroachment by redcedar. The land is currently being managed for research purposes. To understand the hydrological impact of redcedar encroachment, multiple experimental watersheds, for each of the main vegetation types, were instrumented and monitored since 2008 or 2010 (see Qiao et al., 2015 for a detailed description of the watersheds) [30]. For this study, we chose one grassland watershed and one redcedar watershed, similar in size, slope, and well-drained soil, but different in vegetation cover.

2.2. Precipitation, Soil Moisture, and Streamflow Data

Precipitation in both grassland and redcedar woodland watersheds was determined by automatic siphoning tipping bucket rain gauges (TB3, Hydrological Services America, Lake Worth, FL, USA). The rain gauges, with 0.25 mm resolution, were capable of measuring rainfall intensities up to 500 mm h−1 with ±3% accuracy. The soil moisture content at multiple depths was measured using soil moisture sensor arrays (Meter Environment, Pullman, WA, USA). Each watershed was equipped with three arrays comprised of four ECH2O EC-5 sensors and an EM50 data logger simultaneously measuring and logging soil moisture content at four soil depths (5, 20, 45, and 80 cm) at 15 min intervals [22]. Runoff depth was quantified using H-flumes equipped with optical shaft encoders with a stage level resolution of 3 mm (50386SE-105, HydroLynx, West Sacramento, CA, USA). Each watershed had a rain gauge and shaft encoder connected to a data logger (CR1000 or CR200X, Campbell Scientific, Logan, UT, USA) to measure and record precipitation and runoff at five-minute intervals. The precipitation amounts recorded by the two rain gauges were similar, and in this study, we used the precipitation recorded at the redcedar woodland for the frequency and coherence analysis. Thirty-minute rainfall intensities (mm h−1) were used for frequency analysis.

2.3. Meteorological Drought Index

We used the Standardized Precipitation Index (SPI) [31] to calculate annual and monthly meteorological drought indices using 1950–2016 precipitation data for the study site (https://www.ars.usda.gov/; https://www.mesonet.org/). The year 2011 was identified as a drought year and 2015 as a pluvial year, whereas 2012, 2013, and 2014 were identified as normal years. For simplicity, we selected 2011, 2013, and 2015 to represent a drought year, a normal year, and a pluvial year, respectively, in the wavelet analysis.

2.4. Frequency Distribution

To facilitate the analysis of the frequency distribution of the time series (precipitation and soil moisture content), we arranged the series x n , n = 1 , 2 , , N Nin ascending order and divided the series into equidistant class intervals. The frequency of each interval was obtained by dividing the number that falls into each class by the total length of the series. The frequency distribution of precipitation was logarithmically transformed to facilitate visualization of the low frequency numbers in the histogram.

2.5. Wavelet Analysis

In this study, the Morlet wavelet ( ω 0 = 6 ) is used as follows:
ψ 0 ( t ) = π 1 / 4 e i ω 0 t e t 2 / 2
where ω 0 = a ω [ 1 ] and t = η / a [ 1 ] , respectively, are dimensionless frequency and dimensionless time, η is the time parameter [ T ] , ω is the frequency parameter [ 1 / T ] [32].
The continuous wavelet transform (CWT) of a time series x n , n = 1 , 2 , , N is its convolution with the stretched and translated wavelet function ψ 0 ( t ) :
W n X ( a ) = Δ t a n = 1 N x n ψ 0 [ ( n n ) Δ t a ]
where corresponds to the complex conjugate, and Δ t [ T ] is the time step of the series x n , n = 1 , 2 , , N . The parameters a [ T ] and n [ 1 ] are a scale expansion factor and a time shift factor, respectively, to adjust the scale and location of the wavelet in the time-frequency domain [32].
The wavelet power spectrum (WPS) is the squared amplitude of the CWT (i.e., | W n X ( a ) | 2 ) since the wavelet function is complex. Normalized WPS values were used to facilitate the comparison of the different WPSs. The normalized WPSs were obtained by dividing by the variance of the time series and were used to identify the dominant scale and time of the series changes [32]. The significance test of WPS was estimated against the red noise spectrum since the soil moisture series has distinctive red noise characteristics [16].
The definition of wavelet coherence (WTC) is similar to that of a correlation coefficient, and the WTC of two time series x n and y n is defined as:
R n 2 ( a ) = | S ( a 1 W n X Y ( a ) ) | 2 S ( a 1 | W n X ( a ) | 2 ) · S ( a 1 | W n Y ( a ) | 2 ) ,
here, W n X Y ( a ) = W n X ( a ) W n Y ( a ) and is the cross wavelet transform of x n and y n , S is a smoothing operator to smooth the wavelet transformation along the scale axis in time [33].
The Monte Carlo method was used to test the significance level of the wavelet coherence. We first generated the order of 1000 surrogate data set pairs with the same AR(1) coefficients as the input data sets and then calculated the wavelet coherence of each pair. Considering the edge effect, only the values outside the cone of influence (COI) were used to perform a pointwise significance test (0.05 level) against red noise at each scale. Detailed descriptions of the COI and the significance test of WTC are given in other papers [16,32,33,34].

3. Results

3.1. Precipitation Characteristics

The frequency distribution of 30 min rainfall intensities was heavily skewed towards low-intensity events with the majority (about 80%) being less than 10 mm h−1, irrespective of the year (Figure 1a). Heavy storm events with 30 min rainfall intensities higher than 25.2 mm h−1 occurred mainly during the rainfall season (April–November), and the number of the events varied from 4 to 13 events per year. On average, there were more such high rainfall intensity storms recorded for the normal and wet years than for the drought year (Figure 1b).

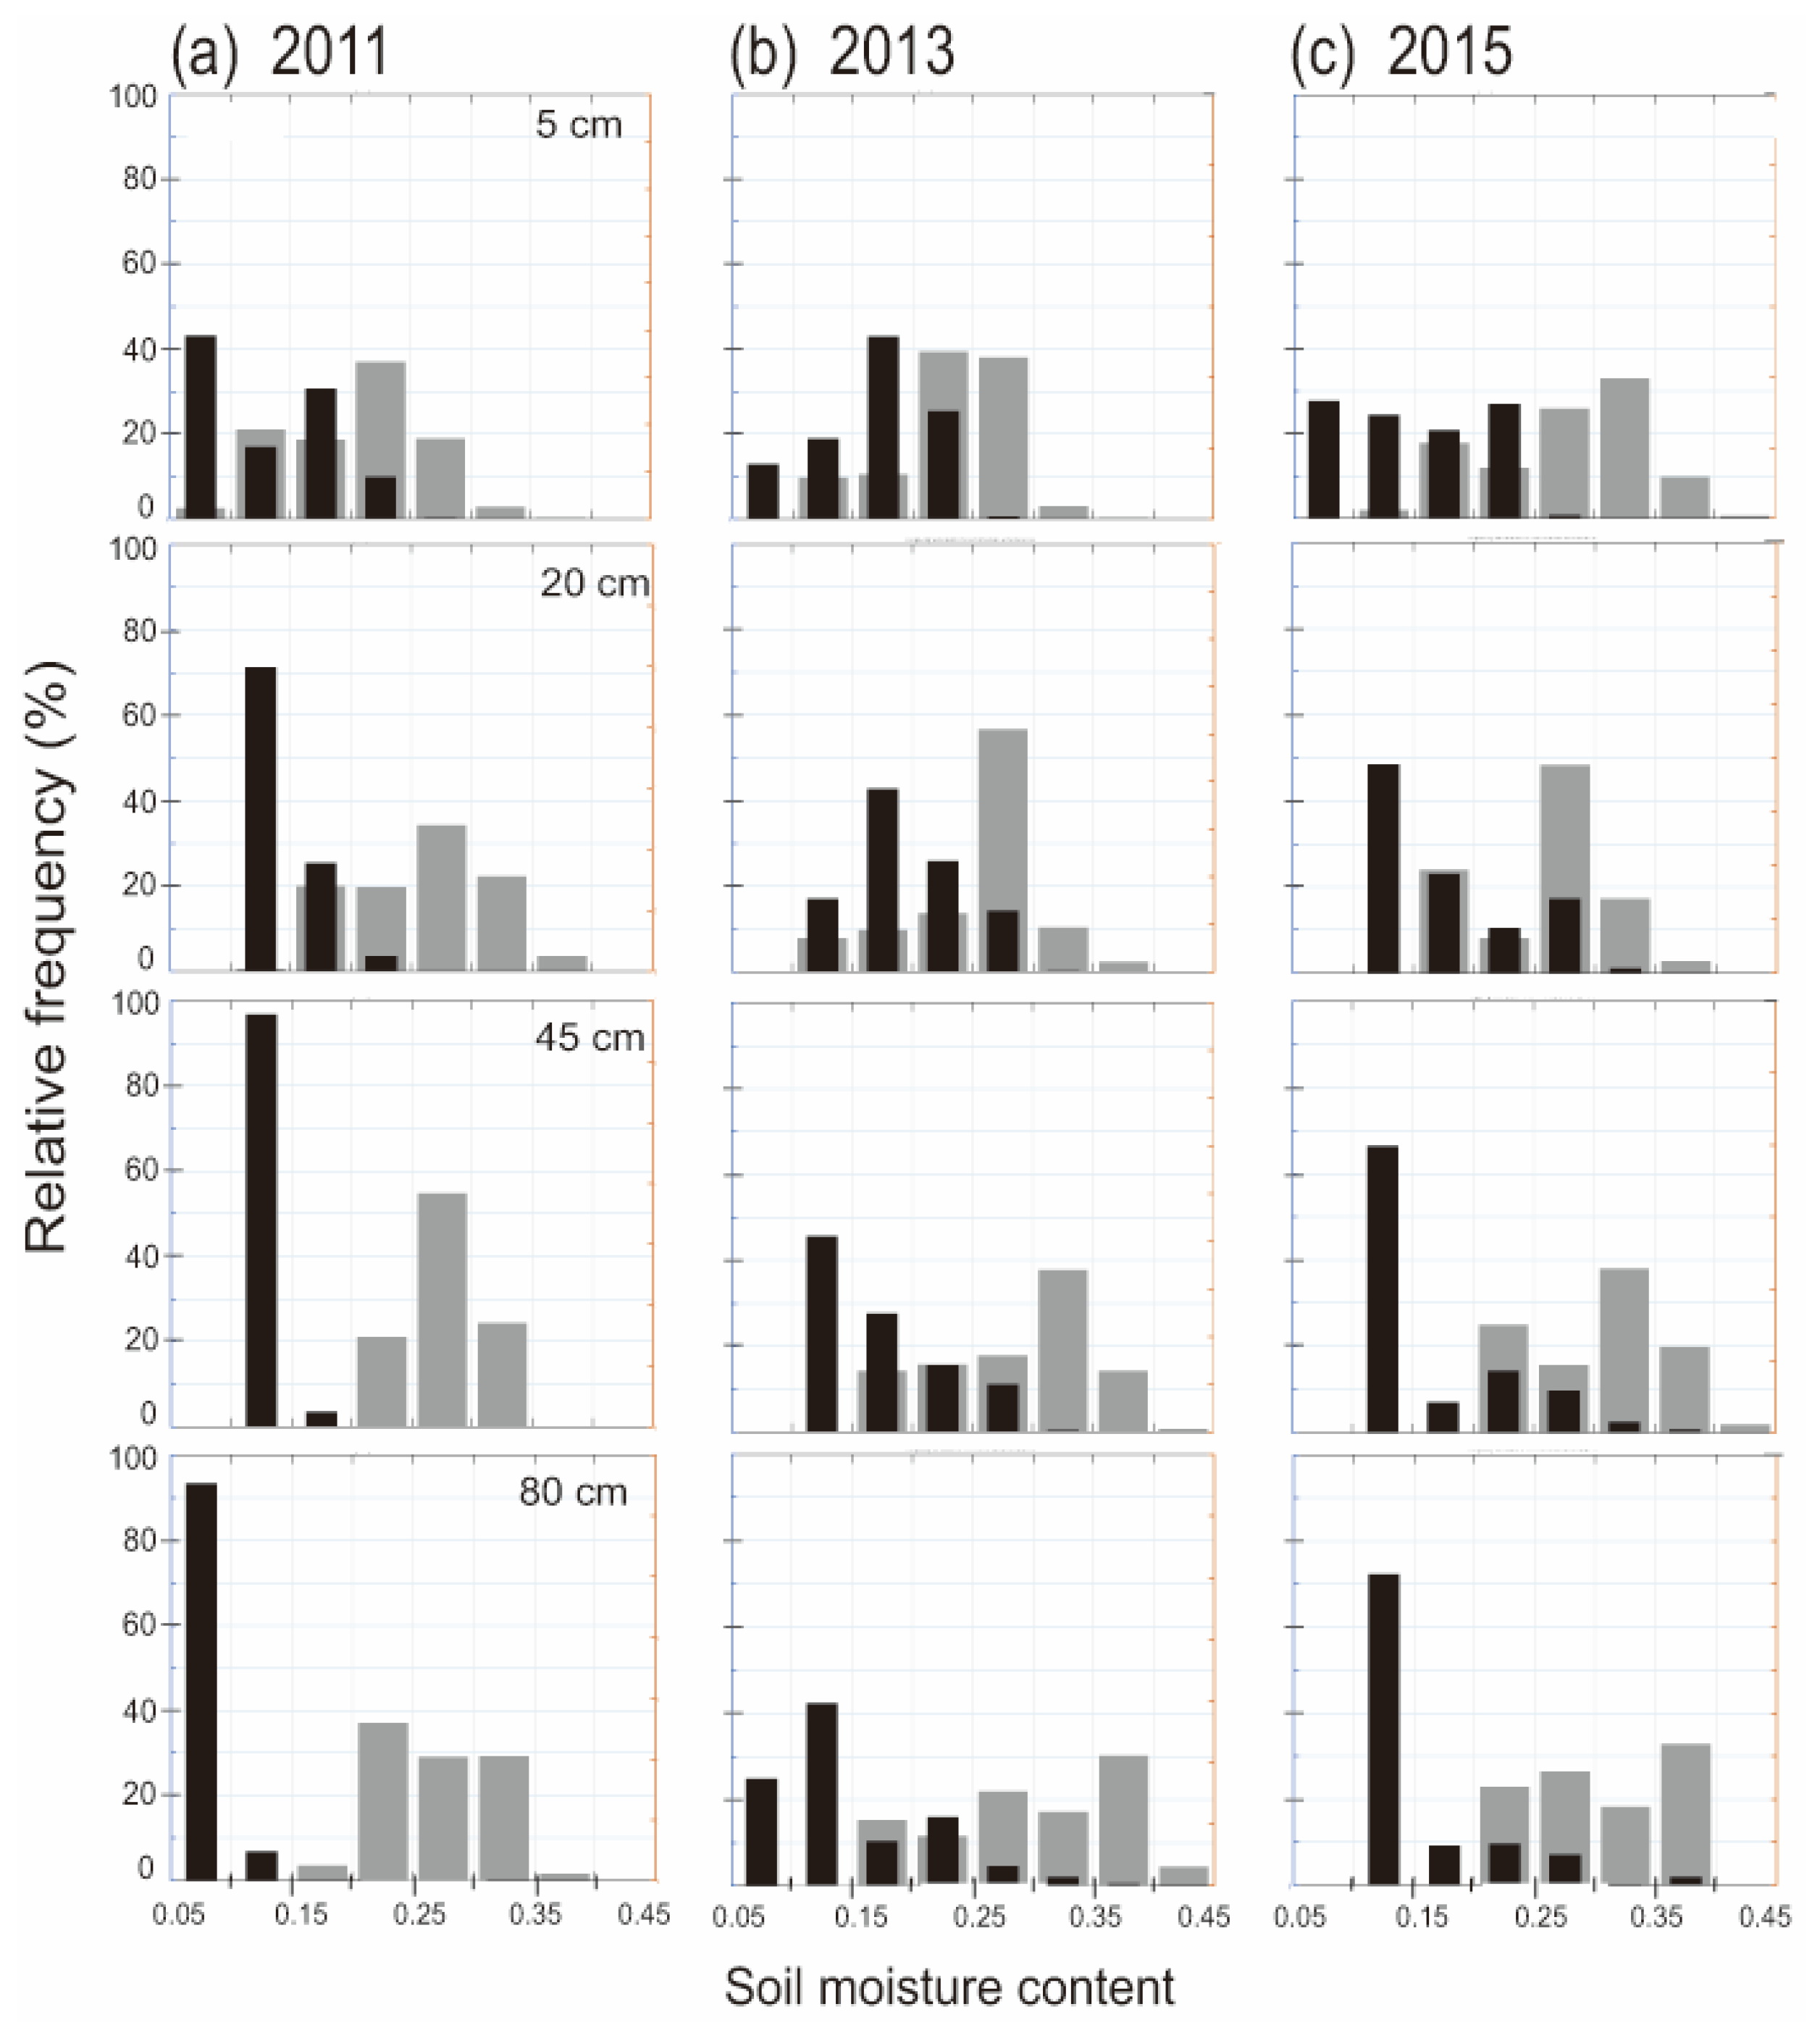
3.2. Impact of Woody Encroachment on Soil Moisture

Compared with the grassland watershed, soil moisture in the woodland watershed fluctuated over a narrower range, and peak frequency always occurred with a lower soil moisture value, irrespective of the year and its associated meteorological conditions (Figure 2). In the drought year (2011), the soil moisture in woodland fluctuated in a low and narrow range. Near the surface, the soil moisture content varied but remained less than 0.25 cm3/cm3. The range of soil moisture content values narrowed even more with deeper soil depth, and 70% or more of the values were less than 0.15 cm3/cm3. Grassland soil moisture was more variable for all depths and all years. With the fading of drought in 2013, the soil moisture in woodland encompassed a wider range along the entire soil profile. For both watersheds, no apparent difference in soil moisture frequency distribution pattern was observed between the normal and the pluvial years.

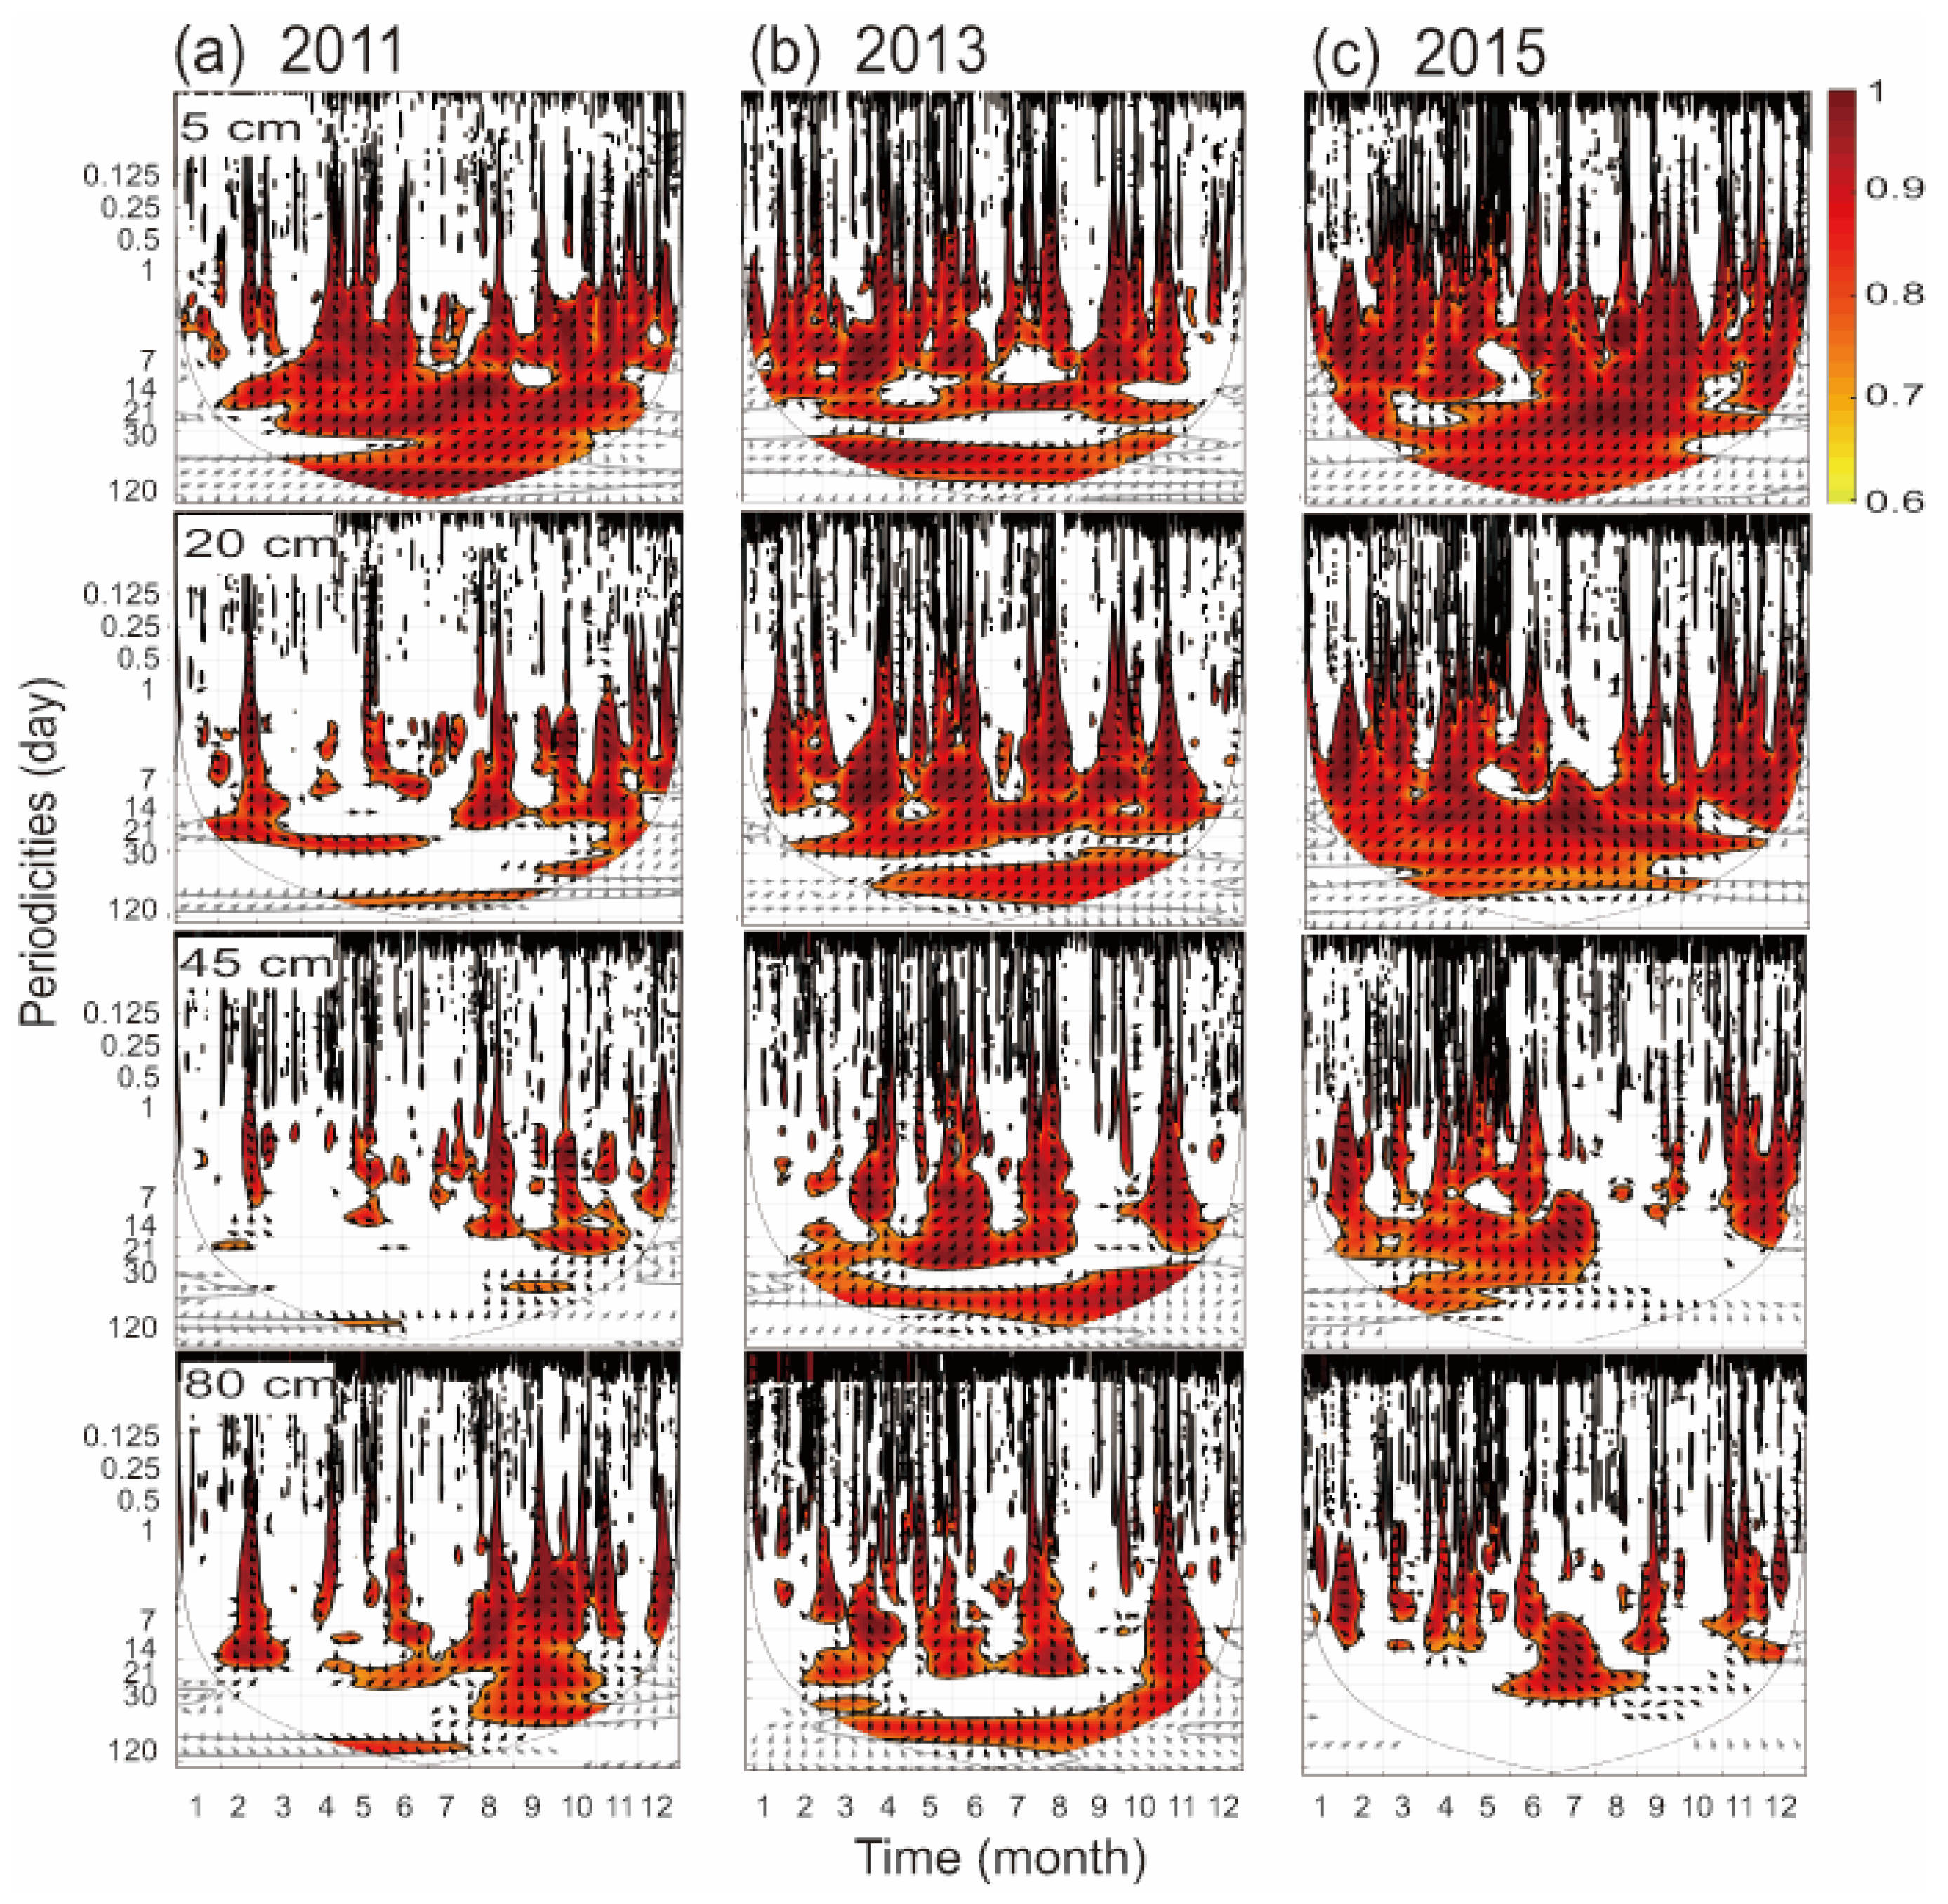
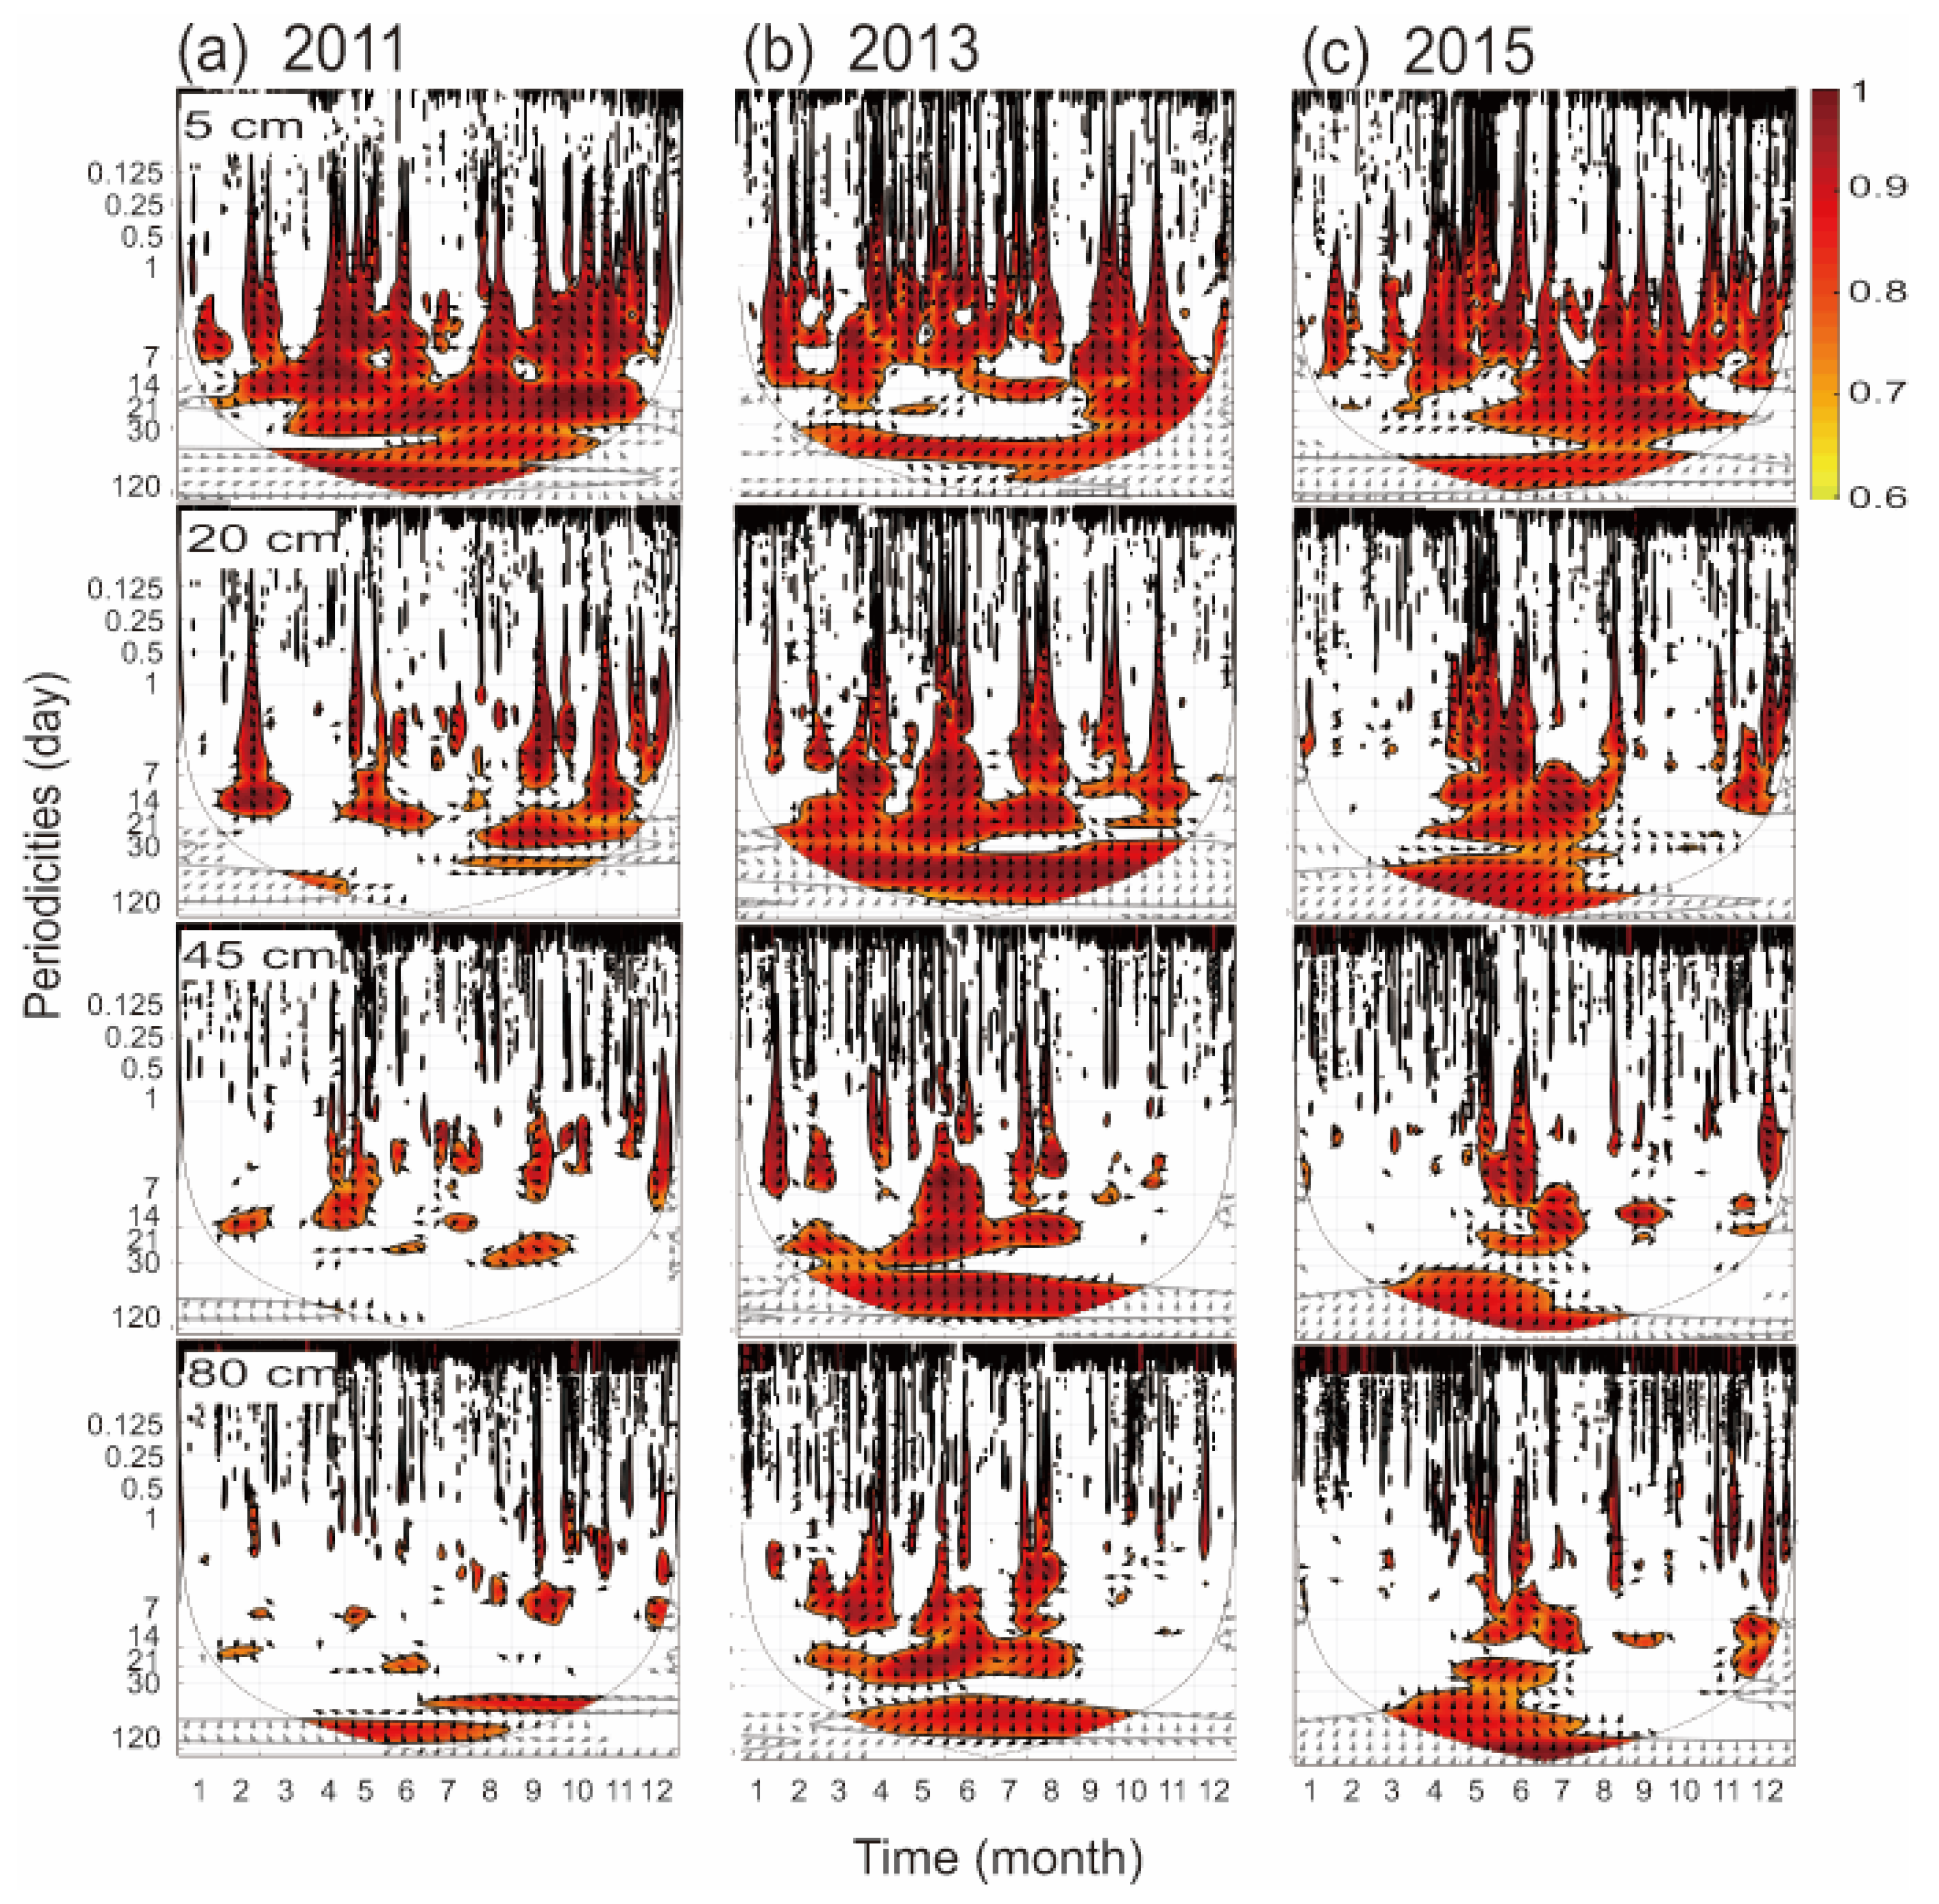
3.3. Coherence between Precipitation and Soil Moisture

There was strong coherence between precipitation and soil moisture at daily to monthly scale for the surface layer (5 cm) irrespective of vegetation and meteorological conditions (Figure 3 and Figure 4). For a normal year and the pluvial year, strong coherence existed during the growing season under both vegetation types at weekly and bi-weekly scales, but there was no or low coherence during the early spring and winter for woodland. For the drought year, the coherence decreased substantially for subsoil depths (20, 45, and 80 cm) for the woodland, but the coherence dropped only slightly for grassland.

3.4. Runoff and Runoff Coefficients

The mean annual runoff depth in the grassland watershed was 54.07 ± 27.6 mm, significantly higher than 21.54 ± 10.41 mm in the encroached watershed (Table 1). An increase in precipitation led to a linear increase in runoff depth for both watersheds, but the runoff coefficient in grassland was three times greater than in woodland (Table 1).

4. Discussion

4.1. Storm Intensity, Infiltration Capacity, and Vegetation Impact

Overland flow derived from infiltration excess or saturation excess does not have a pathway in the soil matrix and is mostly regulated by soil infiltration capacity and precipitation characteristics (e.g., the maximum 30 min storm intensity). The soil infiltration capacity for the studied grassland watershed averages 25.2 mm h−1 based on in situ measurements [23]. In contrast, the soil infiltration capacity for the studied redcedar woodland averages above 100 mm h−1 based on in situ double-ring measurements [22]. The time series of 30 min rainfall intensities showed that storm events with a 30 min intensity higher than 25.2 mm h−1 occur even during a drought year at the study site, suggesting that infiltration excess overland flow likely exists on herbaceous dominated rangeland (Figure 1). However, no storm event with a 30 min intensity higher than 100 mm h−1 occurred during the study period, suggesting that infiltration-excess overland flow rarely ensues on the redcedar woodland. It is important to note, that the studied grassland was derived from historically cultivated lands, which experienced a substantial loss of surface soils. In contrast, native tallgrass prairie soils without cultivation history are highly permeable [35]. The saturated infiltration capacity of the well-managed native prairie was reported to be greater than the 10 yr return rainfall intensity of 68 mm h−1 for the tallgrass prairie region of the south-central Great Plains [36]. Vegetation impact on the streamflow generation mechanism might differ in native prairie without cultivation history.

4.2. Drought Reduces the Coherence of Subsoil Soil Moisture to Precipitation Pulse

Precipitation is a stochastic process, and soil moisture content is a transient property [28]. The frequency distribution of soil moisture in the drought year suggests a low probability of forming a saturation condition that would lead to saturation excess overland flow. Decreased coherence between precipitation and soil moisture in the woodland during the normal and pluvial years suggests a reduced connection between gross precipitation and soil moisture. This disconnection occurs likely from the alteration of the following two hydrological processes—1. Attenuation of gross precipitation by vegetation structure through interception; this effect is more pronounced in woodland than in grassland due to the larger interception surface and the thicker litter layer [37]; and 2. Reduction in percolation through the surface soil and rooting zone due to the frequently dry surface soil layer and the continuous root water uptake in the rooting zone. This results in either a delayed or lack of response of soil moisture in deep soils to a precipitation pulse and reduces the deep recharge potential. Reduced coherence between the precipitation pulse and deep soil moisture for the redcedar woodland during pluvial condition suggests that the vegetation transition from herbaceous cover to woodland in the subhumid rangeland of the southern Great Plains will likely reduce the localized recharge of groundwater despite the increase of infiltration capacity and the potential decrease of overland flow in the redcedar woodland system [38,39].

4.3. Increase in Soil Moisture Stress and Reduction in the Runoff from Redcedar Woodland

Frequency analysis shows that the soil moisture content associated with peak frequency is lower in woodland than in grassland in the year of normal precipitation. This result suggests that the reduction of infiltration-excess overland flow in the redcedar woodland does not convert to an overall improvement in the soil moisture condition. In contrast, the soil moisture content in the redcedar woodland is generally lower than that in grassland for the same depth, in particular for subsoil layers. Continuous and excessive depletion of soil moisture in the subsoil layers in the redcedar woodland during a drought episode is likely to be associated with the altered water uptake pattern, the changed rooting structure, and the vegetation phenology of the redcedar, compared to grassland condition [26]. The frequent existence of dry surface layers interrupts the propagation of net precipitation into deeper soil layers and, therefore, affects the coherence of precipitation and soil moisture dynamics [16]. Hydrologically, the depletion of soil moisture also decreases the possibility of the formation of a saturated soil profile, especially during drought years when precipitation is low. Consequently, it will decrease the occurrence of saturated overland flow, another important mechanism of runoff generation in semiarid and subhumid watersheds [6], especially during the growing season [40].

4.4. Water Resources Challenges in the South-Central Great Plains under Climate Change

The south-central Great Plains of the USA relies heavily on groundwater in the form of aquifers [41] and surface water in the form of impoundments and reservoirs for irrigation, municipal water supplies, and the oil and gas industry [42,43]. With climate change and the concurring increase in population, water demand is projected to increase drastically. For example, the water demand in Oklahoma is estimated to increase by 33% statewide by 2060 as compared to the 2010 water demand [44]. An increase in water demand will likely lead to water stress in most parts of the south-central Great Plains and will affect the higher water demanding sectors, including irrigation, thermoelectric, municipal supply, and the oil and gas industry, all vital for the economic and social well-being of this region.
Evapotranspiration (ET) is the predominant component of the water budget in both arid and semiarid regions [45], and water resources available for non-ecosystem services (groundwater recharge for aquifers and runoff for reservoirs and wetlands) are the residual between precipitation and ET. In moist forest systems where available solar energy input limits the annual ET, there is usually a trade-off between runoff and groundwater replenishment. As a result, a decrease in overland flow associated with reforestation usually transfers into an increase in groundwater recharge and baseflow [46], which is a desirable outcome in water resource conservation. Our frequency analysis of soil moisture content and direct runoff measurement suggest that this trade-off does not necessarily occur in the water-controlled, semiarid, and subhumid region. Even without considering the vegetation impact, modeling simulations indicate that streamflow and groundwater storage in the study region are likely to decrease in the long run due to increases in frequency and strength of droughts [41,47]. The parallel conversion of the vegetation functional type from herbaceous to woody vegetation will exacerbate the decline in water resources due to increased transpiration and canopy interception of rainfall by redcedar as compared to the replaced prairie. In their modeling study, Starks and Moriasi [48] found that even a 20% redcedar encroachment into existing grassland would decrease the current municipal water supply to Oklahoma City, the largest city of Oklahoma, by 27%. Another study suggests a 20% reduction in annual streamflow for a selected Oklahoma watershed upon the complete conversion of existing rangeland into redcedar woodland [49]. The drier climatic outlook for the region, as estimated by global climate models [12,50], could make water management more challenging.
Another critical challenge in water resource management arises as an indirect impact of redcedar encroachment. Redcedar is highly flammable, and a combination of redcedar expansion and a low soil moisture condition is reported to be associated with the increased occurrence of wildfires in Oklahoma between 2008 and 2012 [51]. Wildfire removes vegetation and ground surface cover, imposing a profound impact on water quality and water resource infrastructure [52]. Therefore, an improved understanding of the effects and feedback between climate, soil moisture, and vegetation type, and the ability to incorporate that knowledge into modeling and long-term planning would benefit future water resource management and sustainability in the central Great Plains and other water-limited regions.

5. Conclusions

With the projected increase in drought frequency and the concurring increase in population, augmenting and sustaining landscape runoff to streams and reservoirs becomes an increasing challenge in the south-central Great Plains of the USA. Replenishment of soil moisture is difficult during drought, and the depletion of root zone soil moisture is exacerbated under evergreen redcedar woodland. Streamflow from grassland declines sharply in response to meteorological drought but rebounds rapidly when precipitation returns to normal. In contrast, runoff from evergreen woodland is low during normal precipitation years, becomes lower during drought, and remains lower for a protracted period after rainfall returns to normal. Thus, the conversion from grassland to evergreen woody vegetation reduces the resilience of the hydrological systems to change in climate and can prolong the impact of meteorological drought on hydrological drought. For natural resource managers, restoring and maintaining prairie by preventing the proliferation of redcedar in the central Great Plains could serve as an adaptive measure to counter climate change impact on water resources.

Author Contributions

Conceptualization, Y.H. and C.B.Z.; formal analysis, Q.L. and G.K.; data collection and compilation, E.S. and C.B.Z.; writing—original draft preparation, Y.H. and C.B.Z.; writing—review and editing, C.L., E.S.; Y.Z.; and L.A.

Funding

This research was funded by the National Science Foundation No. DEB-1413900 and USDA OKL03152, and Science Foundation of Tianjin, China under Grant No. 18JCZDJC39500.

Acknowledgments

The authors would like to express their gratitude to the two anonymous reviewers for their insightful and constructive comments.

Conflicts of Interest

The authors declare no conflict of interest.

References

  1. Acharya, B.; Kharel, G.; Zou, C.B.; Wilcox, B.P.; Halihan, T. Woody plant encroachment impacts on groundwater recharge: A review. Water 2018, 10, 1466. [Google Scholar] [CrossRef]
  2. Ritsema, C.J.; Dekker, L.W. How water moves in a water repellent sandy soil: 2. Dynamics of fingered flow. Water Resour. Res. 1994, 30, 2519–2531. [Google Scholar] [CrossRef]
  3. Doerr, S.H.; Shakesby, R.A.; Walsh, R.P.D. Soil water repellency: Its causes, characteristics and hydro-geomorphological significance. Earth Sci. Rev. 2000, 51, 33–65. [Google Scholar] [CrossRef]
  4. Horton, R.E. An approach toward a physical interpretation of infiltration-capacity 1. Soil Sci. Soc. Am. J. 1941, 5, 399–417. [Google Scholar] [CrossRef]
  5. Wilcox, B.P.; Rawls, W.J.; Brakensiek, D.L.; Wight, J.R. Predicting runoff from rangeland catchments: A comparison of two models. Water Resour. Res. 1990, 26, 2401–2410. [Google Scholar] [CrossRef]
  6. Qiao, L.; Zou, C.B.; Stebler, E.; Will, R.E. Woody plant encroachment reduces annual runoff and shifts runoff mechanisms in the tallgrass prairie, USA. Water Resour. Res. 2017, 53, 4838–4849. [Google Scholar] [CrossRef]
  7. Loik, M.E.; Breshears, D.D.; Lauenroth, W.K.; Belnap, J. A multi-scale perspective of water pulses in dryland ecosystems: Climatology and ecohydrology of the western USA. Oecologia. 2004, 141, 269–281. [Google Scholar] [CrossRef]
  8. Basara, J.B.; Maybourn, J.N.; Peirano, C.M.; Tate, J.E.; Brown, P.J.; Hoey, J.D.; Smith, B.R. Drought and associated impacts in the Great Plains of the United States-A Review. Int. J. Geosci. 2013, 4, 72. [Google Scholar] [CrossRef]
  9. Schubert, S.D.; Suarez, M.J.; Pegion, P.J.; Koster, R.D.; Bacmeister, J.T. Causes of long-term drought in the US Great Plains. J. Clim. 2004, 17, 485–503. [Google Scholar] [CrossRef]
  10. Seager, R.; Hoerling, M. Atmosphere and ocean origins of North American droughts. J. Clim. 2014, 27, 4581–4606. [Google Scholar] [CrossRef]
  11. Otkin, J.A.; Zhong, Y.; Hunt, E.D.; Basara, J.; Svoboda, M.; Anderson, M.C.; Hain, C. Assessing the evolution of soil moisture and vegetation conditions during a flash drought–flash recovery sequence over the South-Central United States. J. Hydrometeorol. 2019, 20, 549–562. [Google Scholar] [CrossRef]
  12. Qiao, L.; Zou, C.B.; Gaitán, C.F.; Hong, Y.; McPherson, R.A. Analysis of precipitation projections over the climate gradient of the Arkansas Red River basin. J. Appl. Meteorol. Climatol. 2017, 56, 1325–1336. [Google Scholar] [CrossRef]
  13. Otkin, J.A.; Anderson, M.C.; Hain, C.; Mladenova, I.E.; Basara, J.B.; Svoboda, M. Examining rapid onset drought development using the thermal infrared–based evaporative stress index. J. Hydrometeorol. 2013, 14, 1057–1074. [Google Scholar] [CrossRef]
  14. Otkin, J.A.; Zhong, Y.; Lorenz, D.; Anderson, M.C.; Hain, C. Exploring seasonal and regional relationships between the Evaporative Stress Index and surface weather and soil moisture anomalies across the United States. Hydrol. Earth Syst. Sci. 2018, 22, 5373–5386. [Google Scholar] [CrossRef] [Green Version]
  15. Liu, B.X.; Shao, M.A. Response of soil water dynamics to precipitation years under different vegetation types on the northern Loess Plateau, China. J. Arid Land. 2016, 8, 47–59. [Google Scholar] [CrossRef]
  16. Liu, Q.; Hao, Y.H.; Stebler, E.; Tanaka, N.; Zou, C.B. Impact of plant functional types on coherence between precipitation and soil moisture: A wavelet analysis. Geophys. Res. Lett. 2017, 44, 12197–12207. [Google Scholar] [CrossRef]
  17. Breshears, D.D.; Rich, P.M.; Barnes, F.J.; Campbell, K. Overstory-imposed heterogeneity in solar radiation and soil moisture in a semiarid woodland. Ecol. Appl. 1997, 7, 1201–1215. [Google Scholar] [CrossRef]
  18. Kim, Y.; Wang, G.L. Impact of vegetation feedback on the response of precipitation to antecedent soil moisture anomalies over North America. J. Hydrometeorol. 2007, 8, 534–550. [Google Scholar] [CrossRef]
  19. Kim, J.H.; Jackson, R.B. A global analysis of groundwater recharge for vegetation, climate, and soils. Vadose Zone J. 2012, 11. [Google Scholar] [CrossRef]
  20. Archer, S.; Schimel, D.S.; Holland, E.A. Mechanisms of shrubland expansion, land use, climate or CO2? Clim. Chang. 1995, 29, 91–99. [Google Scholar] [CrossRef]
  21. Briggs, J.M.; Knapp, A.K.; Brock, B.L. Expansion of woody plants in, tallgrass prairie: A fifteen-year study of fire and fire-grazing interactions. Am. Midl. Nat. 2002, 147, 287–294. [Google Scholar] [CrossRef]
  22. Zou, C.B.; Turton, D.J.; Will, R.E.; Engle, D.M.; Fuhlendorf, S.D. Alteration of hydrological processes and streamflow with juniper (Juniperus virginiana) encroachment in a mesic grassland catchment. Hydrol. Process. 2014, 28, 6173–6182. [Google Scholar] [CrossRef]
  23. Wine, M.L.; Ochsner, T.E.; Sutradhar, A.; Pepin, R. Effects of eastern redcedar encroachment on soil hydraulic properties along Oklahoma’s grassland-forest ecotone. Hydrol. Process. 2012, 26, 1720–1728. [Google Scholar] [CrossRef]
  24. Wilcox, B.P.; Breshears, D.D.; Allen, C.D. Ecohydrology of a resource-conserving semiarid woodland: Effects of scale and disturbance. Ecol. Monogr. 2003, 73, 223–239. [Google Scholar] [CrossRef]
  25. Heilman, J.L.; Litvak, M.E.; McInnes, K.J.; Kjelgaard, J.F.; Kamps, R.H.; Schwinning, S. Water storage capacity controls energy partitioning and water use in karst ecosystems on the Edwards Plateau, Texas. Ecohydrology 2014, 7, 127–138. [Google Scholar] [CrossRef]
  26. Caterina, G.L.; Will, R.E.; Turton, D.J.; Wilson, D.S.; Zou, C.B. Water use of Juniperus virginiana trees encroached into mesic prairies in Oklahoma, USA. Ecohydrology 2014, 7, 1124–1134. [Google Scholar]
  27. Laio, F.; Porporato, A.; Ridolfi, L.; Rodriguez-Iturbe, I. Plants in water-controlled ecosystems: Active role in hydrologic processes and response to water stress - II. Probabilistic soil moisture dynamics. Adv. Water Resour. 2001, 24, 707–723. [Google Scholar] [CrossRef]
  28. Porporato, A.; Daly, E.; Rodriguez-Iturbe, I. Soil water balance and ecosystem response to climate change. Am. Nat. 2004, 164, 625–632. [Google Scholar] [CrossRef]
  29. Rodriguez-Iturbe, I.; Isham, V.; Cox, D.R.; Manfreda, S.; Porporato, A. Space-time modeling of soil moisture: Stochastic rainfall forcing with heterogeneous vegetation. Water Resour. Res. 2006, 42. [Google Scholar] [CrossRef] [Green Version]
  30. Qiao, L.; Zou, C.B.; Will, R.E.; Stebler, E. Calibration of swat model for woody plant encroachment using paired experimental watershed data. J. Hydrol. 2015, 523, 231–239. [Google Scholar] [CrossRef]
  31. McKee, T.B.; Doesken, N.J.; Kleist, J. The relationship of drought frequency and duration to time scales. In Proceedings of the 8th Conference on Applied Climatology, Anaheim, CA, USA, 17–22 January 1993; pp. 179–183. [Google Scholar]
  32. Torrence, C.; Compo, G.P. A practical guide to wavelet analysis. B. Am. Meteorol. Soc. 1998, 79, 61–78. [Google Scholar] [CrossRef]
  33. Grinsted, A.; Moore, J.C.; Jevrejeva, S. Application of the cross wavelet transform and wavelet coherence to geophysical time series. Nonlinear Proc. Geophys. 2004, 11, 561–566. [Google Scholar] [CrossRef]
  34. Maraun, D.; Kurths, J.; Holschneider, M. Nonstationary Gaussian processes in wavelet domain: Synthesis, estimation, and significance testing. Phys. Rev. E 2007, 75, 016707. [Google Scholar] [CrossRef] [PubMed]
  35. Hester, J.W.; Thurow, T.L.; Taylor Jr, C.A. Hydrologic characteristics of vegetation types as affected by prescribed burning. J. Range Manag. 1997, 50, 199–204. [Google Scholar] [CrossRef]
  36. West, A.L.; Zou, C.B.; Stebler, E.; Fuhlendorf, S.D.; Allred, B. Pyric-herbivory and hydrological responses in tallgrass prairie. Rangel. Ecol. Manag. 2016, 69, 20–27. [Google Scholar] [CrossRef]
  37. Zou, C.B.; Caterina, G.L.; Will, R.E.; Stebler, E.; Turton, D. Canopy interception for a tallgrass prairie under juniper encroachment. PLoS ONE 2015, 10, 0141422. [Google Scholar] [CrossRef] [PubMed]
  38. Acharya, B.S.; Halihan, T.; Zou, C.B.; Will, R.E. Vegetation controls on the spatio-temporal heterogeneity of deep moisture in the unsaturated zone. A hydrogeophysical evaluation. Sci. Rep. 2017, 7, 1499. [Google Scholar] [CrossRef]
  39. Acharya, B.S.; Hao, Y.H.; Ochsner, T.E.; Zou, C.B. Woody plant encroachment alters soil hydrological properties and reduces downward flux of water in tallgrass prairie. Plant Soil 2017, 414, 379–391. [Google Scholar] [CrossRef]
  40. Schlaepfer, D.R.; Bradford, J.B.; Lauenroth, W.K.; Munson, S.M.; Tietjen, B.; Hall, S.A.; Wilson, S.D.; Duniway, M.C.; Jia, G.; Pyke, D.A.; et al. Climate change reduces extent of temperate drylands and intensifies drought in deep soils. Nat. Commun. 2017, 8, 14196. [Google Scholar] [CrossRef]
  41. Crosbie, R.S.; Scanlon, B.R.; Mpelasoka, F.S.; Reedy, R.C.; Gates, J.B.; Zhang, L. Potential climate change effects on groundwater recharge in the High Plains Aquifer, USA. Water Resour. Res. 2013, 49, 3936–3951. [Google Scholar] [CrossRef] [Green Version]
  42. Dale, J.; Zou, C.B.; Andrews, W.J.; Long, J.M.; Liang, Y.; Qiao, L. Climate, water use, and land surface transformation in an irrigation intensive watershed-Streamflow responses from 1950 through 2010. Agric. Water Manag. 2015, 160, 144–152. [Google Scholar] [CrossRef]
  43. Zou, C.B.; Twidwell, D.; Bielski, C.H.; Fogarty, D.T.; Mittelstet, A.R.; Starks, P.J.; Will, R.E.; Zhong, Y.; Acharya, B.S. Impact of Eastern Redcedar Proliferation on Water Resources in the Great Plains USA—Current State of Knowledge. Water 2018, 10, 1768. [Google Scholar] [CrossRef]
  44. Oklahoma Water Resources Board. Oklahoma Comprehensive Water Plan: Executive Report; Oklahoma Water Resources Board: Oklahoma, OK, USA, 2012.
  45. Wilcox, B.P. Shrub control and streamflow on rangelands: A process based viewpoint. J. Range Manag. 2002, 55, 318–326. [Google Scholar] [CrossRef]
  46. Krishnaswamy, J.; Bonell, M.; Venkatesh, B.; Purandar, B.K.; Rakesh, K.N.; Lele, S.; Kiran, M.C.; Reddy, V.; Badiger, S. The groundwater recharge response and hydrologic services of tropical humid forest ecosystems to use and reforestation: Support for the "infiltration-evapotranspiration trade-off hypothesis". J. Hydrol. 2013, 498, 191–209. [Google Scholar] [CrossRef]
  47. Yoon, J.H.; Wang, S.Y.S.; Lo, M.H.; Wu, W.Y. Concurrent increases in wet and dry extremes projected in Texas and combined effects on groundwater. Environ. Res. Lett. 2018, 13, 054002. [Google Scholar] [CrossRef]
  48. Starks, P.J.; Moriasi, D.N. Impact of eastern redcedar encroachment on stream discharge in the North Canadian River basin. J. Soil Water Conserv. 2017, 72, 12–25. [Google Scholar] [CrossRef]
  49. Zou, C.B.; Qiao, L.; Wilcox, B.P. Woodland expansion in central Oklahoma will significantly reduce streamflows–a modelling analysis. Ecohydrology 2016, 9, 807–816. [Google Scholar] [CrossRef]
  50. Cox, T.; McCluskey, M.; Arthur, K. Incorporating climate change into water supply, and yield studies: A demonstration and comparison of practical methods. In Proceedings of the World Environmental And Water Resources Congress 2012, Albuquerque, NM, USA, 20–24 May 2012. [Google Scholar]
  51. Krueger, E.S.; Ochsner, T.E.; Engle, D.M.; Carlson, J.D.; Twidwell, D.; Fuhlendorf, S.D. Soil moisture affects growing-season wildfire size in the southern great plains. Soil Sci. Soc. Am. J. 2015, 79, 1567–1576. [Google Scholar] [CrossRef]
  52. Smith, H.G.; Sheridan, G.J.; Lane, P.N.; Nyman, P.; Haydon, S. Wildfire effects on water quality in forest catchments: A review with implications for water supply. J. Hydrol. 2011, 396, 170–192. [Google Scholar] [CrossRef]
Figure 1. Precipitation characteristics for the study period. (a) Relative frequency distribution of 30 min rainfall intensity for each year. (b) Time series of 30 min rainfall intensities (mm h−1). The horizontal dotted line indicates the infiltration capacity for the grassland watershed.
Water 11 02357 g001
Figure 2. Relative frequency distribution of soil moisture content under grassland (grey bar) and woodland (black bar) at different soil depths in (a) a drought year, 2011, (b) a normal year, 2013, and (c) a pluvial year, 2015.
Water 11 02357 g002
Figure 3. The wavelet coherence between precipitation and soil moisture content in grassland at different depths (i.e., 5, 20, 45, and 80 cm) in (a) a drought year (2011), (b) a normal year (2013), and (c) a pluvial year (2015). Wavelet coherence is indicated by a color scale ranging from 0–1 with the value of 1 (the darkest red-brown) indicating the greatest coherence. To highlight the energy change of the time-series at a small scale, the vertical axis of the wavelet coherence has a logarithmic axis, and the abscissa axis is linear. The arrow pointing right indicates that the precipitation and soil moisture content is in phase; oppositely, the soil water and precipitation are out of phase. Only the areas which are pointwise significant at the 5% level and fall outside the cone of influence (COI) are colored.
Water 11 02357 g003
Figure 4. Same as Figure 3, but for woodland.
Water 11 02357 g004
Table 1. Annual runoff response to precipitation for grassland watershed and redcedar woodland watershed. Runoff increases linearly with precipitation in grassland watershed.
IGUE Precipitation (P, mm)Runoff (D, mm)Runoff Coefficient (%)
GrasslandWoodland#GrasslandWoodland
2011625.92.041.380.330.22
2012630.350.8121.298.063.38
2013979.161.0619.916.242.03
2014707.813.989.311.981.32
20151020.7142.4755.8513.965.47
Mean (SE)792.75 (96.21)54.07 (27.6)21.54 (10.41)6.11 (2.69)2.48 (1.01)
D = 0.23*P − 128.28 (R2 = 0.64); #D = 0.08*P − 42.47(R2 = 0.56).

