Flood Hazard Mapping Using the Flood and Flash-Flood Potential Index in the Buzău River Catchment, Romania

 ,
, 
Abstract
1. Introduction
2. Study Area and Data
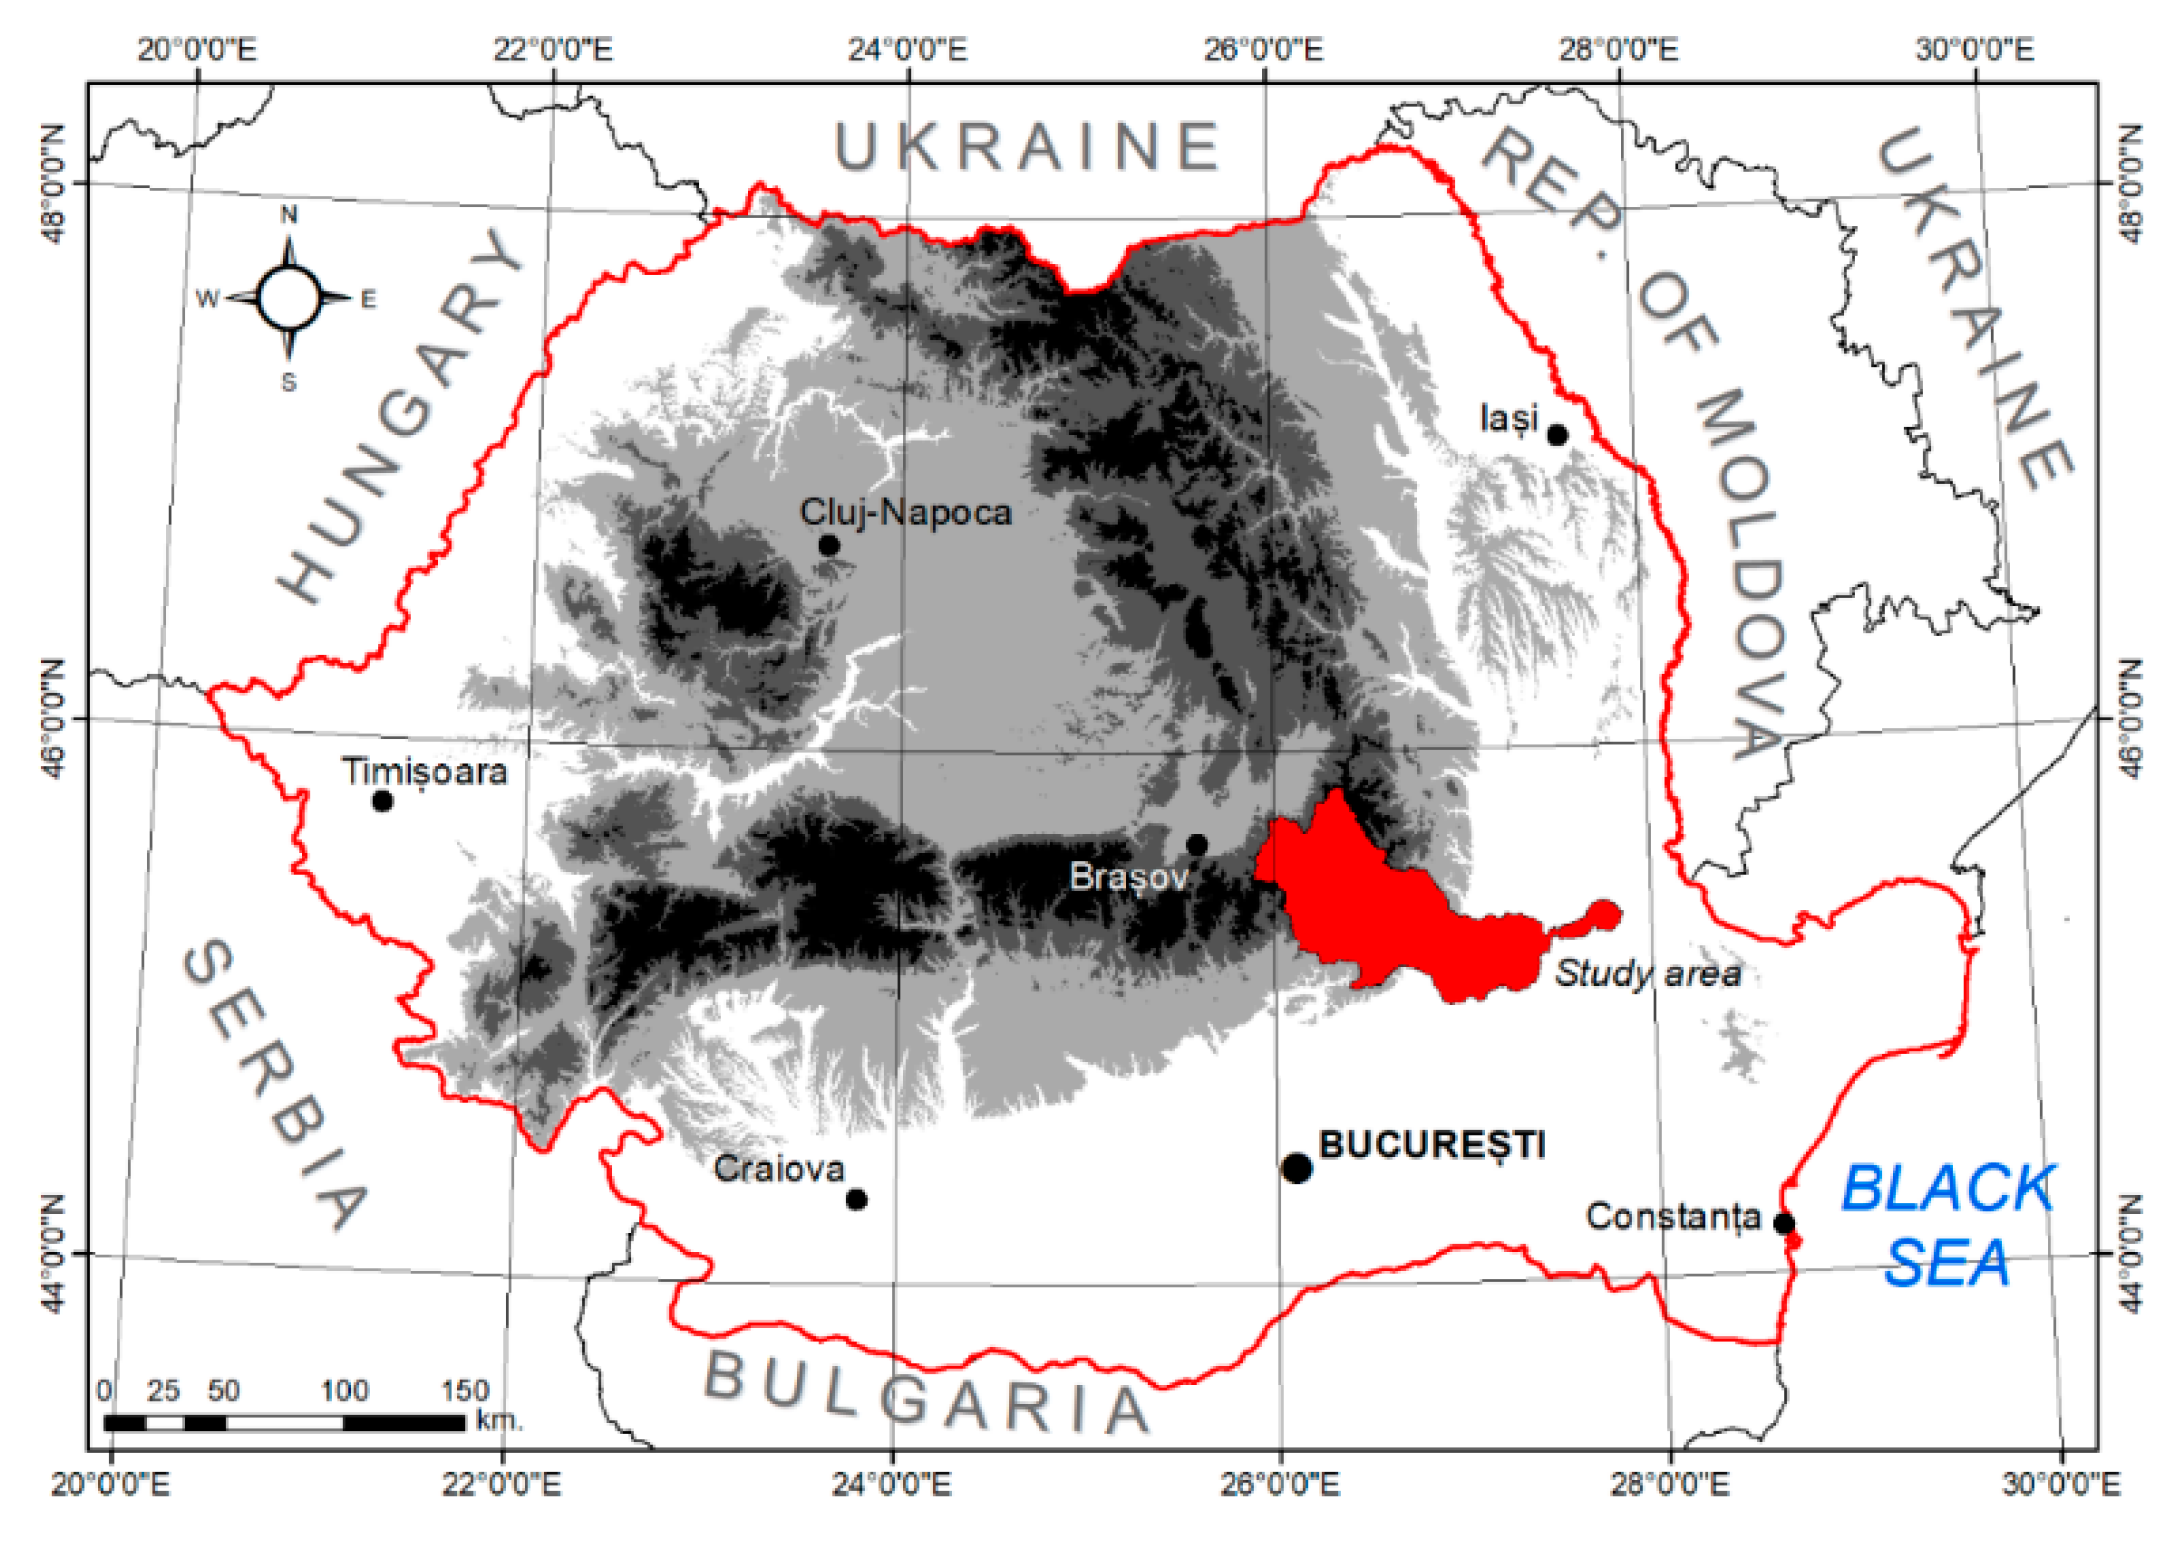
2.1. General Characteristics of the Study Area
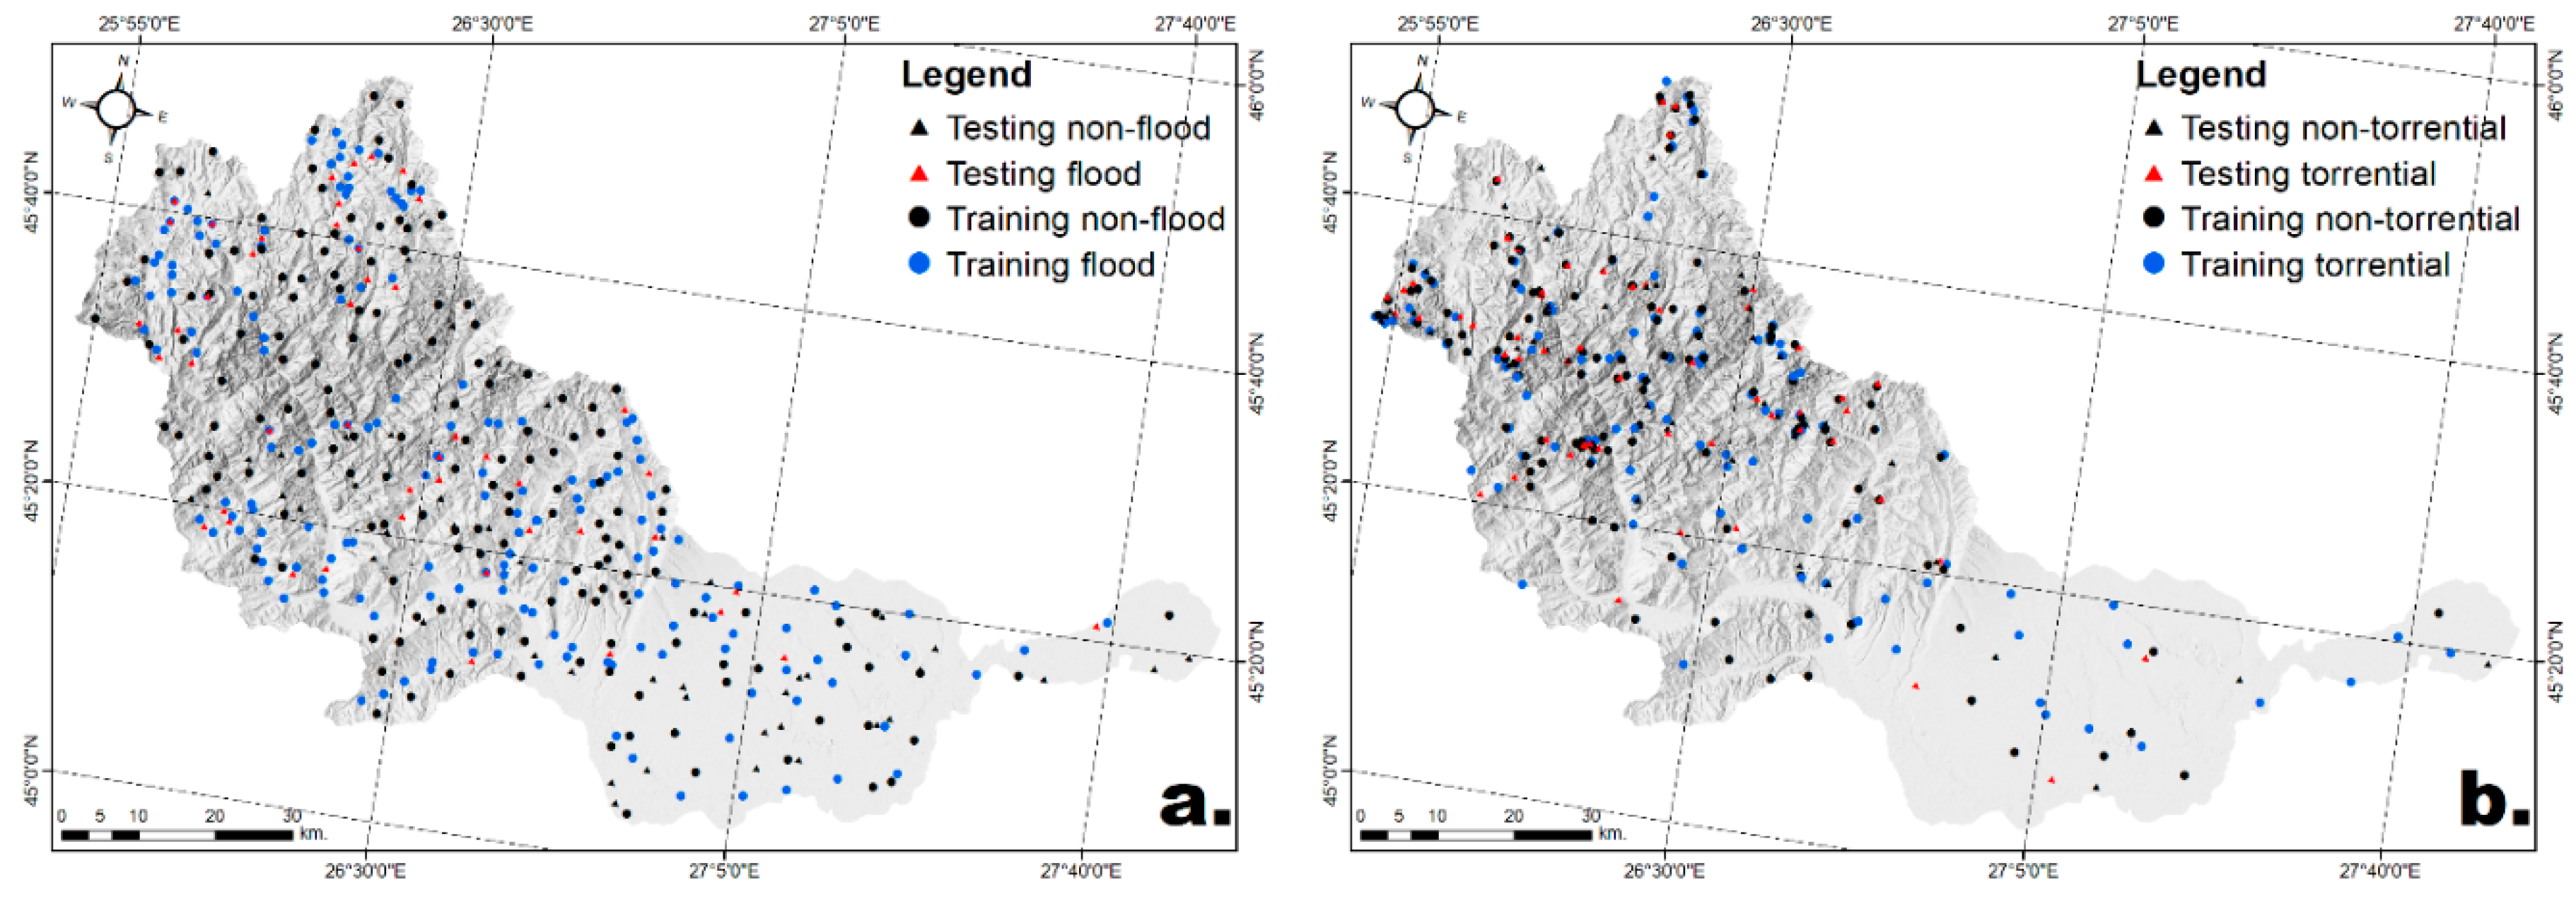
2.2. Inventory of the Historical Flood Locations and Areas Affected by Torrentiality
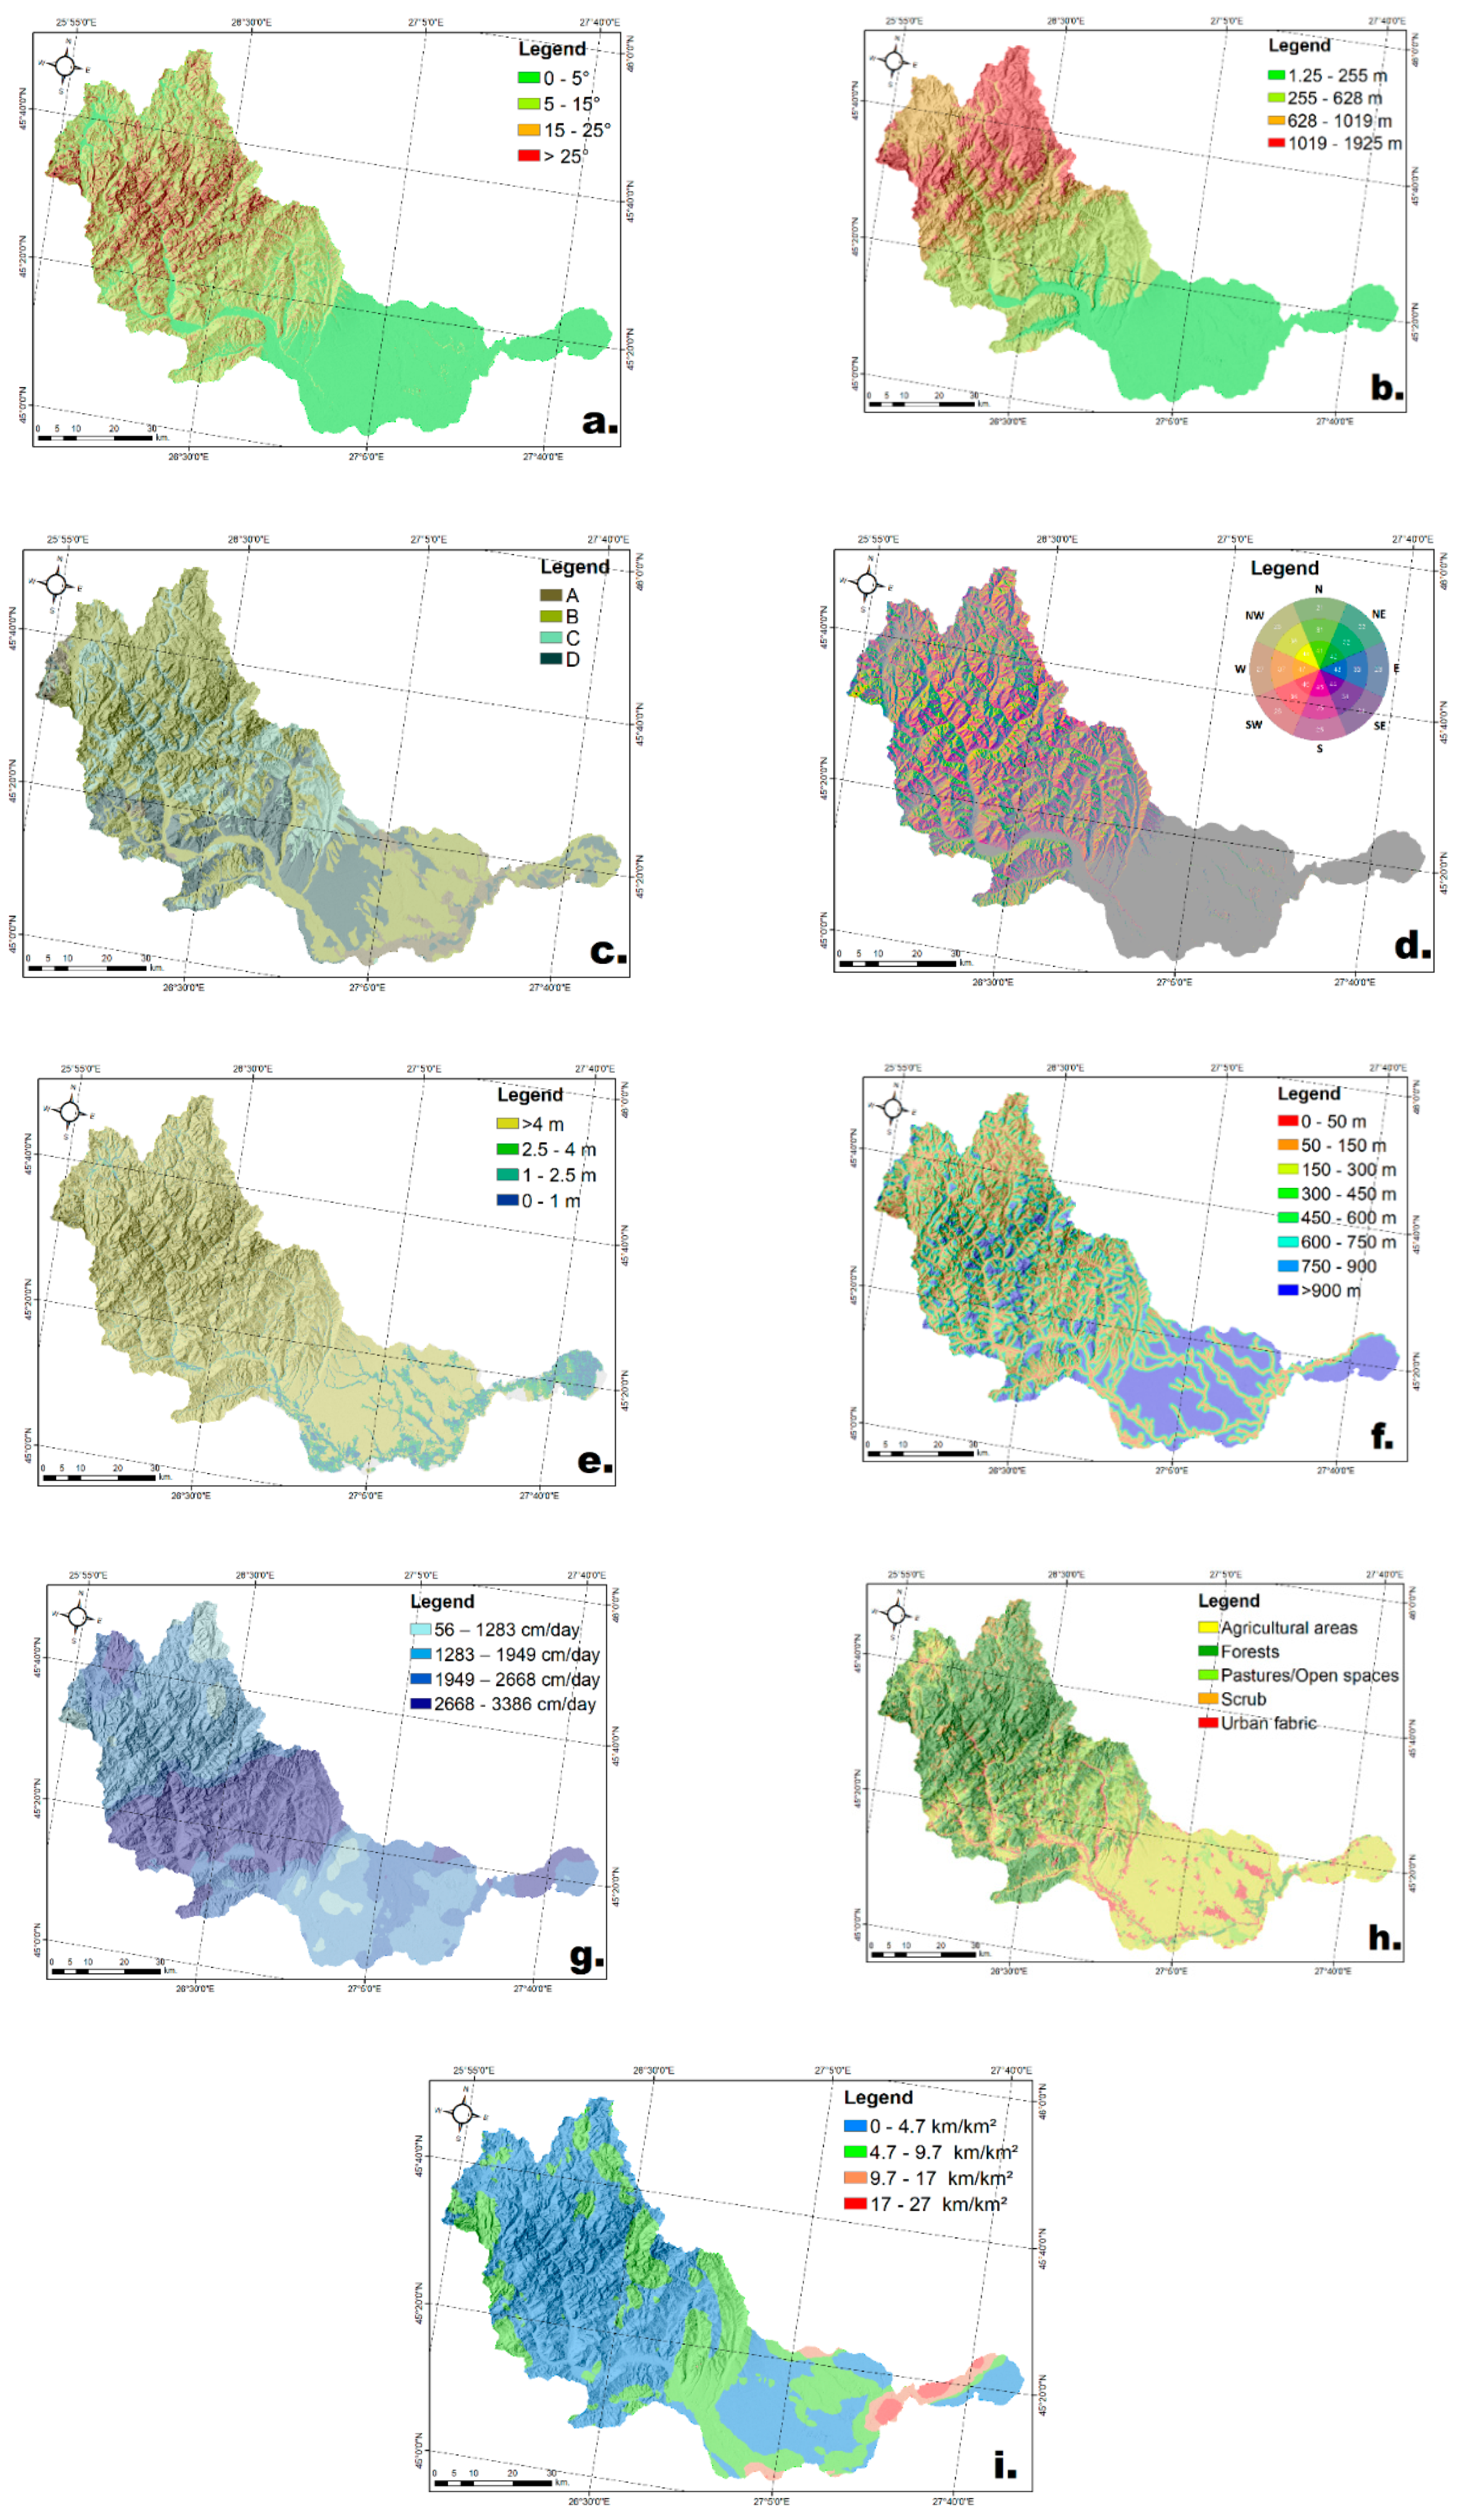
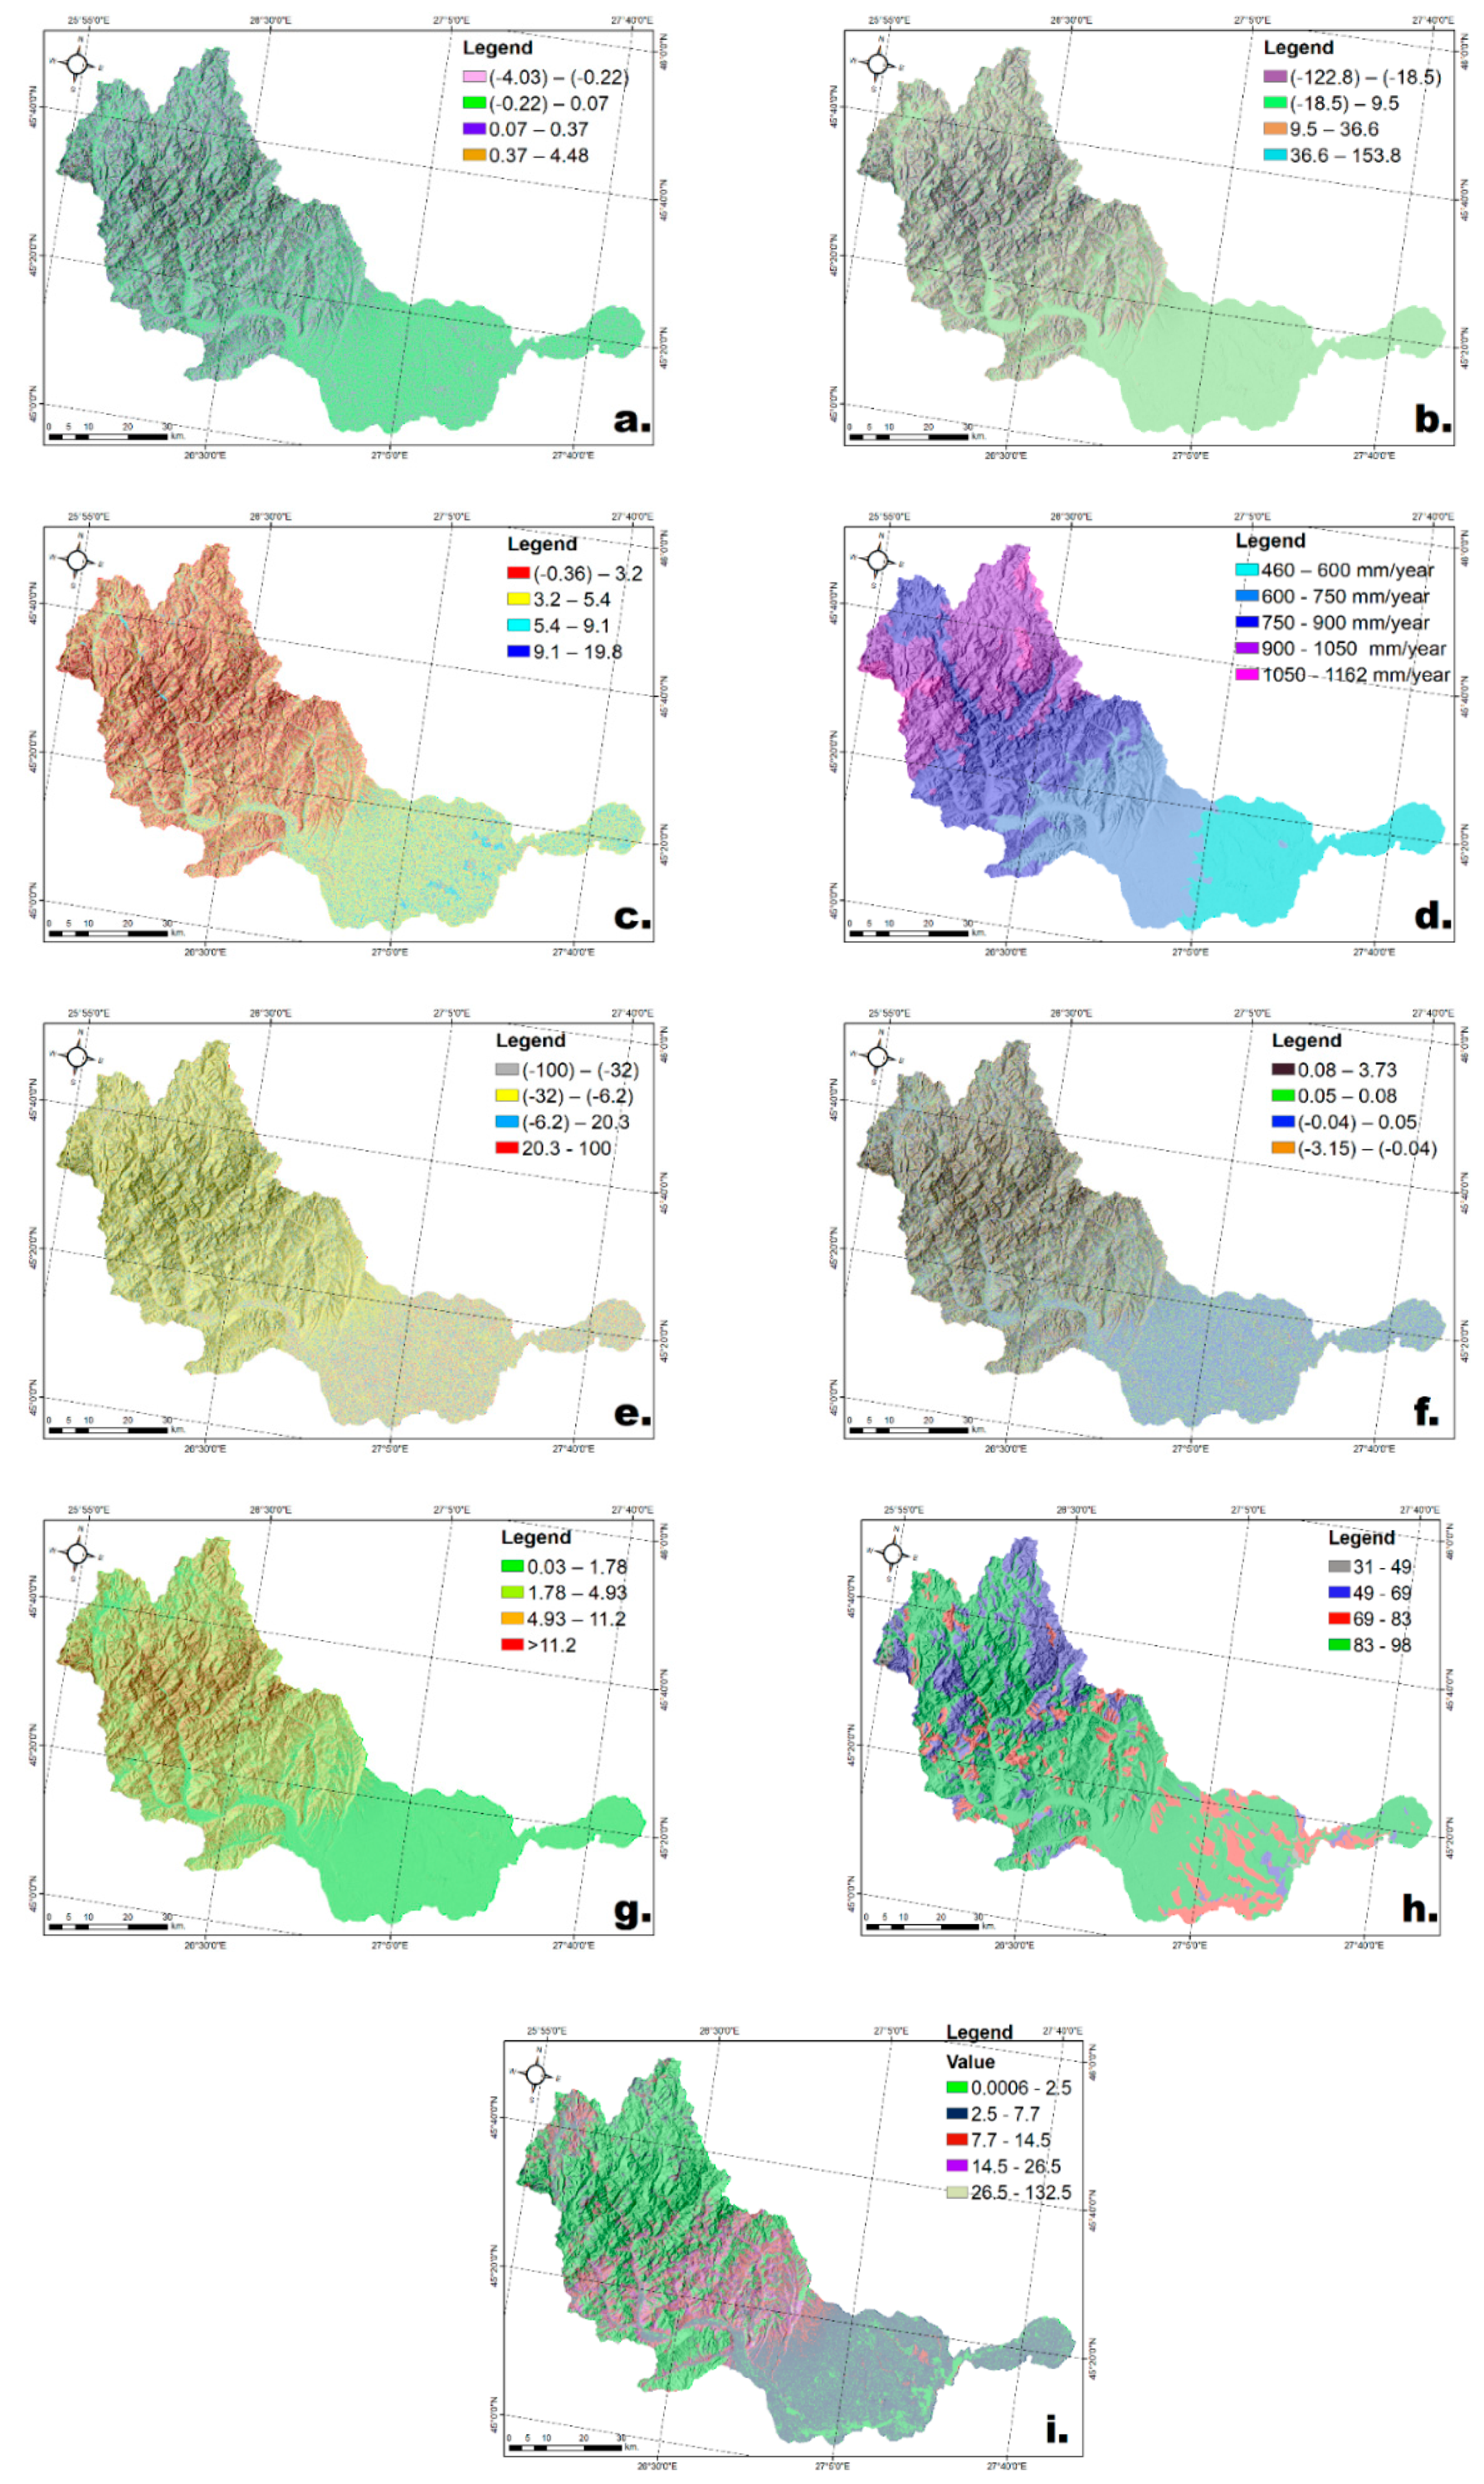
2.3. Flood and Flash-Flood Conditioning Variables
3. Flood and Flash-Flood Modelling Methods
3.1. Training and Testing the Models
3.2. Frequency Ratio Model (FR)
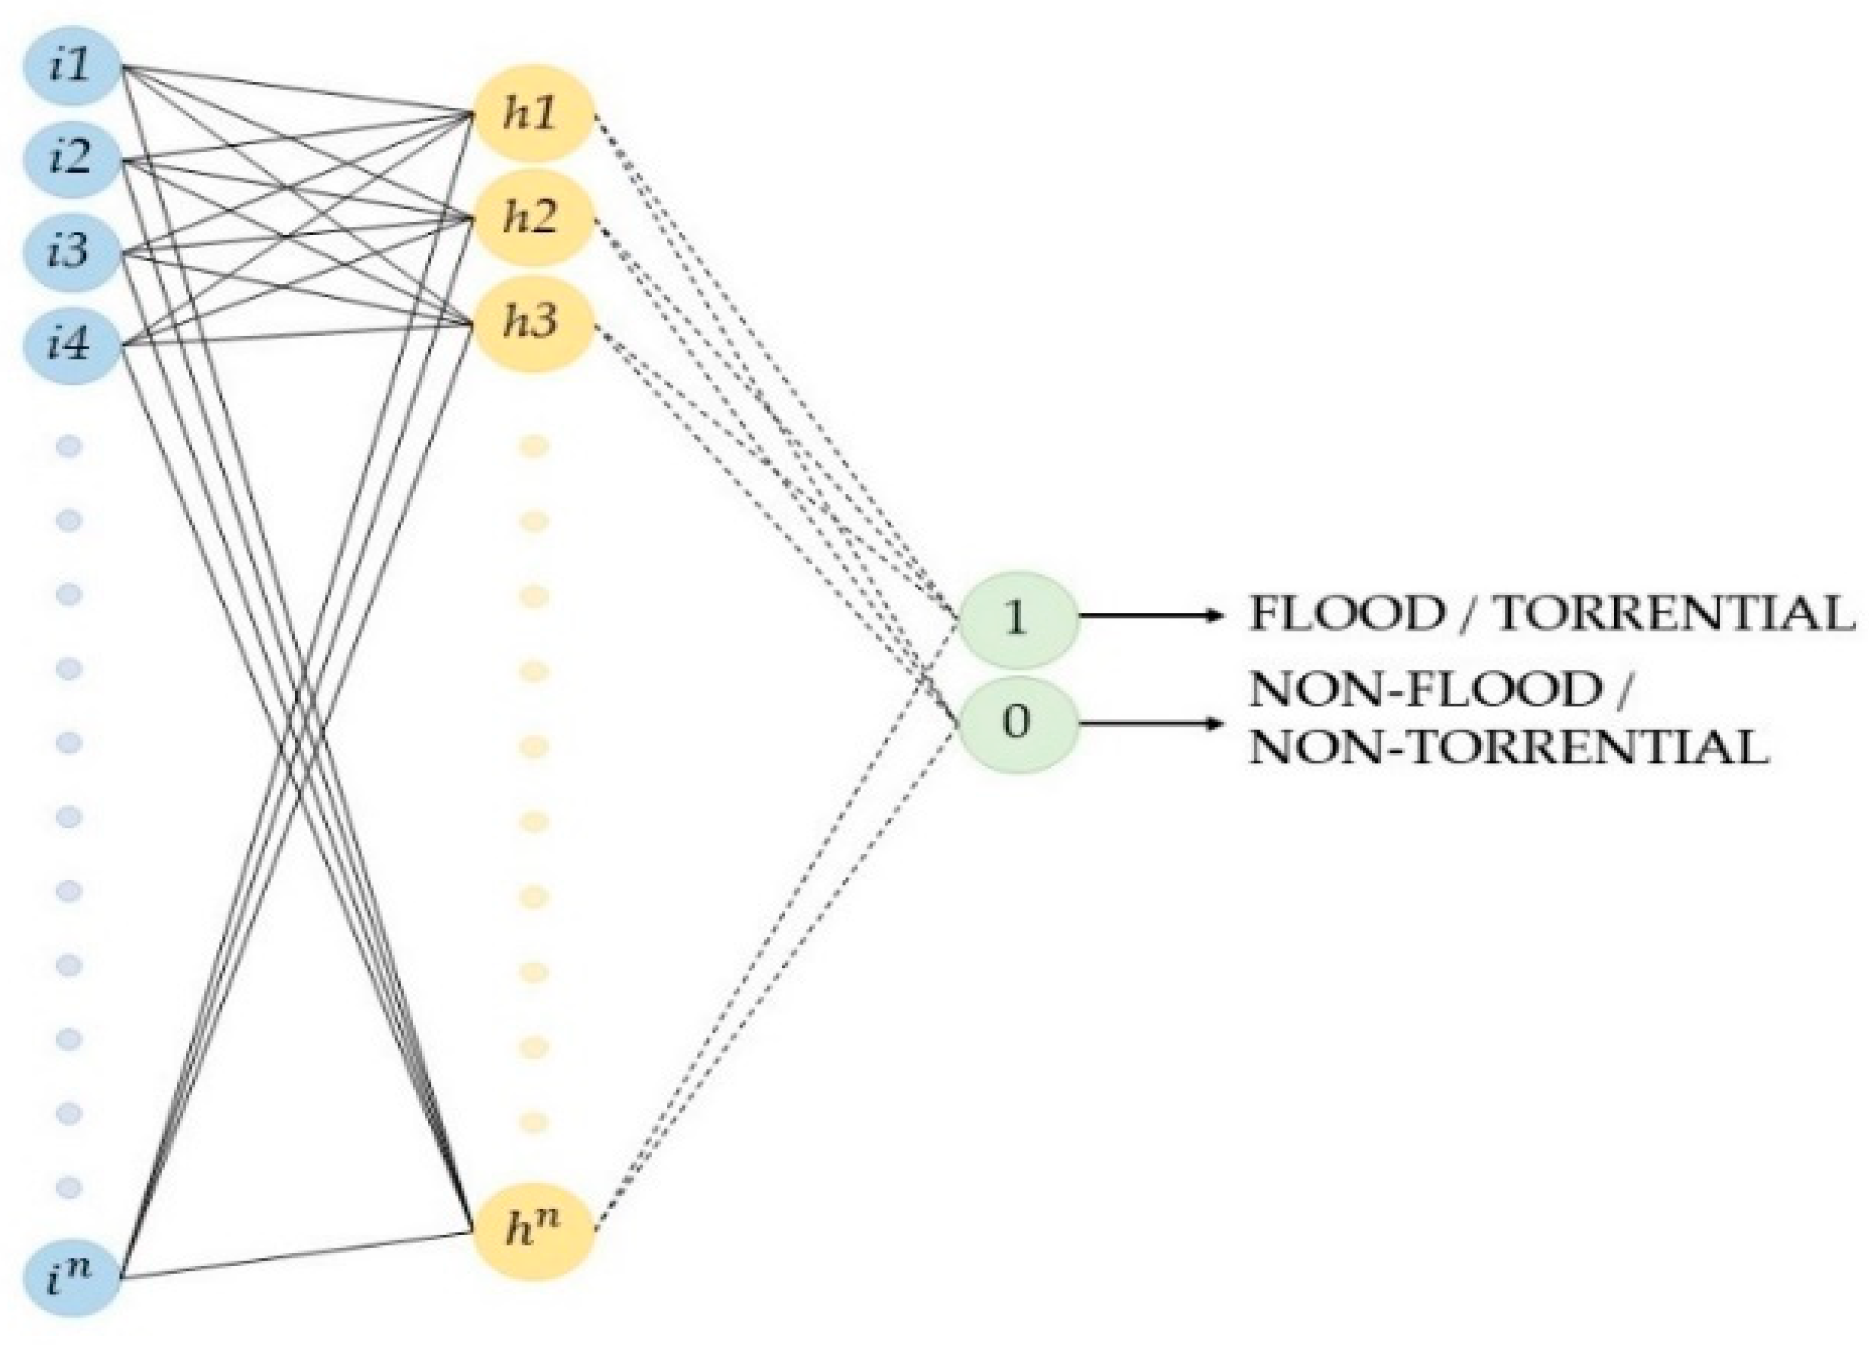
3.3. Multilayer Perceptron Neural Networks (MLP)
4. Results
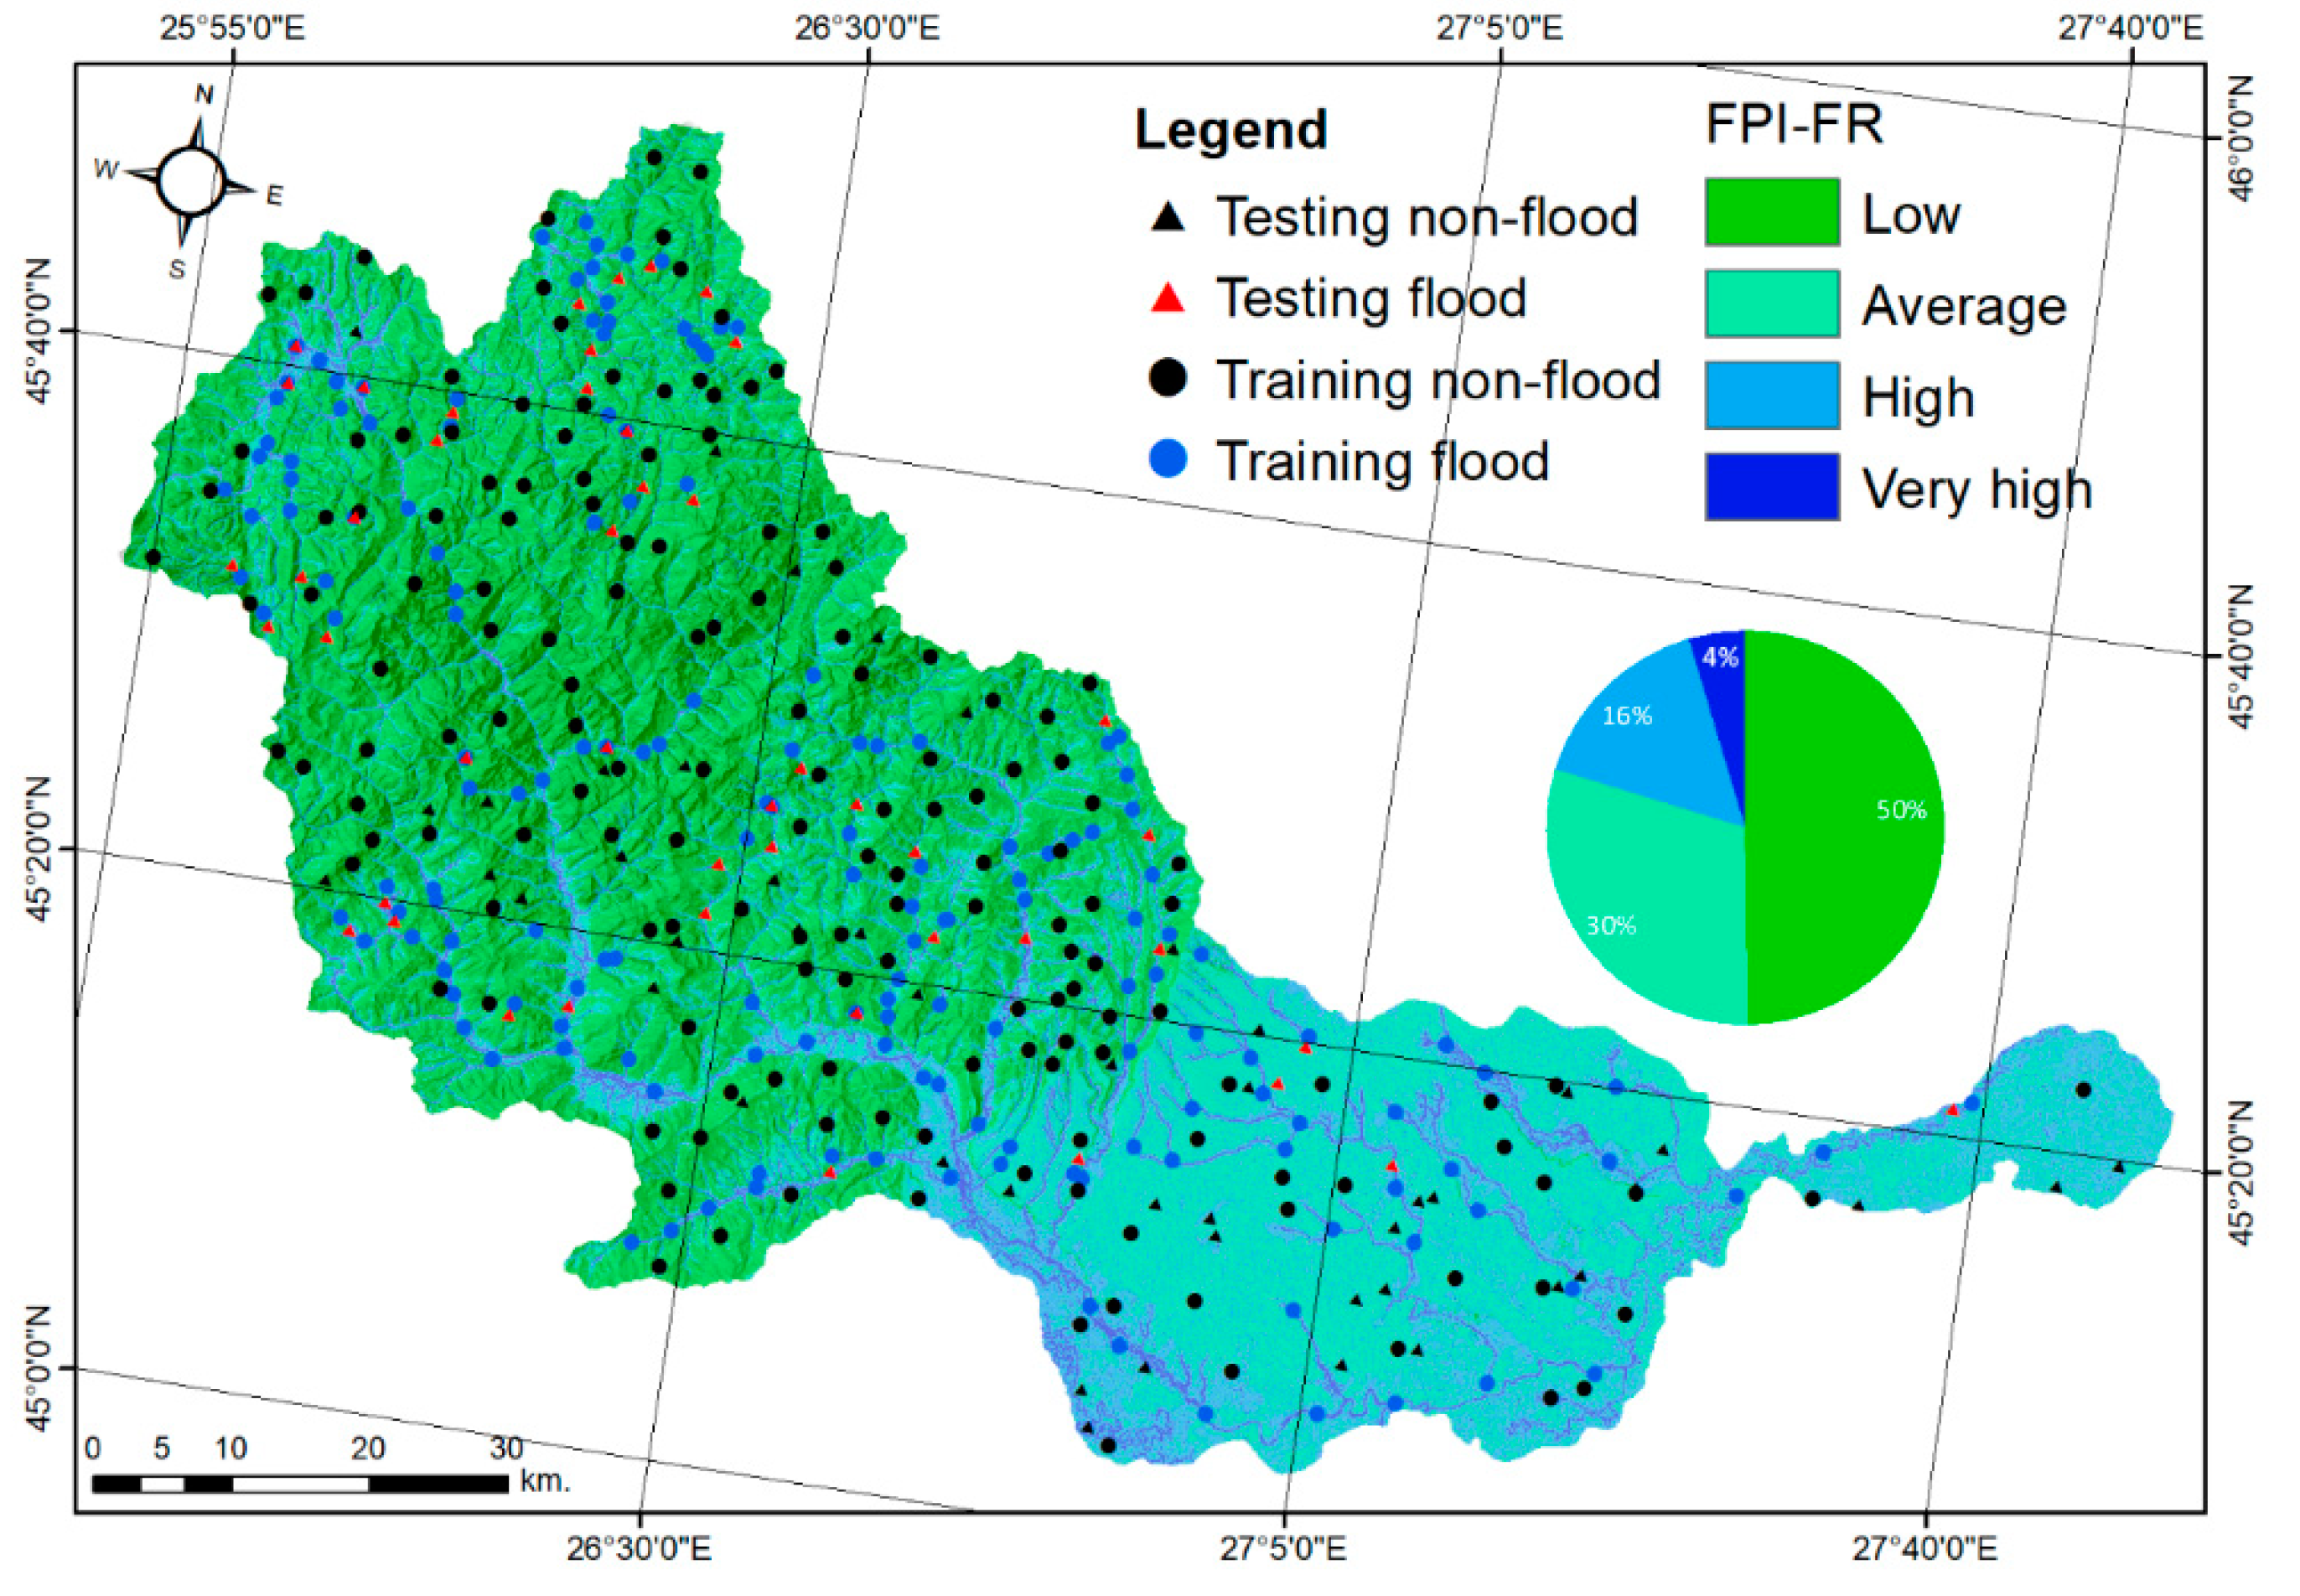
4.1. Flood and Flash-Flood Hazard Mapping Using the Frequency Ratio (FR) Model
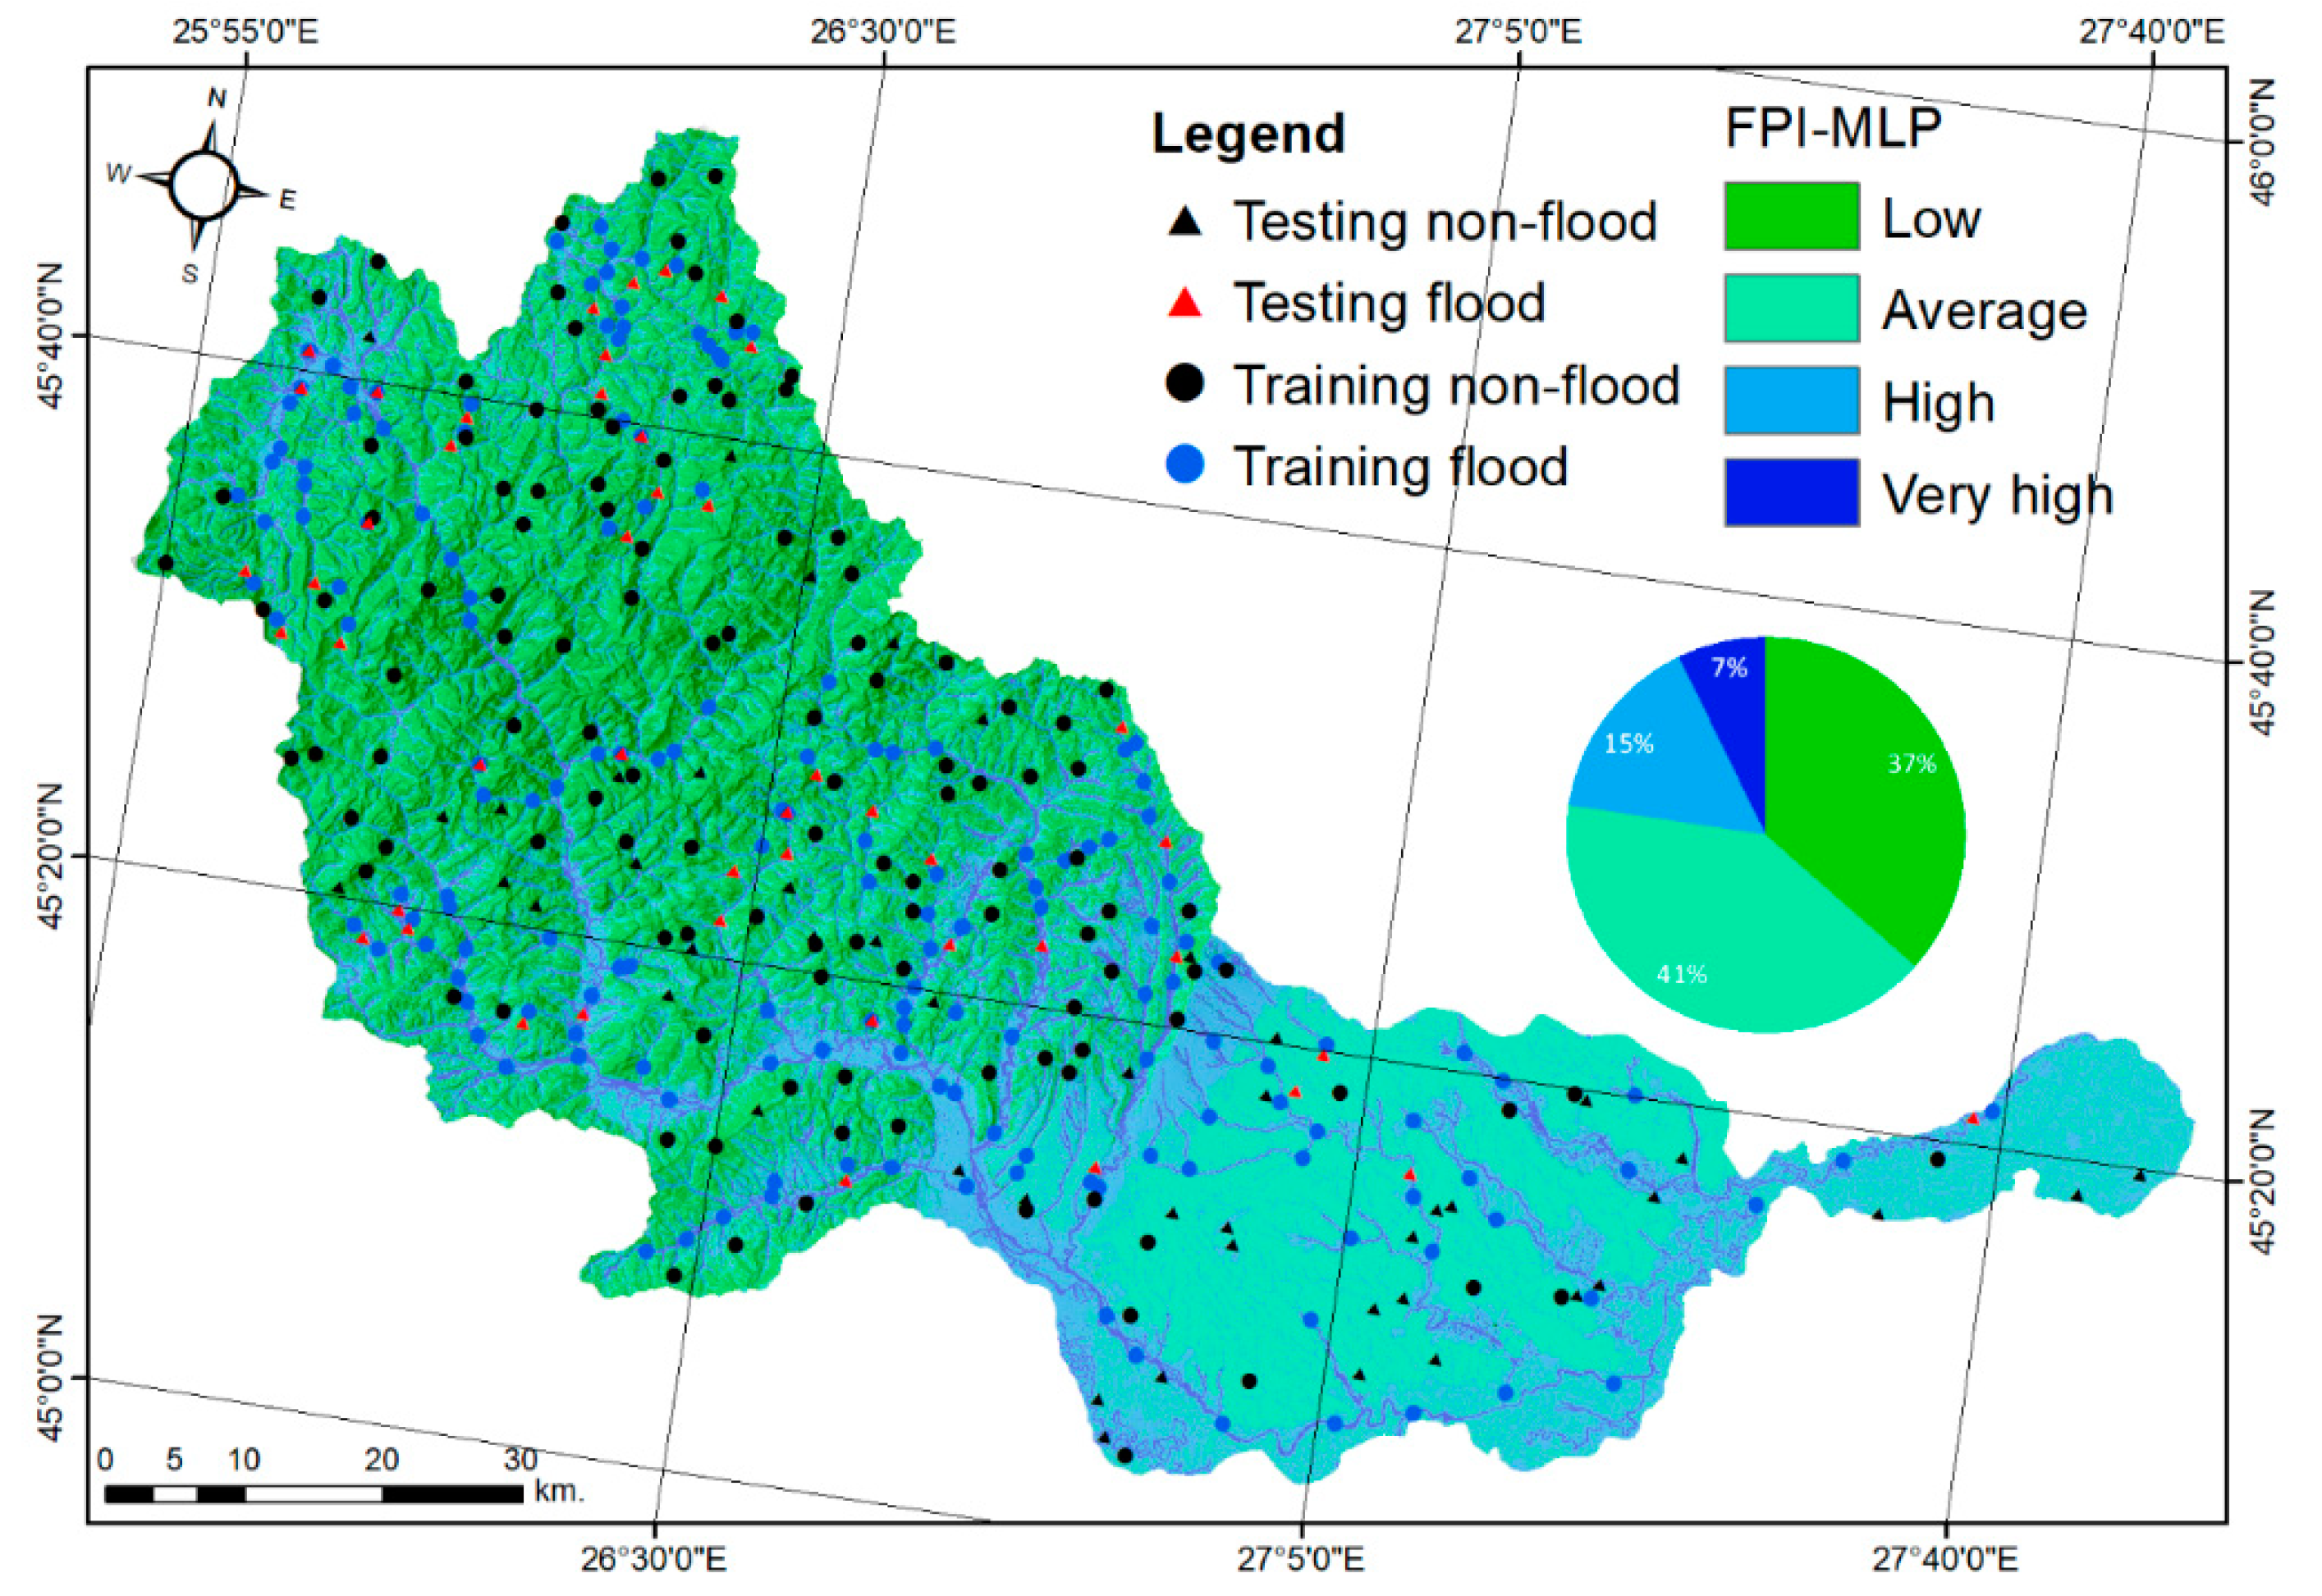
4.2. Flood and Flash-Flood Hazard Mapping Using the Multilayer Percepton Neural Networks Model
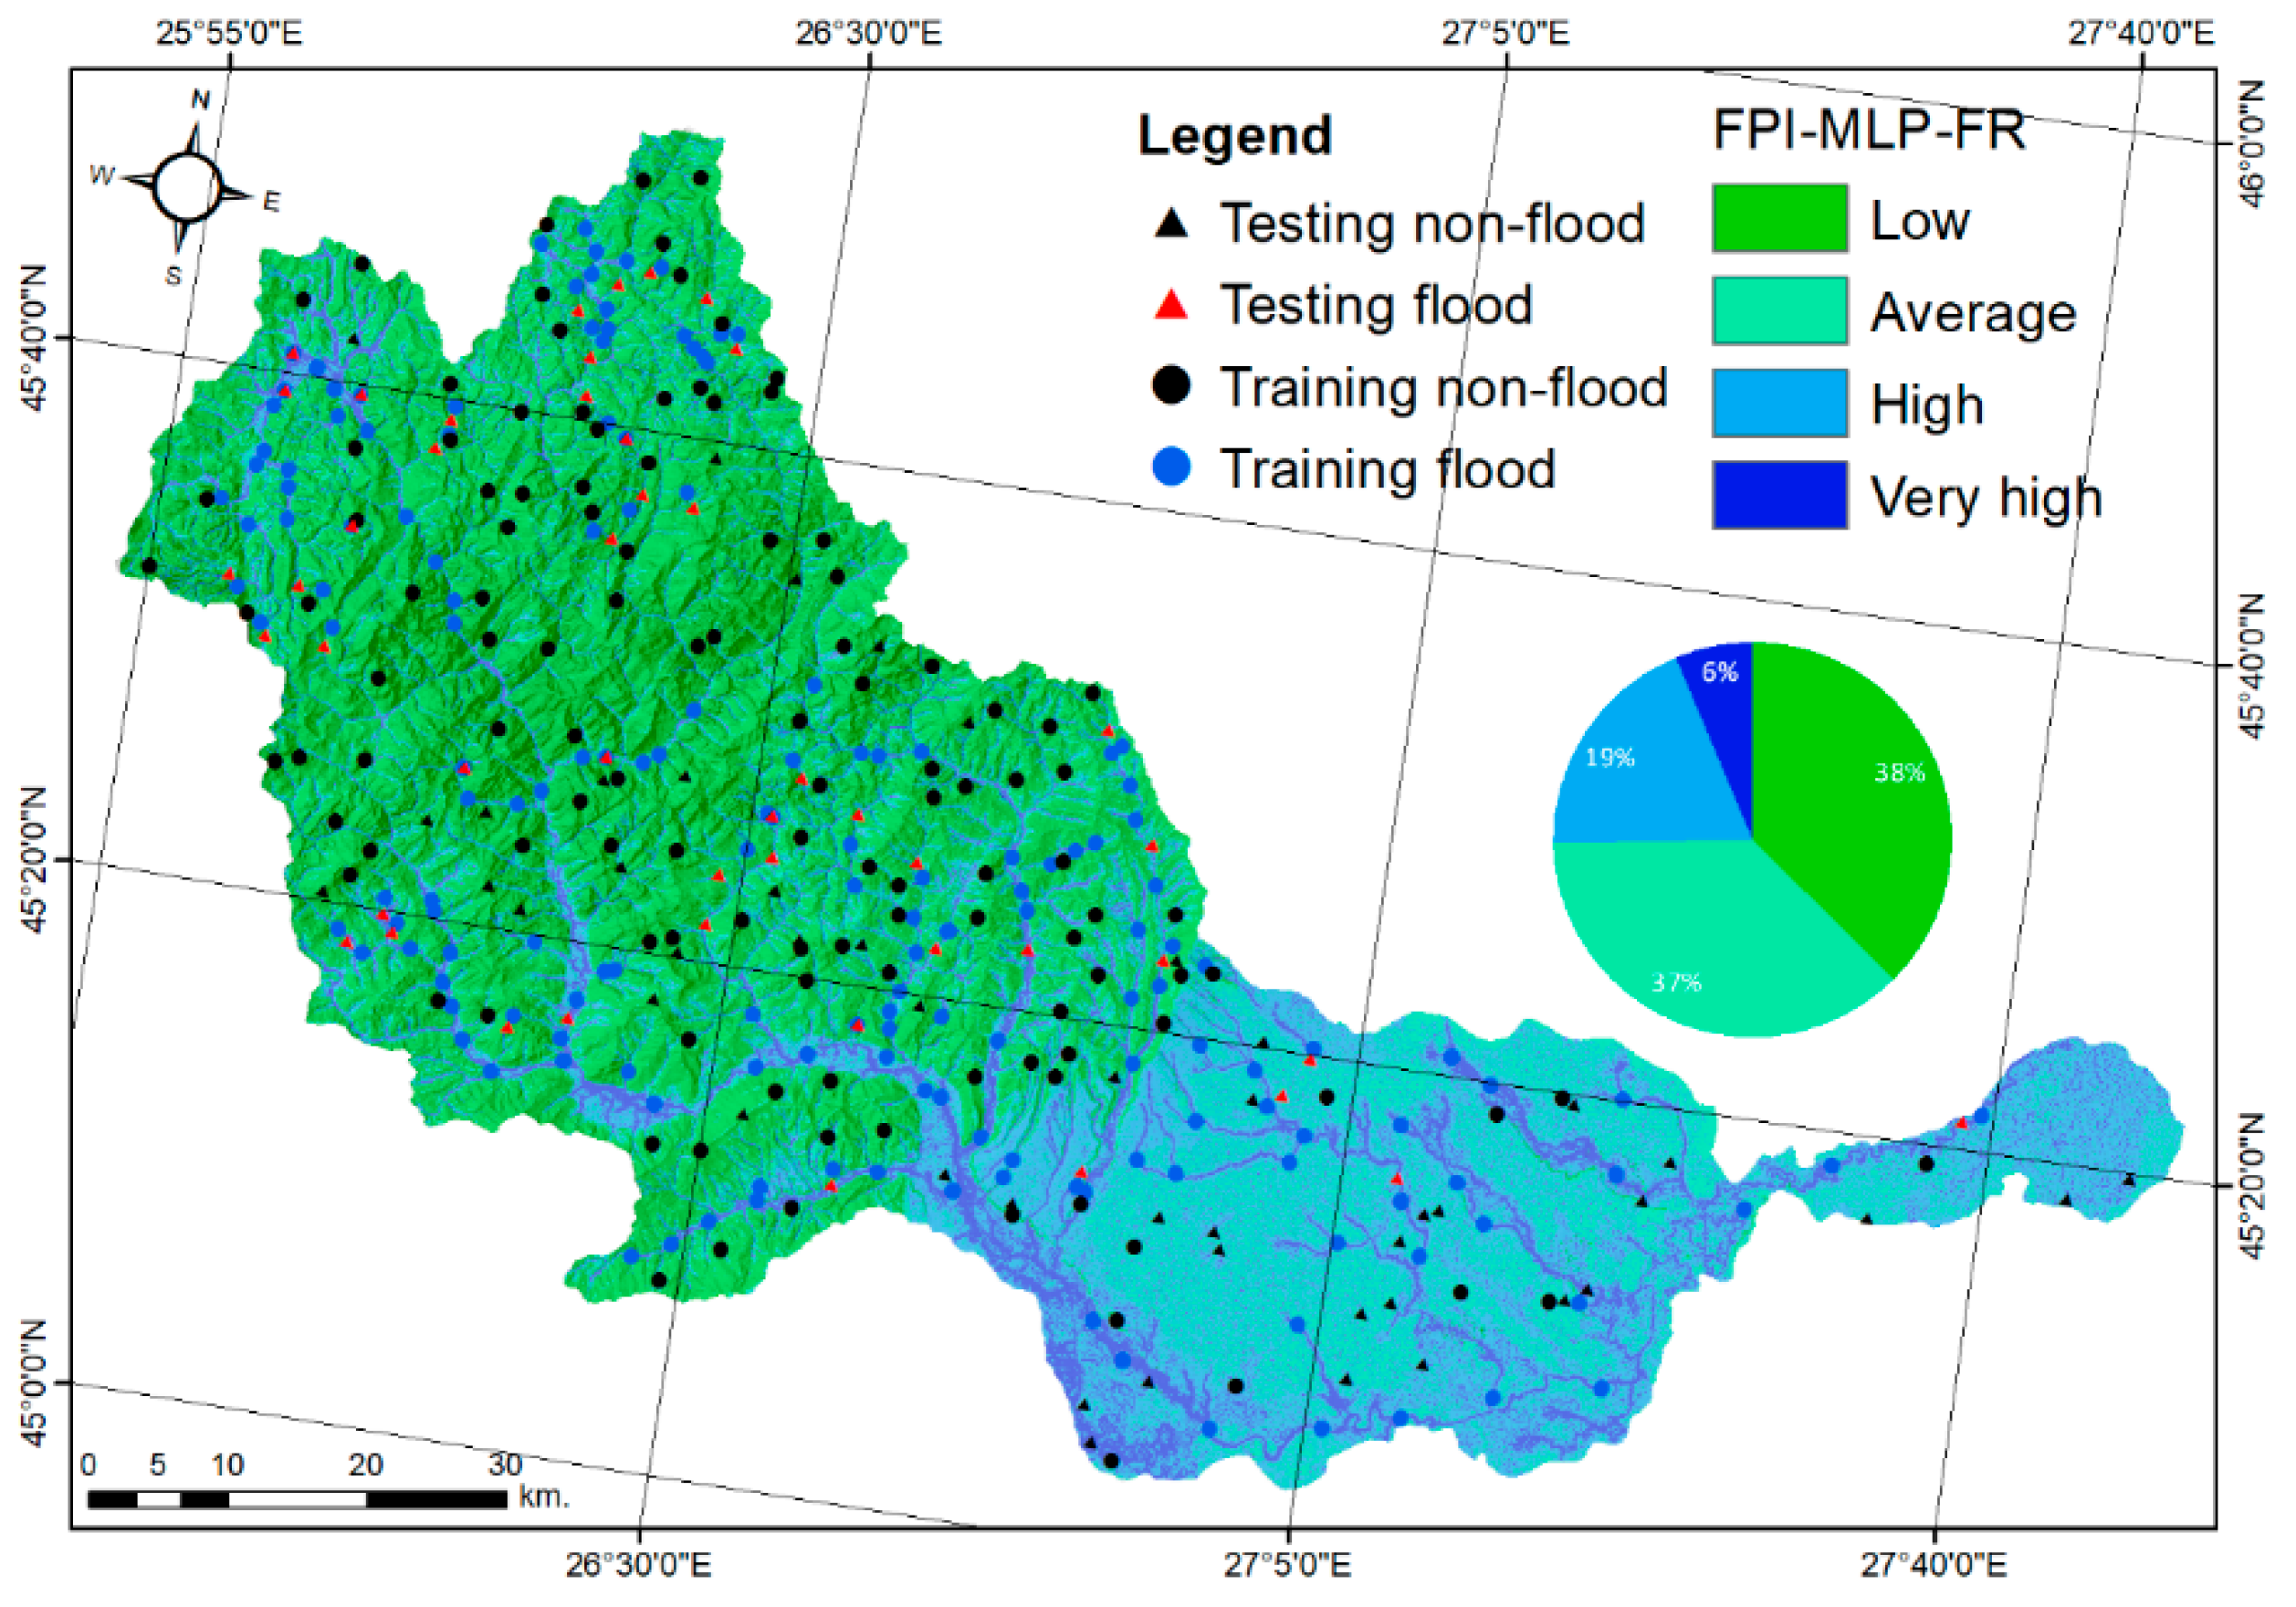
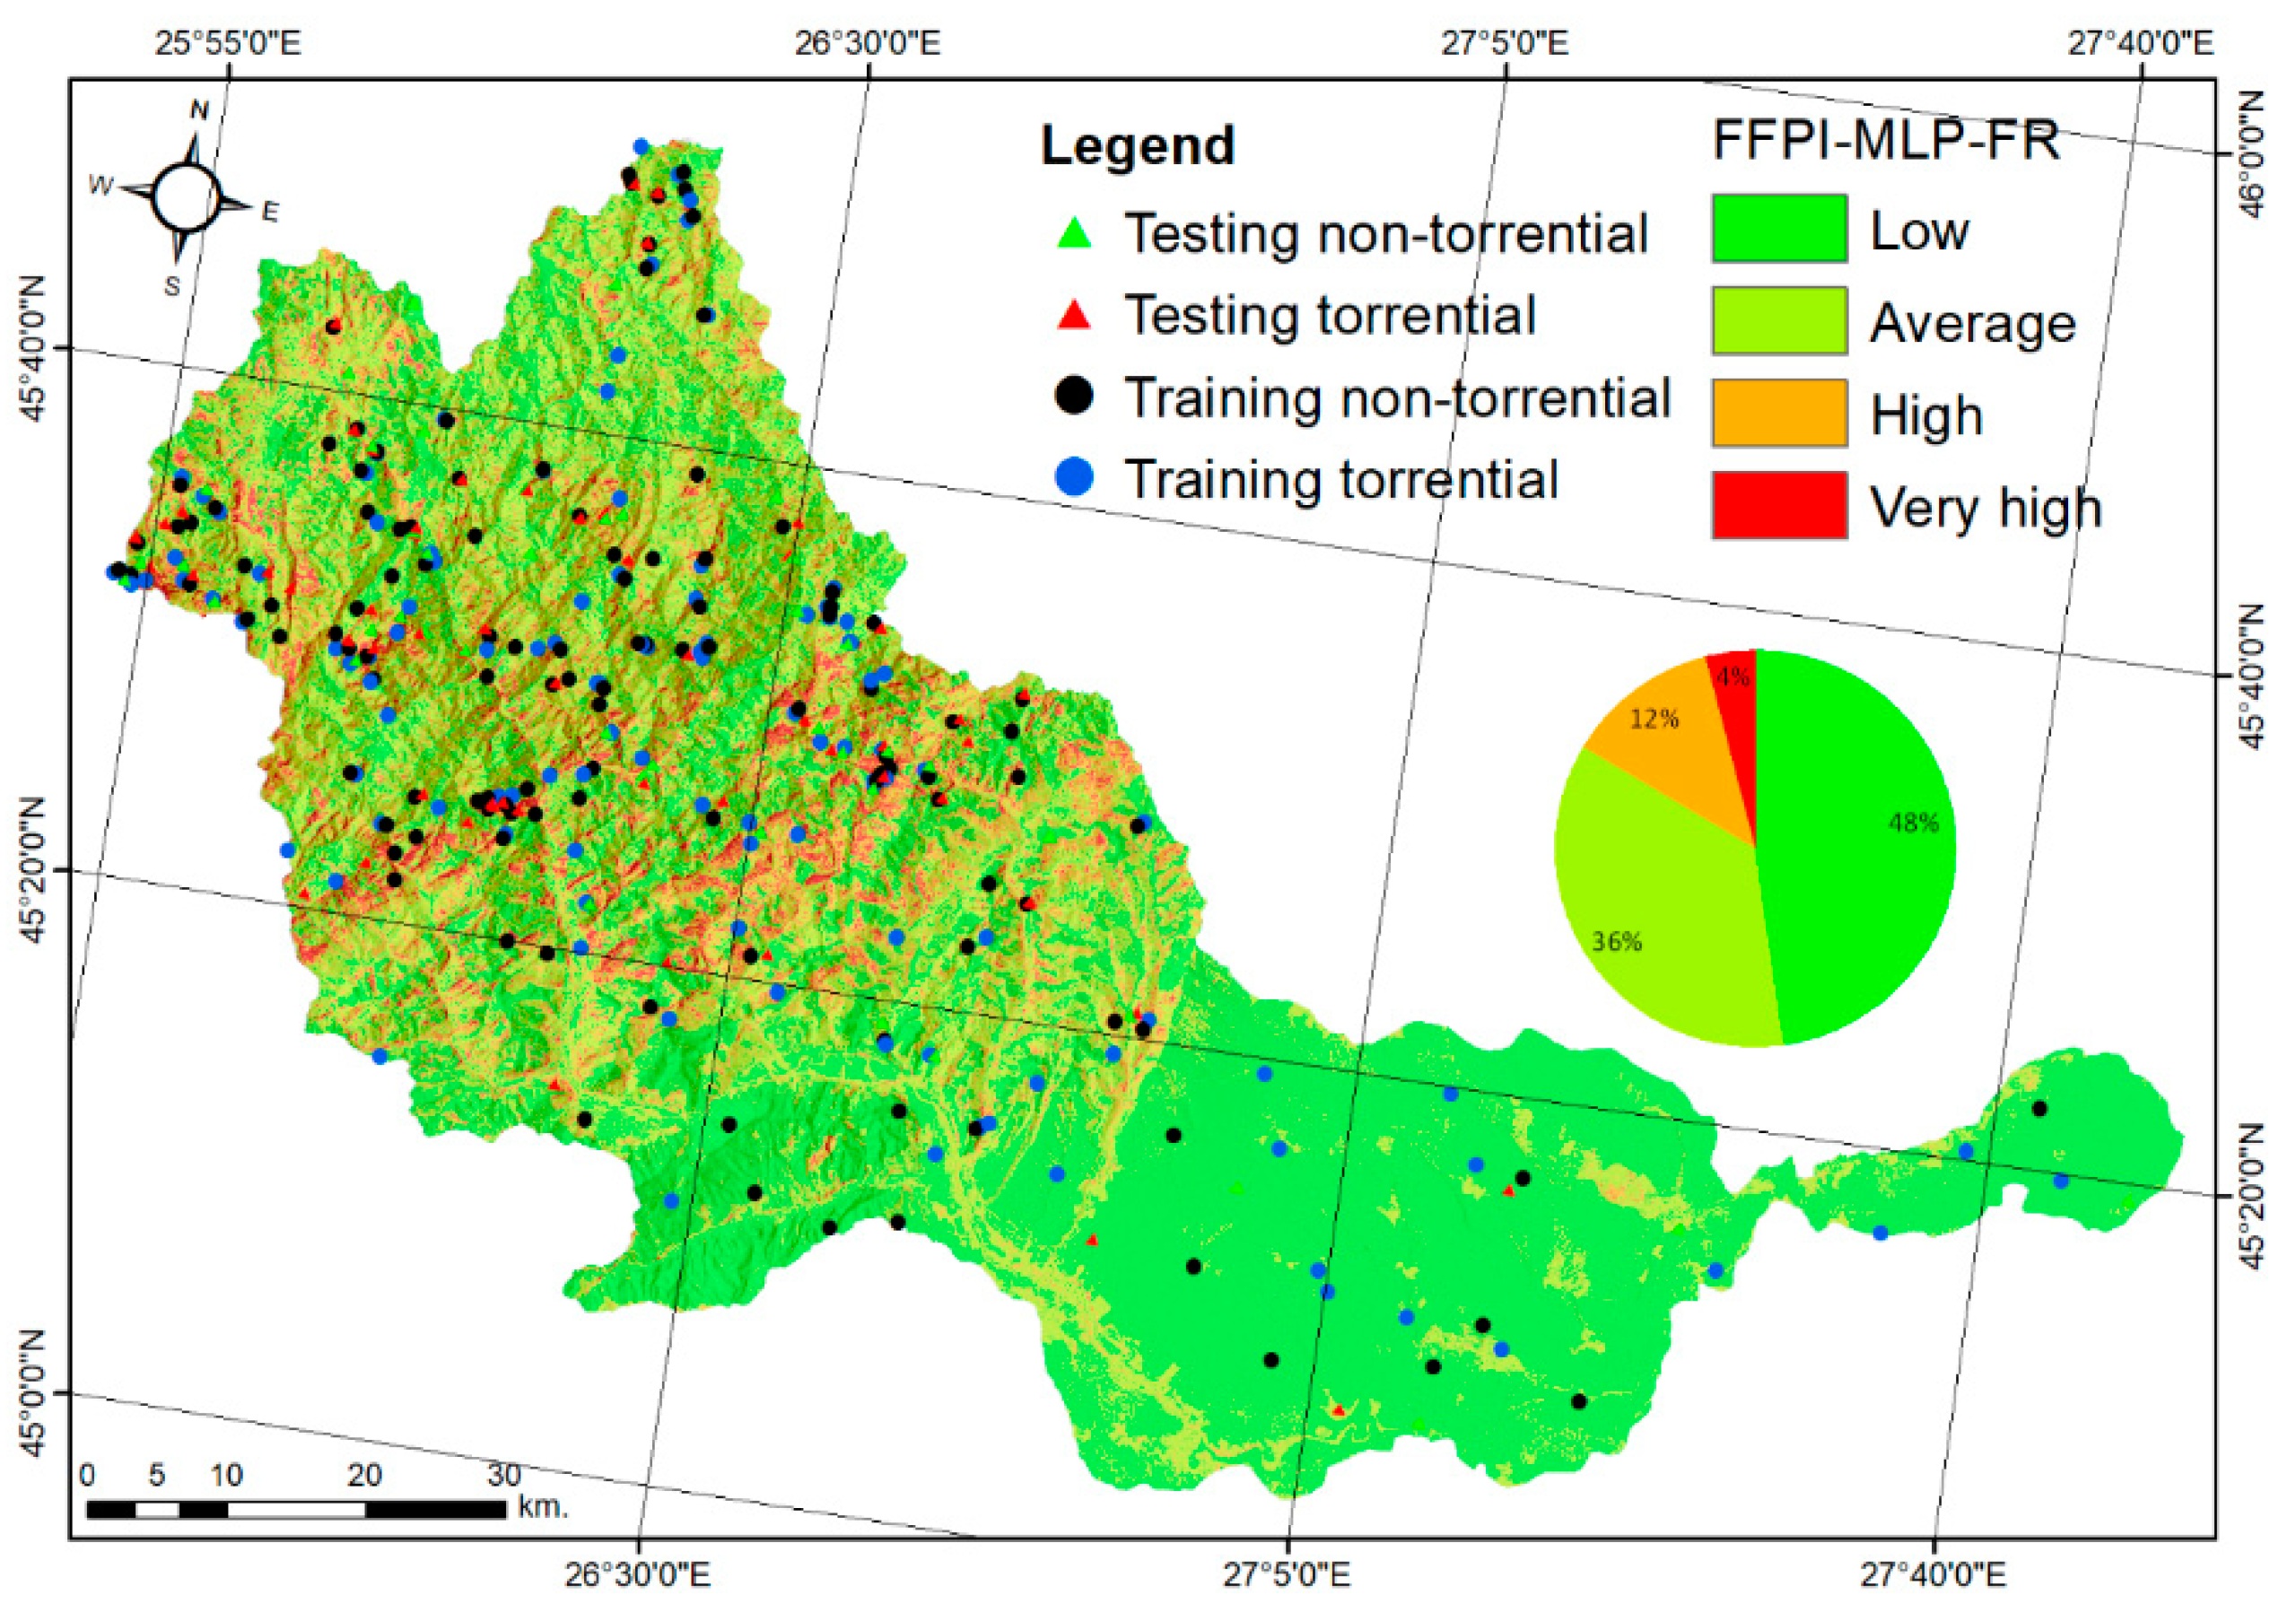
4.3. Flood and Flash-Flood Mapping Using the Hybrid Integration between the Frequency Ratio and the Multilayer Perceptron Neural Networks
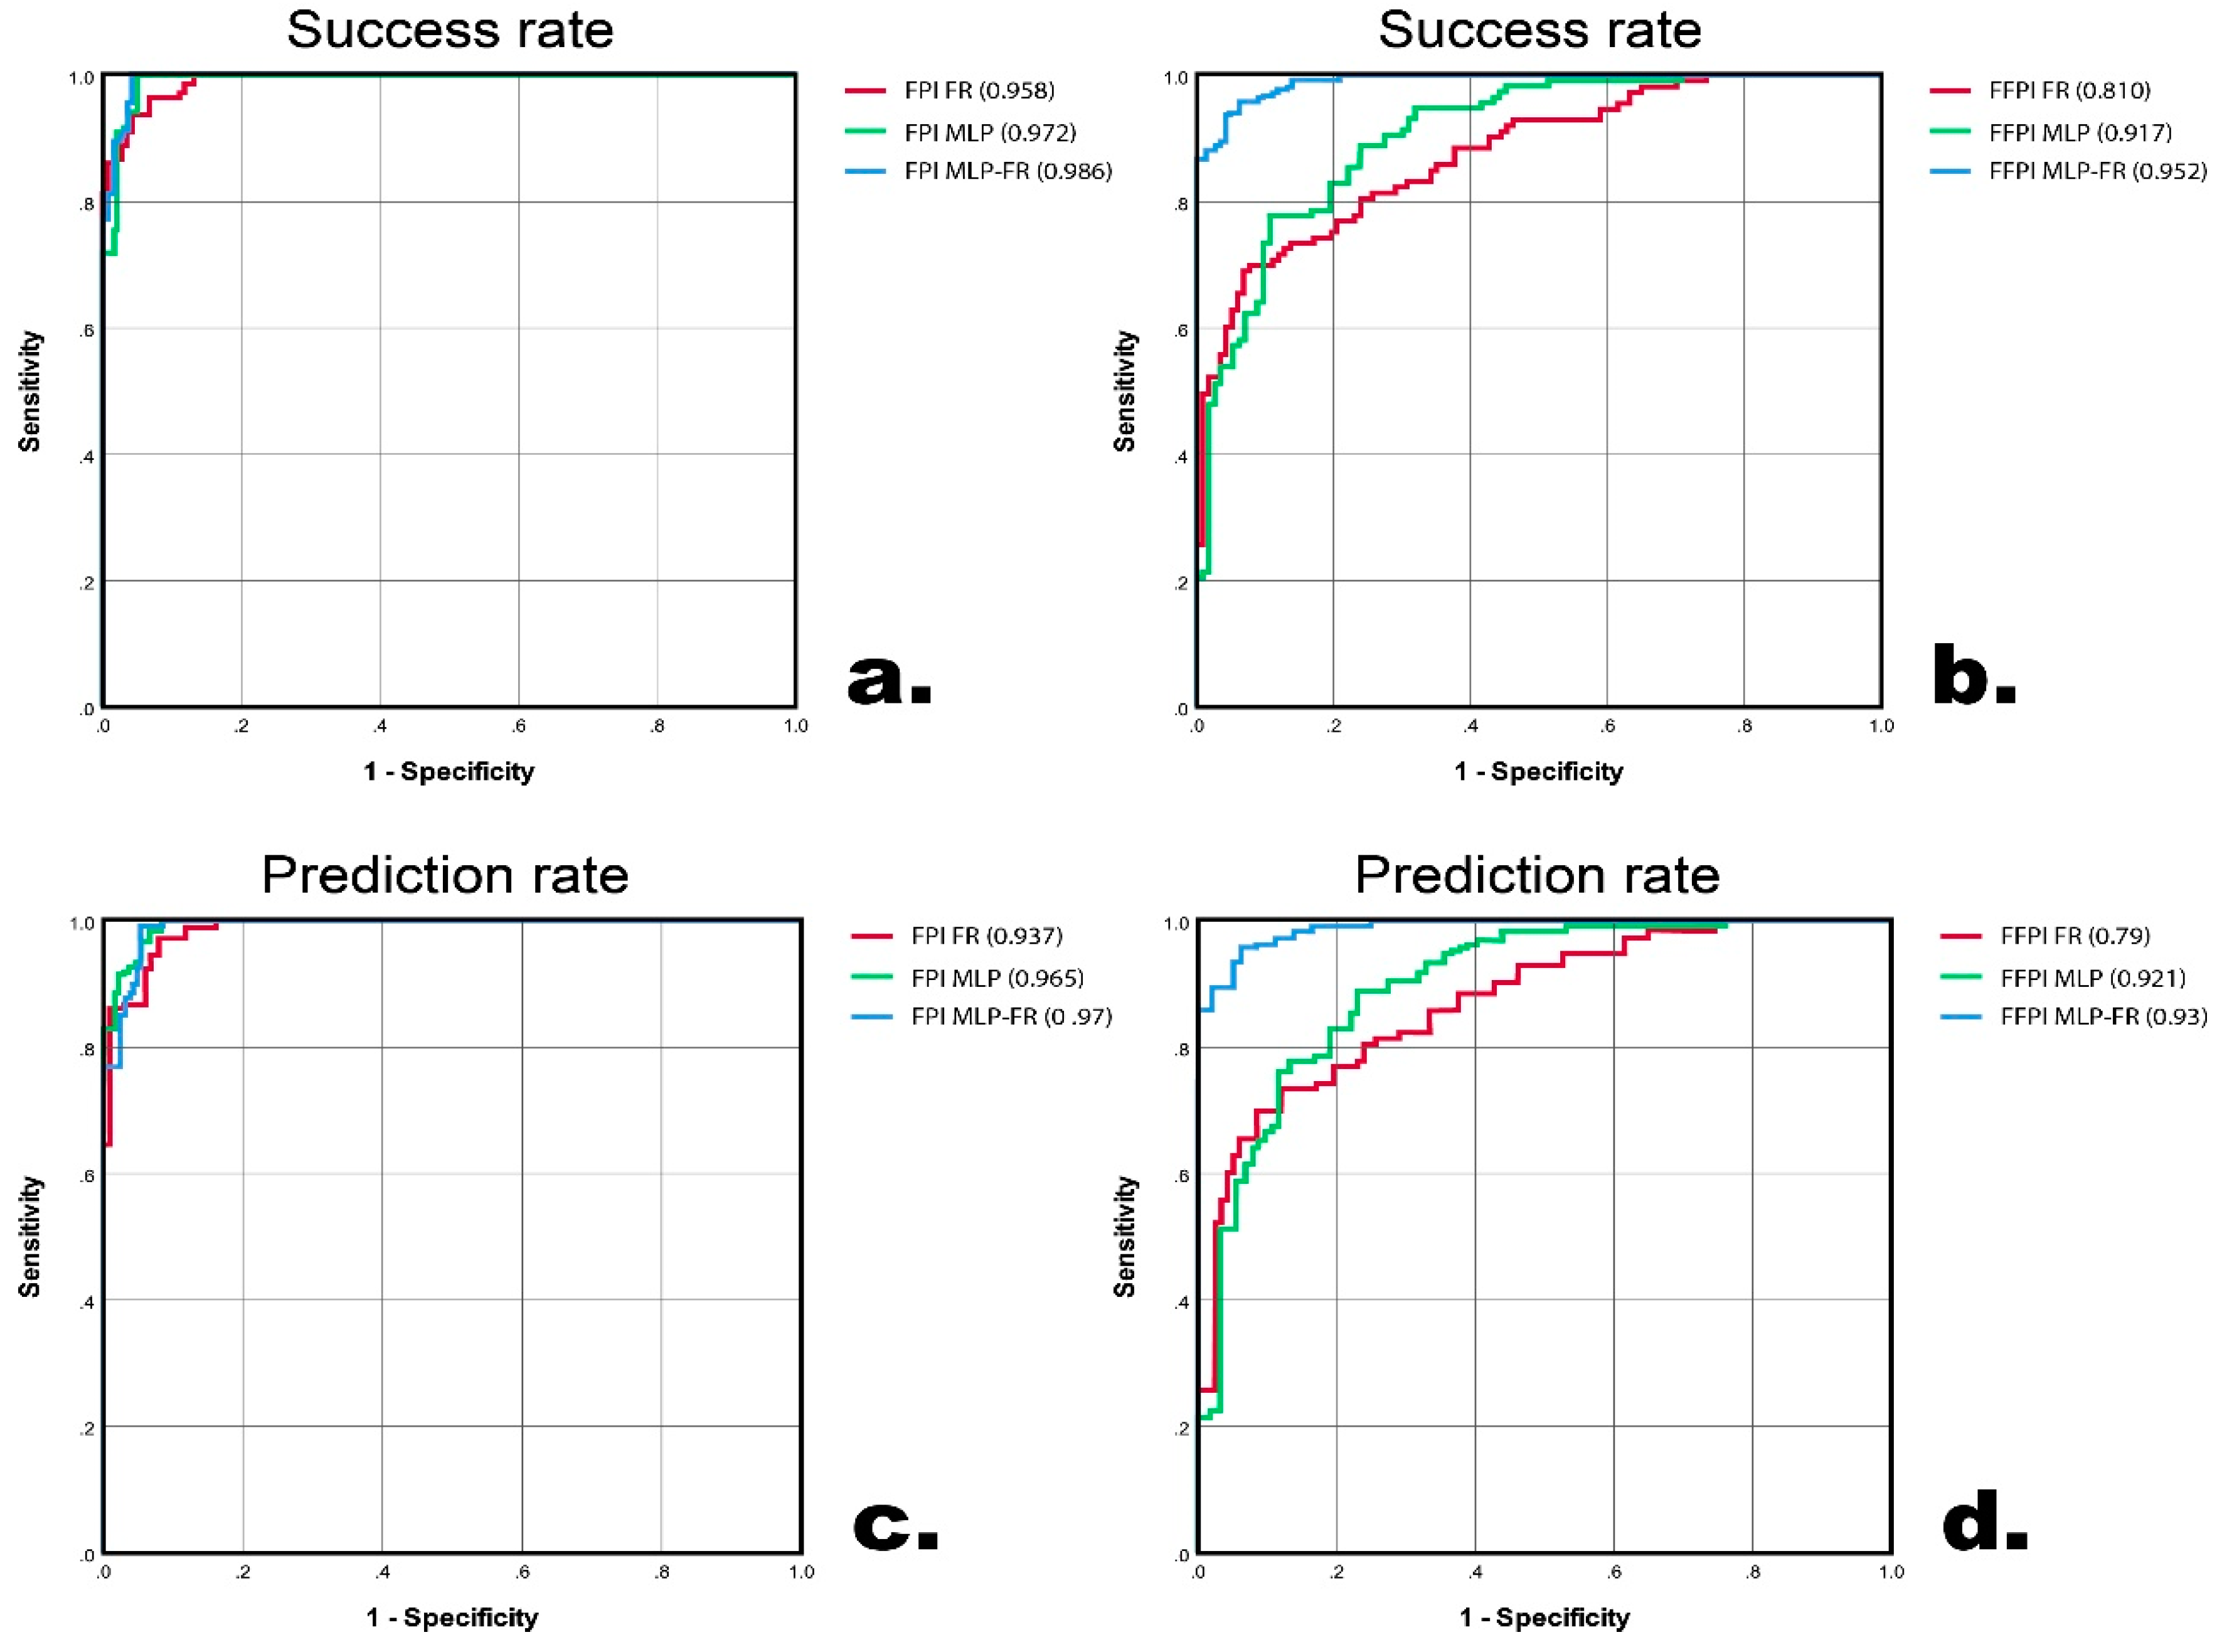
4.4. Flood and Flash-Flood Model Performance Evaluation with ROC Curves
5. Discussion
6. Conclusions
Author Contributions
Funding
Acknowledgments
Conflicts of Interest
References
- Assessment and Adaptation to Climate Change-Related Flood Risks: Oxford Research Encyclopedia of Natural Hazard Science—OI. Available online: https://oxfordindex.oup.com/view/10.1093/acrefore/9780199389407.013.278?lang=en,//oxfordindex.oup.com:443/view/10.1093/acrefore/9780199389407.013.278 (accessed on 19 August 2019).
- Didovets, I.; Krysanova, V.; Bürger, G.; Snizhko, S.; Balabukh, V.; Bronstert, A. Climate change impact on regional floods in the Carpathian region. J. Hydrol. Reg. Stud. 2019, 22, 100590. [Google Scholar] [CrossRef]
- Barriers and Guidelines for Public Policies on Climate Change Adaptation: A Missed Opportunity of Scientific Knowledge-Brokerage—Clar—2013—Natural Resources Forum—Wiley Online Library. Available online: https://onlinelibrary.wiley.com/doi/abs/10.1111/1477-8947.12013 (accessed on 31 August 2019).
- Barredo, J.I.; de Roo, A.; Lavalle, C. Flood risk mapping at European scale. Water Sci. Technol. 2007, 56, 11–17. [Google Scholar] [CrossRef] [PubMed]
- Paprotny, D.; Morales-Nápoles, O.; Jonkman, S.N. Efficient pan-European river flood hazard modelling through a combination of statistical and physical models. Nat. Hazards Earth Syst. Sci. 2017, 17, 1267–1283. [Google Scholar] [CrossRef]
- Massazza, G.; Tamagnone, P.; Wilcox, C.; Belcore, E.; Pezzoli, A.; Vischel, T.; Panthou, G.; Housseini Ibrahim, M.; Tiepolo, M.; Tarchiani, V.; et al. Flood Hazard Scenarios of the Sirba River (Niger): Evaluation of the Hazard Thresholds and Flooding Areas. Water 2019, 11, 1018. [Google Scholar] [CrossRef]
- Hennessey, R.; Pittman, J.; Morand, A.; Douglas, A. Co-benefits of integrating climate change adaptation and mitigation in the Canadian energy sector. Energy Policy 2017, 111, 214–221. [Google Scholar] [CrossRef]
- Dobler, C.; Bürger, G.; Stötter, J. Assessment of climate change impacts on flood hazard potential in the Alpine Lech watershed. J. Hydrol. 2012, 460, 29–39. [Google Scholar] [CrossRef]
- Zeleňáková, M.; Purcz, P.; Blišťan, P.; Vranayová, Z.; Hlavatá, H.; Diaconu, D.C.; Portela, M.M. Trends in Precipitation and Temperatures in Eastern Slovakia (1962–2014). Water 2018, 10, 727. [Google Scholar] [CrossRef]
- Yohe, G.W. Mitigative Capacity–the Mirror Image of Adaptive Capacity on the Emissions Side. Clim. Chang. 2001, 49, 247–262. [Google Scholar] [CrossRef]
- Filatova, T. Market-based instruments for flood risk management: A review of theory, practice and perspectives for climate adaptation policy. Environ. Sci. Policy 2013, 37, 227–242. [Google Scholar] [CrossRef]
- Balica, S.F.; Popescu, I.; Wright, N.G.; Beevers, L. Parametric and physically based modelling techniques for flood risk and vulnerability assessment: A comparison. Environ. Model. Softw. 2013, 41, 84–92. [Google Scholar] [CrossRef]
- Pradhan, B. Flood susceptible mapping and risk area delineation using logistic regression, GIS and remote sensing. J. Spat. Hydrol. 2009, 9, 1–18. [Google Scholar]
- Giustarini, L.; Chini, M.; Hostache, R.; Pappenberger, F.; Matgen, P. Flood Hazard Mapping Combining Hydrodynamic Modeling and Multi Annual Remote Sensing data. Remote Sens. 2015, 7, 14200–14226. [Google Scholar] [CrossRef]
- Gigović, L.; Pamučar, D.; Bajić, Z.; Drobnjak, S. Application of GIS-Interval Rough AHP Methodology for Flood Hazard Mapping in Urban Areas. Water 2017, 9, 360. [Google Scholar] [CrossRef]
- Balogun, A.-L.; Matori, A.-N.; Hamid-Mosaku, A.I. A fuzzy multi-criteria decision support system for evaluating subsea oil pipeline routing criteria in East Malaysia. Environ. Earth Sci. 2015, 74, 4875–4884. [Google Scholar] [CrossRef]
- Tehrany, M.S.; Pradhan, B.; Jebur, M.N. Spatial prediction of flood susceptible areas using rule based decision tree (DT) and a novel ensemble bivariate and multivariate statistical models in GIS. J. Hydrol. 2013, 504, 69–79. [Google Scholar] [CrossRef]
- Mukerji Aditya; Chatterjee Chandranath; Raghuwanshi Narendra Singh Flood Forecasting Using ANN, Neuro-Fuzzy, and Neuro-GA Models. J. Hydrol. Eng. 2009, 14, 647–652. [CrossRef]
- Pulvirenti, L.; Pierdicca, N.; Chini, M.; Guerriero, L. An algorithm for operational flood mapping from Synthetic Aperture Radar (SAR) data using fuzzy logic. Nat. Hazards Earth Syst. Sci. 2011, 11, 529–540. [Google Scholar] [CrossRef]
- Tehrany, M.S.; Pradhan, B.; Jebur, M.N. Flood susceptibility mapping using a novel ensemble weights-of-evidence and support vector machine models in GIS. J. Hydrol. 2014, 512, 332–343. [Google Scholar] [CrossRef]
- Campolo, M.; Soldati, A.; Andreussi, P. Artificial neural network approach to flood forecasting in the River Arno. Hydrol. Sci. J. 2003, 48, 381–398. [Google Scholar] [CrossRef]
- An Artificial Neural Network Model for Flood Simulation Using GIS: Johor River Basin, Malaysia | Springer Link. Available online: https://link.springer.com/article/10.1007/s12665-011-1504-z (accessed on 21 September 2019).
- Tiwari, M.K.; Chatterjee, C. Uncertainty assessment and ensemble flood forecasting using bootstrap based artificial neural networks (BANNs). J. Hydrol. 2010, 382, 20–33. [Google Scholar] [CrossRef]
- Rahmati, O.; Pourghasemi, H.R.; Zeinivand, H. Flood susceptibility mapping using frequency ratio and weights-of-evidence models in the Golastan Province, Iran. Geocarto Int. 2016, 31, 42–70. [Google Scholar] [CrossRef]
- Nandi, A.; Mandal, A.; Wilson, M.; Smith, D. Flood hazard mapping in Jamaica using principal component analysis and logistic regression. Environ. Earth Sci. 2016, 75, 465. [Google Scholar] [CrossRef]
- Lee, M.J.; Kang, J.; Jeon, S. Application of frequency ratio model and validation for predictive flooded area susceptibility mapping using GIS. In 2012 IEEE International Geoscience and Remote Sensing Symposium; IEEE: Munich, Germany, 2012; pp. 895–898. [Google Scholar]
- Evaluating the Application of the Statistical Index Method in Flood Susceptibility Mapping and Its Comparison with Frequency Ratio and Logistic Regression Methods: Geomatics, Natural Hazards and Risk. Available online: https://www.tandfonline.com/doi/full/10.1080/19475705.2018.1506509 (accessed on 31 August 2019).
- Cao, C.; Chen, J.; Zhang, W.; Xu, P.; Zheng, L.; Zhu, C. Geospatial Analysis of Mass-Wasting Susceptibility of Four Small Catchments in Mountainous Area of Miyun County, Beijing. Int. J. Environ. Res. Public Health 2019, 16, 2801. [Google Scholar] [CrossRef] [PubMed]
- Nohani, E.; Moharrami, M.; Sharafi, S.; Khosravi, K.; Pradhan, B.; Pham, B.T.; Lee, S.; Melesse, A. Landslide Susceptibility Mapping Using Different GIS-Based Bivariate Models. Water 2019, 11, 1402. [Google Scholar] [CrossRef]
- Zhang, T.; Han, L.; Chen, W.; Shahabi, H. Hybrid Integration Approach of Entropy with Logistic Regression and Support Vector Machine for Landslide Susceptibility Modeling. Entropy 2018, 20, 884. [Google Scholar] [CrossRef]
- Khan, H.; Shafique, M.; Khan, M.A.; Bacha, M.A.; Shah, S.U.; Calligaris, C. Landslide susceptibility assessment using Frequency Ratio, a case study of northern Pakistan. Egypt. J. Remote Sens. Space Sci. 2019, 22, 11–24. [Google Scholar] [CrossRef]
- Kumar Samanta, R.; Bhunia, G.; Shit, P.; Pourghasemi, H.R. Flood susceptibility mapping using geospatial frequency ratio technique: A case study of Subarnarekha River Basin, India. Model. Earth Syst. Environ. 2018, 4, 395–408. [Google Scholar] [CrossRef]
- Pham, B.T.; Tien Bui, D.; Prakash, I.; Dholakia, M.B. Hybrid integration of Multilayer Perceptron Neural Networks and machine learning ensembles for landslide susceptibility assessment at Himalayan area (India) using GIS. Catena 2017, 149, 52–63. [Google Scholar] [CrossRef]
- Gómez, H.; Kavzoglu, T. Assessment of shallow landslide susceptibility using artificial neural networks in Jabonosa River Basin, Venezuela. Eng. Geol. 2005, 78, 11–27. [Google Scholar] [CrossRef]
- Costache, R. Flash-flood Potential Index mapping using weights of evidence, decision Trees models and their novel hybrid integration. Stoch. Environ. Res. Risk Assess. 2019, 33, 1375–1402. [Google Scholar] [CrossRef]
- Wu, J.; Liu, H.; Wei, G.; Song, T.; Zhang, C.; Zhou, H. Flash Flood Forecasting Using Support Vector Regression Model in a Small Mountainous Catchment. Water 2019, 11, 1327. [Google Scholar] [CrossRef]
- Huang, W.; Cao, Z.; Huang, M.; Duan, W.; Ni, Y.; Yang, W. A New Flash Flood Warning Scheme Based on Hydrodynamic Modelling. Water 2019, 11, 1221. [Google Scholar] [CrossRef]
- Psomiadis, E.; Soulis, K.X.; Zoka, M.; Dercas, N. Synergistic Approach of Remote Sensing and GIS Techniques for Flash-Flood Monitoring and Damage Assessment in Thessaly Plain Area, Greece. Water 2019, 11, 448. [Google Scholar] [CrossRef]
- Dottori, F.; Martina, M.L.V.; Figueiredo, R. A methodology for flood susceptibility and vulnerability analysis in complex flood scenarios. J. Flood Risk Manag. 2018, 11, S632–S645. [Google Scholar] [CrossRef]
- Zaharia, L.; Costache, R.; Prăvălie, R.; Ioana-Toroimac, G. Mapping flood and flooding potential indices: A methodological approach to identifying areas susceptible to flood and flooding risk. Case study: The Prahova catchment (Romania). Front. Earth Sci. 2017, 11, 229–247. [Google Scholar] [CrossRef]
- Dou, J.; Yunus, A.P.; Tien Bui, D.; Sahana, M.; Chen, C.W.; Zhu, Z.; Wang, W.; Thai Pham, B. Evaluating GIS-Based Multiple Statistical Models and Data Mining for Earthquake and Rainfall-Induced Landslide Susceptibility Using the LiDAR DEM. Remote Sens. 2019, 11, 638. [Google Scholar] [CrossRef]
- Vojtek, M.; Vojteková, J. Flood Susceptibility Mapping on a National Scale in Slovakia Using the Analytical Hierarchy Process. Water 2019, 11, 364. [Google Scholar] [CrossRef]
- Miller, V.C. A quantitative geomorphic study of drainage basin characteristics in the Clinch Mountain area, Virginia and Tennessee. J. Geology 1953, 389–402. [Google Scholar]
- Panagos, P.; Borrelli, P.; Poesen, J.; Ballabio, C.; Lugato, E.; Meusburger, K.; Montanarella, L.; Alewell, C. The new assessment of soil loss by water erosion in Europe. Environ. Sci. Policy 2015, 54, 438–447. [Google Scholar] [CrossRef]
- Batista, G.; Prati, R.; Monard, M.C. A study of the behavior of several methods for balancing machine learning training data. ACM SIGKDD Explor. Newsl. 2004, 6, 20–29. [Google Scholar] [CrossRef]
- Shirzadi, A.; Shahabi, H.; Chapi, K.; Tien Bui, D.; Pham, B.; Shahedi, K.; Ahmad, B.B. A comparative study between popular statistical and machine learning methods for simulating volume of landslides. Catena 2017, 157, 213–226. [Google Scholar] [CrossRef]
- Cao, C.; Xu, P.; Wang, Y.; Chen, J.; Zheng, L.; Niu, C. Flash Flood Hazard Susceptibility Mapping Using Frequency Ratio and Statistical Index Methods in Coalmine Subsidence Areas. Sustainability 2016, 8, 948. [Google Scholar] [CrossRef]
- Li, X.; Yan, D.; Wang, K.; Weng, B.; Qin, T.; Liu, S. Flood Risk Assessment of Global Watersheds Based on Multiple Machine Learning Models. Water 2019, 11, 1654. [Google Scholar] [CrossRef]
- Mardani, M.; Mardani, H.; De Simone, L.; Varas, S.; Kita, N.; Saito, T. Integration of Machine Learning and Open Access Geospatial Data for Land Cover Mapping. Remote Sens. 2019, 11, 1907. [Google Scholar] [CrossRef]
- He, Q.; Xu, Z.; Li, S.; Li, R.; Zhang, S.; Wang, N.; Pham, B.T.; Chen, W. Novel Entropy and Rotation Forest-Based Credal Decision Tree Classifier for Landslide Susceptibility Modeling. Entropy 2019, 21, 106. [Google Scholar] [CrossRef]
- National Engineering Handbook Hydrology Chapters | NRCS. Available online: https://www.nrcs.usda.gov/wps/portal/nrcs/detailfull/national/water/manage/hydrology/?cid=STELPRDB1043063 (accessed on 8 August 2019).
- Jones, R.J.A.; Hiederer, R.; Rusco, E.; Montanarella, L. Estimating organic carbon in the soils of Europe for policy support. Eur. J. Soil Sci. 2005, 56, 655–671. [Google Scholar] [CrossRef]
- Tóth, B.; Weynants, M.; Nemes, A.; Makó, A.; Bilas, G.; Tóth, G. New generation of hydraulic pedotransfer functions for Europe. Eur. J. Soil Sci. 2015, 66, 226–238. [Google Scholar] [CrossRef]
- Mohsenipour, M.; Shahid, S. Estimation of Saturated Hydraulic Conductivity: A Review; Advances in Engineering Research; Nova Science Publishers Inc.: New York, NY, USA, 2016; Volume 15, Chapter 5; p. 181. [Google Scholar]
- Hansen, M.C.; Potapov, P.V.; Moore, R.; Hancher, M.; Turubanova, S.A.; Tyukavina, A.; Thau, D.; Stehman, S.V.; Goetz, S.J.; Loveland, T.R.; et al. High-Resolution Global Maps of 21st-Century Forest Cover Change. Science 2013, 342, 850–853. [Google Scholar] [CrossRef]
- Diaconu, D.C.; Andronache, I.; Pintilii, R.D.; Brețcan, P.; Simion, A.G.; Drăghici, C.C.; Gruia, K.A.; Grecu, A.; Marin, M.; Peptenatu, D. Using Fractal Fragmentation and Compaction Index in Analysis of the Deforestation Process in Bucegi Mountains Group, Romania. Carpathian J. Earth Environ. Sci. 2019, 14, 431–438. [Google Scholar]
- Pallard, B.; Castellarin, A.; Montanari, A. A look at the links between drainage density and flood statistics. Hydrol. Earth Syst. Sci. 2009, 13, 1019–1029. [Google Scholar] [CrossRef]
- Diaconu, D.C.; Andronache, I.; Ahammer, H.; Ciobotaru, A.M.; Zeleňáková, M.; Dinescu, R.; Pozdnyakov, A.V.; Alekseevna Chupikova, S. Fractal drainage model—A new approach to determinate the complexity of watershed. Acta Montan. Slovaca 2017, 22, 12–21. [Google Scholar]
- Wakeley, J.; Lichvar, R.; Noble, C.; Berkowitz, J. Regional Supplement to the Corps of Engineers Wetland Delineation Manual: Alaska Region (Version 2.0); US Army Corps of Engineers, U.S Army Engineer Research and Development Center: Vicksburg, MI, USA, 2011.
- De Reu, J.; Bourgeois, J.; Bats, M.; Zwertvaegher, A.; Gelorini, V.; De Smedt, P.; Chu, W.; Antrop, M.; De Maeyer, P.; Finke, P.; et al. Application of the topographic position index to heterogeneous landscapes. Geomorphology 2013, 186, 39–49. [Google Scholar] [CrossRef]
- Raduła, M.W.; Szymura, T.H.; Szymura, M. Topographic wetness index explains soil moisture better than bioindication with Ellenberg’s indicator values. Ecol. Indic. 2018, 85, 172–179. [Google Scholar] [CrossRef]
- Panagos, P.; Borrelli, P.; Meusburger, K. A New European Slope Length and Steepness Factor (LS-Factor) for Modeling Soil Erosion by Water. Geosciences 2015, 5, 117–126. [Google Scholar] [CrossRef]
- Yalcin, A.; Reis, S.; Aydinoglu, A.C.; Yomralioglu, T. A GIS-based comparative study of frequency ratio, analytical hierarchy process, bivariate statistics and logistics regression methods for landslide susceptibility mapping in Trabzon, NE Turkey. Catena 2011, 85, 274–287. [Google Scholar] [CrossRef]
- Bonham-Carter, G.F. Geographic Information Systems for Geoscientists: Modelling with GIS; Elsevier: Pergamon, Turkey, 1994; ISBN 978-1-4831-4494-8. [Google Scholar]
- Althuwaynee, O.F.; Pradhan, B.; Park, H.J.; Lee, J.H. A novel ensemble bivariate statistical evidential belief function with knowledge-based analytical hierarchy process and multivariate statistical logistic regression for landslide susceptibility mapping. Catena 2014, 114, 21–36. [Google Scholar] [CrossRef]
- Peponi, A.; Morgado, P.; Trindade, J. Combining Artificial Neural Networks and GIS Fundamentals for Coastal Erosion Prediction Modeling. Sustainability 2019, 11, 975. [Google Scholar] [CrossRef]
- Shiruru, K. An Introduction to Artificial Neural Network. Int. J. Adv. Res. Innov. Ideas Educ. 2016, 1, 27–30. [Google Scholar]
- Taravat, A.; Rajaei, M.; Emadodin, I.; Hasheminejad, H.; Mousavian, R.; Biniyaz, E. A Spaceborne Multisensory, Multitemporal Approach to Monitor Water Level and Storage Variations of Lakes. Water 2016, 8, 478. [Google Scholar] [CrossRef]
- Sánchez-Reolid, R.; García, A.S.; Vicente-Querol, M.A.; Fernández-Aguilar, L.; López, M.T.; Fernández-Caballero, A.; González, P. Artificial Neural Networks to Assess Emotional States from Brain-Computer Interface. Electronics 2018, 7, 384. [Google Scholar] [CrossRef]
- Wu, Q.; Lee, C.M. A Modified Leakage Localization Method Using Multilayer Perceptron Neural Networks in a Pressurized Gas Pipe. Appl. Sci. 2019, 9, 1954. [Google Scholar] [CrossRef]
- Deep Learning Multilayer Perceptron (MLP) for Flood Prediction Model Using Wireless Sensor Network Based Hydrology Time Series Data Mining—IEEE Conference Publication. Available online: https://ieeexplore.ieee.org/document/8319150 (accessed on 15 August 2019).
- Costache, R.; Tien Bui, D. Spatial prediction of flood potential using new ensembles of bivariate statistics and artificial intelligence: A case study at the Putna river catchment of Romania. Sci. Total Environ. 2019, 691, 1098–1118. [Google Scholar] [CrossRef] [PubMed]
- Castro, W.; Oblitas, J.; Santa-Cruz, R.; Avila-George, H. Multilayer perceptron architecture optimization using parallel computing techniques. PLoS ONE 2017, 12, e0189369. [Google Scholar] [CrossRef]
- Naganna, S.R.; Deka, P.C.; Ghorbani, M.A.; Biazar, S.M.; Al-Ansari, N.; Yaseen, Z.M. Dew Point Temperature Estimation: Application of Artificial Intelligence Model Integrated with Nature-Inspired Optimization Algorithms. Water 2019, 11, 742. [Google Scholar] [CrossRef]
- Allawi, M.F.; Binti Othman, F.; Afan, H.A.; Ahmed, A.N.; Hossain, M.S.; Fai, C.M.; El-Shafie, A. Reservoir Evaporation Prediction Modeling Based on Artificial Intelligence Methods. Water 2019, 11, 1226. [Google Scholar] [CrossRef]
- Improving Generalization of Artificial Neural Networks in Rainfall–Runoff Modelling/Amélioration de la Généralisation de Réseaux de Neurones Artificiels Pour la Modélisation Pluie-Débit: Hydrological Sciences Journal. Available online: https://www.tandfonline.com/doi/abs/10.1623/hysj.50.3.439.65025 (accessed on 18 September 2019).
- Gnana Sheela, K.; Deepa, S.N. Neural network based hybrid computing model for wind speed prediction. Neurocomputing 2013, 122, 425–429. [Google Scholar] [CrossRef]
- Rojas, R. Neural Networks: A Systematic Introduction; Springer: Berlin, Germany, 1996; ISBN 978-3-540-60505-8. [Google Scholar]
- Yang, S.; Berdine, G. The receiver operating characteristic (ROC) curve. Southwest Respir. Crit. Care Chron. 2017, 5, 34–36. [Google Scholar] [CrossRef]
- Advances in Pan-European Flood Hazard Mapping—Alfieri—2014—Hydrological Processes—Wiley Online Library. Available online: https://onlinelibrary.wiley.com/doi/abs/10.1002/hyp.9947 (accessed on 21 September 2019).
- Feyen, L.; Dankers, R.; Bódis, K.; Salamon, P.; Barredo, J. Fluvial flood risk in Europe in present and future climates. Clim. Chang. 2012, 112, 47–62. [Google Scholar] [CrossRef]
- Veijalainen, N. Estimation of Climate Change Impacts on Hydrology and Floods in Finland; Aalto University: Helsinki, Finland, 2012; ISBN 978-952-60-4614-3. [Google Scholar]
- Westerhoff, R.S.; Kleuskens, M.P.H.; Winsemius, H.C.; Huizinga, H.J.; Brakenridge, G.R.; Bishop, C. Automated global water mapping based on wide-swath orbital synthetic-aperture radar. Hydrol. Earth Syst. Sci. 2013, 17, 651–663. [Google Scholar] [CrossRef]
- Dobbin, K.K.; Simon, R.M. Optimally splitting cases for training and testing high dimensional classifiers. BMC Med. Genom. 2011, 4, 31. [Google Scholar] [CrossRef]
- Costache, R.; Zaharia, L. Flash-flood potential assessment and mapping by integrating the weights-of-evidence and frequency ratio statistical methods in GIS environment—Case study: Bâsca Chiojdului River catchment (Romania). J. Earth Syst. Sci. 2017, 126, 59. [Google Scholar] [CrossRef]
- Martins, B.; Nunes, A.; Lourenço, L.; Velez-Castro, F. Flash Flood Risk Perception by the Population of Mindelo, S. Vicente (Cape Verde). Water 2019, 11, 1895. [Google Scholar] [CrossRef]
- Silva, P.R.B.; Makara, C.N.; Munaro, A.; Schnitzler, D.; Diaconu, D.C.; Sandu, I.; Poleto, C. Risks associated of the waters from hydric systems Urban’s: The case of the rio Barigui, south of Brazil. Rev. Chim. 2017, 68, 1834–1842. [Google Scholar]
- Zeleňáková, M.; Gaňová, L.; Purcz, P.; Horský, M.; Satrapa, L.; Blišťan, P.; Diaconu, D.C. Mitigation of the Adverse Consequences of Floods for Human Life, Infrastructure, and the Environment. Nat. Hazards Rev. 2017, 18, 05017002. [Google Scholar] [CrossRef]


| River | Area (km2) | Length (km) | Altitude (m) | Slope Mean (°) | Circularity Ratio | ||
|---|---|---|---|---|---|---|---|
| Min | Mean | Max | |||||
| Buzău | 5264 | 302 | 8 | 516 | 1250 | 4 | 0.24 |
| Bâsca Roziliei | 783 | 76 | 395 | 1110 | 1510 | 15 | 0.28 |
| Slănic | 425 | 73 | 120 | 580 | 1240 | 15 | 0.20 |
| Bâsca Chiojdului | 340 | 92 | 239 | 668 | 1340 | 26 | 0.46 |
| Câlnău | 208 | 57 | 85 | 336 | 700 | 11 | 0.29 |
| Sărățel | 187 | 32 | 141 | 444 | 900 | 24 | 0.65 |
| Flood Variable | Variable Classes | No. of Flood Points | % of Flood Points | Class Area | % of Class Area | Ratio (+) | Prediction Ratio (PR) |
|---|---|---|---|---|---|---|---|
| Slope | 25–55 | 1 | 0.59% | 201,873 | 3.39% | 0.17 | 5.84 |
| 15–25 | 15 | 8.92% | 1,093,638 | 18.39% | 0.48 | ||
| 5–15 | 29 | 17.26% | 2,282,994 | 38.40% | 0.44 | ||
| 0–50 | 123 | 73.21% | 2,366,736 | 39.80% | 1.83 | ||
| Elevation | 1019–1925 | 25 | 14.88% | 989,283 | 16.63% | 0.89 | 1.08 |
| 628–1019 | 26 | 15.47% | 1,235,414 | 20.77% | 0.74 | ||
| 255–628 | 51 | 30.35% | 1,567,088 | 26.35% | 1.51 | ||
| 1.2–255 | 66 | 39.28% | 2,153,456 | 36.22% | 1.08 | ||
| HSG | A | 30 | 17.85% | 1,289,141 | 21.68% | 0.82 | 1 |
| B | 32 | 19.04% | 1,071,383 | 18.02% | 1.05 | ||
| C | 99 | 58.92% | 3,242,969 | 54.54% | 1.08 | ||
| D | 7 | 4.16% | 341,748 | 5.74% | 0.72 | ||
| Slope aspect | North, northeast | 15 | 8.92% | 832,635 | 14% | 0.63 | 2.15 |
| Northwest, east | 18 | 10.71% | 698,426 | 16.28% | 1.05 | ||
| Flat | 89 | 52.97% | 2,065,777 | 34.74% | 1.52 | ||
| West, southeast | 19 | 11.30% | 1,103,674 | 18.56% | 0.60 | ||
| South, southwest | 27 | 16.07% | 974,729 | 16.39% | 0.98 | ||
| EaC | > 4 | 75 | 44.64% | 4,967,941 | 83.56% | 0.53 | 3.82 |
| 2.5–4 | 18 | 10.17% | 268,371 | 4.51% | 2.37 | ||
| 1–2.5 | 26 | 15.47% | 306,406 | 5.15% | 3 | ||
| 0–1 | 49 | 29.16% | 402,520 | 6.77% | 4.30 | ||
| DfR | 0–50 | 74 | 46.42% | 526,807 | 8.86% | 5.23 | 6.26 |
| 50–150 | 53 | 31.54% | 870,457 | 16.64% | 2.15 | ||
| 150–300 | 30 | 17.85% | 1,094,315 | 18.40% | 0.97 | ||
| 300–450 | 7 | 4.16% | 816,602 | 13.73% | 0.30 | ||
| 450–600 | 4 | 2.38% | 632,703 | 10.64% | 0.22 | ||
| 600–750 | - | - | 426,549 | 7.17% | - | ||
| 750–900 | - | - | 312,704 | 5.25% | - | ||
| >900 | - | - | 1,265,104 | 21.27% | - | ||
| SHC | 56–1283 | 8 | 4.76% | 352,086 | 5.92% | 0.80 | 1.41 |
| 1283–1949 | 52 | 30.95% | 2,377,777 | 39.99% | 0.77 | ||
| 1949–2668 | 40 | 23.80% | 1,376,679 | 23.15% | 1.02 | ||
| 2668–3386 | 68 | 40.47% | 1,838,699 | 30.92% | 1.30 | ||
| Land use | Broad-leaved forest, coniferous forest, mixed forest | 39 | 23.21% | 2,421,990 | 40.73% | 0.56 | 3.94 |
| Scrub and/or herbaceous vegetation | 14 | 8.33% | 281,100 | 4.72% | 1.76 | ||
| Agricultural areas, moors and heathland, arable land | 43 | 25.59% | 1,983,856 | 33.36% | 0.76 | ||
| Pastures, natural grassland, open spaces with little or no vegetation | 34 | 20.23% | 889,830 | 14.96% | 1.35 | ||
| Built-up areas | 38 | 22.61% | 368,465 | 6.19% | 3.64 | ||
| DD | 0–4.7 | 94 | 55.95% | 3,831,521 | 64.44% | 0.88 | 2.86 |
| 4.7–9.7 | 71 | 42.26% | 1,888,411 | 31.76% | 1.33 | ||
| 9.7–17 | 2 | 1.19% | 155,026 | 2.60% | 0.45 | ||
| 17–27 | 1 | 0.59% | 70,283 | 1.18% | 0.50 | ||
| PLC | (−4.03)–(−0.22) | 7 | 4.16% | 319,196 | 5.36% | 0.77 | 4.16 |
| (−0.22)–0.07 | 120 | 71.42% | 3,776,549 | 63.52% | 1.12 | ||
| 0.07–0.37 | 41 | 24.40% | 1,614,633 | 27.15% | 0.89 | ||
| 0.37–4.48 | - | - | 234,863 | 3.95% | - | ||
| TPI | (−122.8)–(−18.5) | 73 | 43.45% | 968,840 | 16.26% | 2.66 | 5.87 |
| (−18.5)–9.5 | 82 | 48.80% | 3,607,795 | 60.68% | 0.80 | ||
| 9.5–36.6 | 7 | 4.16% | 963,889 | 16.21% | 0.25 | ||
| 36.6–153.8 | 6 | 3.57% | 404,717 | 6.80% | 0.52 | ||
| TWI | (−0.36)–3.2 | 25 | 14.88% | 2,226,337 | 37.44% | 0.39 | 5.59 |
| 3.2–5.4 | 74 | 44.04% | 2,652,037 | 44.60% | 0.98 | ||
| 5.4–9.1 | 45 | 26.78% | 882,423 | 14.84% | 1.80 | ||
| 9.1–19.8 | 24 | 14.28% | 184,444 | 3.10% | 4.60 | ||
| MaP | 460–600 | 18 | 10.71% | 1,166,213 | 19.61% | 0.54 | 2.25 |
| 600–750 | 59 | 35.11% | 1,523,307 | 25.62% | 1.37 | ||
| 750–900 | 56 | 33.33% | 1,627,725 | 27.37% | 1.21 | ||
| 900–1050 | 33 | 19.64% | 1,460,019 | 24.55% | 0.79 | ||
| 1050–1162 | 2 | 1.19% | 167,977 | 2.82% | 0.42 | ||
| CI | (−100)–(−32) | 7 | 4.16% | 452,756 | 7.61% | 0.54 | 3.93 |
| (−32)–(−6.2) | 106 | 63.09% | 4,231,277 | 71.17% | 0.88 | ||
| (−6.2)–20.3 | 35 | 20.83% | 981,656 | 16.51% | 1.26 | ||
| 20.3–100 | 20 | 11.90% | 279,552 | 4.70% | 2.53 |
| Flood Variable | Variable Classes | No. of Torrential Points | % of Torrential Points | Class Area | % of Class Area | Ratio (+) | Prediction Ratio (PR) |
|---|---|---|---|---|---|---|---|
| Slope | 0–5 | 19 | 11.04% | 2,366,736 | 39.80% | 0.27 | 5.10 |
| 5–15 | 25 | 14.53% | 2,282,994 | 38.40% | 0.37 | ||
| 15–25 | 51 | 17.26% | 1,093,637 | 18.39% | 1.61 | ||
| 25–55 | 77 | 73.21% | 201,873 | 3.39% | 13.18 | ||
| PC | 0.08–3.73 | 39 | 22.67% | 970,991 | 16.33% | 1.38 | 1 |
| 0.05–0.08 | 44 | 25.58% | 1,803,190 | 30.32% | 0.84 | ||
| (−0.04)–0.05 | 39 | 22.67% | 1,939,676 | 32.62% | 0.69 | ||
| (–3.15)–(–0.04) | 50 | 29.06% | 1,231,384 | 20.71% | 1.40 | ||
| HSG | A | 14 | 8.13% | 1,289,141 | 21.68% | 0.37 | 1.79 |
| B | 49 | 28.48% | 1,071,383 | 18.02% | 1.58 | ||
| C | 98 | 56.97% | 3,242,969 | 54.54% | 1.04 | ||
| D | 11 | 6.39% | 341,748 | 5.74% | 1.12 | ||
| Slope aspect | North, northeast | 33 | 19.18% | 832,635 | 14% | 1.36 | 1.56 |
| Northwest, east | 50 | 29.06% | 698,426 | 16.28% | 1.78 | ||
| Flat | 17 | 9.88% | 2,065,777 | 34.74% | 0.28 | ||
| West, southeast | 47 | 27.32% | 1,103,674 | 18.56% | 1.47 | ||
| South, southwest | 27 | 15.69% | 974,729 | 16.39% | 0.95 | ||
| L-S | 0.03–1.78 | 21 | 12.20% | 2,668,191 | 44.87% | 0.27 | 4.19 |
| 1.78–4.93 | 37 | 21.51% | 2,150,823 | 36.17% | 0.59 | ||
| 4.93–11.2 | 100 | 58.13% | 1,076,945 | 18.14% | 3.20 | ||
| >11.2 | 14 | 8.13% | 49,282 | 0.82% | 9.81 | ||
| CN | 31–49 | 3 | 1.74% | 29,892 | 0.50% | 3.46 | 2.34 |
| 49–69 | 65 | 37.79% | 1,033,834 | 17.38% | 2.17 | ||
| 69–83 | 18 | 10.46% | 797,020 | 13.40% | 0.78 | ||
| 83–98 | 86 | 50% | 4,084,495 | 68.70% | 0.72 | ||
| CI | (–100)–(–32) | 8 | 4.65% | 452,756 | 7.61% | 0.61 | 1.85 |
| (–32)–(–6.2) | 146 | 84.88% | 4,231,277 | 71.17% | 1.19 | ||
| (–6.2)–20.3 | 15 | 8.72% | 981,656 | 16.51% | 0.52 | ||
| 20.3–100 | 3 | 1.74% | 279,552 | 4.70% | 0.37 | ||
| Land use | Broad-leaved forest, coniferous forest, mixed forest | 79 | 45.93% | 2,421,990 | 40.73% | 1.12 | 3.39 |
| Scrub and/or herbaceous vegetation | 39 | 22.67% | 281,100 | 4.72% | 4.49 | ||
| Agricultural areas, moors and heathland, arable land | 24 | 13.95% | 1,983,856 | 33.36% | 0.41 | ||
| Pastures, natural grassland, open spaces with little or no vegetation | 23 | 13.37% | 889,830 | 14.96% | 0.89 | ||
| Built-up areas | 7 | 4.06% | 368,465 | 6.19% | 0.65 | ||
| SEW | 0.0006–2.5 | 109 | 63.37% | 2,771,623 | 46.61% | 1.35 | 4.23 |
| 2.5–7.7 | 22 | 12.79% | 2,004,066 | 33.70% | 0.37 | ||
| 7.7–14.5 | 11 | 6.37% | 763,903 | 12.84% | 0.49 | ||
| 14.5–26.5 | 13 | 7.55% | 341,928 | 5.75% | 1.31 | ||
| 26.5–132.5 | 17 | 9.88% | 63,721 | 1.07% | 9.22 | ||
| DD | 0–4.7 | 116 | 67.44% | 3,831,521 | 64.44% | 1.04 | 1.83 |
| 4.7–9.7 | 54 | 31.39% | 1,888,411 | 31.76% | 0.98 | ||
| 9.7–17 | 1 | 0.58% | 155,026 | 2.60% | 0.22 | ||
| 17–27 | 1 | 0.58% | 70,283 | 1.18% | 0.49 | ||
| TPI | (–122.8)–(–18.5) | 20 | 11.62% | 968,840 | 16.26% | 0.71 | 2.93 |
| (–18.5)–9.5 | 81 | 47.09% | 3,607,795 | 60.68% | 0.77 | ||
| 9.5–36.6 | 28 | 16.27% | 963,889 | 16.21% | 1 | ||
| 36.6–153.8 | 43 | 25% | 404,717 | 6.80% | 3.67 | ||
| TWI | (–0.36)–3.2 | 120 | 69.76% | 2,226,337 | 37.44% | 1.86 | 3.32 |
| 3.2–5.4 | 37 | 21.51% | 2,652,037 | 44.60% | 0.48 | ||
| 5.4–9.1 | 14 | 8.13% | 882,423 | 14.84% | 0.54 | ||
| 9.1–19.8 | 1 | 0.58% | 184,444 | 3.10% | 0.18 | ||
| MaP | 460–600 | 10 | 5.81% | 1,166,213 | 19.61% | 0.29 | 2.96 |
| 600–750 | 19 | 11.04% | 1,523,307 | 25.62% | 0.43 | ||
| 750–900 | 51 | 29.65% | 1,627,725 | 27.37% | 1.08 | ||
| 900–1050 | 73 | 42.44% | 1,460,019 | 24.55% | 1.72 | ||
| 1050–1162 | 19 | 11.04% | 167,977 | 2.82% | 3.90 |
© 2019 by the authors. Licensee MDPI, Basel, Switzerland. This article is an open access article distributed under the terms and conditions of the Creative Commons Attribution (CC BY) license (http://creativecommons.org/licenses/by/4.0/).
Share and Cite
Popa, M.C.; Peptenatu, D.; Drăghici, C.C.; Diaconu, D.C. Flood Hazard Mapping Using the Flood and Flash-Flood Potential Index in the Buzău River Catchment, Romania. Water 2019, 11, 2116. https://doi.org/10.3390/w11102116
Popa MC, Peptenatu D, Drăghici CC, Diaconu DC. Flood Hazard Mapping Using the Flood and Flash-Flood Potential Index in the Buzău River Catchment, Romania. Water. 2019; 11(10):2116. https://doi.org/10.3390/w11102116
Chicago/Turabian StylePopa, Mihnea Cristian, Daniel Peptenatu, Cristian Constantin Drăghici, and Daniel Constantin Diaconu. 2019. "Flood Hazard Mapping Using the Flood and Flash-Flood Potential Index in the Buzău River Catchment, Romania" Water 11, no. 10: 2116. https://doi.org/10.3390/w11102116
APA StylePopa, M. C., Peptenatu, D., Drăghici, C. C., & Diaconu, D. C. (2019). Flood Hazard Mapping Using the Flood and Flash-Flood Potential Index in the Buzău River Catchment, Romania. Water, 11(10), 2116. https://doi.org/10.3390/w11102116