Article

Inter-Seasonal Precipitation Variability over Southern China Associated with Commingling Effect of Indian Ocean Dipole and El Niño

1
State Key Laboratory of Water Resources and Hydropower Engineering Science, Wuhan University, Wuhan 430072, China
2
Department of Safety and Disaster Prevention Research, Seoul Institute of Technology, Seoul 03909, Korea
*
Authors to whom correspondence should be addressed.
Water 2019, 11(10), 2023; https://doi.org/10.3390/w11102023
Submission received: 8 August 2019 / Revised: 24 September 2019 / Accepted: 26 September 2019 / Published: 28 September 2019

Abstract

:
This study analyzed temporal and regional responses of precipitation to the Indian Ocean Dipole (IOD) over southern China and the differences between IOD-only and El Niño–southern oscillation–IOD cases. The Mann–Kendall test and intentionally biased bootstrapping were used. The results revealed three main phases (development and peak, decay, and aftermath) of percentage changes in seasonal total rainfall and showed the most positive sensitivity to positive IOD events in southern China. Moreover, El Niño played an essential role in intensifying the positive response to positive IOD events in the first and second phases while contributing little to the third. In terms of precipitation variability (frequency, intensity, and magnitude), seasonal maximum 1-day precipitation and maximum number of consecutive dry days were more sensitive to positive IOD events than the maximum number of consecutive wet days and simple daily precipitation intensity index. This study enhances knowledge of the temporal and spatial sensitivity of precipitation features to positive IOD events over southern China.

1. Introduction

The Indian Ocean Dipole (IOD) is an important indicator of the coupled ocean–atmosphere phenomenon in the Indian Ocean [1,2,3]. With a western center in the Arabian Sea and a pole in the eastern Indian Ocean, IOD events exert enormous impacts on global climate, particularly precipitation variability [4,5,6,7]. Research on the latent correlation between the IOD and rainfall anomalies has been widely conducted [7,8,9], and the possible mechanism leading to this relationship has been investigated [9,10].
Specifically, IOD events are divided into two types based on differences in sea surface temperature (SST) over the Indian Ocean. A positive event is defined as an event during which warmer SSTs occur in the western Indian Ocean than in the east, and a negative event involves warmer SSTs being succeeded by cooler SSTs in the west [2]. Hence, different IOD events have different effects on regional temperature and precipitation. Cai et al. [11] found that the frequency of positive IOD events has increased, whereas negative IOD events have decreased. During positive IOD events, Europe, northeast Asia, North and South America, and southern Africa experience decreased rainfall [7]. Saji et al. [2] further pointed out that droughts in the Indonesian region and floods in east Africa are caused by positive IOD events but that the opposite occurs during negative IOD events. Guan and Yamagata [12] indicated that circulation anomalies over east Asia weaken southerly monsoonal winds and cause water vapor divergence, resulting in severe droughts during positive IOD events. Similar investigations into the impacts of IOD events in east Africa and Australia have been conducted [4,5,11].
To improve understanding of the influences of IOD events on precipitation features over China, recent studies have demonstrated that positive and negative IOD events have asymmetric influences, with positive IOD events imposing far stronger climatic effects than negative ones [11,13,14]. Therefore, interest in the influence of positive IOD events on precipitation over China has increased significantly. Summer rainfall has different patterns during different IOD events, which are caused by variations in Asian summer monsoon circulations and the South Asian High [15]. Thus, summer precipitation anomalies have been widely investigated [16,17,18]. Positive IOD events have recently induced below-normal rainfall in northern China, but rainfall has been higher than usual in southern China (SC) during summer [16]. In addition, Liu et al. [17] showed that this above-normal summer rainfall is concentrated in Hunan province during positive IOD events. Yan and Zhang [18] indicated that IOD events significantly impact the intensity of the Asian summer monsoon, with more precipitation occurring in eastern and southern China in summer.
Winter precipitation anomalies can cause severe droughts and floods because of low temperatures, and Zhang et al. [14] showed that winter rainfall has increased in some areas, including southwest, north, and northeast China, whereas precipitation has decreased in the Yangtze and Huaihe River Basins during positive IOD events. Likewise, the role of IOD events in spring and autumn rainfall trends in China has been studied [13,19,20].
Furthermore, numerous studies have focused on the latent correlation between the IOD and El Niño–Southern Oscillation (ENSO) and their effects on regional climate [8,9,11,21,22]. These studies highlighted the coexistence of positive and negative IOD events and El Niño and La Niña, respectively, although the IOD is an internally coupled air–sea mode over the Indian Ocean and does not always coincide with ENSO [23,24]. During simultaneous ENSO and IOD events, the development of positive IOD events is facilitated by El Niño in that the possibility of easterly summer winds off Sumatra is enhanced [25]. In addition to the influence of the ENSO on the IOD, IOD events can also affect the ENSO, e.g., extreme IOD events can significantly enhance El Niño [21]. Izumo et al. [26] indicated that negative and positive IOD events precede El Niño and La Niña 14 months before their respective peaks. IOD events can, therefore, be useful indicators for predicting ENSO events.
Consequently, the ENSO–IOD interaction has synchronous or separate impacts on precipitation. After analyzing the correlation between the ENSO, IOD, and seasonal rainfall in the Yangtze River Basin, China, Xiao et al. [27] identified the ENSO as the driving force of precipitation variability in all seasons, and the IOD was found to influence rainfall in summer, autumn, and winter. Pui et al. [28] obtained comparable results with the support of data on the ENSO and IOD, which suggested that the ENSO has a dominant impact on rainfall anomalies over eastern Australia during winter and spring.
Previous studies have selected typical IOD years and IOD–ENSO combination years using methods with specific thresholds, such as the dipole mode index (DMI), proposed by Saji et al. [2], with one standard deviation. Regardless, knowledge of the influence of IOD events on rainfall variations with SST changes under these thresholds remain limited. Until recently, most studies have focused on seasonal or annual total precipitation rather than on other precipitation features, such as maximum 1-day precipitation and maximum number of consecutive dry and wet days, which are widely applied to quantify heavy rainfall. Changes in the frequency, intensity, and magnitude of precipitation play crucial roles in determining the impacts of extreme climatic events [29,30,31]. Additionally, many previous studies have focused on the influences of positive IOD events on summer total precipitation [16,17,18], whereas comparatively little attention has been paid to rainfall anomalies in other seasons.
Therefore, in this study, the correlation between positive IOD events and the climate of SC was established by using the intentionally biased bootstrapping (IBB) method instead of extracting separate IOD years. The main objectives of this study were (1) to find out how seasonal precipitation responds to positive IOD events; (2) to explore changes in the intensity, frequency, and magnitude of precipitation during positive IOD events; and (3) to consider the differences between IOD-only and IOD–ENSO cases.

2. Data and Methods

2.1. IOD and ENSO Data

According to the definition of DMI, namely the difference between the mean SST anomalies in the western pole (10°S–10°N, 50°–70°E) and eastern pole (10°S–0, 90°–110°E), we directly used the monthly anomalous DMI calculated by the Asia-Pacific Economic Cooperation (APEC) climate center to identify positive IOD events. The Niño3.4 index, calculated as area-averaged SST anomalies in the Niño3.4 region (5°S–5°N, 170°–120°W), from the National Oceanic and Atmospheric Administration (NOAA) using the Hadley Centre sea ice and sea surface temperature dataset (HadISST1) was also used to identify El Niño years. These data covered the period from 1961 to 2017. We further applied a three-month running average August–September–October (ASO) DMI with +1 SD (SD denotes standard deviation) to distinguish positive and negative IOD events, as they are the most powerful in boreal autumn but weakest in boreal spring [10,13]. Referring to Trenberth [32], we extracted El Niño years for this study.

2.2. Precipitation Data

Daily precipitation data from across China for 1961–2017 were collected from the Chinese National Meteorological Center. Surface stations with observation errors, missing data, and other problems were removed from the rainfall dataset. Finally, 264 meteorological stations in China were selected to detect precipitation sensitivity to IOD events. For the quantification of seasonal and heavy rainfall, we used typical precipitation indices [33,34]. To identify the frequency, intensity, and magnitude of rainfall, the following indices were used: seasonal total precipitation on wet days (PRCPTOT; ≥1.0 mm), maximum 1-day precipitation (Rx1day), simple daily precipitation index (SDII; defined as PRCPTOT divided by the sum of wet days), maximum number of consecutive dry days (CDD; <1.0 mm), and maximum number of consecutive wet days (CWD).
In this study, daily precipitation data were transformed into moving three-month data from ASO, September–October–November (SON), October–November–December (OND), November–December–January (NDJ), December–January–February (DJF), January–February–March (JFM), February–March–April (FMA), and March–April–May (MAM) and covered autumn, winter, and spring in the ensuing years for the identification of intra-seasonal rainfall variability.

2.3. Study Area

Since SC is especially sensitive to IOD events, it was identified as the best study area for the purposes of this study [17,18]. Data from meteorological stations in the Yangtze River, Southeast, and Pearl River Basins were used (Figure 1).

2.4. Trend Detection

Although parametric tests are more appropriate than nonparametric tests for hydrometeorological data that do not comply with normality requirements, the Mann–Kendall (MK) test is widely used to detect trends in climate data time sequences [35,36]. The null hypothesis indicates that no trend is detected in the time series, whereas the alternative hypothesis indicates a trend that exists under a given significance level. The statistic S in the MK test was calculated as follows:
S   =   i = 1 n 1 j = i + 1 n s g n ( X j X i )
where n is the length of the dataset,
s g n ( θ )   =   { 1   i f   θ   >   0 0   i f   θ   =   0 1   i f   θ   <   0
and
E ( S ) =   0
V ( S ) =   n ( n 1 ) ( 2 n + 5 ) m = 1 n t m m ( m 1 ) ( 2 m + 5 ) 18
where tm measures the count of ties of extent m. The statistic Z was calculated using Equation (5):
Z   =   { S 1 V ( S ) S   >   0 0 S   =   0 S + 1 V ( S ) S   <   0

2.5. IBB Simulation

As a type of statistical resampling technique, the IBB method, introduced by Hall and Presnell [37], has widely been used to address the problem of changing some values without altering others [37,38]. Given that there is high uncertainty in climate variables, including temperature and precipitation, we adapted the IBB method to provide information for the assessment of the response variable by deliberately changing the mean value of the explanatory variable from the normal to a certain level [39]. As a result, the IBB approach can effectively identify the correlation between the explanatory and response variables. The IBB method is briefly described below.
Among an n number of xi (i = 1, 2, 3, …, n), observation events were resampled after changing the mean of the original data by ∆µ. Using different weights Si,n in Equation (6), each value had a different chance to be chosen:
S i , n   =   i / n
Thus, the assigned weight Si,n represents the possibility of observed data being selected in the IBB process. The mean of the simulated data ( μ ˜ ) was acquired via Equation (7):
μ ˜   =   1 Ψ i = 1 n S i , n x ( i )
where x(i) is the ith increasing ordered value and Ψ   =   i = 1 n S i , n . The average amount of increase or decrease, δ μ , was calculated via Equation (8):
δ μ   =   μ ˜ μ ^   =   1 Ψ i = 1 n S i , n x ( i ) 1 n i = 1 n x i
After adding the weight order (r) to Equation (7), Equation (9) was used to obtain different values of μ ˜ ( r ) :
μ ˜ ( r ) =   1 Ψ r i = 1 n S i , n r x ( i )
where Ψ r   =   i = 1 n S i , n r . The difference δ μ ( r ) was derived as follows:
δ μ ( r ) =   μ ˜ ( r ) μ ^ =   1 Ψ r j = 1 n S j , n r x ( j ) 1 n j = 1 n x j
If the average value of increase or decrease is given to Δ μ , the weight order “r” can be estimated accordingly. In this study, the Self-Organizing Migrating Algorithm [40] was used to select the weight order “r” with the objective function to minimize ( Δ μ δ μ ( r ) ) 2 . The IBB technique was employed to simulate datasets based on historical statistics to assess the impacts of IOD events on total precipitation and rainfall frequency, intensity, and magnitude over SC. Likewise, after omitting El Niño years from the original dataset, we analyzed the different influences of IOD-only and IOD–ENSO combined events. The dataset was resampled after changing the mean of the original data through IBB simulations, with DMI + 1 SD (0.410) for the IOD-ENSO combined case and DMI + 1 SD (0.363) for the IOD-only case, except for El Nino years and departure from the long-term average (1961–2017), respectively.

3. Analysis Results

3.1. Trends in Seasonal Precipitation in SC

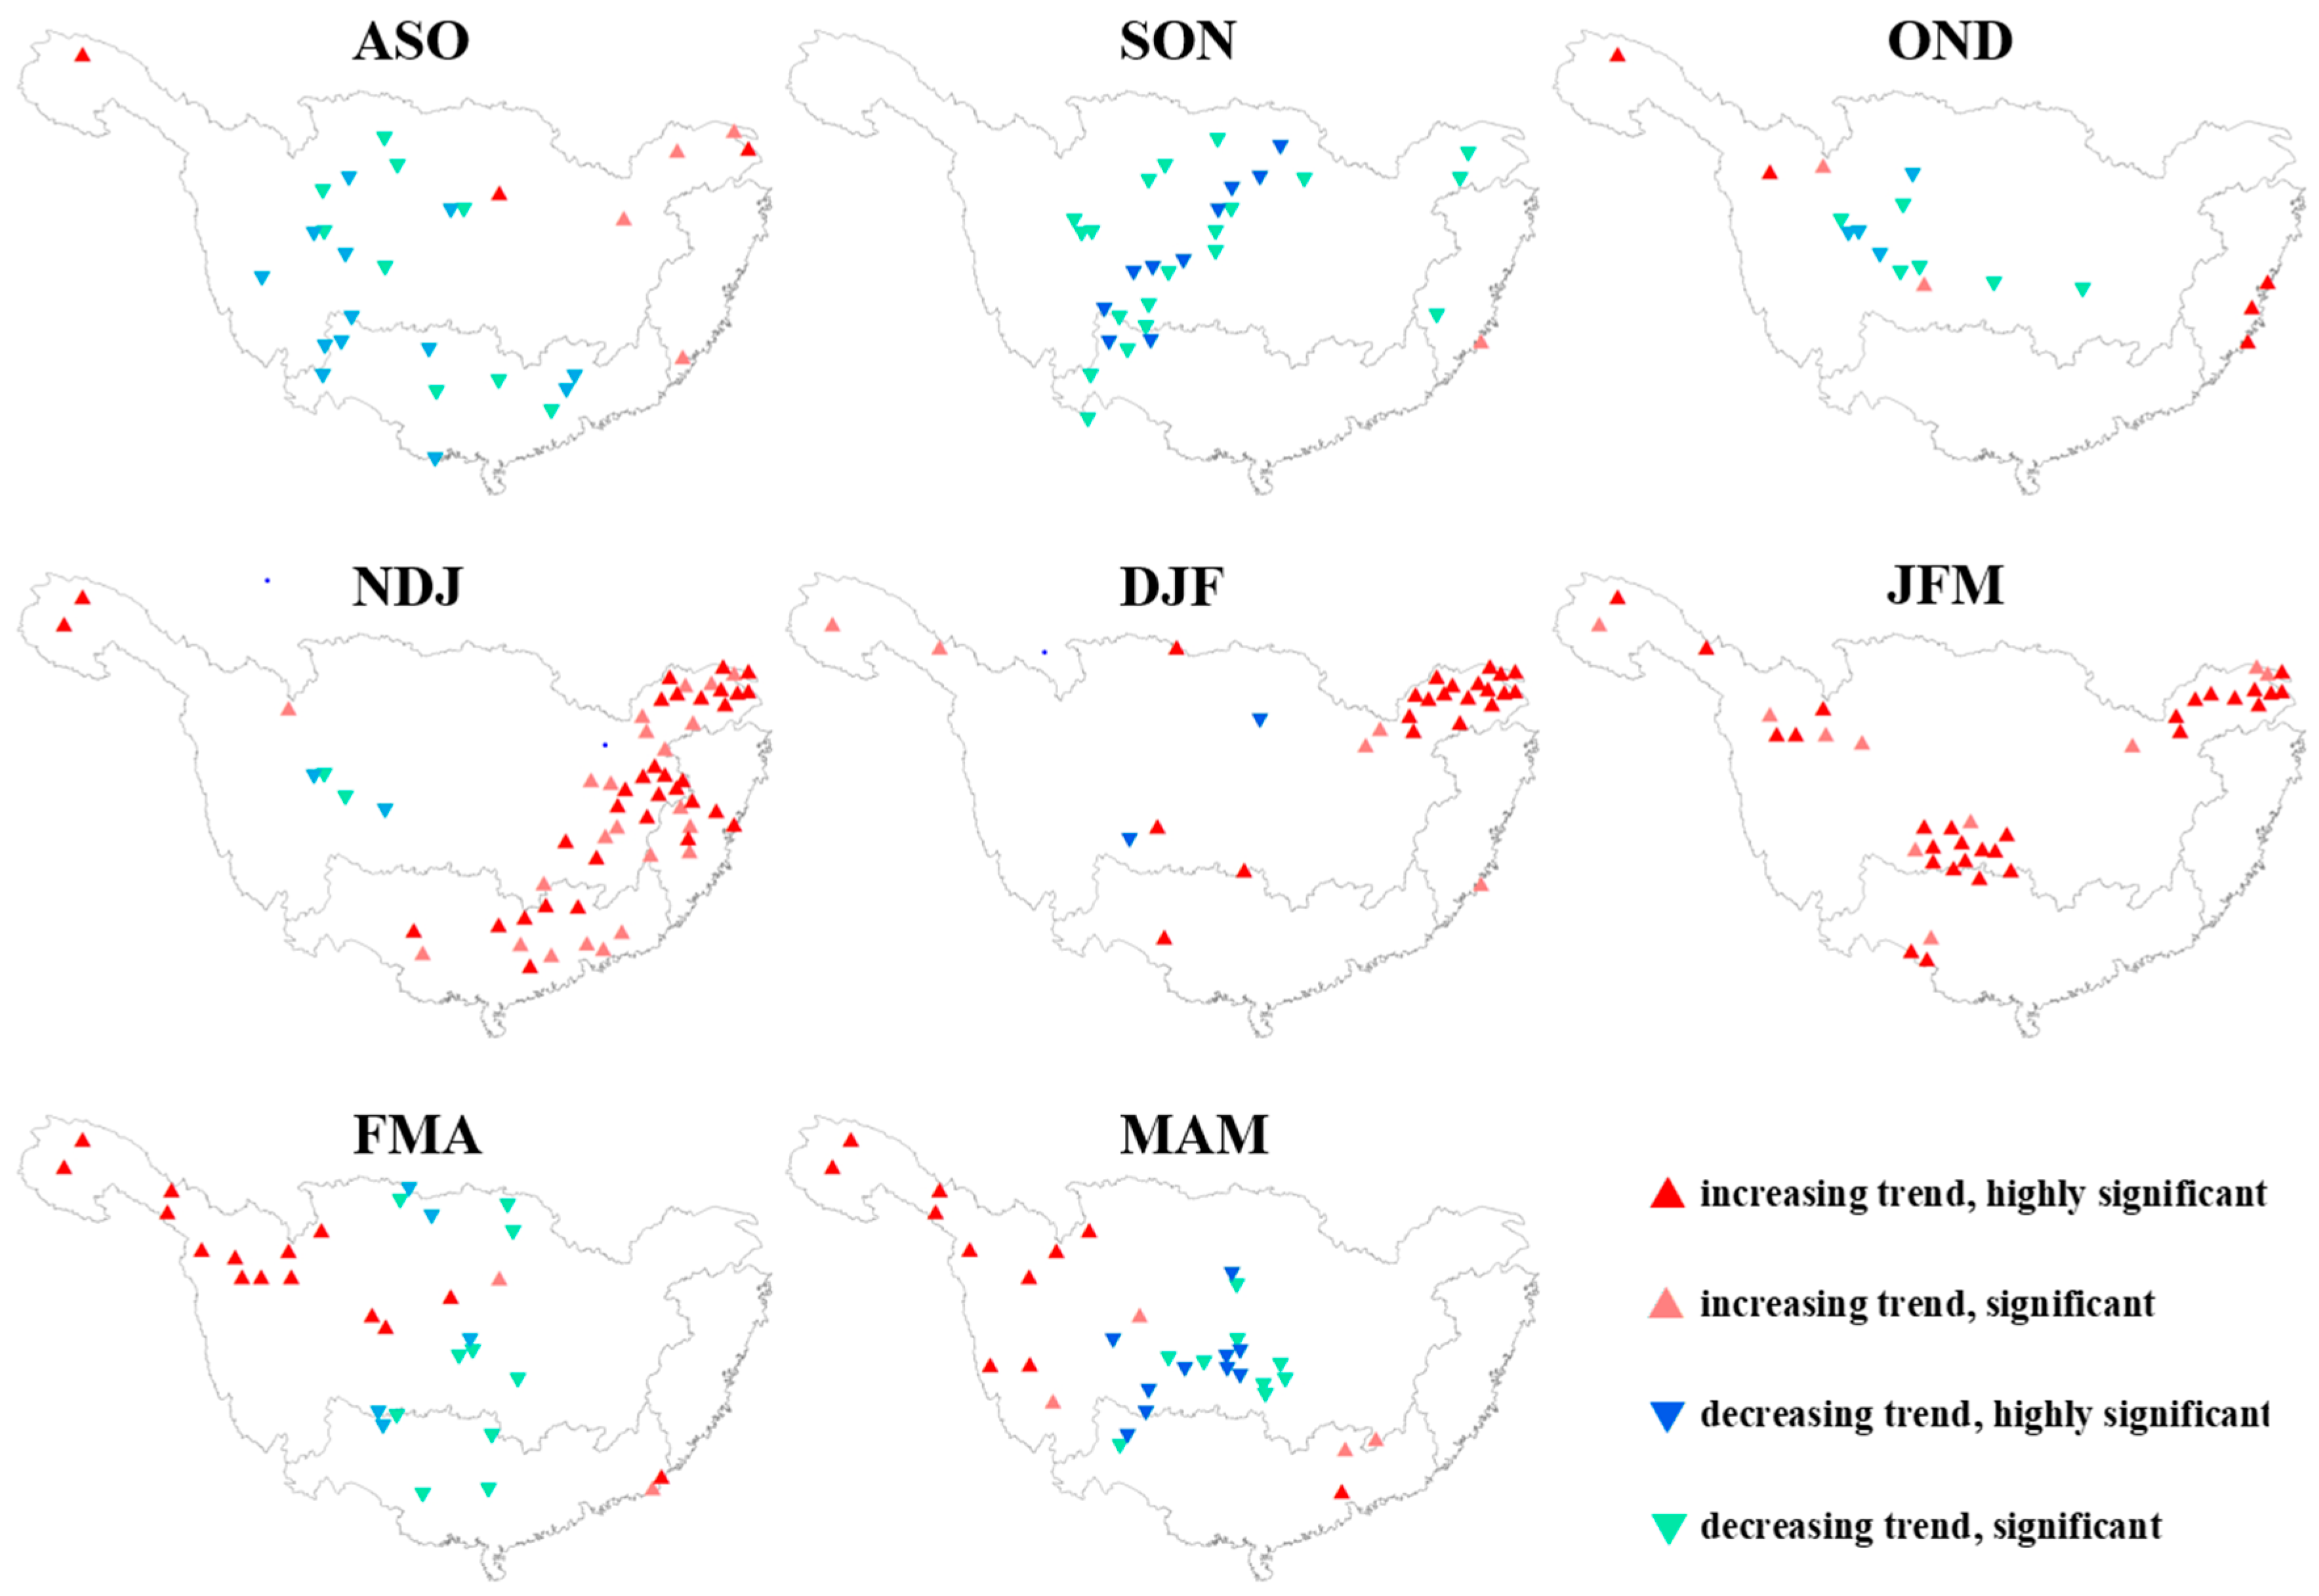
Figure 2 displays the long-term trend in running three-month total precipitation from 1960 to 2017 over SC. The trends detected from ASO to MAM showed a distinct distribution pattern of trend anomalies. ASO, SON, and OND showed statistically significant decreasing trends in the upper and middle reaches of the Yangtze River. However, the lower reaches of the Yangtze River, Pearl River, and Southeast Basins experienced a significant increase in precipitation during NDJ, whereas only some stations in the middle reaches of the Yangtze River showed decreasing trends.
After NDJ, gradually increasing trends were observed in the three main areas, namely the upper reaches of the Yangtze River (area A), the area between the middle reaches of the Yangtze River and the Pearl River Basin (area B), and the area near the Yangtze Estuary (area C). During FMA and MAM, area B was dominated by decreasing trends and significant signals disappeared in area C.

3.2. Inter-Seasonal Rainfall Variability Associated with IOD

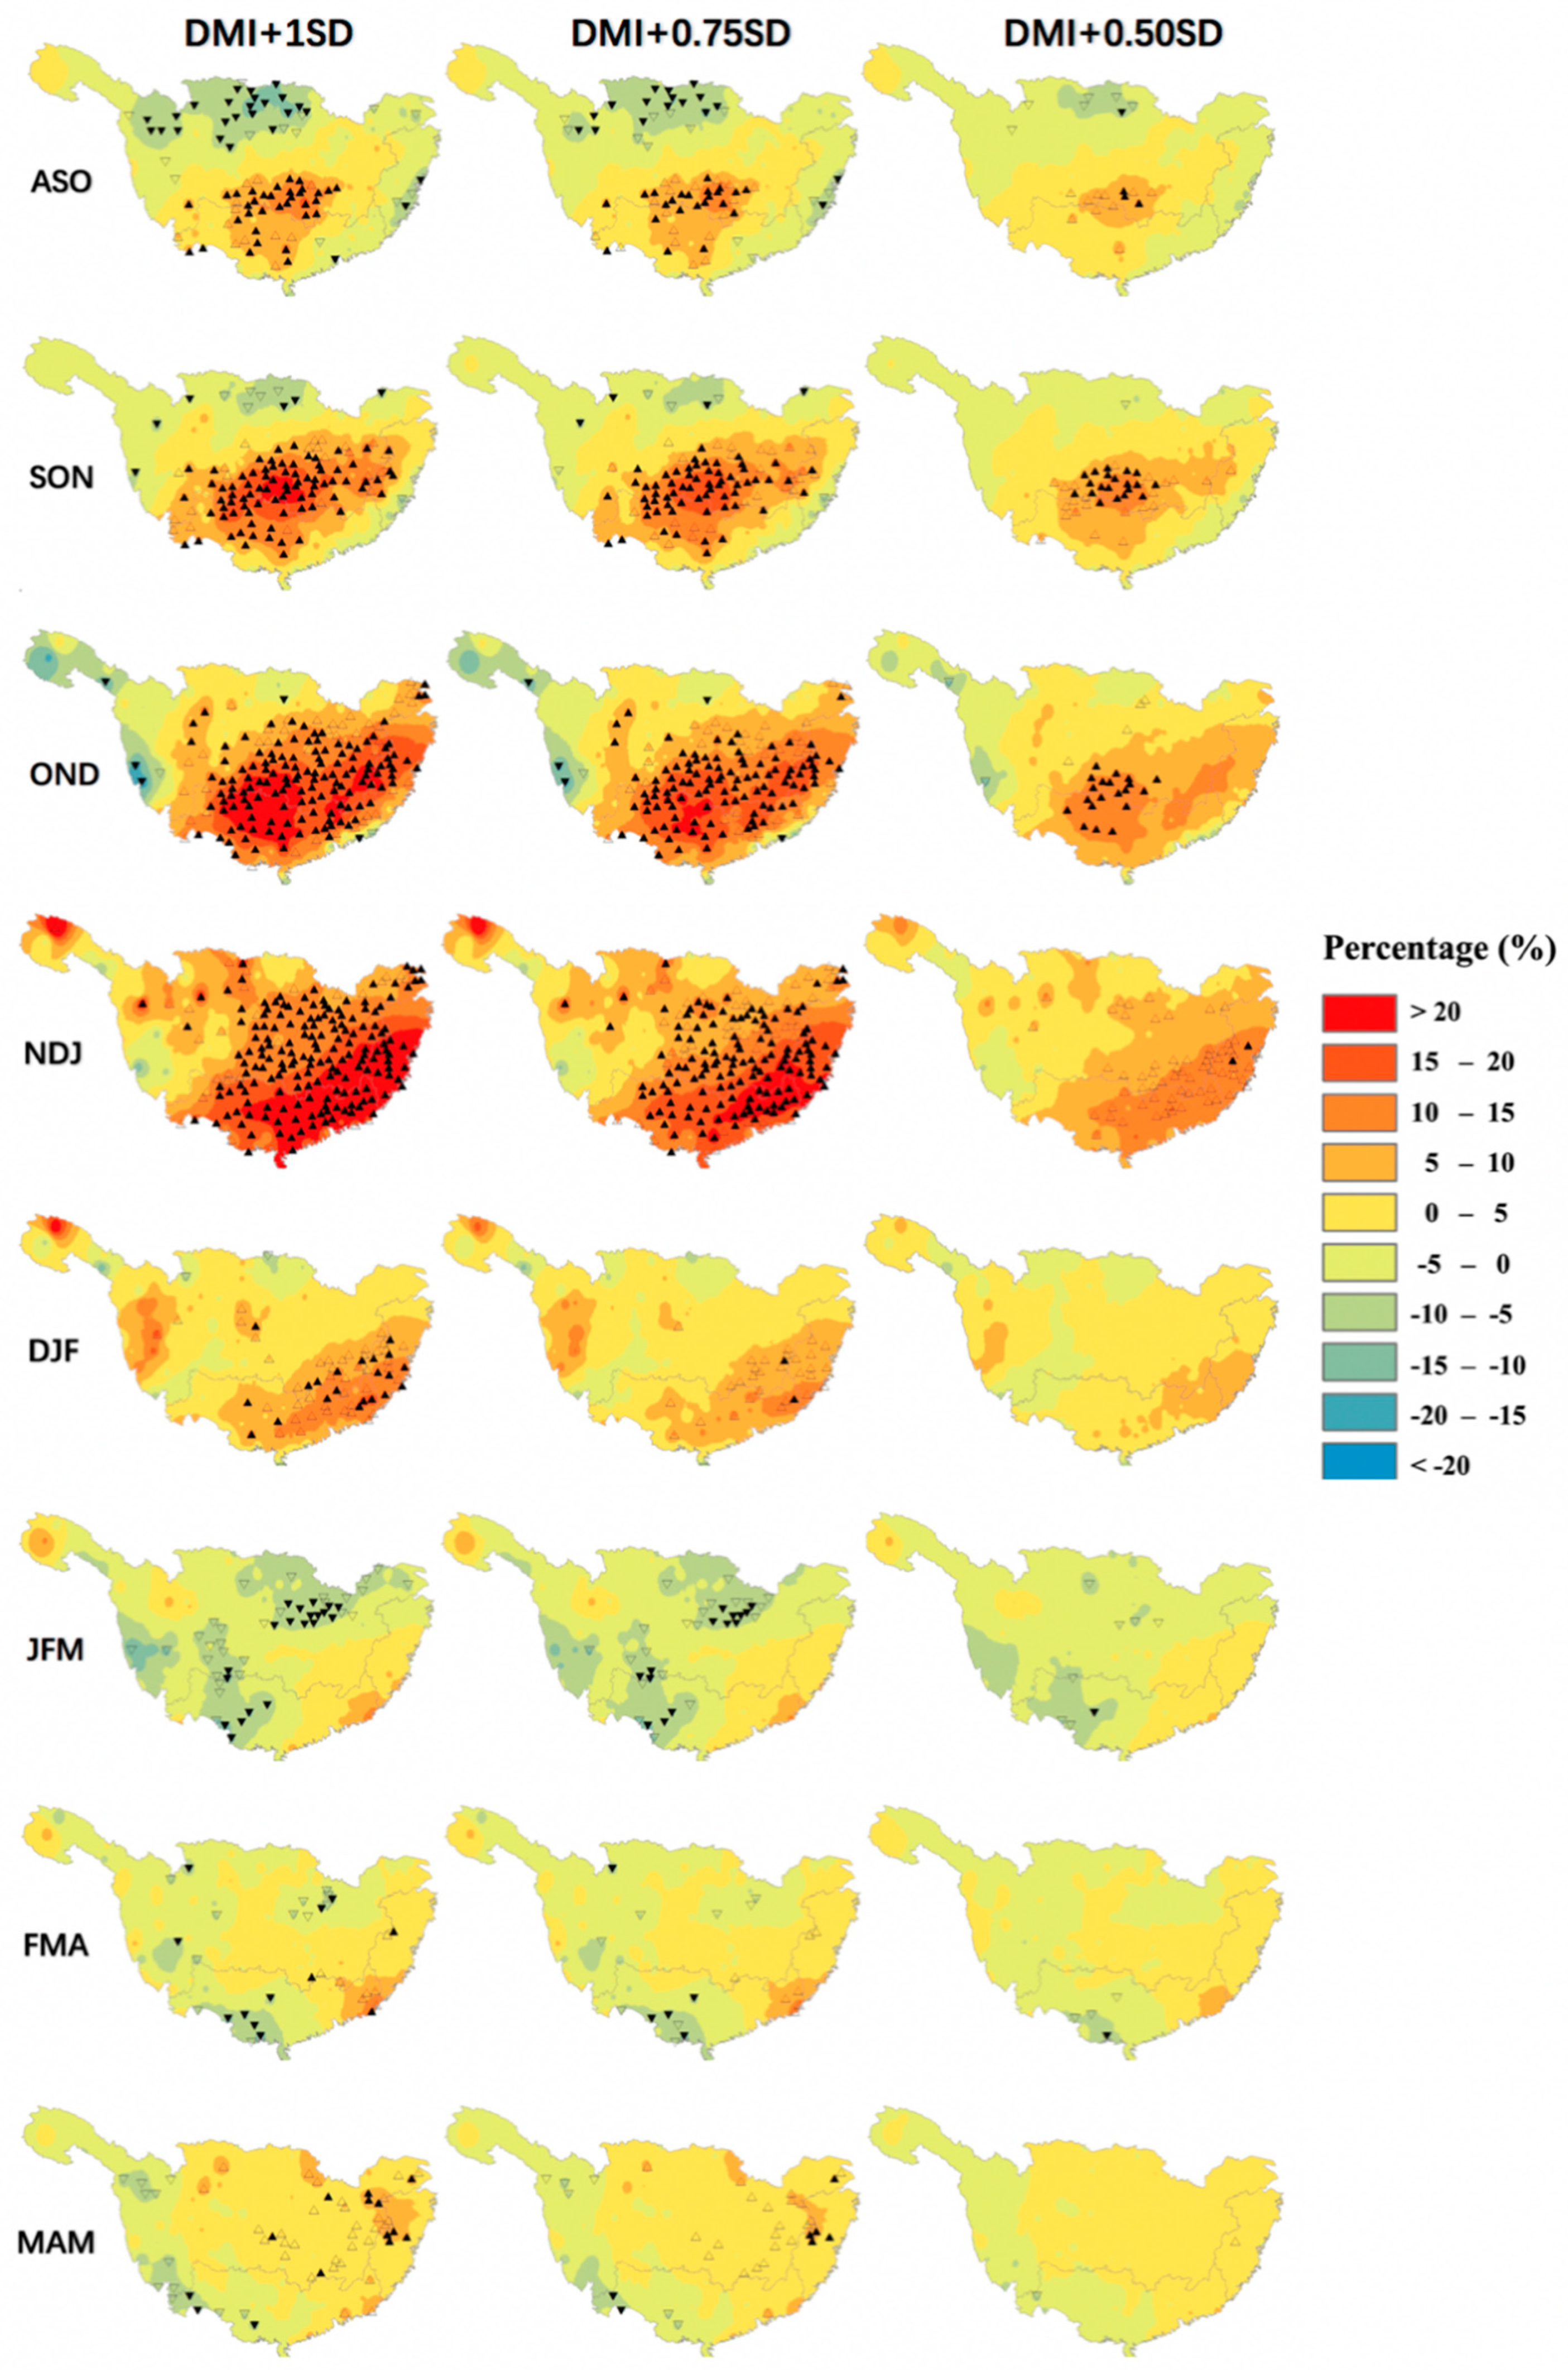
Figure 3 illustrates the spatial and temporal variations in seasonal rainfall using the PRCPTOT index. The main features of the distribution of rainfall anomalies were successfully captured by the IBB simulation. In the DMI + 1 SD case, which intentionally increased the value of the DMI by +1 SD, SC experienced changes from ASO to MAM. The time series of these changes were divided into three main phases: (1) the development and peak phase (mostly from ASO to NDJ), (2) the decay phase (mainly from DJF to JFM), and (3) the aftermath phase (mostly from FMA to MAM) according to the extent of the influence of the positive IOD events on precipitation. The development and peak phase was the stage from the development of a positive response to its peak. The decay phase was the stage in which the positive response weakened and the negative response started to dominate. The aftermath phase was the stage during which the positive response dominated again.
During ASO—the peak of positive IOD events—northern SC, including the northern Yangtze River Basin, experienced decreasing percentage changes, indicating that this area was negatively sensitive to positive IOD events. However, south of the Yangtze and of the Pearl River Basins were positively sensitive. From ASO to NDJ (autumn to winter), the number of stations that observed increasing changes grew substantially, whereas those that measured decreasing changes shrank. Stations measuring significant increases in seasonal precipitation peaked in NDJ, when almost the entire study area was positively sensitive, except for some stations in western SC.
After NDJ, the central SC region (CSC) first began to return to normal. The positively sensitive regions rapidly became negatively sensitive in JFM before the ensuing spring. During spring, positive IOD events influenced the study area, but this influence was weaker than that during other seasons. The positive response to the positive IOD events dominated SC again in the aftermath phase. Most of the study area exhibited positive sensitivity, and significant increases occurred in CSC and eastern SC, whereas western SC experienced substantial decreases in the PRCPTOT index.
The IBB simulation often revealed temporal sensitivity towards positive IOD events throughout SC. The percentage changes were much more powerful in autumn and winter than in spring, especially from ASO to NDJ. NDJ was the peak season during which the impacts of positive IOD events on the study area were strongest. Notably, CSC was the most positively sensitive area towards positive IOD events. In the case of DMI + 0.5 SD, CSC responded first and significant increases spread from CSC to adjacent regions with intensifying magnitude of DMI anomalies. Nevertheless, the number of stations showing negative sensitivity to positive IOD events was lower than that of those showing positive sensitivity. Therefore, no districts were identified for negative sensitivity in SC.

3.3. Commingling Effect of IOD and ENSO on Seasonal Precipitation

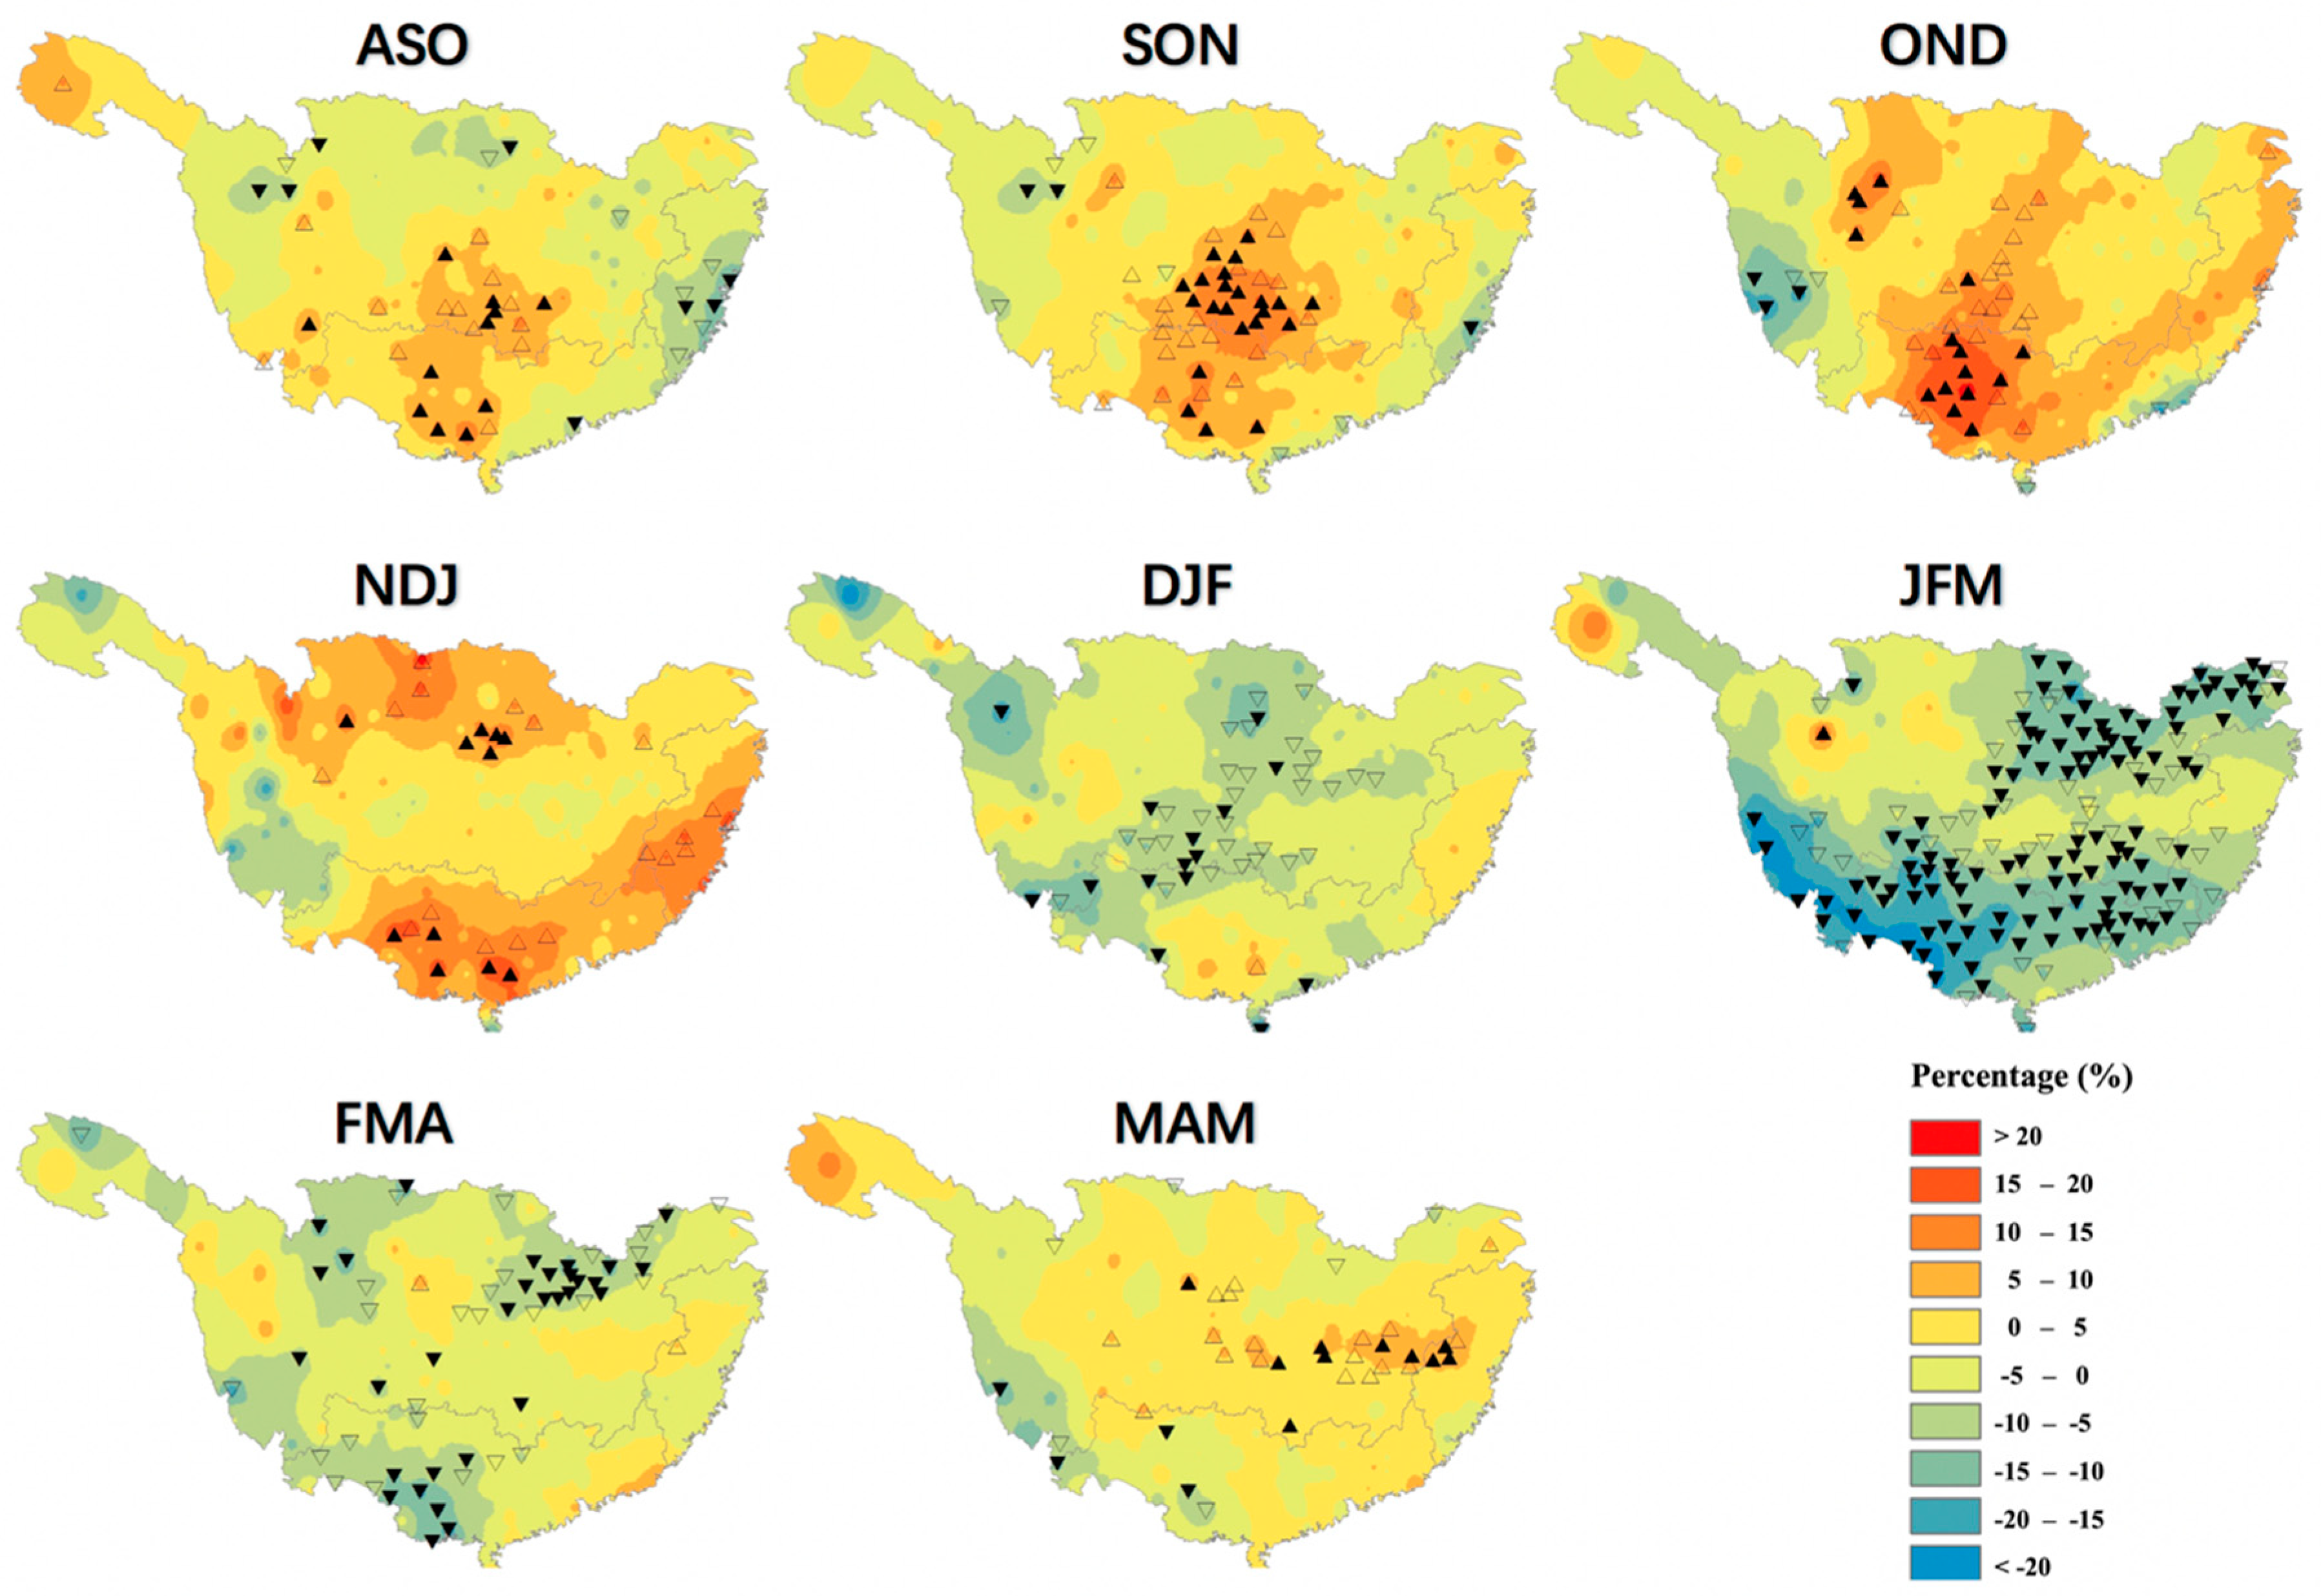
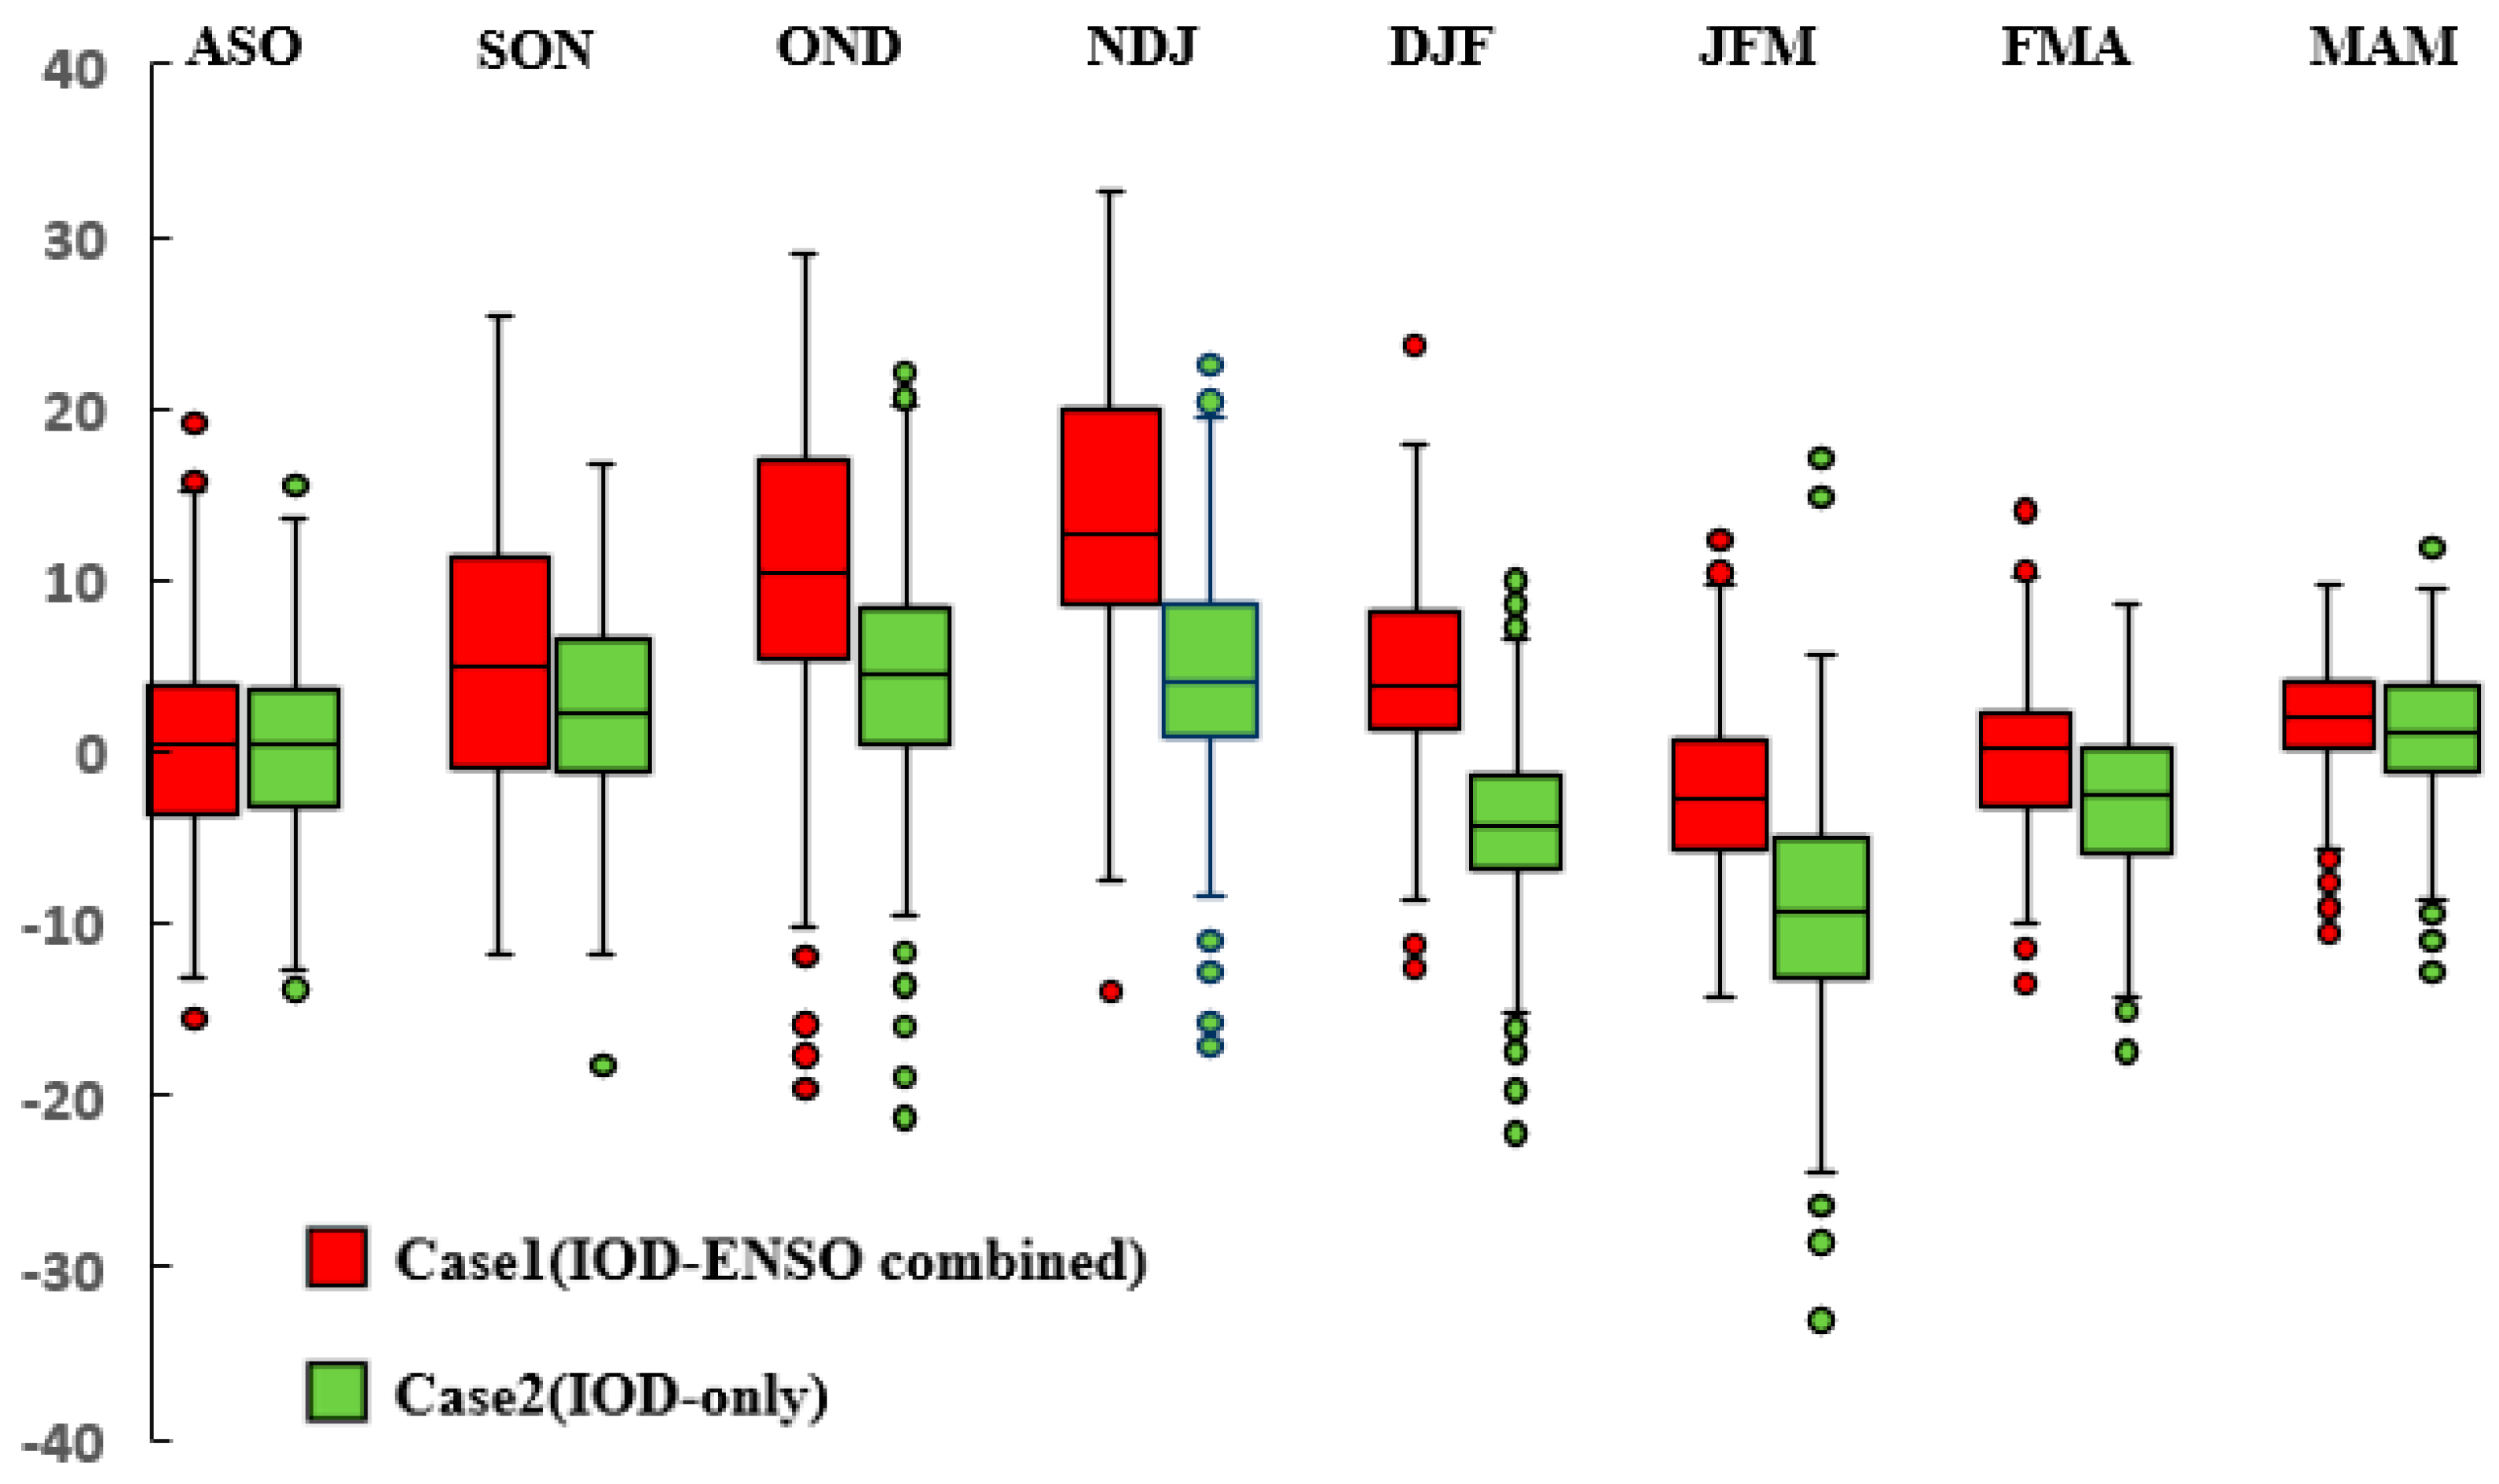
After removing select El Niño years (1963, 1965, 1968, 1969, 1972, 1976, 1977, 1982, 1986, 1987, 1991, 1994, 1997, 2002, 2004, 2006, 2009, 2014, and 2015), we determined the differences in seasonal precipitation between the effects of IOD-only and ENSO–IOD combined events in SC (Figure 4). Compared with positive IOD events, El Niño was the driving force in changing the precipitation features and even reversed the impacts of positive IOD events, mainly in the development and peak as well as decay phases (Figure 3 and Figure 4). Specifically, El Niño strengthened the positive response in SC. During the development and peak phase, the number of significant signals in the IOD-only case was notably less than that in the ENSO–IOD case (Figure 5). Hence, El Niño influenced the augmentation of the response number and the enhancement of the response intensity. In particular, CSC, the most sensitive region with positive sensitivity in the ENSO–IOD case, displayed only slight (no significant) percentage changes. Therefore, the peak phase was not significant in the IOD-only case.
During the decay phase, El Niño played an important role in prolonging the influences of the development and peak stage and in shortening the decay phase. During DJF, most of the study area still had a positive response, with many significant changes in the coastal area in the ENSO–IOD case, whereas the opposite was true in the IOD-only case. There were many significant decreases in CSC in the IOD-only case, which indicated that the transformation from the peak phase of the positive response to the decay phase proceeded without the ENSO.
The decay phase in the IOD-only case was prolonged from two months to three months. Specifically, FMA was included in the decay phase instead of in the aftermath phase because many stations still displayed negative sensitivity during FMA. Remarkably, the negative response was significantly improved during JFM in the IOD-only case. The influences of El Niño were negligible in the aftermath phase.
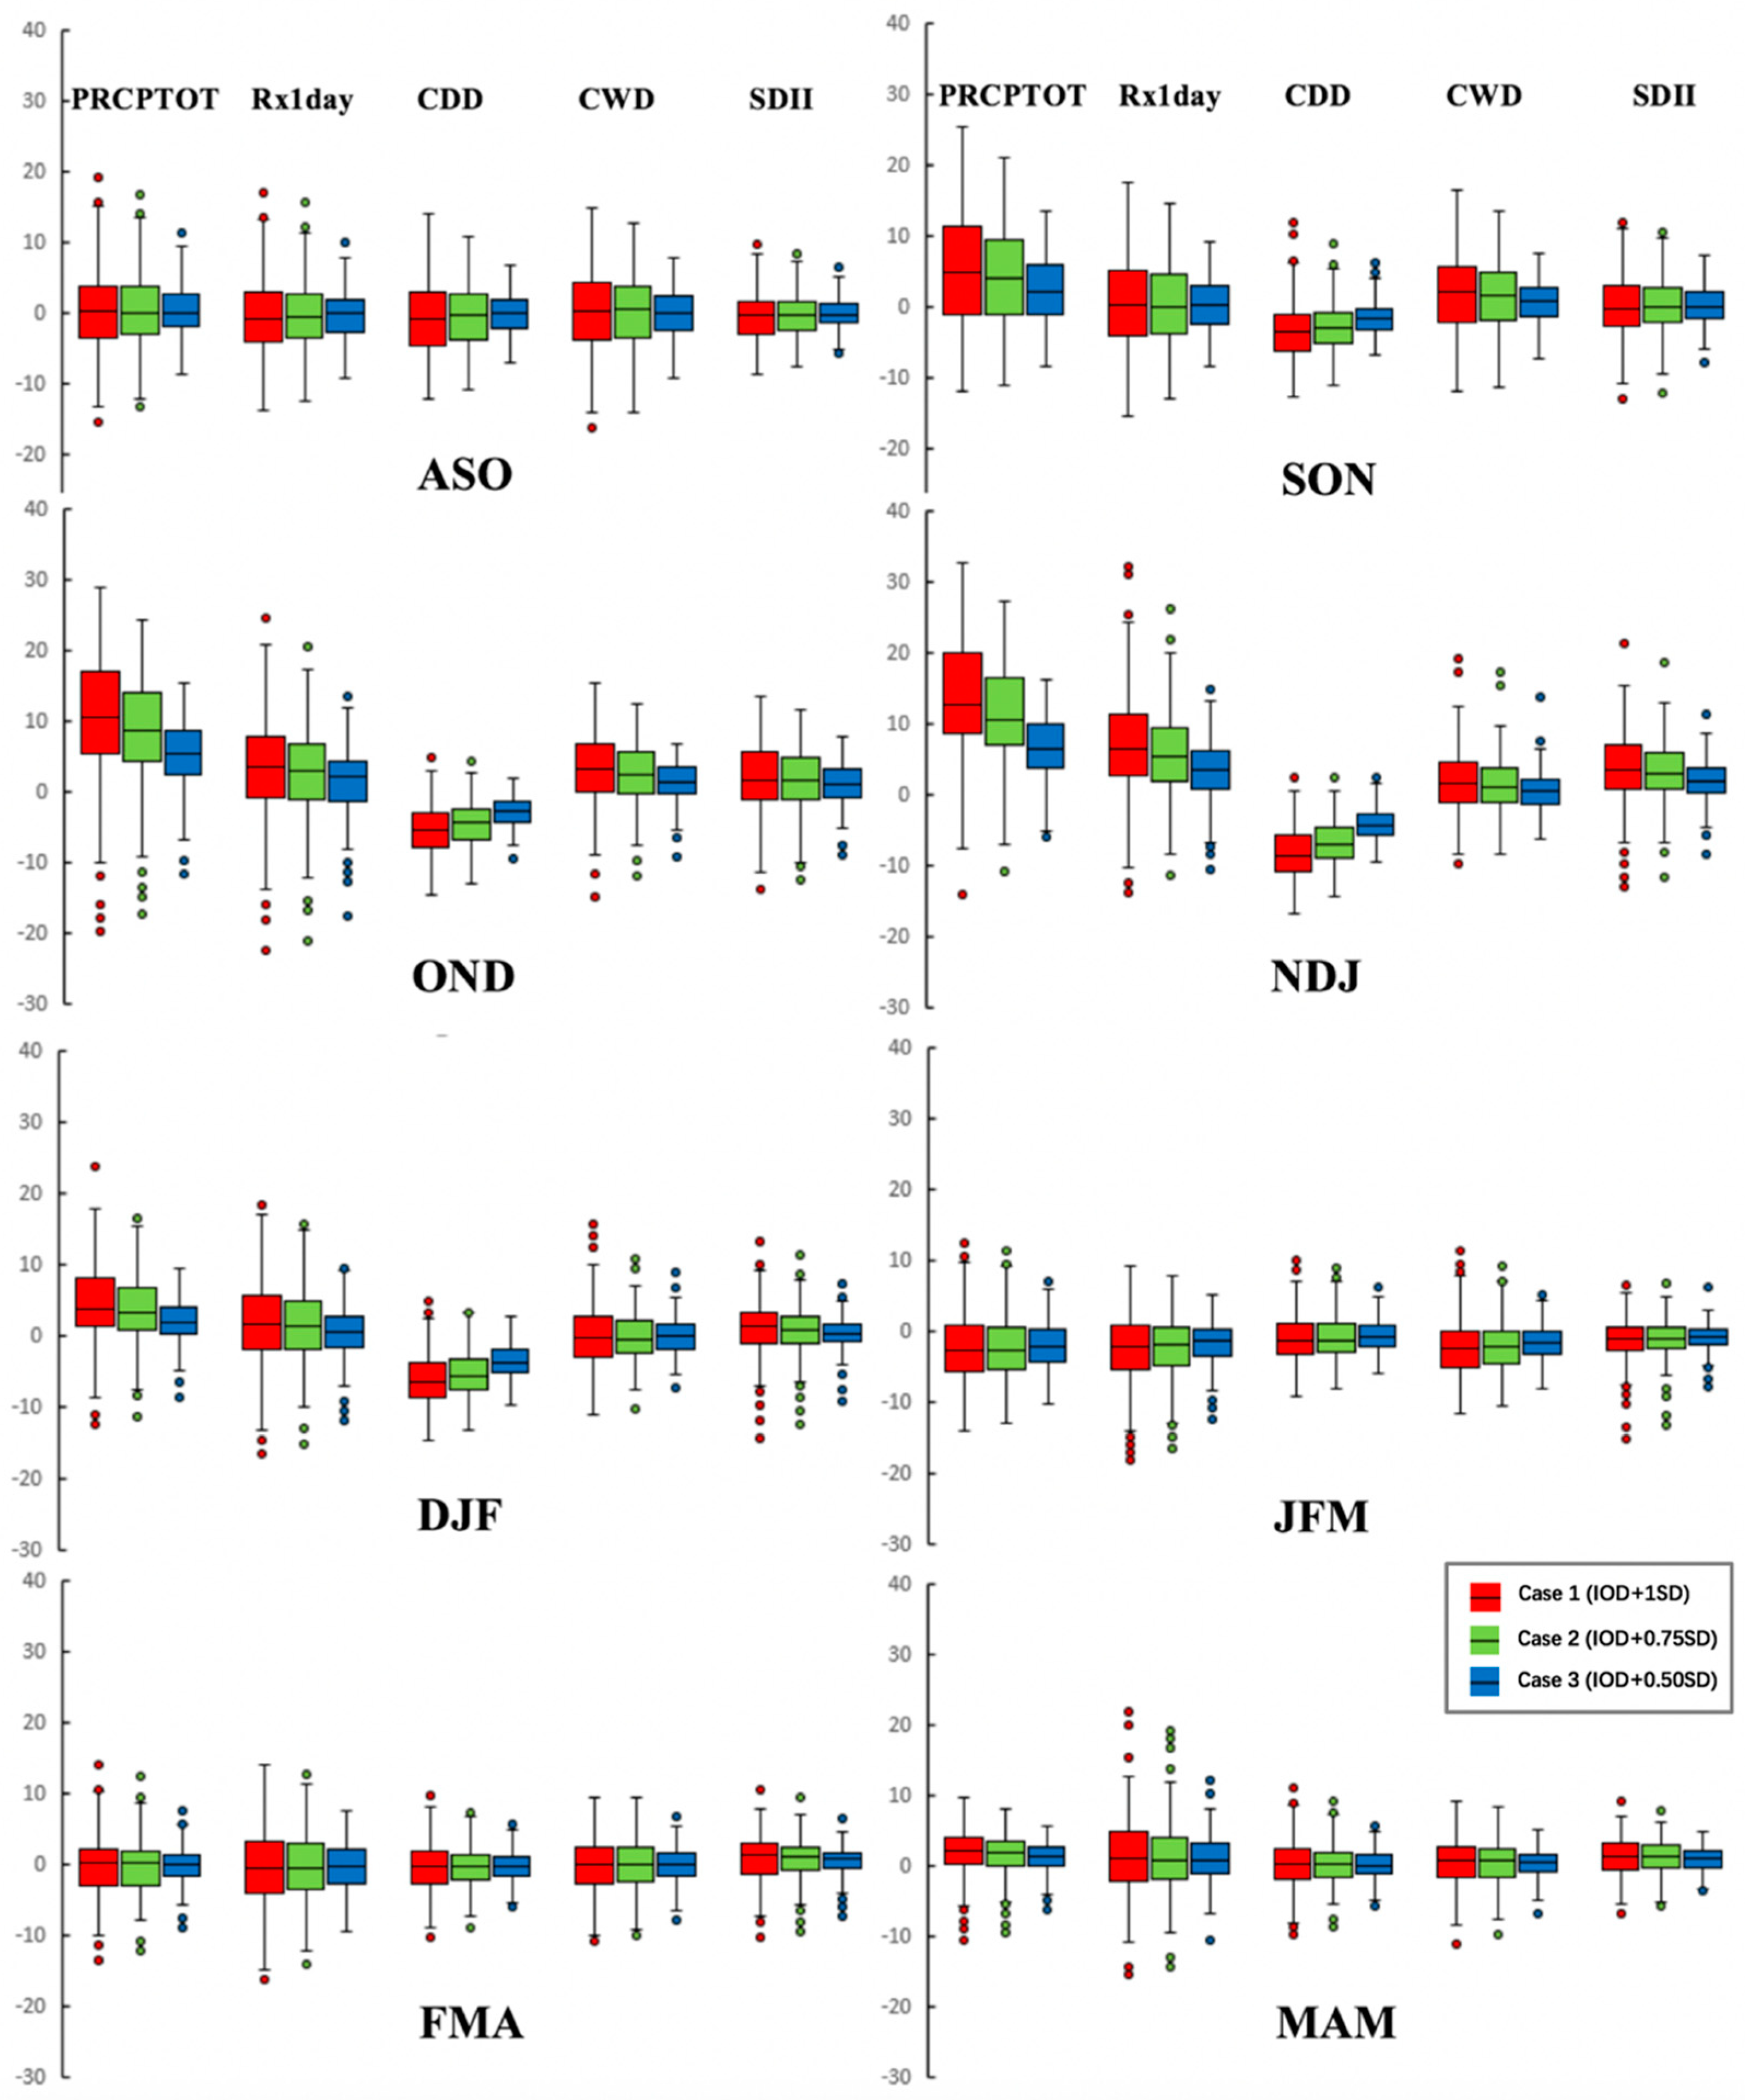
Notable percentage changes in precipitation features occurred in SON, OND, NDJ, and DJF (Figure 6), which demonstrated that the development and peak phase contributed most to the influence of the positive IOD events. During other seasons, the median of percentage changes in each precipitation index fluctuated around zero. However, some indices showed significant changes during SON, OND, NDJ, and DJF. Apart from PRCPTOT, Rx1day and CDD were more sensitive to positive IOD events than other indices. CDD tended to have an opposite trend to that of the other four indices. Nevertheless, the impact of positive IOD events on PRCPTOT was most evident among the precipitation indices.

4. Summary and Conclusions

Using the IBB simulation, this study investigated the influences of positive IOD events on seasonal total precipitation as well as rainfall frequency, intensity, and magnitude in SC with regard to both IOD-only and ENSO–IOD cases. The impacts of IOD events on precipitation in SC were divided into three main phases, and distinct differences were found when ENSO events were excluded. Precipitation data from 264 meteorological stations revealed that the impacts of the two cases differed noticeably.
Significant decreasing trends in seasonal precipitation occurred in the upper and middle reaches of the Yangtze River in ASO, SON, and OND, whereas significant increasing trends dominated some areas in SC during NDJ, DJF, and JFM. During FMA and MAM, significant decreases in the total rainfall occurred in CSC, whereas significant increases occurred in northwestern SC. Three main phases, namely the development and peak phase (ASO–NDJ), decay phase (DJF–JFM), and aftermath phase (FMA–MAM), were apparent in the time series. In the development and peak phase, the positive response to positive IOD events gradually dominated SC and the most powerful positive response occurred in NDJ. The negative response dominated after positive changes decayed. Positive sensitivity was found in most of the study area in the aftermath phase, but it was much weaker than it was during the first phase.
Compared to the IOD-only case, El Niño was the driving force in seasonal total precipitation anomalies in SC in the development and peak as well as decay phases. However, it exerted little influence on PRCPTOT in the aftermath phase. Specifically, El Niño made SC more vulnerable to a positive response. The five precipitation indices exhibited more distinct changes during SON, OND, NDJ, and DJF than during other months. Apart from PRCPTOT, Rx1day and CDD were more sensitive to positive IOD events than CWD and SDII.
In summary, this study used statistical analyses to identify the impacts of positive IOD events on precipitation features from ASO to MAM, i.e., over autumn, winter, and spring, in SC. Although the results relied on limited observations, this study provided predictions of rainfall anomalies in SC caused by positive IOD events. Importantly, to analyze the spatiotemporal variability in summer precipitation in SC, changes in precipitation caused by different moisture sources—such as summer monsoon and tropical cyclone (TC) activities, including TC genesis position, TC track, TC recurvature, TC intensity, and TC-induced precipitation—associated with the commingling effect of IOD and ENSO should be considered in future research.

Author Contributions

Conceptualization, C.H. and J.-S.K.; formal analysis, C.H.; methodology, S.-K.Y. and J.-S.K.; resources, J.-S.K.; writing—original draft preparation, C.H. and J.-S.K.; writing—review and editing, S.-K.Y., L.X. and J.-S.K.

Funding

This research is supported by the National Natural Science Foundation of China (NSFC Grant Nos. 41890822 and 51525902) and the Ministry of Education “111 Project” Fund of China (B18037), all of which are greatly appreciated.

Conflicts of Interest

The authors declare no conflicts of interest.

References

  1. Behera, S.K.; Krishnan, R.; Yamagata, T. Unusual ocean-atmosphere conditions in the tropical Indian Ocean during 1994. Geophys. Res. Lett. 1999, 26, 3001–3004. [Google Scholar] [CrossRef] [Green Version]
  2. Saji, N.H.; Goswami, B.N.; Vinayachandran, P.N.; Yamagata, T. A dipole mode in the Tropical Indian Ocean. Nature 1999, 401, 360–363. [Google Scholar] [CrossRef] [PubMed]
  3. Webster, P.J.; Moore, A.M.; Loschnigg, J.P.; Leben, R.R. Coupled ocean-atmosphere dynamics in the Indian Ocean during 1997–98. Nature 1999, 401, 356–360. [Google Scholar] [CrossRef] [PubMed]
  4. Ashok, K.; Guan, Z.; Yamagata, T. Influence of the Indian Ocean Dipole on the Australian winter rainfall. Geophys. Res. Lett. 2003, 30, 1821. [Google Scholar] [CrossRef]
  5. Black, E.; Slingo, J.; Sperber, K.R. An Observational Study of the Relationship between Excessively Strong Short Rains in Coastal East Africa and Indian Ocean SST. Mon. Weather Rev. 2003, 131, 74–94. [Google Scholar] [CrossRef]
  6. Chan, S.C.; Behera, S.K.; Yamagata, T. Indian Ocean Dipole influence on South American rainfall. Geophys. Res. Lett. 2008, 35, L14S12. [Google Scholar] [CrossRef]
  7. Saji, N.H.; Yamagata, T. Possible impacts of Indian Ocean Dipole mode events on global climate. Clim. Res. 2003, 25, 151–169. [Google Scholar] [CrossRef]
  8. Ashok, K.; Guan, Z.; Yamagata, T. Impact of the Indian Ocean dipole on the relationship between the Indian monsoon rainfall and ENSO. Geophys. Res. Lett. 2001, 28, 4499–4502. [Google Scholar] [CrossRef] [Green Version]
  9. Cai, W.; Rensch, P.V.; Cowan, T.; Hendon, H.H. Teleconnection Pathways of ENSO and the IOD and the Mechanisms for Impacts on Australian Rainfall. J. Clim. 2011, 24, 3910–3923. [Google Scholar] [CrossRef]
  10. Li, C.; Mu, M. The Influence of the Indian Ocean Dipole on Atmospheric Circulation and Climate. Adv. Atmos. Sci. 2001, 18, 830–843. [Google Scholar]
  11. Cai, W.; Rensch, P.V.; Cowan, T.; Hendon, H.H. An Asymmetry in the IOD and ENSO Teleconnection Pathway and Its Impact on Australian Climate. J. Clim. 2012, 25, 6318–6329. [Google Scholar] [CrossRef]
  12. Guan, Z.; Yamagata, T. The unusual summer of 1994 in East Asia: IOD teleconnections. Geophys. Res. Lett. 2003, 30, 1544. [Google Scholar] [CrossRef]
  13. Qiu, Y.; Cai, W.; Guo, X.; Ng, B. The asymmetric influence of the positive and negative IOD events on China’s rainfall. Sci. Rep. 2014, 4, 4943. [Google Scholar] [CrossRef] [PubMed]
  14. Zhang, X.; Xiao, Z.; Li, Y. Effects of Indian Ocean SSTA with ENSO on winter rainfall in China. J. Trop. Meteorol. 2014, 20, 45–56. [Google Scholar]
  15. Yuan, Y.; Yang, H.; Zhou, W.; Li, C. Influences of the Indian Ocean Dipole on the Asian summer monsoon in the following year. Int. J. Climatol. 2008, 28, 1849–1859. [Google Scholar] [CrossRef]
  16. Xiao, Z.; Yuan, H.; Li, C. The relationship between Indian Ocean SSTA Dipole Index and the precipitation and temperature over China. J. Trop. Meteorol. 2012, 4, 732. [Google Scholar]
  17. Liu, X.; Yuan, H.; Guan, Z. Effects of ENSO on the relationship between IOD and summer rainfall in China. J. Trop. Meteorol. 2009, 15, 59–62. [Google Scholar]
  18. Yan, X.; Zhang, M. A Study of the Indian Ocean Dipole Influence on Climate Variations over East Asian Monsoon Region. Clim. Environ. Res. 2004, 3, 461–462. [Google Scholar]
  19. Feng, J.; Yu, L.; Hu, D. Influence of Indian Ocean subtropical dipole on spring rainfall over China. Int. J. Climatol. 2014, 34, 954–963. [Google Scholar] [CrossRef]
  20. Liu, J.; Ma, Z.; Yang, S.; Xu, J. Relationship between Indian Ocean Dipole and Autumn Rainfall in West China. Plateau Meteorol. 2015, 4, 461–462. [Google Scholar]
  21. Luo, J.; Zhang, R.; Behera, S.K.; Masumoto, Y.; Jin, F.; Lukas, R.; Yamagata, T. Interaction between El Niño and Extreme Indian Ocean Dipole. J. Clim. 2010, 23, 726–742. [Google Scholar] [CrossRef]
  22. Xu, K.; Zhu, C.; Wang, W. The cooperative impacts of the El Niño-Southern Oscillation and the Indian Ocean Dipole on the interannual variability of autumn rainfall in China. Int. J. Climatol. 2016, 36, 1987–1999. [Google Scholar] [CrossRef]
  23. Annamalai, H.; Xie, S.P.; McCreary, J.P.; Murtugudde, R. Impact of Indian Ocean Sea Surface Temperature on Developing El Niño. J. Clim. 2005, 18, 302–319. [Google Scholar] [CrossRef]
  24. Yamagata, T.; Behera, S.K.; Luo, J.; Masson, S.; Jury, M.R.; Rao, S.A. Coupled Ocean-Atmosphere Variability in the Tropical Indian Ocean. Geophys. Monogr. Am. Geophys. Union 2004, 147, 189–212. [Google Scholar]
  25. Annamalai, H.; Murtugudde, R.; Potemra, J.; Xie, S.P.; Liu, P.; Wang, B. Coupled dynamics over the Indian Ocean: Spring initiation of the Zonal Mode. Deep Sea Res. Part II Top. Stud. Oceanogr. 2003, 50, 2305–2330. [Google Scholar] [CrossRef]
  26. Izumo, T.; Vialard, J.; Lengaigne, M.; de Boyer Montegut, C.; Behera, S.K.; Luo, J.; Cravatte, S.; Masson, S.; Yamagata, T. Influence of the state of the Indian Ocean Dipole on the following year’s El Niño. Nat. Geosci. 2010, 3, 168–172. [Google Scholar] [CrossRef]
  27. Xiao, M.; Zhang, Q.; Singh, V.P. Influences of ENSO, NAO, IOD and PDO on seasonal precipitation regimes in the Yangtze River basin, China. Int. J. Climatol. 2015, 35, 3556–3567. [Google Scholar] [CrossRef]
  28. Pui, A.; Sharma, A.; Santoso, A.; Westra, S. Impact of the El Niño–Southern Oscillation, Indian Ocean Dipole, and Southern Annular Mode on Daily to Subdaily Rainfall Characteristics in East Australia. Mon. Weather Rev. 2012, 140, 1665–1682. [Google Scholar] [CrossRef]
  29. Karl, T.R.; Knight, R.W.; Plummer, N. Trends in high-frequency climate variability in the twentieth century. Nature 1995, 377, 217–220. [Google Scholar] [CrossRef]
  30. Zhang, Z.; Chao, B.; Chen, J.; Wilson, C. Terrestrial water storage anomalies of Yangtze River Basin droughts observed by GRACE and connections with ENSO. Glob. Planet. Chang. 2015, 126, 35–45. [Google Scholar] [CrossRef]
  31. Lv, A.; Qu, B.; Jia, S.; Zhu, W. Influence of three phases of El Niño–Southern Oscillation on daily precipitation regimes in China. Hydrol. Earth Syst. Sci. 2019, 23, 883–896. [Google Scholar] [CrossRef]
  32. Trenberth, K.E.; Stepaniak, D.P. Indices of El Nino evolution. J. Clim. 2001, 14, 1697–1701. [Google Scholar] [CrossRef]
  33. Karl, T.R.; Nicholls, N.; Ghazi, A. CLIVAR/GCOS/WMO Workshop on Indices and Indicators for Climate Extremes—Workshop summary. Clim. Chang. 1999, 42, 3–7. [Google Scholar] [CrossRef]
  34. Peterson, T.C. Climate Change Indices. WMO Bull. 2005, 54, 83–86. [Google Scholar]
  35. Mann, H.B. Non-parametric tests against trend. Econometrica 1945, 13, 245–259. [Google Scholar] [CrossRef]
  36. Kendall, M.G. Rank correlation methods. Br. J. Psychol. 1990, 25, 86–91. [Google Scholar] [CrossRef]
  37. Hall, P.; Presnell, B. Intentionally biased bootstrap methods. J. R. Stat. Soc. Ser. B Stat. Methodol. 1999, 61, 143–158. [Google Scholar] [CrossRef]
  38. Davison, A.C.; Hinkley, D.V.; Young, G.A. Recent developments in bootstrap methodology. Stat. Sci. 2003, 18, 141–157. [Google Scholar]
  39. Lee, T. Climate change inspector with intentionally biased bootstrapping (CCIIBB ver. 1.0)—Methodology development. Geosci. Model Dev. 2017, 10, 525–536. [Google Scholar] [CrossRef]
  40. Zelinka, I. SOMA—self organizing migrating algorithm. In New Optimization Techniques in Engineering; Onwubolu, B.B., Ed.; Springer: New York, NY, USA, 2004; pp. 167–218. ISBN 3-540-20167X. [Google Scholar]
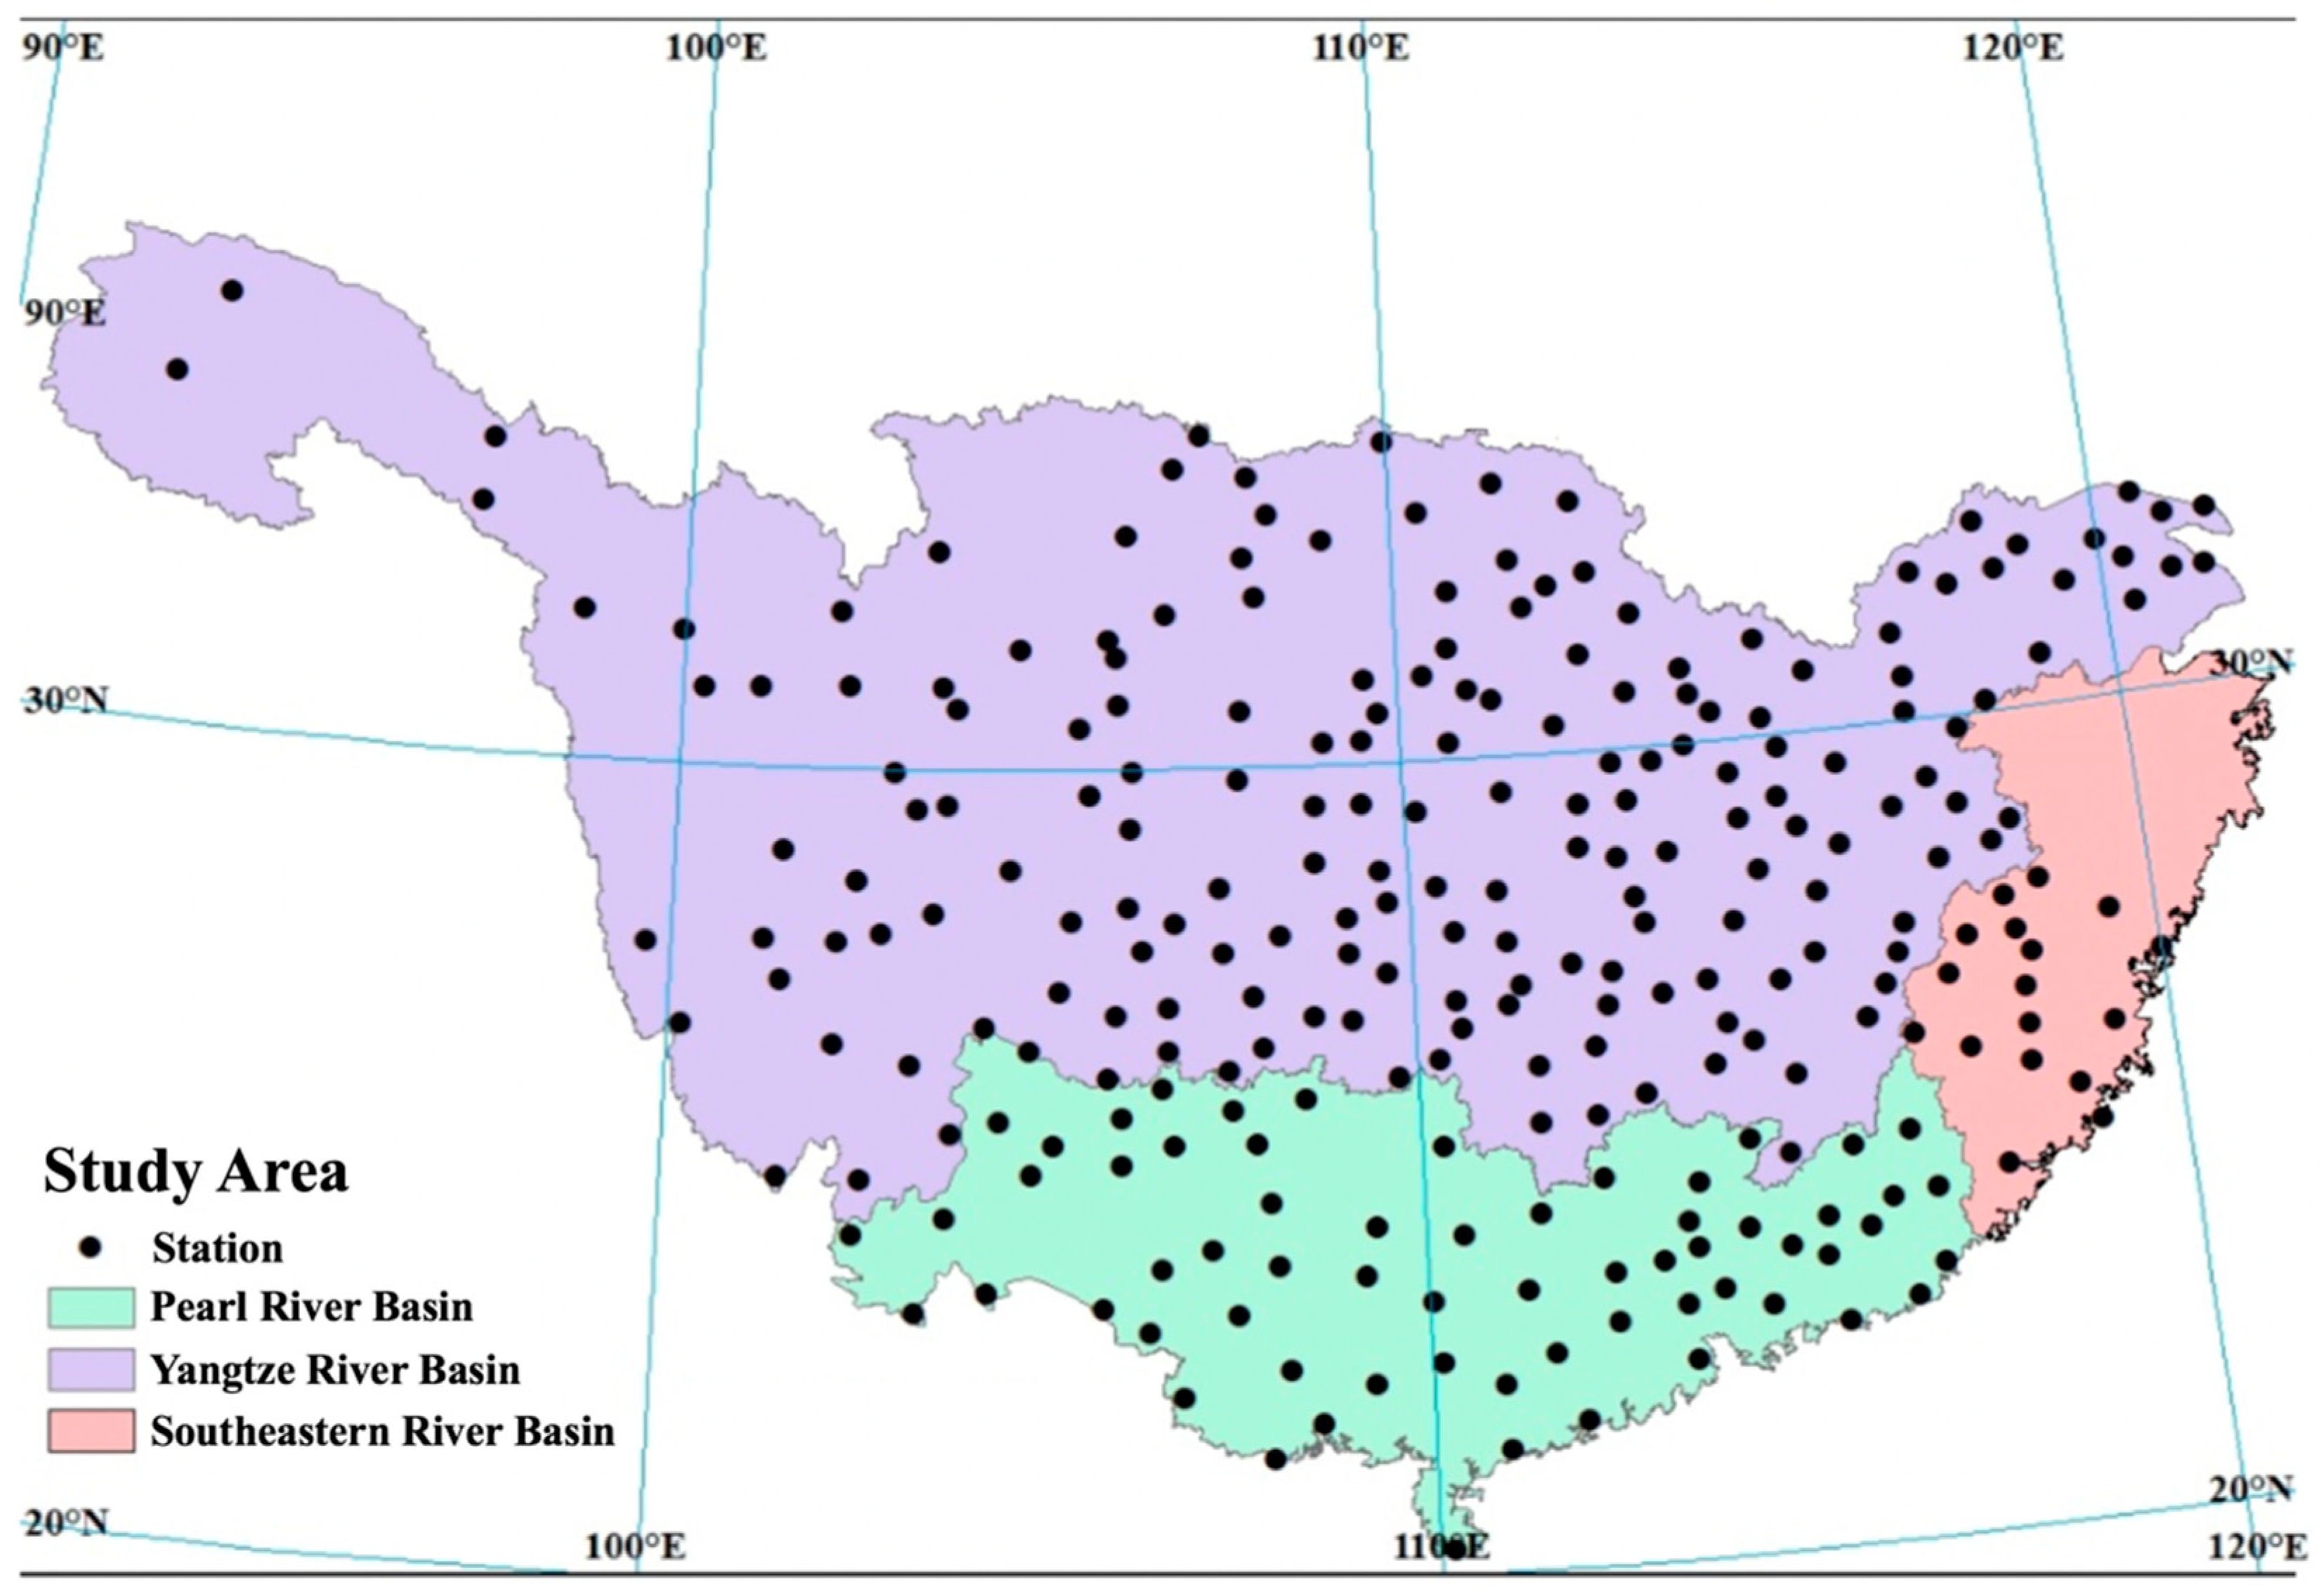
Figure 1. Map of southern China and location of meteorological stations used in this study.
Water 11 02023 g001
Figure 2. Results of trend analysis in moving three-month total precipitation in southern China for the period 1961–2017: Increasing and decreasing trends are indicated with red and blue symbols, with deep and light colors respectively representing 95% (highly significant) and 90% (significant) confidence levels. For definitions of abbreviations, refer to Section 2.2.
Water 11 02023 g002
Figure 3. Intentionally biased bootstrapping simulations of three-month moving average precipitation from August–September–October (ASO) to March–April–May (MAM) over southern China with different thresholds (dipole mode index (DMI) + 1 standard deviation (SD), DMI + 0.75 SD, and DMI + 0.5 SD): Here, DMI + 1 SD represents the case in which the DMI is intentionally increased by a +1-SD departure from the long-term average (1961–2017) to assess the impact of Indian Ocean Dipole (IOD) events on seasonal total precipitation. In each figure, percentage changes in seasonal precipitation are shown in red (blue) for increases (decreases). The weather stations showing statistically significant increases and decreases are indicated with regular and inverted triangles, respectively. In addition, the results of applying 90% and 95% confidence levels are marked by unfilled and filled symbols, respectively. For definitions of abbreviations, refer to Section 2.2.
Water 11 02023 g003
Figure 4. Intentionally biased bootstrapping simulations of three-month moving average precipitation from ASO to MAM (refer to Section 2.2 for definitions) over southern China in the case of DMI + 1 SD, excluding El Niño years: Here, DMI + 1 SD represents the case in which the DMI is intentionally increased by a +1-SD departure from the long-term average (1961–2017) to assess the impact of IOD events on seasonal total precipitation. In each figure, percentage changes in seasonal precipitation are shown in red (blue) for increases (decreases). The weather stations showing statistically significant increases and decreases are indicated with regular and inverted triangles, respectively. In addition, the results of applying 90% and 95% confidence levels are marked by unfilled and filled symbols, respectively.
Water 11 02023 g004
Figure 5. Boxplots of percentage changes in the intentionally biased bootstrapping simulation of running three-month precipitation from ASO to MAM (refer to Section 2.2 for definitions) over southern China (SC) in the case of Case 1 (IOD-El Niño–Southern Oscillation (ENSO) combined) and Case 2 (IOD-only) with DMI + 1 SD.
Water 11 02023 g005
Figure 6. Boxplots of percentage changes in intentionally biased bootstrapping simulation of running three-month precipitation from ASO to MAM (refer to Section 2.2 for definitions) over southern China in the case of five indices (PRCPTOT, seasonal total precipitation on wet days (≥1.0 mm); Rx1day, maximum 1-day precipitation; CDD, maximum number of consecutive dry days (<1.0 mm); CWD, maximum number of consecutive wet days; and SDII, simple daily precipitation index) with different threshold (DMI + 1 SD, DMI + 0.75 SD, and DMI + 0.5 SD) departures from the long-term average (1961–2017).
Water 11 02023 g006