Article

Hydrogeochemical Characteristics and Quality Assessment of Groundwater in an Irrigated Region, Northwest China

1
School of Environmental Science and Engineering, Chang’an University, Xi’an 710054, Shaanxi, China
2
Key Laboratory of Subsurface Hydrology and Ecological Effect in Arid Region of Ministry of Education, Chang’an University, No.126 Yanta Road, Xi’an 710054, Shaanxi, China
3
Xi’an Center of China Geological Survey, No.438 East Youyi Road, Xi’an 710054, Shaanxi, China
*
Author to whom correspondence should be addressed.
Water 2019, 11(1), 96; https://doi.org/10.3390/w11010096
Submission received: 19 November 2018 / Revised: 19 December 2018 / Accepted: 21 December 2018 / Published: 8 January 2019
(This article belongs to the Section Water Quality and Contamination)

Abstract

:
Groundwater is one of the most important sources of water for drinking and irrigation in arid and semi-arid regions of the world. In this study, 50 groundwater samples were collected and analyzed for various chemical constituents (pH, TDS, Na+, K+, Ca2+, Mg2+, SO42−, Cl, HCO3, NO3, and F) to identify the hydrogeochemical characteristics, and to evaluate its suitability for drinking and irrigation uses in Zhongning area of Northwest China. Results showed that groundwater was slightly alkaline in nature. Fluoride and nitrate concentrations in the groundwater of the study region were much higher than its prescribed limits for drinking purposes. A factor analysis (FA) was implemented to understand the contamination source of groundwater in the region, and the results indicated that rock–water interaction, geogenic, and human-induced contamination were the major factors influencing groundwater chemistry. An entropy-weighted water quality index (EWQI) was employed to evaluate the water quality for drinking purpose. Mg2+, Ca2+, SO42-, HCO3, and TDS played the leading roles in influencing the groundwater quality with high weights. Forty-eight percent of groundwater samples were unfit for drinking purpose in the study area, due to poor quality. Elevated concentrations of SO42−, Cl and NO3-N in groundwater caused poor quality and extremely poor quality water, which may be attributed to human activities. According to the calculation of sodium percentage (Na%), sodium adsorption ration (SAR), and permeability index (PI), the majority of the groundwater samples were suitable for irrigation. However, it should be noted that 26% of the samples were unfit for irrigation because of the high salinity in the groundwater. This is mainly attributed to the intense evaporation and the intensified irrigation activities in the region. The findings in this study contribute to a better understanding of groundwater sustainability for supporting water management and protection in the future.

1. Introduction

Groundwater is an indispensable resource for our planet, which supports over 97% of accessible freshwater, half of the drinking water, and approximately half of the irrigation purposes [1]. As many public health problems are derived from poor water and sanitation, water quality is as important as its quantity, for satisfying basic human needs [2,3,4,5]. Chemical compounds in the water for irrigation may also have effects on soil and crops, especially in saline alkali soil areas [6]. Therefore, it is most essential to understand the quality of available groundwater for ensuring a reliable supply for various purposes.
Physical and chemical characteristics of groundwater depend on both natural factors (such as lithology, velocity, geochemical reactions, solubility of salts, and the quality of recharge water) and anthropogenic activities (such as agriculture, industry, etc.) [7,8,9]. The variation and interactions of these factors determine the complexity of groundwater management [10]. Because it is more efficient to identify and eliminate the source of the contamination of waters rather than to install expensive water treatment for the removal of chemical constituents [11], many researchers have been devoted to elucidate the effects of natural processes and human pressures on groundwater chemistry [12,13,14,15,16]. Identifying the hydrogeochemical characteristics and groundwater quality can be helpful for revealing the interaction mechanism between groundwater and the environment, and to provide new insights into water protection and management [17,18,19,20].
Groundwater is at the core of sustainable development, and it is also critical for supporting socio-economic development and maintaining healthy ecosystem in arid regions of China (Northwest China) [21,22,23]. The common use of groundwater is for drinking, irrigation, and industrial purposes in many parts of China [21]. Groundwater is the primary source for domestic water supply in Ningxia Plain, Northwest China. It has been also considered a vital resource to ensure crop yields, especially during dry periods. Over 2000 years of irrigation history in the alluvial plain of Yellow River has made the aquifer system highly vulnerable to pollution because of high permissibility and shallow water depth [23,24,25]. Chen et al. [26] found that 40.7% of groundwater samples with high nitrate concentrations were unfit for drinking in the agricultural region. Zhongning area is in the southwest part of Ningxia Plain. The economy of this region was dominated by agriculture. Although the potential health risk from drinking groundwater in Zhongning area was assessed [26,27,28], basic information on the groundwater hydrogeochemistry and the quality of the Zhongning area is still unknown. The unclear effects of the geological and anthropic factors on water quality greatly constrain the utilization and sustainable protection of groundwater in the area.
Groundwater chemistry has been utilized as a tool for water quality outlook. The water quality index (WQI) is an efficient technique to express water quality by aggregating various water quality parameters [29]. During the WQI calculating process, the weight of each parameter is usually assigned by experts according to their practical experience, and valuable information about hydrogeological conditions [30,31]. Information entropy proposed by Shannon can express the degree of uncertainty [32]. A number of researchers and groundwater scientists believe that the WQI with entropy weight (EWQI) is most significant method, which helps to minimize the large amount of analysis data into a single digit [33]. However, it is not easy to distinguish contributions from natural factors and anthropogenic inputs based on the chemical composition of groundwater alone. Factor analysis (FA) helps to reduce the dimensionality of data sets, and a smaller number of variables can be used to reflect the large numbers of observed variables [34,35]. It is very useful to ascertain the critical information on chemical relationships essential to the deduction. This approach has proven to be highly effective in studies of water quality, ecology, and water management [36,37,38].
In this paper, FA and EWQI were applied to clarify the factors controlling water chemistry and water quality in the Zhongning area, to provide a general view of groundwater quality status for drinking and irrigation purpose. It is expected to provide more information on groundwater sustainability for decision makers.

2. Study Area

The study area is located in the southern part of Zhongning county in Ningxia, Northwest China (between 37°26′11″ and 37°35′54″ N and 105°34′18″–105°51′47″ E, Figure 1), covering an area of 201.18 km2. The climate of this region is arid with rare rainfall. The annual mean evaporation (1828.6 mm) is about 10 times greater than that of precipitation (179.4 mm). Agriculture is the main source of income for rural communities, and the major agronomic crops of cultivated land are rice, wheat, and corn. Wolfberry is the major cash crop in the region, which has long been used in traditional Chinese medicine as a general health tonic. Water from the Yellow River has brought considerable economic benefits to the surrounding communities.
The deposits of the alluvial aquifer are of Quaternary age and are primarily composed of fine sands, coarse sand, and gravels [26]. The sandstones are dominated mainly by quartz, plagioclase, feldspars, calcite, and dolomite. The phreatic aquifer is generally 40 m in thickness, and depth of groundwater is very shallow, less than 3 m. Under these conditions, shallow wells are fairly common in the region, owing to the low cost and ready access. Local residents drill boreholes within their homesteads and farm lands to support domestic and irrigation water supply, especially during dry periods. More importantly, nearly 10,000 people are dependent on untreated groundwater for their drinking supply.

3. Materials and Methods

3.1. Sample Collection and Analysis

A total of 50 water samples were collected from hand-dug wells in different villages in April 2012. The sampling locations recorded by a handheld GPS device (G120BD, Hezhong Sizhuang Technology Co., Ltd., Beijing, China) in the field are presented in Figure 1. These shallow wells with a depth less than 30 m were all private wells for drinking and irrigation purposes. Water was flushed for 5–10 min before collecting samples, to eliminate the influence of static water. The pre-cleaned polyethylene bottles were thoroughly rinsed with samples before collection. Immediately after sampling, pH, TDS (total dissolved solids), and temperature were measured in the field by portable pH and TDS meters (DDBJ-350F, INESA Scientific Instrument Co., Ltd., Shanghai, China). All the samples were kept refrigerated at 4 °C before physicochemical analysis.
Chemical analysis of major ions (Na+, K+, Ca2+, Mg2+, SO42−, Cl and HCO3), NO3, and F were carried out in Laboratory of Environmental Monitoring of Zhongwei Station. Each groundwater sample was analyzed by using standard methods recommended by the Ministry of Health of PRC (People’s Republic of China) and Standardization Administration of PRC [39]. Na+ and K+ were analyzed using flame atomic absorption spectrophotometry. Ca2+ and Mg2+ were measured using EDTA (elhylene diamine tetraacetic acid) titration; SO42− and Cl, F, and NO3–N were measured by ion chromatography; HCO3 was analyzed by the titrimetric method. The replicates were within ±5% error, and repeated measurements of calibration standards were within ±1%.

3.2. Data Treatment and Water Quality Assessment Method

In this study, FA was applied to identify the water chemistry characteristics and certain unobserved factors from the observed variables in groundwater samples by SPSS 20.0. Surfer 13 was used to visualize geographic information for mapping purposes. A Durov diagram [40] was applied to define the hydrogeochemical features with the help of AqQA software (RockWare, Inc. 2004). Correlation analysis was conducted using R (3.5.1, https://cran.r-project.org/bin/windows/base/) between all the parameters, to thoroughly investigate the processes contributing to groundwater quality in the study area.

3.2.1. Entropy-Weighted Water Quality Index

In order to avoid personal judgements, and to integrate more valuable information about water quality, the improved method of water quality index (EWQI) that used the entropy weighted value in calculations was employed in this paper. The calculation of EWQI values follows the following steps [29,33,41].
Step 1 (construction of initial matrix). An initial matrix X can be constructed based on the chemical analysis data. When m (i = 1, 2, …m) water samples were taken to evaluate the water quality, and each sample had n evaluated parameters (j = 1, 2, …m). The eigenvalue matrix X can be obtained:
X = [ x 11 x 12 x 1 n x 21 x 22 x 2 n x m 1 x m 2 x m n ]
Step 2 (matrix normalization). Date pretreatment is useful for eliminating the influence caused by the difference of different units of characteristic indices and different quantity grades. According to attribution of every index, the feature indexes may be divided into four types: Efficiency type, cost type, fixed type, and interval type. For the efficiency and cost types, the standardization treatments were expressed as Equation (2). After transformation, the standard-grade matrix was written as Y = (yij)(m×n):
y i j = {    x i j ( x i j ) min ( x i j ) max ( x i j ) min     effciency type ( x i j ) max x i j ( x i j ) max ( x i j ) min          cos t type
Step 3 (calculation of entropy weight). The information entropy was expressed as:
e j = 1 ln m i = 1 m P i j ln P i j
P i j = ( y i j + 10 4 ) / i = 1 m ( y i j + 10 4 )
where ej was the information entropy of the jth index. 10−4 was used in the formula to ensure that the formula was meaningful. The smaller the value of ej was, the bigger the effect of the j index. Then, the entropy weight of j parameter can be obtained.
w j = 1 e j j = 1 n ( 1 e j )
Step 4 (calculation of EWQI value):
q j = C j S j × 100
E W Q I = J = 1 n w j q j
where qj is a quality rating scale for the jth parameter. Cj is the concentration of each chemical parameter in each water sample in mg/L; Sj is the limit for drinking groundwater of each parameter in mg/L, in accordance with quality standards of the WHO (World Health Organization).
According to EWQI, groundwater is classified into five categories, ranging from “excellent water” to “extremely poor water” [29,33,41]. The classification standards are listed in Table 1. Groundwater with excellent and good water quality are suitable for drinking, and will rarely induce health problems. Medium water quality indicates that some parameters are slightly beyond the corresponding presumable limits, and it can be used for drinking conditionally. When the EWQI value is greater than 150, groundwater becomes unfit for drinking, as some elements are seriously beyond the acceptable limits.

3.2.2. Evaluation of Groundwater Quality for Irrigation Purposes

To evaluate the suitability of groundwater for irrigation purposes, TDS was used to describe the salts carried in the irrigation water. The sodium percentage (Na%), sodium adsorption ratio (SAR), and permeability index (PI) were also calculated by using the standard formulas (Equations (8)–(10)). All concentrations were expressed in meq/L.
Na % = ( Na + K ) × 100 ( Ca + Mg + Na + K )
SAR = Na ( Ca + Mg ) / 2
PI % = Na + HCO 3 × 100 Ca + Mg + Na

4. Results and Discussion

4.1. Chemical Compositions of Groundwater

All of the parameters were statistically analyzed to provide general chemical characteristics in groundwater. Table 2 exhibited the minimum, maximum, mean, and the standard deviation for each parameter. The permissible limits for drinking purposes set by World Health Organization [12,42] and Chinese regulation [43] were involved.
Groundwater in this area was slightly alkaline to neutral, as the recorded pH values ranged from 7 to 8.5, with a mean value of 7.8. The pH values were within the permissible limits (6.5–8.5) set by WHO and the Chinese standards at all sites. The TDS parameter is generally used as a measure of water palatability, because high TDS may distort the taste of the water [11]. Freshwater with TDS < 1000 mg/L is regarded as being suitable for drinking [11,42,43]. In the study area, the TDS values ranged from 468 to 2560 mg/L with a mean of 1225 mg/L, and the results indicated that 62% of groundwater samples exceeded the permissible limit for drinking purpose.
The concentration of cations was in the order of Na+ > Ca2+ > Mg2+ ≫ K+. The sodium values in groundwater ranged from 58.5 to 691 mg/L. Fourteen samples had high levels of Na+, exceeding the permissible limit for drinking purposes, based on the WHO standards (>200 mg/L). Sodium was dominant, but highly variable, because the standard deviations were larger than the mean value (Table 2). Calcium and magnesium are common elements in water. The concentrations of Ca2+ and Mg2+ were in the ranges of 30.9–255 mg/L and 21.3–116 mg/L, respectively. A total of 92% and 96% of the samples had higher values of Ca2+ and Mg2+, which were beyond the acceptable limits of WHO (75 mg/L, 30 mg/L), respectively. This implies that hard water (caused by compounds of Ca2+ and Mg2+) may contribute to scaling in boilers and industrial equipment. The concentration of K+ was quite lower, ranging from 1.72 to 16.3 mg/L in the study area. Higher K+ levels (>10 mg/L) were observed in the three samples.
Anions dominances of the groundwater were observed as SO42− > HCO3 > Cl. Chloride is an extremely stable element in water, which may be derived from weathering, the leaching of sedimentary rock and soil, and domestic effluents [44]. The observed concentration of Cl was between 49.7 and 553 mg/L, with a mean of 148 mg/L. The majority of the groundwater samples were suitable for drinking, but the Cl levels in six samples were beyond the permissible limit (250 mg/L). SO42− concentrations were from 82 to 986 mg/L in the study area. The maximum permissible limit for sulfate was 250 mg/L. A total of 58% of the samples were above the threshold for drinking purposes. Interestingly, the groundwater samples showed large variations in both SO42− and Cl (Table 2), and abnormally high concentrations of SO42− and Cl were measured in the W1, W34, W41, and W45 samples. The observation may imply the adverse impact of sewage or effluent on groundwater quality. These findings were consistent with the results of the hydrogeochemical characteristics of groundwater carried out in the alluvial plain [9]. The levels of HCO3 in the groundwater samples were between 170 and 661 mg/L, with a mean of 459 mg/L. Results showed that 90% of the groundwater samples had higher levels of HCO3, exceeding the permissible limit (>300mg/L).
As an essential trace element in human body, fluoride concentration in drinking water should not exceed 1.5 and 1.0 mg/L, as set by WHO and the Chinese standards, respectively. Long-term exposure to high-fluorine water may cause adverse effects such as dental or skeletal fluorosis [45]. In the study area, the concentrations of fluoride ranged from 0.11 to 6.33 mg/L, with a mean of 0.85 mg/L. Four and 11 samples located in the southern part of the region were beyond the acceptable limits of 1.5 and 1.0 mg/L, respectively. This may be probably attributed to the dissolution of fluoride bearing mineral.
The nitrate concentration of groundwater in agricultural regions reached in high levels in recent decades, due to the intensive application of chemical fertilizer [13,46,47]. As shown in Table 2, the NO3-N concentrations in the groundwater samples ranged from 2.66 to 103 mg/L. Thirty and 14 samples showed higher concentrations when compared to acceptable limits for drinking purpose set by WHO (10 mg/L) and Chinese regulations (20 mg/L), respectively. The nitrate concentrations in W32 and W37 even reached to 67.9 and 103 mg/L, respectively. Both irrigation activities and fertilizer application may be likely to create a blanket non-point source of nitrate, even though there was no significant correlation between the nitrate level and the land use in the study area.

4.2. Hydrogeochemical Facies

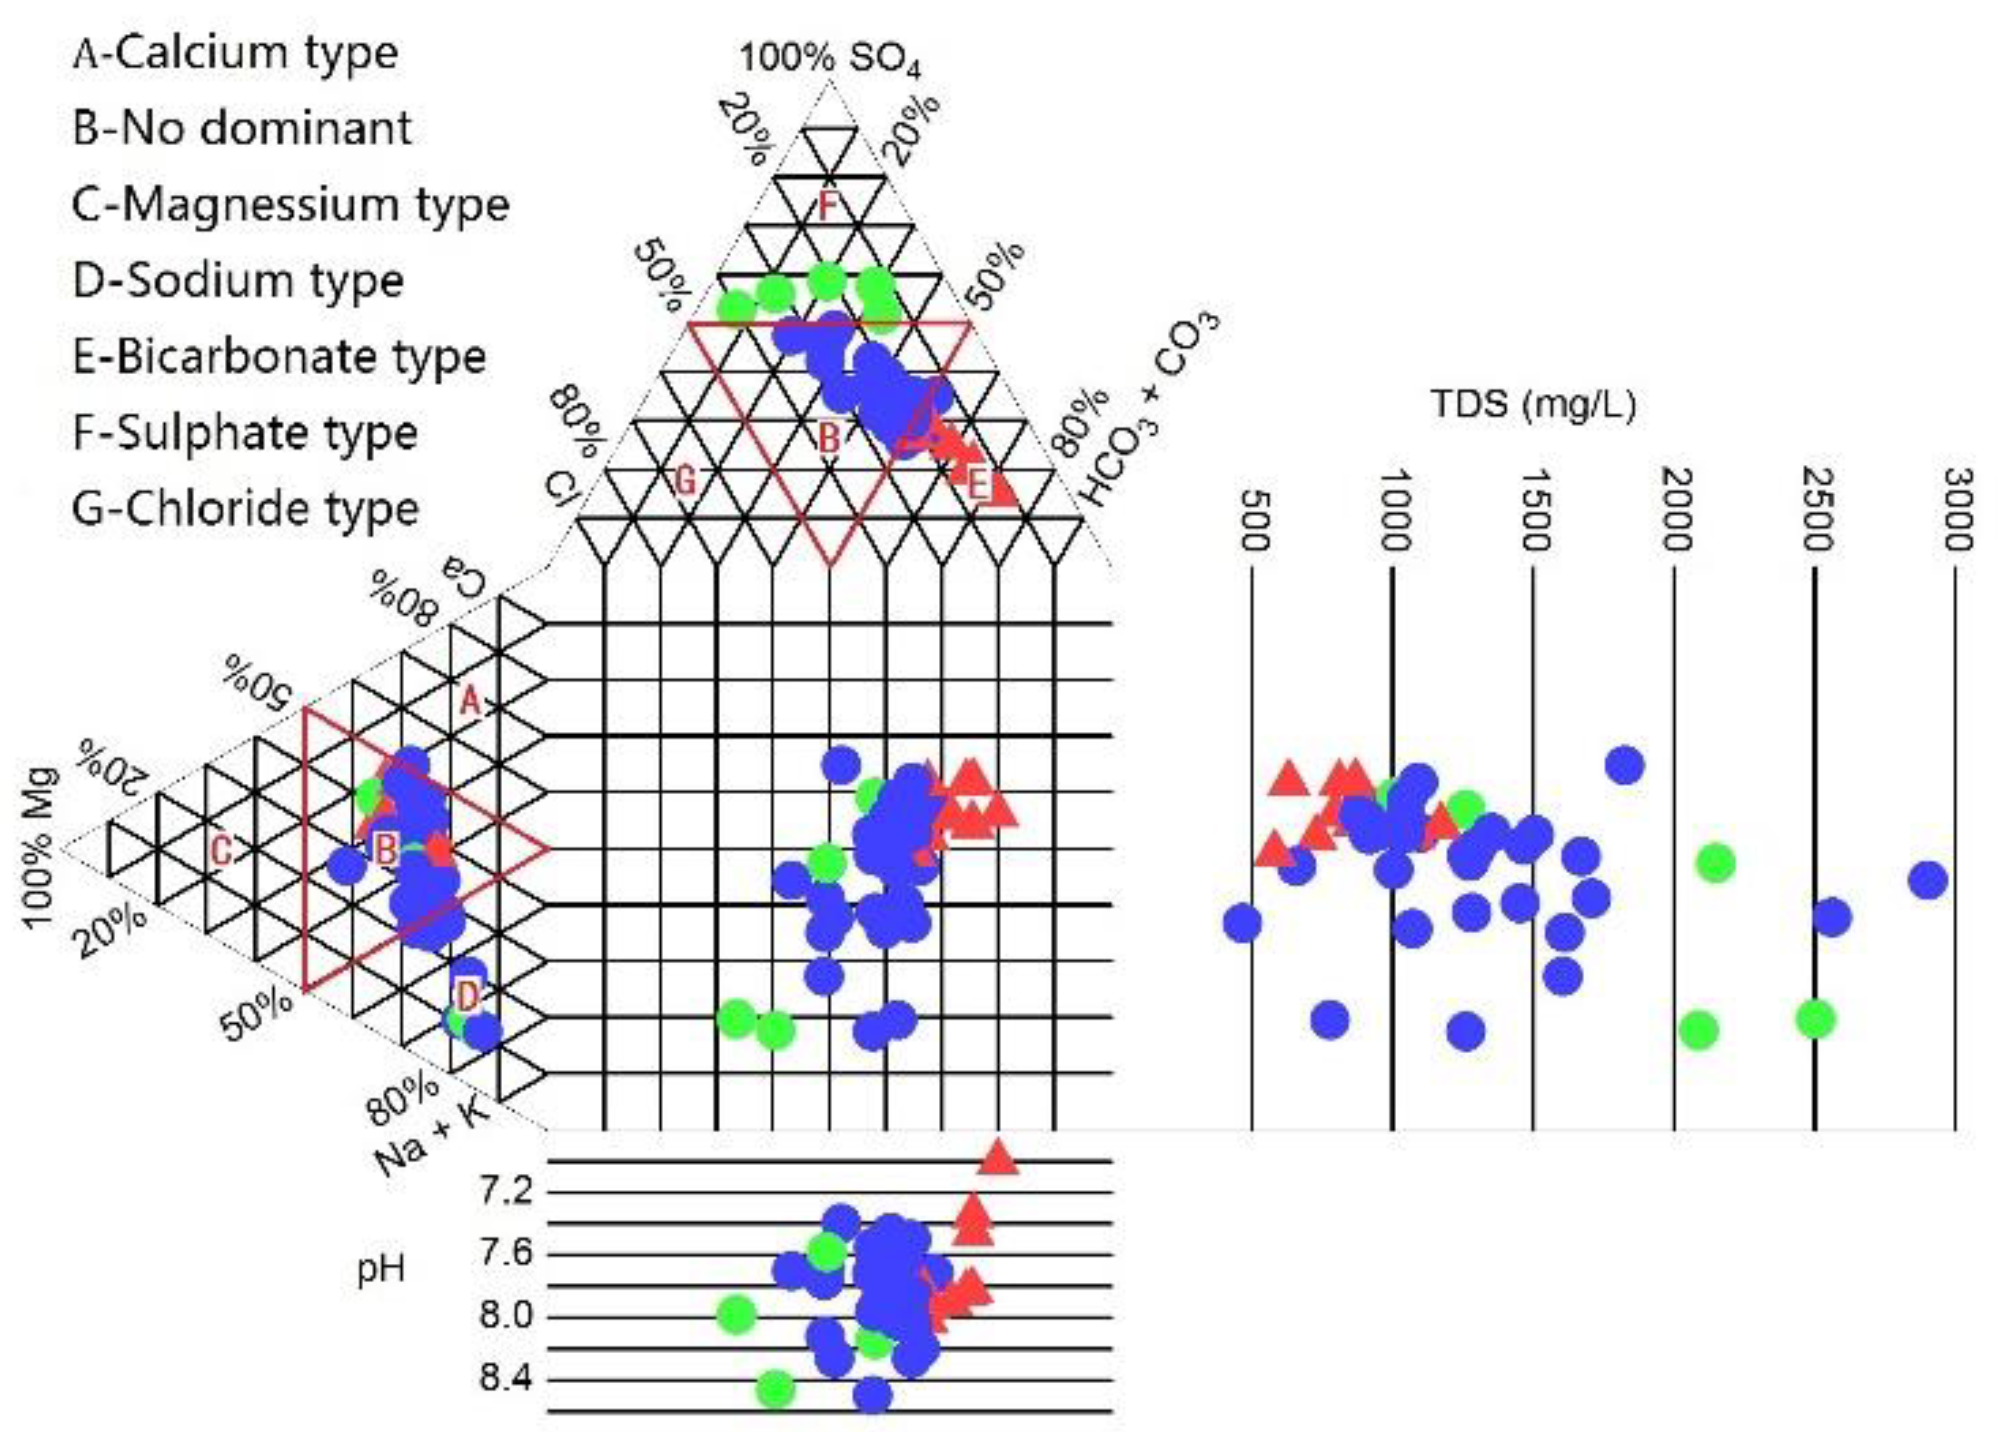
The Durov diagram [40] is a useful graphical tool for representing hydrogeochemical data. As shown in Figure 2, the majority of the samples, with respect to cations, were observed in B (no dominant), and filed in the left triangle. The cations in the groundwater were predominated by the mixed type. Only three samples were plotted in the field of D (sodium type in Figure 2), suggesting the dominance of (Na + K) in the groundwater. On the contrary, distinct difference was detected in anions for the groundwater. The red filled circles in the field of E belonged to the bicarbonate type, indicating the dominant anion of HCO3. These samples were mainly characterized by fresh water (TDS < 1000 mg/L), which were located in the recharge zone of the aquifer (the southern part of the study area). The other samples (blue and green filled circles) belonged to the brackish water group with the sulfate and mixed water type, indicating the combined influences of evaporation, water–rock interaction, and/or human activities.

4.3. Processes Regulating Groundwater Hydrogeochemistry

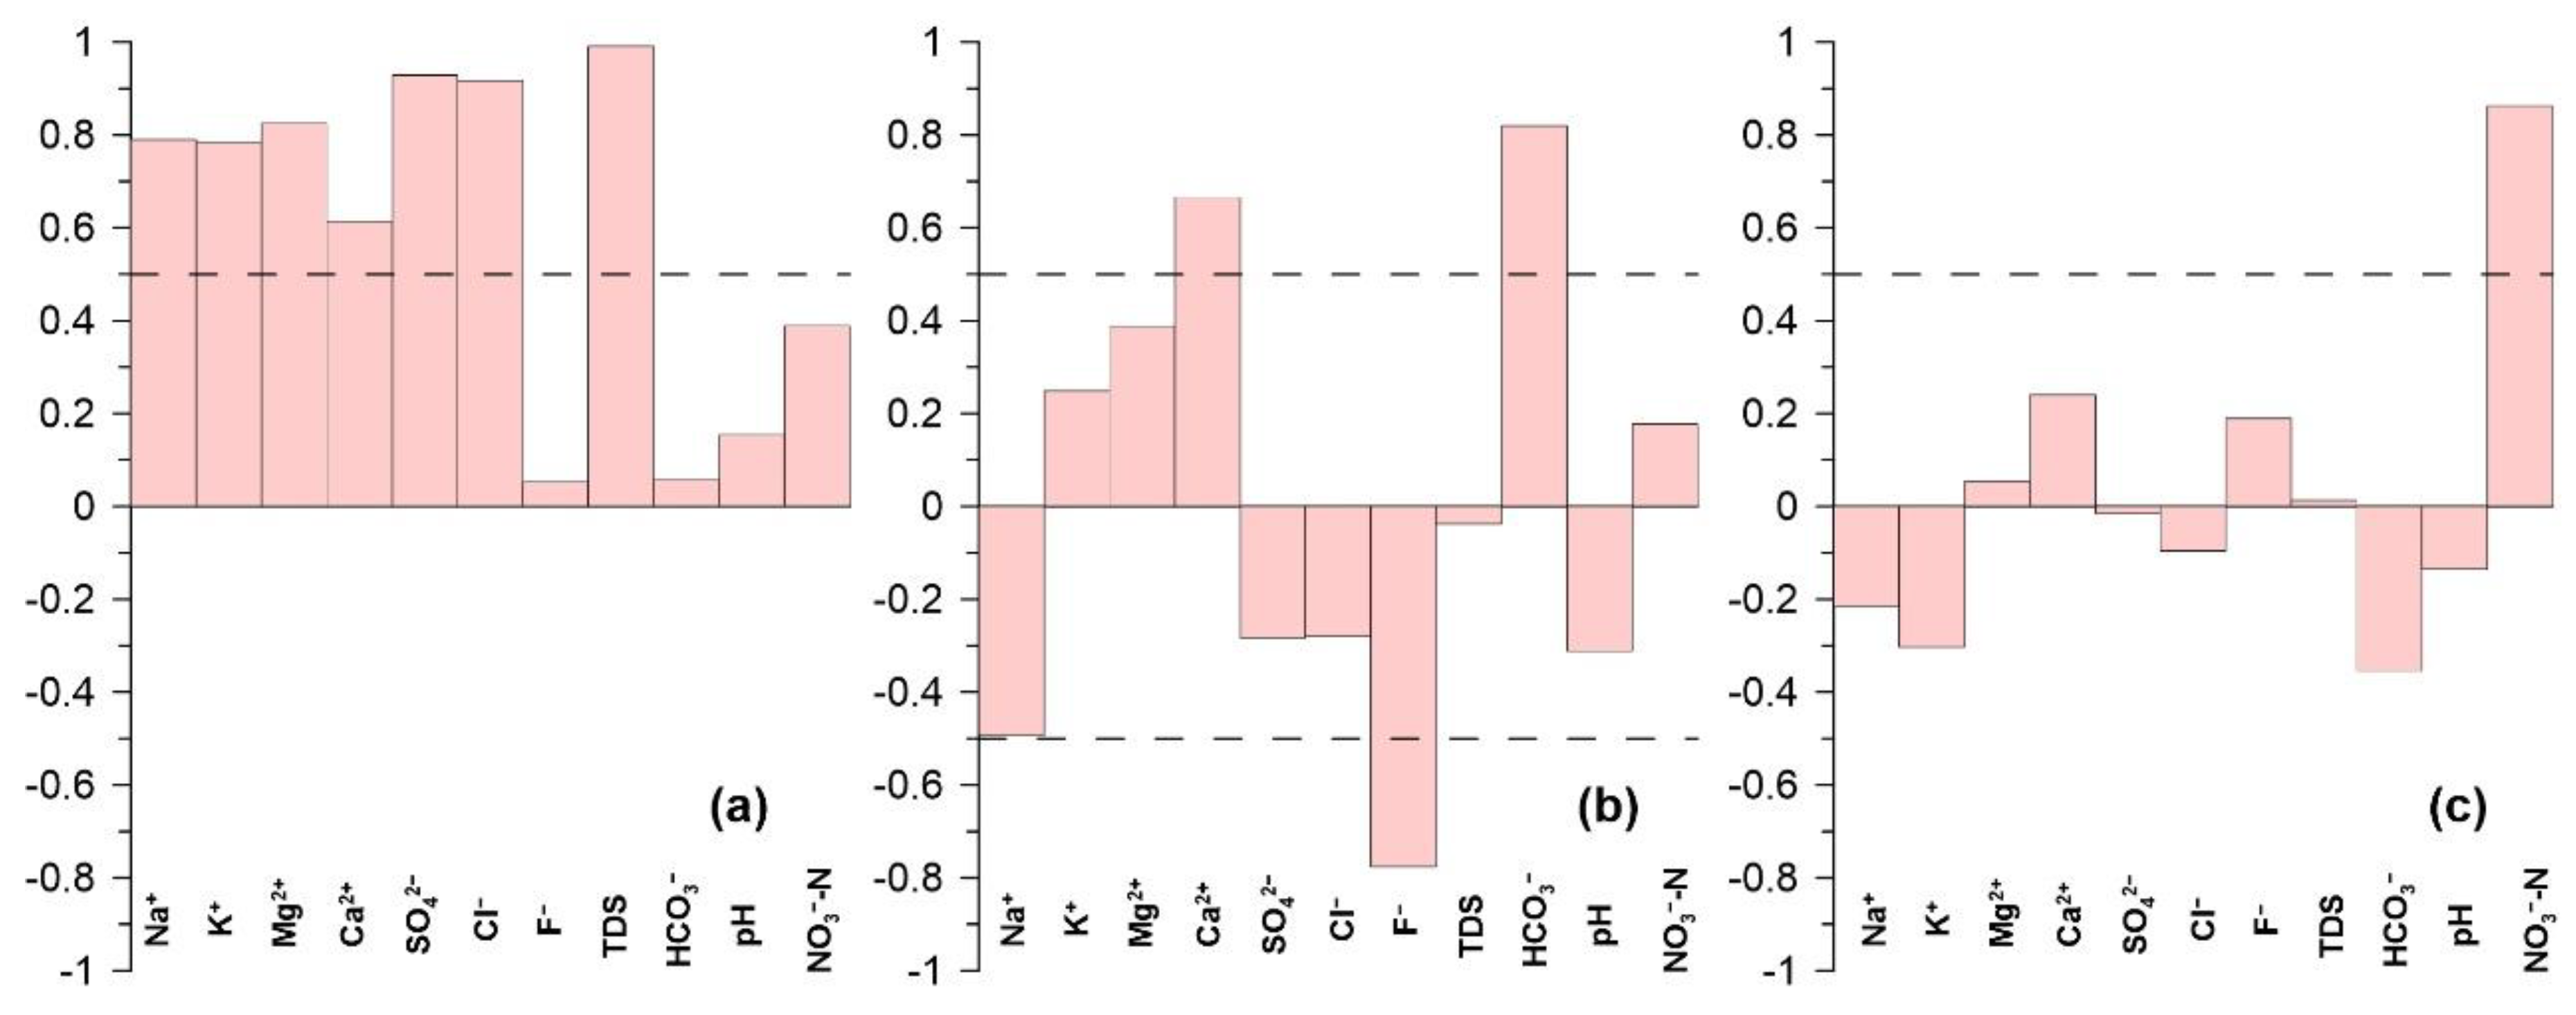
Distinguishing the lithogenic origin and anthropogenic effects have been recognized as necessary step to support groundwater protection. In this study, FA was applied to define the dominant factors affecting water signature variations in the aquifer system. Three eigenvalues above 1 were retained, which account for 82.6% of the total variance of the original dataset after the factors were extracted and rotated (Figure 3). These were: (1) the water–rock interaction, represented by Factor 1, (2) the geogenic contamination factor, represented by Factor 2, and (3) human-caused contamination, represented by Factor 3. Each process explained 46.8%, 25.4%, and 10.4% of the total variance of the groundwater chemistry in the study area, respectively.

4.3.1 Water–Rock Interactions

Factor 1 had strong loadings on Na+, K+, Mg2+, Cl, SO42−, and TDS (Figure 3a). The association of these parameters reflected the occurrence of mineral precipitation, and can thus be termed “water–rock interaction factor”.
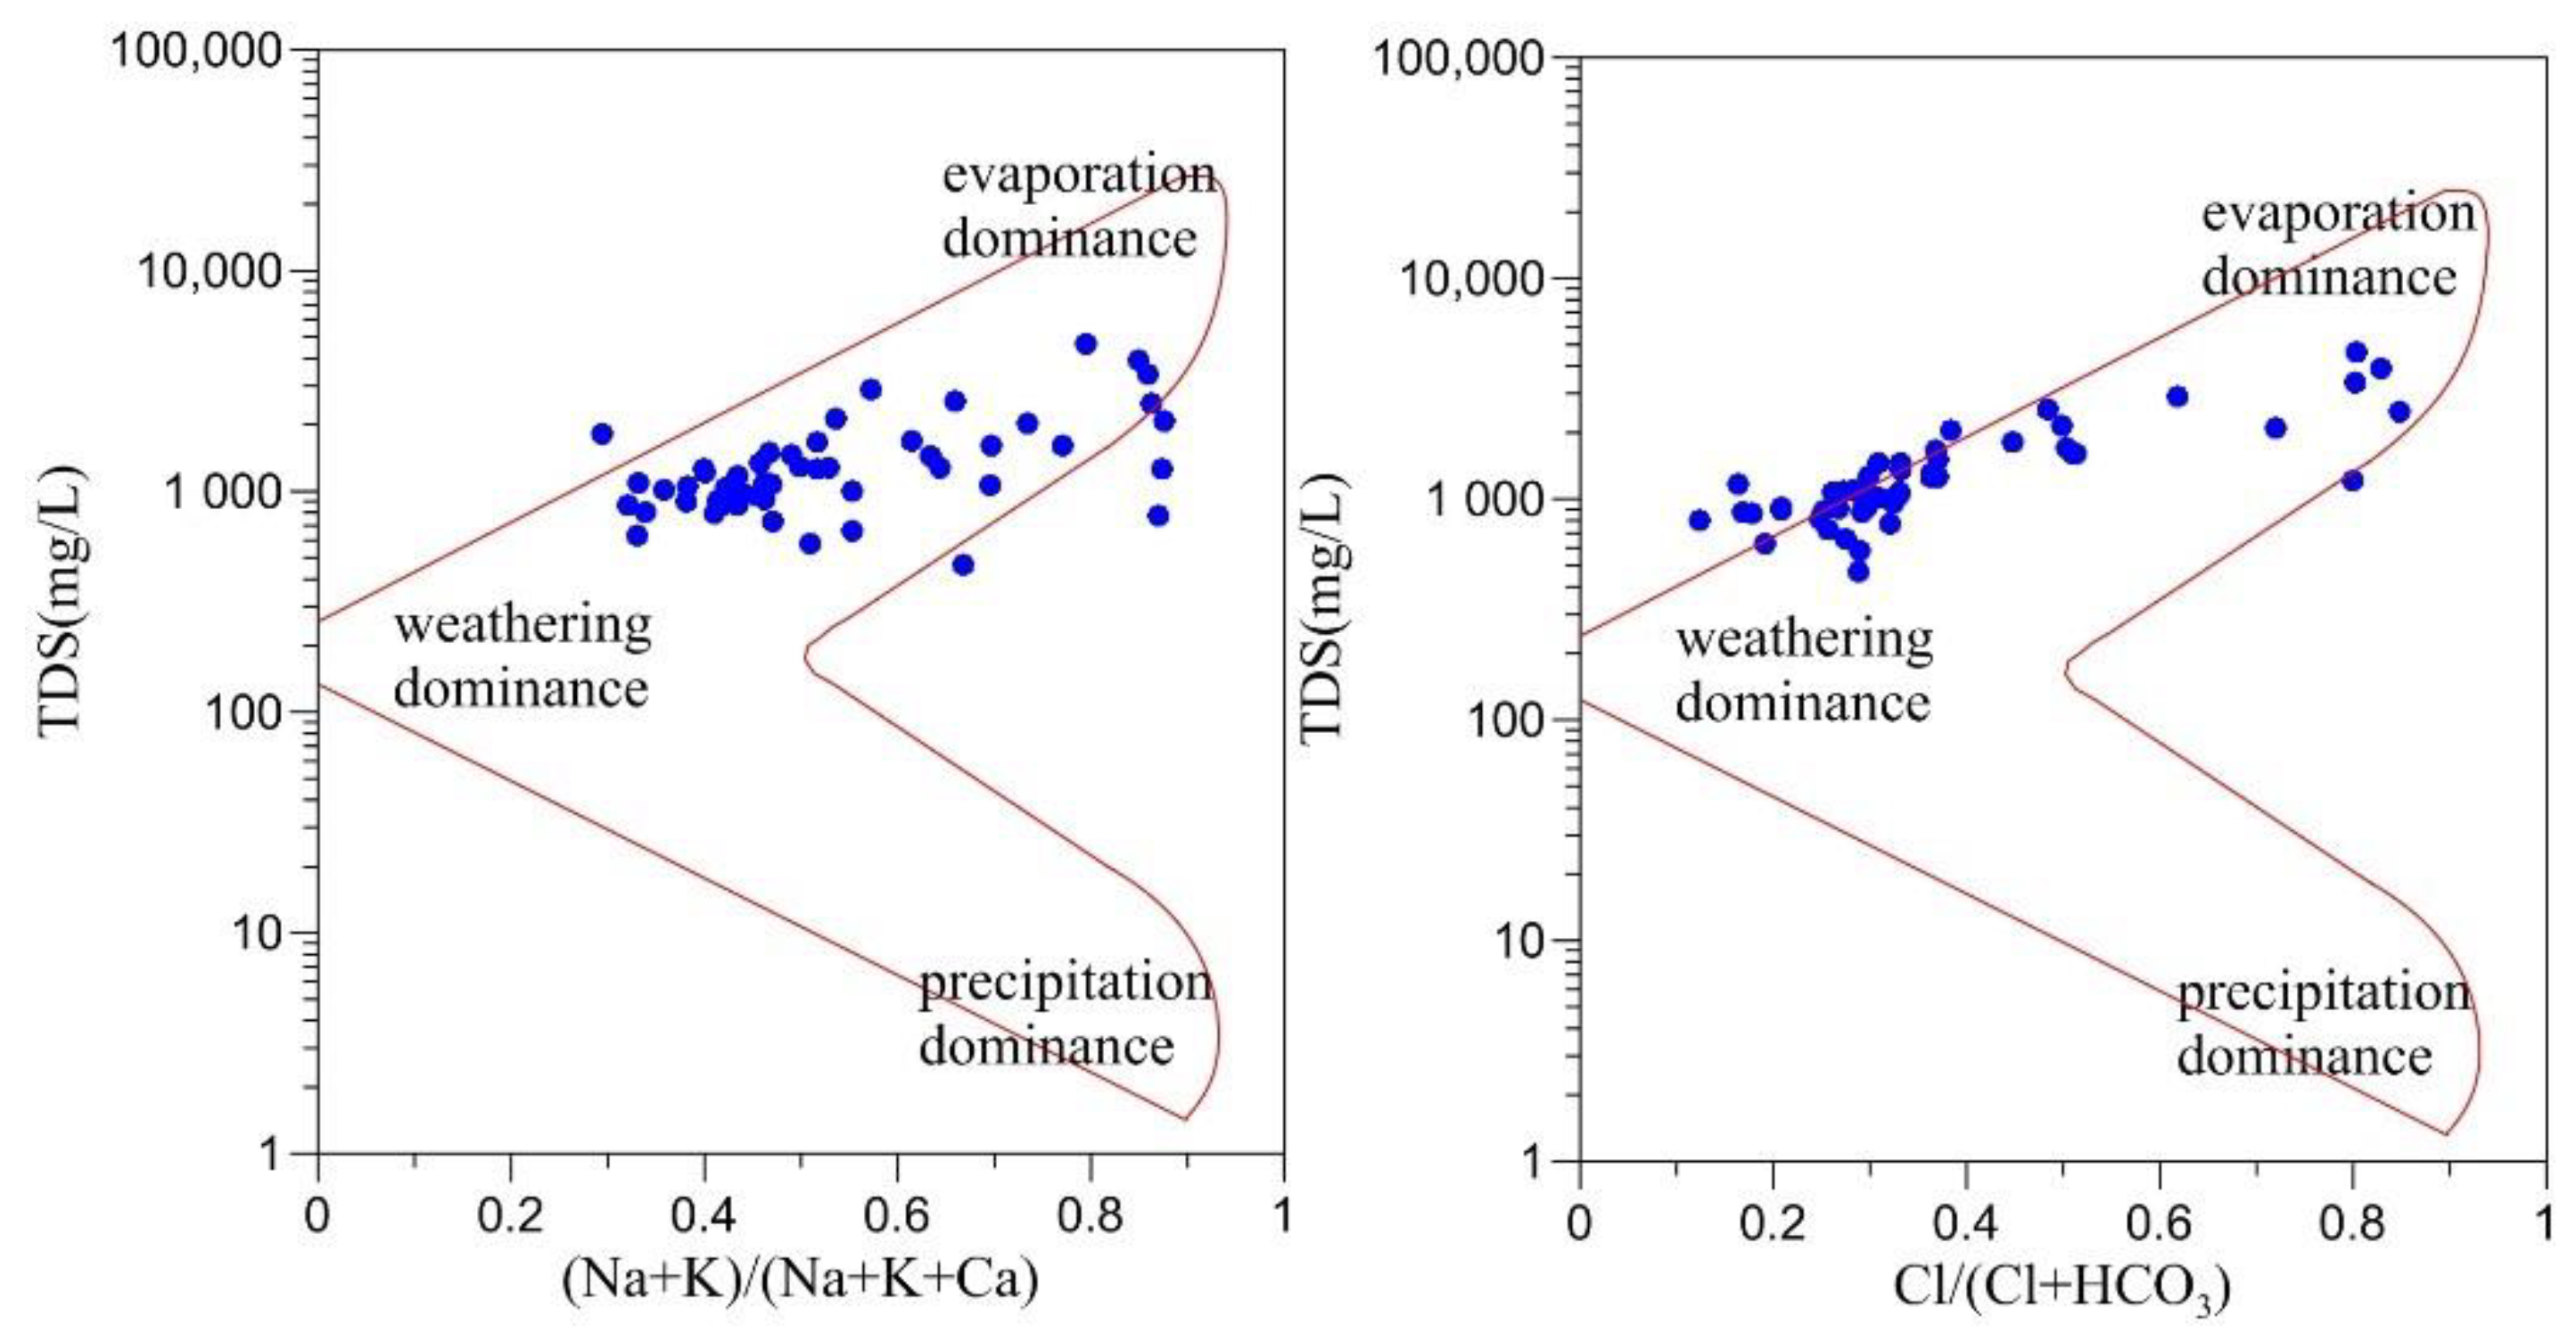
The Gibbs diagram is widely used to study the relationship between water chemistry and aquifer lithology [48]. The functional sources of the dissolved chemical constituents can be divided into three distinct fields in this diagram, namely precipitation dominance, evaporation dominance, and weathering dominance areas. The ratios of Cl/(Cl + HCO3) and (Na + K)/(Na + K +Ca) as a function of TDS were drawn in Figure 4. The majority of the samples fell in the weathering field, demonstrating the importance of soil and aquifer properties on groundwater chemistry. Significant effects of evaporation were also detected in the study area. Given the intensified irrigation activities, it may be associated with a shallow water depth in the agricultural region.
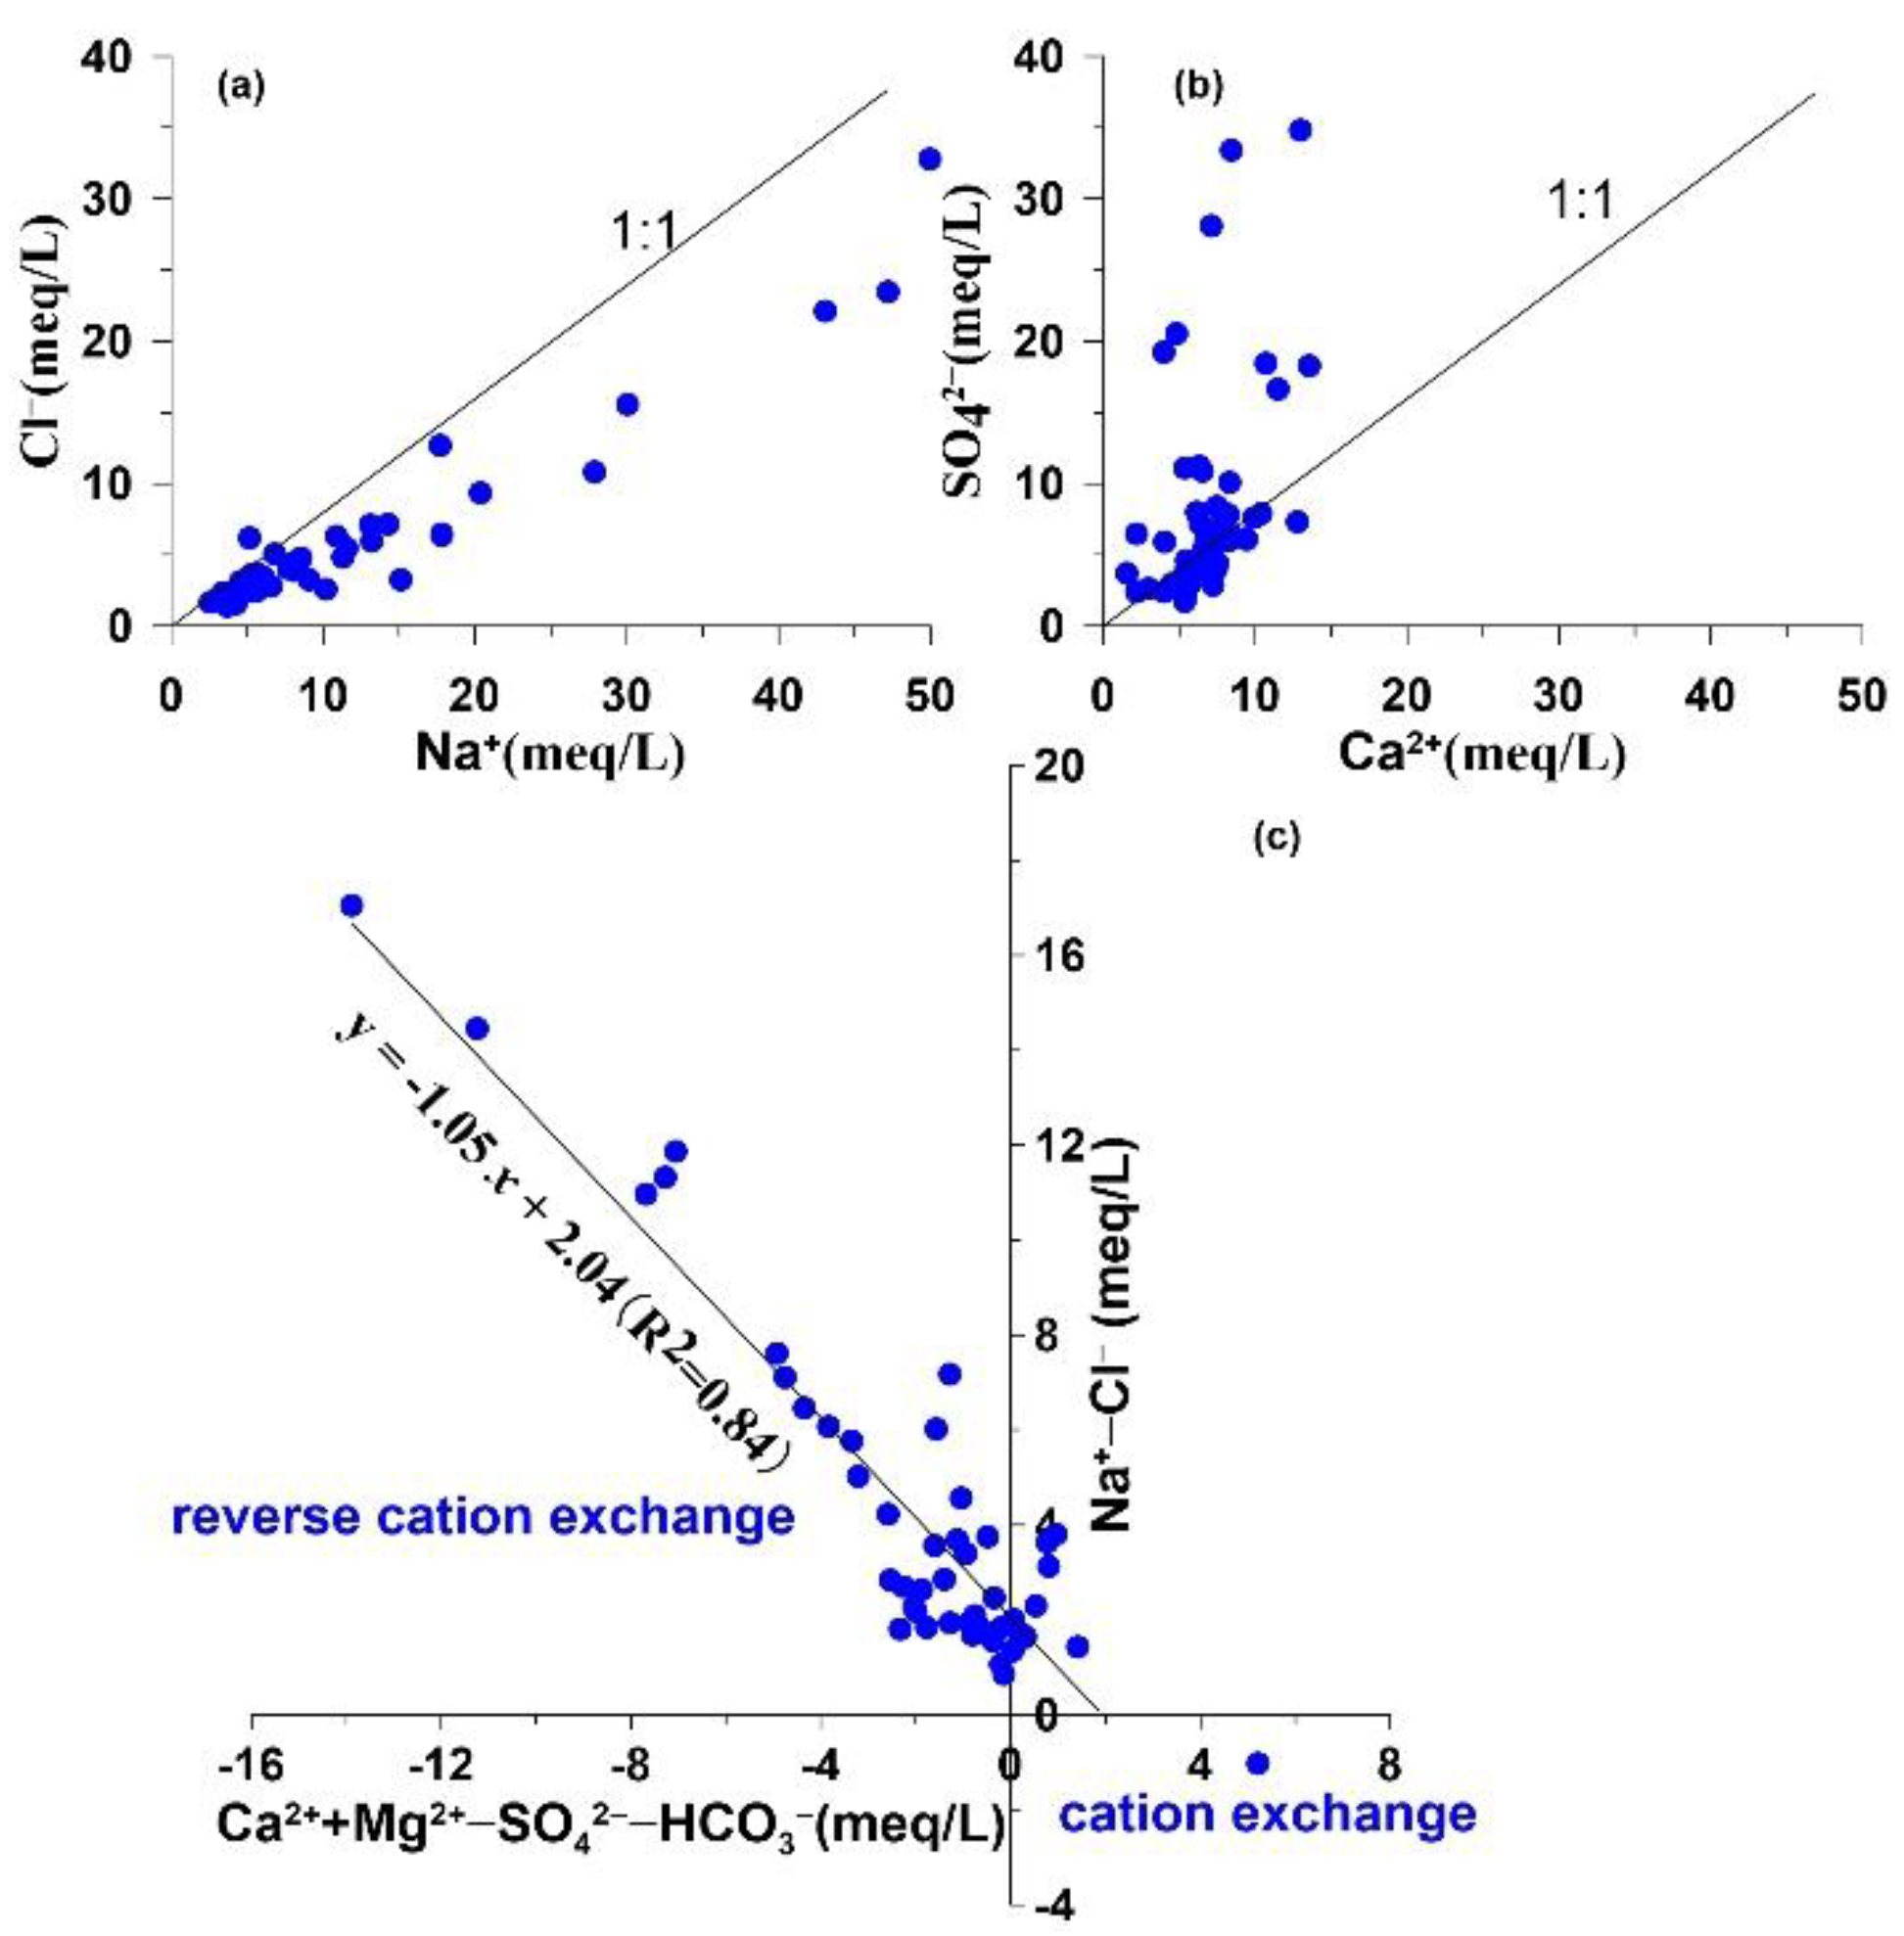
The Na versus Cl plot showed clear enrichment of Na in the groundwater samples (Figure 5a). The Na/Cl ratios in the study area varied from 0.8 to 4.6, with a mean value of 2.0. In general, the Na/Cl ratio should be approximately equal to 1, if halite dissolution is the only source (Figure 6). The majority of the samples having a higher Na/Cl ratio suggested another possible source of Na+ [15,49]. Silicate weathering may take place under alkaline circumstances (Equations (11) and (12)). Cation exchange processes may also be responsible for the exceeding Na+ in the groundwater [50]. The relation of (Ca2+ + Mg2+ − SO42− − HCO3) (meq/L) to (Na+ − Cl) (meq/L) can better indicate the involvement of ion exchange between groundwater and its host environment. Negative values of (Ca2+ + Mg2+ − SO42− − HCO3)/(Na+ − Cl) are usually used to demonstrate the involvement of cation exchange, inducing the ions absorbed on the surface of fine-grained materials of the aquifers to be replaced by the ions in the solutions [51,52]. In Figure 5, the ratio of this trend in groundwater was −1.05, and the correlation coefficient was 0.84. Results showed that 98% of the groundwater samples were in the field of a reverse ion exchange reaction. This indicates that the reverse cation exchange between Na+ and Ca2+ (Mg2+) has distinct impacts on the ion concentration of groundwater. Excessive Ca2+ and Mg2+ can exchange Na+ from the minerals in the aquifer, causing the concentration of Na+ to increase in the groundwater.
3 Na 1 / 3 Al 7 / 3 Si 11 / 3 O 10 ( OH ) 2 + 30 H 2 O + 6 OH Na + + 7 Al ( OH ) 4 + 11 H 2 SiO 4
4 NaAlSi 3 O 8   +   4 CO 2   +   22 H 2 O 4 Na + + 4 HCO 3   +   Al 4 ( Si 4 O 10 ) ( OH ) 8   +   8 H 4 SiO 4
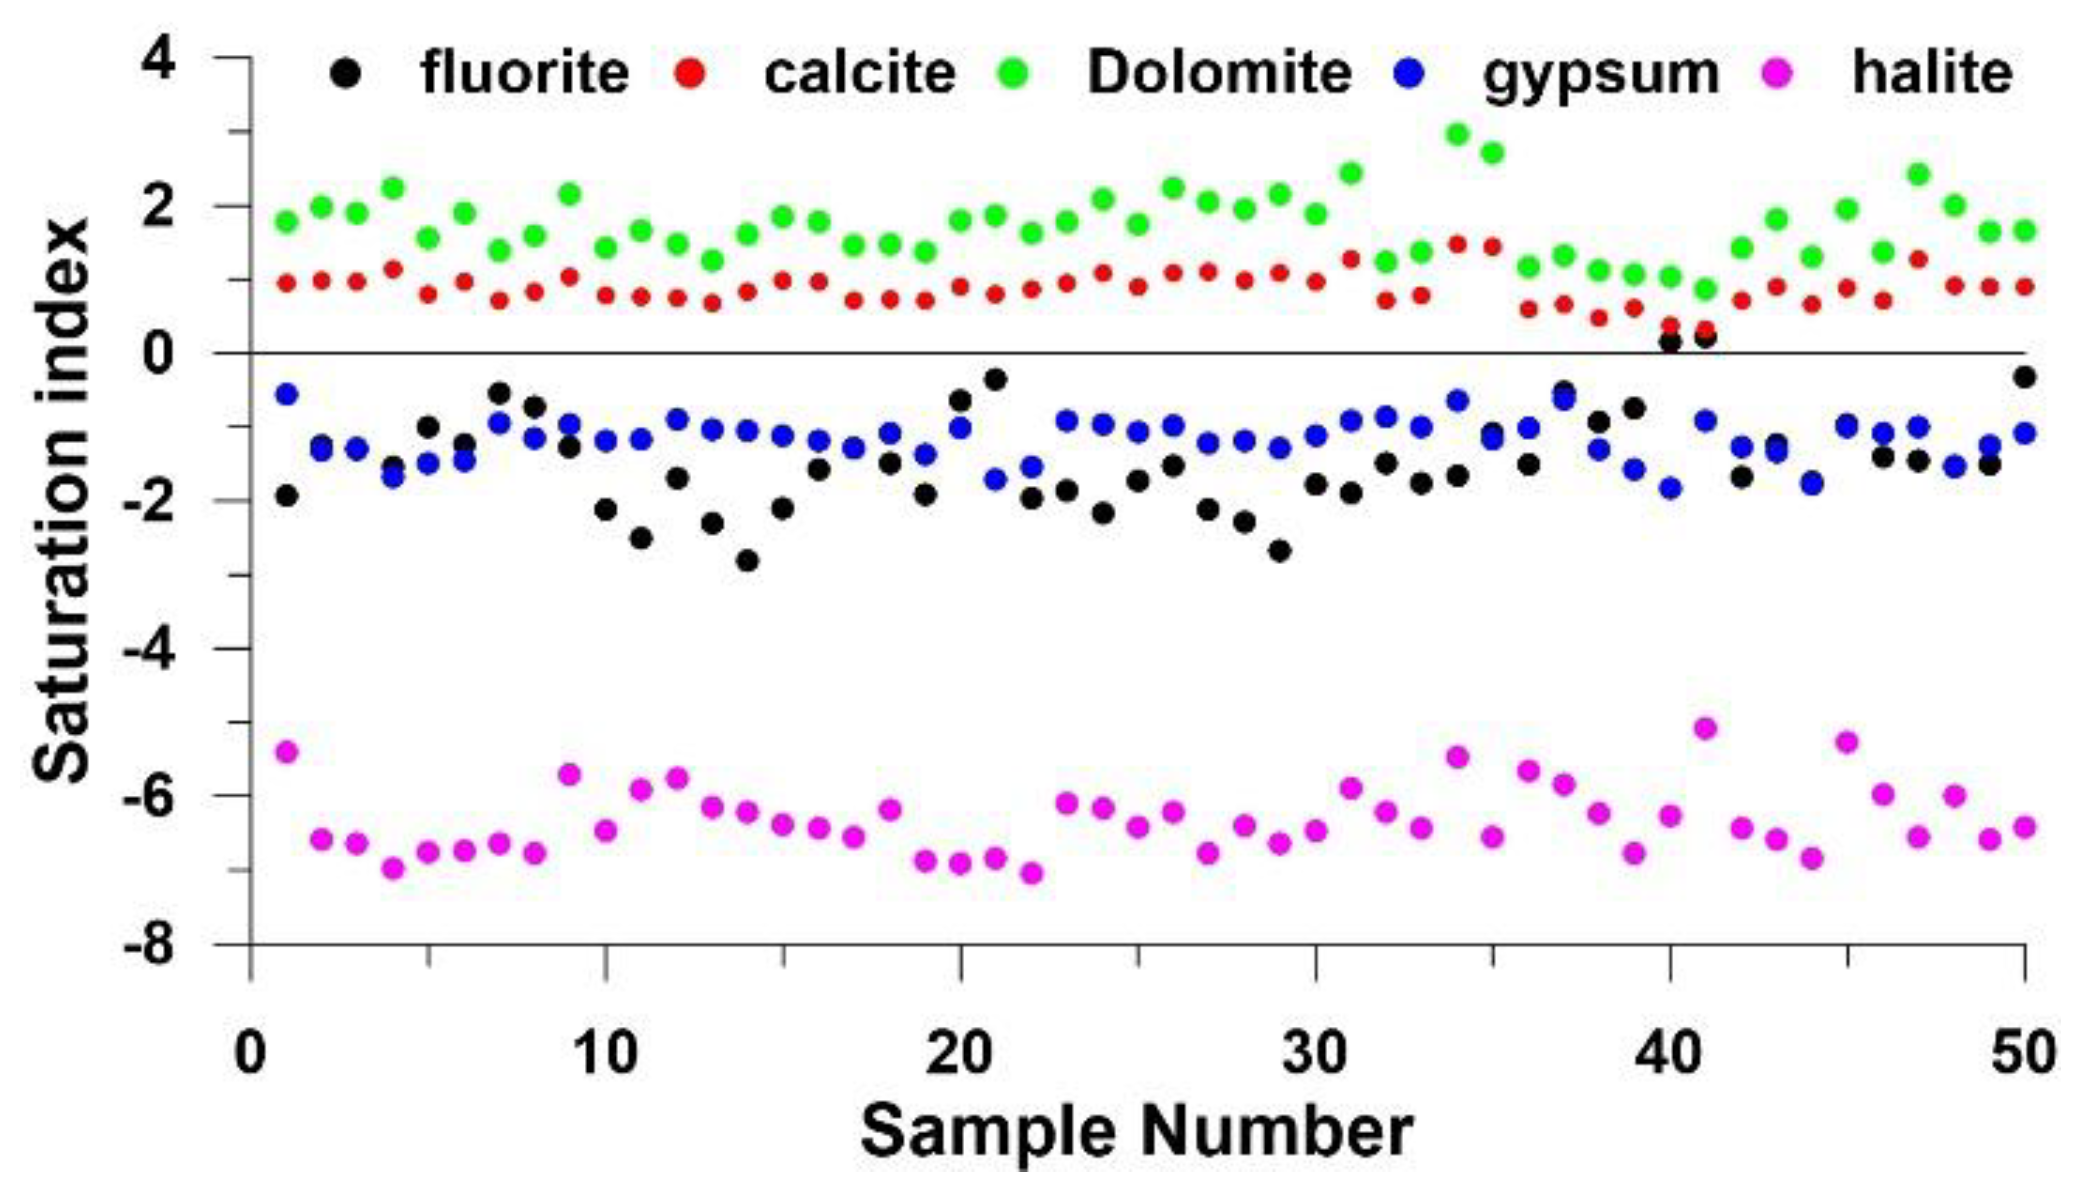
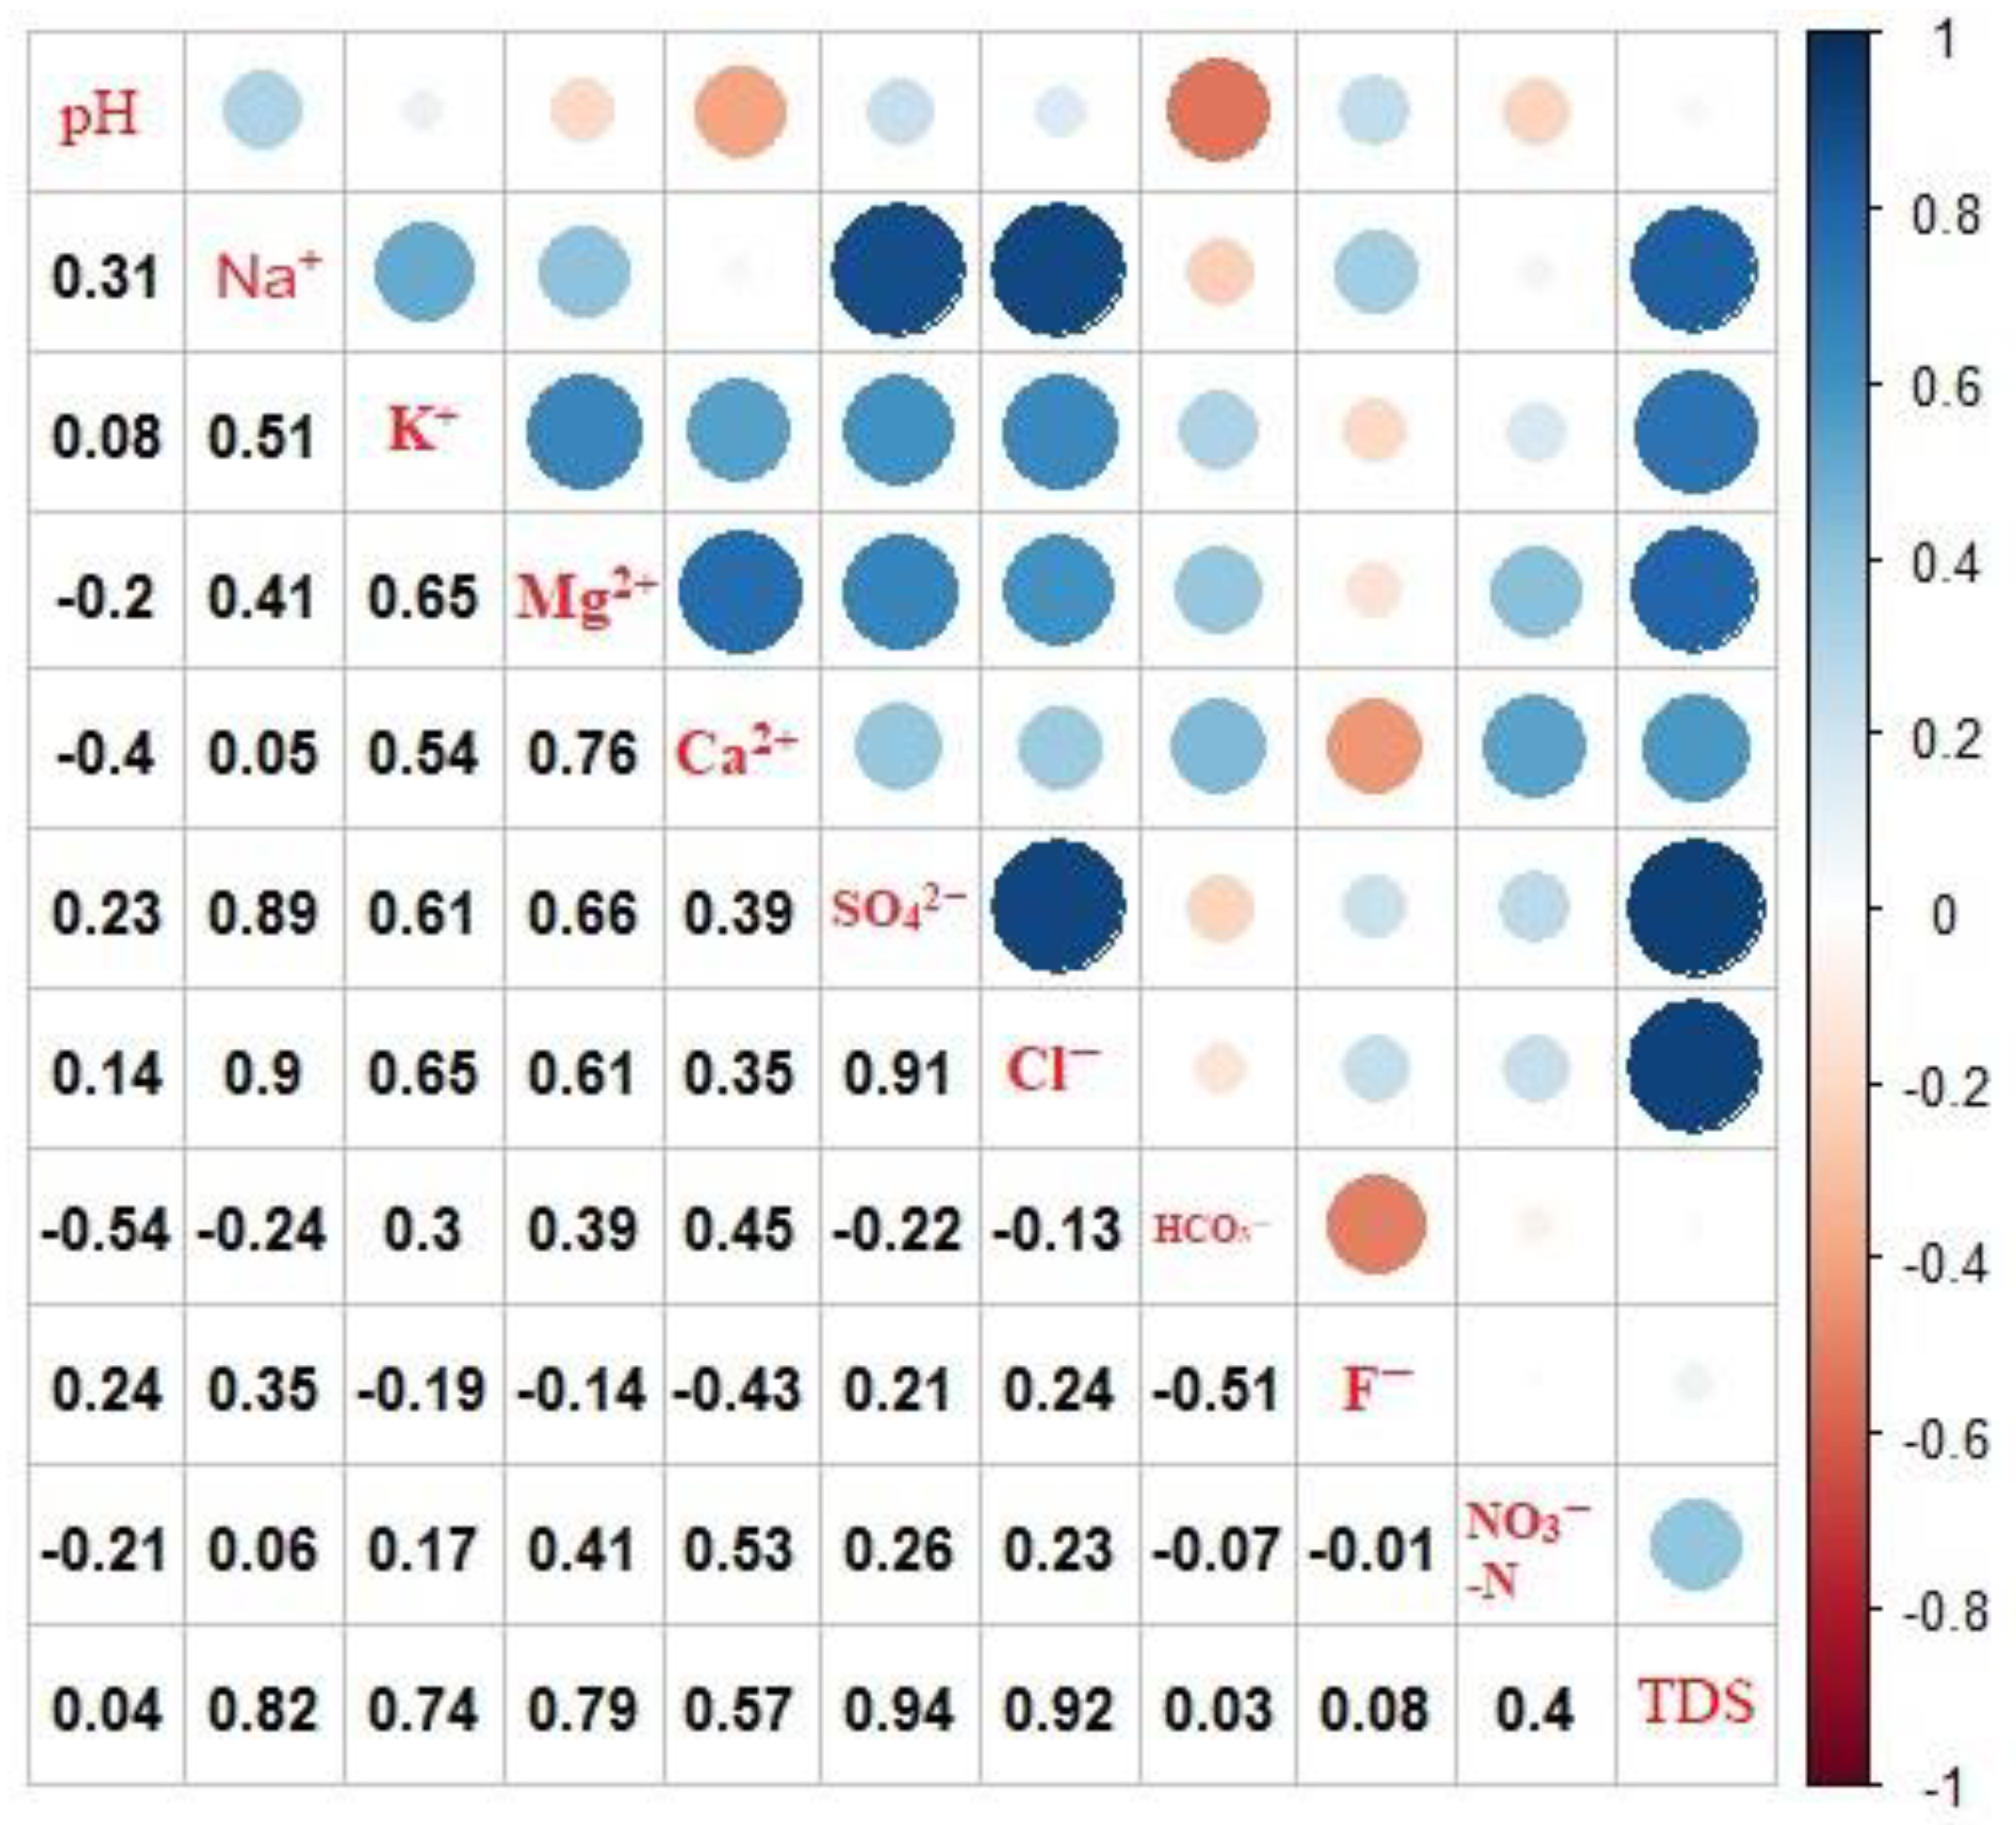
In addition, TDS is associated with the ions’ presence in the water. According to the correlation analysis (Figure 7), TDS showed a strong positive correlation with Na+ (rs = 0.82, p < 0.01), SO42– (rs = 0.94, p < 0.01) and Cl (rs = 0.92, p < 0.01), indicating the dominant contributions of these elements for water salinity. All groundwater samples were undersaturated with respect to gypsum (from −0.55 to −1.82) (Figure 6). Because the cation exchange between Na+ and Ca2+ or Mg2+ will lower the concentration of Ca2+ dissolved in groundwater, the action might be a reasonable contributor to the weak and moderate correlation coefficients between SO42− and Ca2+ (rs = 0.39, p < 0.05) (Figure 5b).

4.3.2. Geogenic Contamination

The relevant score coefficients for Factor 2 were pH, Ca2+, HCO3 and F. It showed positive correlation to pH and F, and negative correlation to Ca2+ and HCO3 (Figure 3b). The presence of ions in groundwater was primarily caused by fluoride contamination, and can thus be termed as a “geogenic contamination factor”.
Fluorine tends to accumulate in an alkaline environment [53,54]. In the study area, the higher pH (mean of 7.81) provided favorable conditions for the dissolution of F-bearing minerals, resulting in the enrichment of F- in the groundwater. This is in agreement with the finding of fluoride distribution in China. According to the 2005–2015 national survey on groundwater quality, fluoride was a considerable part of the geogenic origins of deteriorated water quality. Undrinkable groundwater accounted for 15.0% of the country’s >30 thousand monitored wells [54,55], suggesting that around 29 provinces and 26 million people were affected by high F groundwater [56]. As shown in Figure 6, the SI (saturation index) values of fluorite (CaF2) were all less than zero, and that of calcite and dolomite were the opposite. These values revealed that fluorite resulted from dissolution (13), and that calcite and dolomite were in a precipitated state. In general, the increased concentration of Ca2+ can inhibit the dissolution of CaF2. Under these conditions, it will cause more F- to dissolve, and more Ca2+ to be removed from the groundwater by inverse cation exchange, and the precipitation of calcite and dolomite. The concentration of HCO3 can accelerate the dissolution of fluoride in groundwater (14). Similar results were detected in other studies [57,58,59].
CaF Ca 2 +   +   2 F
CaF 2   +   2 HCO 3 CaCO 3   +   H 2 O   +   CO 2 +   2 F

4.3.3. Human-Induced Contamination

Factor 3 had strong loading on NO3-N (Figure 3c). Nitrate in groundwater was mainly derived from anthropogenic activities, and it can thus be termed an “human-induced interaction factor”.
China consumes about 30% of the global anthropogenic N fixation on only 7% of the world’s land base [60]. More importantly, the average rate of fertilizer applicated in Ningxia (832.81 kg/ha) were far beyond the average rate in the high fertilizer input region of China (339 kg/ha) [9,47]. As shown in Figure 1, the communities in the study area were surrounded by farmland, determining that they have a much higher concentration of farm runoff flowing into the shallow groundwater system. A significant correlation of NO3-N with K+ and Cl was used to indicate the effects of chemical fertilizer application in arable areas [61,62,63,64]. However, it was difficult to distinguish the influences of agricultural activities and waste water disposal on groundwater in the study area (Figure 7).

4.4. Groundwater Suitability for Drinking

EWQI was used to assess groundwater quality for drinking purposes in the study area. The role and contribution of each parameter in water quality assessment were described, with the weights based on entropy information. Parameters with a maximum entropy weight and a minimum entropy value had the most effect on water quality. As shown in Table 3, Mg2+, Ca2+, SO42−, HCO3 and TDS had more significant effects on groundwater quality in the study area, because these ions had the lower entropy values and higher entropy weights. The entropy weights were 0.159, 0.131, 0.13, 0.119, and 0.107, respectively. Fluoride had the lowest entropy weight (0.057), indicating its minimal influence on drinking water quality. The influence of the parameters on water quality decreased in the order: Mg2+ > Ca2+ > SO42− > HCO3 > TDS > Na+ > K+ > Cl > NO3-N > F.
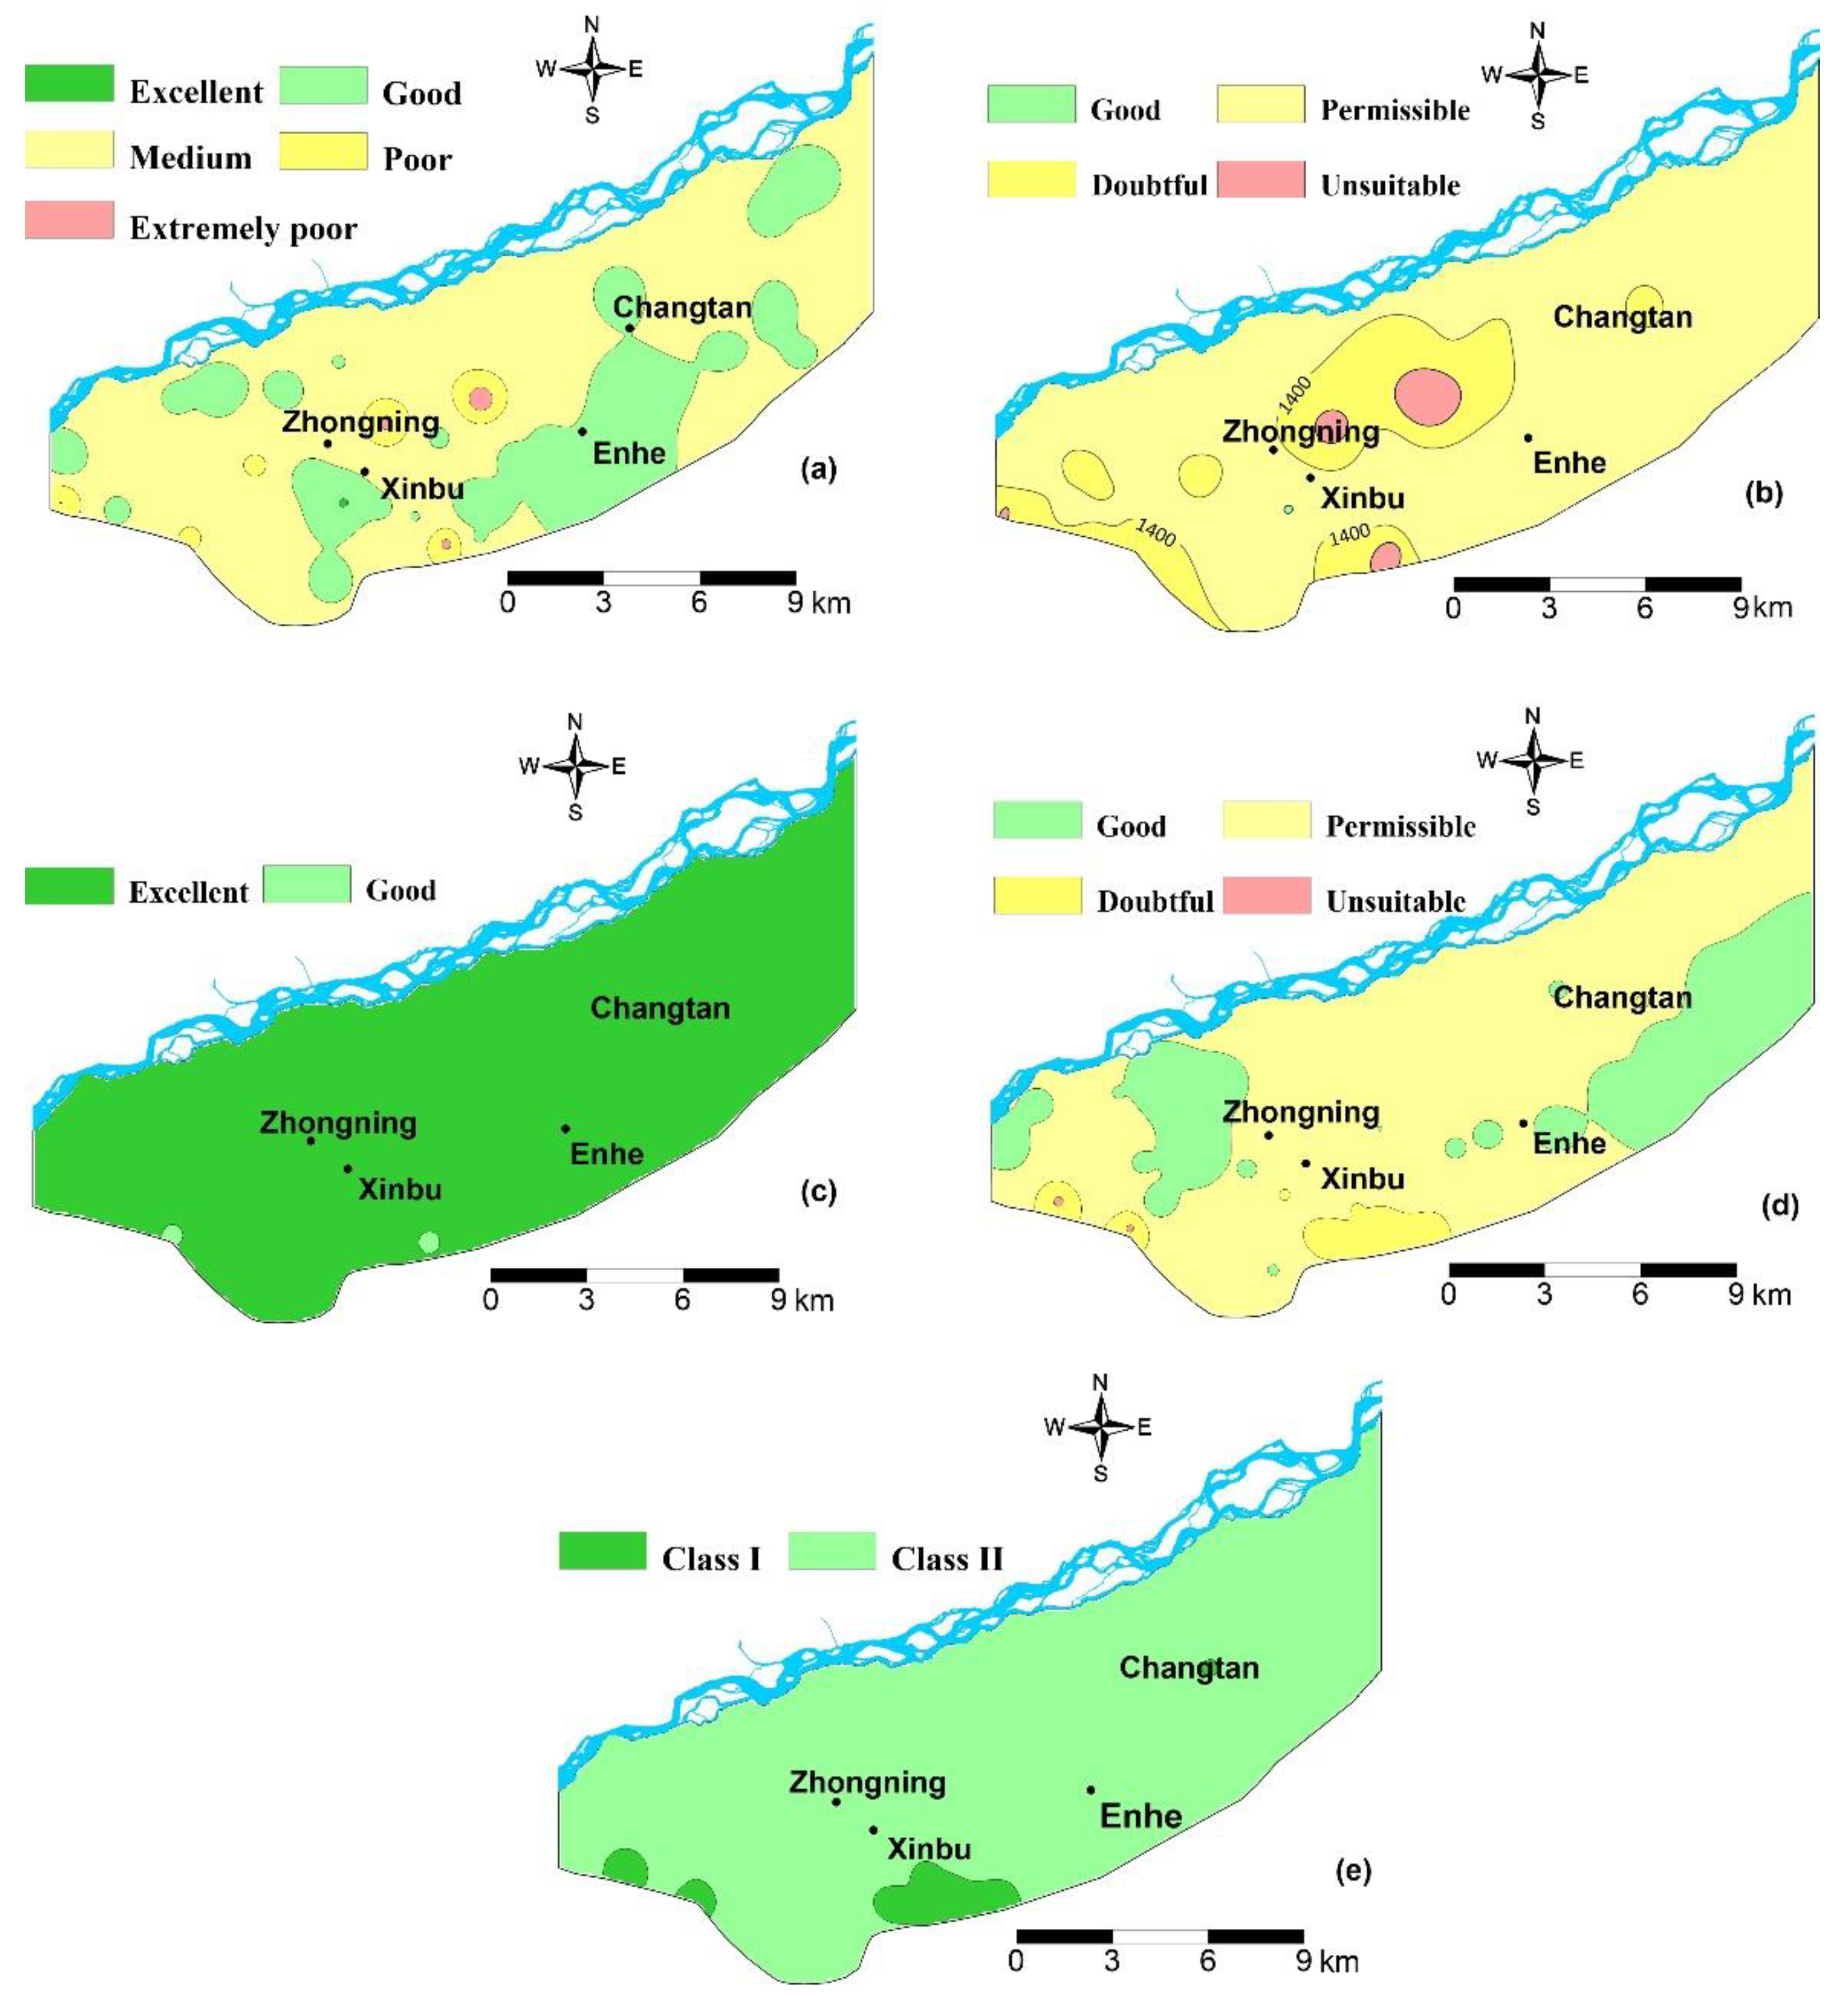
The calculated EWQI values of groundwater were between 45.6 and 231, with a mean value of 112. Of the 50 samples, one sample (W44) was of extremely good quality, and 25 were of good quality, which were suitable for human consumption. However, 48% of the groundwater samples cannot be directly used for drinking purposes. Eighteen samples had medium quality which should be used for drinking purposes before proper treatment. Besides, two samples (W32 and W45) were of poor quality, and four samples were classified as extremely poor-quality water (W1, W34, W37, and W41). The spatial variation of groundwater quality for drinking purpose was shown in Figure 8a. As mentioned above, the greater concentrations of SO42− and Cl were measured in W1, W34, W41, and W45, and the samples of W32 and W34 were characterized by higher concentrations of NO3-N. The greater EWQI values reflected the poor water quality in these sampling locations. Given the scattered points, human activities may probably be responsible for water quality deterioration in these sampling sites. Therefore, more attention should be paid on the variation of sulfate, chloride, and nitrate concentrations in further groundwater management.
Currently, the Chinese government has taken efforts to address the situation by implementing various technical and financial programs to ensure drinking water safety. A major policy plan on water pollution control and clean-up (“Water Ten Plan) was adopted in 2015 [65]. Due to the government-led improvements in water supply and safe drinking water initiatives, it has had a profound influence on the health and livelihoods of millions of Chinese people and the environment [66,67]. In 2017, the addition of 54 chemical parameters was made to the revised national standard for groundwater quality [43]. In this context, findings in this study will contribute to a better understanding of groundwater sustainability in further water management and protection.

4.5 Groundwater Suitability for Irrigation

As the suitability of groundwater for irrigation purposes also depends on its chemical constituents, the salinity hazard (TDS), SAR, Na%, and PI were used to assess the water quality for irrigation. According to the calculated parameters, the groundwater can be classified into various classes, which are shown in Table 4.
Given the intense evaporation and shallow water depth, salt is prone to accumulate in soil in the study area. It may induce salinity hazards, because the roots are unable to absorb water with high concentrations of salt in soil. In general, water salinity is measured by the EC (electric conductivity) or TDS [68]. As shown in Table 4, only one sample was good for irrigation, due to the relative lower values of TDS. The majority of samples (36 samples, 72% of the total samples) were permissible for irrigation (Figure 8b), but nine and four samples belonged to doubtful and unsuitable categories, respectively. This is mainly attributed to the intense evaporation and intensified irrigation activities in the region.
SAR is also considered to be an important parameter for determining the suitability of groundwater for agricultural use. It can be used to indicate alkali/sodium hazards to crops, because the parameter can express the degree of cation exchange reactions in soil when sodium replacing the absorbed magnesium and calcium occurs [69]. Based on the classification by Richards [70], water with SAR values of less than 18 indicated a suitability for irrigation, which did not have, or had a low sodium hazard. The range of 18–26 indicated that the water was harmful for almost all types of soil. If the SAR value was beyond 26, the water was unsuitable for irrigation. The SAR values were in the range of 1.19–12.76 for all of the groundwater samples in the study area. As shown in Table 4 and Figure 8c, 96% of samples belonged to the excellent category, and the remaining samples belonged to the good category.
The sodium percentage is an important factor to indicate the sodium hazard in irrigation water. Sodium tends to displace magnesium and calcium ions in the soil when the concentration of Na+ is high in irrigation water. This exchange process decreases the permeability in soil, and eventually restricts the air and water circulation [71]. Thus, irrigation water with a high Na % may deteriorate the soil structure and reduce its aeration and permeability, causing adverse impacts on crop growth [72]. Wilcox [73] proposed the classification of water quality for irrigation water (Table 4). As shown in Table 4 and Figure 8d, the majority of the groundwater samples were in the permissible category for irrigation purposes. Only six samples had 60% to 80% sodium, showing adverse effects on soil permeability and texture. Two samples (W45 and W48) were harmful for crops, because of their unsuitable sodium percentages.
In addition, PI values can present the permeability of the soil that is affected by Na+, Mg2+, Ca2+, and HCO3, and the soil type. Doneen [74] proposed a permeability index (PI) and classified it into three categories (Table 4). Based on the classification, water with >75% (Class I) PI was good for irrigation, 25–75% (Class II) was suitable, and <25% (Class III) was unsafe water. The decrease of PI has harmful effects on plant growth. It can be seen form Table 4 and Figure 8e that all the samples were suitable for irrigation in the study area. A total of 14% and 86% of the groundwater were designated as Class I and Class II, respectively.
A comparison of the spatial variation of these indices indicated that majority of the samples were permissible for irrigation purposes. However, 26% samples were doubtful and unsuitable for irrigation, because of the high salinity in the water. Therefore, more attention should be paid on groundwater quality monitoring (particularly for water salinity) in the Zhongning area, for ensuring dependable and affordable groundwater, and protecting the quantity available for future use.

5. Conclusions

The interpretation of hydrogeochemical characteristics of 50 groundwater samples in the study area revealed that the groundwater was slightly alkaline in nature. The sequence of the abundance of major ions was found to be in the order of Na+ > Ca2+ > Mg2+ ≫ K+ and SO42− > HCO3 > Cl. Factor analysis determined three major factors controlling groundwater hydrogeochemistry. Water–rock interaction factors had strong loadings on Na+, K+, Mg2+, Cl, SO42−, and TDS. Except for halite dissolution, the occurrence of reverse cation exchange caused an increase of Na+ from the minerals into the groundwater. Na+, SO42−, and Cl, were dominant contributors to water salinity, due to the strong positive correlation between TDS and these parameters. Geogenic contamination factors showed positive correlations to pH and F-, and negative correlations to Ca2+ and HCO3, which was consistent with the dissolution of fluorite minerals. In addition, human-induced interaction factors had strong loadings on NO3-N, indicating the possible effects of agricultural activities and/or sewages disposal on groundwater quality.
The EWQI values of groundwater were in the range of 45.6–231, with a mean value of 112. High weights of Mg2+, Ca2+, SO42−, HCO3, and TDS indicated the leading roles influencing the groundwater quality. Results indicated that 48% of the groundwater samples cannot be directly used for drinking purposes. Due to the greater concentrations of SO42−, Cl, and NO3-N, two samples were of poor quality, and four samples were classified as extremely poor-quality water. Human activities should be responsible for the water quality deterioration. Moreover, the groundwater was suitable for irrigation at most sites by using Na%, SRA, and PI approaches. However, 26% of the samples were doubtful and unsuitable for irrigation, because of the high salinity in water. More attention should be paid on groundwater salinity variations in future management for sustainable utilization.

Author Contributions

Conceptualization, H.Q.; Data curation, J.C.; Formal analysis, J.C. and Y.L.; Funding acquisition, H.Q.; Investigation, J.C. and Y.F.; Methodology, Q.H. and R.L.; Resources, Y.F.; Software, Y.L. and H.M.; Validation, H.Q.; Writing—original draft, J.C.; Writing—review & editing, H.Q.

Funding

We are grateful for the support from the National Natural Science Foundation of China (41572236, 41790441, 41761144059), China Postdoctoral Science Foundation (300204000181), and the Special Fund for Basic Scientific Research of Central Universities (300102298305).

Acknowledgments

Anonymous reviewers and the Editor are sincerely acknowledged for their useful comments.

Conflicts of Interest

The authors declare no conflict of interest.

References

  1. Vadiati, M.; Adamowski, J.; Beynaghi, A. A brief overview of trends in groundwater research: Progress towards sustainability? J. Environ. Manag. 2018, 223, 849–851. [Google Scholar] [CrossRef] [PubMed]
  2. Jakeman, A.; Barreteau, O.; Hunt, R.J.; Rinaudo, J.D.; Ross, A. Integrated Groundwater Management; Springer: Berlin, Germany, 2016. [Google Scholar]
  3. Han, Z. Groundwater resources protection and aquifer recovery in China. Environ. Geol. 2003, 44, 106–111. [Google Scholar] [CrossRef]
  4. Howard, G.J.B.; Pedley, S.; Schmoll, O.; Chorus, I.; Berger, P. Groundwater and Public Health; IWA Publishing; World Health Organization: London, UK, 2006. [Google Scholar]
  5. Villholth, K.G.; Rajasooriyar, L.D. Groundwater Resources and Management Challenges in Sri Lanka—An Overview. Water Resour. Manag. 2010, 24, 1489–1513. [Google Scholar] [CrossRef]
  6. Chen, J.; Qian, H.; Gao, Y.; Li, X. Human Health Risk Assessment of Contaminants in Drinking Water Based on Triangular Fuzzy Numbers Approach in Yinchuan City, Northwest China. Expo. Health 2018, 10, 155–166. [Google Scholar] [CrossRef]
  7. Hosseinifard, S.J.; Aminiyan, M.M. Hydrochemical Characterization of Groundwater Quality for Drinking and Agricultural Purposes: A Case Study in Rafsanjan Plain, Iran. Water Qual. Expo. Health 2015, 7, 531–544. [Google Scholar] [CrossRef]
  8. Hussein, M.T. Hydrochemical evaluation of groundwater in the Blue Nile Basin, Eastern Sudan, using conventional and multivariate techniques. Hydrogeol. J. 2004, 12, 144–158. [Google Scholar] [CrossRef]
  9. Chen, J.; Wu, H.; Qian, H.; Gao, Y. Assessing nitrate and fluoride contaminants in drinking water and their health risk of rural residents living in a semiarid region of Northwest China. Expo. Health 2017, 9, 183–195. [Google Scholar] [CrossRef]
  10. Li, P.; Qian, H.; Zhou, W. Finding harmony between the environment and humanity: An introduction to the thematic issue of the Silk Road. Environ. Earth Sci. 2017, 76, 105. [Google Scholar] [CrossRef]
  11. Christensen, J.N.; Dafflon, B.; Shiel, A.E.; Tokunaga, T.K.; Wan, J.; Faybishenko, B.; Dong, W.; Williams, K.H.; Hobson, C.; Brown, S.T.; et al. Using strontium isotopes to evaluate the spatial variation of groundwater recharge. Sci. Total Environ. 2018, 637–638, 672–685. [Google Scholar] [CrossRef]
  12. World Health Organization (WHO). Guidelines for Drinking Water Quality, 4th ed.; WHO: Geneva, Switzerland, 2011. [Google Scholar]
  13. Mostaza-Colado, D.; Carreño-Conde, F.; Rasines-Ladero, R.; Iepure, S. Hydrogeochemical characterization of a shallow alluvial aquifer: 1 Baseline for groundwater quality assessment and resource management. Sci. Total Environ. 2018, 639, 1110–1125. [Google Scholar] [CrossRef]
  14. Thorburn, P.J.; Biggs, J.S.; Weier, K.L.; Keating, B.A. Nitrate in groundwater of intensive agricultural areas in coastal Northeastern Australia. Agric. Ecosyst. Environ. 2003, 94, 49–58. [Google Scholar] [CrossRef]
  15. Alaya, M.B.; Saidi, S.; Zemni, T.; Zargouni, F. Suitability assessment of deep groundwater for drinking and irrigation use in the Djeffara aquifers (Northern Gabes, South-Eastern Tunisia). Environ. Earth Sci. 2013, 71, 3387–3421. [Google Scholar] [CrossRef]
  16. Xing, L.; Huang, L.; Hou, X.; Yang, L.; Chi, G.; Xu, J.; Zhu, H. Groundwater Hydrochemical Zoning in Inland Plains and its Genetic Mechanisms. Water 2018, 10, 752. [Google Scholar] [CrossRef]
  17. Li, P.; Qian, H.; Howard, K.W.F.; Wu, J. Building a new and sustainable “Silk Road economic belt”. Environ. Earth Sci. 2015, 74, 7267–7270. [Google Scholar] [CrossRef]
  18. Qian, H.; Li, P.; Howard, K.W.F.; Yang, C.; Zhang, X. Assessment of Groundwater vulnerability in the Yinchuan Plain, Northwest China using OREADIC. Environ. Monit. Assess. 2012, 184, 3613–3628. [Google Scholar] [CrossRef] [PubMed]
  19. Fagbote, E.O.; Olanipekun, E.O.; Uyi, H.S. Water quality index of the ground water of bitumen deposit impacted farm settlements using entropy weighted method. Int. J. Environ. Sci. Technol. 2014, 11, 127–138. [Google Scholar] [CrossRef]
  20. Nag, S.K. Evaluation of Hydrochemical Parameters and Quality Assessment of the Groundwater in Gangajalghati Block, Bankura District, West Bengal, India. Arab. J. Sci. Eng. 2014, 39, 5715–5727. [Google Scholar] [CrossRef]
  21. Chen, J.; Wu, H.; Qian, H.; Li, X. Challenges and prospects of sustainable groundwater management in an agricultural plain along the Silk Road Economic Belt, North-West China. Int. J. Water Resour. Dev. 2018, 34, 354–368. [Google Scholar] [CrossRef]
  22. Mohamed, E.A.; Aref, L.; Nassir, A.; Abdulaziz, A. Groundwater characteristics and pollution assessment using integrated hydrochemical investigations GIS and multivariate geostatistical techniques in arid areas. Water Resour. Manag. 2015, 29, 5593–5612. [Google Scholar] [CrossRef]
  23. Li, P.; Qian, H.; Wu, J. Conjunctive use of groundwater and surface water to reduce soil salinization in the Yinchuan Plain, North-West China. Int. J. Water Resour. Dev. 2018, 34, 337–353. [Google Scholar] [CrossRef]
  24. Qian, H.; Li, P.; Wu, J.; Zhou, Y. Isotopic characteristics of precipitation, surface and ground waters in the Yinchuan Plain, Northwest China. Environ. Earth Sci. 2013, 70, 57–70. [Google Scholar] [CrossRef]
  25. Wang, L.; Hu, F.; Yin, L.; Wan, L.; Yu, Q. Hydrochemical and isotopic study of groundwater in the Yinchuan Plain, China. Environ. Earth Sci. 2013, 69, 2037–2057. [Google Scholar] [CrossRef]
  26. Chen, J.; Qian, H.; Wu, H. Nitrogen contamination in groundwater in an agricultural region along the New Silk Road, Northwest China: Distribution and factors controlling its fate. Environ. Sci. Pollut. Res. Int. 2017, 24, 13154–13167. [Google Scholar] [CrossRef] [PubMed]
  27. Li, P.; Wu, J.; Qian, H.; Lyu, X.; Liu, H. Origin and assessment of groundwater pollution and associated health risk: A case study in an industrial park, Northwest China. Environ. Geochem. Health 2014, 36, 693–712. [Google Scholar] [CrossRef] [PubMed]
  28. Li, P.; Wu, J.; Qian, H.; Zhang, Y.; Yang, N.; Jing, L.; Yu, P. Hydrogeochemical Characterization of Groundwater in and Around a Wastewater Irrigated Forest in the Southeastern Edge of the Tengger Desert, Northwest China. Expo. Health 2016, 8, 331–348. [Google Scholar] [CrossRef]
  29. Abbasi, T.; Abbasi, S.A. Water Quality Indices; Elsevier: Amsterdam, The Netherlands, 2012. [Google Scholar]
  30. Lumb, A.; Sharma, T.C.; Bibeault, J. A review of genesis and evolution of water quality index (WQI) and some future directions. Water Qual. Expo. Health 2011, 3, 11–24. [Google Scholar] [CrossRef]
  31. Kumar, S.K.; Logeshkumaran, A.; Magesh, N.S.; Godson, P.S.; Chandrasekar, N. Hydro-geochemistry and application of water quality index (WQI) for groundwater quality assessment, Anna Nagar, part of Chennai City, Tamil Nadu, India. Appl. Water Sci. 2015, 5, 335–343. [Google Scholar] [CrossRef]
  32. Shannon, C.E. A Mathematical Theory of Communication. Bell Syst. Tech. J. 1948, 27, 379–423. [Google Scholar] [CrossRef]
  33. Amiri, V.; Rezaei, M.; Sohrabi, N. Groundwater quality assessment using entropy weighted water quality index (EWQI) in Lenjanat. Iran Environ. Earth Sci. 2014, 72, 3479–3490. [Google Scholar] [CrossRef]
  34. Love, D.; Hallbauer, D.; Amos, A.; Hranova, R. Factor analysis as a tool in groundwater quality management: Two Southern African case studies. Phys. Chem. Earth 2004, 29, 1135–1143. [Google Scholar] [CrossRef]
  35. Yu, S.; Shang, J.; Zhao, J.; Guo, H. Factor Analysis and Dynamics of Water Quality of the Songhua River, Northeast China. Water Air Soil Pollut. 2003, 144, 159–169. [Google Scholar] [CrossRef]
  36. Huang, H.; Lu, J. Identification of river water pollution characteristics based on projection pursuit and factor analysis. Environ. Earth Sci. 2014, 72, 3409–3417. [Google Scholar] [CrossRef]
  37. Obeidat, M.M.; Awawdeh, M.; Al-Rub, F.A. Multivariate statistical analysis and environmental isotopes of Amman/Wadi Sir (B2/A7) groundwater, Yarmouk River Basin, Jordan. Hydrol. Process. 2013, 27, 2449–2461. [Google Scholar] [CrossRef]
  38. Mahlknecht, J.; Steinich, B.; Navarro de León, I. Groundwater chemistry and mass transfers in the Independence aquifer, Central Mexico, by using multivariate statistics and mass-balance models. Environ. Geol. 2004, 45, 781–795. [Google Scholar] [CrossRef]
  39. Ministry of Health of PRC, Standardization Administration of PRC. Standard Examination Methods for Drinking Water; GB/T5750-2006; Standards Press of China: Beijing, China, 2006. (In Chinese) [Google Scholar]
  40. Durov, S.A. Natural waters and graphical representation of their composition. Doklady Akademii Nauk SSSR 1948, 59, 87–90. [Google Scholar]
  41. Li, P.; Qian, H.; Wu, J. Groundwater Quality Assessment Based on Improved Water Quality Index in Pengyang County, Ningxia, Northwest China. E-J. Chem. 2010, 7, S209–S216. [Google Scholar]
  42. World Health Organization (WHO). Guidelines for Drinking Water Quality; World Health Organization: Geneva, Switzerland, 2004. [Google Scholar]
  43. Bureau of Quality and Technical Supervision of China. National Standard of the People’s Republic of China: Quality Standard for Groundwater; GB/T 14848-2017; Bureau of Quality and Technical Supervision of China: Beijing, China, 2017. (In Chinese) [Google Scholar]
  44. Prasanth, S.V.S.; Magesh, N.S.; Jitheshlal, K.V.; Chandrasekar, N.; Gangadhar, K. Evaluation of groundwater quality and its suitability for drinking and agricultural usein the coastal stretch of Alappuzha District, Kerala, India. Appl. Water Sci. 2012, 2, 165–175. [Google Scholar] [CrossRef]
  45. Fordyce, F.M.; Vrana, K.; Zhovinsky, E.; Povoroznuk, V.; Toth, G.; Hope, B.C.; Iljinsky, U.; Baker, J. A health risk assessment for fluoride in Central Europe. Environ. Geochem. Health 2007, 229, 83–102. [Google Scholar] [CrossRef]
  46. Wu, J.; Sun, Z. Evaluation of shallow groundwater contamination and associated human health risk in an alluvial plain impacted by agricultural and industrial activities, Mid-West China. Expo. Health 2016, 8, 311–329. [Google Scholar] [CrossRef]
  47. Chen, T.B.; Zen, X.B.; Hu, Q.X. Utilization efficiently of chemical fertilizers among different counties of China. Acta Geogr. Sin. 2002, 57, 531–538. [Google Scholar]
  48. Gibbs, R.J. Mechanisms controlling world’s water chemistry. Science 1970, 170, 1088–1090. [Google Scholar] [CrossRef] [PubMed]
  49. Kumar, M.; Ramanathan, A.L.; Rao, M.S.; Kumar, B. Identification and evaluation of hydrogeochemical process in the groundwater environment of Delhi, India. Environ. Geol. 2006, 50, 1025–1039. [Google Scholar] [CrossRef]
  50. Carol, E.S.; Kruse, E.E.; Laurencena, P.C.; Rojo, A.; Deluchi, M.H. Ionic exchange in groundwater hydrochemical evolution. Study case: The drainage basin of El Pescado creek (Buenos Aires province, Argentina). Environ. Earth Sci. 2012, 65, 421–428. [Google Scholar] [CrossRef]
  51. Ettazarini, S. Processes of water-rock interaction in the Turonian aquifer of Oum Er-Rabia Basin, Morocco. Environ. Geol. 2005, 49, 293–299. [Google Scholar] [CrossRef]
  52. Rajmohan, N.; Elango, L. Identification and evolution of hydrogeochemical processes in the groundwater environment in an area of the Palar and Cheyyar River Basins, Southern India. Environ. Geol. 2004, 46, 47–61. [Google Scholar] [CrossRef]
  53. Wu, J.; Li, P.; Qian, H. Hydrochemical characterization of drinking groundwater with special reference to fluoride in an arid area of China and the control of aquifer leakage on its concentrations. Environ. Earth Sci. 2015, 73, 8575–8588. [Google Scholar] [CrossRef]
  54. Chen, J.; Qian, H.; Wu, H.; Gao, Y.; Li, X. Assessment of arsenic and fluoride pollution in groundwater in Dawukou area, Northwest China, and the associated health risk for inhabitants. Environ. Earth Sci. 2017, 76, 314. [Google Scholar] [CrossRef]
  55. Chinese Academy of Sciences (CAS). Groundwater Sciences; Science Press: Beijing, China, 2018. (In Chinese) [Google Scholar]
  56. Jia, Y.; Xi, B.; Jiang, Y.; Guo, H.; Yang, Y.; Lian, X.; Han, S. Distribution, formation and human-induced evolution of geogenic contaminated groundwater in China: A review. Sci. Total Environ. 2018, 643, 967–993. [Google Scholar] [CrossRef]
  57. Wen, D.; Zhang, F.; Zhang, E.; Wang, C.; Han, S.; Zheng, Y. Arsenic, fluoride and iodine in groundwater of China. J. Geochem. Explor. 2013, 135, 1–21. [Google Scholar] [CrossRef] [Green Version]
  58. Kim, Y.; Kim, J.Y.; Kim, K. Geochemical characteristics of fluoride in groundwater of Gimcheon, Korea: Lithogenic and agricultural origins. Environ. Earth Sci. 2011, 63, 1139–1148. [Google Scholar] [CrossRef]
  59. Moghaddam, A.A.; Fijani, E. Distribution of fluoride in groundwater of Maku area, Northwest of Iran. Environ. Geol. 2008, 56, 281–287. [Google Scholar] [CrossRef]
  60. Cui, S.; Shi, Y.; Groffman, P.M.; Schlesinger, W.H.; Zhu, Y. Centennial-scale analysis of the creation and fate of reactive nitrogen in China (1910–2010). Proc. Natl. Acad. Sci. USA 2013, 110, 2052–2057. [Google Scholar] [CrossRef] [PubMed]
  61. Reddy, A.G.S. Geochemical evaluation of nitrate and fluoride contamination in varied hydrogeological environs of Prakasam district, Southern India. Environ. Earth Sci. 2014, 71, 4473–4495. [Google Scholar] [CrossRef]
  62. Suthar, S.; Bishnoi, P.; Singh, S.; Mutiyar, P.K.; Nema, A.K.; Patil, N.S. Nitrate contamination in groundwater of some rural areas of Rajasthan, India. J. Hazard. Mater. 2009, 171, 189–199. [Google Scholar] [CrossRef]
  63. Esmaeili, A.; Moore, F.; Keshavarzi, B. Nitrate contamination in irrigation groundwater, Isfahan, Iran. Environ. Earth Sci. 2014, 72, 2511–2522. [Google Scholar] [CrossRef]
  64. Zakhem, B.A.; Hafez, R. Hydrochemical, isotopic and statistical characteristics of groundwater nitrate pollution in Damascus Oasis (Syria). Environ. Earth Sci. 2015, 74, 2781–2797. [Google Scholar] [CrossRef]
  65. Policy Plan on Water Pollution Control and Clean-Up, Water Ten Plan, 2015. Available online: http://www.chinawaterrisk.org/notices/new-water-ten-plan-to-safeguard-chinas-waters/ (accessed on 22 Dcecember 2018).
  66. Song, X.; Sun, S.; Zhang, W.; Chen, Y. Study of the optimization of water environment management in China under the background of Water Pollution and Control Plan. Environ. Prot. Sci. 2017, 43, 51–57. (In Chinese) [Google Scholar]
  67. Han, D.; Currell, M.J.; Cao, G. Deep challenges for China’s war on water pollution. Environ. Pollut. 2016, 218, 1222–1233. [Google Scholar] [CrossRef]
  68. Fipps, G. Irrigation Water Quality Standards and Salinity Management Strategies; Texas Cooperative Extension, The Texas A&M University System: College Station, TX, USA, 1914. [Google Scholar]
  69. Wilcox, L.V. Classification and Use of Irrigation Water; Agriccirc 969; United States Department of Agriculture (USDA): Washington, DC, USA, 1955.
  70. Subramani, T.; Elango, L.; Damodarasamy, S.R. Groundwater quality and its suitability for drinking and agricultural use in Chithar River Basin, Tamil Nadu, India. Environ. Geol. 2005, 47, 1099–1110. [Google Scholar] [CrossRef]
  71. Kumar, M.; Kumari, K.; Ramanathan, A.L.; Saxena, R. A comparative evaluation of groundwater suitability for irrigation and drinking purposes in two intensively cultivated districts of Punjab, India. Environ. Geol. 2007, 53, 553–574. [Google Scholar] [CrossRef]
  72. Bouderbala, A.; Gharbi, B.Y. Hydrogeochemical characterization and groundwater quality assessment in the intensive agricultural zone of the Upper Cheliff Plain, Algeria. Environ. Earth Sci. 2017, 76, 744. [Google Scholar] [CrossRef]
  73. Richards, L.A. Diagnosis and Improvement of Saline Alkali Soils: Agriculture; Handbook 60; US Department of Agriculture: Washington, DC, USA, 1954.
  74. Doneen, L.D. Notes on Water Quality in Agriculture; Published as a Water Science and Engineering Paper 4001; Department of Water Science and Engineering, University of California: Oakland, CA, USA, 1964. [Google Scholar]
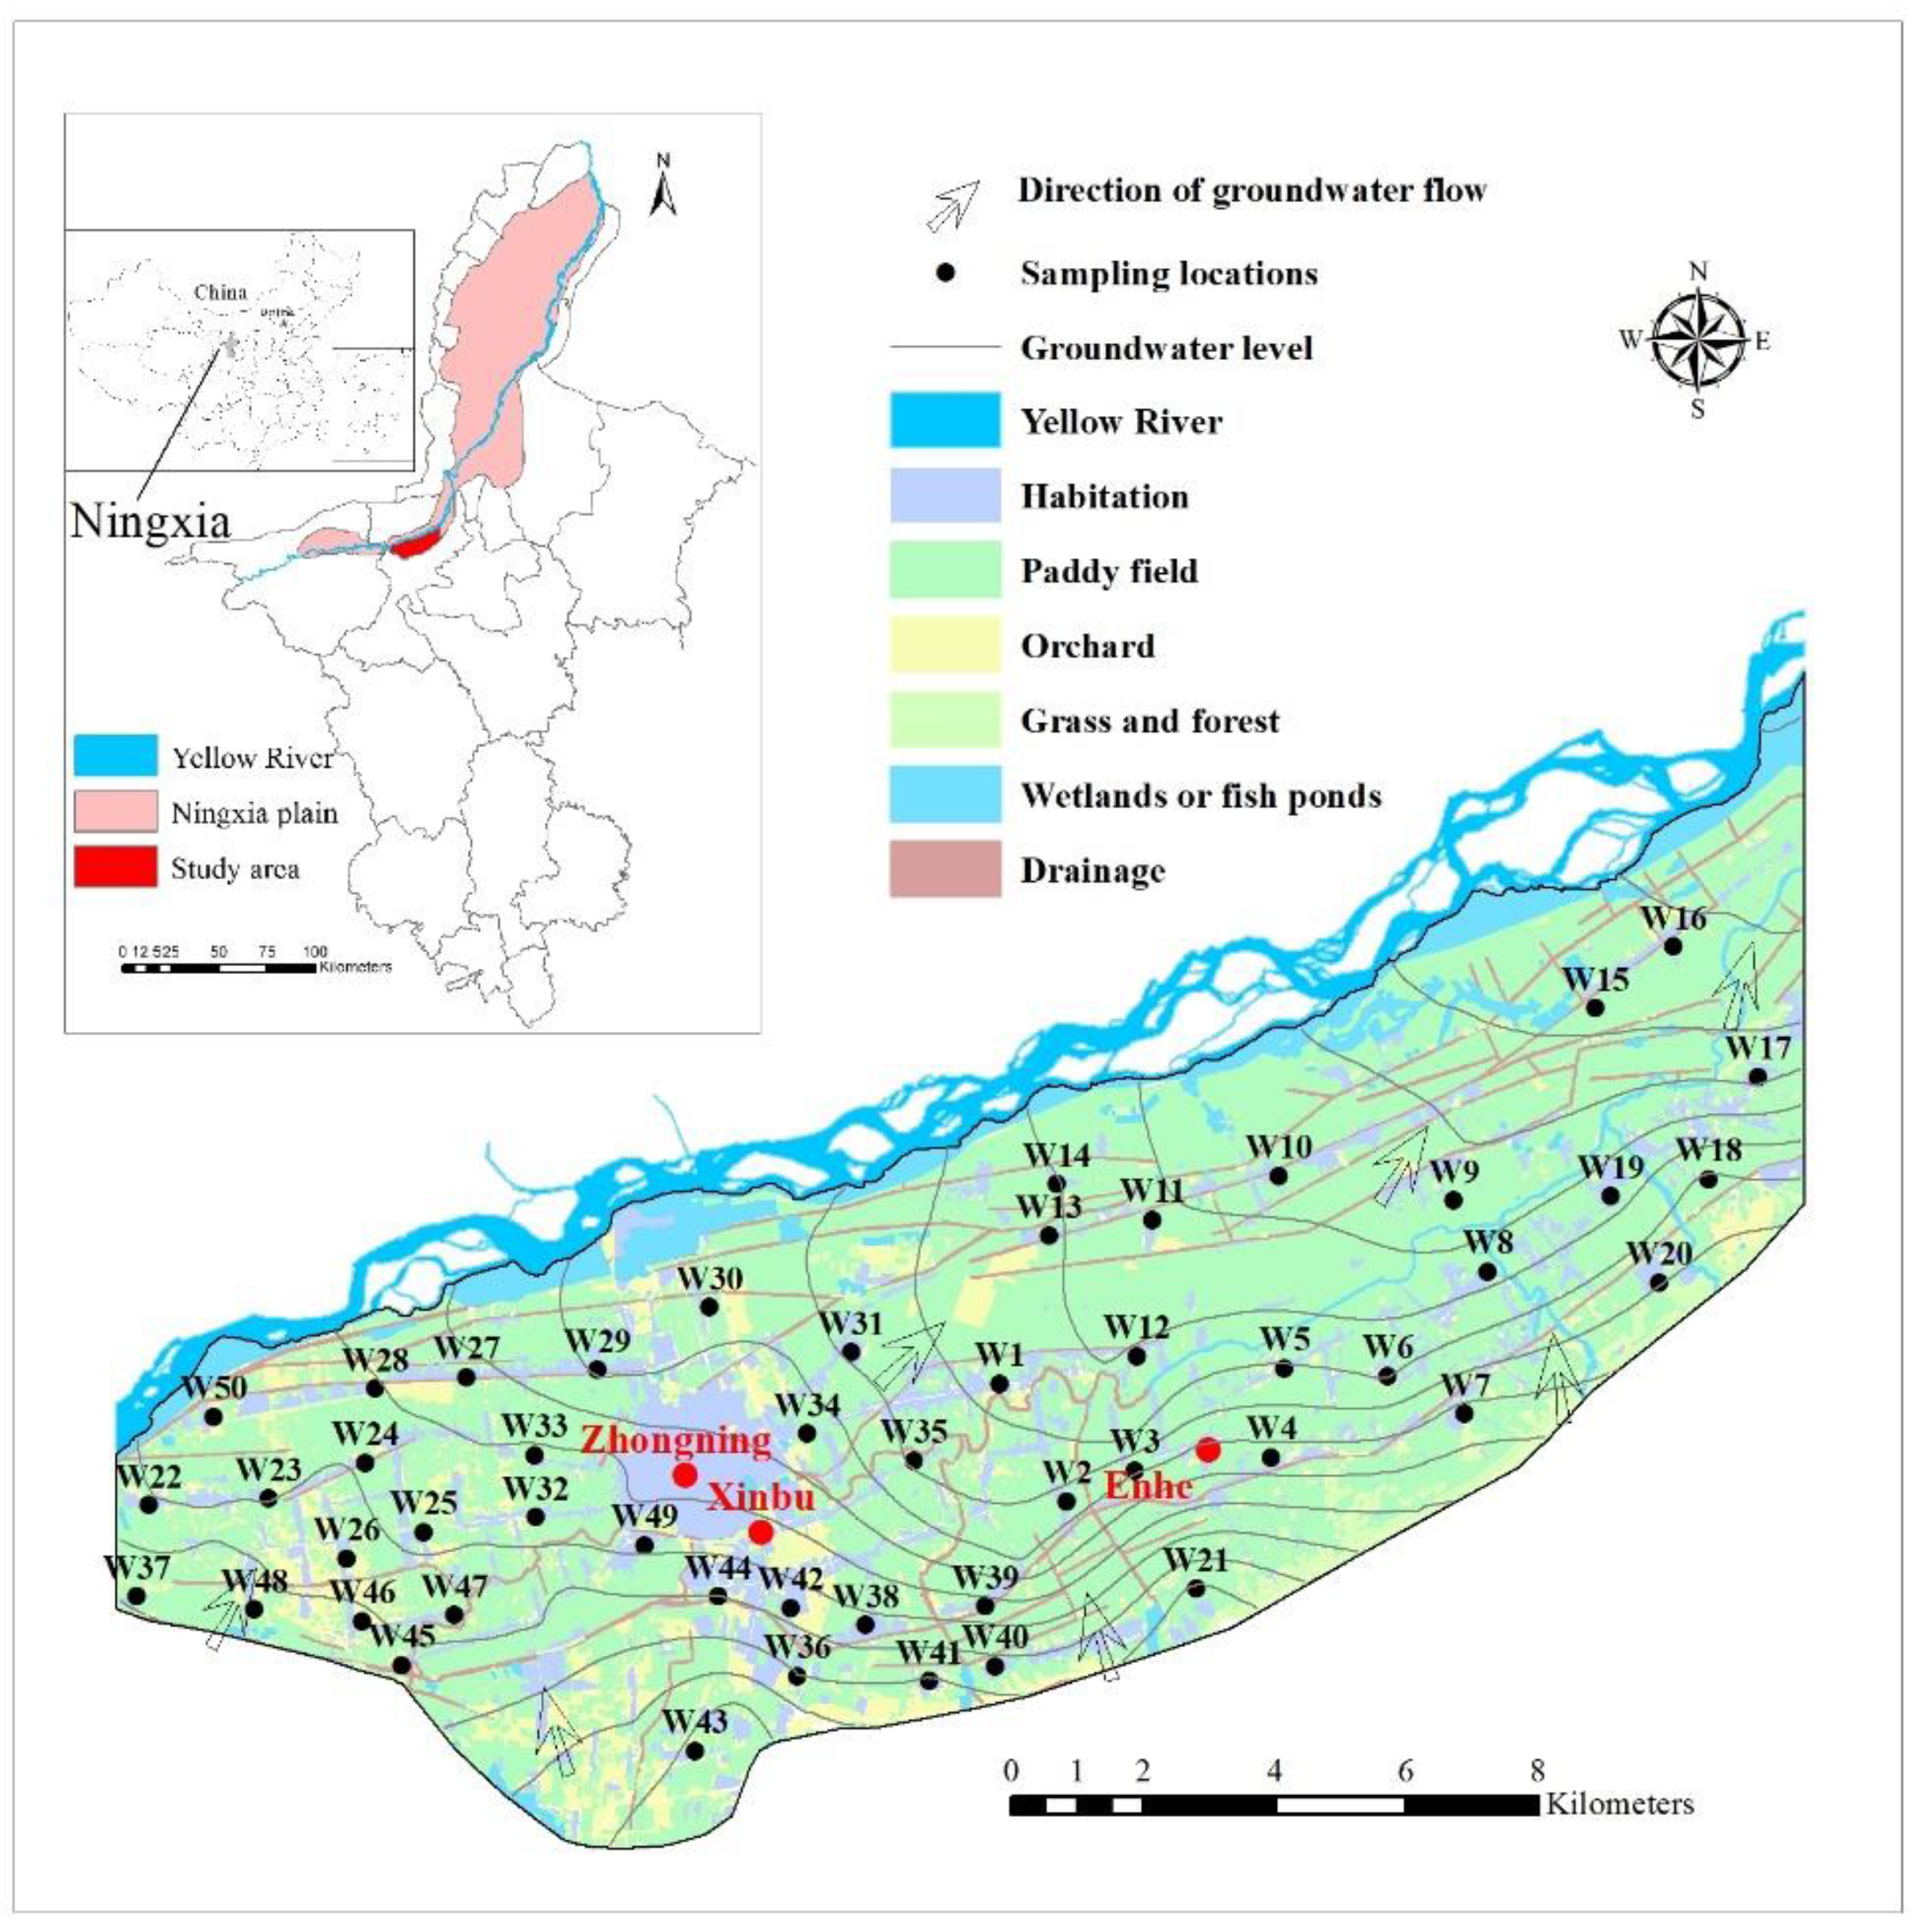
Figure 1. Location map of the Zhongning area and sampling wells.
Water 11 00096 g001
Figure 2. Durov diagram of the groundwater in the Zhongning area.
Water 11 00096 g002
Figure 3. Varimax rotated factor scores of groundwater in the study area. (a) Factor 1, water–rock interactions; (b) Factor 2, geogenic contamination; (c) Factor 3, human-induced contamination.
Water 11 00096 g003
Figure 4. Gibbs diagram of the groundwater samples.
Water 11 00096 g004
Figure 5. Plots of Na+ vs. Cl (a), Ca2+ vs. SO42− (b), and (Ca2+ + Mg2+ − SO42− − HCO3) vs. (Na+ − Cl) in the groundwater (meq/L) (c).
Water 11 00096 g005
Figure 6. Saturation index of different minerals (halite, calcite, dolomite, gypsum, and fluoride) in groundwater samples.
Water 11 00096 g006
Figure 7. Correlation diagram of the chemical parameters.
Water 11 00096 g007
Figure 8. Distributed map of EWQI (a), TDS (b), SAR (c), Na% (d), and PI (e) in the Zhongning area.
Water 11 00096 g008
Table 1. Groundwater quality classification for drinking based on the entropy-weighted water quality index (EWQI) value.
EWQIWater Quality
<50Excellent
50–100Good
100–150Medium
150–200Poor
>200Extremely poor
Table 2. Statistical analysis of physicochemical parameters of the groundwater samples.
ParametersUnitMinMaxMeanSDWHO Guideline (2011)Chinese Guideline
pH-7.08.57.80.286.5–8.56.5–8.5
TDSmg/L4682560122551510001000
Na+mg/L58.5691189138200-
K+mg/L1.7216.35.232.9310 *-
Ca2+mg/L30.925513649.375 *-
Mg2+mg/L21.311664.720.230 *-
Clmg/L49.7553148102250250
SO42−mg/L82986328218250250
HCO3mg/L170661459125300 *-
NO3-Nmg/L2.6610317.918.31020
Fmg/L0.116.330.851.141.51.0
* Based on WHO guideline in 2004 [42].
Table 3. Entropy weights for the parameters.
ParameterEntropy Value
Na+0.092
K+0.073
Mg2+0.159
Ca2+0.131
SO42−0.130
Cl0.073
HCO30.119
F0.057
NO3-N0.060
TDS0.107
Table 4. Groundwater quality classification for drinking and irrigation purposes.
Classification PatternCategoriesRangesNO. of Samples
EWQIExcellent<501
Good 50–10025
Medium 100–15018
Poor150–2002
Extremely poor>2004
Salinity hazard (TDS)Excellent<1750
Good175–5251
Permissible525–140036
Doubtful1400–21009
Unsuitable>21004
Sodium adsorption ration (SAR)Excellent0–1048
Good10–182
Fair18–260
Poor>260
Sodium percentage (Na%)Excellent0–200
Good20–4023
Permissible40–6019
Doubtful60–806
Unsuitable>802
Permeability index (PI)Class I>757
Class II25–7543
Class III<250