Hydrogeochemical Characteristics and Quality Assessment of Groundwater in an Irrigated Region, Northwest China

 ,
,
Abstract
1. Introduction
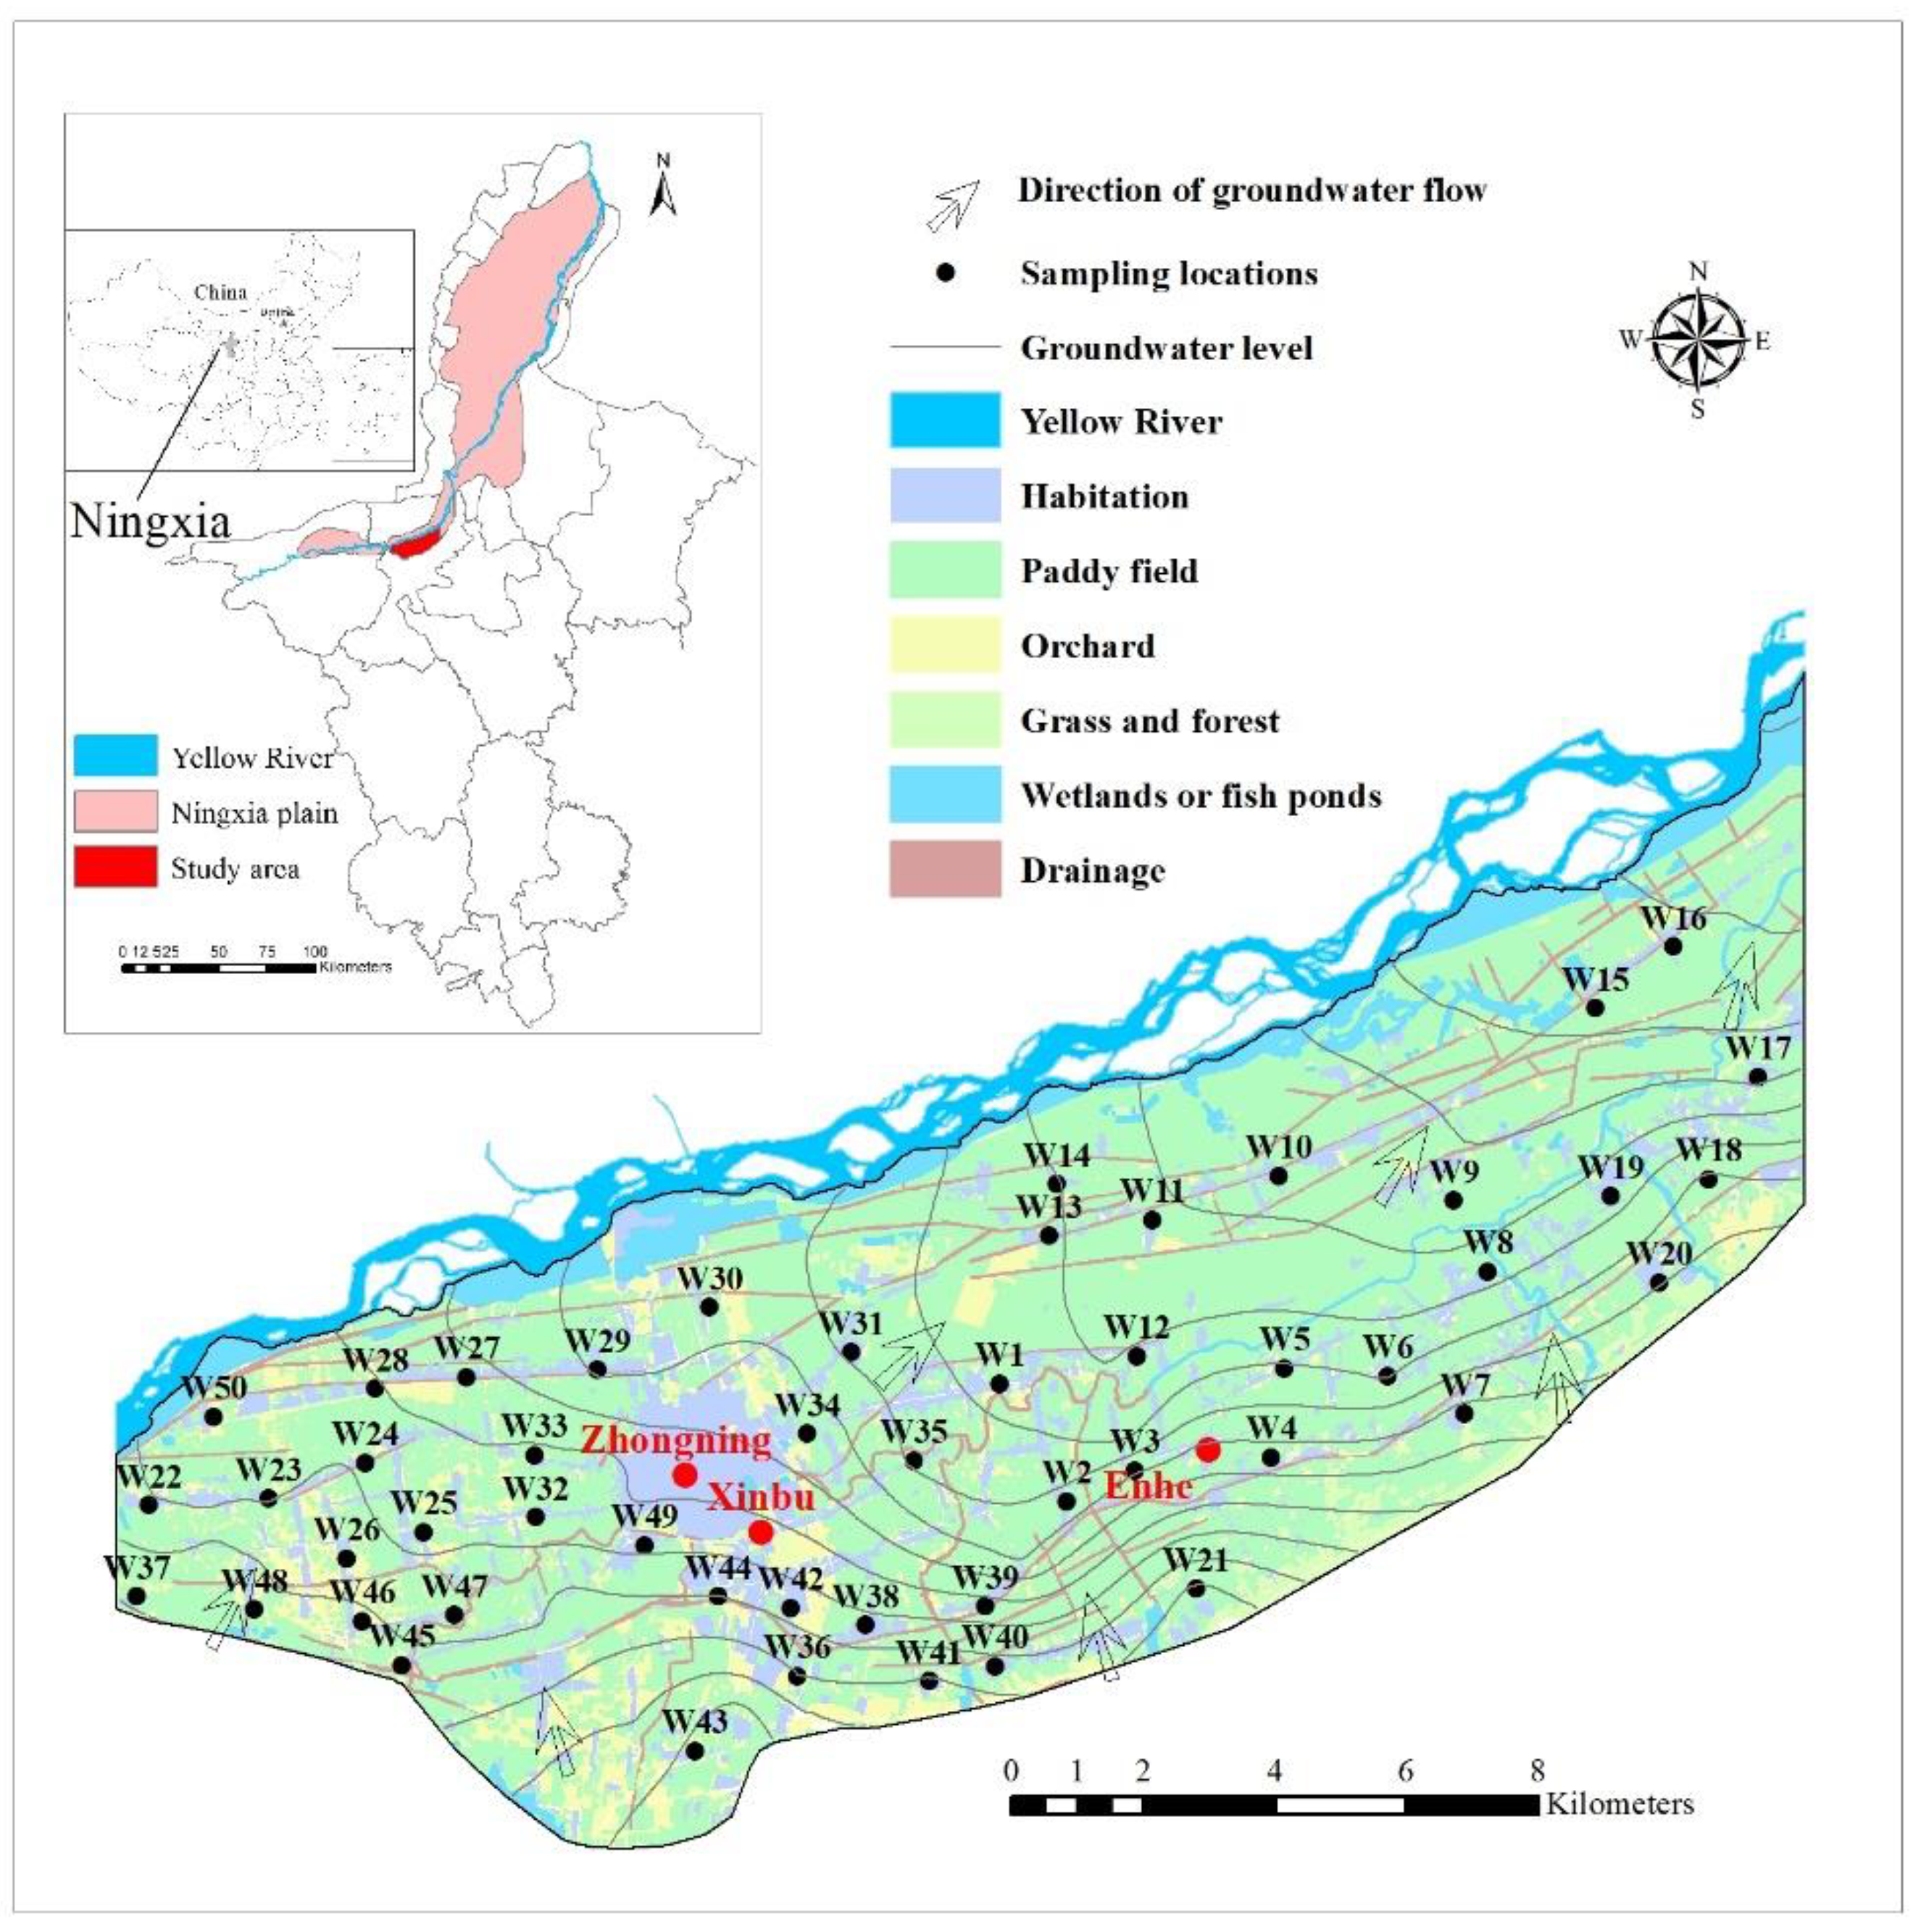
2. Study Area
3. Materials and Methods
3.1. Sample Collection and Analysis
3.2. Data Treatment and Water Quality Assessment Method
3.2.1. Entropy-Weighted Water Quality Index
3.2.2. Evaluation of Groundwater Quality for Irrigation Purposes
4. Results and Discussion
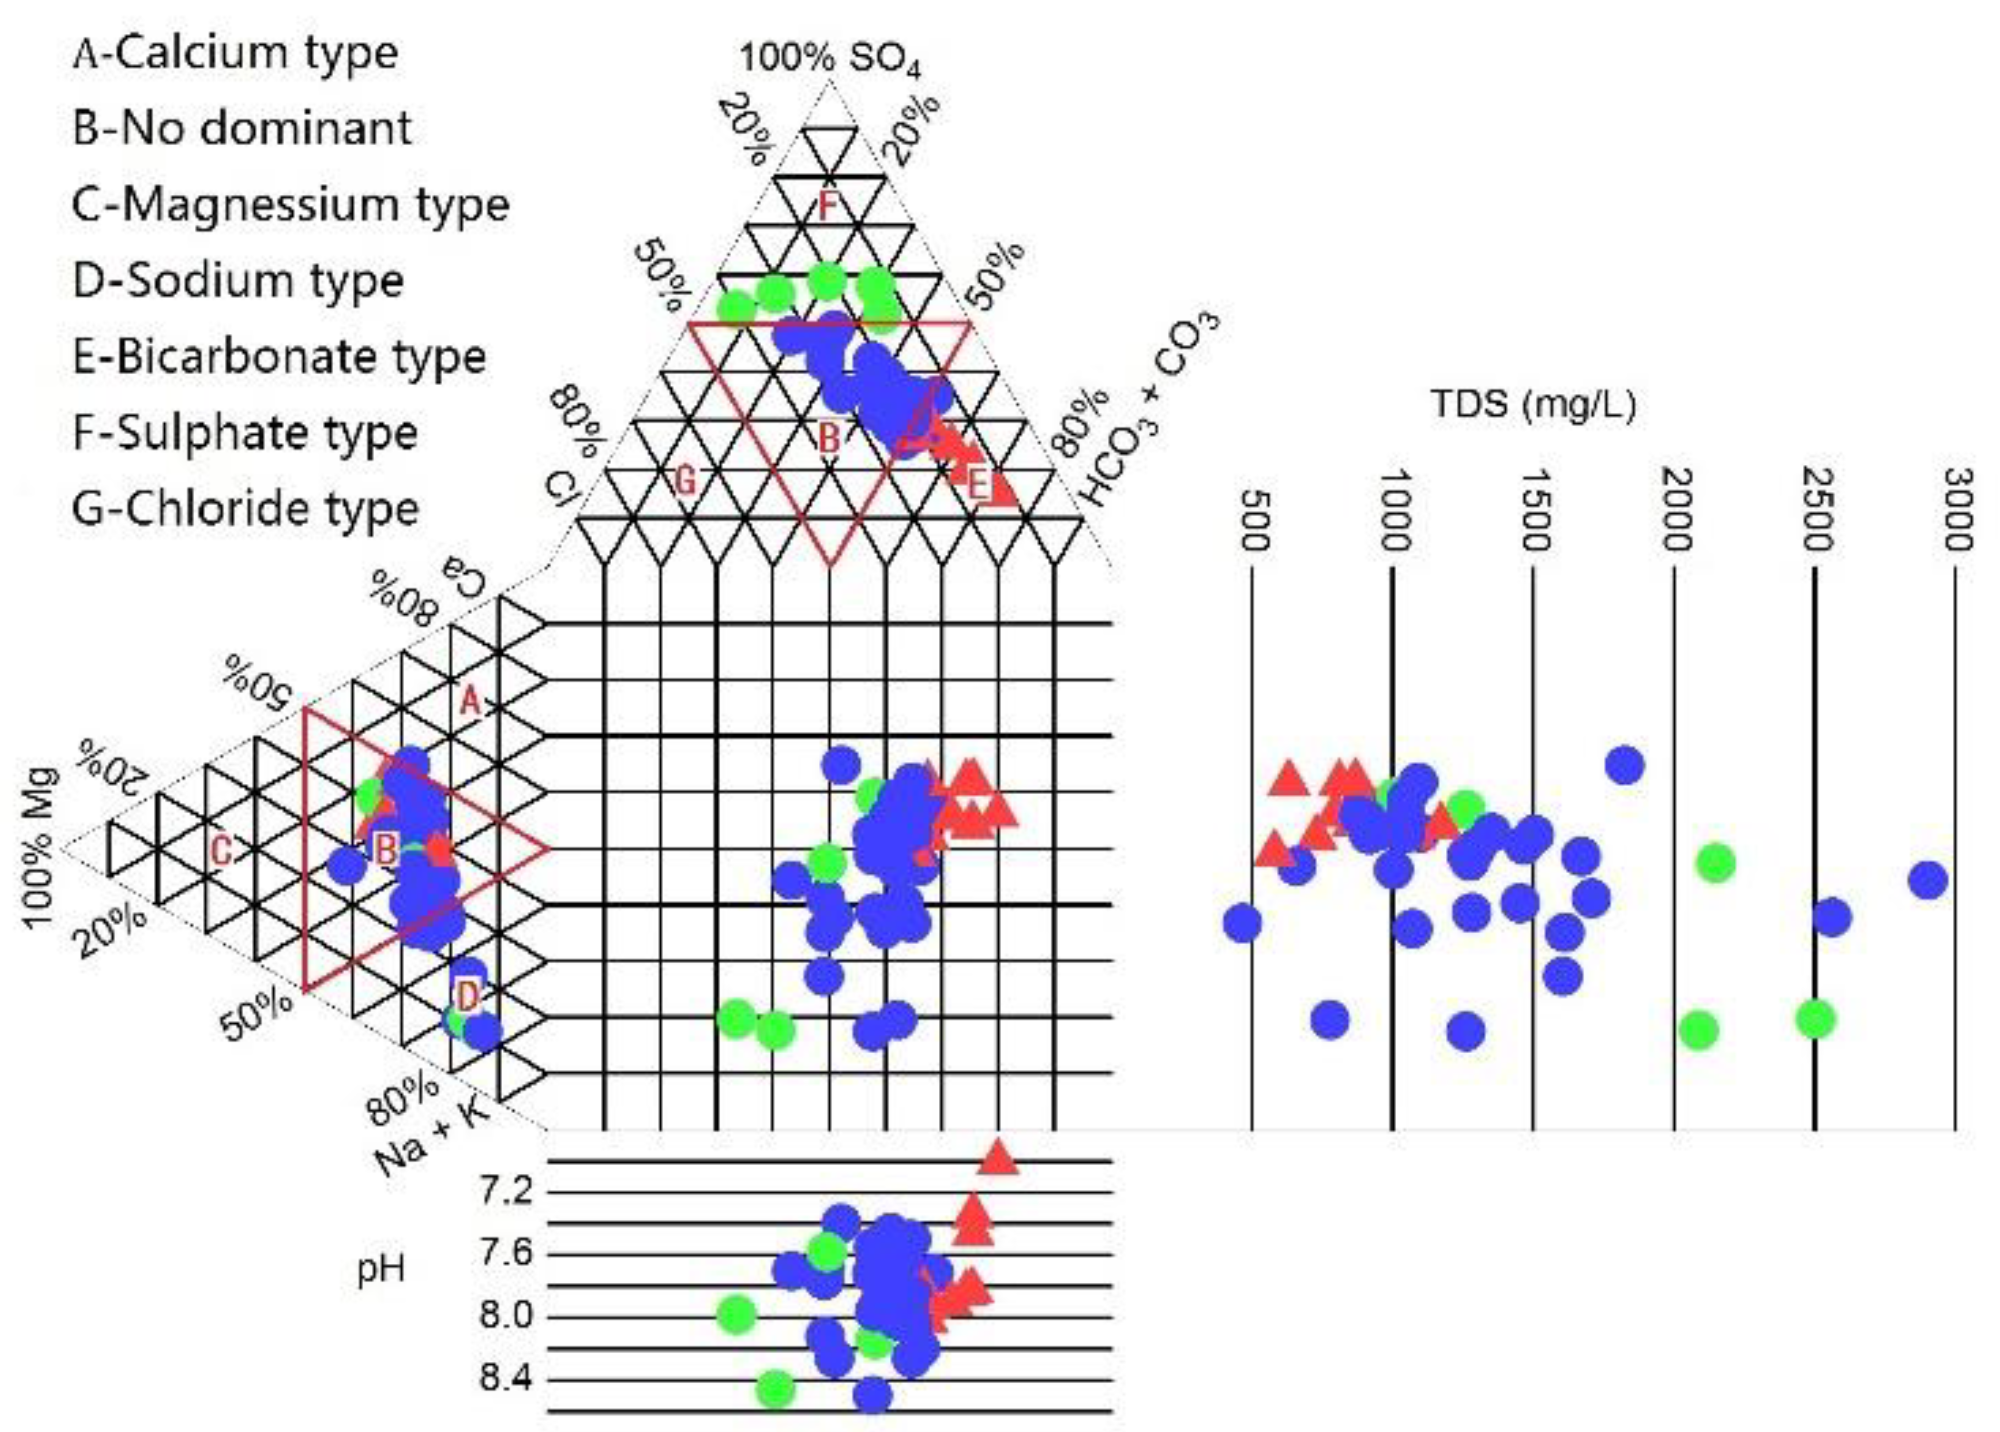
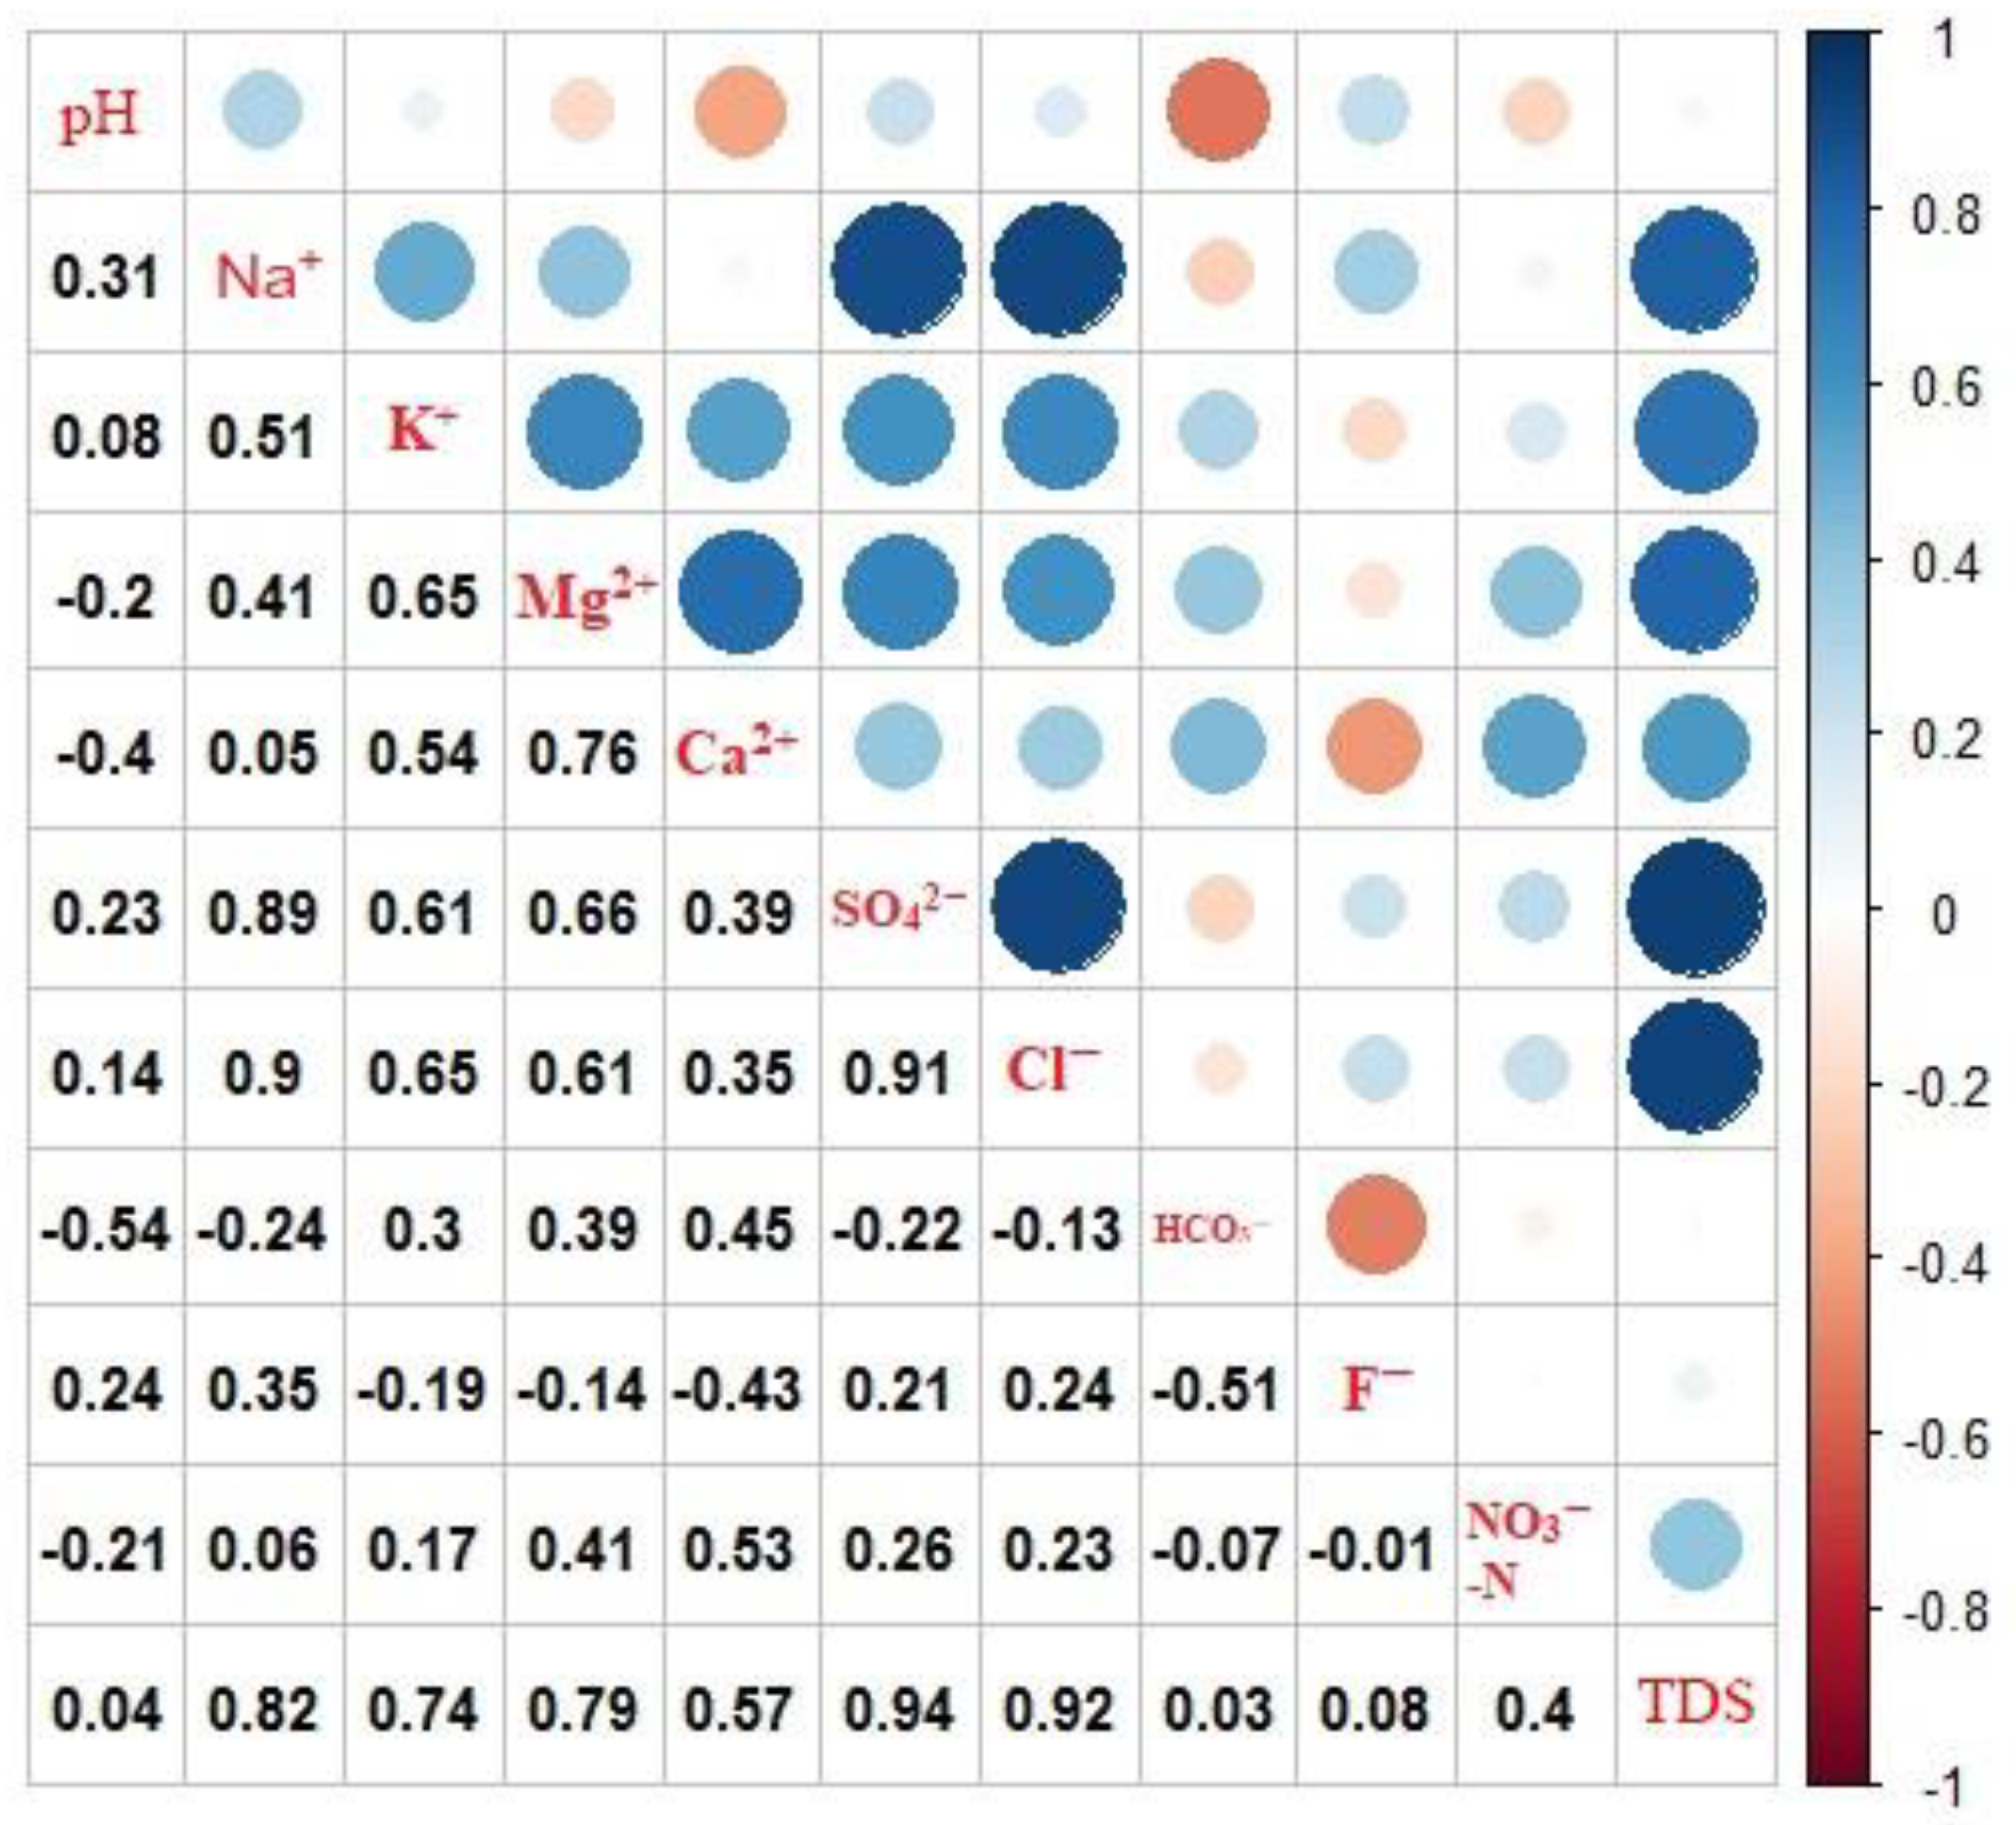
4.1. Chemical Compositions of Groundwater
4.2. Hydrogeochemical Facies
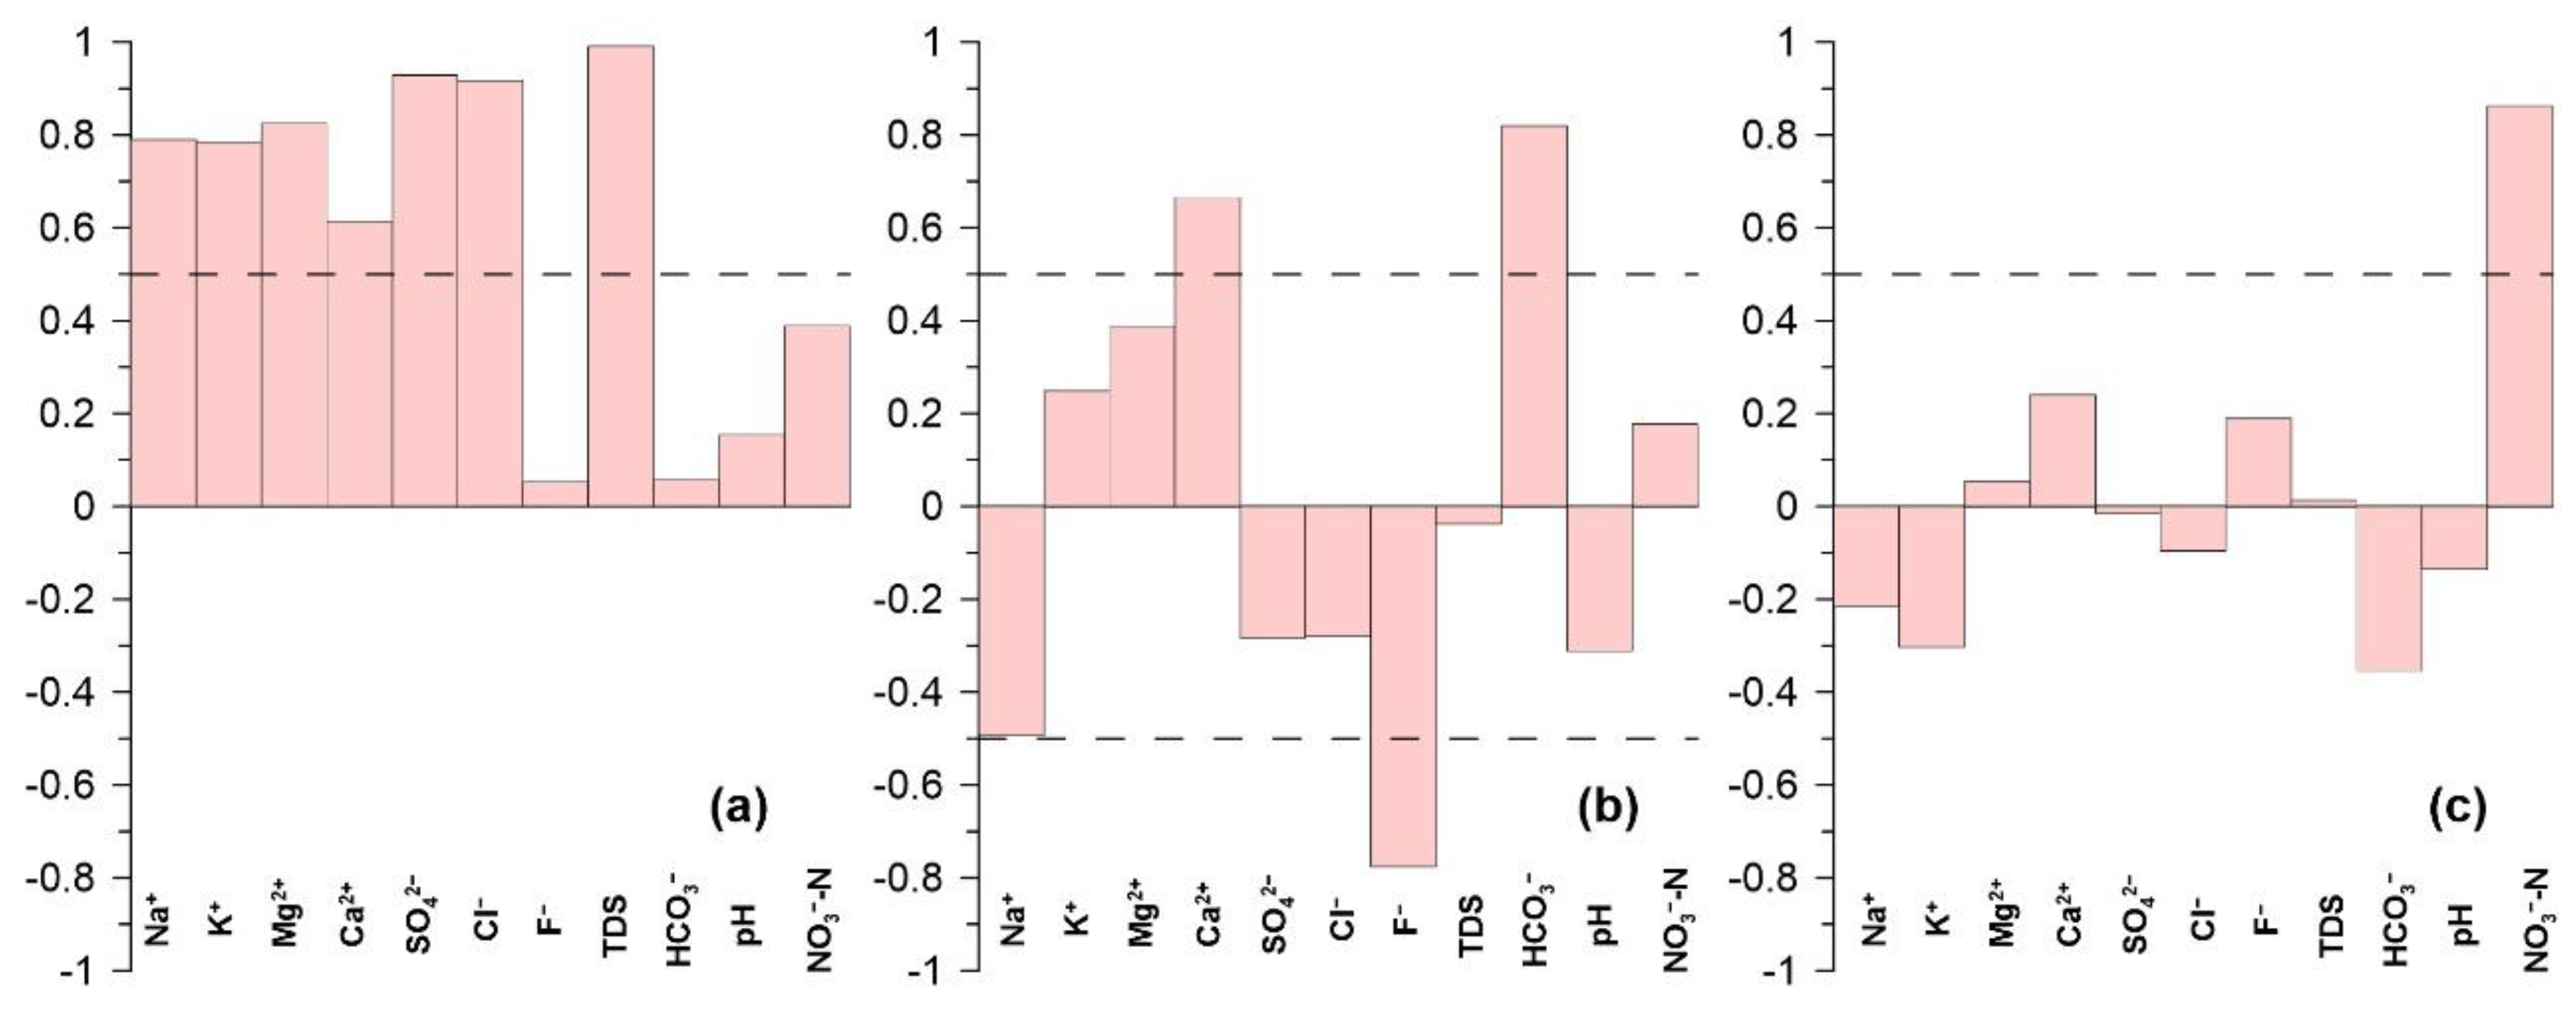
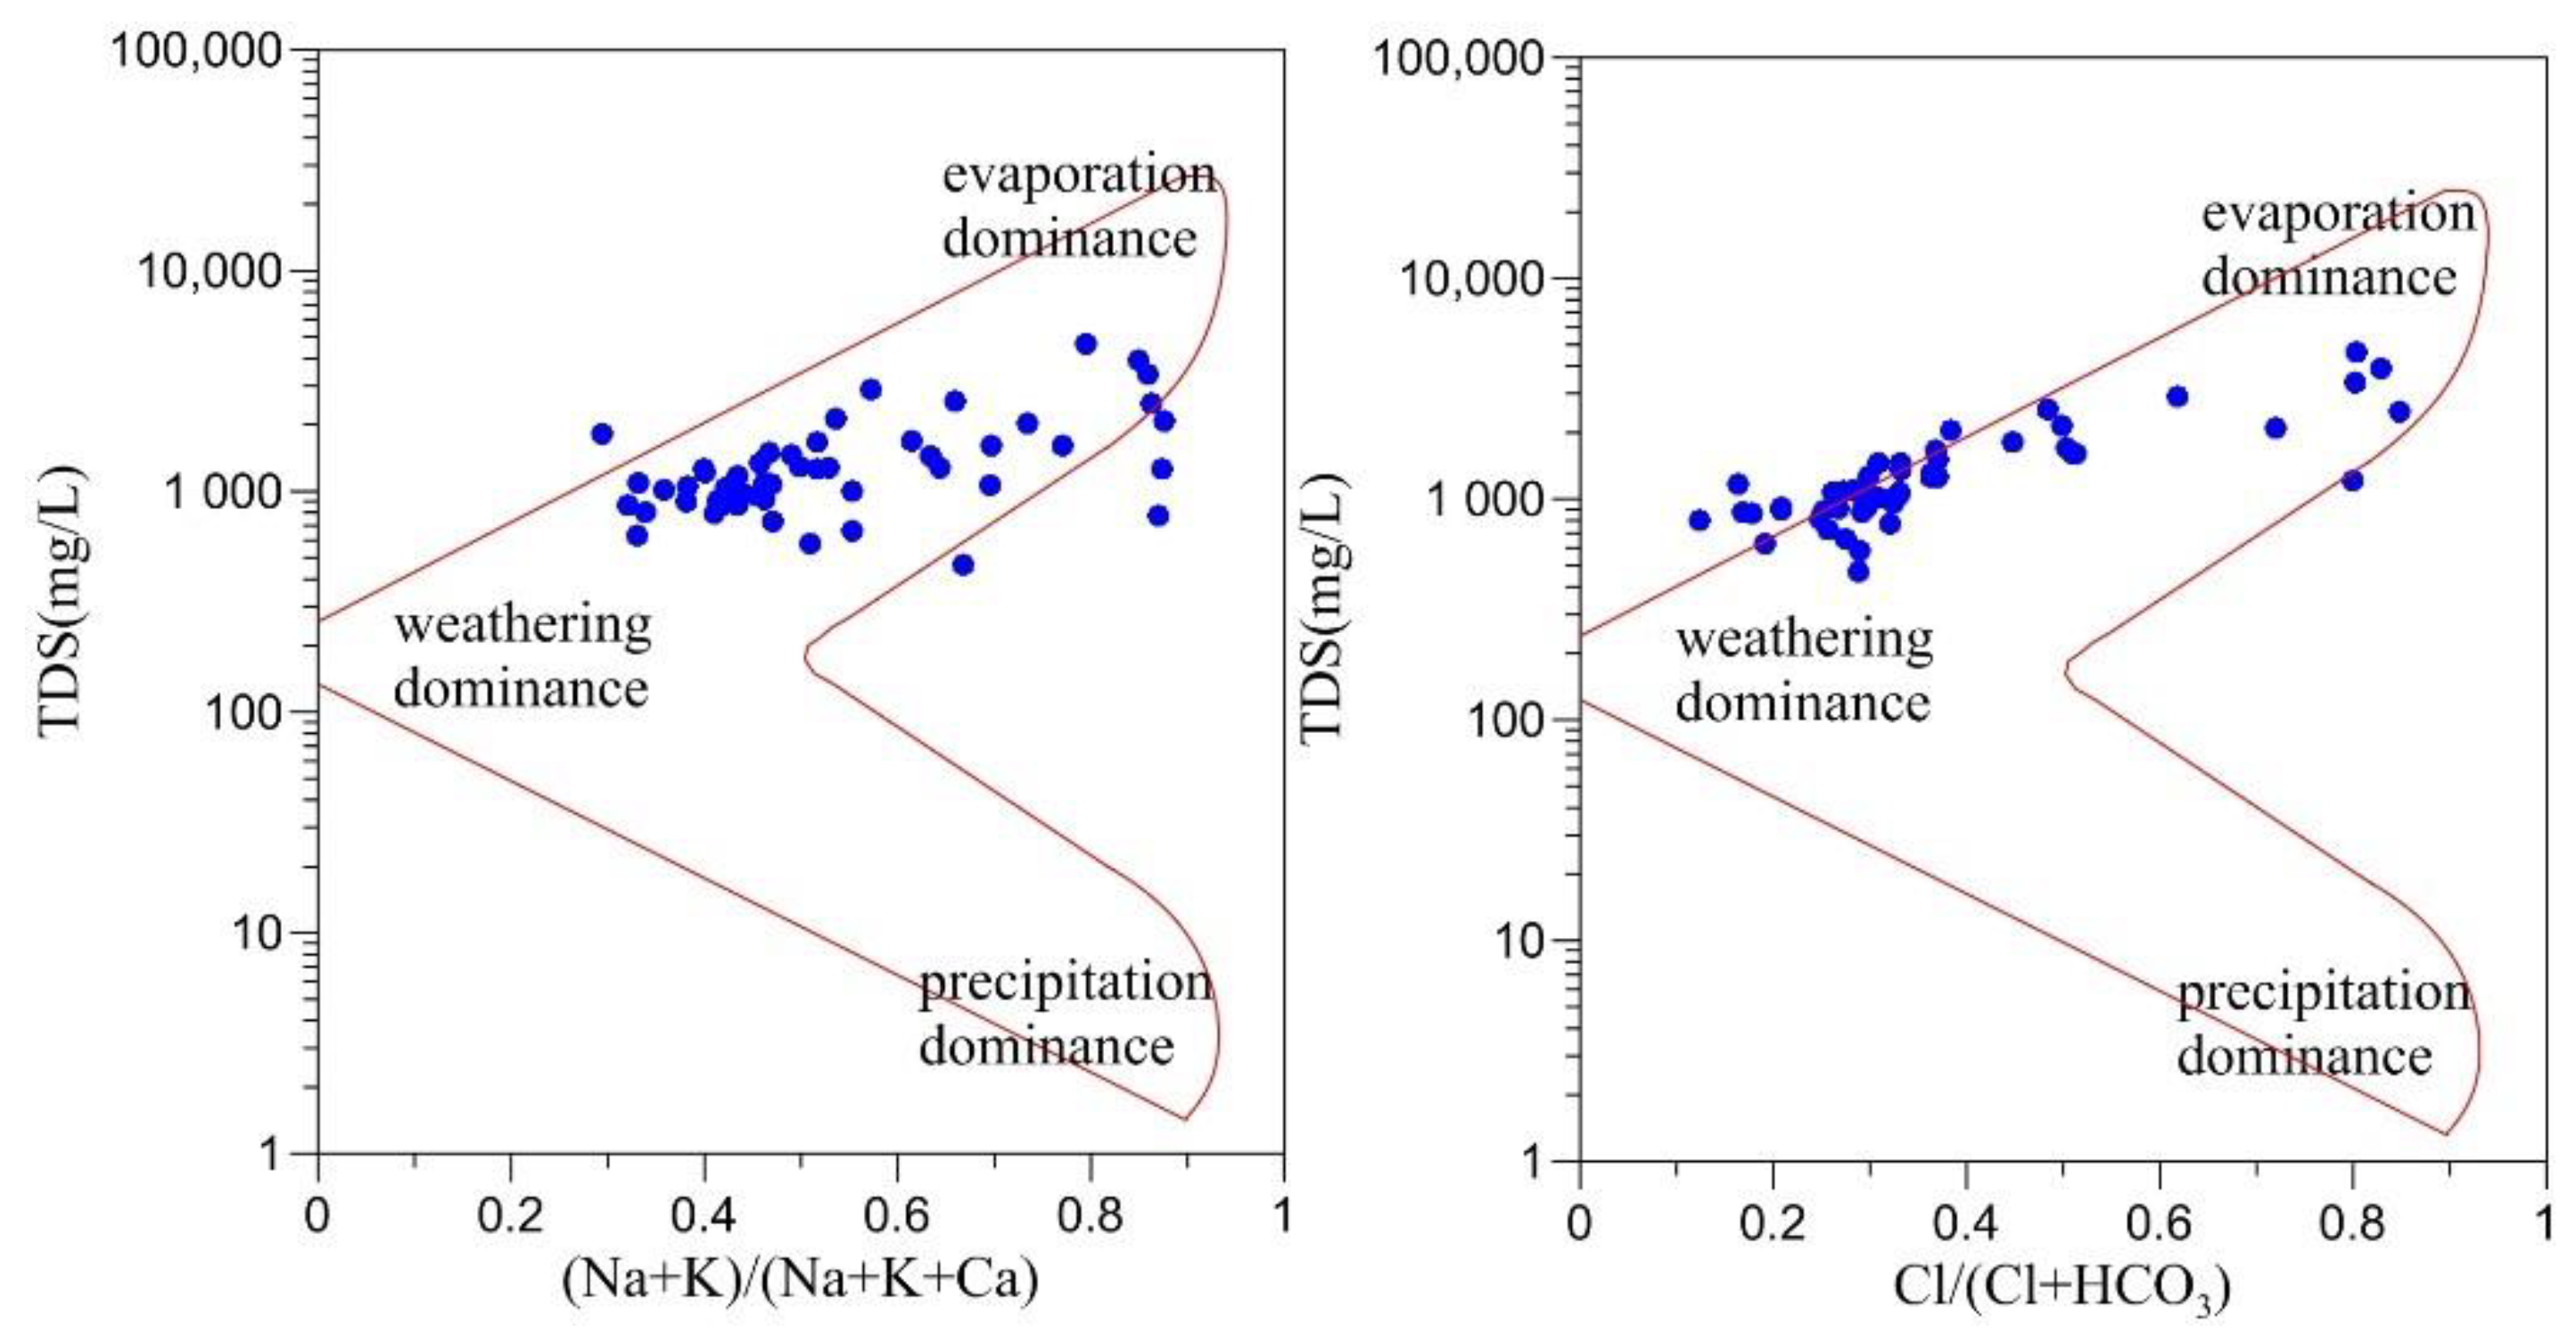
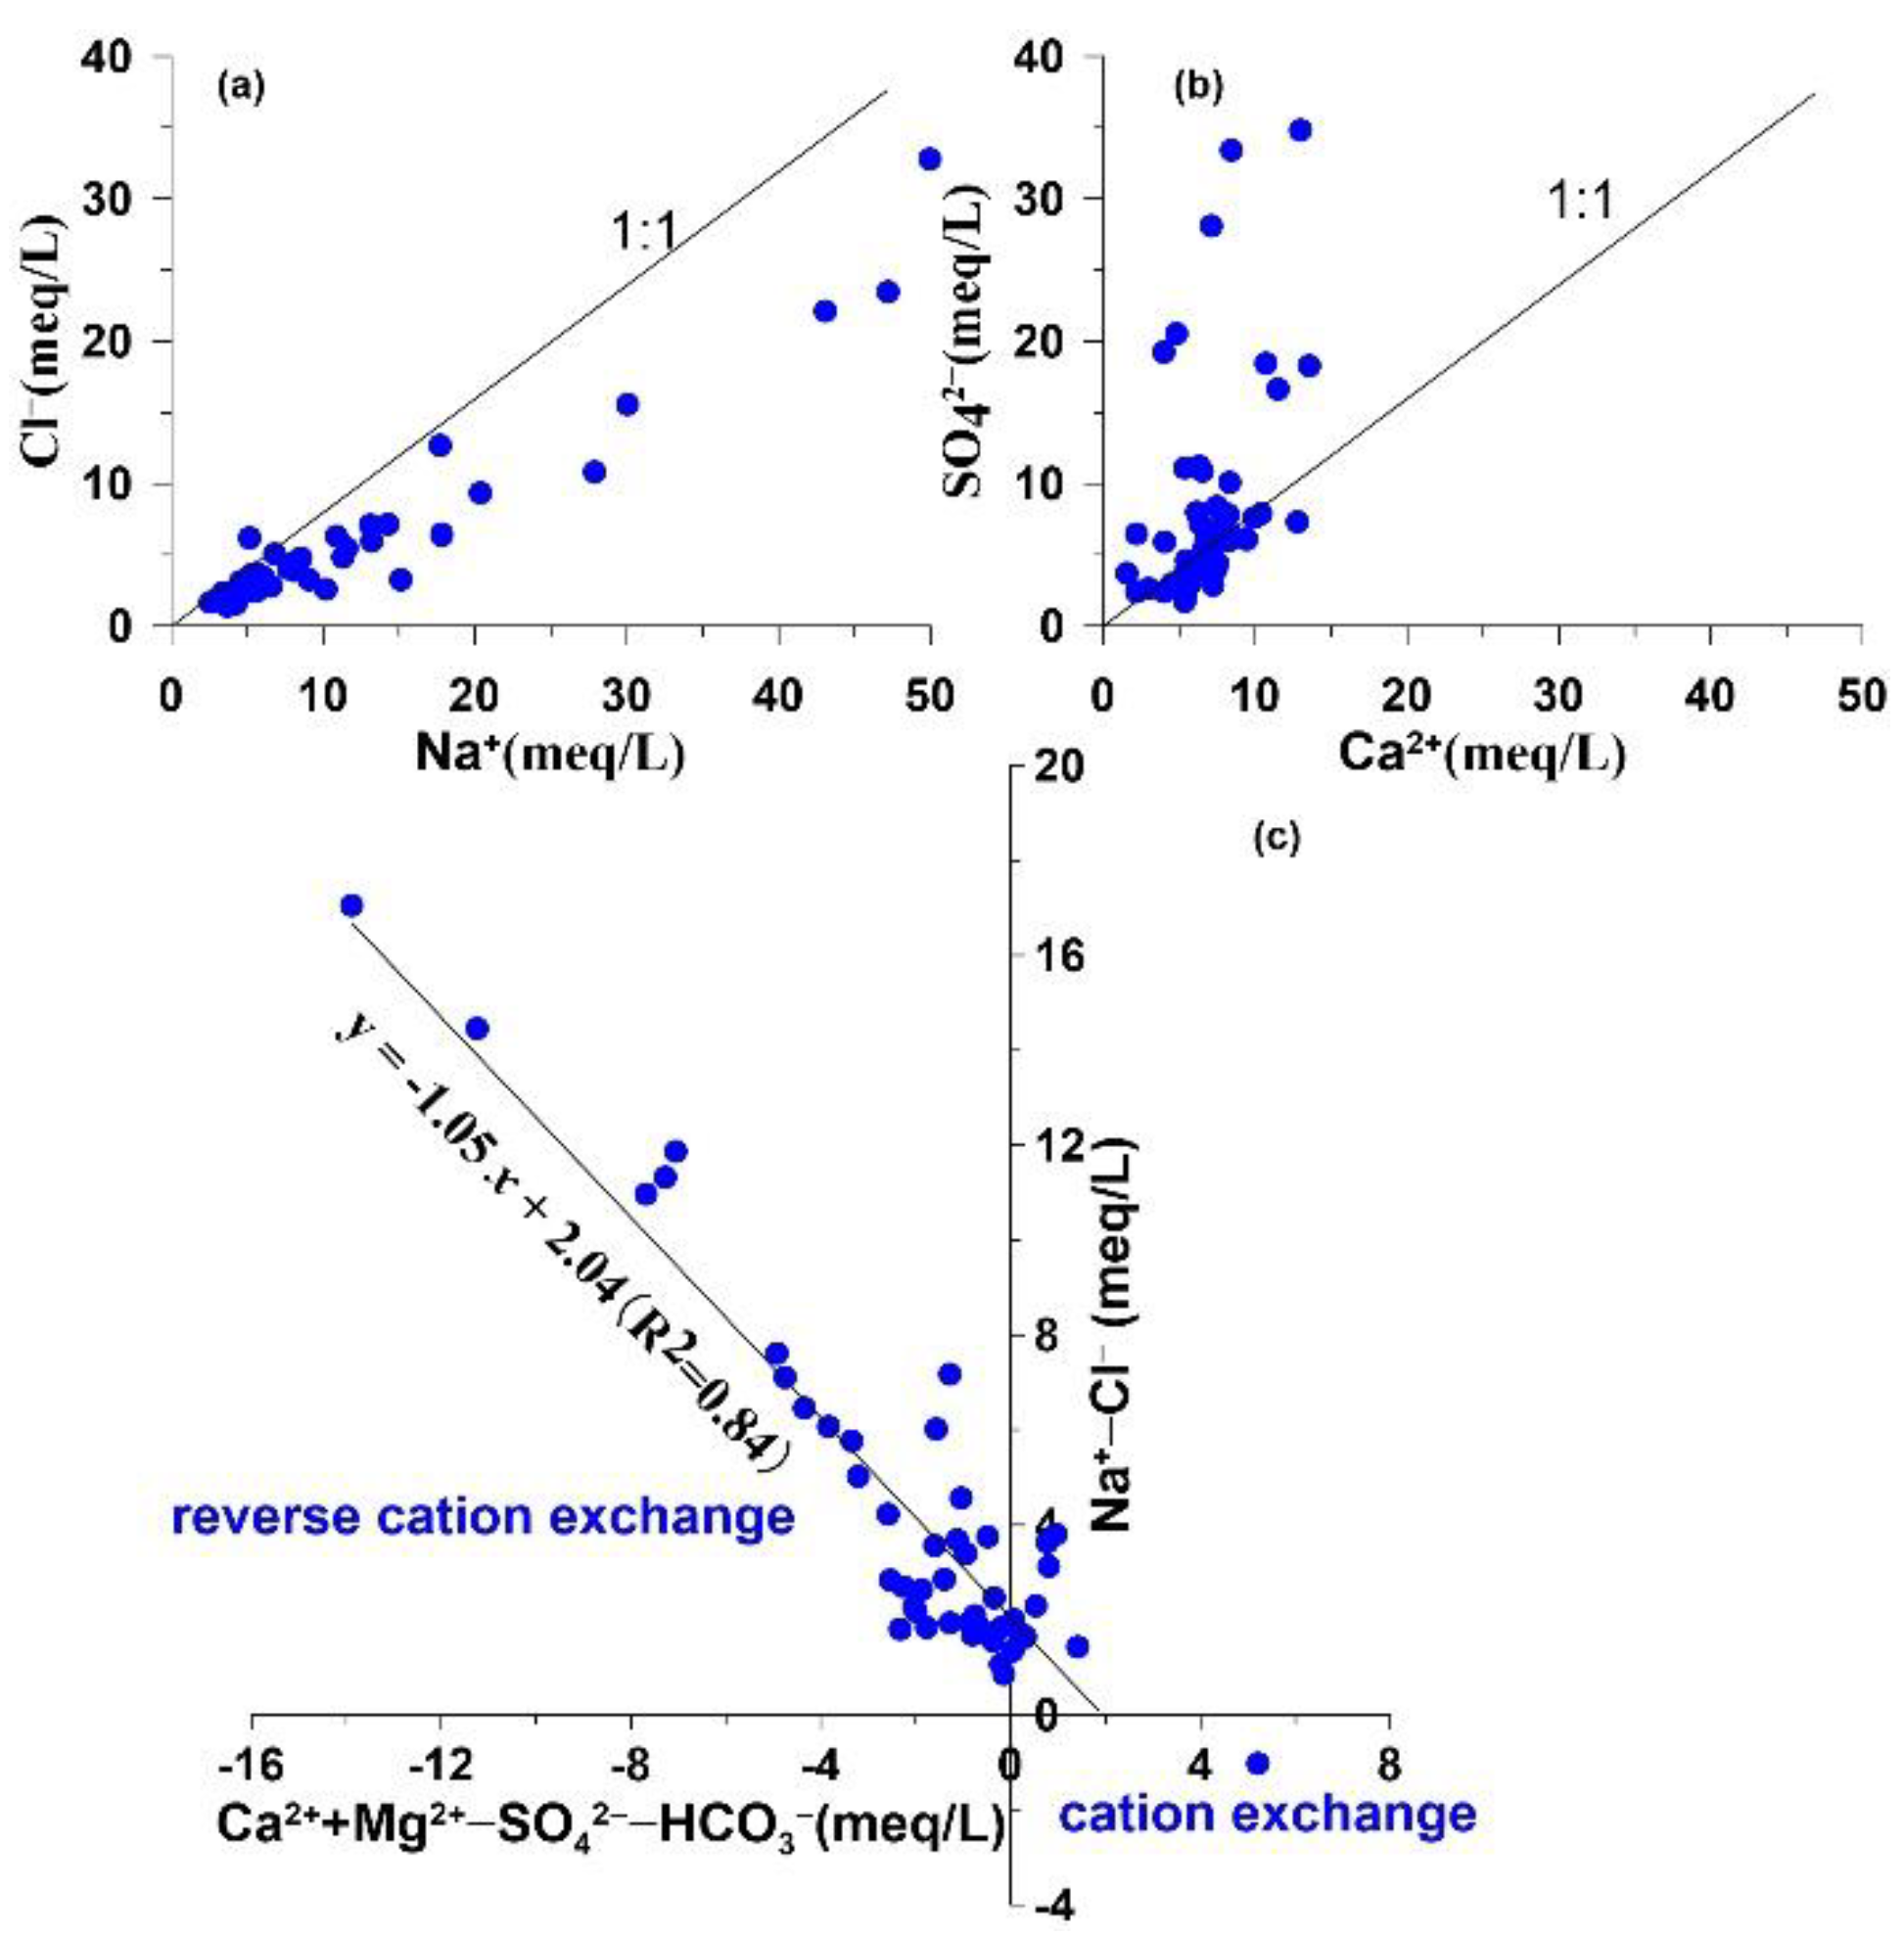
4.3. Processes Regulating Groundwater Hydrogeochemistry
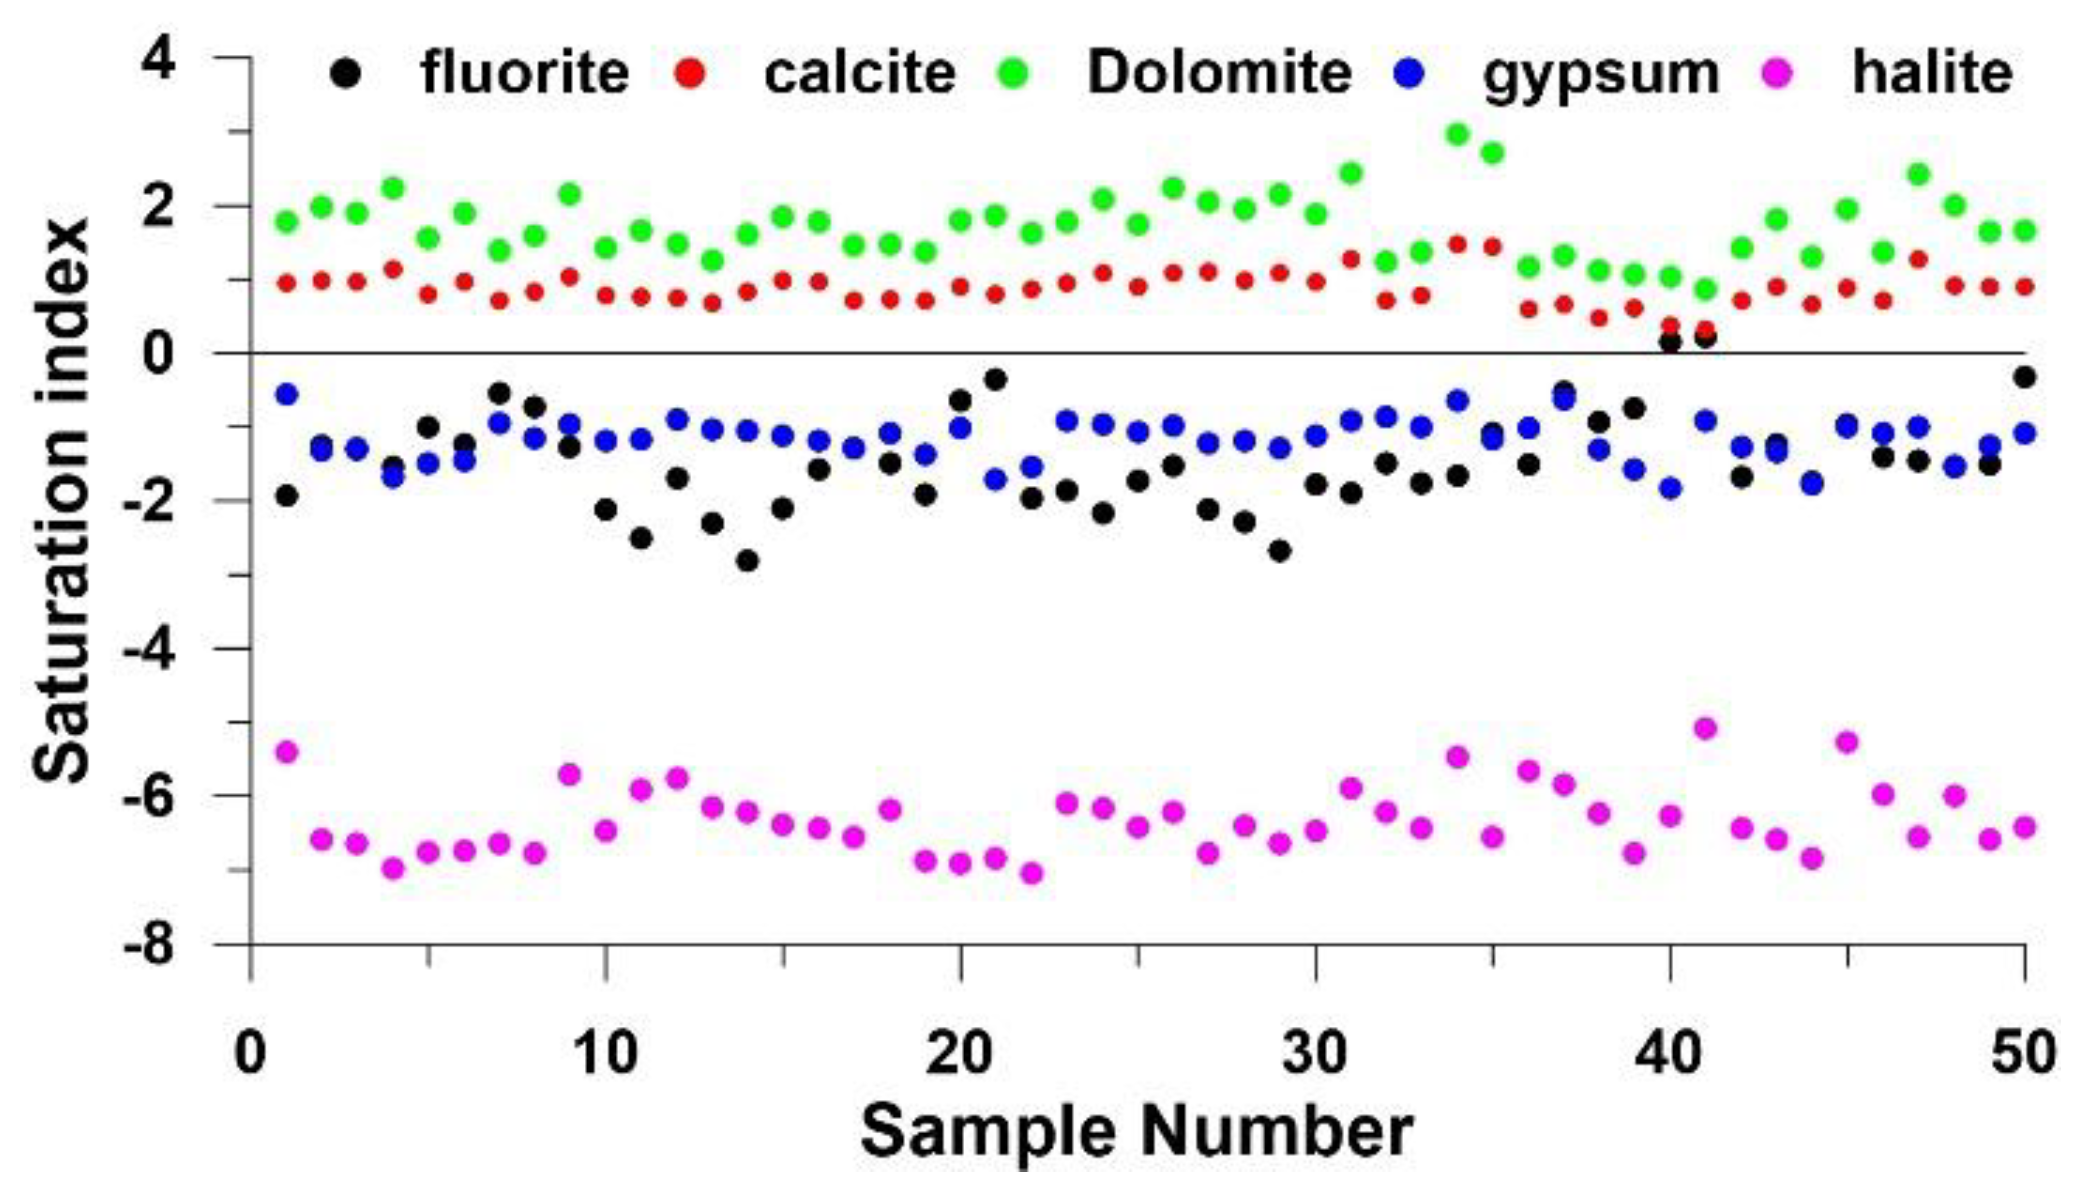
4.3.1 Water–Rock Interactions
4.3.2. Geogenic Contamination
4.3.3. Human-Induced Contamination
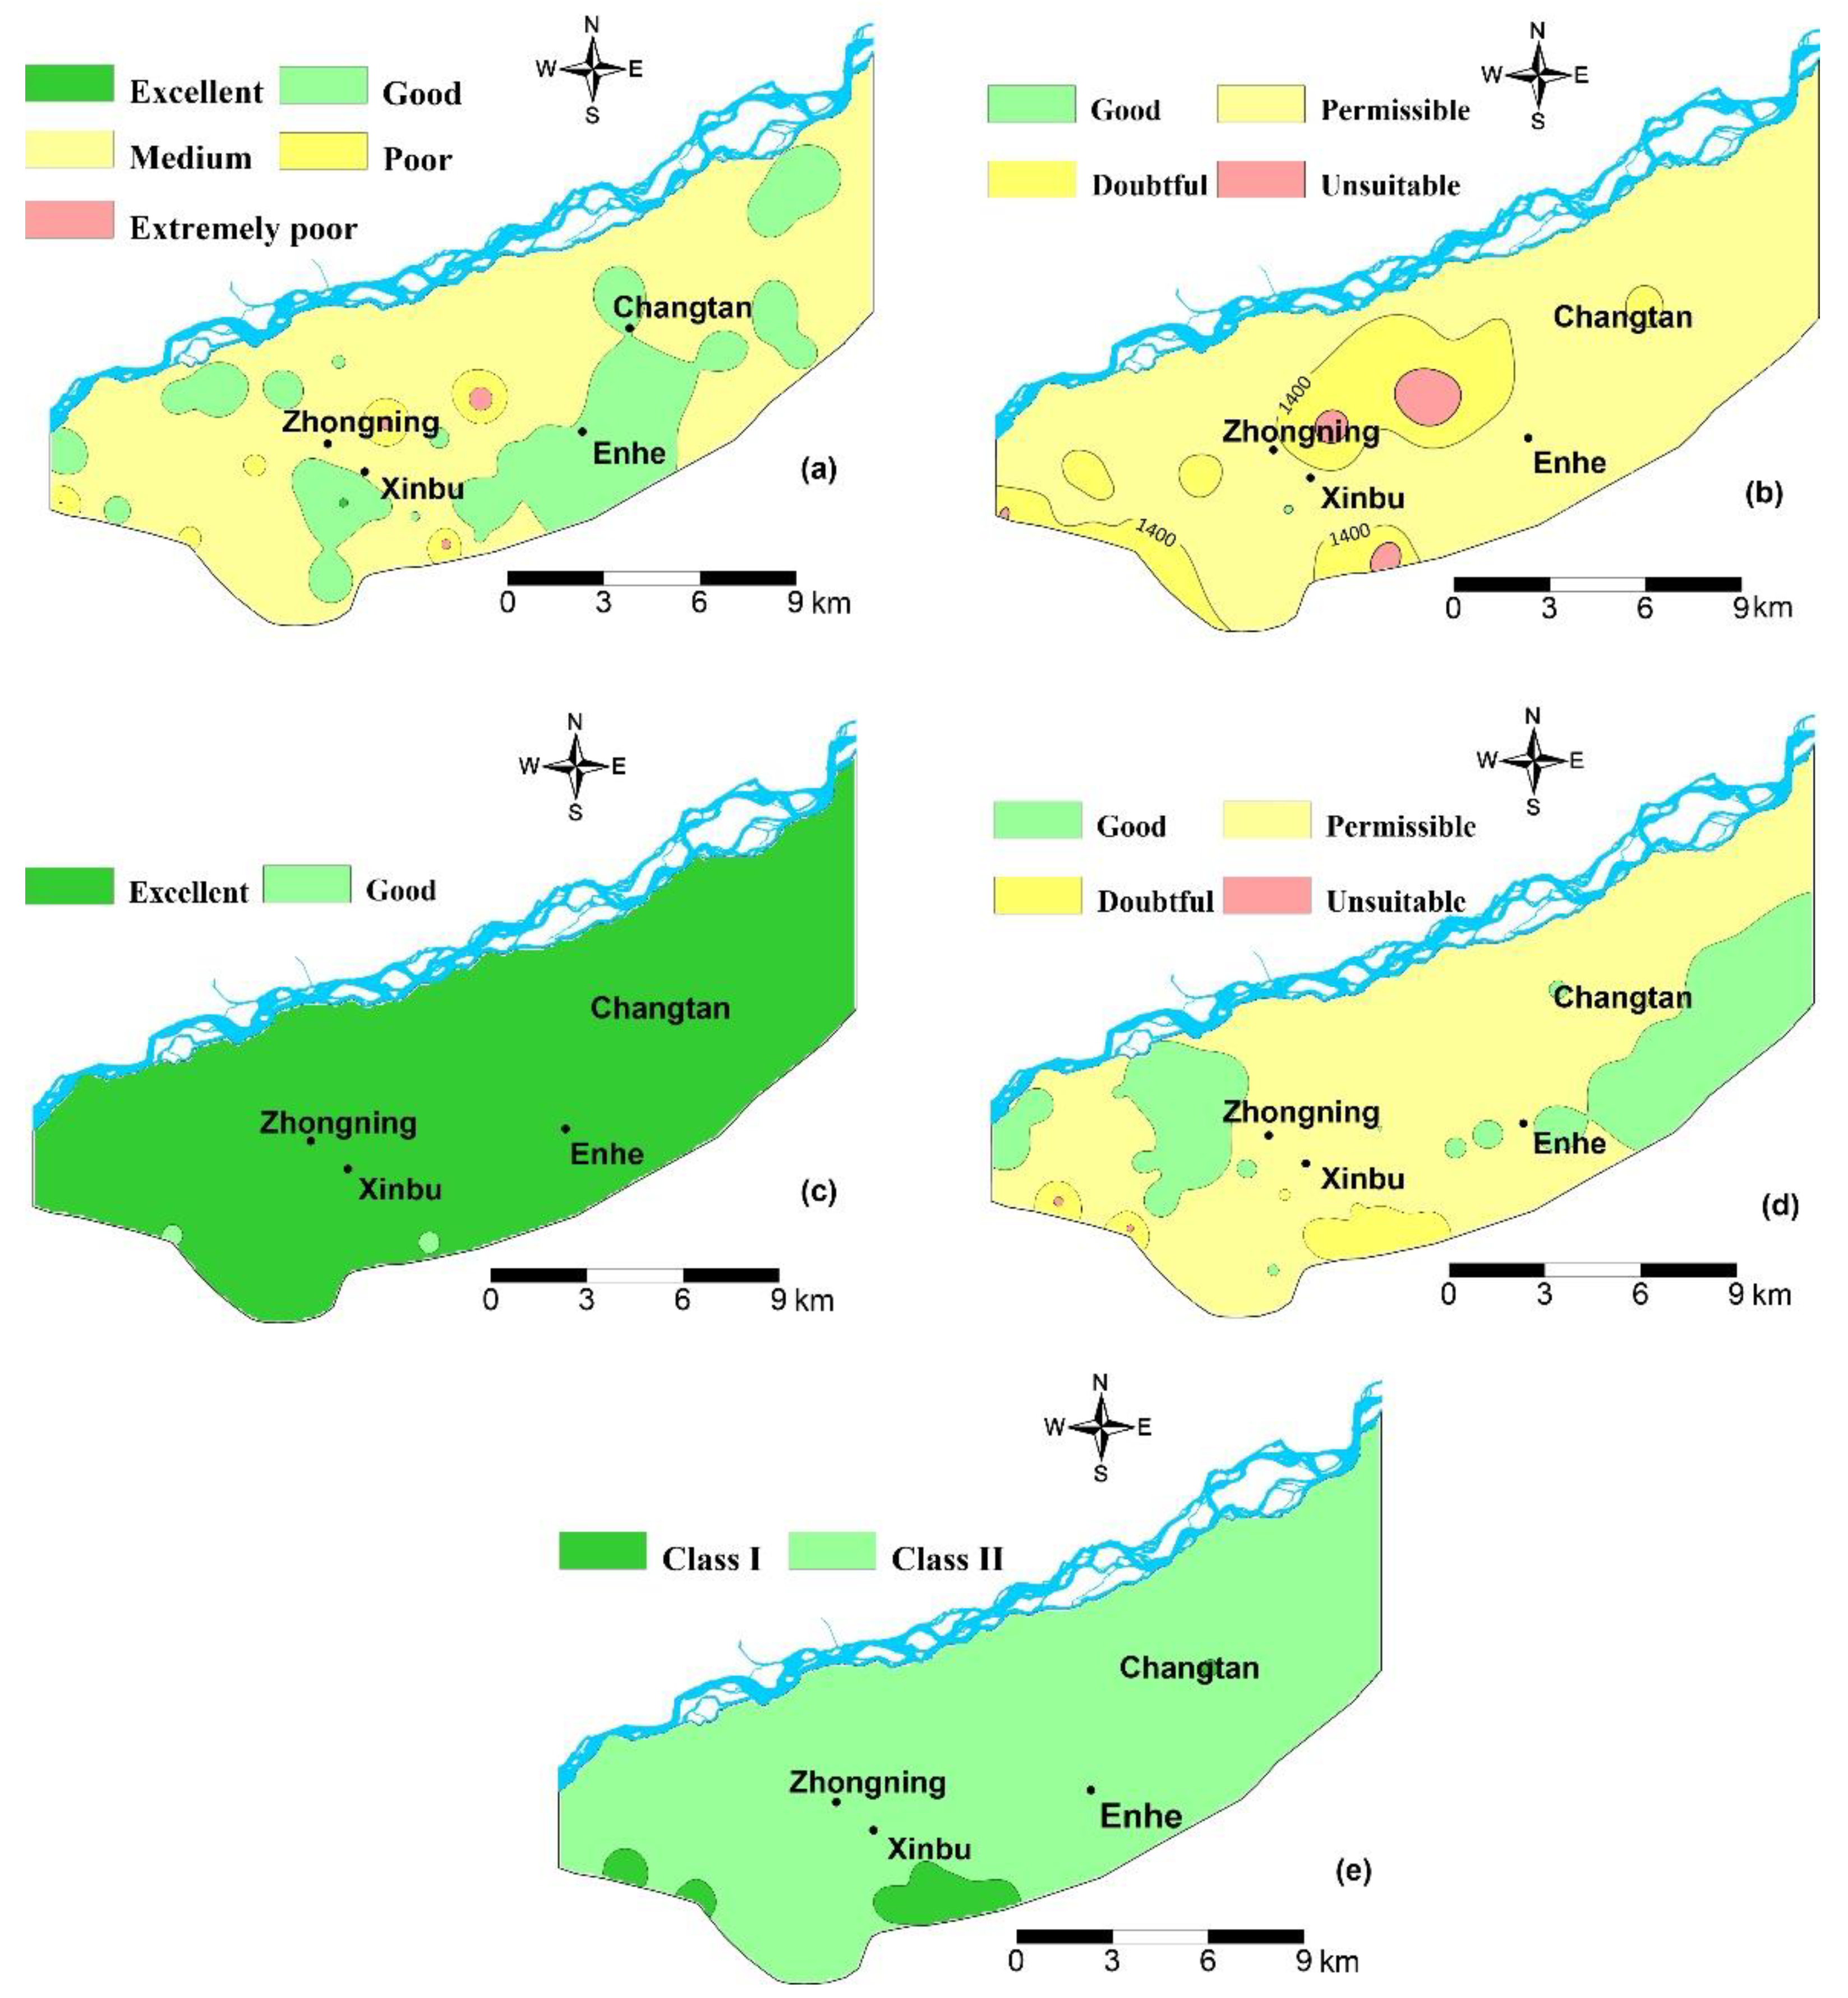
4.4. Groundwater Suitability for Drinking
4.5 Groundwater Suitability for Irrigation
5. Conclusions
Author Contributions
Funding
Acknowledgments
Conflicts of Interest
References
- Vadiati, M.; Adamowski, J.; Beynaghi, A. A brief overview of trends in groundwater research: Progress towards sustainability? J. Environ. Manag. 2018, 223, 849–851. [Google Scholar] [CrossRef] [PubMed]
- Jakeman, A.; Barreteau, O.; Hunt, R.J.; Rinaudo, J.D.; Ross, A. Integrated Groundwater Management; Springer: Berlin, Germany, 2016. [Google Scholar]
- Han, Z. Groundwater resources protection and aquifer recovery in China. Environ. Geol. 2003, 44, 106–111. [Google Scholar] [CrossRef]
- Howard, G.J.B.; Pedley, S.; Schmoll, O.; Chorus, I.; Berger, P. Groundwater and Public Health; IWA Publishing; World Health Organization: London, UK, 2006. [Google Scholar]
- Villholth, K.G.; Rajasooriyar, L.D. Groundwater Resources and Management Challenges in Sri Lanka—An Overview. Water Resour. Manag. 2010, 24, 1489–1513. [Google Scholar] [CrossRef]
- Chen, J.; Qian, H.; Gao, Y.; Li, X. Human Health Risk Assessment of Contaminants in Drinking Water Based on Triangular Fuzzy Numbers Approach in Yinchuan City, Northwest China. Expo. Health 2018, 10, 155–166. [Google Scholar] [CrossRef]
- Hosseinifard, S.J.; Aminiyan, M.M. Hydrochemical Characterization of Groundwater Quality for Drinking and Agricultural Purposes: A Case Study in Rafsanjan Plain, Iran. Water Qual. Expo. Health 2015, 7, 531–544. [Google Scholar] [CrossRef]
- Hussein, M.T. Hydrochemical evaluation of groundwater in the Blue Nile Basin, Eastern Sudan, using conventional and multivariate techniques. Hydrogeol. J. 2004, 12, 144–158. [Google Scholar] [CrossRef]
- Chen, J.; Wu, H.; Qian, H.; Gao, Y. Assessing nitrate and fluoride contaminants in drinking water and their health risk of rural residents living in a semiarid region of Northwest China. Expo. Health 2017, 9, 183–195. [Google Scholar] [CrossRef]
- Li, P.; Qian, H.; Zhou, W. Finding harmony between the environment and humanity: An introduction to the thematic issue of the Silk Road. Environ. Earth Sci. 2017, 76, 105. [Google Scholar] [CrossRef]
- Christensen, J.N.; Dafflon, B.; Shiel, A.E.; Tokunaga, T.K.; Wan, J.; Faybishenko, B.; Dong, W.; Williams, K.H.; Hobson, C.; Brown, S.T.; et al. Using strontium isotopes to evaluate the spatial variation of groundwater recharge. Sci. Total Environ. 2018, 637–638, 672–685. [Google Scholar] [CrossRef]
- World Health Organization (WHO). Guidelines for Drinking Water Quality, 4th ed.; WHO: Geneva, Switzerland, 2011. [Google Scholar]
- Mostaza-Colado, D.; Carreño-Conde, F.; Rasines-Ladero, R.; Iepure, S. Hydrogeochemical characterization of a shallow alluvial aquifer: 1 Baseline for groundwater quality assessment and resource management. Sci. Total Environ. 2018, 639, 1110–1125. [Google Scholar] [CrossRef]
- Thorburn, P.J.; Biggs, J.S.; Weier, K.L.; Keating, B.A. Nitrate in groundwater of intensive agricultural areas in coastal Northeastern Australia. Agric. Ecosyst. Environ. 2003, 94, 49–58. [Google Scholar] [CrossRef]
- Alaya, M.B.; Saidi, S.; Zemni, T.; Zargouni, F. Suitability assessment of deep groundwater for drinking and irrigation use in the Djeffara aquifers (Northern Gabes, South-Eastern Tunisia). Environ. Earth Sci. 2013, 71, 3387–3421. [Google Scholar] [CrossRef]
- Xing, L.; Huang, L.; Hou, X.; Yang, L.; Chi, G.; Xu, J.; Zhu, H. Groundwater Hydrochemical Zoning in Inland Plains and its Genetic Mechanisms. Water 2018, 10, 752. [Google Scholar] [CrossRef]
- Li, P.; Qian, H.; Howard, K.W.F.; Wu, J. Building a new and sustainable “Silk Road economic belt”. Environ. Earth Sci. 2015, 74, 7267–7270. [Google Scholar] [CrossRef]
- Qian, H.; Li, P.; Howard, K.W.F.; Yang, C.; Zhang, X. Assessment of Groundwater vulnerability in the Yinchuan Plain, Northwest China using OREADIC. Environ. Monit. Assess. 2012, 184, 3613–3628. [Google Scholar] [CrossRef] [PubMed]
- Fagbote, E.O.; Olanipekun, E.O.; Uyi, H.S. Water quality index of the ground water of bitumen deposit impacted farm settlements using entropy weighted method. Int. J. Environ. Sci. Technol. 2014, 11, 127–138. [Google Scholar] [CrossRef]
- Nag, S.K. Evaluation of Hydrochemical Parameters and Quality Assessment of the Groundwater in Gangajalghati Block, Bankura District, West Bengal, India. Arab. J. Sci. Eng. 2014, 39, 5715–5727. [Google Scholar] [CrossRef]
- Chen, J.; Wu, H.; Qian, H.; Li, X. Challenges and prospects of sustainable groundwater management in an agricultural plain along the Silk Road Economic Belt, North-West China. Int. J. Water Resour. Dev. 2018, 34, 354–368. [Google Scholar] [CrossRef]
- Mohamed, E.A.; Aref, L.; Nassir, A.; Abdulaziz, A. Groundwater characteristics and pollution assessment using integrated hydrochemical investigations GIS and multivariate geostatistical techniques in arid areas. Water Resour. Manag. 2015, 29, 5593–5612. [Google Scholar] [CrossRef]
- Li, P.; Qian, H.; Wu, J. Conjunctive use of groundwater and surface water to reduce soil salinization in the Yinchuan Plain, North-West China. Int. J. Water Resour. Dev. 2018, 34, 337–353. [Google Scholar] [CrossRef]
- Qian, H.; Li, P.; Wu, J.; Zhou, Y. Isotopic characteristics of precipitation, surface and ground waters in the Yinchuan Plain, Northwest China. Environ. Earth Sci. 2013, 70, 57–70. [Google Scholar] [CrossRef]
- Wang, L.; Hu, F.; Yin, L.; Wan, L.; Yu, Q. Hydrochemical and isotopic study of groundwater in the Yinchuan Plain, China. Environ. Earth Sci. 2013, 69, 2037–2057. [Google Scholar] [CrossRef]
- Chen, J.; Qian, H.; Wu, H. Nitrogen contamination in groundwater in an agricultural region along the New Silk Road, Northwest China: Distribution and factors controlling its fate. Environ. Sci. Pollut. Res. Int. 2017, 24, 13154–13167. [Google Scholar] [CrossRef] [PubMed]
- Li, P.; Wu, J.; Qian, H.; Lyu, X.; Liu, H. Origin and assessment of groundwater pollution and associated health risk: A case study in an industrial park, Northwest China. Environ. Geochem. Health 2014, 36, 693–712. [Google Scholar] [CrossRef] [PubMed]
- Li, P.; Wu, J.; Qian, H.; Zhang, Y.; Yang, N.; Jing, L.; Yu, P. Hydrogeochemical Characterization of Groundwater in and Around a Wastewater Irrigated Forest in the Southeastern Edge of the Tengger Desert, Northwest China. Expo. Health 2016, 8, 331–348. [Google Scholar] [CrossRef]
- Abbasi, T.; Abbasi, S.A. Water Quality Indices; Elsevier: Amsterdam, The Netherlands, 2012. [Google Scholar]
- Lumb, A.; Sharma, T.C.; Bibeault, J. A review of genesis and evolution of water quality index (WQI) and some future directions. Water Qual. Expo. Health 2011, 3, 11–24. [Google Scholar] [CrossRef]
- Kumar, S.K.; Logeshkumaran, A.; Magesh, N.S.; Godson, P.S.; Chandrasekar, N. Hydro-geochemistry and application of water quality index (WQI) for groundwater quality assessment, Anna Nagar, part of Chennai City, Tamil Nadu, India. Appl. Water Sci. 2015, 5, 335–343. [Google Scholar] [CrossRef]
- Shannon, C.E. A Mathematical Theory of Communication. Bell Syst. Tech. J. 1948, 27, 379–423. [Google Scholar] [CrossRef]
- Amiri, V.; Rezaei, M.; Sohrabi, N. Groundwater quality assessment using entropy weighted water quality index (EWQI) in Lenjanat. Iran Environ. Earth Sci. 2014, 72, 3479–3490. [Google Scholar] [CrossRef]
- Love, D.; Hallbauer, D.; Amos, A.; Hranova, R. Factor analysis as a tool in groundwater quality management: Two Southern African case studies. Phys. Chem. Earth 2004, 29, 1135–1143. [Google Scholar] [CrossRef]
- Yu, S.; Shang, J.; Zhao, J.; Guo, H. Factor Analysis and Dynamics of Water Quality of the Songhua River, Northeast China. Water Air Soil Pollut. 2003, 144, 159–169. [Google Scholar] [CrossRef]
- Huang, H.; Lu, J. Identification of river water pollution characteristics based on projection pursuit and factor analysis. Environ. Earth Sci. 2014, 72, 3409–3417. [Google Scholar] [CrossRef]
- Obeidat, M.M.; Awawdeh, M.; Al-Rub, F.A. Multivariate statistical analysis and environmental isotopes of Amman/Wadi Sir (B2/A7) groundwater, Yarmouk River Basin, Jordan. Hydrol. Process. 2013, 27, 2449–2461. [Google Scholar] [CrossRef]
- Mahlknecht, J.; Steinich, B.; Navarro de León, I. Groundwater chemistry and mass transfers in the Independence aquifer, Central Mexico, by using multivariate statistics and mass-balance models. Environ. Geol. 2004, 45, 781–795. [Google Scholar] [CrossRef]
- Ministry of Health of PRC, Standardization Administration of PRC. Standard Examination Methods for Drinking Water; GB/T5750-2006; Standards Press of China: Beijing, China, 2006. (In Chinese) [Google Scholar]
- Durov, S.A. Natural waters and graphical representation of their composition. Doklady Akademii Nauk SSSR 1948, 59, 87–90. [Google Scholar]
- Li, P.; Qian, H.; Wu, J. Groundwater Quality Assessment Based on Improved Water Quality Index in Pengyang County, Ningxia, Northwest China. E-J. Chem. 2010, 7, S209–S216. [Google Scholar]
- World Health Organization (WHO). Guidelines for Drinking Water Quality; World Health Organization: Geneva, Switzerland, 2004. [Google Scholar]
- Bureau of Quality and Technical Supervision of China. National Standard of the People’s Republic of China: Quality Standard for Groundwater; GB/T 14848-2017; Bureau of Quality and Technical Supervision of China: Beijing, China, 2017. (In Chinese) [Google Scholar]
- Prasanth, S.V.S.; Magesh, N.S.; Jitheshlal, K.V.; Chandrasekar, N.; Gangadhar, K. Evaluation of groundwater quality and its suitability for drinking and agricultural usein the coastal stretch of Alappuzha District, Kerala, India. Appl. Water Sci. 2012, 2, 165–175. [Google Scholar] [CrossRef]
- Fordyce, F.M.; Vrana, K.; Zhovinsky, E.; Povoroznuk, V.; Toth, G.; Hope, B.C.; Iljinsky, U.; Baker, J. A health risk assessment for fluoride in Central Europe. Environ. Geochem. Health 2007, 229, 83–102. [Google Scholar] [CrossRef]
- Wu, J.; Sun, Z. Evaluation of shallow groundwater contamination and associated human health risk in an alluvial plain impacted by agricultural and industrial activities, Mid-West China. Expo. Health 2016, 8, 311–329. [Google Scholar] [CrossRef]
- Chen, T.B.; Zen, X.B.; Hu, Q.X. Utilization efficiently of chemical fertilizers among different counties of China. Acta Geogr. Sin. 2002, 57, 531–538. [Google Scholar]
- Gibbs, R.J. Mechanisms controlling world’s water chemistry. Science 1970, 170, 1088–1090. [Google Scholar] [CrossRef] [PubMed]
- Kumar, M.; Ramanathan, A.L.; Rao, M.S.; Kumar, B. Identification and evaluation of hydrogeochemical process in the groundwater environment of Delhi, India. Environ. Geol. 2006, 50, 1025–1039. [Google Scholar] [CrossRef]
- Carol, E.S.; Kruse, E.E.; Laurencena, P.C.; Rojo, A.; Deluchi, M.H. Ionic exchange in groundwater hydrochemical evolution. Study case: The drainage basin of El Pescado creek (Buenos Aires province, Argentina). Environ. Earth Sci. 2012, 65, 421–428. [Google Scholar] [CrossRef]
- Ettazarini, S. Processes of water-rock interaction in the Turonian aquifer of Oum Er-Rabia Basin, Morocco. Environ. Geol. 2005, 49, 293–299. [Google Scholar] [CrossRef]
- Rajmohan, N.; Elango, L. Identification and evolution of hydrogeochemical processes in the groundwater environment in an area of the Palar and Cheyyar River Basins, Southern India. Environ. Geol. 2004, 46, 47–61. [Google Scholar] [CrossRef]
- Wu, J.; Li, P.; Qian, H. Hydrochemical characterization of drinking groundwater with special reference to fluoride in an arid area of China and the control of aquifer leakage on its concentrations. Environ. Earth Sci. 2015, 73, 8575–8588. [Google Scholar] [CrossRef]
- Chen, J.; Qian, H.; Wu, H.; Gao, Y.; Li, X. Assessment of arsenic and fluoride pollution in groundwater in Dawukou area, Northwest China, and the associated health risk for inhabitants. Environ. Earth Sci. 2017, 76, 314. [Google Scholar] [CrossRef]
- Chinese Academy of Sciences (CAS). Groundwater Sciences; Science Press: Beijing, China, 2018. (In Chinese) [Google Scholar]
- Jia, Y.; Xi, B.; Jiang, Y.; Guo, H.; Yang, Y.; Lian, X.; Han, S. Distribution, formation and human-induced evolution of geogenic contaminated groundwater in China: A review. Sci. Total Environ. 2018, 643, 967–993. [Google Scholar] [CrossRef]
- Wen, D.; Zhang, F.; Zhang, E.; Wang, C.; Han, S.; Zheng, Y. Arsenic, fluoride and iodine in groundwater of China. J. Geochem. Explor. 2013, 135, 1–21. [Google Scholar] [CrossRef]
- Kim, Y.; Kim, J.Y.; Kim, K. Geochemical characteristics of fluoride in groundwater of Gimcheon, Korea: Lithogenic and agricultural origins. Environ. Earth Sci. 2011, 63, 1139–1148. [Google Scholar] [CrossRef]
- Moghaddam, A.A.; Fijani, E. Distribution of fluoride in groundwater of Maku area, Northwest of Iran. Environ. Geol. 2008, 56, 281–287. [Google Scholar] [CrossRef]
- Cui, S.; Shi, Y.; Groffman, P.M.; Schlesinger, W.H.; Zhu, Y. Centennial-scale analysis of the creation and fate of reactive nitrogen in China (1910–2010). Proc. Natl. Acad. Sci. USA 2013, 110, 2052–2057. [Google Scholar] [CrossRef] [PubMed]
- Reddy, A.G.S. Geochemical evaluation of nitrate and fluoride contamination in varied hydrogeological environs of Prakasam district, Southern India. Environ. Earth Sci. 2014, 71, 4473–4495. [Google Scholar] [CrossRef]
- Suthar, S.; Bishnoi, P.; Singh, S.; Mutiyar, P.K.; Nema, A.K.; Patil, N.S. Nitrate contamination in groundwater of some rural areas of Rajasthan, India. J. Hazard. Mater. 2009, 171, 189–199. [Google Scholar] [CrossRef]
- Esmaeili, A.; Moore, F.; Keshavarzi, B. Nitrate contamination in irrigation groundwater, Isfahan, Iran. Environ. Earth Sci. 2014, 72, 2511–2522. [Google Scholar] [CrossRef]
- Zakhem, B.A.; Hafez, R. Hydrochemical, isotopic and statistical characteristics of groundwater nitrate pollution in Damascus Oasis (Syria). Environ. Earth Sci. 2015, 74, 2781–2797. [Google Scholar] [CrossRef]
- Policy Plan on Water Pollution Control and Clean-Up, Water Ten Plan, 2015. Available online: http://www.chinawaterrisk.org/notices/new-water-ten-plan-to-safeguard-chinas-waters/ (accessed on 22 Dcecember 2018).
- Song, X.; Sun, S.; Zhang, W.; Chen, Y. Study of the optimization of water environment management in China under the background of Water Pollution and Control Plan. Environ. Prot. Sci. 2017, 43, 51–57. (In Chinese) [Google Scholar]
- Han, D.; Currell, M.J.; Cao, G. Deep challenges for China’s war on water pollution. Environ. Pollut. 2016, 218, 1222–1233. [Google Scholar] [CrossRef]
- Fipps, G. Irrigation Water Quality Standards and Salinity Management Strategies; Texas Cooperative Extension, The Texas A&M University System: College Station, TX, USA, 1914. [Google Scholar]
- Wilcox, L.V. Classification and Use of Irrigation Water; Agriccirc 969; United States Department of Agriculture (USDA): Washington, DC, USA, 1955.
- Subramani, T.; Elango, L.; Damodarasamy, S.R. Groundwater quality and its suitability for drinking and agricultural use in Chithar River Basin, Tamil Nadu, India. Environ. Geol. 2005, 47, 1099–1110. [Google Scholar] [CrossRef]
- Kumar, M.; Kumari, K.; Ramanathan, A.L.; Saxena, R. A comparative evaluation of groundwater suitability for irrigation and drinking purposes in two intensively cultivated districts of Punjab, India. Environ. Geol. 2007, 53, 553–574. [Google Scholar] [CrossRef]
- Bouderbala, A.; Gharbi, B.Y. Hydrogeochemical characterization and groundwater quality assessment in the intensive agricultural zone of the Upper Cheliff Plain, Algeria. Environ. Earth Sci. 2017, 76, 744. [Google Scholar] [CrossRef]
- Richards, L.A. Diagnosis and Improvement of Saline Alkali Soils: Agriculture; Handbook 60; US Department of Agriculture: Washington, DC, USA, 1954.
- Doneen, L.D. Notes on Water Quality in Agriculture; Published as a Water Science and Engineering Paper 4001; Department of Water Science and Engineering, University of California: Oakland, CA, USA, 1964. [Google Scholar]


| EWQI | Water Quality |
|---|---|
| <50 | Excellent |
| 50–100 | Good |
| 100–150 | Medium |
| 150–200 | Poor |
| >200 | Extremely poor |
| Parameters | Unit | Min | Max | Mean | SD | WHO Guideline (2011) | Chinese Guideline |
|---|---|---|---|---|---|---|---|
| pH | - | 7.0 | 8.5 | 7.8 | 0.28 | 6.5–8.5 | 6.5–8.5 |
| TDS | mg/L | 468 | 2560 | 1225 | 515 | 1000 | 1000 |
| Na+ | mg/L | 58.5 | 691 | 189 | 138 | 200 | - |
| K+ | mg/L | 1.72 | 16.3 | 5.23 | 2.93 | 10 * | - |
| Ca2+ | mg/L | 30.9 | 255 | 136 | 49.3 | 75 * | - |
| Mg2+ | mg/L | 21.3 | 116 | 64.7 | 20.2 | 30 * | - |
| Cl− | mg/L | 49.7 | 553 | 148 | 102 | 250 | 250 |
| SO42− | mg/L | 82 | 986 | 328 | 218 | 250 | 250 |
| HCO3− | mg/L | 170 | 661 | 459 | 125 | 300 * | - |
| NO3−-N | mg/L | 2.66 | 103 | 17.9 | 18.3 | 10 | 20 |
| F− | mg/L | 0.11 | 6.33 | 0.85 | 1.14 | 1.5 | 1.0 |
| Parameter | Entropy Value |
|---|---|
| Na+ | 0.092 |
| K+ | 0.073 |
| Mg2+ | 0.159 |
| Ca2+ | 0.131 |
| SO42− | 0.130 |
| Cl− | 0.073 |
| HCO3− | 0.119 |
| F− | 0.057 |
| NO3−-N | 0.060 |
| TDS | 0.107 |
| Classification Pattern | Categories | Ranges | NO. of Samples |
|---|---|---|---|
| EWQI | Excellent | <50 | 1 |
| Good | 50–100 | 25 | |
| Medium | 100–150 | 18 | |
| Poor | 150–200 | 2 | |
| Extremely poor | >200 | 4 | |
| Salinity hazard (TDS) | Excellent | <175 | 0 |
| Good | 175–525 | 1 | |
| Permissible | 525–1400 | 36 | |
| Doubtful | 1400–2100 | 9 | |
| Unsuitable | >2100 | 4 | |
| Sodium adsorption ration (SAR) | Excellent | 0–10 | 48 |
| Good | 10–18 | 2 | |
| Fair | 18–26 | 0 | |
| Poor | >26 | 0 | |
| Sodium percentage (Na%) | Excellent | 0–20 | 0 |
| Good | 20–40 | 23 | |
| Permissible | 40–60 | 19 | |
| Doubtful | 60–80 | 6 | |
| Unsuitable | >80 | 2 | |
| Permeability index (PI) | Class I | >75 | 7 |
| Class II | 25–75 | 43 | |
| Class III | <25 | 0 |
© 2019 by the authors. Licensee MDPI, Basel, Switzerland. This article is an open access article distributed under the terms and conditions of the Creative Commons Attribution (CC BY) license (http://creativecommons.org/licenses/by/4.0/).
Share and Cite
Chen, J.; Huang, Q.; Lin, Y.; Fang, Y.; Qian, H.; Liu, R.; Ma, H. Hydrogeochemical Characteristics and Quality Assessment of Groundwater in an Irrigated Region, Northwest China. Water 2019, 11, 96. https://doi.org/10.3390/w11010096
Chen J, Huang Q, Lin Y, Fang Y, Qian H, Liu R, Ma H. Hydrogeochemical Characteristics and Quality Assessment of Groundwater in an Irrigated Region, Northwest China. Water. 2019; 11(1):96. https://doi.org/10.3390/w11010096
Chicago/Turabian StyleChen, Jie, Qiwei Huang, Yaling Lin, Yuan Fang, Hui Qian, Ruiping Liu, and Hongyun Ma. 2019. "Hydrogeochemical Characteristics and Quality Assessment of Groundwater in an Irrigated Region, Northwest China" Water 11, no. 1: 96. https://doi.org/10.3390/w11010096
APA StyleChen, J., Huang, Q., Lin, Y., Fang, Y., Qian, H., Liu, R., & Ma, H. (2019). Hydrogeochemical Characteristics and Quality Assessment of Groundwater in an Irrigated Region, Northwest China. Water, 11(1), 96. https://doi.org/10.3390/w11010096