A Shear Reynolds Number-Based Classification Method of the Nonuniform Bed Load Transport


Abstract
1. Introduction
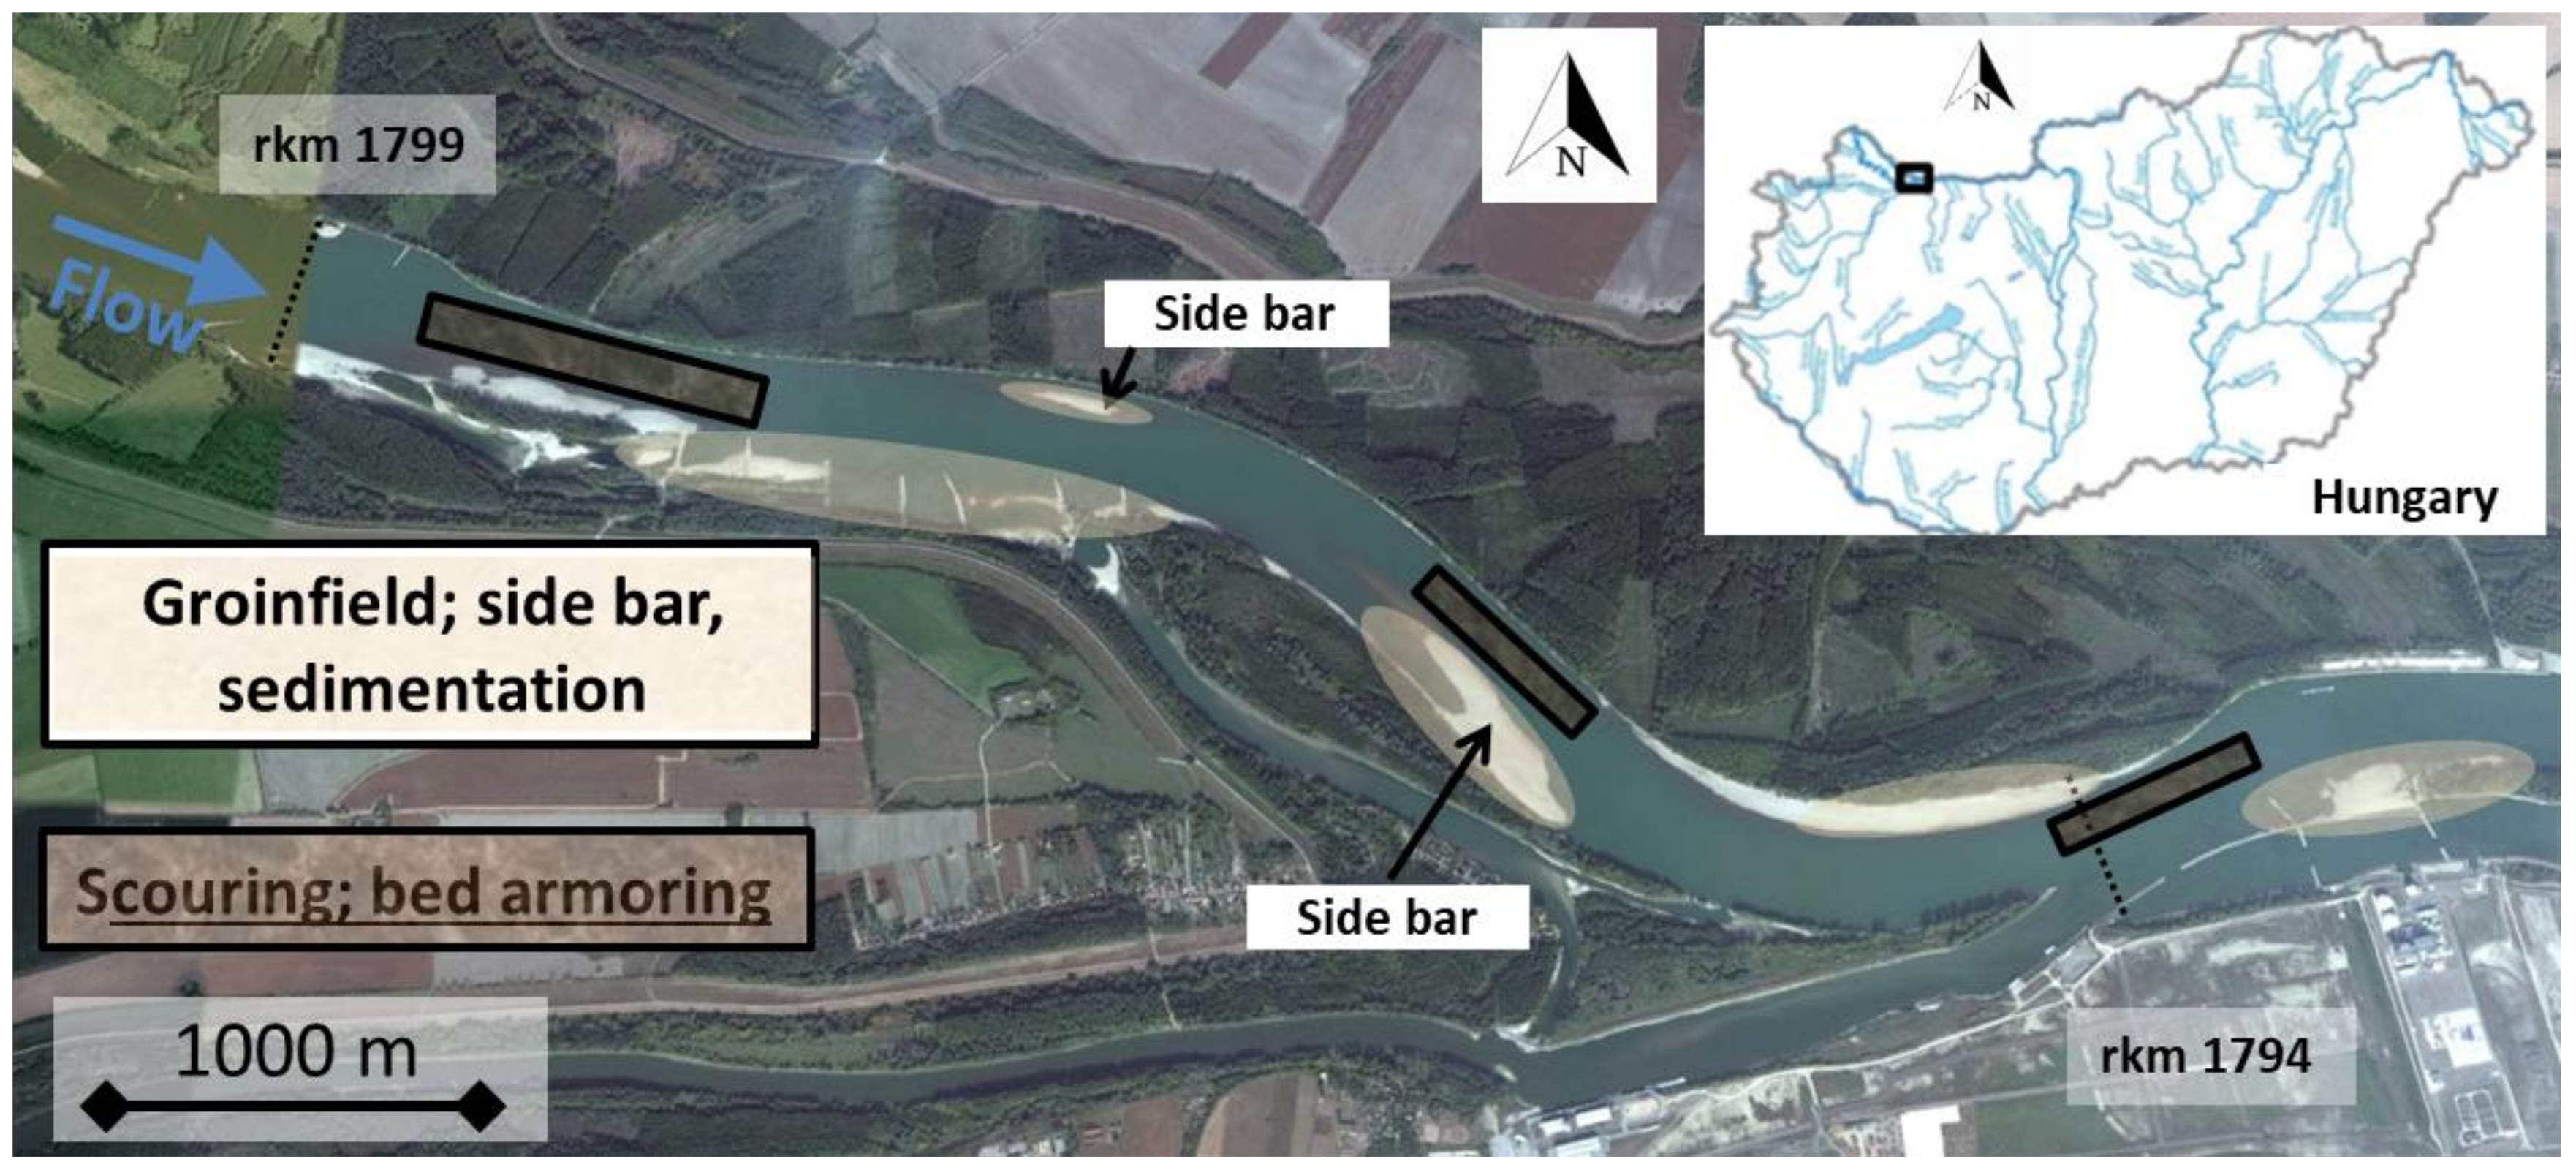
Case Study
2. Materials and Methods
2.1. Problem Statement
2.2. Existing Method for Bed Load Classification
2.3. Introducing the Novel Method for Bed Load Classification
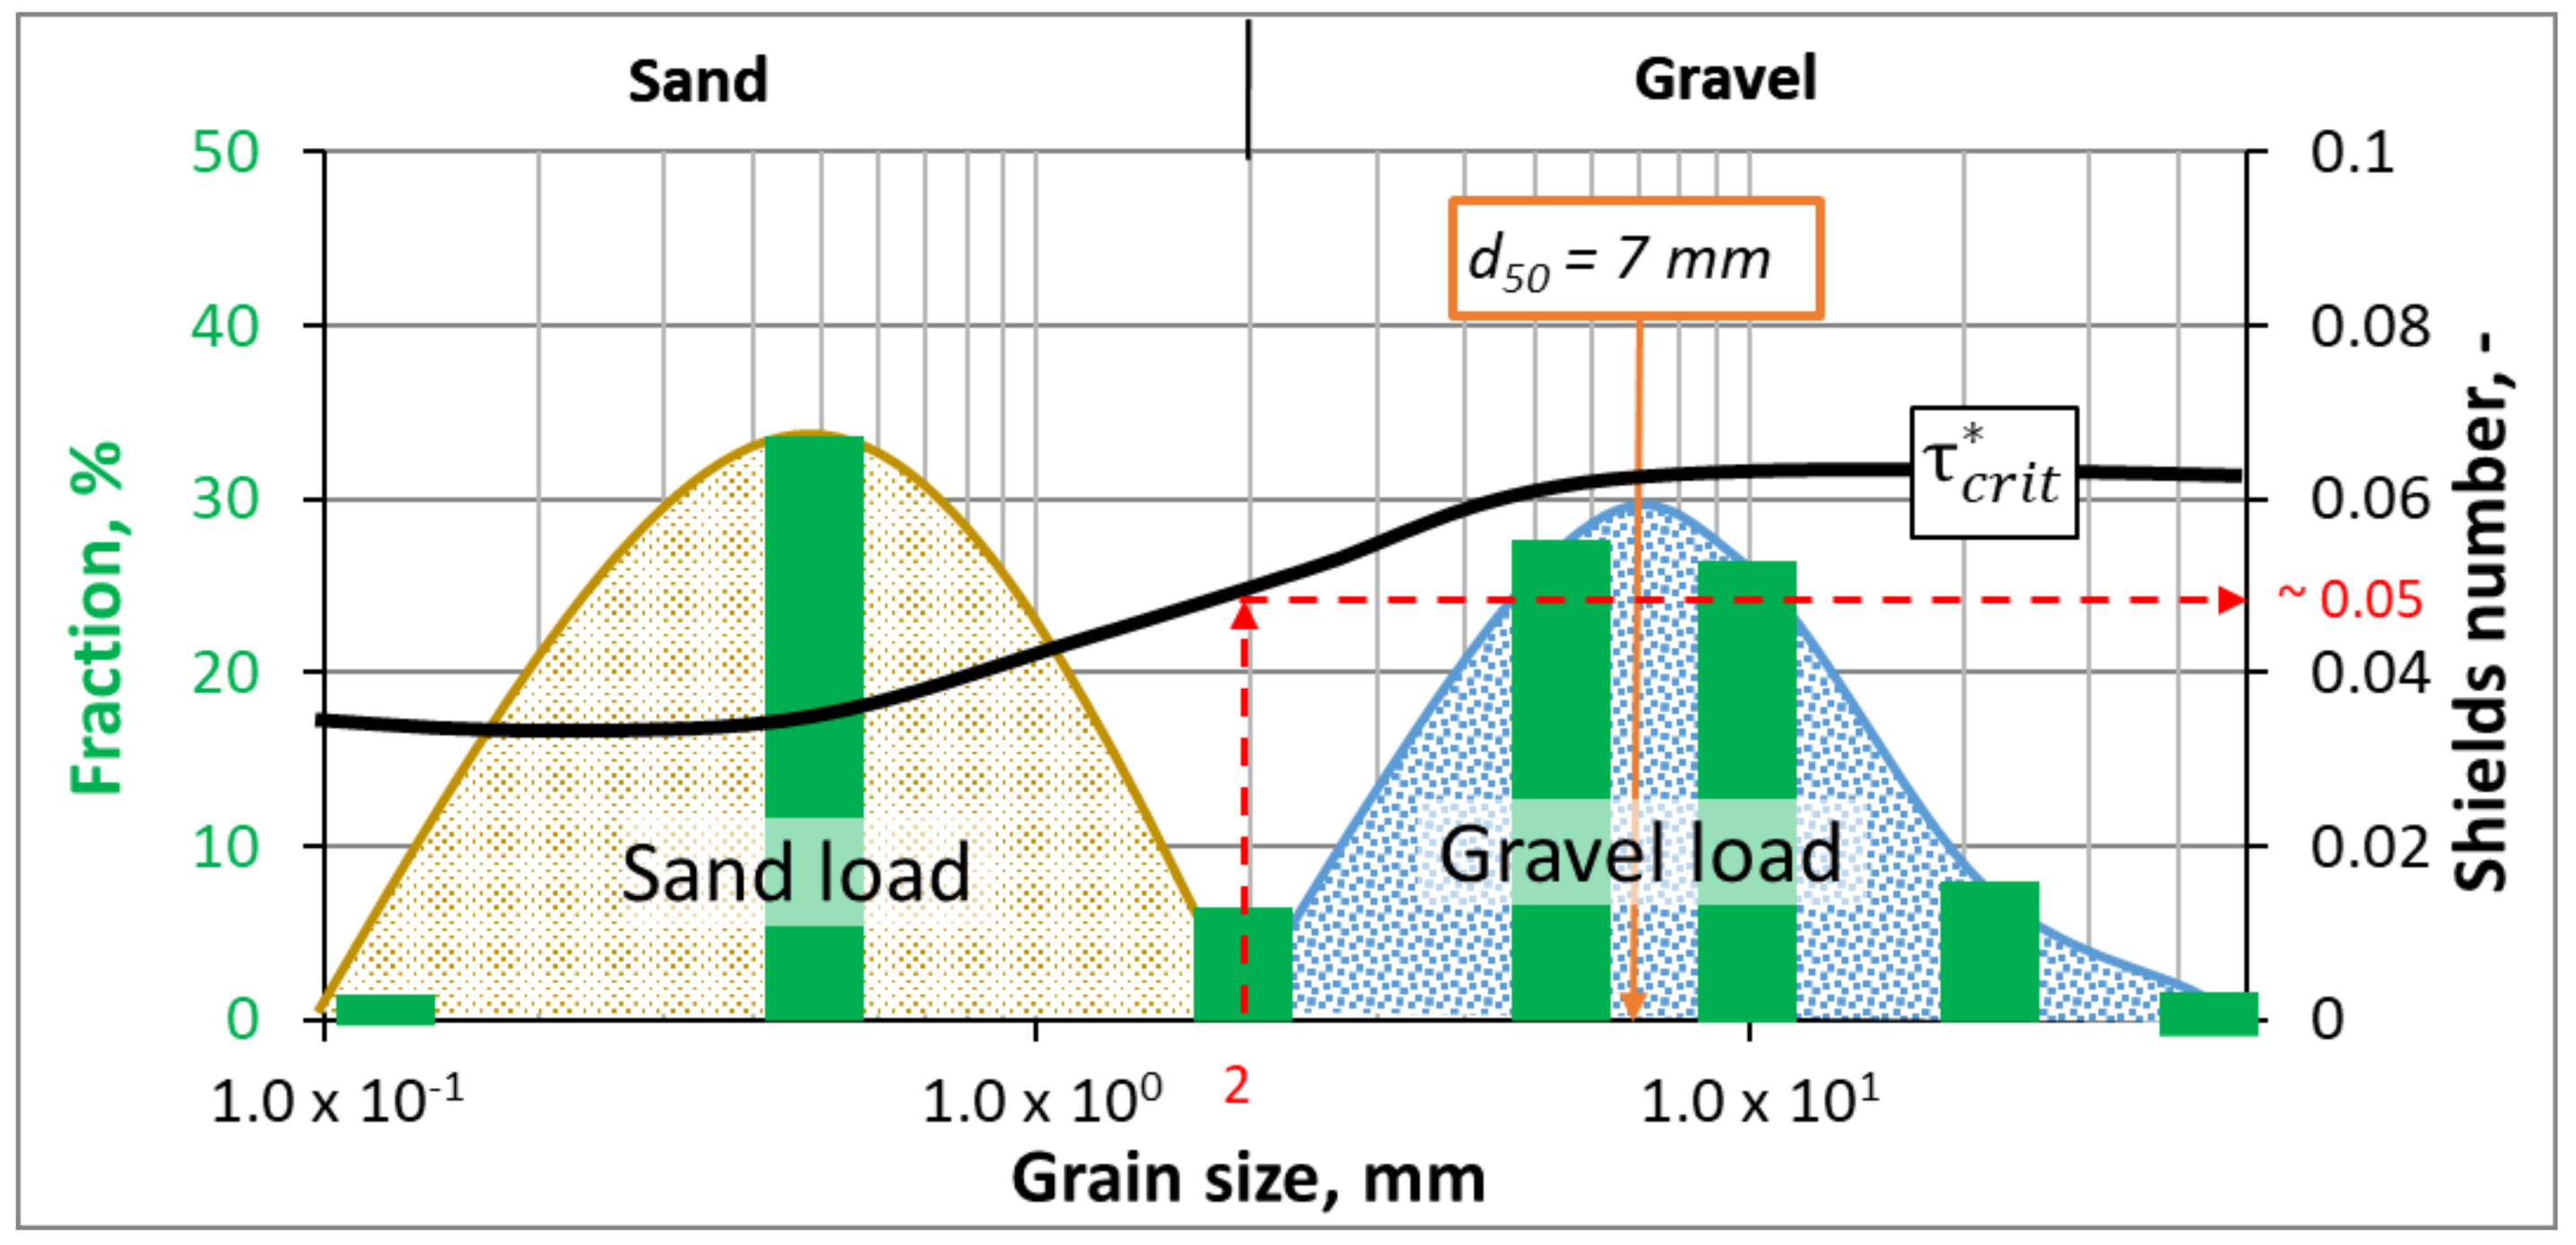
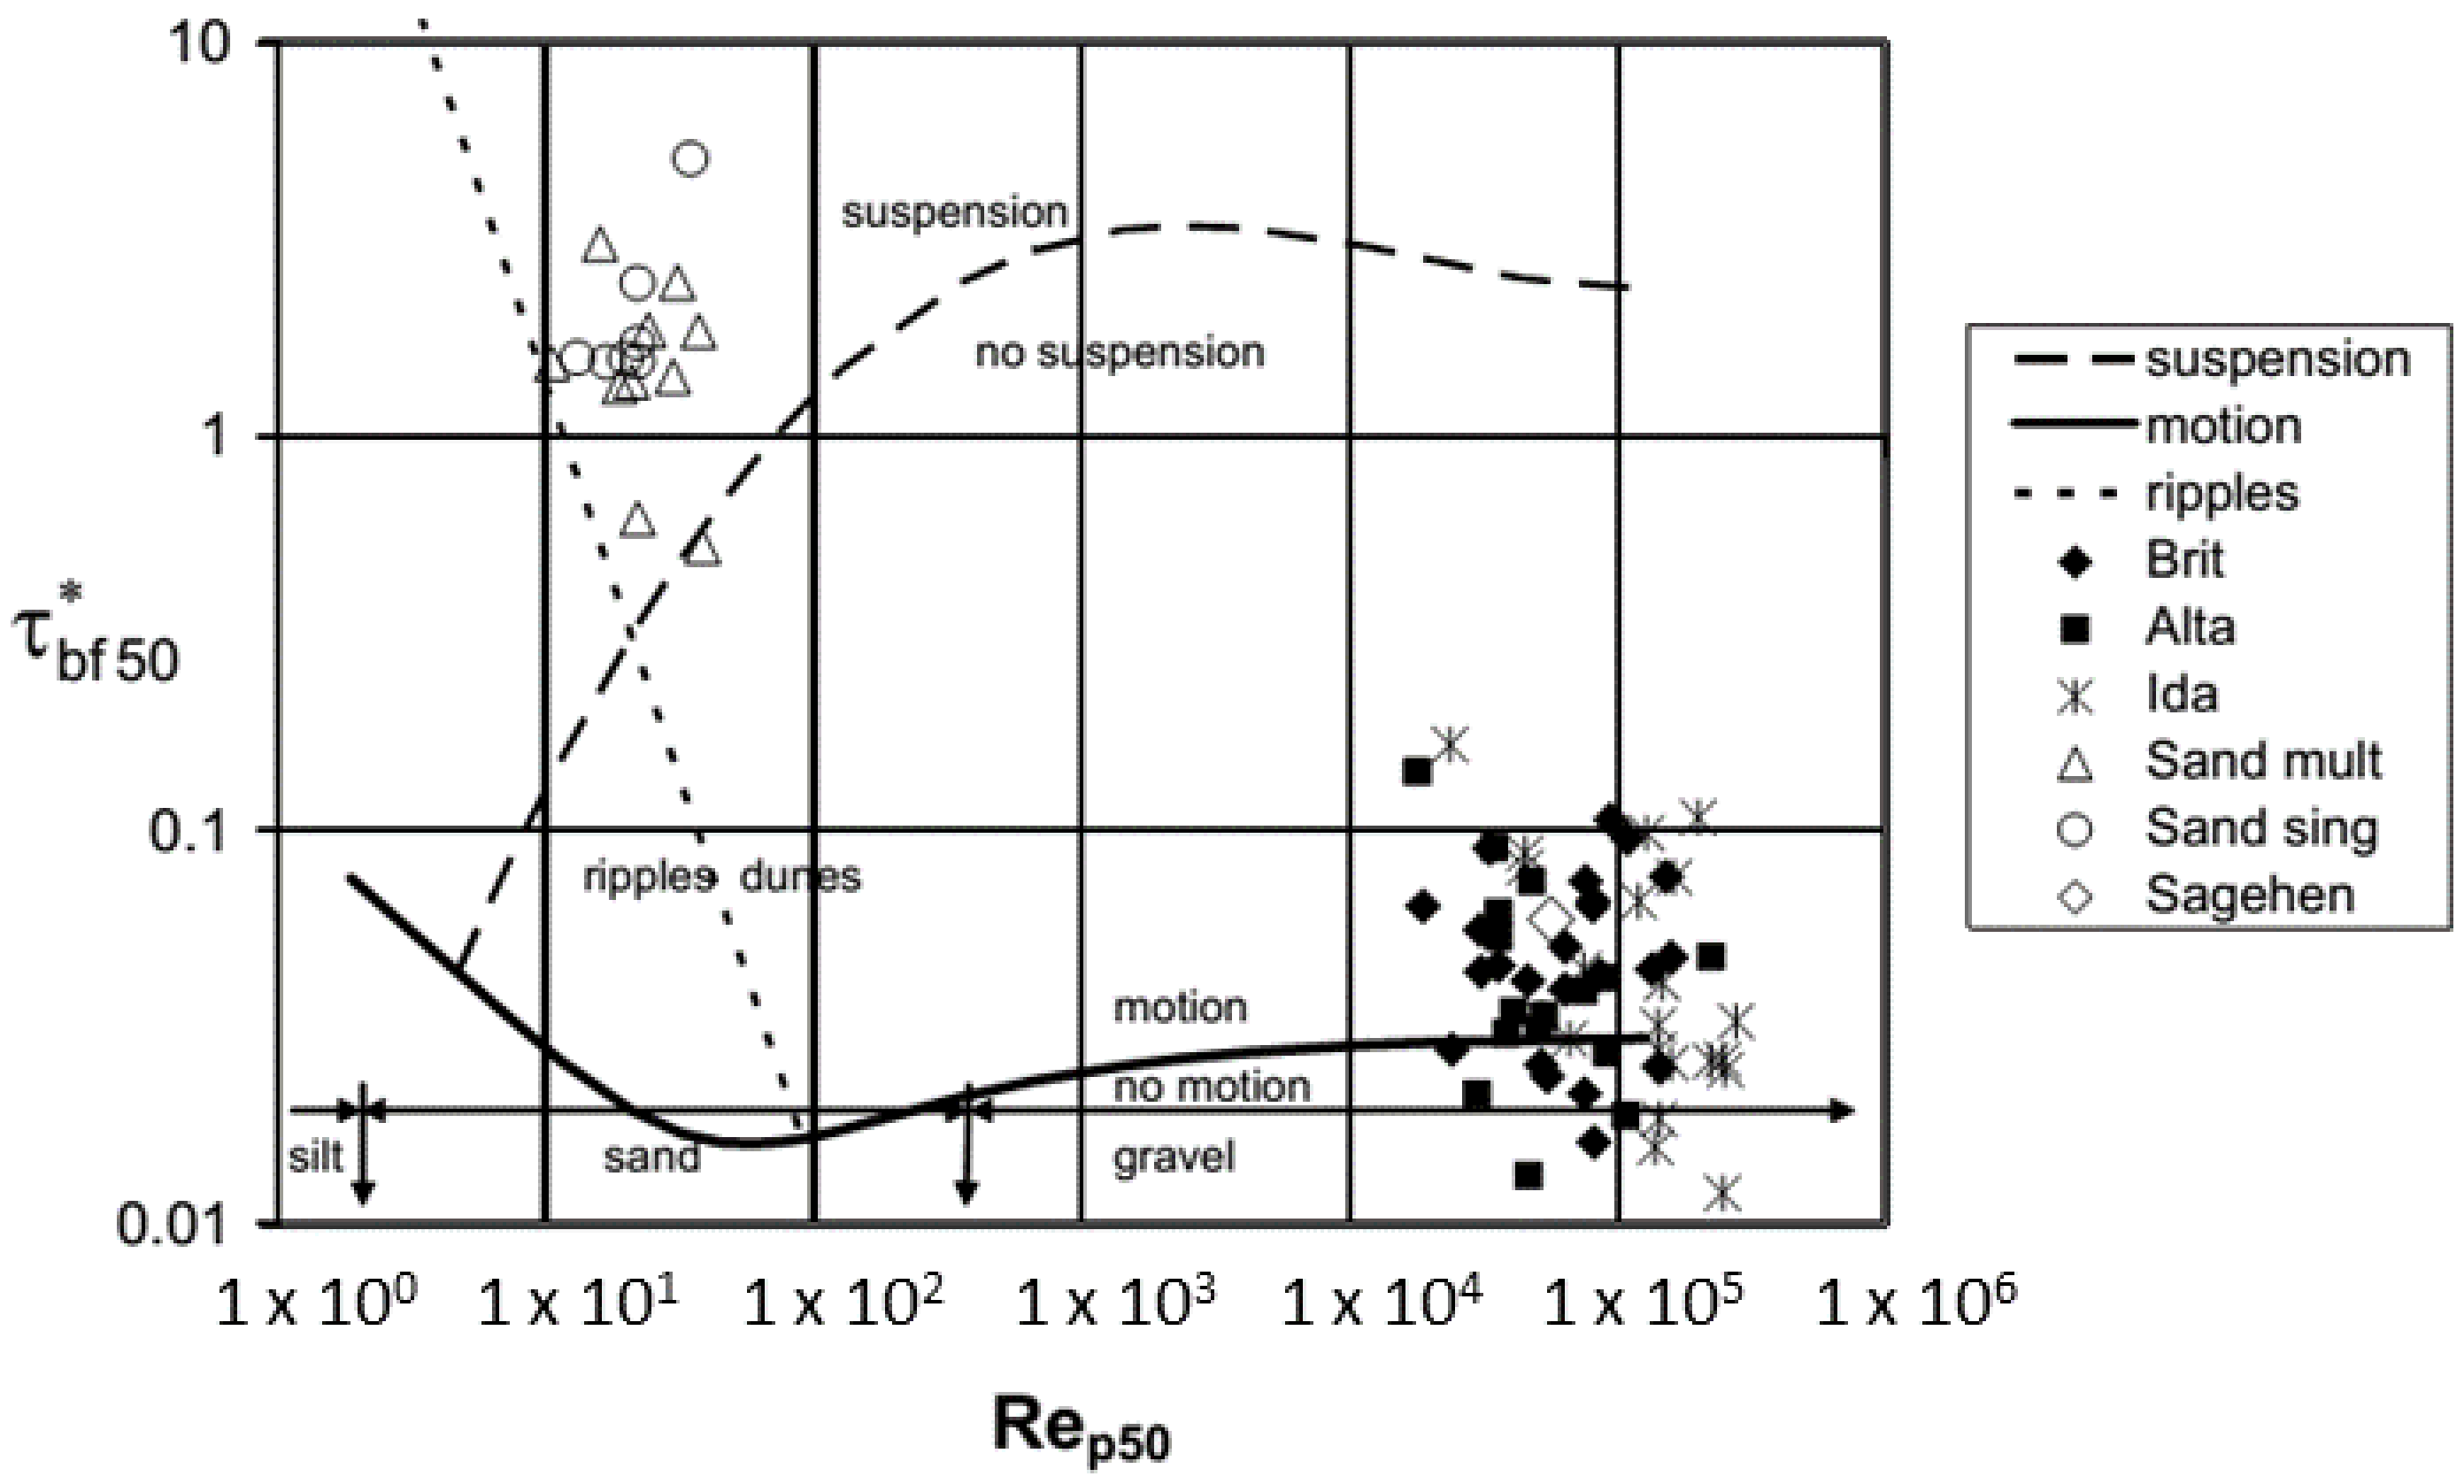
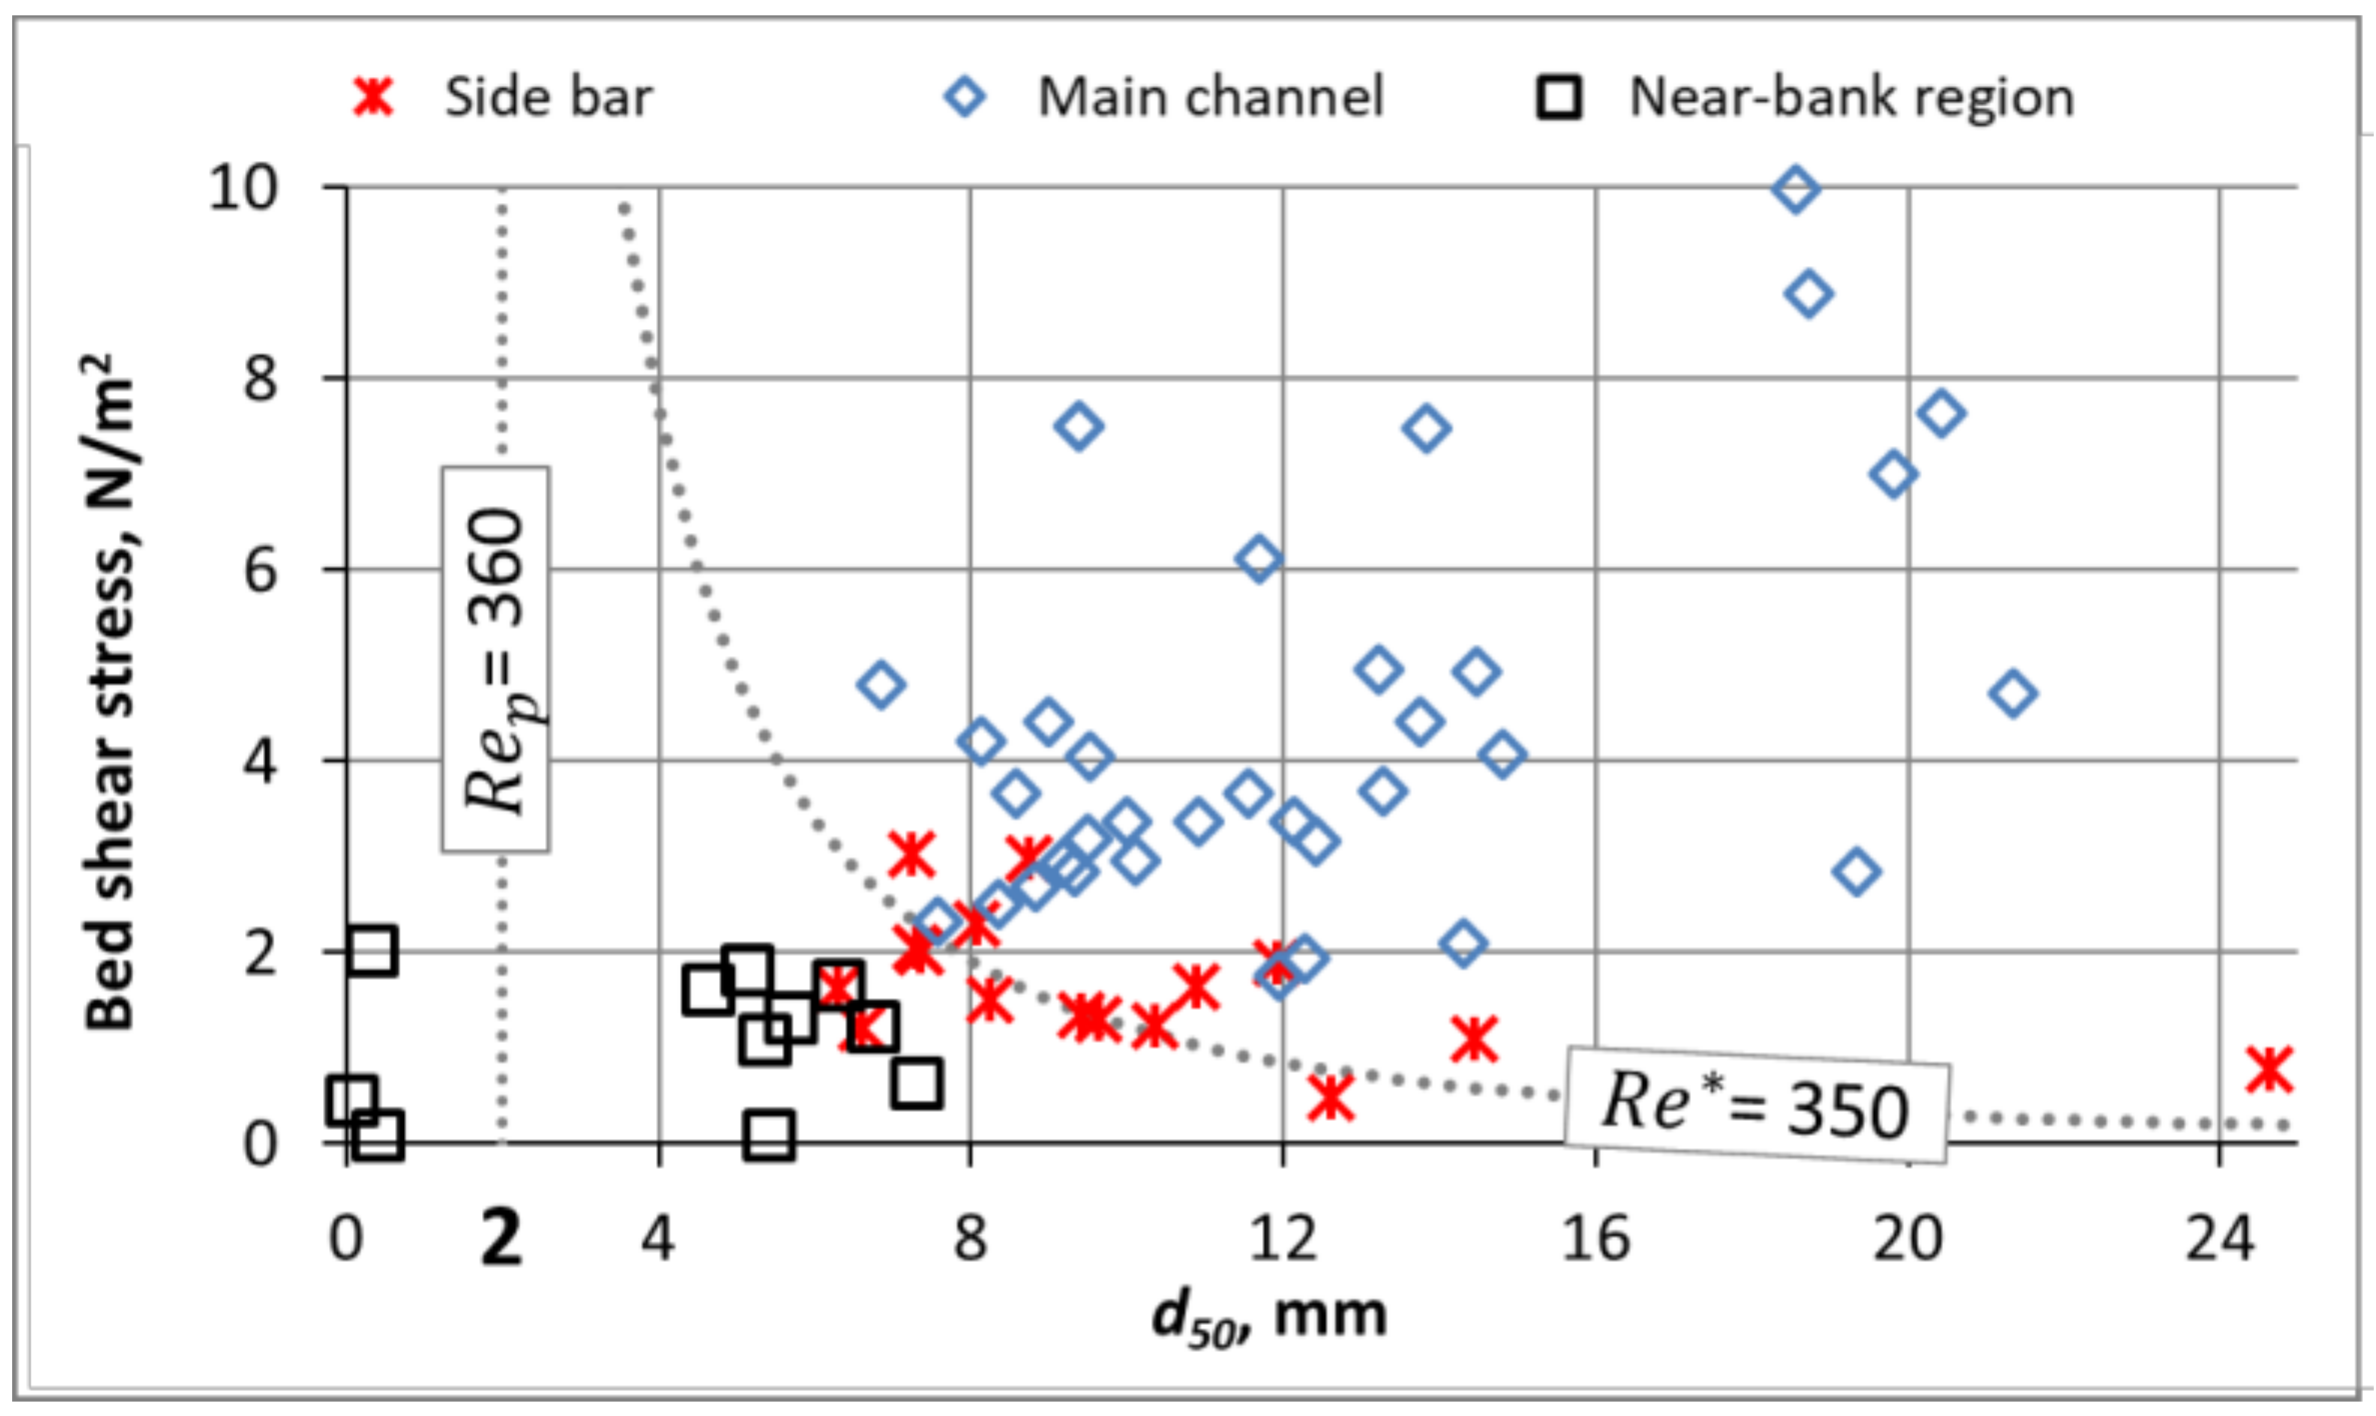
- Shields has already presented [22] that the shear Reynolds number (Re*) is a suitable variable (instead of the grain sizes) to define the relation of the acting forces and thus to classify the sediment transport in the near-surface zone. In other words, the effective force of the flow (together with the resistance of the grain) must be taken into account for the proper investigation of the stability and mobility of bed-forming particles.
- The applicability of both mathematical models of Shields [22] and van Rijn [20] can be described by the shear Reynolds number, but not by grain sizes. This also supports the fact that the shear Reynolds number-based classification of the sediment transport is expected to be more reliable than a grain-size-based method.
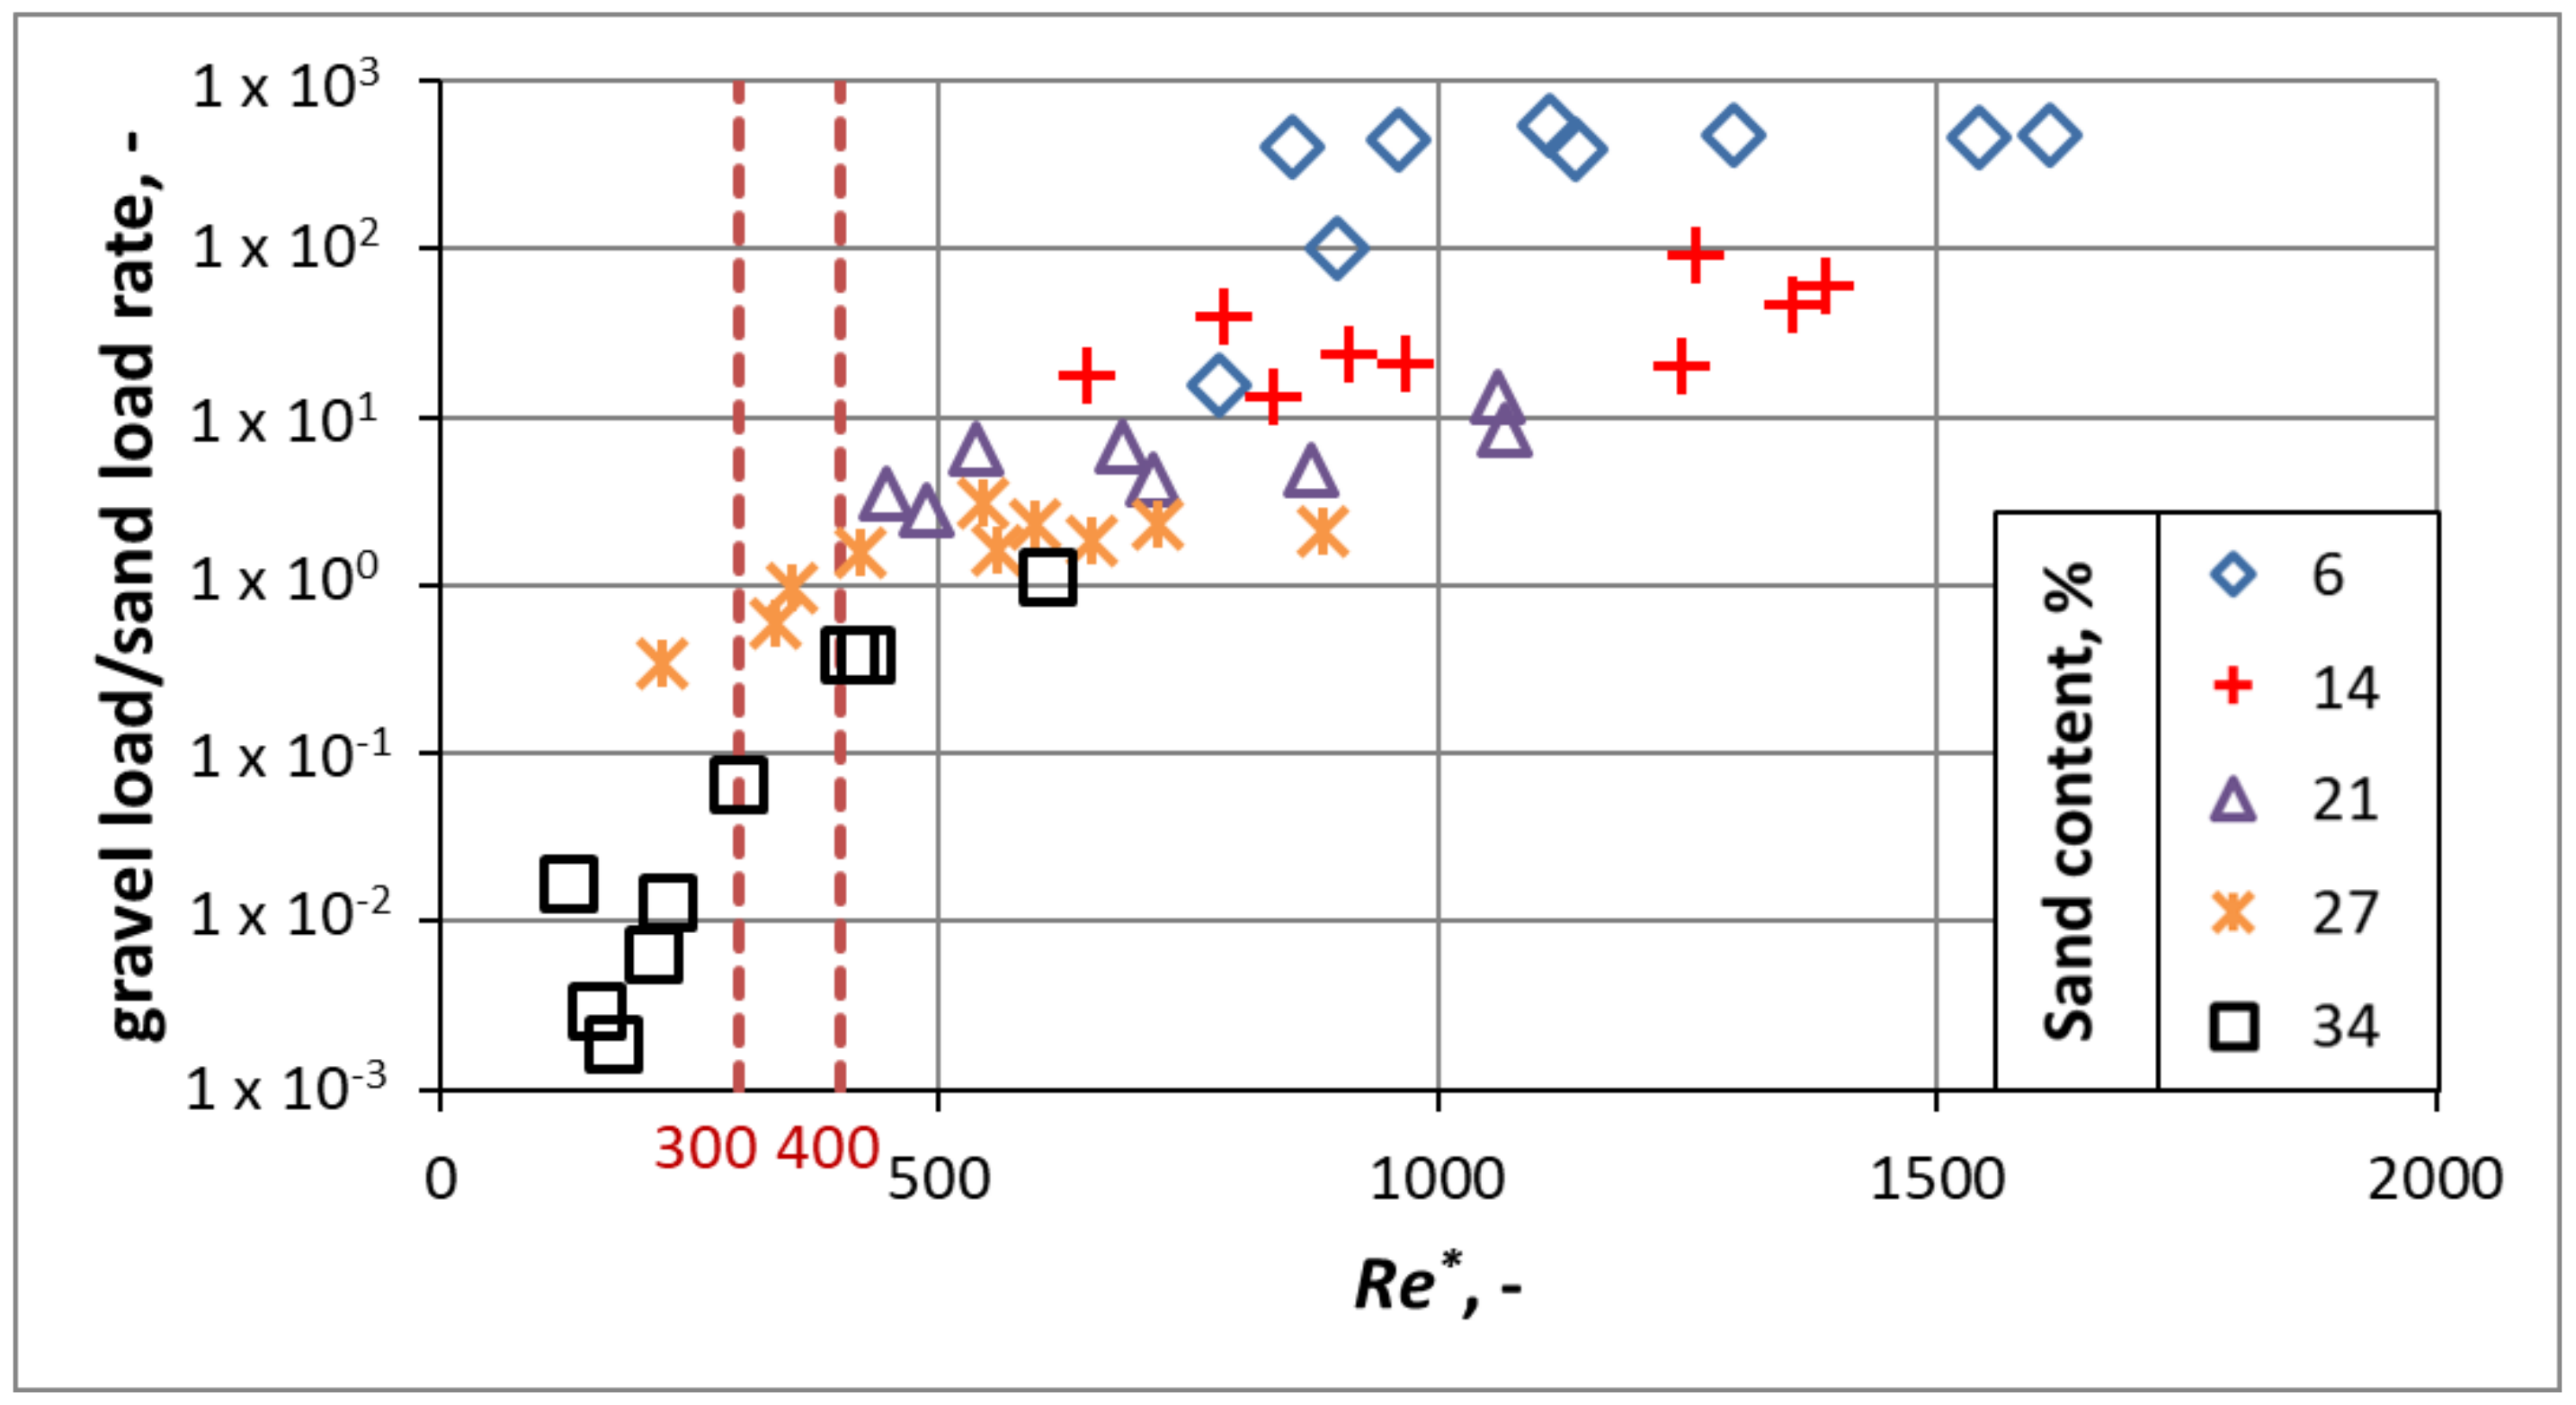
- The investigation of the measurements, for which the van Rijn bed load formula was validated and calibrated [20,57,58], suggests that the sand bed load can occur at lower Re* range, Re* < 400. Complementing this by the statement of Parker [8], it is assumed that in rougher hydraulic regime (Re* > ~1000), the sand transport appears only in suspended form, while the bed load consists mainly of gravel.
- The Re*-based assessment of the laboratory experiments of Wilcock et al. [26] shows that the Re* range ~3–400 seems to be a critical zone, where the yield of the sand and gravel are roughly the same. A characteristic grain size cannot refer to such phenomena.
2.4. Description of the Validation Measurements
2.5. Measurement Data Processing for Validation Purpose of the Stated Conjecture
3. Results
4. Discussion
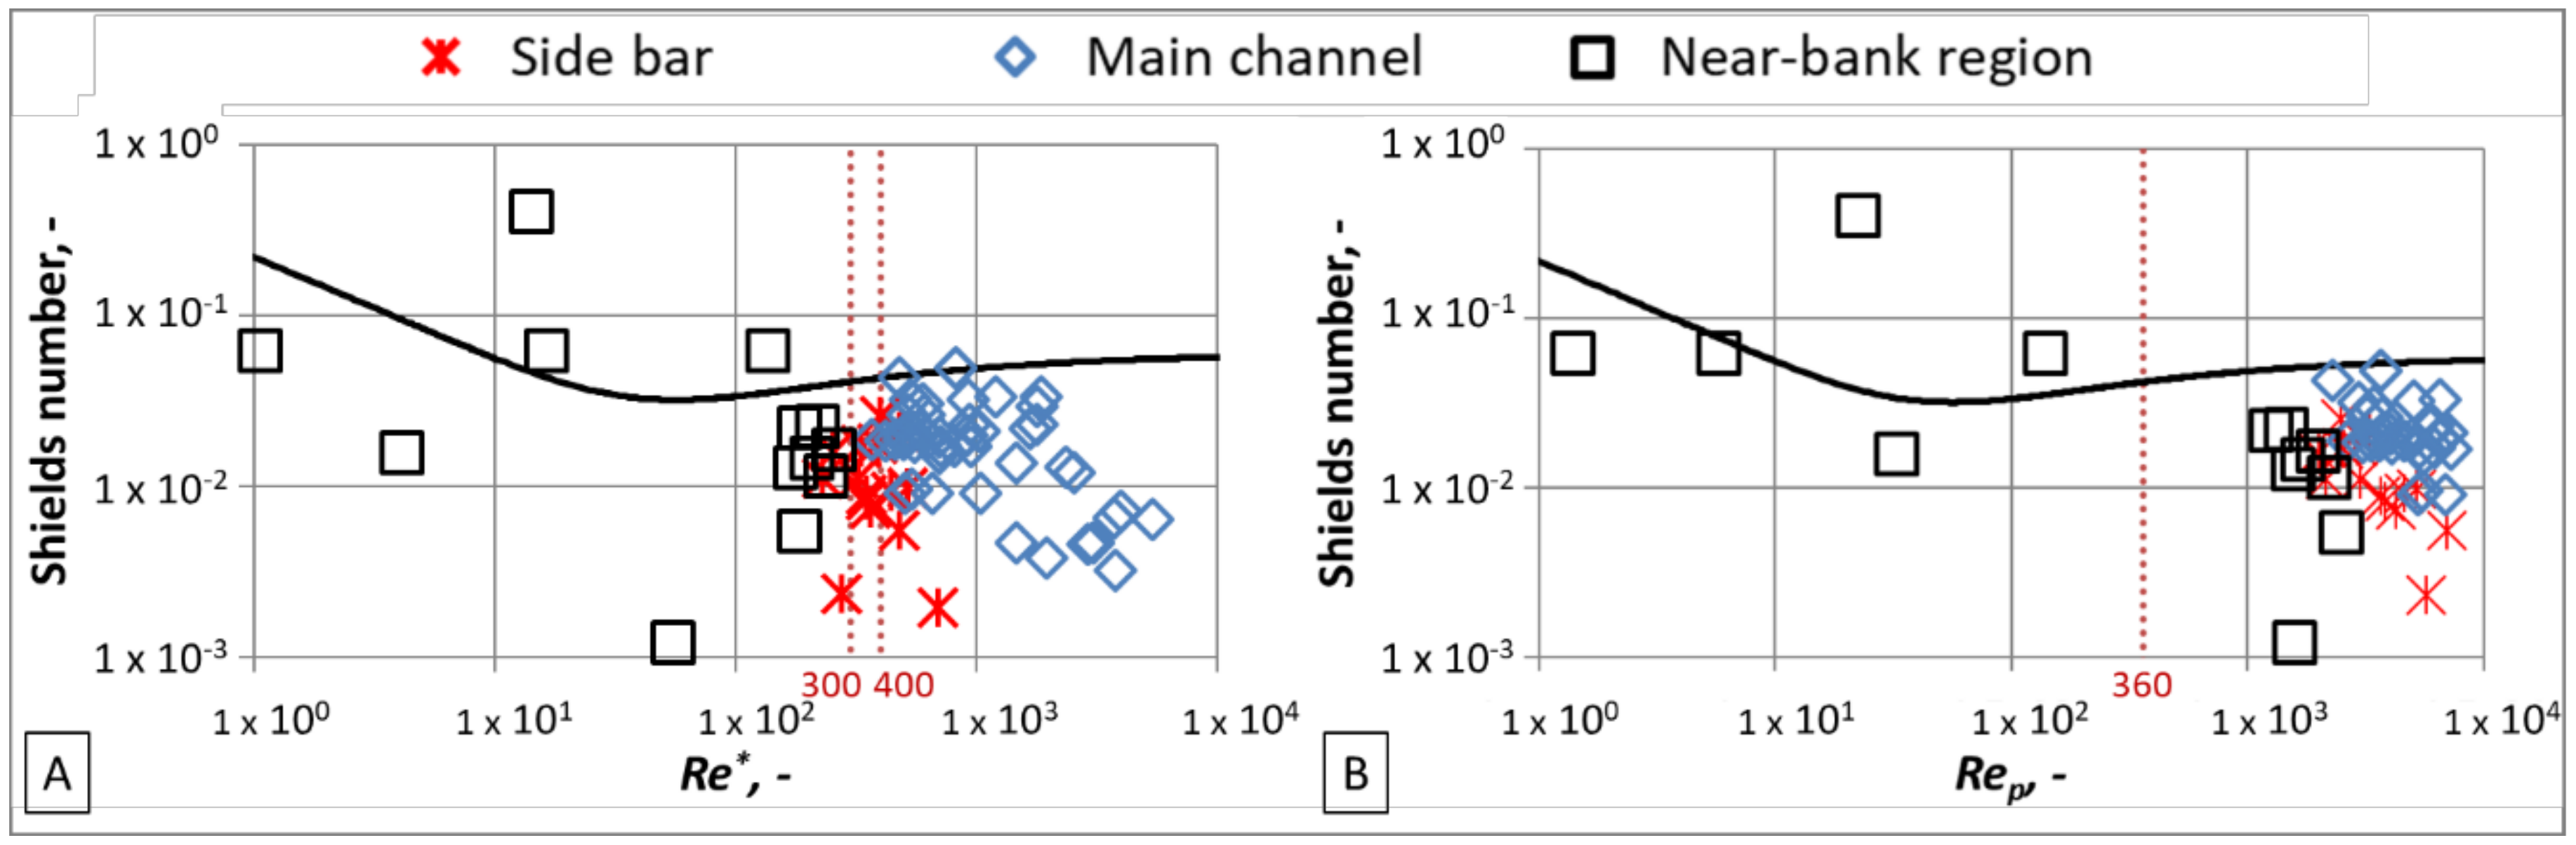
- Re* < ~300 → sand transport dominates;
- Re* > ~400 → gravel transport dominates;
- ~300 < Re* < ~400 → gravel accumulating and side bar formation is expected.
5. Conclusions
Author Contributions
Funding

Conflicts of Interest
Appendix A

| Main Channel, Bed Armor | Sand Aggradation, Near-Bank Points | Side Bar | |||||||||||||
|---|---|---|---|---|---|---|---|---|---|---|---|---|---|---|---|
| d50 | d50 | d50 | |||||||||||||
| Danube, rkm 1798–1795 |
0.054 0.053 0.046 |
0.020 0.009 0.009 |
498 1031 657 |
3546 10,835 6886 |
9.2 19.4 14.3 |
0.025 0.010 0.022 |
0.005 0.001 0.062 |
185 55 1 |
2512 1604 1 |
7.3 5.4 0.0 |
0.022 0.035 0.028 |
0.002 0.007 0.002 |
276 364 689 |
5705 4242 15,567 |
12.6 10.4 24.6 |
|
0.042 0.058 |
0.009 0.019 |
500 633 |
5252 4583 | 11.9 | 0.129 | 0.062 | 16 | 6 | 0.1 | 0.033 | 0.006 | 478 | 6995 | 14.5 | |
| 10.9 | 0.128 | 0.062 | 136 | 140 | 1.1 | 0.036 | 0.008 | 347 | 3802 | 9.6 | |||||
| 0.061 | 0.020 | 701 | 5005 | 11.6 | 0.045 | 0.399 | 14 | 23 | 0.3 | 0.041 | 0.009 | 443 | 4577 | 10.9 | |
| 0.066 | 0.030 | 598 | 3429 | 9.0 | 0.010 | 0.016 | 4 | 33 | 0.4 | 0.037 | 0.009 | 347 | 3676 | 9.4 | |
| 0.044 | 0.010 | 540 | 5481 | 12.3 | 0.044 | 0.010 | 519 | 5231 | 11.9 | ||||||
| 0.069 | 0.014 | 1465 | 12,559 | 21.4 | |||||||||||
| 0.058 | 0.003 | 3745 | 65,995 | 64.6 | |||||||||||
| 0.100 | 0.033 | 1855 | 10,182 | 18.6 | |||||||||||
| 0.064 | 0.026 | 605 | 3737 | 9.5 | |||||||||||
| 0.064 | 0.017 | 946 | 7251 | 14.8 | |||||||||||
| 0.069 | 0.043 | 475 | 2283 | 6.9 | |||||||||||
| 0.094 | 0.029 | 1766 | 10,314 | 18.7 | |||||||||||
| 0.084 | 0.022 | 1659 | 11,230 | 19.8 | |||||||||||
| 0.087 | 0.049 | 813 | 3658 | 9.4 | |||||||||||
| 0.056 | 0.021 | 535 | 3715 | 9.5 | |||||||||||
| 0.048 | 0.019 | 365 | 2657 | 7.6 | |||||||||||
| 0.087 | 0.049 | 813 | 3658 | 9.4 | |||||||||||
| 0.053 | 0.019 | 499 | 3631 | 9.3 | |||||||||||
| 0.058 | 0.021 | 581 | 4026 | 10.0 | |||||||||||
| 0.077 | 0.007 | 3955 | 46,694 | 51.3 | |||||||||||
| 0.049 | 0.004 | 1956 | 31,713 | 39.6 | |||||||||||
| 0.079 | 0.012 | 2543 | 23,129 | 32.1 | |||||||||||
| 0.061 | 0.005 | 3042 | 44,346 | 49.5 | |||||||||||
| 0.082 | 0.006 | 5374 | 67,130 | 65.3 | |||||||||||
| 0.060 | 0.005 | 2896 | 42,850 | 48.4 | |||||||||||
| 0.073 | 0.006 | 3714 | 46,211 | 50.9 | |||||||||||
| 0.048 | 0.005 | 1449 | 21,195 | 30.3 | |||||||||||
| 0.066 | 0.020 | 913 | 6486 | 13.7 | |||||||||||
| 0.079 | 0.013 | 2345 | 20,525 | 29.6 | |||||||||||
| Laboratory measurements | 0.065 | 0.032 | 528 | 2951 | 8.1 | 0.040 | 0.022 | 186 | 1262 | 4.6 | 0.035 | 0.011 | 228 | 2155 | 6.6 |
| 0.078 | 0.032 | 915 | 5087 | 11.7 | 0.033 | 0.013 | 177 | 1570 | 5.3 | 0.055 | 0.026 | 398 | 2481 | 7.2 | |
| 0.070 | 0.023 | 930 | 6118 | 13.2 | 0.036 | 0.014 | 207 | 1727 | 5.7 | 0.055 | 0.021 | 478 | 3287 | 8.7 | |
| 0.060 | 0.026 | 518 | 3194 | 8.6 | 0.043 | 0.022 | 219 | 1474 | 5.1 | 0.045 | 0.017 | 329 | 2537 | 7.4 | |
| 0.086 | 0.033 | 1197 | 6548 | 13.8 | 0.041 | 0.016 | 257 | 2015 | 6.3 | 0.039 | 0.011 | 320 | 3016 | 8.3 | |
| 0.058 | 0.017 | 704 | 5374 | 12.1 | 0.035 | 0.011 | 237 | 2220 | 6.7 | 0.045 | 0.017 | 330 | 2506 | 7.3 | |
| 0.061 | 0.017 | 805 | 6151 | 13.3 | 0.048 | 0.018 | 387 | 2914 | 8.1 | ||||||
| 0.070 | 0.021 | 1018 | 7012 | 14.5 | 0.040 | 0.016 | 253 | 2005 | 6.3 | ||||||
| 0.056 | 0.016 | 697 | 5558 | 12.4 | |||||||||||
| 0.054 | 0.018 | 549 | 4084 | 10.1 | |||||||||||
| 0.087 | 0.023 | 1785 | 11,739 | 20.4 | |||||||||||
| 0.050 | 0.019 | 417 | 3066 | 8.3 | |||||||||||
| 0.052 | 0.019 | 459 | 3339 | 8.8 | |||||||||||
References
- Dey, S. Fluvial Processes: Meandering and Braiding. In Fluvial Hydrodynamics: Hydrodynamic and Sediment Transport Phenomena; Springer: Berlin/Heidelberg, Germany, 2014; pp. 529–562. [Google Scholar]
- Leopold, B.L.; Wolman, M.G. River Channel Patterns: Braided, Meandering and Straight; Geological Survey Professional Paper; U.S. Government Printing Office: Washington, DC, USA, 1957; Volume 282.
- Lane, E.W. A Study of the Shape of Channels Formed by Natural Streams Flowing in Erodible Material; U.S. Army Corps of Engineers Report; The Division: Omaha, NE, USA, 1957; Volume 141. [Google Scholar]
- Leopold, L.B.; Wolman, M.G. River meanders. Geol. Soc. Am. Bull. 1960, 71, 769–794. [Google Scholar] [CrossRef]
- Schumm, S.A. Evolution and response of the fluvial system, sedimentologic implications. SEPM Spec. Publ. 1981, 31, 19–29. [Google Scholar]
- Jaeggi, M.N.R. Effect of Engineering Solutions on Sediment Transport. In Dynamics of Gravel-Bed Rivers; Billi, P., Hey, R.D., Thorne, C.R., Tacconi, P., Eds.; John Wiley & Sons Ltd.: Hoboken, NJ, USA, 1992. [Google Scholar]
- García, M.H. Sediment Transport and Morphodynamics. In Sedimentation Engineering: Processes, Measurements, Modeling, and Practice, Manuals and Reports on Engineering Practice; ASCE: Reston, VA, USA, 2008; pp. 21–163. [Google Scholar]
- Parker, G. Transport of Gravel and Sediment Mixtures. In Sedimentation Engineering; Garcia, M., Ed.; American Society of Civil Engineers: Reston, VA, USA, 2008; ISBN 978-0-7844-0814-8. [Google Scholar]
- Schumm, S.A.; Dumont, J.F.; Holbrook, J.M. Active Tectonics and Alluvial Rivers; Cambridge University Press: Cambridge, UK; New York, NY, USA; Melbourne, Australia, 2000; ISBN 0-521-66110-2. [Google Scholar]
- Edward, J. Hickin. Chapter 4. In Fluid Mechanics; Online course note; Simon Fraser University and R.S. Graphics and Printing: Burnaby, BC, Canada, 2009. [Google Scholar]
- Piton, G.; Recking, A. The concept of travelling bedload and its consequences for bedload computation in mountain streams. Earth Surf. Process. Landf. 2017, 42, 1505–1519. [Google Scholar] [CrossRef]
- Farkas-Iványi, K.; Guti, G. The Effect of Hydromorphological Changes on Habitat Composition of the Szigetköz Floodplain. ACTA Zool. Bulg. 2014, 7, 117–121. [Google Scholar]
- Hankó, Z.; Starosolszky, Ö.; Bakonyi, P. Megvalósíthatósági tanulmány a Duna környezetének és hajózhatóságának fejlesztésére (Danube Environmental and navigation Project, Feasibility Study). Vízügyi Közlemények 1996, 78, 291–315. [Google Scholar]
- Rákóczi, L. A Duna-meder sorsa Szap és Szob között (Destiny of the Danube channel between Szap and Szob). Vízügyi Közlemények 2000, 82, 262–280. [Google Scholar]
- Goda, L. A Duna gázlói Pozsony-Mohács között (Shallows of the River Danube between Pozsony, Bratislava and Mohács. Vízügyi Közlemények 1995, 77, 71–102. [Google Scholar]
- Baranya, S.; Józsa, J.; Török, G.T.; Ficsor, J.; Mohácsiné Simon, G.; Habersack, H.; Haimann, M.; Riegler, A.; Liedermann, M.; Hengl, M. A Duna hordalékvizsgálatai a SEDDON osztrák-magyar együttműködési projekt keretében (Introduction of the joint Austro-Hungarian sediment research under the SEDDON ERFE-project). Hidrológiai Közlöny 2015, 95, 41–46. [Google Scholar]
- Török, G.T.; Baranya, S. Morphological investigation of a critical reach of the upper Hungarian Danube. Period. Polytech. Civ. Eng. 2017, 61. [Google Scholar] [CrossRef]
- Észak-Dunántúli Vízügyi Igazgatóság. Nagyvízi mwe haederkezelési terv (High Water River Management Plan) 01.nmt.02. (egyeztetési terv)—Duna 1809,76—1786,00 fkm; 2014; Professional report; Észak-Dunántúli Vízügyi Igazgatóság: Győr, Hungary, 2014. [Google Scholar]
- Liedermann, M.; Gmeiner, P.; Pessenlehner, S.; Haimann, M.; Hohenblum, P.; Habersack, H. A Methodology for Measuring Microplastic Transport in Large or Medium Rivers. Water 2018, 10, 414. [Google Scholar] [CrossRef]
- Van Rijn, L.C. Sediment Transport, Part I: Bed Load Transport. J. Hydraul. Eng. 1984, 110, 1431–1456. [Google Scholar] [CrossRef]
- Wilcock, P.R.; Crowe, J.C. Surface-based transport model for mixed-size sediment. J. Hydraul. Eng. 2003, 129, 120–128. [Google Scholar] [CrossRef]
- Shields, A. Application of Similarity Principles and Turbulence Research to Bed-Load Movement. Mitt. Preuss. Versuchsanst. Wasserbau Schiffbau 1936, 26, 47. [Google Scholar]
- Bergillos, R.J.; Rodrígez-Delgado, C.; Millares, A.; Ortega-Sánchez, M.; Losada, M.A. Impact of river regulation on a Mediterranean delta: Assessment of managed versus unmanaged scenatios. Water Resour. Res. 2016, 52, 5132–5148. [Google Scholar] [CrossRef]
- Bergillos, R.J.; Ortega-Sánchez, M.; Masselink, G.; Losada, M.A. Morpho-sedimentary dynamics of a micro-tidal mixed sand and gravel beach, Playa Granada, southern Spain. Mar. Geol. 2016, 379, 28–38. [Google Scholar] [CrossRef]
- Fischer-Antze, T.; Rüther, N.; Olsen, N.; Gutknecht, D. Three-dimensional (3D) modeling of non-uniform sediment transport in a channel bend with unsteady flow. J. Hydraul. Res. 2009, 47, 670–675. [Google Scholar] [CrossRef]
- Wilcock, P.R.; Kenworthy, S.T.; Crowe, J.C. Experimental Study of the Transport of Mixed Sand and Gravel. Water Resour. Res. 2001, 37, 3349–3358. [Google Scholar] [CrossRef]
- Wilcock, P.R. A two-fraction model for the transport of sand/gravel mixtures. Water Resour. Res. 2002, 38, 1–12. [Google Scholar] [CrossRef]
- Sziło, J.; Bialik, R.J. Grain Size Distribution of Bedload Transport in a Glaciated Catchment (Baranowski Glacier, King George Island, Western Antarctica). Water 2018, 10, 360. [Google Scholar] [CrossRef]
- Bialik, R.J. Numerical study of saltation of non-uniform grains. J. Hydraul. Res. 2011, 49, 697–701. [Google Scholar] [CrossRef]
- Einstein, H.A. The Bed-Load Function for Sediment Transportation in Open Channel Flows; Department of Agriculture, Soil Conservation Service: Washington, DC, USA, 1950. [Google Scholar]
- Ashida, K.; Michiue, M. Study on hydraulic resistance and bedload transport rate in alluvial streams. Trans. Jpn. Soc. Civ. Eng. 1972, 206, 59–69. [Google Scholar] [CrossRef]
- Meyer-Peter, E.; Müller, R. Formulas for Bed-Load Transport. In Proceeding of the IAHSR 2nd Meeting, Stockholm, Sweden, 7–9 June 1948. [Google Scholar]
- Wiberg, P.L.; Smith, J.D. Model for calculating bed load transport of sediment. J. Hydraul. Eng. 1989, 115, 101–123. [Google Scholar] [CrossRef]
- Török, G.T.; Baranya, S.; Rüther, N. 3D CFD Modeling of Local Scouring, Bed Armoring and Sediment Deposition. Water 2017, 9, 56. [Google Scholar] [CrossRef]
- Gaeuman, D.; Andrews, E.D.; Krause, A.; Smith, W. Predicting fractional bed load transport rates: Application of the Wilcock-Crowe equations to a regulated gravel bed river. Water Resour. Res. 2009, 45, 1–15. [Google Scholar] [CrossRef]
- Janssen, S.R. Testing Sediment Transport Models under Partial Transport Conditions. Master’s Thesis, University of Twente, Enschede, The Netherlands, 2010. [Google Scholar]
- Török, G.T.; Baranya, S.; Rüther, N. Three-dimensional numerical modeling of non-uniform sediment transport and bed armoring process. In Proceedings of the 18th Congress of the Asia & Pacific Division of the International Association for Hydro-Environment Engineering and Research, Jeju, Korea, 19–23 August 2012. [Google Scholar]
- Rüther, N.; Olsen, N.R.B. Modelling free-forming meander evolution in a laboratory channel using three-dimensional computational fluid dynamics. Geomorphology 2007, 89, 308–319. [Google Scholar] [CrossRef]
- Rüther, N.; Olsen, N.R.B. 3D modeling of transient bed deformation in a sine-generated laboratory channel with two different width to depth ratios. In Proceedings of the International Conference on Fluvial Hydraulics, Lisbon, Portugal, 6–8 September 2006; Taylor & Francis: New York, NY, USA, 2006. [Google Scholar]
- Rüther, N.; Olsen, N.R.B. Three-dimensional modeling of sediment transport in a narrow 90° channel bend. J. Hydraul. Eng. 2005, 131, 917–920. [Google Scholar] [CrossRef]
- Olsen, N.R.B.; Melaaen, M.C. Three-dimensional calculation of scour around cylinders. J. Hydraul. Eng. 1993, 119, 1048–1054. [Google Scholar] [CrossRef]
- Bihs, H.; Olsen, N.R.B. Numerical Modeling of Abutment Scour with the Focus on the Incipient Motion on Sloping Beds. J. Hydraul. Eng. 2011, 137, 1287–1292. [Google Scholar] [CrossRef]
- Deltares. 3D/2D modelling suite for integral water solutions. Delft3D-FLOW, User Manual; Deltares: Delft, The Netherlands, 2014; Volume 710. [Google Scholar]
- Skinner, C.J.; Coulthard, T.J.; Schwanghart, W.; Van De Wiel, M.J.; Hancock, G. Global sensitivity analysis of parameter uncertainty in landscape evolution models. Geosci. Model Dev. 2018, 11, 4873–4888. [Google Scholar] [CrossRef]
- Unal, N.E. Shear Stress-Based Analysis of Sediment Incipient Deposition in Rigid Boundary Open Channels. Water 2018, 10, 1399. [Google Scholar] [CrossRef]
- Habersack, H.; Kreisler, A. Sediment Transport Processes. In Dating Torrential Processes on Fans and Cones; Beniston, M., Ed.; Springer: Dordrecht, The Netherlands; Heidelberg, Germany; New York, NY, USA; London, UK, 2013; ISBN 9789400743359. [Google Scholar]
- Zanke, U.C.E. Hydromechanik der Gerinne und Küstengewässer; Blackwell; Vieweg+Teubner Verlag: Berlin, Germany, 2002; ISBN 978-3-322-80212-5. [Google Scholar]
- Parker, G.; Klingeman, P.C. On why gravel rivers are paved. Water Resour. Res. 1982, 18, 1409–1423. [Google Scholar] [CrossRef]
- Cushman-Roisin, B. Rivers and Streams, Chapter 15. In Environenmental Fluid Mechanics; John Wiley & Sons, Inc.: Hanover, NH, USA, 2019. [Google Scholar]
- Parker, G. Surface-based bedload transport relation for gravel rivers. J. Hydraul. Res. 1990, 28, 417–436. [Google Scholar] [CrossRef]
- Dey, B.S.; Papanicolaou, A. Sediment Threshold under Stream Flow: A State-of-the-Art Review. KSCE J. Civ. Eng. 2008, 12, 45–60. [Google Scholar] [CrossRef]
- Dwivedi, A.; Melville, B.W.; Shamseldin, A.Y.; Guha, T.K. Analysis of hydrodynamic lift on a bed sediment particle. J. Geophys. Res. 2011, 116. [Google Scholar] [CrossRef]
- Morsi, S.A.; Alexander, A.J. An investigation of particle trajectories in two phase flow systems. J. Fluid Mech. 1972, 55, 193–208. [Google Scholar] [CrossRef]
- Rubinow, S.I.; Keller, J.B. The transverse force on a spinning sphere moving in a viscous fluid. J. Fluid Mech. 1961, 11, 447–459. [Google Scholar] [CrossRef]
- Saffman, P.G. The lift on a small sphere in a slow shear flow. J. Fluid Mech. 1965, 22, 385–400. [Google Scholar] [CrossRef]
- Dey, S. Sediment threshold. Appl. Math. Model. 1999, 23, 399–417. [Google Scholar] [CrossRef]
- Fernandez Luque, R. Erosion and Transport of Bed-load Sediment. BSc Thesis, Delft Technical University, Delft, The Netherlands, 1974. [Google Scholar]
- Fernandez Luque, R.; van Beek, R. Erosion and Transport of Bed-load Sediment. J. Hydraul. Res. 1976, 14, 127–144. [Google Scholar] [CrossRef]
- Török, G.T.; Baranya, S.; Rüther, N.; Spiller, S. Laboratory analysis of armor layer development in a local scour around a groin. In Proceedings of the International Conference on Fluvial Hydraulics, RIVER FLOW 2014, Lausanne, Switzerland, 3–5 September 2014; Taylor and Francis Group: Lausanne, Switzerland, 2014; pp. 1455–1462. [Google Scholar]
- Detert, M.; Weitbrecht, V. User guide to gravelometric image analysis by BASEGRAIN. In Advances in River Sediment Research; Fukuoka, S., Nakagawa, H., Sumi, T., Zhang, H., Eds.; CRC Press: Boca Raton, FL, USA, 2013; ISBN 9781138000629. [Google Scholar]
- Kim, S.C.; Friedrichs, C.T.; Maa, J.P.Y.; Wright, L.D. Estimating bottom stress in tidal boundary layer from Acoustic Doppler velocimeter data. J. Hydraul. Eng. 2000, 126, 399–406. [Google Scholar] [CrossRef]
- Cea, L.; Puertas, J.; Pena, L. Velocity measurements on highly turbulent free surface flow using ADV. Exp. Fluids 2007, 42, 333–348. [Google Scholar] [CrossRef]
- Przyborowski, Ł.; Loboda, A.M.; Bialik, R.J. Experimental investigations of interactions between sand wave movements, flow structure, and individual aquatic plants in natural rivers: A case study of Potamogeton Pectinatus, L. Water 2018, 10, 1166. [Google Scholar] [CrossRef]
- Török, G.T. Methodological Improvement of Morphodynamic Investigation Tools for Rivers with Non-Uniform Bed Material By. Ph.D. Thesis, Budapest University of Technology and Economics, Budapest, Hungary, 2018. [Google Scholar]
- Koris, K. Hidrológia II. (Hydrology II); 1. kiadás.; Class note (Egyetemi jegyzet): Budapest, Hungary, 2014; ISBN 978-963-12-0752-1. [Google Scholar]
- Mueller, E.R.; Pitlick, J.; Nelson, J.M. Variation in the reference Shields stress for bed load transport in gravel-bed streams and rivers. Water Resour. Res. 2005, 41. [Google Scholar] [CrossRef]
- Vowinckel, B.; Jain, R.; Kempe, T.; Fröhlich, J. Entrainment of single particles in a turbulent open-channel flow: A numerical study. J. Hydraul. Res. 2016, 54, 158–171. [Google Scholar] [CrossRef]
- EasyFit Professional, Version 5; MathWave Technologies: Washington, DC, USA, 2015.
- Aristizabal, R.J. Estimating the Parameters of the Three-Parameter Lognormal Distribution. FIU Electronic Theses and Dissertation, Florida International University, St. Miami, FL, USA, 2012. [Google Scholar]


| Constants 1 | Variables | ||
|---|---|---|---|
| d, | |||
| , g, R | d |
| Landform Classes | Re* | Rep | |||
|---|---|---|---|---|---|
| <300 | < > | >400 | <360 | >360 | |
| Sand aggradation, near-bank points | 95% | 5% | 0% | 15% | 85% |
| Side bar | 5% | 60% | 35% | 0% | 100% |
| Main channel, bed armor | 0% | 3% | 97% | 0% | 100% |
© 2019 by the authors. Licensee MDPI, Basel, Switzerland. This article is an open access article distributed under the terms and conditions of the Creative Commons Attribution (CC BY) license (http://creativecommons.org/licenses/by/4.0/).
Share and Cite
Török, G.T.; Józsa, J.; Baranya, S. A Shear Reynolds Number-Based Classification Method of the Nonuniform Bed Load Transport. Water 2019, 11, 73. https://doi.org/10.3390/w11010073
Török GT, Józsa J, Baranya S. A Shear Reynolds Number-Based Classification Method of the Nonuniform Bed Load Transport. Water. 2019; 11(1):73. https://doi.org/10.3390/w11010073
Chicago/Turabian StyleTörök, Gergely T., János Józsa, and Sándor Baranya. 2019. "A Shear Reynolds Number-Based Classification Method of the Nonuniform Bed Load Transport" Water 11, no. 1: 73. https://doi.org/10.3390/w11010073
APA StyleTörök, G. T., Józsa, J., & Baranya, S. (2019). A Shear Reynolds Number-Based Classification Method of the Nonuniform Bed Load Transport. Water, 11(1), 73. https://doi.org/10.3390/w11010073