Article

Strategic Approach for Prioritising Local and Regional Sanitation Interventions for Reducing Global Antibiotic Resistance

School of Engineering, Newcastle University, Newcastle upon Tyne NE1 7RU, UK
*
Author to whom correspondence should be addressed.
Water 2019, 11(1), 27; https://doi.org/10.3390/w11010027
Submission received: 23 November 2018 / Revised: 15 December 2018 / Accepted: 18 December 2018 / Published: 24 December 2018
(This article belongs to the Section Water, Agriculture and Aquaculture)

Abstract

:
Globally increasing antibiotic resistance (AR) will only be reversed through a suite of multidisciplinary actions (One Health), including more prudent antibiotic use and improved sanitation on international scales. Relative to sanitation, advanced technologies exist that reduce AR in waste releases, but such technologies are expensive, and a strategic approach is needed to prioritize more affordable mitigation options, especially for Low- and Middle-Income Countries (LMICs). Such an approach is proposed here, which overlays the incremental cost of different sanitation options and their relative benefit in reducing AR, ultimately suggesting the “next-most-economic” options for different locations. When considering AR gene fate versus intervention costs, reducing open defecation (OD) and increasing decentralized secondary wastewater treatment, with condominial sewers, will probably have the greatest impact on reducing AR, for the least expense. However, the best option for a given country depends on the existing sewerage infrastructure. Using Southeast Asia as a case study and World Bank/WHO/UNICEF data, the approach suggests that Cambodia and East Timor should target reducing OD as a national priority. In contrast, increasing decentralized secondary treatment is well suited to Thailand, Vietnam and rural Malaysia. Our approach provides a science-informed starting point for decision-makers, for prioritising AR mitigation interventions; an approach that will evolve and refine as more data become available.

Graphical Abstract

1. Introduction

1.1. Global Spread of Antibiotic Resistance

Antibiotic resistance (AR) is a major threat to global health and human development. Overuse of antibiotics and other antimicrobial agents is the root driver of AR; however, how “use” translates to global spread is under debate, especially, the relative roles of environmental versus clinical factors [1]. In their seminal work, Hawkey and Jones [2] reviewed the extent and diversity of one extended spectrum β-lactamase antibiotic resistance gene class (ARG; blaCTM-X) around the world, highlighting its rapid spread in the 1990s. blaCTM-X had not been observed in clinical settings prior to 1989 [3], but became global within a few years, suggesting the importance of wider factors on AR globalisation, including human- and non-human international travel [4,5,6]. Further, it is apparent that elevated AR levels are fuelled by faecal releases and other pollution, especially in the developing world [7,8], which implies that inadequate local sanitation, anywhere, can potentially translate to AR around the globe [9].
Unfortunately, until recently, targeting AR was not a primary goal at the World Health Organisation (WHO) within water, sanitation and hygiene (WASH) programs. This was a critical omission, given that the use of antibiotics and AR are increasing at much higher rates within Low- and Middle-Income Countries (LMICs) than High-Income Countries (HICs) [10]. As such, combining more responsible antibiotic use and improved local waste management in LMICs should be central to our battle against AR. Routes to clinical exposure are more direct in LMICs than in HICs, and effective engineered barriers are often not in place (e.g., central drinking water treatment with disinfection). However, evidence exists that small interventions within WASH, such as washing hands and enhanced personal hygiene, provide best value for money in fighting AR [11]—a theme in this manuscript.
Given the above, a strategy that combines more prudent antibiotic stewardship and improved waste management in LMICs is needed to address globally increasing AR, but no such plan currently exists, especially one that is rooted in holistic One Health ideals and is framed for decision-makers to develop and implement policy. Sanitation problems in LMICs are diverse, including considerations that do not exist in HICs, such as open defection (OD), unimproved basic sanitation and the release of untreated wastewater, directly into sensitive receiving waters. Further, LMICs have differing levels of resources and sanitation infrastructure, and often have differing behaviours and cultural practices. For example, even basic waste management may not exist, suggesting most appropriate and effective AR mitigation options may be social or very “low” technology. In fact, “high technology” solutions from HICs may never be sustainable in most LMICs; although bias towards high technology often exists among decision-makers. Given this apparent bias, a better case is needed for smaller, more incremental mitigation steps, especially a One Health rooted approach for making systematic decisions on community, state and-or country levels, which considers both technical and social factors.
Here, we propose such an overarching approach, which is based upon analysis of data available from the WHO/UNICEF Joint Monitoring Program and published sources available through the World Bank [12,13,14,15,16]. It considers technical and cultural factors [17], particularly behaviours related to higher AR releases to the environment [10], and then prioritises the “most-affordable” stepped interventions. The underpinning approach will be presented first, after which suggested sanitation priorities for Southeast (SE) Asia will be used as a case study to show how the approach might work at the country level. Our strategy uses quasi-cost–benefit analysis to identify the “next-most-cost-effective” AR mitigation options that fit the resources and existing infrastructure in a country. As will be shown, different solutions are suggested for different LMICs in SE Asia. The ethos presented here should be viewed as a holistic AR exposure reduction strategy, based on improved sanitation; therefore, detailed genetics or specific AR exchange between environmental and clinical organisms is not considered.

1.2. Sanitation Gaps, Infectious Disease and AR in LMICs

Reducing OD was targeted as a centrally important strategy for reducing the spread of infectious disease in LMICs as part of the Millennium Development Goals [18]. The initial “end the practice” date was 2015, but with the transition to the Sustainable Development Goals (SDG), the date changed to 2030. As of 2015, 12% of the global population still practice OD, and more than 60% do not have access to safe sanitation, whereas, access to safe drinking water has been significantly improved [12]. Sanitation is clearly lagging behind.
In 2001, the World Toilet Organisation launched “World Toilet Day” to aid in meeting this goal, which later was declared an official UN International Observance Day, in 2013, interestingly occurring during the WHO World Antimicrobial Agent Week. In parallel, without a direct link to AR, the Bill and Melinda Gates Foundation introduced “Reinvent the Toilet Challenge”, in 2011, with the aim “to bring sustainable sanitation solutions to the 2.5 billion people worldwide who do not have access to safe, affordable sanitation” [19]. The challenge particularly aimed to support the invention of “off-grid” technologies that remove pathogens from human waste and recover valuable resources. It has produced an array of “leapfrog” technologies for consideration (e.g., toilets that receive and treat faecal matter, without the need for traditional infrastructure) [20].
Despite some technological innovation, a gap in global sanitation still persists, because most of the leapfrog options are not ready to be rolled out or require too much maintenance to be useful in LMIC contexts [21], and an overarching strategy to guide decisions on the “next-most-cost-effective” sanitation options is still needed. This gap is critical to addressing AR because places with inadequate sanitation are often places with the most rapidly increasing AR [10,22]. Therefore, addressing the sanitation gap would almost certainly reduce AR, if antibiotic use also is curbed. By analogy, eliminating OD almost completely eradicated deaths due to diarrhoea, in rural Bangladesh, by providing complete access to latrines [23]. We feel a similar success is possible by eliminating OD as a strategy to reduce AR because improved sanitation often leads to increased pride and civic responsibility [24], which could be used to fuel more responsible antibiotic use, reducing the spiral of increasing AR.

1.3. WASH Programs as a Platform for Reducing AR

WASH programs have not historically targeted AR. Increased toilet availability and use within WASH programs has clearly reduced infectious disease [25], but OD is not the only driver of infectious disease and AR. For example, mitigating the direct discharge of inadequately treated wastewater into surface waters may be as important as eradicating OD for reducing AR, because flowing wastewater makes AR spread more possible [26,27]. However, expanding to centralised wastewater treatment would be extraordinarily expensive in LMICs. In fact, building full-scale secondary wastewater treatment plants (WWTP) in places where limited existing sanitation infrastructure exists, makes little sense; they are expensive and, in most cases, will have little impact on the “net” AR released on regional and national levels, given that non-point exposure routes also exist. This opinion is supported by recommendations in new WHO Sanitation guidance [28], which advises that sanitation must cover “entire communities”, to have an effect.
AR, like many infectious diseases, is spread by faecal–oral transmission and, therefore, the extent of AR spread depends upon the barriers between the raw faecal sources and the next exposed person. As such, the extent of personal and community toilet use, and the consideration of local sanitation and hygiene behaviours are critical to reducing AR spread. Simple investments in new or improved toilets may be a valuable strategy for reducing AR exposure, where OD is prevalent, but placement of toilets does not mean they will be used [29,30,31]. Other factors, such as cultural traditions, religious practices and gender, also impact their uptake and use. Therefore, for a WASH-based intervention strategy to be realized, for reducing AR, an understanding of how the behavioural factors differ across locations, becomes critical, especially, given that social practices vary widely from place to place and among countries, even within the same region. Technical and social considerations must be combined for AR mitigation; i.e., a One Health ethos, which includes clinical, sanitation and wider cultural considerations [10].
As such, the cost–benefit framework presented here was developed with WASH in mind, especially helping policy-makers prioritize the most appropriate sanitation solutions for reducing AR in LMICs. This approach is based on two main elements; (1) the relative cost of different sanitation mitigation options versus their relative benefit in reducing AR releases to the environment, and (2) the existing infrastructure in a given location, which in tandem can be used to help prioritize local interventions. This paper does not provide absolute solutions; rather, in line with the WHO Sanitation guidelines, the paper makes recommendations based on the relative value of incremental sanitation improvements that would, in theory, reduce global AR levels, at much less expense.

2. Developing a Strategic Approach for Prioritising AR Mitigation Options

2.1. Philosophical Basis of the Approach: Relative Costs versus Relative Benefits

Limited data exist on the relative costs of AR mitigation, especially considering both technological and non-technological sanitation options, linked to relative AR-related benefits. This is partially because the pricing of real-world sanitation solutions is case-specific and the relative benefits of the different options for reducing AR, are hard to define. Many local factors can impact “cost”, including capital investment in specific AR mitigation interventions (e.g., building secondary vs. tertiary WWTPs); the gap between the existing and required infrastructure to facilitate interventions (e.g., local vs. central sewer connections); the availability of resources and materials in different locations; and operation and maintenance costs of any intervention (e.g., energy, education and technical expertise) [32]. Conversely, the benefits also are hard to define, partially, due to a lack of data, but also due to a lack of standardisation in defining AR, across studies (e.g., does one use specific AR bacteria [ARB] or a mosaic of ARG data?). Finally, most work on AR fate has been “academic”, meaning observations have not always been made using realistic operating conditions, possibly making AR benefits appear better than what might be expected in practice.
In developing a strategic approach for decision-makers, one must balance a well-grounded technical core and relative simplicity; i.e., the approach must be technically and financially correct, but user-friendly for the relative non-experts in sanitation solutions. With this in mind, we have grouped AR mitigation solutions and their benefits into four general steps of intervention. The main sanitation mitigation steps are shown in Figure 1, ranging from no intervention (i.e., OD/unimproved basic sanitation) to tertiary wastewater treatment. We have chosen these steps because they roughly align with the goals under SDG 6.0 and UN benchmarks [33]; i.e., improved basic sanitation is SDG 6.2, secondary treatment is SDG 6.3 and tertiary treatment brackets SDG 6.3 and 6.5. It should be noted that technological interventions in Figure 1 require complementary social interventions, which are especially important at the low end of the sanitation scale. In fact, social and behavioural factors may dominate the efficiency of sub-secondary treatment interventions, which will be further considered within this case study.

2.2. Relative Cost of Different AR Sanitation Interventions

To develop a strategic approach, we have opted to define “costs” in relative terms, using data gathered from engineering and non-engineering wastewater and sanitation literature (e.g., [32,34,35,36,37,38]). The actual costs of technological options vary hugely, depending on many factors, including geography; the population size and density served by the system; local water use; climatic factors; and technologies employed. In general, relative costs are fairly consistent between technology tiers, although costs can differ widely within a tier, especially, wastewater treatment options. For example, primary treatment (screening and settling waste-solids from wastewater), historically, costs two to three times less than using secondary wastewater treatment [39], the treatment step that biodegrades soluble organic matter. This estimate is consistent with World Bank data that show the global cost of “safely managed sanitation” was about triple that of “basic sanitation” [37]. Here, safely managed sanitation assumes 50% sewage treatment and 50% percent faecal sludge management, with treatment.
More advanced treatment steps, such as tertiary treatment or quaternary treatment, further remove nutrients, micropollutants, bacterial levels and other trace chemicals, as a precursor, before the waste is reused or released to sensitive receiving waters. For our analysis, we combined tertiary and quaternary treatment under one umbrella (for simplicity), which we refer to as “tertiary treatment” henceforth. Based on the US Environmental Protection Agency (EPA) data [32], tertiary treatment costs about three times more than the typical secondary treatment, although this factor varies widely, ranging from less than double to many times greater depending upon existing secondary treatment and the type of tertiary treatment employed. Finally, World Bank estimates indicate the relative cost of moving to improved “basic sanitation” from no sanitation (e.g., OD) was about four times [37], albeit absolute costs at the lower end of the technology scale are relatively small, compared with higher technology sanitation options.
Contrary to cost data on sanitation and treatment options, the relative cost of new wastewater infrastructure, such as sewers needed to centralize wastewater treatment, is nearly impossible to estimate in general terms. Sewer infrastructure is almost always the costliest element of any wastewater network [39], often costing five to six times more than the secondary wastewater treatment plants themselves (e.g., [40]). Further, the expected cost of sewerage infrastructure in a given setting is hard to generalize and define a priori, which is heavily dependent upon the local topography, the spatial distribution of the sewage sources, sub-surface conditions and many other factors [41]. As such, the step-cost of moving from no sewer connections to a fully serviced area is expensive, usually much greater than the mitigation technologies themselves. As will be seen, this is critical in defining the next-most cost-effective sanitation option.

2.3. Relative Benefit of Different AR Sanitation Interventions

Data on the concentrations and removal rates of ARB and ARGs in different waste processing and wastewater treatment processes are varied, depending on the mitigation step, and also the format, type and measurement methods used (see [42,43,44,45,46,47,48,49,50]). For example, limited ARG and ARB reduction data exist on the most basic mitigation options, such as the value of moving from OD to improved basic sanitation. However, as waste treatment expands from primary through to tertiary technologies, ARB and ARG fate data is more available; although the technical options are more varied. This means there are large variations in reported AR removal levels for tertiary processes, due to diversity among technologies and operating conditions assessed.
Given these limitations and a goal of developing a strategic framework for making decisions, AR mitigation “benefits” are defined here as the incremental log reduction of exemplar ARGs associated with tetracycline, β-lactam (including carbapenems) and macrolide resistance. For background, AR develops when organisms acquire and retain ARGs, and such genes conditionally express proteins that confer AR, creating resistance in ARBs with enhanced cell defence to specific or general antibiotics. Further, individual organisms can acquire more than one ARG or acquire uniquely powerful ARGs, either of which can confer multi-drug resistance; a particular problem in LMICs [44]. The ARGs used for comparisons here were chosen because they are measured in most treatment studies by a common analytical method, quantitative Polymerase Chain Reaction. For our study, we chose specific ARG data from nine manuscripts that examined full- or field-scale systems [42,43,44,45,46,47,48,49,50]. Other manuscripts were considered, but our goal was to contrast ARG conditions and removal rates only in “real” sanitation systems. Much more ARG and ARB fate data are needed, especially at the low end of the technology scale.
Data for comparisons are provided as “relative abundances”; i.e., as ARG copy number/16S rRNA copy number, which is a common metric for quantifying AR in environmental samples that accounts for differences in absolute bacterial levels. The AR benefit curve was developed by clustering the ARG removal data into the four, mitigation step-changes. As such, the curve provides tiered reductions in relative ARG levels, as a function of the mitigation steps. Each step-change was calculated from the measured data and associated standard errors were calculated for each step.
It is important to note that ARGs were used here as biomarkers of AR. However, detecting an ARG does not explicitly indicate an ARB (including pathogens), which only results when the ARG is in an expressible location and is being expressed in the bacterial host. This does not mean detecting ARGs is unimportant because they indicate the genetic potential for AR, however, it should be noted that their presence does not necessarily mean, resistance. We use ARGs here because more data exist on ARGs than ARBs, allowing a greater statistical confidence in developing an AR benefit curve. For comparison, ARG removal rates tend to be one log lower than ARB removal in wastewater processes, although this relationship varies, depending upon the conditions and technology [50].

2.4. Case Study: Cost–Benefits of Sanitation Interventions across SE Asia

The approach developed here is intentionally general and, in theory, might be used anywhere in the world, although SE Asia was chosen for the case study. SE Asia is ideal for demonstration because it covers a comparatively small area (on global scales); it includes many islands and other geographic barriers between countries; and it is diverse in terms of wealth, levels of sanitation, religion and cultural traditions. Countries within this region also have sufficient datasets to allow comparisons. For this study, SE Asia includes Brunei Darussalam, Cambodia, Indonesia, Laos People’s Democratic Republic (PDR), Malaysia, Myanmar, Philippines, Singapore, Thailand, Timor-Leste and Vietnam. Regional descriptive and quantitative data was obtained from published sources available through the World Bank [12], including percentage or absolute data on OD levels [14], Gross Domestic Product (GDP) per capita [15] and relative levels of sanitation between rural and urban locations [16] (ranging from none or unimproved, to basic, to higher levels of waste management). Similar data are available for other countries around the world, including Sub-Saharan Africa, Latin America and elsewhere.

3. Results and Discussion

3.1. Sanitation Options for Reducing AR: Relative Costs and Relative Benefits

Using Figure 1 as a guide, Figure 2 and Figure 3 were developed based on literature data to compare the relative AR mitigation value and costs of the four main sanitation steps. Figure 2 was developed based on ARG reduction data drawn from nine studies [42,43,44,45,46,47,48,49,50]. In summary, roughly log 4 to 6 ARG reductions occur from OD to improved basic sanitation (although this is hugely variable); improved basic sanitation to primary treatment adds a further 0.0 to 1.0 log reduction in ARGs; primary to secondary treatment provides an additional log 1.0 to 2.0 reduction; and finally, secondary to tertiary treatment adds a further log 1.0 to 3.0. Possible ranges of each step are indicated by the shaded area on Figure 2. Shading was estimated by calculating the standard error of each incremental reduction step, which varied among the steps and sample sizes (from n = 5, for OD to basic sanitation, to n = 15 for secondary to tertiary). Overall, the greatest step-reduction in relative AR levels appears to occur when one moves from OD to improved basic sanitation. The second largest step-reduction occurs with the addition of tertiary waste treatment.
On the cost side (Figure 3), solid relative cost data are available, especially, at the bottom of the cost curve, which comes from the World Bank estimates from over one hundred and thirty countries [37]. Further, mean costs of each stepped increase in sanitation technology are reliable and are based on various synoptic reports [32,34,35,36,37,38], although variation around mean costs is harder to estimate at the top end of the cost curve, because of a wide variability in the definitions of secondary and tertiary treatment. The relative cost of this incremental step depends on the existing secondary treatment system (e.g., conventional activated sludge, biofilters, aerobic vs. anaerobic technologies, etc.), and existing or planned tertiary treatment options (e.g., advance oxidation, reverse osmosis, membrane filtration, etc.) [39]. Given this uncertainty, we have opted to show the variability symbolically (i.e., the shaded area in Figure 3), rather than using statistical error. The existing World Bank data allow us to be more confident at the lower end of the curve [37]. Despite uncertainties, overall cost trends are meaningful in relative terms, especially, the large and increasing costs for more technological mitigation options.
Note: Relative incremental reductions in the antibiotic resistance gene (ARG) concentrations, as a function of different AR mitigation interventions (see Figure 1). Reductions are baselined to an initial ARG concentration of (log 10) ARG copies/unit volume in the faecal matter, which is the brown bar. Each step reduction is based on mean ARG removal data from nine studies on the field-scale systems [42,43,44,45,46,47,48,49,50]. Sample numbers: n = 5 for faecal matter to improved sanitation; n = 8 for improved sanitation to primary treatment; n = 11 for primary to secondary treatment; n = 15 for secondary to tertiary treatment. Error bars refer to standard errors of data from the studies and shaded areas show ranges.
The large step cost (Figure 3) incurred when progressing from improved sanitation (through primary treatment) to centralised, secondary waste treatment, is due to the need for sewers and greater infrastructure to carry wastewater to a central facility. Therefore, we have provided a dashed line on Figure 3 to show a step increase in costs when one moves from local improved to secondary treatment. This cost is highly case specific and not easily generalised, but this step cost always is large, compared to the secondary wastewater treatment itself [39].

3.2. Comparing AR Cost–Benefits of Different Sanitation Options

When one compares the relative benefits to AR reduction of the different sanitation options (Figure 2), with the relative costs of those interventions (Figure 3), three key observations become apparent. First, the lowest cost sanitation intervention provides the greatest step-value, in terms of reducing AR exposures; i.e., moving from OD to improved basic sanitation. Reduced AR exposures with this mitigation option are highly local, but they suggest that if one provides a reliable barrier between one person’s faeces and the next, one can drastically reduce concentrated ARG exposure. Further, if one does not mobilize the faeces in water by reducing OD, the barrier becomes even more complete (i.e., burial in soils above the groundwater table is probably best) and AR exposure might be reduced further. Although such interventions are common sense and already are embedded within the WHO WASH policy to reduce infectious disease, they also apply to reducing AR exposure. World Bank data suggest the financial cost of this step is comparatively small (37; Figure 3), although social investment is needed to make it work (e.g., basic education and increased awareness). As such, although reducing OD is not as expensive as the more technological options (in absolute terms), parallel social investment, according to the WASH principles, would be crucial to fully achieving the AR mitigation benefits [10].
The second striking observation is that a comparatively small reduction (relative to reducing OD) in ARG releases/exposures) is realized when moving from improved basic sanitation, to primary treatment, to secondary treatment, although the relative cost can be high, especially, if major infrastructure (i.e., sewers) is needed to make the technological step. Moving towards secondary treatment does reduce AR exposures in absolute terms, benefiting water quality and reducing infectious disease exposures, but costs may be prohibitive in places without sewer connections. Consequently, investment in secondary treatment could only be cost-effective if changes in the sewage collection infrastructure was minimal. For example, the implementation of condominium sewers [51] in concert with smaller scale “decentralized” secondary treatment would be a more affordable option. This approach is analogous in its goals to leapfrog toilet technologies [19,20], but we feel it may be the better option because it probably would cost less per person, servicing whole communities rather than smaller clusters. The affordability of this approach could be enhanced if the location has some existing sub-surface plumbing, such as with septic tanks. Therefore, places with existing septic tanks might be particularly amenable to this option.
The final observation of Figure 2 and Figure 3 is that tertiary treatment does consequentially reduce ARGs from wastewater, although it has a large incremental cost, especially when extending from conventional secondary treatment. One can reduce ARGs by up to log 3.0 with tertiary treatment (ARBs by even more), but this reduction is from a comparatively low-AR level (relative to raw sewage or faecal matter). Therefore, although tertiary treatment can be effective, the high cost is probably prohibitive, except where direct water reuse is needed due to water scarcity. An example of where this might be economical is in arid and semi-arid urban locations, such as Mexico City [52]. In fact, transition to tertiary treatment is already occurring in Mexico using combined public–private funding with cost recovery being obtained from the revenues from the reuse facility. It would be helpful to study these “proto-type” actions in terms of their AR benefits (nothing currently is known), which could be matched with the associated costs.

3.3. Case Study: Prioritising Sanitation Options to Mitigate AR in SE Asia

3.3.1. Using the Strategy for Prioritising AR Mitigation Sanitation Options for LMICs

The cost–benefit analysis summarized in Section 3.1 and Section 3.2, provides a method for prioritising sanitation mitigation actions to reduce AR that is consistent with a One Health ethos, and which is based on the existing infrastructures and relative AR benefits from different sanitation improvements. To show how the method can be used in mitigation decision-making, a case study has been developed based on SE Asian countries. Specifically, the approach identifies the possible “next-most cost-effective” sanitation options for rural and urban populations in each country, which differ from place to place. We believe that, as a minimum, “secondary treatment for all” should be the long-term goal, but the approach suggests that incremental steps probably will be more economical, but will differ among countries due to the different existing infrastructures.

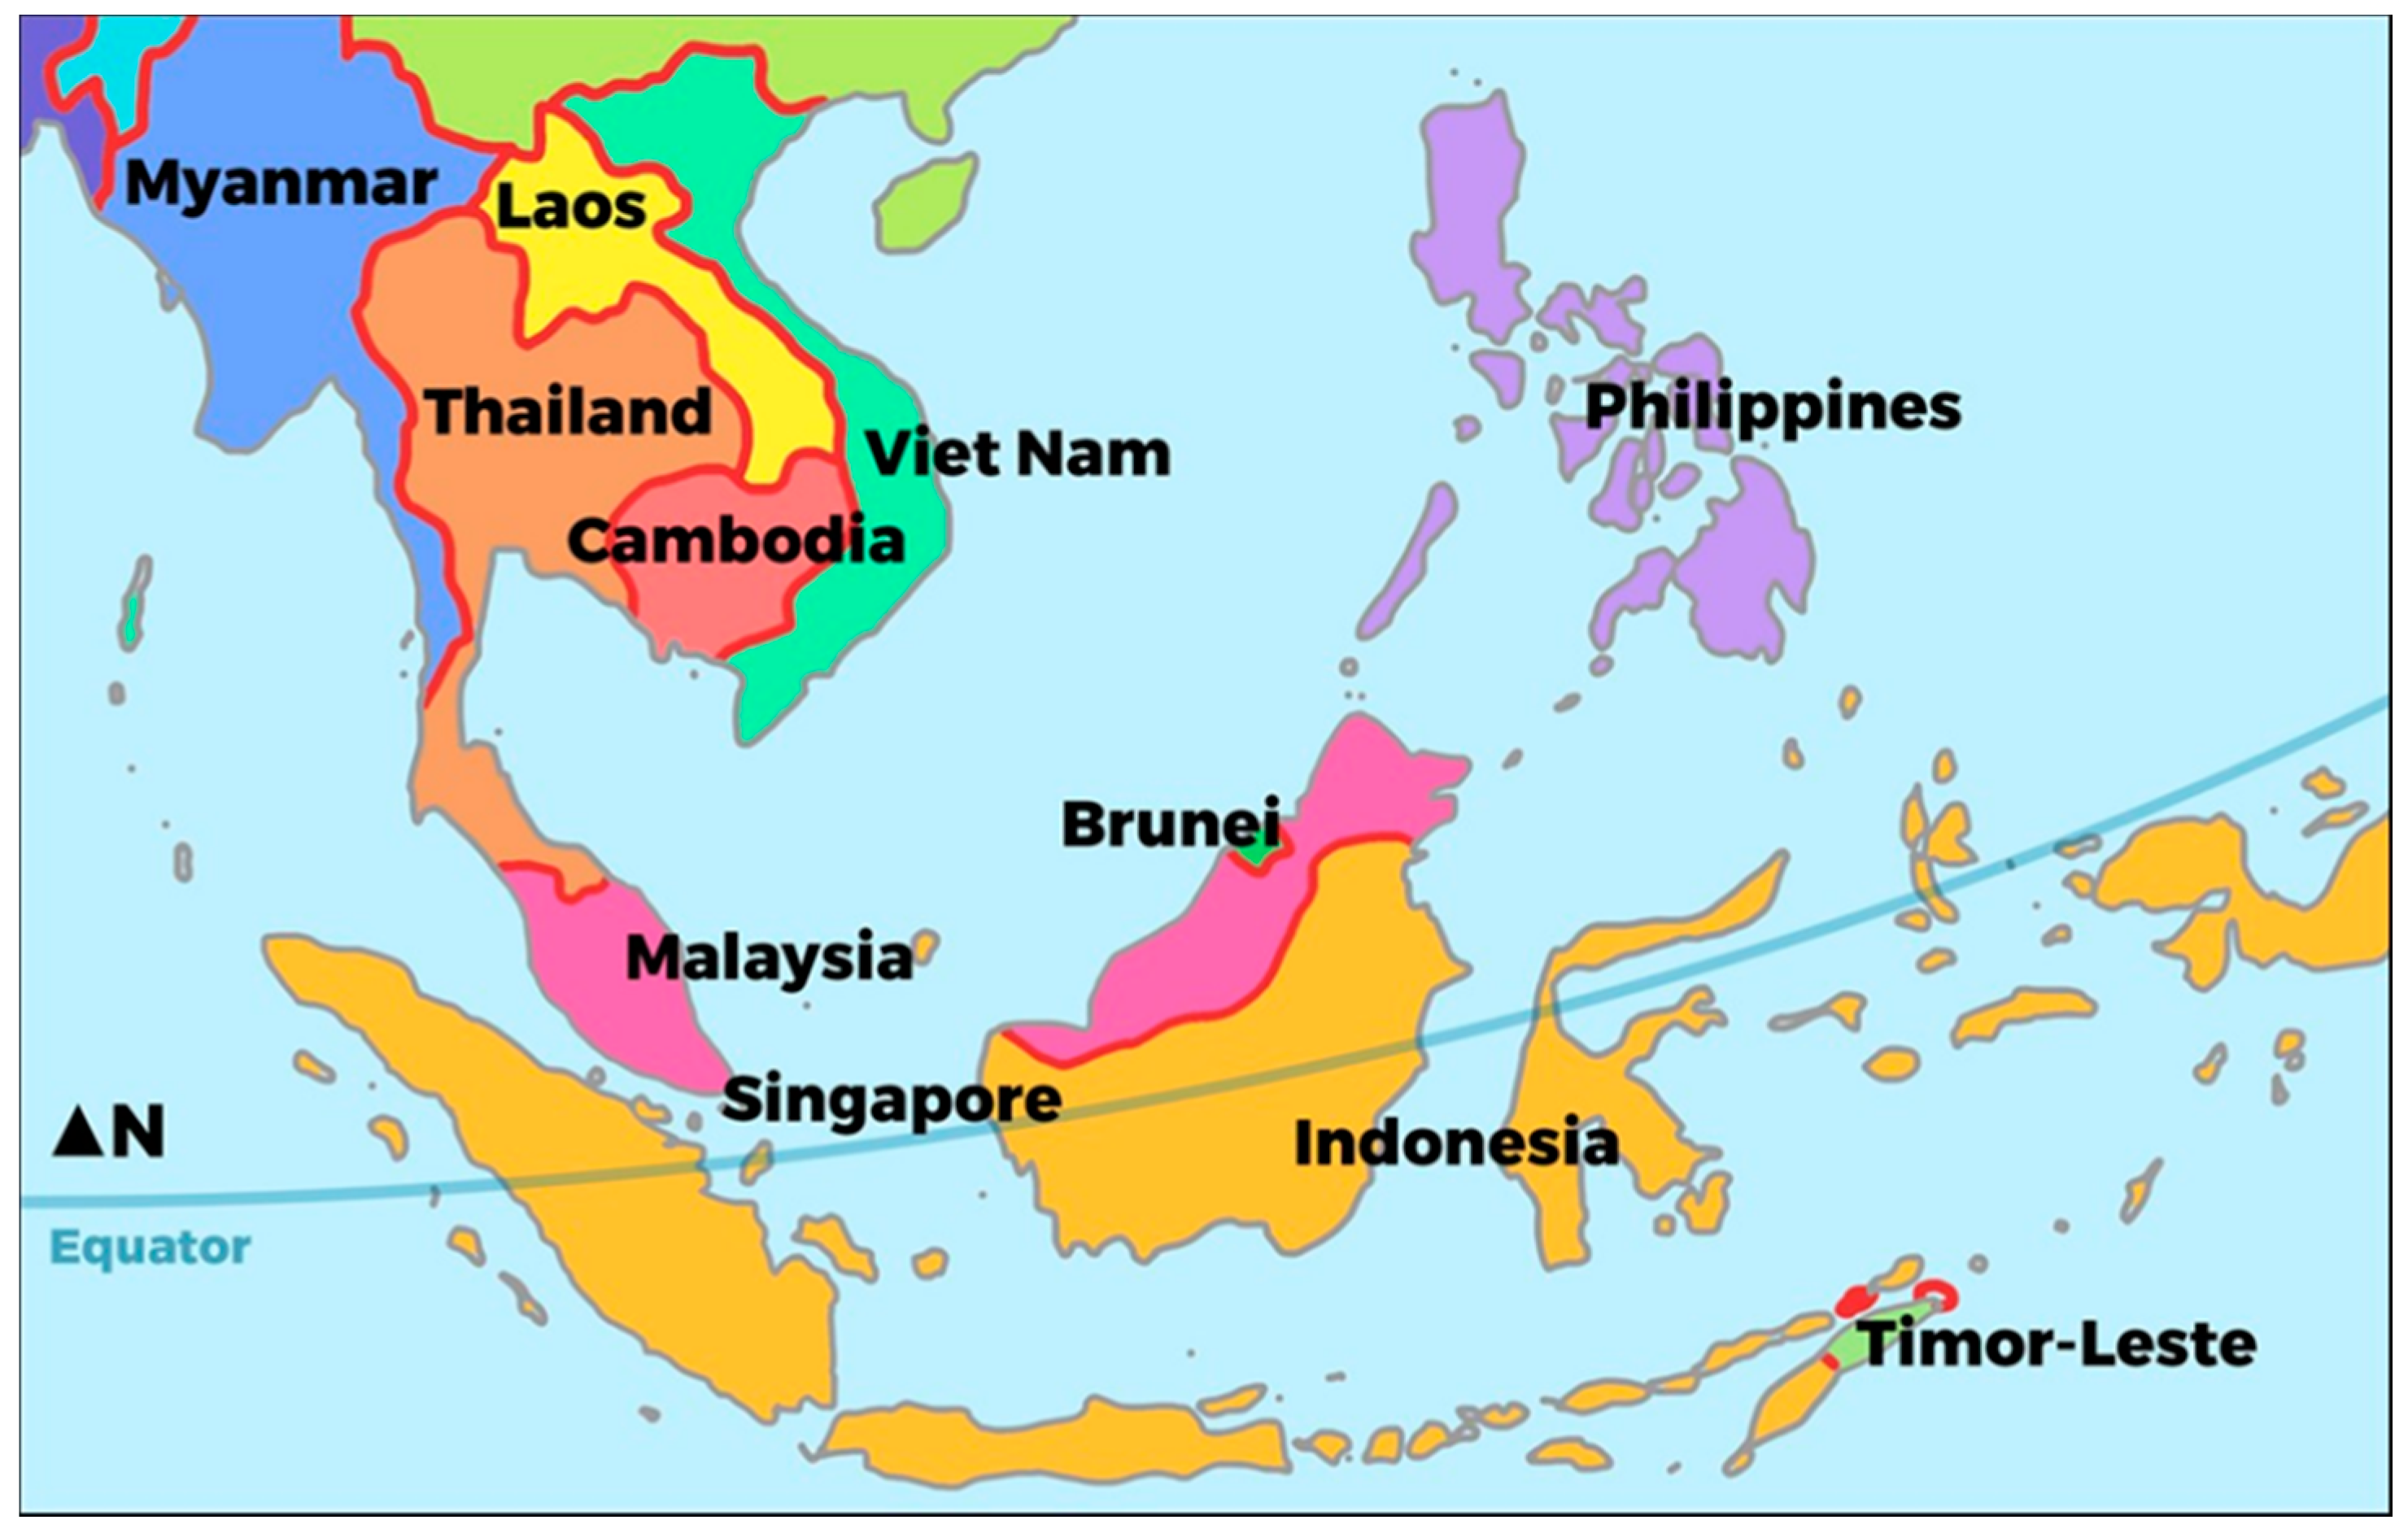
3.3.2. Geographic, Economic and Sanitation Background for SE Asia

SE Asia is comprised of eleven countries (Figure 4) that range widely in terms of the relative wealth, sanitation behaviour, infrastructure capacity, culture (e.g., primary religions), population size and density, and rural/urban population distribution (Table 1, Figure 5, Figure 6 and Figure 7). Total populations range from almost 429,000 in Brunei to over 260 million in Indonesia [13]; population densities range from 29 people/km2 in Laos PDR to 7752 people/km2 in Singapore; percent urban population ranges from 23% in Cambodia to 100% in Singapore [16]; and annual GDP ranges from $US 1299/capita in Myanmar to almost $US 58,000/capita in Singapore, based on 2017 data [15]. These wide differences in population, relative wealth and level of urbanisation directly mirror the levels of OD and unimproved basic sanitation, which are most evident with rural populations (Figure 5). Eight of the 11 SE Asian countries have over 20% of rural populations that practice OD [14], or do not have basic sanitation, including two countries with over 60% (Timor-Leste and Cambodia). Sub-basic sanitation is less pronounced in urban settings (Figure 5), but Timor-Leste and Cambodia have over 20% unimproved urban sanitation, suggesting locations where high AR exposures may exist, due to poor sanitation and greater problems with AR management in urban environments [53].
When examining SE Asia in more detail (Figure 6), sanitation conditions differ widely, and, in some cases, actual levels of sanitation are unknown. For this assessment, unknown is assumed to be undefined sanitation, possibly including unimproved sanitation [12]. Estimates are primarily based on household surveys, but in many places, how survey data relate to actual practices, is unclear. Regardless, Figure 6 summarizes the variety of the types and levels of improved basic sanitation among countries, including the existing sewer connections. Some differences deserve highlighting. For example, some countries have high levels of septic tank coverage (or similar; e.g., Thailand, Vietnam and Philippines), whereas others have higher levels of improved latrines (e.g., Malaysia and Myanmar). Only four countries have greater than 30% sewer connections for urban settings (Brunei, Cambodia, Malaysia and Singapore), suggesting centralized sewers are quite limited across the region. Finally, only in wealthy, highly urban Brunei and Singapore are sewers consistently connected to centralized secondary or higher levels of wastewater treatment [12].
Diversity in SE Asian sanitation conditions are exemplified in Figure 7, which shows that relative wealth (per capita GDP) significantly inversely correlates with the country’s levels of OD (Spearman’s rho; r = −0.763, p = 0.009; Figure 7a), and the percent rural population in a country significantly positively correlates with OD (r = 0.811 p = 0.002; Figure 7b). However, variations around the trendline in Figure 7b suggest that OD differs widely among countries and does not appear to be related to population density, which does not correlate with OD practice (r = −0.396; p = 0.228). These observations suggest other factors are important to OD and sanitation practices, such as local culture, wealth and behaviour. These factors are key because recent data from seventy-three countries showed that the GDP per capita, education, infrastructure, public health-care spending and antibiotic consumption, all inversely correlated with country-level antibiotic resistance [10], suggesting a combination of increased education, expanded community health support and public investment in improved sanitation are crucial to reducing global AR.

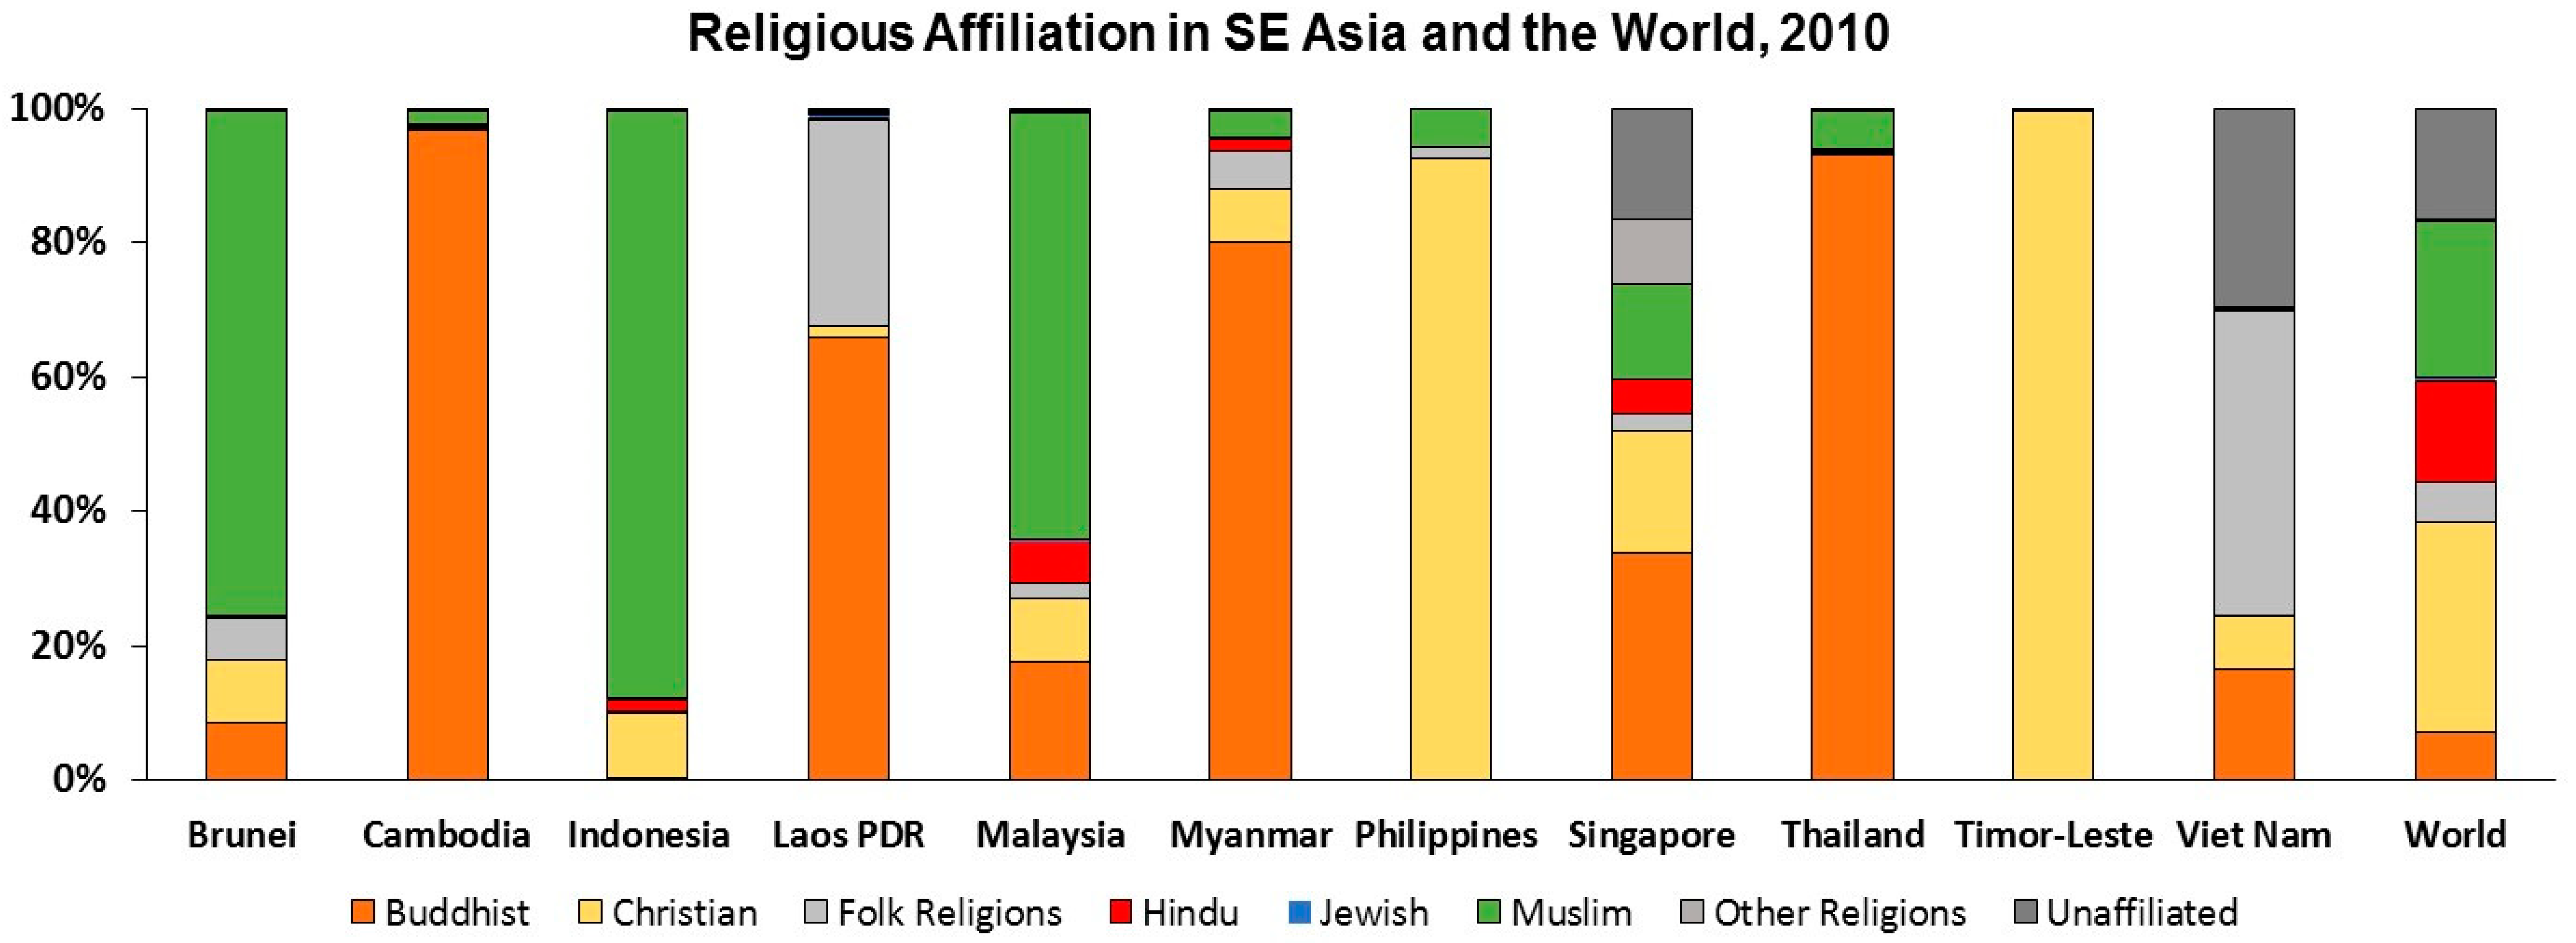
3.3.3. Cultural Considerations for AR Mitigation in SE Asia

Cultural issues must be considered in parallel with technical interventions in addressing sanitation [54,55], and implicitly, AR mitigation. Considering culture and human behaviour has not historically been connected to prioritising the most suitable sanitation technologies, but many now believe that changing personal behaviour may be the primary challenge to improving sanitation, especially reducing OD, in the developing world [10,56,57,58]. It is also critical if one wants to address the global AR problem using One Health.
Here, we will not examine specific SE Asian cultural considerations, but will summarize cultural considerations that are important, especially as advice to a technical audience less familiar with relationships between culture and sanitation practice. SE Asia is highly diverse, culturally, which implies behaviours around toilet use must vary across the region, including, for example, acceptability of OD or tolerance of faecal releases, without adequate sanitary barriers. “Defection etiquette” and habits differ among cultures, and also change through time, often being driven by social organisation and settlement patterns. As an example, sedentary settlements lead to increased concentrations of people, and closer proximity to domesticated animals and uninvited pests (e.g., rats, roaches and mosquitoes). Unsurprisingly, relative poverty, educational level and deficiencies in “home technologies” also play an integral role in sanitation behaviour [59]. Cultural factors are most important in the least-developed LMICs [29,30,31,60,61,62], including in SE Asia. Therefore, social considerations are critical in prioritising AR mitigation sanitation interventions, especially, where engagement will drive sustainability.
A detailed assessment of cultural and individual behaviours that impact sanitation practices is beyond the scope of this paper. However, Table 2 is provided as a general summary of the identified factors that influence sanitation behaviour. As can be seen, most factors are linked to cultural beliefs and traditional habits, including taboos around handling human faeces (faecophilia versus faecophobia); purification rituals around defection; defection “posture” preferences (sitting versus squatting); location of latrines in relation to dwellings; privacy requirements; gender issues, especially personal safety; social class and kinship restrictions; and other factors. Some of these behaviours directly or indirectly link to religious beliefs, which are diverse across SE Asia (Figure 8; [17]. In SE Asia, three countries are predominantly Muslim, four are predominantly Buddhist, two are Christian and two are religiously diverse. Although religion is only one element of the culture, religious diversity is a reasonable surrogate for the diversity in behaviours that might influence AR mitigation. As examples, the cardinal direction of the latrine, traditional defecation postures, cleansing requirements before and after defection (water or waterless/washers or wipers) and the colour of the toilet, all have religious roots.
The range of cultural considerations listed in Table 2 [53,54,55,56,57,58,59,60,61,62,63,64,65,66,67,68,69,70,71,72,73] shows that although reducing OD may sound easy by simply providing latrines or other improved sanitation, translating that aspiration into action is not trivial and neglecting such considerations may lead to OD being preferred [71,72,73]. Therefore, if one is to invest in improved latrines or promote decentralized secondary treatment, one must simultaneously inform and educate to ensure sustained use (i.e., to recover AR reduction benefit from the financial investment).

3.3.4. Translating Cost–Benefit Analysis into Sanitation Priorities for Reducing AR Exposures

This case study did not provide absolute answers because the background data were limited, and the specifics were more local, but it showed how top-end, One Health thinking can aid sanitation decisions, based on the relative cost–benefit considerations. Figure 2 and Figure 3 suggest the greatest value for investment in reducing AR would be realised by eliminating OD and upgrading basic sanitation to some form of secondary treatment, depending on the existing infrastructure and relative wealth. In terms of SE Asia, the “next-most cost-effective” AR mitigation sanitation actions should be to improve the basic sanitation in rural Cambodia and Timor-Leste, and possibly urban Indonesia, Myanmar and Timor-Leste. Obviously, cultural investment is also required, especially educating on the health hazards of OD, but providing improved basic latrines (or similar) should have a positive impact on AR exposures in these areas, for relatively little expense. Conversely, the presence of high levels of septic tanks or similar, in the urban and rural Philippines and Thailand (See Figure 6), and urban Vietnam, appear to be well-suited to decentralized secondary waste treatment as a strategy for reducing AR exposures. Rural and parts of urban Myanmar and rural Malaysia may also be suited to improved treatment of some sort, depending on the nature of the existing latrines and sanitation systems.
Although these prioritisations are crude, they are the logical first steps for each location and are consistent with wider recommendations for reducing AR [10]. Obviously, any improved sanitation must be coupled with reduced antibiotic use and also pollution in general, but the above suggestions are reasonable options for initial consideration. Ideally, the ultimate goal should be to provide at least secondary treatment for all, on global scales, but this is not remotely affordable in a single step or even logical, from an economic perspective. In fact, we suspect that centralised sewer infrastructures and waste treatment may never be needed, if we successfully raise regions with high OD to condominial sewers and decentralized secondary waste treatment.
One qualification must be made relative to implementing local-scale secondary treatment as a sanitation strategy and that is the general lack of low energy, low maintenance secondary treatment options for small-scale applications. Secondary wastewater treatment technologies, such as activated sludge or trickling filters, are notoriously unreliable at smaller scales (e.g., <1000 population equivalent) because sewage flow rates are more variable as the system becomes smaller, which causes a treatment process instability. Therefore, extending septic tanks to condominium sewers with secondary treatment, also requires new technology research and development, especially technologies that tolerate flow variation, use less energy and require less maintenance; all essential for most rural or peri-urban LMIC applications. A variety of technologies exist [74,75,76,77], including denitrifying downflow hanging sponge systems [78] that reduce ARG levels in domestic wastewater by log 1.5 to 2.0 [79]. However, most systems have not been operationalised in “real” scenarios, without expert maintenance; a key criterion in LMICs. In fact, a major technology gap exists in decentralized secondary treatment options, presenting a major commercial opportunity because the market would be vast in LMICs if reliable systems are developed. Considerable financial investment has been made into leapfrog toilet options [19,20]. A similar investment should be made into treatment options better suited to whole communities, which, our assessment suggests, might provide better value for money.

4. Conclusions

Central to reducing AR is reducing the use of antibiotics, which should be our top priority on global scales. However, reducing untreated or inadequately-treated faecal releases must also be a goal to compliment reduced antibiotic use [80]. Here, we provide a strategic approach for prioritising sanitation interventions based on the relative cost of different sanitation options versus their relative benefit in reducing local AR exposures. The approach suggests a tiered mitigation strategy should be cost-effective at reducing AR, although the next-best sanitation options will vary across locations based on the existing local infrastructure, wealth and social and behavioural factors [10]. In fact, cost–benefit analysis implies “low-technology” steps, such as reducing OD, improving basic sanitation and providing local-scale secondary treatment in LMICs will probably have the greatest net benefit in reducing global AR due to faecal matter releases. Clearly, sanitation solutions must also seamlessly fit into the local culture and political conditions to be taken up and become sustainable, but we provide here a comparatively simple, One-Health-rooted approach to guide policy decision-making. However, this work is only a starting point and, hopefully, the approach will develop and refine over time, as more data become available on the costs and benefits of different AR mitigation sanitation options.

Author Contributions

This research was conceptualized and developed by D.W.G.; and background investigation and data gathering were performed by M.J.G., especially the economic and behavioural data. D.W.G. drafted the core paper, whereas J.T.B., M.J.G. and D.W.G. edited and refined the draft for submission. D.W.G. conceived the visualisations; and J.T.B., M.J.G. and D.W.G. translated the drafts into the final versions.

Funding

Work within this manuscript was funded by the UK EPSRC Impact Acceleration Awards, EP/K503885/1 and EP/R511584/1.

Acknowledgments

The authors would like to thank Florence Jong and Marcos Quintela-Baluja for discussions on the ideas behind this manuscript. We also would like to thank Astrid Wester and Kristy Buckley for their invaluable conversations in contextualising our strategic approach within the WASH programs, and Eadington Graham for developing the graphics in the manuscript.

Conflicts of Interest

The authors declare no conflict of interest. The funders had no role in the design of the study; in the collection, analyses, or interpretation of data; in the writing of the manuscript, or in the decision to publish the results.

References

  1. Allen, H.K.; Donato, J.; Wang, H.M.; Cloud-Hansen, C.A.; Davies, J.; Handelsman, J. Call of the wild: Antibiotic resistance genes in natural environments. Nat. Rev. Microbiol. 2010, 8, 251–259. [Google Scholar] [CrossRef] [PubMed]
  2. Hawkey, P.M.; Jones, A.M. The changing epidemiology of resistance. J. Antimicrob. Chemother. 2009, 64, i3–i10. [Google Scholar] [CrossRef] [PubMed]
  3. Knapp, C.W.; Dolfing, J.; Ehlert, F.A.I.; Graham, D.W. Evidence of increasing antibiotic resistance gene abundances in archived soils since 1940. Environ. Sci. Technol. 2010, 44, 580–587. [Google Scholar] [CrossRef] [PubMed]
  4. Arcilla, M.S.; van Hattem, J.M.; Bootsma, M.C.; van Genderen, P.J.; Goorhuis, A.; Schultsz, C. The carriage of multiresistant bacteria after travel (COMBAT) prospective cohort study: Methodology and design. BMC Public Health 2014, 14, 410. [Google Scholar] [CrossRef] [PubMed]
  5. Von Wintersdorff, C.J.H.; Penders, J.; Stobberingh, E.E.; Lashof, A.M.L.O.; Hoebe, C.J.P.A.; Savelkoul, P.H.M.; Wolffs, P.F.G. High rates of antimicrobial drug resistance gene acquisition after international travel, The Netherlands. Emerg. Infect. Dis. 2014, 20, 649–657. [Google Scholar] [CrossRef] [PubMed]
  6. Häsler, R.; Kautz, C.; Rehman, A.; Podschun, R.; Gassling, V.; Brzoska, P.; Sherlock, J.; Gräsner, J.-T.; Hoppenstedt, G.; Schubert, S.; et al. The antibiotic resistome and microbiota landscape of refugees from Syria, Iraq and Afghanistan in Germany. Microbiome 2018, 6, 37. [Google Scholar] [CrossRef] [PubMed]
  7. Fletcher, S. Understanding the contribution of environmental factors in the spread of antimicrobial resistance. Environ. Health Prev. Med. 2015, 20, 243–252. [Google Scholar] [CrossRef] [Green Version]
  8. Williams, M.R.; Stedtfeld, R.D.; Guo, X.; Hashsham, S.A. Antimicrobial resistance in the environment. Water Environ. Res. 2016, 88, 1951–1967. [Google Scholar] [CrossRef]
  9. Quintela-Baluja, M.; Chan, W.C.; Alnakip, M.E.; Abouelnaga, M.; Graham, D.W. Sanitation, water quality, and antibiotic resistance dissemination. In The Battle Against Microbial Pathogens: Basic Science, Technological Advances and Educational Programs; Méndez-Vilas, Ed.; Fomatex Research Center: Badajoz, Spain, 2015; pp. 965–975. ISBN 9788494213472. [Google Scholar]
  10. Collignon, P.; Beggs, J.J.; Walsh, T.R.; Gandra, S.; Laxminarayan, R. Anthropological and socioeconomic factors contributing to global antimicrobial resistance: A univariate and multivariable analysis. Lancet Planet Health 2018, 2, e398–e405. [Google Scholar] [CrossRef]
  11. OECD. Stemming the Superbug Tide: Just a Few Dollars More; OECD Publishing: Paris, France, 2018. [Google Scholar]
  12. WHO and UNICEF Progress on Drinking Water, Sanitation and Hygiene: 2017 Update and SDG Baselines 2017. Available online: https://washdata.org/sites/default/files/documents/reports/2018-01/JMP-2017-report-final.pdf (accessed on 29 October 2018).
  13. Population, Total. Available online: https://data.worldbank.org/indicator/SP.POP.TOTL (accessed on 29 October 2018).
  14. WHO/UNICEF Joint Monitoring Programme (JMP) for Water Supply and Sanitation (wssinfo.org). People Practicing Open Defecation (% of Population). Available online: https://data.worldbank.org/indicator/SH.STA.ODFC.ZS?locations=BN-KH-TL-ID-LA-MY-MM-PH-SG-TH-VN&view=chart (accessed on 29 October 2018).
  15. World Bank National Accounts Data, and OECD National Accounts Data Files. GDP per Capita (current US$). Available online: https://data.worldbank.org/indicator/NY.GDP.PCAP.CD (accessed on 29 October 2018).
  16. World Bank Staff Estimates Based on the United Nations Population Division’s World Urbanization Prospects: 2018 Revision. Rural population (% of total population). Available online: https://data.worldbank.org/indicator/SP.RUR.TOTL.ZS (accessed on 29 October 2018).
  17. Pew-Templeton Global Religious Futures Project Research Center. Available online: http://www.globalreligiousfutures.org/countries (accessed on 29 October 2018).
  18. Millennium Development Goals and Beyond 2015, End Open Defecation. Available online: http://www.un.org/millenniumgoals/endopendefecation.shtml (accessed on 29 October 2018).
  19. Bill and Melinda Gates Foundation. Reinvent the Toilet Challenge: Strategy Overview. Available online: https://www.gatesfoundation.org/What-We-Do/Global-Growth-and-Opportunity/Water-Sanitation-and-Hygiene/Reinvent-the-Toilet-Challenge (accessed on 18 September 2018).
  20. University of Science and Technology Beijing. Reinventing the Toilet. In Proceedings of the Reinvent the Toilet Challenge, Beijing, China, 6–8 November 2018; Available online: http://stepsforsanitation.org/wp-content/uploads/2018/11/The-Reinvented-Toilet-Exhibitor-Guide-FINAL.pdf (accessed on 21 November 2018).
  21. Zhou, X.; Li, Z.; Zheng, T.; Yan, Y.; Li, P.; Odey, E.A.; Mang, H.P.; Uddin, S.M.N. Review of global sanitation development. Environ. Int. 2018, 120, 246–261. [Google Scholar] [CrossRef]
  22. Graham, D.W.; Collignon, P.; Davies, J.; Larsson, D.G.J.; Snape, J.R. Underappreciated role of regionally poor water quality on globally increasing antibiotic resistance. Environ. Sci. Technol. 2014, 11746–11747. [Google Scholar] [CrossRef] [PubMed]
  23. The Economist. Beating the Bugs: How Bangladesh Vanquished Diarrhea; The Economist: London, UK, 2018; Available online: https://www.economist.com/asia/2018/03/22/how-bangladesh-vanquished-diarrhoea (accessed on 29 October 2018).
  24. Rousham, E.K.; Unicomb, L.; Islam, M.A. Human, animal and environmental contributors to antibiotic resistance in low-resource settings: Integrating behavioural, epidemiological and One Health approaches. Available online: https://www.ncbi.nlm.nih.gov/pubmed/29643217 (accessed on 29 October 2018).
  25. UNICEF. Water, Sanitation and Hygiene (WASH), Annual Report 2013; UNICEF: New York, NY, USA, 2014; Available online: https://www.unicef.org/wash/files/WASH_Annual_Report_Final_7_2_Low_Res.pdf (accessed on 29 October 2018).
  26. Lamba, M.; Gupta, C.; Shukla, R.; Graham, D.W.; Sreekrishnan, T.R.; Ahammad, Z.A. Carbapenem resistance exposures via wastewaters across New Delhi. Environ. Int. 2018, 119, 302–308. [Google Scholar] [CrossRef] [PubMed]
  27. Milledge, D.G.; Gurjar, S.K.; Bunce, J.T.; Tare, V.; Sinha, R.; Carbonneau, P.E. Population density controls on microbial pollution across the Ganga catchment. Water Res. 2018, 128, 82–91. [Google Scholar] [CrossRef] [PubMed]
  28. World Health Organisation. Guidelines on Sanitation and Health; WHO: Geneva, Switzerland, 2018; Available online: http://www.who.int/water_sanitation_health/publications/guidelines-on-sanitation-and-health/en/ (accessed on 21 November 2018).
  29. O’Reilly, K.; Louis, E. The toilet tripod: Understanding successful sanitation in rural India. Health Place 2014, 29, 43–51. [Google Scholar] [CrossRef] [PubMed]
  30. Hajra, G.; Dutta, A. The gap between construction and usage of toilets: An under identified problem. BMJ Glob. Health 2016, 1, A39. [Google Scholar] [CrossRef]
  31. Sinha, A.; Nagel, C.L.; Schmidt, W.P.; Torondel, B.; Boisson, S.; Routray, P.; Clasen, T.F. Assessing patterns and determinants of latrine use in rural settings: A longitudinal study in Odisha, India. Int. J. Hyg. Environ. Health 2017, 220, 906–915. [Google Scholar] [CrossRef]
  32. US EPA. Treatability Manual. Volume IV: Cost Estimating; EPA/600/8-80/042D (NTIS PB80223084); US EPA: Washington, DC, USA, 1980.
  33. Sustainable Development Goals. Goal 6: Ensure Access to Water and Sanitation for All. 2015. Available online: https://www.un.org/sustainabledevelopment/water-and-sanitation/ (accessed on 29 October 2018).
  34. U.S. Department of Health, Education, and Welfare. Modern Sewage Treatment Plants? How Much Do They Cost?: A Practical Guide to Estimating Municipal Sewage Treatment Plant Construction Cost; USPHS Publication No. 1229; U.S. Government Printing Office: Washington, DC, USA, 1964.
  35. Dodane, P.-H.; Mbéguéré, M.; Sow, O.; Strande, L. Capital and operating costs of full-scale fecal sludge management and wastewater treatment systems in Dakar, Senegal. Environ. Sci. Technol. 2012, 46, 3705–3711. [Google Scholar] [CrossRef] [PubMed]
  36. Rodríguez-Miranda, J.P.; García-Ubaque, C.A.; Penagos-Londoño, J.C. Analysis of the investment costs in municipal wastewater treatment plants in Cundinamarca. Dyna 2015, 82, 230–238. [Google Scholar] [CrossRef]
  37. Hutton, G.; Varughese, M. Costs of meeting the 2030 Sustainable Development Goal Targets on Drinking Water, Sanitation, and Hygiene; Water and Sanitation Program; World Bank: Washington, DC, USA, 2016. [Google Scholar]
  38. Roefs, I.; Meulman, B.; Vreeburg, J.H.G.; Spiller, M. Centralised, decentralised or hybrid sanitation systems? Economic evaluation under urban development uncertainty and phased expansion. Water Res. 2017, 109, 274–286. [Google Scholar] [CrossRef]
  39. Metcalf, L.; Tchobanoglous, G. Wastewater Engineering Treatment and Reuse; McGraw-Hill: New York, NY, USA, 2003. [Google Scholar]
  40. Eggimann, S.; Truffer, B.; Maurer, M. To connect or not to connect? Modelling the optimal degree of centralisation for wastewater infrastructures. Water Res. 2015, 84, 218–231. [Google Scholar] [CrossRef]
  41. Eggimann, S.; Truffer, B.; Feldmann, U.; Maurer, M. Screening European market potentials for small modular wastewater treatment systems—An inroad to sustainability transitions in urban water management? Land Use Policy 2018, 78, 711–725. [Google Scholar] [CrossRef]
  42. Galvin, S.; Boyle, F.; Hickey, P.; Vellinga, A.; Morris, D.; Cornican, M. Enumeration and characterization of antimicrobial-resistant Escherichia coli bacteria in effluent from municipal, hospital, and secondary treatment facility sources. Appl. Environ. Microbiol. 2010, 76, 4772–4779. [Google Scholar] [CrossRef] [PubMed]
  43. Munir, M.; Wong, K.; Xagoraraki, I. Release of antibiotic resistant bacteria and genes in the effluent and biosolids of five wastewater utilities in Michigan. Water Res. 2011, 45, 681–693. [Google Scholar] [CrossRef] [PubMed]
  44. Ahammad, Z.S.; Sreekrishnan, T.R.; Hands, C.L.; Knapp, C.W.; Graham, D.W. Increased waterborne blaNDM-1 resistance gene abundances associated with seasonal human pilgrimages to the Upper Ganges River. Environ. Sci. Technol. 2014, 48, 3014–3020. [Google Scholar] [CrossRef] [PubMed]
  45. Munck, C.; Albertsen, M.; Telke, A.; Ellabaan, M.; Nielsen, P.H.; Sommer, M.O. Limited dissemination of the wastewater treatment plant core resistome. Nat. Commun. 2015, 6, 8452. [Google Scholar] [CrossRef] [PubMed] [Green Version]
  46. Yuan, Q.-B.; Guo, M.-T.; Yang, J. Fate of antibiotic resistant bacteria and genes during wastewater chlorination: Implications for antibiotic resistance control. PLoS ONE 2015, 10, e0119403. [Google Scholar] [CrossRef] [PubMed]
  47. DHI. Full Scale Advanced Wastewater Treatment at Herlev Hospital: Treatment Performance and Evaluation. Available online: https://www.dhigroup.com/-/media/shared%20content/global/news/2016/08/evaluation%20report.pdf?la=en (accessed on 29 October 2018).
  48. Waseem, H.; Williams, M.R.; Stedtfeld, R.D.; Hashsham, S.A. Antimicrobial resistance in the environment. Water Environ. Res. 2017, 89, 921–941. [Google Scholar] [CrossRef]
  49. Quach-Cu, J.; Herrera-Lynch, B.; Marciniak, C.; Adams, S.; Simmerman, A.; Reinke, R.A. The effect of primary, secondary, and tertiary wastewater treatment processes on antibiotic resistance gene (ARG) concentrations in solid and dissolved wastewater fractions. Water 2018, 10, 37. [Google Scholar] [CrossRef]
  50. Hong, P.-Y.; Julian, T.R.; Pype, M.-L.; Jiang, S.C.; Nelson, K.L.; Graham, D.W.; Pruden, A.; Manaia, C.M. Reusing treated wastewater: Consideration of the safety aspects associated with antibiotic-resistant bacteria and antibiotic resistance genes. Water 2018, 10, 244. [Google Scholar] [CrossRef]
  51. Melo, J. The Experience of Condominial Water and Sewerage Systems in Brazil; Report 34442; World Bank: Washington, DC, USA, 2007. [Google Scholar]
  52. Graham, D.W.; Giesen, M.J.; Jong, M.-C.; Bunce, J.T. Improving local-scale waste management: A solution for reducing global antibiotic resistance. In Proceedings of the 1st IWA Latin American & Caribbean Young Water Professionals Conference, Queretaro, Mexico, 5–9 November 2018. [Google Scholar]
  53. Manaia, C.M.; Macedo, G.; Fatta-Kassinos, D.; Nunes, O.C. Antibiotic resistance in urban aquatic environments: Can it be controlled? Appl. Microbiol. Biotechnol. 2016, 100, 1543–1557. [Google Scholar] [CrossRef]
  54. Cernea, M.M. Putting People First Sociological Variables in Rural Development; World Bank: Washington, DC, USA, 1985. [Google Scholar]
  55. Mogane, B.S. Techniques for Gathering Socio-Cultural Data on Water Supply and Sanitation Programmes. 1990 Pretoria; CSIR, Division of Water Technology. Available online: https://www.ircwash.org/sites/default/files/202.5-90TE-9138.pdf (accessed on 19 November 2018).
  56. Aboud, F.E.; Singla, D.R. Challenges to changing health behaviours in developing countries: A critical overview. Soc. Sci. Med. 2012, 75, 589–594. [Google Scholar] [CrossRef] [PubMed]
  57. Bisung, E.; Elliott, S.J.; Schuster-Wallace, C.J.; Karanja, D.M.; Bernard, A. Social capital, collective action and access to water in rural Kenya. Soc. Sci. Med. 2014, 119, 147–154. [Google Scholar] [CrossRef] [PubMed]
  58. Coffey, D.; Spears, D.; Vyas, S. Switching to sanitation: Understanding latrine adoption in a representative panel of rural Indian households. Soc. Sci. Med. 2017, 188, 41–50. [Google Scholar] [CrossRef] [PubMed]
  59. Mata, L. Sociocultural factors in the control and prevention of parasitic diseases. Rev. Infect. Dis. 1982, 4, 871–879. [Google Scholar] [CrossRef] [PubMed]
  60. Routray, P.; Schmidt, W.P.; Boisson, S.; Clasen, T.; Jenkins, M.W. Socio-cultural and behavioural factors constraining latrine adoption in rural coastal Odisha: An exploratory qualitative study. BMC Public Health 2015, 15, 880. [Google Scholar] [CrossRef] [PubMed]
  61. Dwipayanti, N.; Rutherford, S.; Phung, D.; Chu, C. How important is culture to sanitation uptake? The influence of local values in Rural Bali. Adv. Sci. Lett. 2017, 23, 3537–3540. [Google Scholar] [CrossRef]
  62. Garn, J.V.; Sclar, G.D.; Freeman, M.C.; Penakalapati, G.; Alexander, K.T.; Brooks, P.; Rehfuess, E.A.; Boisson, S.; Medlicott, K.O.; Clasen, T.F. The impact of sanitation interventions on latrine coverage and latrine use: A systematic review and meta-analysis. Int. J. Hyg. Environ. Health 2017, 220, 329–340. [Google Scholar] [CrossRef] [Green Version]
  63. Reynolds, R. Cleanliness and Godliness; Doubleday: New York, NY, USA, 1946. [Google Scholar]
  64. Warner, W.S. Cultural Influences that Affect the Acceptance of Compost Toilets: Psychology, Religion and Gender; Jordforsk Centre for Soil and Environmental Research: As, Norway, 1998. [Google Scholar]
  65. Greed, C. Inclusive Urban Design: Public Toilets; Routledge: London, UK, 2003; ISBN 978-0750653855. [Google Scholar]
  66. Gil, A.; Lanata, C.; Kleinau, E.; Penny, M. Children’s Feces Disposal Practices in Developing Countries and Interventions to Prevent Diarrheal Diseases: A Literature Review. In Environmental Health Project of USAID Strategic Report. Available online: https://www.ncbi.nlm.nih.gov/pmc/articles/PMC5217632/ (accessed on 24 November 2018).
  67. Dellström Rosenquist, L.E. A psychosocial analysis of the human-sanitation nexus. J. Environ. Psychol. 2005, 25, 335–346. [Google Scholar] [CrossRef]
  68. Anthony, K.; Dufresne, M. Potty Parity in Perspective: Gender and Family Issues in Planning and Designing Public Restrooms. J. Plan. Lit. 2007, 21, 267–294. [Google Scholar] [CrossRef] [Green Version]
  69. George, R. The Big Necessity: Adventures in the World of Human Waste; Portobello Books: London, UK, 2008. [Google Scholar]
  70. Shettar, S.C. Sociology of sanitation: Incorporating gender issues in sanitation. In Proceedings of the National Conference on Sociology of Sanitation, New Delhi, India, 28–29 January 2013; pp. 95–100. [Google Scholar]
  71. Coffey, D.; Gupta, A.; Hathi, P.; Khurana, N.; Spears, D.; Srivastav, N.; Vyas, S. Revealed preference for open defecation: Evidence from a new survey in rural North India. Econ. Polit. Wkly. 2014, 38, 43–55. [Google Scholar]
  72. Thys, S.; Mwape, K.E.; Lefèvre, P.; Dorny, P.; Marcotty, T.; Phiri, A.M.; Phiri, I.K.; Gabriël, S. Why latrines are not used: Communities’ perceptions and practices regarding latrines in a Taenia solium endemic rural area in Eastern Zambia. PLoS Negl. Trop. Dis. 2015, 9, e0003570. [Google Scholar] [CrossRef]
  73. Coffey, D.; Gupta, A.; Hathi, P.; Spears, D.; Srivastav, N.; Vyas, S. Understanding open defecation in rural India: Untouchability, pollution, and latrine pits. Econ. Polit. Wkly. 2017, 52, 59–66. [Google Scholar]
  74. Capodaglio, A.G. Integrated, decentralized wastewater management for resource recovery in rural and peri-urban areas. Resources 2017, 6, 22. [Google Scholar] [CrossRef]
  75. Capodaglio, A.G.; Callegari, A.; Cecconet, D.; Molognoni, D. Sustainability of decentralized wastewater treatment technologies. Water Pract. Technol. 2017, 12, 463–477. [Google Scholar] [CrossRef]
  76. Sharma, A.K.; Tjandraatmadja, G.; Cook, S.; Gardner, T. Decentralised systems—Definition and drivers in the current context. In Proceedings of the IWA Regional Conference on Wastewater Purification and Reuse, Heraklion, Greece, 28–30 March 2012. [Google Scholar]
  77. Tandukar, M.; Uemura, S.; Ohashi, A.; Harada, H. Combining UASB and the “fourth generation” down-flow hanging sponge reactor for municipal wastewater treatment. Water Sci. Technol. 2006, 53, 209–218. [Google Scholar] [CrossRef] [PubMed]
  78. Bundy, C.A.; Wu, D.; Jong, M.-C.; Edwards, S.R.; Ahammad, Z.S.; Graham, D.W. Enhanced denitrification in downflow hanging sponge reactors for decentralised domestic wastewater treatment. Bioresour. Technol. 2017, 226, 1–8. [Google Scholar] [CrossRef] [PubMed]
  79. Jong, M.-C.; Su, J.-Q.; Bunce, J.T.; Harwood, C.R.; Snape, J.R.; Zhu, Y.-G.; Graham, D.W. Co-optimization of sponge-core bioreactors for removing total nitrogen and antibiotic resistance genes from domestic wastewater. Sci. Total Environ. 2018, 634, 1417–1423. [Google Scholar] [CrossRef]
  80. Finley, R.L.; Collignon, P.; Larsson, D.G.J.; McEwen, S.A.; Li, X.-Z.; Gaze, W.H.; Reid-Smith, R.; Timinouni, M.; Graham, D.W.; Topp, E. The scourge of antibiotic resistance: The important role of the environment. Clin. Inf. Dis. 2013, 57, 704–710. [Google Scholar] [CrossRef] [PubMed]
Figure 1. Locations in a waste management system where antibiotic resistance (AR) mitigation interventions might occur, aligned with Sustainable Development Goal 6.0. For the purpose of comparing options, the intervention steps are Basic Improved Sanitation, Primary Treatment, Secondary Treatment and Tertiary Treatment. However, it is assumed some level of infrastructural investment is needed to transition from basic interventions to secondary treatment.
Water 11 00027 g001
Figure 2. Relative incremental reductions in antibiotic resistance gene (ARG) concentrations as a function of different AR mitigation interventions (see Figure 1). Reductions are baselined to an initial ARG concentration of (log 10) ARG copies/unit volume in fecal matter, which is the brown bar. Each step reduction is based on mean ARG removal data from nine studies on field-scale systems [42,43,44,45,46,47,48,49,50]. Sample numbers: n = 5 for fecal matter to improved sanitation; n = 8 for improved sanitation to primary treatment; n = 11 for primary to secondary treatment; n = 15 for secondary to tertiary treatment. Error bars refer to standard errors of data from the studies and shaded areas show ranges.
Water 11 00027 g002
Figure 3. Relative incremental “net cost” increases as a function of AR mitigation interventions (see Figure 1). Costs are relative only, based on data from various sources. Cost data up to Secondary treatment are World Bank data [37], whereas, Secondary and Tertiary treatment are from US EPA and EU sources [32,34,35,36,38]. The Infrastructure cost is dashed and broken because this varies hugely from scenario to scenario. The step increase on the graph is based on Eggimann et al. [40]. Shaded areas show ranges. Ranges of costs increase as the level of technology increases because huge variability in technical options exists (and their costs), within the secondary and tertiary treatment options.
Water 11 00027 g003
Figure 4. Map of Southeast Asia showing the relative sizes and locations of the eleven countries used in the case study.
Water 11 00027 g004
Figure 5. Percentages in 2017 of rural and urban populations [16] in the case study countries who practice open defection or have unimproved basic sanitation; i.e., a limited barrier between one person’s faecal matter and the next [12]. The mean level for the world is shown in brown.
Water 11 00027 g005
Figure 6. Percentages of the rural and urban population serviced by improved latrines or similar, septic tanks or have sewer connections in eleven countries in SE Asia in 2017 [12]. Unknown implies inadequate data to clearly define. × = Investment should prioritize Basic Improved Sanitation to have the greatest impact of AR exposures (based on >60% rural or >20% urban); = Investment should prioritize decentralized secondary waste treatment as an approach to reducing AR, but only if limited infrastructure investment is required; Water 11 00027 i001 
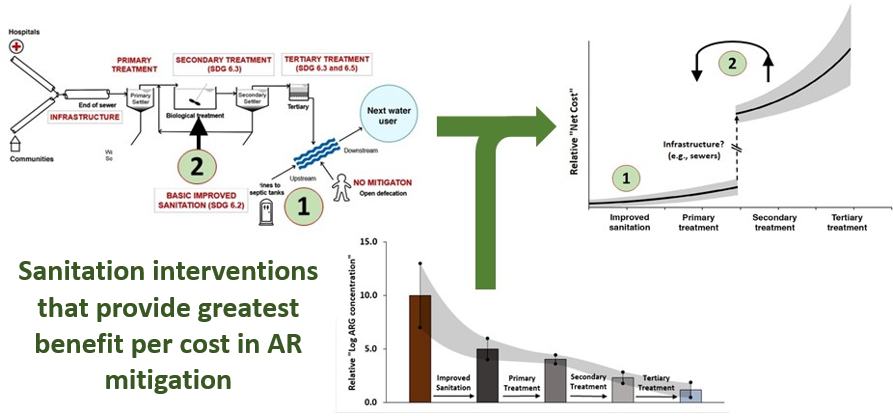
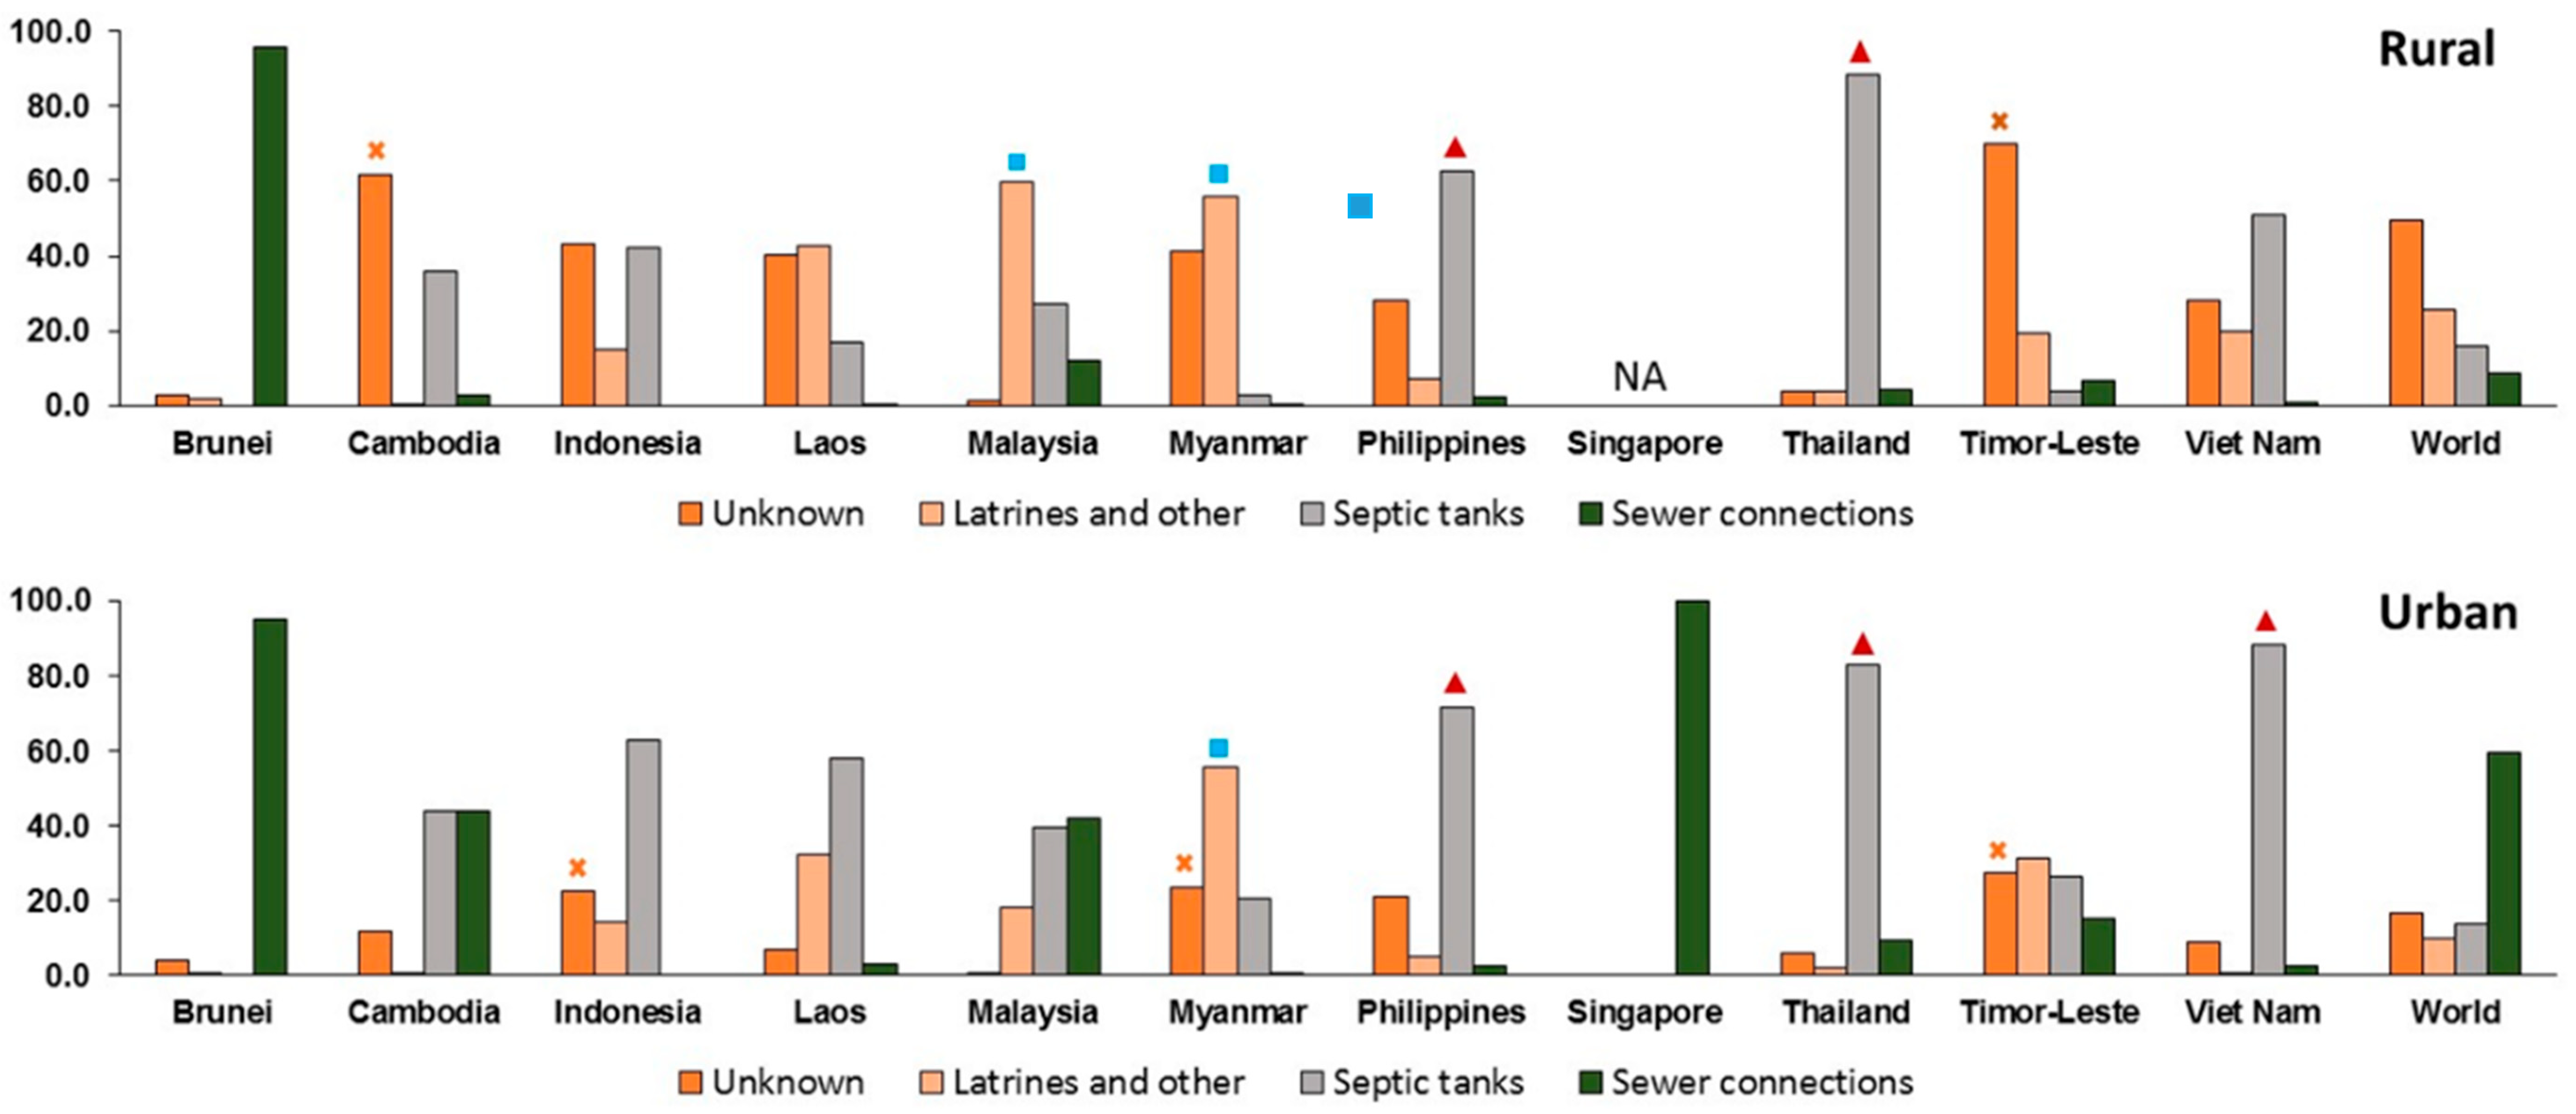
= Investment should prioritize decentralized secondary waste treatment. The difference between the latter two categories is the availability of existing plumbing with septic tanks or similar.
Water 11 00027 g006
Figure 7. Relationships between the per capita Gross Domestic Product (GDP) [15] and percent rural population and percentage of the population that practices OD in the eleven SE Asian countries. (a) GDP and (b) percentage of rural population. Trendlines provided to help visualize the trends.
Water 11 00027 g007
Figure 8. Primary religious affiliations in the eleven countries in the case study [17].
Water 11 00027 g008
Table 1. Total population [13], percent level of urban population [16] and GDP per capita [15] for the eleven countries in the case study based on 2017 data.
PopulationArea (km2)Population Density (#/km2) Urban Population (% of Total Population)GDP Per Capita ($US)
Brunei428,69757657477.328,291
Cambodia16,005,373181,0358823.01384
Indonesia263,991,3791,904,56913954.73847
Laos PDR6,858,160236,8002934.42457
Malaysia31,624,264329,8479675.49945
Myanmar53,370,609676,0007930.31299
Philippines104,918,090343,44830546.72989
Singapore5,612,253724775210057,714
Thailand69,037,513513,12013549.26594
Timor-Leste1,296,31114,8748730.22279
Viet Nam95,540,800331,21028835.22343
Table 2. Cultural and personal behavioural factors that reflect cultural preference towards the use of toilet and related facilities. These factors are drawn from many sanitation studies [53,54,55,56,57,58,59,60,61,62,63,64,65,66,67,68,69,70,71,72,73] and rarely have been considered in technical interventions aimed at reducing AR. Not all factors are relevant to SE Asia, but accounting for such factors is critical for ensuring public buy-in, especially with more rudimentary sanitation interventions for AR mitigation.
Cultural Factors
age—different expectation for adults versus and children; e.g., diapers, training toilets and older people’s preference to follow traditional ways
cleansing—washing versus wiping anus, post defecation and for some bathing immediately after defecating
disabled and/or sick—need for separate or different arrangements
ethnicity/class/caste—segregation of different social/cultural groups
gender—segregation by genders
kinship—restriction based on family relationship; e.g., fathers-in-law and daughters-in-law do not use the same toilet
social structure or traditional roles
location of toilet within the dwelling or village
menstruating women—prohibited from using communal or family toilets
posture while defecating—squatting or seating
purify and pollution notions—faecophilic or faecophobic
traditions or taboos—prohibition of handling or talking about human faeces
use of human excreta or compost derived from human excrete as a fertilizer
religious rules—combination of any of the above, including orientation while defecating (relative to Mecca) and colour restrictions
Personal Considerations
accessibility
comfort
convenience—fitting daily routine
darkness
dignity
disability
education level
environmental cleanliness
fear of being seen, falling in the hole, or the pit collapsing
health (diseases, safety)
insect nuisance
menstrual management
odours/smells
ownership
prestige (status, being modern, social pressure)
privacy
safety and protection

